TRPA1 channels regulate astrocyte resting calcium. and inhibitory synapse efficacy through GAT-3
|
|
|
- Alexandrina Griffith
- 5 years ago
- Views:
Transcription
1 TRPA1 channels regulate astrocyte resting calcium and inhibitory synapse efficacy through GAT-3 * 1 Eiji Shigetomi, * 1 Xiaoping Tong 3 Kelvin Y. Kwan, 3 David P. Corey & 1,2 Baljit S. Khakh Ψ 1 Departments of Physiology and 2 Neurobiology, David Geffen School of Medicine, University of California Los Angeles, Los Angeles USA CA Howard Hughes Medical Institute, Harvard Medical School, Neurobiology, Goldenson 444, 220 Longwood Ave, Boston, MA *authors with equal contributions to experiments (ES and XT) SUPPLEMENTARY INFORMATION LIST Legends for Supplementary videos Page 2 Supplementary figures and legends Pages 3 23 Supplementary Tables Pages
2 Legends for Supplementary Videos Supplementary Video 1: Spotty Ca 2+ signals in a representative astrocyte in co-cultures. Frame interval = 1 s, duration of movie = 300 s. Representative from 696 sites of 54 cells. Supplementary Video 2: Spotty Ca 2+ signals are abolished upon application of Ca 2+ free buffers in astrocytes in co-cultures. Frame interval = 1 s, duration of movie = 1800 s. Representative from 155 sites of 14 cells. Supplementary Video 3: HC , a specific blocker of TRPA1 channels, largely reduces spotty Ca 2+ signals in astrocytes in co-cultures. Frame interval = 1 s, duration of movie = 1800 s. Representative from 96 sites of 11 cells. HC almost completely reduced the spotty Ca 2+ signals. Supplementary Video 4: Spotty Ca 2+ signals are preserved in astrocytes in co-cultures transfected with control sirna. Frame interval = 1 s, duration of movie = 360 s. Representative of 55 cells. ATP (30 µm) was applied at 300 s for 2 s (as indicated by the text). Supplementary Video 5: Spotty Ca 2+ signals are reduced in astrocytes in co-cultures transfected with TRPA1 sirna. Frame interval = 1 s, duration of movie = 360 s. Representative of 8 cells. ATP (30 µm) was applied at 300 s for 2 s (as indicated by the appearance of the callout text). Supplementary Video 6: A low concentration of AITC increased astrocyte spotty Ca 2+ signals in co-cultures. Frame interval = 1 s, duration of movie = 360 s. AITC (1 µm) was applied at 120 s for 120 s (as indicated by the text). Representative of 21 cells. Supplementary Video 7: Spotty Ca 2+ signals in control astrocytes in co-cultures. Frame interval = 1 s, duration of movie = 300 s. Representative of 13 cells. These data were gathered at the same time as for experiments where mtrpa1 was expressed in astrocytes (see Supplementary movie 8). Supplementary Video 8: Over expression of mtrpa1 channels increased spotty Ca 2+ signals in astrocytes in co-cultures. Frame interval = 1 s, duration of movie = 300 s. Note that astrocytes over expressing mtrpa1 show more spotty Ca 2+ signals. Representative of 12 cells. 2

3 Supplementary Figure 1: Dual emission imaging with Lck-GCaMP3 and cytosolic Fura Red in co-cultures. a. Representative images from co-cultures showing basal fluorescence of Lck-GCaMP3 and Fura Red captured simultaneously with a beam splitter. b. Representative traces show simultaneous recordings from a region of interest for the Lck-GCaMP3 signal (green) and the Fura Red signal (red). Note that spotty Ca 2+ signals can be easily seen in the Lck-GCaMP3 trace, but these are harder to see in the Fura Red trace. However, elevation of global Ca 2+ levels by ATP results in robust signals for the Lck-GCaMP3 and Fura Red traces. c. Plots the peak amplitude of the df/f for 363 spotty Ca 2+ signals (x-axis) against the Fura Red signal (y-axis) for the same regions of interest. The solid line represent the line of identity: all points should fall near this line if spotty Ca 2+ signals measured by Lck-GCaMP3 also resulted in significant elevations in cytosolic Ca 2+ signals. Importantly, the dynamic range for Lck-GCaMP3 was large, whereas that for Fura Red it was small. Also, very few points were near the line of identity and there was little correlation between the two signals. d. Summary bar graph showing the peak df/f for the spotty Ca 2+ signals measured by Lck-GCaMP3 in relation to the signals measured by Fura Red when transients were observed in both channels with a beam splitter. From the data it is clear that spotty Ca 2+ signals do not largely elevate Ca 2+ in the cytosol of astrocytes, but that for ~46% of events the signals can be detected with a cytosolic dye with a largely reduced signal-to-noise. Overall, we conclude that spotty Ca 2+ signals are easily detected by membrane tethered Lck- GCaMP3, but that the Ca 2+ quickly dissipates and is unreliably and poorly detected by cytosolic dyes. These data show Ca 2+ entry during spotty Ca 2+ signals does elevate bulk cytosolic levels, but the signal dissipates. 3
4 Supplementary Figure 2: Properties of spotty Ca 2+ signals studied with TIRF microscopy and Fluo-4 in co-cultures. a. Spotty Ca 2+ signals disappeared, but ATP-induced Ca 2+ signals were maintained in the absence of extracellular Ca 2+. b. Depletion of intracellular Ca 2+ stores by thapsigargin (TG, 1 µm) completely abolished ATP-induced Ca 2+ signals. However, spotty Ca 2+ signals still exist in the presence of TG. c. Shows a plot of blockade (%) of spotty Ca 2+ signals versus blockade 4
5 (%) of ATP-induced Ca 2+ signals. Red circles indicate the drugs that mainly reduced spotty Ca 2+ signals, suggesting TRP-like channels mediated spotty Ca 2+ signals. Green circles indicate drugs that mainly reduced ATP-evoked Ca 2+ signals. Grey circles indicate drugs affect both or none of signals. d. df/f images of astrocyte footprints observed in TIRF for cells loaded with Fluo-4. Bottom panels show 3D rendering of images above. e. Intensity versus time profile of four ROIs. HC dramatically decreased spotty Ca 2+ signals (n = 22 sites from 11 cells). f. Shows fluorescence images of mcherry (left panels) and df/f images of spotty Ca 2+ signals. We transfected sirnas with mcherry as a reporter. The numbers in the images correspond to the time when images were taken (in seconds). g. Shows summary data for the percentage of astrocytes showing spotty Ca 2+ signals observed in TIRF. TRPA1 sirnas significantly reduced the number of cells showing spotty Ca 2+ signals (Fisher s exact test, Control, 77.8%, n = 27 cells; TRPA1 #1, 5.6%, n = 18 cells, p < ; TRPA1 #2, 40.8%, n = 27 cells, p < 0.01; TRPA1 #3, 17.4%, n = 13 cells, p < ). h. Number of spotty Ca 2+ signals in astrocyte were significantly decreased by TRPA1 sirnas (negative control sirna, 3.7 ± 0.6 events per cell; TRPA1 sirna #1, 0.06 ± 0.06 events per cell, p < ; TRPA1 sirna #2, 0.74 ± 0.25 events per cell, p < ; TRPA1 sirna #3, 0.22 ± 0.11 events per cell, p < ). Note: in panel c a value of less than 0% inhibition represents an increase, as was subtly observed in the case of BBG, U73122 and ryanodine. 5

6 Supplementary Figure 3: Overexpression of mtrpa1 in co-cultures and HEK 293 cells increased spotty Ca 2+ signals measured by Lck-GCaMP3. a. Representative df/f images of a maximal projection of 300 frame video of astrocytes in cocultures expressing Lck-GCaMP3 with or without co-transfection of mtrpa1 (Supplementary Video 7, 8). Dashed lines show the outline of the imaged astrocytes. b. Cumulative probability plot of the number of spotty Ca 2+ signals within each cell. Astrocyte co-cultures over expressing mtrpa1 channels (gray line, n = 12 cells) showed significantly more spotty Ca 2+ signals than control (black line, n = 13 cells, Kolmogorov-Smirnov test, p < ). The number of spotty Ca 2+ signals increased from 3.4 ± 2.5 locations per astrocytes to 16.4 ± 4.2 locations in astrocytes expressing TRPA1 channels. c. The panels show df/f images of HEK 293 cells expressing Lck- GCaMP3 and mtrpa1. d. Traces show the intensity versus time profile of Lck-GCaMP3 signals. HEK-293 cells did not express functional TRPA1 channels natively since AITC (10 µm) did not cause detectable Ca 2+ transients. e. Expression of mtrpa1 caused spontaneous spotty 6
7 Ca 2+ signals in 41.7% of HEK cells (n = 36 cells in total), whereas only 5.9% of HEK-293 cells (n = 34 cells in total) expressing solely Lck-GCaMP3 showed spontaneous signals. These data further suggest that TRPA1 channels are sufficient to cause spontaneous spotty Ca 2+ signals. AITC (10 µm) evoked strong Ca 2+ signals in HEK-293 cells expressing mtrpa1. 7
8 Supplementary Figure 4: TRPA1 sirnas do not affect ATP-evoked global Ca 2+ signals in astrocyte co-cultures. a. ATP (30 µm)-evoked Ca 2+ transients in astrocytes observed by Fluo-4 with epifluorescence microscopy under the conditions indicated. b. Average data for experiments such as those shown in panel a. Negative control sirna, 6.9 ± 0.4 (n = 17 cells); sirna#1, 6.4 ± 0.5 (n = 7 cells); sirna#2, 6.6 ± 0.3 (n = 12 cells); sirna#3, 6.2 ± 0.3 (n = 10 cells). 8
9 Supplementary Figure 5: Evidence for TRPA1 expression in astrocyte co-cultures. a. AITC (100 µm)-evoked currents in astrocytes and HEK-293 cells expressing mtrpa1. We used 100 µm AITC to maximally activate TRPA1 because the currents were relatively small in astrocytes (see text for data). Voltage-ramps were applied from -80 mv to 60 mv every 2 s (in 280 ms) and from -80 mv to +50 mv every 0.5 s for astrocytes and HEK-293 cells before, during after applications of AITC. AITC was applied for 60 s. Currents were normalized to the currents at -80 mv. Both currents showed similar outward rectification which is typical for TRPA1 currents. The bar graph shows summary data of the effect of sirna on mtrpa1 currents in HEK-293 cells at -60 mv. sirna significantly decreased TRPA1 currents (p < 0.05). b. Current-voltage relationships for AITC (100 µm)-evoked currents in astrocyte co-cultures transfected with negative control sirna (black trace) or TRPA1 sirna #1 (gray trace). The bar graph on the right shows summary data of AITC-evoked currents, which were reduced significantly by TRPA1 sirna (p < 0.05). c. As in b, but for IV plots for astrocytes without any agonist applications to monitor the potassium currents. The TRPA1 sirna did not significantly affect the potassium currents at any voltage, as shown by the bar graph. d. A 130 kd band was detected in HEK-293 cells expressing rtrpa1 channels, but not in untransfected cells. The 9
10 control β-actin band is also shown, which was natively expressed at much higher levels than TRPA1. e. Western blot analysis of TRPA1 expression relative to β-actin under the conditions indicated for astrocyte co-cultures: sirna#1 significantly reduced TRPA1 band intensity as shown in the bar graph. 10
11 Supplementary Figure 6: Spotty Ca 2+ signals measured with Lck-GCaMP3 in co-cultures are not due to neurotransmitter release. a. Representative traces of spotty Ca 2+ signals recorded from astrocytes in co-cultures. At the times indicated by the solid bars, TTX (1 µm; n = 122 sites from 6 cells), PPADS (40 µm; n = 86 sites from 5 cells), MCPG (500 µm; n = 110 sites from 8 cells) or CNQX and APV (10 and 50 µm; n = 103 sites from 4 cells) were applied. N = events. None of these agents had any detectable effect on spotty Ca 2+ signals. b. Summary data for experiments such as those shown in a. 11
12 12
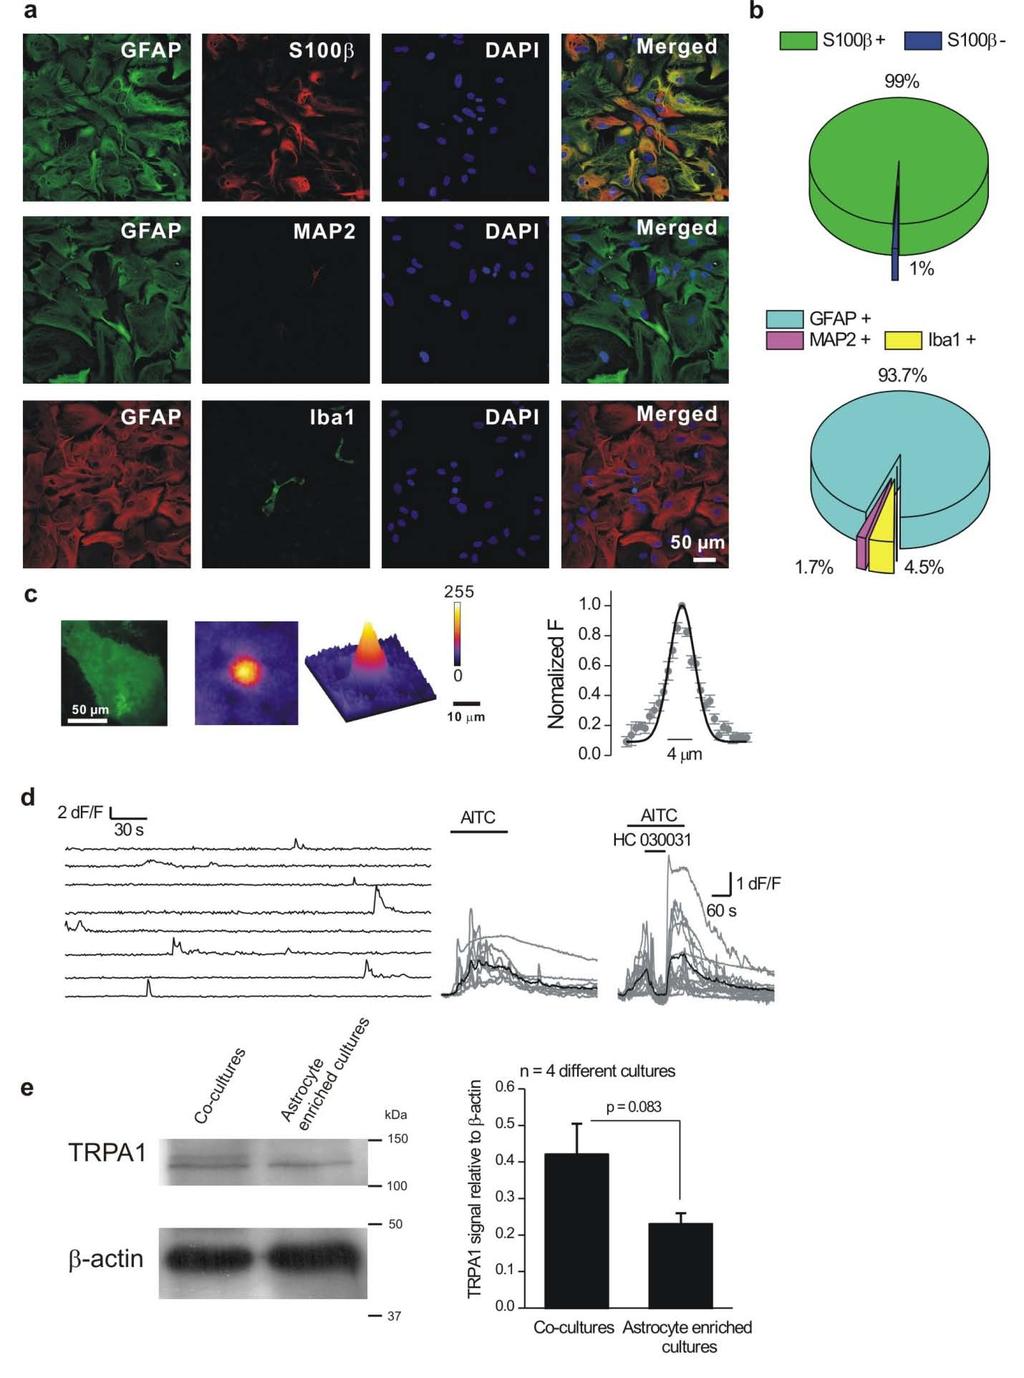
13 Supplementary Figure 7: TRPA1 expression within astrocyte enriched cultures from hippocampus. a. The images show GFAP staining in relation to that for S100β, MAP2, Iba1 and DAPI, which are markers for astrocytes, neurons, microglia and cell nuclei, respectively. We detected very little evidence for the presence of neurons or microglia in these cultures, which were made using protocols that enrich for astrocytes. b. Pie charts summarize the finding that 99% of the cells showed costaining for GFAP and S100β, confirming that they were astrocytes. Evaluations of MAP2 and Iba1 staining showed that the cells were likely to be ~94% pure for astrocytes. c. Image of an astrocyte expressing Lck-GCaMP3 from astrocyte enriched cultures, shown next to a representative image of a spotty Ca 2+ signal from the same cell. The spotty Ca 2+ signal is shown as 2D and 3D representations. The graph shows average FWHM line profiles of spotty Ca 2+ signals measured from astrocyte enriched cultures. d. Left panel: representative traces for spotty Ca 2+ signals in astrocyte only cultures. Middle panel representative traces for AITC (20 µm; n = 13) evoked calcium signals (the black line is an average of the individual traces shown in gray). Right panel: representative traces showing that AITC-evoked Ca 2+ elevations can be blocked by HC (40 µm; n = 20). e. Representative Western blots showing TRPA1 and β-actin expression in co-cultures and enriched astrocyte cultures. Average data from 4 such experiments are shown in the bar graph with the intensity of the TRPA1 band being normalised to that of β-actin. We found approximately equal levels of TRPA1 in both cultures. 13

14 Supplementary Figure 8: Functional evidence for TRPA1 channels in hippocampal astrocytes but not neurons in co-cultures. a. Several TRPA1 agonists-induced global Ca 2+ transients in astrocytes, but not in neurons (measured by Fluo-4). The following agonist concentrations were used. AITC 20 µm (n = 62 astrocytes; n = 11 neurons), allicin 10 µm (n = 37 astrocytes; n = 12 neurons), N- methylmaleimide 50 µm (NMM, n = 22 astrocytes; n = 10 neurons), acrolein 20 µm (n = 27 astrocytes; n = 15 neurons), formaldehyde 0.01% (n = 36 astrocytes; n = 9 neurons), nicotine 1 mm (n = 26 astrocytes; n = 14 neurons), menthol 30 µm (n = 34 astrocytes; n = 11 neurons). b. Bar graphs summarize results from experiments such as those illustrated in a. c. A representative image of a field of view of neuron-astrocyte co-cultures. In this field of view 5 cells were analyzed (labeled as 1-6): the neurons are identified by the arrows. The traces to the right show AITC-evoked calcium elevations (measured with Fluo-4; 20 µm) in the astrocytes. Similar responses were not recorded in the neurons. For these experiments, neurons were identified by their compact somata and dendrites, whereas astrocytes were identified as flat cells with no dendrites. These features were readily visible in the Fluo-4 and bright field images and the distinction was based on 12 years of experience with hippocampal co-cultures by the Khakh lab and is based on extensive past work using imaging and electrophysiology on co-cultures. In short, we are confident we can discriminate a neuron from an astrocyte. 14

15 Supplementary Figure 9: Representative images of astrocytes in the stratum radiatum region of the hippocampus bulk loaded with Fluo-4. The arrows point to astrocytes. 15
16 Supplementary Figure 10: Properties of interneuron mipscs when astrocytes were dialyzed with BAPTA. a. Normalized interneuron mipsc amplitudes in 5 minute bins from time 0 to 35 minutes after attaining the whole-cell mode in astrocytes and thus beginning intracellular dialysis with BAPTA. In this approach, we recorded from a neuron, established a set of baseline values for mipsc amplitude and frequency and then patch an astrocyte with BAPTA. The mipscs were significantly reduced in amplitude after 20 minutes of BAPTA dialysis. Control experiments (where astrocytes were not patched/dialyzed), showed no decrease in mipsc amplitudes over time. Related control experiments when astrocytes were dialyzed with BAPTA at different levels of Ca 2+ buffering are reported in the main text, demonstrating that the act of dialyzing itself does not affect mipscs. The right hand panels show representative mipscs from a single cell at the 16
17 time points indicated. b. Representative mipscs (gray) and averages (black and green) at the time points indicated after start of astrocyte dialysis with BAPTA. The bar graphs show that the rise and decay times of mipscs were not altered with astrocyte BAPTA dialysis. c. The graph plots the control amplitude of mipscs (green symbols) on the x-axis from the 0-5 min period against the amplitude of mipscs recorded min after astrocyte BAPTA dialysis. The thick black line represents the expected relationship between the two distributions if the mipscs after BAPTA dialysis scaled proportionally with those before. The dashed line represents one expected result if the mipscs after astrocyte BAPTA dialysis were scaled across all synapses in a subtractive manner. The red line represents the expected result if the mipscs scaled in a multiplicative manner by a factor of across all synapses, which closely represents the observed data. d. The right hand graph shows cumulative probability plots for mipsc amplitudes under control conditions and after astrocyte dialysis with BAPTA. The right hand graph shows the same data, but after mipscs recorded following astrocyte BAPTA dialysis were scaled by a factor of Note this scaling factor was sufficient to render the two distributions identical. These data suggest that astrocyte BAPTA dialysis scales all synapses equally by ~ 0.73, as discussed in the text for 6/8 interneurons. 17
18 Supplementary Figure 11: Dialysis of interneurons with BAPTA did not affect mipscs, but dialysis of astrocytes did so. a. Representative traces of mipscs recorded from interneurons using a standard intracellular solution as well as from interneurons recorded with 13 mm BAPTA in the patch-pipette. b. Cumulative probability mipsc amplitude and inter-event interval distributions for interneurons with a standard control intracellular solution and for interneurons dialyzed with 13 mm BAPTA. 18
19 c. Representative mipsc traces for interneurons located near astrocytes dialyzed with intracellular solutions to clamp the bulk concentration of Ca 2+ ions to known levels using either the fast chelator BAPTA, or the slower chelator EGTA. d-f. Shows average cumulative probability plots for experiments like those illustrated in c. No significant changes were observed for the inter-event interval distributions under any conditions. g. Summary bar graph showing the effect of astrocyte dialysis with BAPTA (to achieve the indicated calculated intracellular Ca 2+ concentrations) in mipsc amplitudes and frequency (see text for details). In brief, the mipsc amplitudes alone were decreased significantly (p < 0.01) when astrocyte Ca 2+ levels were decreased below rest to ~35 nm. 19
20 Supplementary Figure 12: The TRPA1 channel blocker HC did not affect the membrane properties of CA1 region pyramidal neurons or interneurons. Panels a-b show representative traces before and during application of 40 µm HC for recordings from interneurons and pyramidal neurons. The table presents average data for key parameters for control conditions and during the application of key drugs used in the course of the experiments reported in this study. None of them produced any significant effect on the membrane properties of interneurons or pyramidal neurons. 20
21 Supplementary Figure 13: Controls for experiments showing that astrocyte dialysis with BAPTA occludes the effect of HC on interneuron mipscs and also the effect of astrocyte BAPTA dialysis on evoked IPSCs. a. Representative traces of mipscs arriving onto interneurons for control conditions and after min astrocyte dialysis with BAPTA (13 mm). b. Average cumulative probability plots showing mipsc amplitudes and inter-event intervals for the experimental conditions shown in a: note the significant reduction in mipsc amplitudes. These experiments were performed in parallel with those reported in Fig 5e and are the control data set for those experiments. c. The graph shows stimulus response curves at a range of stimulation intensities for control interneurons (black symbols) as well as those located within ~100 µm of astrocytes dialyzed with 13 mm BAPTA (green). Representative traces are shown to the right. IPSCs were evoked using a glass stimulating electrode placed within 100 µm of the recorded interneuron with a pulse duration of 0.2 ms. 21
. 22")
22 Supplementary Figure 14: GAT-1 and GAT-3 immunostaining in the stratum radiatum region of the hippocampus. a. The confocal images show GAT-1 and GFAP staining in the stratum radiatum. The spotty GAT-1 immunostaining did not colocalise with GFAP. b. As in a, but for GAT-3 immunostaining. In this case GAT-3 staining did colocalise with GFAP (white arrows). 22
23 Supplementary Fig 15: Elevating astrocyte calcium levels did not affect mipscs onto interneurons. a. The upper panel shows traces for AITC (100 µm) evoked calcium elevations in hippocampal astrocytes. The lower graph is an average cumulative probability plot of mipsc amplitudes before and during AITC. b. As in a, but for ADPβS (30 µm) applications. c. As in a but for ET-1 (100 nm) applications. d. Summary data for experiments such as those shown in panels a-c. Neither AITC, ADPβS or ET-1 changed the amplitude or frequency of mipscs arriving onto interneurons. 23
24 Supplementary Table 1: Effect of blockers on spotty Ca 2+ signals measured with TIRF microscopy. Drugs Conc. % block of microdomain Ca 2+ signal frequency (%) % of block of ATP responses (%) 0 Ca 2+ EGTA 5mM 98.7 ± 1.3 (22) 17.9 ± 2.1 (44) Target proteins BAPTA-AM 100 µm ND (9 FOV) 98.3 ± 0.5 (22) Ca 2+ chelator Gd µm 100 ± 0 (30) 42.7 ± 5.6 (37) TRPs, SOCC, Orai1 La µm 96.6 ± 3.4 (17) ± 5.2 (27) TRPs, SOCC HC µm 99.2 ± 0.8 (22) 0.4 ± 1.9 (21) TPRA1 2-aminoethoxy diphenylborate (2-APB) 100 µm -3.0 ± 16.5 (16) 95.3 ± 0.6 (19) TRPCs, TRPMs, Orai1 Ruthenium Red 10 µm -5.0 ± 2.0 (20) 49.1 ± 4.4 (26) TRPVs, TRPA1 SKF µm 33.1 ± 26.7 (19) 55.0 ± 5.7 (29) TPRCs, SOCCs, Orai1 MRS µm 53.3 ± 17.3 (11) 43.7 ± 4.7 (33) TRPCs, SOCCs Flufenamic acid (FFA) 100 µm 54.7 ± 12.2 (15) 36.7 ± 22.4 (44) TRPCs, TRPMs, SOCCs Menthol 500 µm 81.9 ± 4.2 (30) 7.2 ± 6.4 (30) TRPA1 Streptomycin 200 µm 58.7 ± 14.8 (27) 4.2 ± 1.3 (42) Mechnosensitive cation channels 10 mm Mg ± 14.2 (16) 7.7 ± 2.4 (34) Mechnosensitive cation channels Cyclopiazonic acid (CPA) 20 µm 42.7 ± 11.6 (17) 95.3 ± 1.4 (37) SERCA pump Thapsigargin (TG) 1 µm 27.5 ± 16.9 (14) 95.8 ± 0.8 (34) SERCA pump Xestospondin C (XeC) 20 µm 10.8 ± 19.3 (29) 81.2 ± 5.1 (16) IP 3 receptors U µm ± 16.6 (13) 97.1 ± 0.5 (40) Phospholipase C Ryanodine 100 µm 22.6 ± 14.1 (16) -8.0 ± 5.8 (28) Ryanodine receptors PPADS 40 µm 17.8 ± 13.0 (21) 95.5 ± 1.2 (28) P2Y receptors Cd µm 34.6 ± 32.7 (12) 60.9 ± 4.5 (43) Voltage-gated Ca 2+ channels Brilliant Blue G (BBG) 10 µm -30 ± 31.4 (5) 13.5 ± 3.9 (27) P2X 7 receptor 24
25 Supplementary Table 2: Sequences of sirnas. sirna Sense Antisense Negative control sirna TRPA1 sirna #1 UAACGACGCGACGACGUAAtt ACACGUGGACAUCAAAGCUGUGUUC UUACGUCGUCGCGUCGUUAtt GAACACAGCUUUGAUGUCCACGUGU TRPA1 sirna #2 AACUCAGGCCGCAAAUUCCUUAGCC GGCUAAGGAAUUUGCGGCCUGAGUU TRPA1 sirna #3 UUAGUGUCAAGAAUGACCUUCAUGG CCAUGAAGGUCAUUCUUGACACUAA The negative control sirna did not target any gene product. 25
26 Supplementary Table 3: A TRPA1 agonist (AITC; 100 µm) and antagonist (HC ; 80 µm) did not affect the membrane properties of pyramidal neurons in hippocampal slices. Control + AITC (100 µm) Control + HC (80 µm) Vm (mv) ± ± ± ± 0.6 Rm (MΩ) 225 ± ± ± ± 9 AP height (mv) 98 ± ± ± ± 1.6 AP T 0.5 (ms) 1.7 ± ± ± ± 0.1 n
A genetically targeted optical sensor to monitor calcium signals in astrocyte processes
 A genetically targeted optical sensor to monitor calcium signals in astrocyte processes 1 Eiji Shigetomi, 1 Sebastian Kracun, 2 Michael V. Sofroniew & 1,2 *Baljit S. Khakh Ψ 1 Departments of Physiology
SUPPLEMENTARY INFORMATION. Supplementary Figure 1
 SUPPLEMENTARY INFORMATION Supplementary Figure 1 The supralinear events evoked in CA3 pyramidal cells fulfill the criteria for NMDA spikes, exhibiting a threshold, sensitivity to NMDAR blockade, and all-or-none
SUPPLEMENTARY INFORMATION
 Supplementary Figure 1. Normal AMPAR-mediated fepsp input-output curve in CA3-Psen cdko mice. Input-output curves, which are plotted initial slopes of the evoked fepsp as function of the amplitude of the
Astrocyte signaling controls spike timing-dependent depression at neocortical synapses
 Supplementary Information Astrocyte signaling controls spike timing-dependent depression at neocortical synapses Rogier Min and Thomas Nevian Department of Physiology, University of Berne, Bern, Switzerland
Supporting Information
 ATP from synaptic terminals and astrocytes regulates NMDA receptors and synaptic plasticity through PSD- 95 multi- protein complex U.Lalo, O.Palygin, A.Verkhratsky, S.G.N. Grant and Y. Pankratov Supporting
Short- and long-lasting consequences of in vivo nicotine treatment
 Short- and long-lasting consequences of in vivo nicotine treatment on hippocampal excitability Rachel E. Penton, Michael W. Quick, Robin A. J. Lester Supplementary Figure 1. Histogram showing the maximal
Supplementary Figure 1. Basic properties of compound EPSPs at
 Supplementary Figure 1. Basic properties of compound EPSPs at hippocampal CA3 CA3 cell synapses. (a) EPSPs were evoked by extracellular stimulation of the recurrent collaterals and pharmacologically isolated
Supplementary Figure 1) GABAergic enhancement by leptin hyperpolarizes POMC neurons A) Representative recording samples showing the membrane
 GABAergic enhancement by leptin hyperpolarizes POMC neurons A) Representative recording samples showing the membrane") Supplementary Figure 1) GABAergic enhancement by leptin hyperpolarizes POMC neurons A) Representative recording samples showing the membrane potential recorded from POMC neurons following treatment with
Supplementary Figure 1) GABAergic enhancement by leptin hyperpolarizes POMC neurons A) Representative recording samples showing the membrane potential recorded from POMC neurons following treatment with
File name: Supplementary Information Description: Supplementary Figures, Supplementary Table and Supplementary References
 File name: Supplementary Information Description: Supplementary Figures, Supplementary Table and Supplementary References File name: Supplementary Data 1 Description: Summary datasheets showing the spatial
Supporting Online Material for
 www.sciencemag.org/cgi/content/full/312/5779/1533/dc1 Supporting Online Material for Long-Term Potentiation of Neuron-Glia Synapses Mediated by Ca 2+ - Permeable AMPA Receptors Woo-Ping Ge, Xiu-Juan Yang,
Supporting Online Material for
 www.sciencemag.org/cgi/content/full/317/5841/183/dc1 Supporting Online Material for Astrocytes Potentiate Transmitter Release at Single Hippocampal Synapses Gertrudis Perea and Alfonso Araque* *To whom
Wenqin Hu, Cuiping Tian, Tun Li, Mingpo Yang, Han Hou & Yousheng Shu
 Distinct contributions of Na v 1.6 and Na v 1.2 in action potential initiation and backpropagation Wenqin Hu, Cuiping Tian, Tun Li, Mingpo Yang, Han Hou & Yousheng Shu Supplementary figure and legend Supplementary
Supplementary Materials for
 www.sciencesignaling.org/cgi/content/full/8/358/ra2/dc1 Supplementary Materials for Localized TRPA1 channel Ca 2+ signals stimulated by reactive oxygen species promote cerebral artery dilation Michelle
Supporting Information
 Supporting Information Gerasimenko et al..73/pnas.39 SI Materials and Methods Reagents used in this study include Fluo-4/Fura- (Invitrogen), thapsigargin (albiochem), collagenase (Worthington), palmitoleic
Supplementary Figure 1 NMR spectra of hydroxy α and β-sanshool isomers. (Top) Hydroxy-α-sanshool (2E,6Z,8E,10E)-2'-
 Hydroxy-α-sanshool (2E,6Z,8E,10E)-2'-") Supplementary Figure 1 NMR spectra of hydroxy α and β-sanshool isomers. (Top) Hydroxy-α-sanshool (2E,6Z,8E,10E)-2'- hydroxyl-n-isobutyl-2,6,8,10-dodeca-tetraenamide) and (bottom) hydroxy-β-sanshool (2E,6E,8E,10E)-2'-hydroxyl-N-isobutyl-
Supplementary Figure 1 NMR spectra of hydroxy α and β-sanshool isomers. (Top) Hydroxy-α-sanshool (2E,6Z,8E,10E)-2'- hydroxyl-n-isobutyl-2,6,8,10-dodeca-tetraenamide) and (bottom) hydroxy-β-sanshool (2E,6E,8E,10E)-2'-hydroxyl-N-isobutyl-
SUPPLEMENTARY INFORMATION
 SUPPLEMENTARY INFORMATION Human cerebral cortex development from pluripotent stem cells to functional excitatory synapses Yichen Shi 1,2, Peter Kirwan 1,2, James Smith 1,2, Hugh P.C. Robinson 3 and Frederick
Supplementary Information. Errors in the measurement of voltage activated ion channels. in cell attached patch clamp recordings
 Supplementary Information Errors in the measurement of voltage activated ion channels in cell attached patch clamp recordings Stephen R. Williams 1,2 and Christian Wozny 2 1 Queensland Brain Institute,
Chapter 3 subtitles Action potentials
 CELLULAR NEUROPHYSIOLOGY CONSTANCE HAMMOND Chapter 3 subtitles Action potentials Introduction (3:15) This third chapter explains the calcium current triggered by the arrival of the action potential in
Supplementary Figure 1. SDS-FRL localization of CB 1 in the distal CA3 area of the rat hippocampus. (a-d) Axon terminals (t) in stratum pyramidale
 Axon terminals (t) in stratum pyramidale") Supplementary Figure 1. SDS-FRL localization of CB 1 in the distal CA3 area of the rat hippocampus. (a-d) Axon terminals (t) in stratum pyramidale (b) show stronger immunolabeling for CB 1 than those in
Supplementary Figure 1. SDS-FRL localization of CB 1 in the distal CA3 area of the rat hippocampus. (a-d) Axon terminals (t) in stratum pyramidale (b) show stronger immunolabeling for CB 1 than those in
Supplementary Figure 1: Steviol and stevioside potentiate TRPM5 in a cell-free environment. (a) TRPM5 currents are activated in inside-out patches
 TRPM5 currents are activated in inside-out patches") Supplementary Figure 1: Steviol and stevioside potentiate TRPM5 in a cell-free environment. (a) TRPM5 currents are activated in inside-out patches during application of 500 µm Ca 2+ at the intracellular
Supplementary Figure 1: Steviol and stevioside potentiate TRPM5 in a cell-free environment. (a) TRPM5 currents are activated in inside-out patches during application of 500 µm Ca 2+ at the intracellular
Dep. Control Time (min)
") aa Control Dep. RP 1s 1 mv 2s 1 mv b % potentiation of IPSP 2 15 1 5 Dep. * 1 2 3 4 Time (min) Supplementary Figure 1. Rebound potentiation of IPSPs in PCs. a, IPSPs recorded with a K + gluconate pipette
aa Control Dep. RP 1s 1 mv 2s 1 mv b % potentiation of IPSP 2 15 1 5 Dep. * 1 2 3 4 Time (min) Supplementary Figure 1. Rebound potentiation of IPSPs in PCs. a, IPSPs recorded with a K + gluconate pipette
SUPPLEMENTARY INFORMATION
 doi: 1.138/nature6416 Supplementary Notes Spine Ca 2+ signals produced by glutamate uncaging We imaged uncaging-evoked [Ca 2+ ] transients in neurons loaded with a green Ca 2+ - sensitive indicator (G;
Supplemental Materials Molecular Biology of the Cell
 Supplemental Materials Molecular Biology of the Cell Garcia-Alvarez et al. Supplementary Figure Legends Figure S1.Expression and RNAi-mediated silencing of STIM1 in hippocampal neurons (DIV, days in vitro).
Chapter 5 subtitles GABAergic synaptic transmission
 CELLULAR NEUROPHYSIOLOGY CONSTANCE HAMMOND Chapter 5 subtitles GABAergic synaptic transmission INTRODUCTION (2:57) In this fifth chapter, you will learn how the binding of the GABA neurotransmitter to
Supplementary Figure 1. ACE robotic platform. A. Overview of the rig setup showing major hardware components of ACE (Automatic single Cell
 2 Supplementary Figure 1. ACE robotic platform. A. Overview of the rig setup showing major hardware components of ACE (Automatic single Cell Experimenter) including the MultiClamp 700B, Digidata 1440A,
Supplementary Figure 1. GABA depolarizes the majority of immature neurons in the
 Supplementary Figure 1. GABA depolarizes the majority of immature neurons in the upper cortical layers at P3 4 in vivo. (a b) Cell-attached current-clamp recordings illustrate responses to puff-applied
Nature Methods: doi: /nmeth Supplementary Figure 1. Activity in turtle dorsal cortex is sparse.
 Supplementary Figure 1 Activity in turtle dorsal cortex is sparse. a. Probability distribution of firing rates across the population (notice log scale) in our data. The range of firing rates is wide but
BIPN 140 Problem Set 6
 BIPN 140 Problem Set 6 1) The hippocampus is a cortical structure in the medial portion of the temporal lobe (medial temporal lobe in primates. a) What is the main function of the hippocampus? The hippocampus
Light-evoked hyperpolarization and silencing of neurons by conjugated polymers
 Light-evoked hyperpolarization and silencing of neurons by conjugated polymers Paul Feyen 1,, Elisabetta Colombo 1,2,, Duco Endeman 1, Mattia Nova 1, Lucia Laudato 2, Nicola Martino 2,3, Maria Rosa Antognazza
Nature Neuroscience: doi: /nn Supplementary Figure 1. Trial structure for go/no-go behavior
 Supplementary Figure 1 Trial structure for go/no-go behavior a, Overall timeline of experiments. Day 1: A1 mapping, injection of AAV1-SYN-GCAMP6s, cranial window and headpost implantation. Water restriction
BIPN 140 Problem Set 6
 BIPN 140 Problem Set 6 1) Hippocampus is a cortical structure in the medial portion of the temporal lobe (medial temporal lobe in primates. a) What is the main function of the hippocampus? The hippocampus
SUPPLEMENTARY INFORMATION
 SUPPLEMENTARY INFORMATION doi:10.1038/nature11306 Supplementary Figures Supplementary Figure 1. Basic characterization of GFP+ RGLs in the dentate gyrus of adult nestin-gfp mice. a, Sample confocal images
Human TRPC6 Ion Channel Cell Line
 TECHNICAL DATA SHEET ValiScreen Ion Channel Cell Line Caution: For Laboratory Use. A research product for research purposes only Human TRPC6 Ion Channel Cell Line Product No.: AX-012-C Lot No.: 512-548-A
Supplementary Table I Blood pressure and heart rate measurements pre- and post-stroke
 SUPPLEMENTARY INFORMATION doi:10.1038/nature09511 Supplementary Table I Blood pressure and heart rate measurements pre- and post-stroke Pre Post 7-days Systolic Diastolic BPM Systolic Diastolic BPM Systolic
Nature Neuroscience: doi: /nn Supplementary Figure 1. Large-scale calcium imaging in vivo.
 Supplementary Figure 1 Large-scale calcium imaging in vivo. (a) Schematic illustration of the in vivo camera imaging set-up for large-scale calcium imaging. (b) High-magnification two-photon image from
-51mV 30s 3mV. n=14 n=4 p=0.4. Depolarization (mv) 3
 3") Supplementary Figure 1 a optoβ 2 -AR b ChR2-51mV 30s 3mV -50mV 30s 3mV c 4 n=14 n=4 p=0.4 Depolarization (mv) 3 2 1 0 Both optogenetic actuators, optoβ 2 AR and ChR2, were effective in stimulating astrocytes
Supplementary Figure 1 a optoβ 2 -AR b ChR2-51mV 30s 3mV -50mV 30s 3mV c 4 n=14 n=4 p=0.4 Depolarization (mv) 3 2 1 0 Both optogenetic actuators, optoβ 2 AR and ChR2, were effective in stimulating astrocytes
Supplementary Materials for VAMP4 directs synaptic vesicles to a pool that selectively maintains asynchronous neurotransmission
 Supplementary Materials for VAMP4 directs synaptic vesicles to a pool that selectively maintains asynchronous neurotransmission Jesica Raingo, Mikhail Khvotchev, Pei Liu, Frederic Darios, Ying C. Li, Denise
Brief presynaptic bursts evoke synapse-specific retrograde inhibition mediated by endogenous cannabinoids
 Brief presynaptic bursts evoke synapse-specific retrograde inhibition mediated by endogenous cannabinoids Solange P Brown 1 3,Stephan D Brenowitz 1,3 & Wade G Regehr 1 Many types of neurons can release
Supplementary Figure 1. SybII and Ceb are sorted to distinct vesicle populations in astrocytes. Nature Neuroscience: doi: /nn.
 Supplementary Figure 1 SybII and Ceb are sorted to distinct vesicle populations in astrocytes. (a) Exemplary images for cultured astrocytes co-immunolabeled with SybII and Ceb antibodies. SybII accumulates
Supplemental Information. Memory-Relevant Mushroom Body. Output Synapses Are Cholinergic
 Neuron, Volume 89 Supplemental Information Memory-Relevant Mushroom Body Output Synapses Are Cholinergic Oliver Barnstedt, David Owald, Johannes Felsenberg, Ruth Brain, John-Paul Moszynski, Clifford B.
Nature Neuroscience: doi: /nn Supplementary Figure 1
 Supplementary Figure 1 Bidirectional optogenetic modulation of the tonic activity of CEA PKCδ + neurons in vitro. a, Top, Cell-attached voltage recording illustrating the blue light-induced increase in
A thallium based screening procedure to identify molecules that modulate the activity of Ca 2+ -activated monovalent cation selective channels.
 Supplemental Material A thallium based screening procedure to identify molecules that modulate the activity of Ca 2+ -activated monovalent cation selective channels. Koenraad Philippaert *,1,2,3, Sara
T H E J O U R N A L O F C E L L B I O L O G Y
 Supplemental material Chen et al., http://www.jcb.org/cgi/content/full/jcb.201210119/dc1 T H E J O U R N A L O F C E L L B I O L O G Y Figure S1. Lack of fast reversibility of UVR8 dissociation. (A) HEK293T
Supplementary Information
 Supplementary Information D-Serine regulates cerebellar LTD and motor coordination through the 2 glutamate receptor Wataru Kakegawa, Yurika Miyoshi, Kenji Hamase, Shinji Matsuda, Keiko Matsuda, Kazuhisa
Sample Lab Report 1 from 1. Measuring and Manipulating Passive Membrane Properties
 Sample Lab Report 1 from http://www.bio365l.net 1 Abstract Measuring and Manipulating Passive Membrane Properties Biological membranes exhibit the properties of capacitance and resistance, which allow
Supplementary Figure 1
 Supplementary Figure 1 Supplementary Figure 1 SNARE Probes for FRET/2pFLIM Analysis Used in the Present Study. mturquoise (mtq) and Venus (Ven) are in blue and yellow, respectively. The soluble N-ethylmaleimide-sensitive
Synaptic Integration
 Synaptic Integration 3 rd January, 2017 Touqeer Ahmed PhD Atta-ur-Rahman School of Applied Biosciences National University of Sciences and Technology Excitatory Synaptic Actions Excitatory Synaptic Action
Unique functional properties of somatostatin-expressing GABAergic neurons in mouse barrel cortex
 Supplementary Information Unique functional properties of somatostatin-expressing GABAergic neurons in mouse barrel cortex Luc Gentet, Yves Kremer, Hiroki Taniguchi, Josh Huang, Jochen Staiger and Carl
Supplementary Information
 Supplementary Information Title Degeneration and impaired regeneration of gray matter oligodendrocytes in amyotrophic lateral sclerosis Authors Shin H. Kang, Ying Li, Masahiro Fukaya, Ileana Lorenzini,
SUPPLEMENTARY INFORMATION
 doi:1.138/nature1139 a d Whisker angle (deg) Whisking repeatability Control Muscimol.4.3.2.1 -.1 8 4-4 1 2 3 4 Performance (d') Pole 8 4-4 1 2 3 4 5 Time (s) b Mean protraction angle (deg) e Hit rate (p
Functions of Lysosomes
 Functions of Lysosomes Intro - Degradation of cell components -Cell death -Autophagy 1st - Exocytosis / Secretory pathway - Calcium signalling 2nd O BayDH., (2009) Phosphatidylcholine Intro Phosphatidylcholine
Title: Plasticity of intrinsic excitability in mature granule cells of the dentate gyrus
 Title: Plasticity of intrinsic excitability in mature granule cells of the dentate gyrus Authors: Jeffrey Lopez-Rojas a1, Martin Heine b1 and Michael R. Kreutz ac1 a Research Group Neuroplasticity, b Research
Supplementary Information
 Hyperpolarization-activated cation channels inhibit EPSPs by interactions with M-type K + channels Meena S. George, L.F. Abbott, Steven A. Siegelbaum Supplementary Information Part 1: Supplementary Figures
Ube3a is required for experience-dependent maturation of the neocortex
 Ube3a is required for experience-dependent maturation of the neocortex Koji Yashiro, Thorfinn T. Riday, Kathryn H. Condon, Adam C. Roberts, Danilo R. Bernardo, Rohit Prakash, Richard J. Weinberg, Michael
Bidirectional NMDA receptor plasticity controls CA3 output and heterosynaptic metaplasticity
 Bidirectional NMDA receptor plasticity controls CA output and heterosynaptic metaplasticity David L. Hunt, Nagore Puente, Pedro Grandes, Pablo E. Castillo a NMDAR EPSC (pa) - - -8-6 -4 - st 5 nd 5 b NMDAR
Supplementary Figure 1
 Supplementary Figure 1 AAV-GFP injection in the MEC of the mouse brain C57Bl/6 mice at 4 months of age were injected with AAV-GFP into the MEC and sacrificed at 7 days post injection (dpi). (a) Brains
Supplementary Figure S1 (a) (b)
 (b)") Supplementary Figure S1: IC87114 does not affect basal Ca 2+ level nor nicotineinduced Ca 2+ influx. (a) Bovine chromaffin cells were loaded with Fluo-4AM (1 μm) in buffer A containing 0.02% of pluronic
Supplementary Figure S1: IC87114 does not affect basal Ca 2+ level nor nicotineinduced Ca 2+ influx. (a) Bovine chromaffin cells were loaded with Fluo-4AM (1 μm) in buffer A containing 0.02% of pluronic
SUPPLEMENTARY LEGENDS...
 TABLE OF CONTENTS SUPPLEMENTARY LEGENDS... 2 11 MOVIE S1... 2 FIGURE S1 LEGEND... 3 FIGURE S2 LEGEND... 4 FIGURE S3 LEGEND... 5 FIGURE S4 LEGEND... 6 FIGURE S5 LEGEND... 7 FIGURE S6 LEGEND... 8 FIGURE
Chapter 6 subtitles postsynaptic integration
 CELLULAR NEUROPHYSIOLOGY CONSTANCE HAMMOND Chapter 6 subtitles postsynaptic integration INTRODUCTION (1:56) This sixth and final chapter deals with the summation of presynaptic currents. Glutamate and
Pharmacological evaluation. in human ipsc-derived cortical and sensory neurons using high-throughput MEA system
 ELRIG Drug Discovery 2017 Oct 3-4 Liverpool UK Pharmacological Responses in Cultured Human ipsc Pharmacological evaluation derived Cortical Neurons using Multi-electrode Array in human ipsc-derived cortical
Nature Neuroscience: doi: /nn.2275
 Supplementary Figure S1. The presence of MeCP2 in enriched primary glial cultures from rat or mouse brains is not neuronal. Western blot analysis of protein extracts from (a) rat glial and neuronal cultures.
Supplementary Figure 1. mir124 does not change neuron morphology and synaptic
 Supplementary Figure 1. mir124 does not change neuron morphology and synaptic density. Hippocampal neurons were transfected with mir124 (containing DsRed) or DsRed as a control. 2 d after transfection,
Tuning properties of individual circuit components and stimulus-specificity of experience-driven changes.
 Supplementary Figure 1 Tuning properties of individual circuit components and stimulus-specificity of experience-driven changes. (a) Left, circuit schematic with the imaged component (L2/3 excitatory neurons)
Chapter 3 Neurotransmitter release
 NEUROPHYSIOLOGIE CELLULAIRE CONSTANCE HAMMOND Chapter 3 Neurotransmitter release In chapter 3, we proose 3 videos: Observation Calcium Channel, Ca 2+ Unitary and Total Currents Ca 2+ and Neurotransmitter
Neuroscience 201A Problem Set #1, 27 September 2016
 Neuroscience 201A Problem Set #1, 27 September 2016 1. The figure above was obtained from a paper on calcium channels expressed by dentate granule cells. The whole-cell Ca 2+ currents in (A) were measured
Silencing neurotransmission with membrane-tethered toxins
 nature methods Silencing neurotransmission with membrane-tethered toxins Sebastian Auer, Annika S Stürzebecher, René Jüttner, Julio Santos-Torres, Christina Hanack, Silke Frahm, Beate Liehl & Inés Ibañez-Tallon
Neurons of the Bed Nucleus of the Stria Terminalis (BNST)
") Neurons of the Bed Nucleus of the Stria Terminalis (BNST) Electrophysiological Properties and Their Response to Serotonin DONALD G. RAINNIE a Harvard Medical School and Department of Psychiatry, Brockton
Neurons of the Bed Nucleus of the Stria Terminalis (BNST) Electrophysiological Properties and Their Response to Serotonin DONALD G. RAINNIE a Harvard Medical School and Department of Psychiatry, Brockton
Comparative effects of heterologous TRPV1 and TRPM8 expression in rat hippocampal neurons
 Washington University School of Medicine Digital Commons@Becker Open Access Publications 2009 Comparative effects of heterologous TRPV1 and TRPM8 expression in rat hippocampal neurons Devon C. Crawford
Supplementary information. The Light Intermediate Chain 2 Subpopulation of Dynein Regulates Mitotic. Spindle Orientation
 Supplementary information The Light Intermediate Chain 2 Subpopulation of Dynein Regulates Mitotic Spindle Orientation Running title: Dynein LICs distribute mitotic functions. Sagar Mahale a, d, *, Megha
Supplementary Figure 1 Information on transgenic mouse models and their recording and optogenetic equipment. (a) 108 (b-c) (d) (e) (f) (g)
 108 (b-c) (d) (e) (f) (g)") Supplementary Figure 1 Information on transgenic mouse models and their recording and optogenetic equipment. (a) In four mice, cre-dependent expression of the hyperpolarizing opsin Arch in pyramidal cells
Supplementary Figure 1 Information on transgenic mouse models and their recording and optogenetic equipment. (a) In four mice, cre-dependent expression of the hyperpolarizing opsin Arch in pyramidal cells
A Role for Synaptic Inputs at Distal Dendrites: Instructive Signals for Hippocampal Long-Term Plasticity
 Article A Role for Synaptic Inputs at Distal Dendrites: Instructive Signals for Hippocampal Long-Term Plasticity Joshua T. Dudman, 1 David Tsay, 1 and Steven A. Siegelbaum 1,2,3, * 1 Department of Neuroscience
The action potential travels down both branches because each branch is a typical axon with voltage dependent Na + and K+ channels.
 BIO 360 - MIDTERM FALL 2018 This is an open book, open notes exam. PLEASE WRITE YOUR NAME ON EACH SHEET. Read each question carefully and answer as well as you can. Point values are shown at the beginning
Cellular Neurobiology BIPN 140 Fall 2016 Problem Set #2
 Cellular Neurobiology BIPN 140 Fall 2016 Problem Set #2 1. (PeiXi) You are performing research on a novel ion channel and want to learn some of its characteristics. a) When you conducted voltage clamp
5-Nervous system II: Physiology of Neurons
 5-Nervous system II: Physiology of Neurons AXON ION GRADIENTS ACTION POTENTIAL (axon conduction) GRADED POTENTIAL (cell-cell communication at synapse) SYNAPSE STRUCTURE & FUNCTION NEURAL INTEGRATION CNS
Supplemental Information. Ca V 2.2 Gates Calcium-Independent. but Voltage-Dependent Secretion. in Mammalian Sensory Neurons
 Neuron, Volume 96 Supplemental Information Ca V 2.2 Gates Calcium-Independent but Voltage-Dependent Secretion in Mammalian Sensory Neurons Zuying Chai, Changhe Wang, Rong Huang, Yuan Wang, Xiaoyu Zhang,
Nature Biotechnology: doi: /nbt.3828
 Supplementary Figure 1 Development of a FRET-based MCS. (a) Linker and MA2 modification are indicated by single letter amino acid code. indicates deletion of amino acids and N or C indicate the terminus
( )-Englerin A as a novel potent activator of TRPC4 and TRPC5 channels
-Englerin A as a novel potent activator of TRPC4 and TRPC5 channels") Aurora Ion Channel Retreat 215 ( )-Englerin A as a novel potent activator of TRPC4 and TRPC5 channels Hannah J. Gaunt David Beech Lab School of Medicine University of Leeds Introduction to TRP channels
Aurora Ion Channel Retreat 215 ( )-Englerin A as a novel potent activator of TRPC4 and TRPC5 channels Hannah J. Gaunt David Beech Lab School of Medicine University of Leeds Introduction to TRP channels
The mammalian cochlea possesses two classes of afferent neurons and two classes of efferent neurons.
 1 2 The mammalian cochlea possesses two classes of afferent neurons and two classes of efferent neurons. Type I afferents contact single inner hair cells to provide acoustic analysis as we know it. Type
Supplementary Figure 1
 Supplementary Figure 1 Arcuate ChIEF-tdTomato neurons expressed TH These micrographs show that TH-Cre-ChIEF-tdTomato (magenta), expressed by AAV in a TH-Cre mouse, were immunostained with TH (green) in
BIPN140 Lecture 8: Synaptic Transmission II
 BIPN140 Lecture 8: Synaptic Transmission II 1. Postsynaptic Receptors: Metabotropic & Ionotropic 2. Postsynaptic Responses (Postsynaptic Potentials, PSPs) 3. Neurotransmitters Su (FA16) Chemical Synapse:
Is action potential threshold lowest in the axon?
 Supplementary information to: Is action potential threshold lowest in the axon? Maarten H. P. Kole & Greg J. Stuart Supplementary Fig. 1 Analysis of action potential (AP) threshold criteria. (a) Example
Enhancement of synaptic transmission by cyclic AMP modulation of presynaptic I h channels. Vahri Beaumont and Robert S. Zucker
 Enhancement of synaptic transmission by cyclic AMP modulation of presynaptic I h channels Vahri Beaumont and Robert S. Zucker Background I h channels discovered in 1976 (Noma A. and Irisawa H.) Voltage-gated
Nature Medicine: doi: /nm.4084
 Supplementary Figure 1: Sample IEDs. (a) Sample hippocampal IEDs from different kindled rats (scale bar = 200 µv, 100 ms). (b) Sample temporal lobe IEDs from different subjects with epilepsy (scale bar
VaTx1 VaTx2 VaTx3. VaTx min Retention Time (min) Retention Time (min)
 Retention Time (min)") a Absorbance (mau) 5 2 5 3 4 5 6 7 8 9 6 2 3 4 5 6 VaTx2 High Ca 2+ Low Ca 2+ b 38.2 min Absorbance (mau) 3 2 3 4 5 3 2 VaTx2 39.3 min 3 4 5 3 2 4. min 3 4 5 Supplementary Figure. Toxin Purification For
a Absorbance (mau) 5 2 5 3 4 5 6 7 8 9 6 2 3 4 5 6 VaTx2 High Ca 2+ Low Ca 2+ b 38.2 min Absorbance (mau) 3 2 3 4 5 3 2 VaTx2 39.3 min 3 4 5 3 2 4. min 3 4 5 Supplementary Figure. Toxin Purification For
Supplementary Figure 1
 Supplementary Figure 1 The average sigmoid parametric curves of capillary dilation time courses and average time to 50% peak capillary diameter dilation computed from individual capillary responses averaged
Imaging energy status in live cells with a fluorescent biosensor of the intracellular ATP-to-ADP. ratio
 Imaging energy status in live cells with a fluorescent biosensor of the intracellular ATP-to-ADP ratio Mathew Tantama, Juan Ramón Martínez-François, Rebecca Mongeon, Gary Yellen* Department of Neurobiology,
Nature Neuroscience doi: /nn Supplementary Figure 1. Characterization of viral injections.
 Supplementary Figure 1 Characterization of viral injections. (a) Dorsal view of a mouse brain (dashed white outline) after receiving a large, unilateral thalamic injection (~100 nl); demonstrating that
Calcium Store Depletion Induces Persistent Perisomatic Increases in the Functional Density of h Channels in Hippocampal Pyramidal Neurons
 Article Calcium Store Depletion Induces Persistent Perisomatic Increases in the Functional Density of h Channels in Hippocampal Pyramidal Neurons Rishikesh Narayanan, 1,2 Kevin J. Dougherty, 1 and Daniel
Supplementary Figure 1. Microglia do not show signs of classical immune activation following MD a-b. Images showing immunoreactivity for MHCII (a)
") 1 Supplementary Figure 1. Microglia do not show signs of classical immune activation following MD a-b. Images showing immunoreactivity for MHCII (a) and CD45 (b) in fixed sections of binocular visual cortex
1 Supplementary Figure 1. Microglia do not show signs of classical immune activation following MD a-b. Images showing immunoreactivity for MHCII (a) and CD45 (b) in fixed sections of binocular visual cortex
(a) Significant biological processes (upper panel) and disease biomarkers (lower panel)
 Significant biological processes (upper panel) and disease biomarkers (lower panel)") Supplementary Figure 1. Functional enrichment analyses of secretomic proteins. (a) Significant biological processes (upper panel) and disease biomarkers (lower panel) 2 involved by hrab37-mediated secretory
Supplementary Figure 1. Functional enrichment analyses of secretomic proteins. (a) Significant biological processes (upper panel) and disease biomarkers (lower panel) 2 involved by hrab37-mediated secretory
Rescue of mutant rhodopsin traffic by metformin-induced AMPK activation accelerates photoreceptor degeneration Athanasiou et al
 Supplementary Material Rescue of mutant rhodopsin traffic by metformin-induced AMPK activation accelerates photoreceptor degeneration Athanasiou et al Supplementary Figure 1. AICAR improves P23H rod opsin
Ultrastructural Contributions to Desensitization at the Cerebellar Mossy Fiber to Granule Cell Synapse
 Ultrastructural Contributions to Desensitization at the Cerebellar Mossy Fiber to Granule Cell Synapse Matthew A.Xu-Friedman and Wade G. Regehr Department of Neurobiology, Harvard Medical School, Boston,
HEK293-GRIK2. Glutamate receptor GluR6. Application Report:
 Application Report: HEK293-GRIK2 Glutamate receptor GluR6 This report presents QPatch studies based on whole-cell current recordings from the ligand-gated ion channel GRIK2 receptors (Glu6R), expressed
The plant alkaloid harmaline blocks the human voltage-gated sodium channel Na v 1.7 expressed in CHO cells: a study using automated patch clamp
 Ernst Moritz Arndt University of Greifswald Institute of Pathophysiology The plant alkaloid harmaline blocks the human voltage-gated sodium channel Na v 1.7 expressed in CHO cells: a study using automated
Hormonal gain control of a medial preoptic area social reward circuit
 CORRECTION NOTICE Nat. Neurosci. 20, 449 458 (2017) Hormonal gain control of a medial preoptic area social reward circuit Jenna A McHenry, James M Otis, Mark A Rossi, J Elliott Robinson, Oksana Kosyk,
SUPPLEMENTARY INFORMATION. The Calcium-activated Chloride Channel Anoctamin 1 acts as a Heat. Sensor in Nociceptive Neurons
 SUPPLEMENTARY INFORMATION The Calcium-activated Chloride Channel Anoctamin 1 acts as a Heat Sensor in Nociceptive Neurons Hawon Cho, Young Duk Yang, Jesun Lee, Byeongjoon Lee, Tahnbee Kim Yongwoo Jang,
TRPC channels function independently of STIM1 and Orai1
 J Physiol 587.1 (29) pp 2275 2298 2275 TRPC channels function independently of STIM1 and Orai1 Wayne I. DeHaven, Bertina F. Jones, John G. Petranka, Jeremy T. Smyth, Takuro Tomita, Gary S. Bird and James
BIONB/BME/ECE 4910 Neuronal Simulation Assignments 1, Spring 2013
 BIONB/BME/ECE 4910 Neuronal Simulation Assignments 1, Spring 2013 Tutorial Assignment Page Due Date Week 1/Assignment 1: Introduction to NIA 1 January 28 The Membrane Tutorial 9 Week 2/Assignment 2: Passive
Authors: K. L. Arendt, M. Royo, M. Fernández-Monreal, S. Knafo, C. N. Petrok, J.
 SUPPLEMENTARY INFORMATION Title: PIP 3 controls synaptic function by maintaining AMPA receptor clustering at the postsynaptic membrane Authors: K. L. Arendt, M. Royo, M. Fernández-Monreal, S. Knafo, C.
SUPPLEMENTARY INFORMATION
 doi:10.1038/nature10776 Supplementary Information 1: Influence of inhibition among blns on STDP of KC-bLN synapses (simulations and schematics). Unconstrained STDP drives network activity to saturation