Supplemental Table 1. Primers used for RT-PCR analysis of inflammatory cytokines Gene Primer Sequence
|
|
|
- Madeleine Hancock
- 6 years ago
- Views:
Transcription
1 Supplemental Table 1. Primers used for RT-PCR analysis of inflammatory cytokines Gene Primer Sequence IL-1α Forward primer 5 -CAAGATGGCCAAAGTTCGTGAC-3' Reverse primer 5 -GTCTCATGAAGTGAGCCATAGC-3 IL-1β Forward primer 5 -ATGGCAACTGTTCCTGAACTCAACT-3 Reverse primer 5 -CAGGACAGGTATAGATTCTTTCCTTT-3 IL-6 Forward primer 5 -AGGATACCACTCCCAACAGACCT-3 Reverse primer 5 -CAAGTGCATCATCGTTGTTCATAC-3 TNF-α Forward primer 5 -TTCTGTCTACTGAACTTCGGGGTGATCGGTCC-3 Reverse primer 5 -GTATGAGATAGCAAATCGGCTGACGGTGTGGG-3 ICAM-1 Forward primer 5 -GGCATTGTTCTCTAATGTCTCCG-3 Reverse primer 5 -CCGCTCAGAAGAACCACCTTGG-3 VCAM-1 Forward primer 5 -TACTCCCGTCATTGAGGATATTGG-3 Reverse primer 5 -CTCCTTCACACACATAGACTCC-3
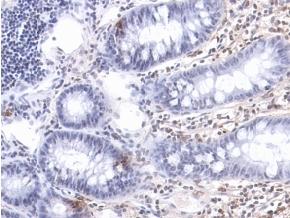
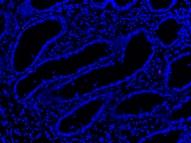
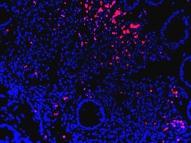
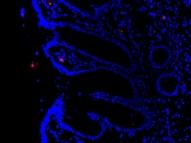
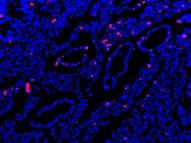
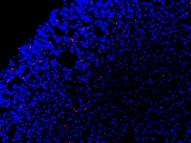
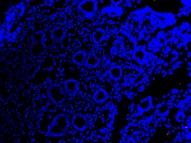
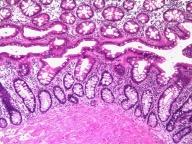
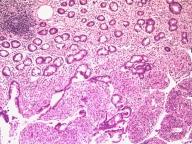
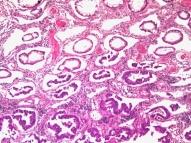
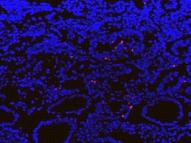
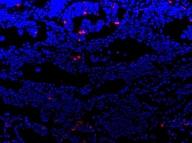
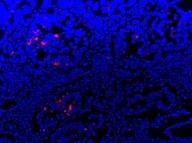
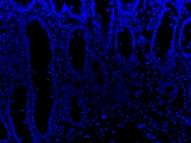
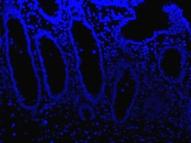
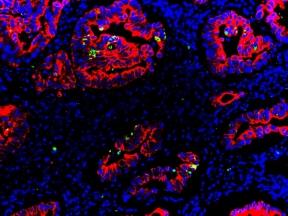
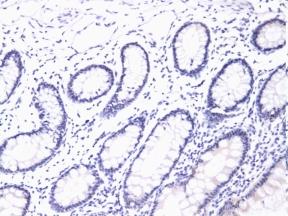
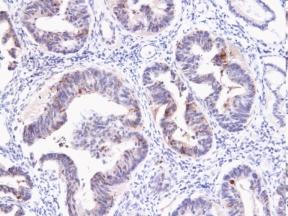
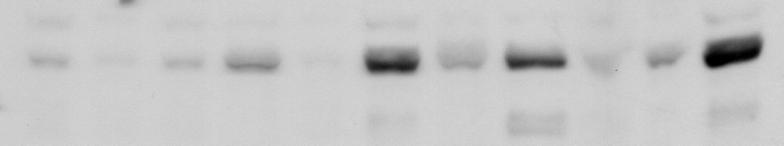
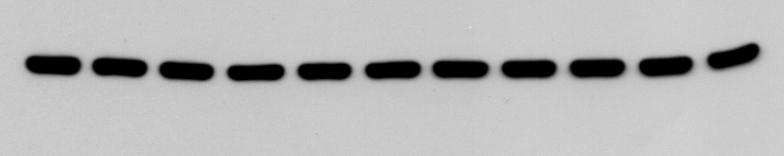
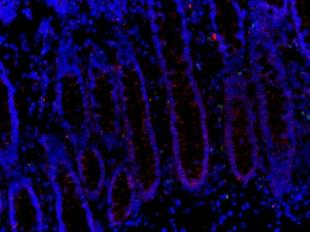
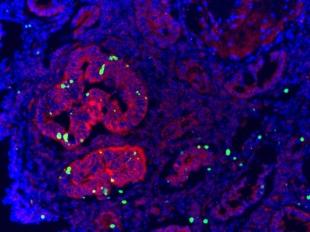
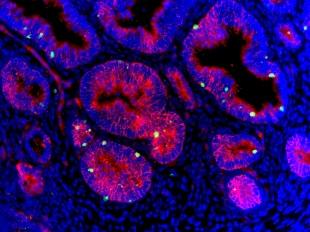
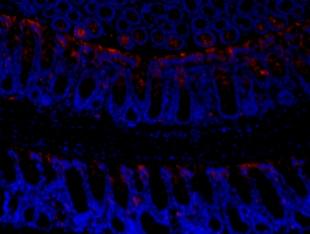
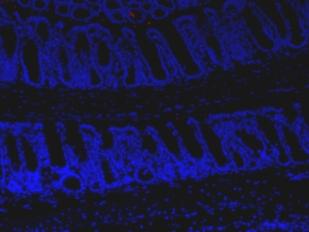
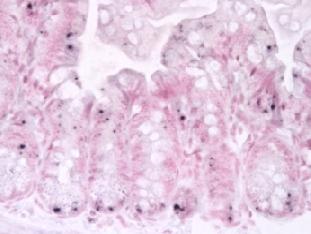
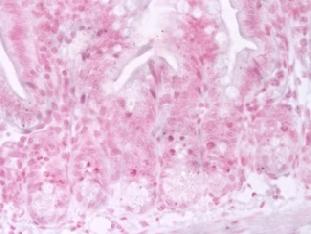
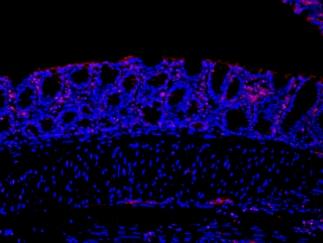
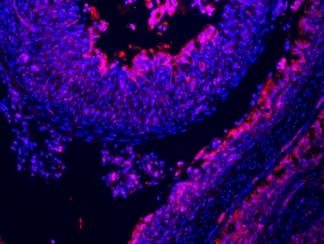
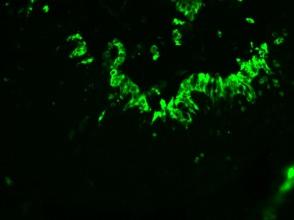
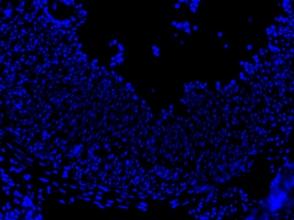
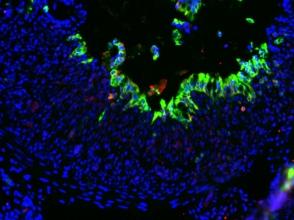
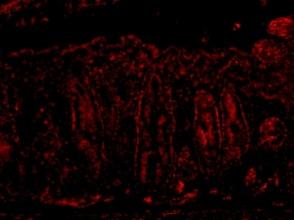
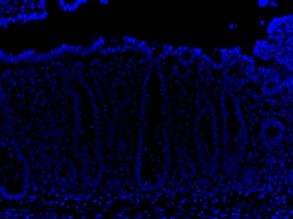
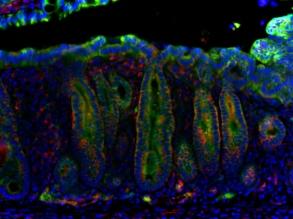
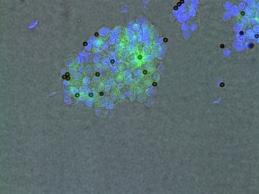
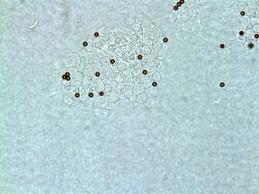
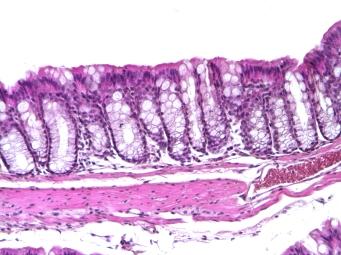
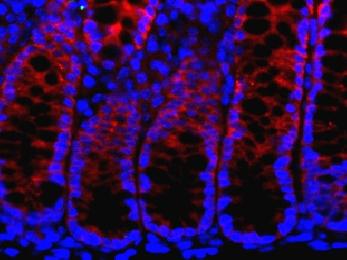
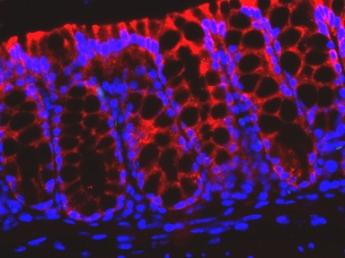
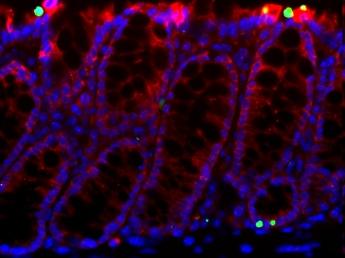
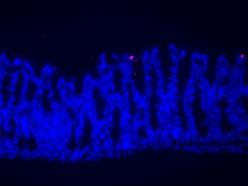
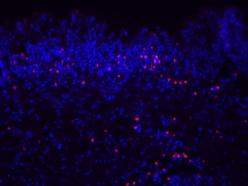
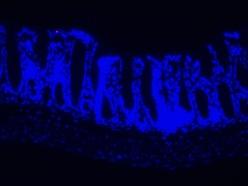
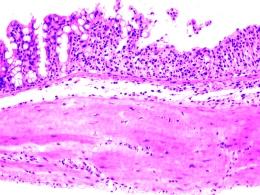
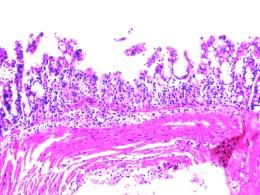
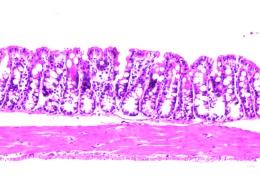
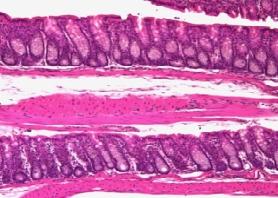
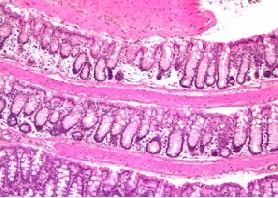
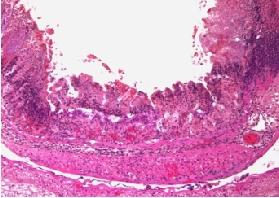
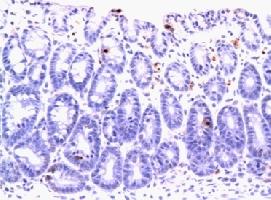
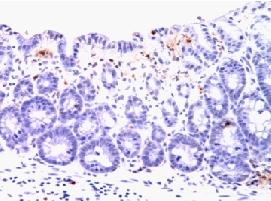
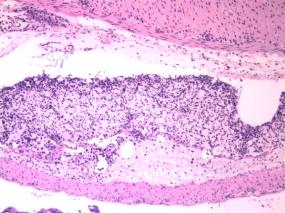
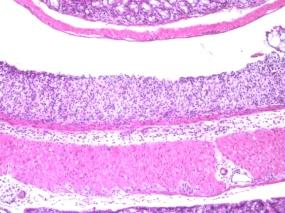
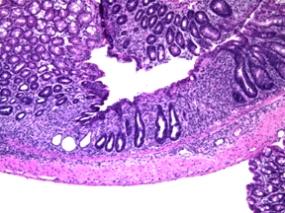
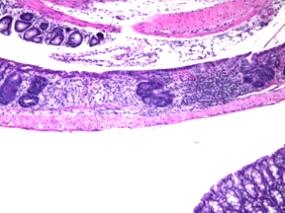
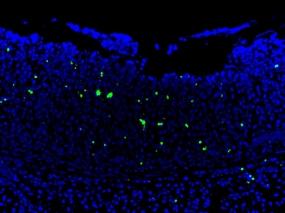
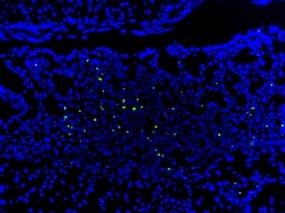
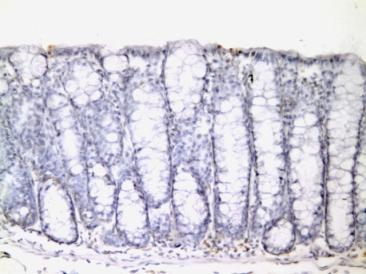
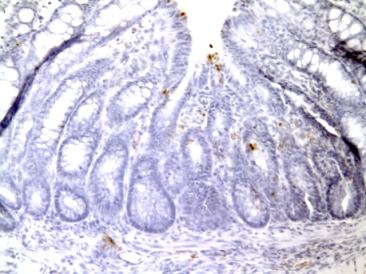
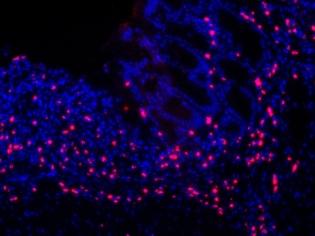
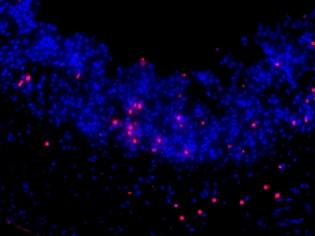
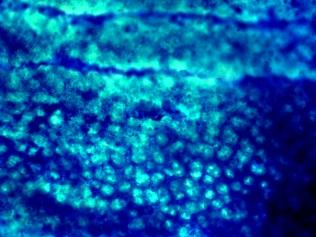
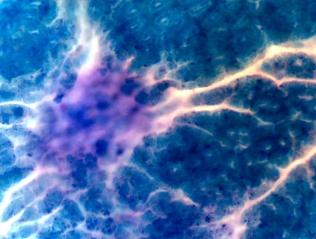
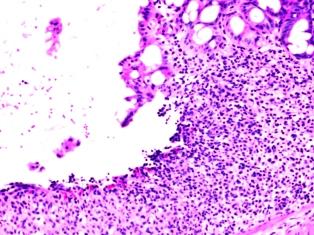
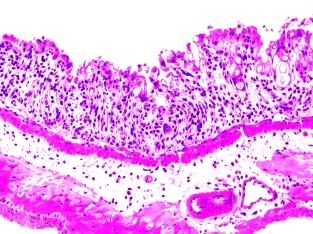
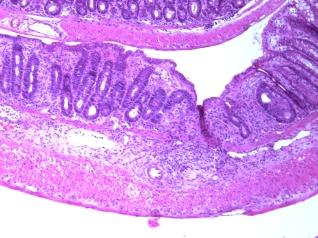
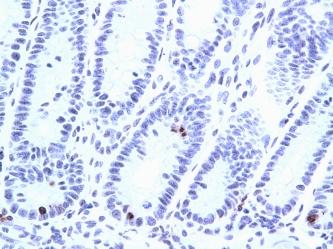
2 Supplemental Figure 1 Apoptosis and caspase activation in human ulcerative colitis tissues. (A) H&E (left panel), TUNEL (red, middle panel), and active caspase 3 (red, right panel) staining of 3 matched pairs of uninvolved colonic and colitis tissues (200 ). (B) TUNEL (brown) staining of a matched pair of uninvolved colonic and colitis tissues (400 ). Arrows indicate example TUNEL positive cells. (C) Apoptotic index of the crypts of uninvolved colonic and colitis tissues was determined by counting TUNEL signals in 100 randomly selected crypts following TUNEL staining as in (B). Values were means ± SD (n = 6 in each group). (D) Caspase 3 activation in a matched pair of uninvolved colonic and colitis tissues was detected by active caspase 3 (brown) immunostaining (upper panel; 400 ), and active caspase 3 (green) and cytokeratin (red) double staining (lower panel; 400 ). Arrows indicate example active caspase 3 positive, or active caspase 3 and cytokeratin double positive cells. (E) Active caspase 3 index of crypts of uninvolved colonic and colitis tissues from UC patients was determined by counting active caspase 3 signals in 20 randomly selected crypts following active caspase 3 staining as in (D). Values were means ± SD (n = 3 in each group). Supplemental Figure 2 PUMA induction and apoptosis in human ulcerative colitis tissues. (A) PUMA protein expression in 11 uninvolved colonic tissues (N1-N11) and 11 ulcerative colitis (UC1-UC11) tissues was analyzed by Western blotting. (B) A control for PUMA RNA in situ hybridization (ISH). PUMA expression (dark dots) was analyzed by ISH in colonic tissues from WT and PUMA-KO mice at 4 hr after exposure to -irradiation at 15 Gy (400 ). Arrows indicate example PUMA-expressing cells. (C) A control for PUMA immunostaining. PUMA expression 1
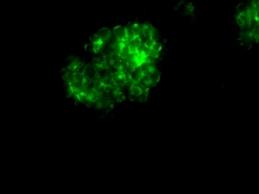
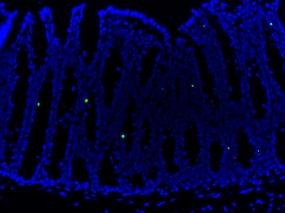
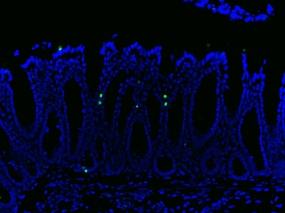
3 in colonic tissues from WT and PUMA-KO mice was analyzed by immunostaining (200 ). Arrows indicate example cells with basal PUMA expression. (D) PUMA (red) and TUNEL (green) double staining of an uninvolved and 2 UC tissues (400 ). Arrows indicate example PUMA and TUNEL double positive cells. (E) Correlation between PUMA expression determined by Western blotting and apoptosis levels analyzed by TUNEL staining in colitis tissues from UC patients. Values were means ± SD (n = 9 in each group). Supplemental Figure 3 Induction of PUMA in mice following DSS or TNBS treatment. WT and PUMA-KO mice were treated with 5% DSS for 7 days, or 100 mg/kg of TNBS for 3 days, to induce colitis. (A) PUMA (red) staining of colonic tissues from the treated mice (200 ). A section from untreated PUMA- KO mice was used as the control for staining specificity. (B) PUMA (red) and cytokeratin (green) double staining of colonic tissues from the treated mice (200 ). Supplemental Figure 4 Induction of PUMA in colonic epithelial cells and expression of other Bcl-2 family members in colonic mucosa of DSS- and TNBS-treated mice. WT mice were treated with 5% DSS for 7 days, or 100 mg/kg of TNBS for 3 days, to induce colitis. (A) Colonic epithelial cells were isolated from colonic mucosa of the treated mice as described in the Methods. The isolated epithelial cells were verified by immunostaining for EpCAM (green), an epithelial marker. (B) Western blot analysis of the indicated proteins in colonic epithelial cells isolated as in (A). (C) Western blot analysis of Bcl-2 family members in the colonic mucosa of DSS- or TNBS-treated 2
4 mice. In (B) and (C), relative expression of each sample normalized to the loading control - actin is indicated, with that of the untreated animal arbitrarily set as 1.0. Supplemental Figure 5 DSS-induced colonic damage in WT and PUMA-KO mice. (A) H&E staining of colonic tissues from WT and PUMA-KO mice treated with 5% DSS for 1 or 3 days (200 ). (B) Histological scores of the treated mice were determined following H&E staining as in (A). Values were means ± SD (n = 3 in each group). (C) Myeloperoxidase (MPO) activities in colonic mucosa from WT and PUMA-KO mice treated with 5% DSS for 7 days were measured as described in the Methods. Supplemental Figure 6 Apoptosis in colonic tissues from WT and PUMA-KO mice treated with 5% DSS or 100 mg/kg of TNBS. (A) DNA fragmentation in the mice treated with DSS for 7 days was quantified by diphenylamine reaction as described in the Methods. Values were means ± SD (n = 3 in each group). (B) Apoptotic index in the mice treated with DSS for 1 or 3 days was determined by counting TUNEL signals in 100 randomly selected crypts following TUNEL staining. Values were means ± SD (n = 3 mice in each group). (C) TUNEL (green) and cytokeratin (red) double staining of colonic tissues from the mice treated with DSS for 3 days (400 ). Arrows indicate example TUNEL and cytokeratin double positive cells. (D) Caspase 3 activity was measured using colonic mucosa extracts from the mice treated with DSS for 7 days. Values were means ± SD (n = 6 mice in each group). (E) TUNEL (green) and cytokeratin (red) double staining of 3
5 colonic tissues from the mice treated with 100 mg/kg TNBS for 3 days (400 ). Arrows indicate example TUNEL and cytokeratin double positive cells. Supplemental Figure 7 TNBS-induced inflammation in WT and PUMA-KO mice. WT and PUMA-KO mice were treated with 100 mg/kg of TNBS for 3 days to induce colitis. (A) Expression of the indicated inflammatory cytokines in the treated mice was analyzed by real time RT-PCR. * P<0.02 compared to the untreated control. (B) Myeloperoxidase (MPO) activities in colonic mucosa of the treated mice were measured as described in the Methods. Values were means ± SD (n = 3 in each group). Supplemental Figure 8 DSS-induced colonic damage and apoptosis in WT and p53-ko mice. WT and p53-ko mice treated with 5% DSS for 7 days. Colonic damage and apoptosis were analyzed. (A) Methylene blue staining of colonic tissues from the DSS-treated mice with arrows indicating ulcers. (B) Colonic ulcers were counted following methylene blue staining as in (A). (C) H&E staining of colonic tissues from the control and DSS-treated mice (200 ). (D) TUNEL staining of colonic tissues from the control and DSS-treated mice (200 ). (E) Analysis of caspase 3 activation after DSS treatment by Western blotting. (F) Measurement of caspase 3 activities in the intestinal mucosa extracts from the DSS-treated mice. Values in (B) and (F) were means ± SD (n = 6 mice in each group). Supplemental Figure 9 4
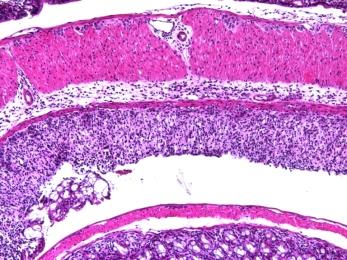
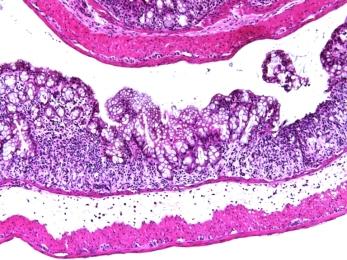
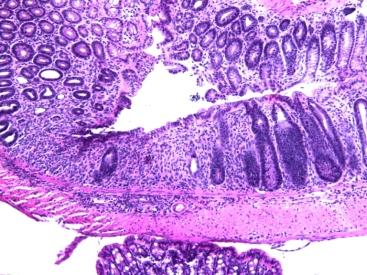
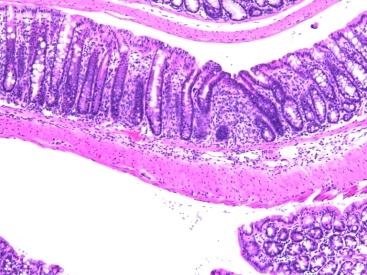
6 TNBS-induced colonic damage and apoptosis in WT and p53-ko mice. WT and p53-ko mice treated with 100 mg/kg of TNBS for 3 days. Colonic damage and apoptosis were analyzed. (A) H&E staining of colonic tissues from the control and TNBS-treated mice (200 ). (B) TUNEL staining of colonic tissues from the control and TNBS-treated mice (200 ). (C) Apoptotic index was determined by counting TUNEL signals in 100 randomly selected crypts following TUNEL staining as in (B). Values were means ± SD (n = 6 in each group). Supplemental Figure 10 Bid-independent colitis induced by DSS or TNBS. WT and Bid-KO mice were treated with 5% DSS for 7 days, or 100 mg/kg of TNBS for 5 days, to induce colitis. (A) H&E staining of colonic tissues from the DSS-treated mice (200 ). (B) Histological damage after DSS treatment was scored following H&E staining as in (A). (C) TUNEL (green) staining of colonic tissues from the DSS-treated mice (400 ). Arrows indicate example TUNEL-positive cells. (D) Apoptotic index was determined by counting TUNEL signals in 100 randomly selected crypts following TUNEL staining as in (C). (E) H&E staining of colonic tissues from the TNBStreated mice (200 ). (F) Histological damage after TNBS treatment was scored following H&E staining as in (E). (G) TUNEL (green) staining of colonic tissues from the TNBS-treated mice (400 ). Arrows indicate example TUNEL-positive cells. (H) Apoptotic index was determined by counting TUNEL signals in 100 randomly selected crypts following TUNEL staining as in (G). Values in (B), (D), (F) and (H) were means ± SD (n = 3 mice in each group). Supplemental Figure 11 5
7 Effects of the TNF antibody infliximib on DSS-induced colitis. WT mice were treated with 5% DSS, alone or in combination with 10 mg/kg of the TNF antibody infliximib for 7 days. (A) Real time RT-PCR analysis of PUMA mrna expression in colonic mucosa of the treated mice. (B) H&E staining of colonic tissues from the treated mice (200 ). (C) Colonic ulcers were counted following methylene blue staining. Values in (A) and (C) were means ± SD (n = 3 in each group). Supplemental Figure 12 Effects of the TNF antibody infliximib on TNBS-induced colitis. WT mice were treated with 100 mg/kg of TNBS, alone or in combination with 10 mg/kg of the TNF antibody infliximib for 3 days. (A) H&E staining of colonic tissues from the treated mice (200 ). (B) TUNEL (brown) staining of colonic tissues from the treated mice (200 ). (C) Apoptotic index was calculated by counting TUNEL signals in 100 randomly selected crypts following TUNEL staining as in (B). Values were means ± SD (n = 3 in each group). Supplemental Figure 13 Effects of the TNF inhibitor pentoxifylline on DSS-induced colitis. WT mice were treated with 5% DSS, alone or in combination with 200 mg/kg of the TNF inhibitor pentoxifylline (PTX). (A) Real time RT-PCR analysis of PUMA mrna expression in colonic mucosa of the mice treated for 24 hr. Values were means ± SD (n = 3 in each group). (B) Western blot analysis of PUMA expression in colonic mucosa of the mice treated for 24 hr. (C) Disease activity index in the mice treated with DSS with or without PTX was measured at indicated time points. * P<0.01 compared to DSS alone (two-way ANOVA). (D) Methylene blue staining of colonic tissues 6
8 from the mice treated for 7 days, with the arrow indicating an ulcer (200 ). (E) Colonic ulcers were counted following methylene blue staining as in (D). (F) H&E staining of colonic tissues from the mice treated for 7 days (200 ). (G) Histological damage in colonic tissues from the mice treated for 7 days was scored following H&E staining as in (F). (H) TUNEL staining (red) of colonic tissues from the mice treated for 7 days. (I) Apoptotic index was calculated by counting TUNEL signals in 100 randomly selected crypts. Values in (C), (E), (G) and (I) were means ± SD (n = 5 in each group). Supplemental Figure 14 Effects of the TNF inhibitor pentoxifylline on TNBS-induced colitis. WT mice were treated with 100 mg/kg of TNBS, alone or in combination with 200 mg/kg of the TNF- inhibitor pentoxifylline (PTX). (A) Western blot analysis of the indicted proteins in colonic mucosa from the mice treated for 24 hr. (B) H&E staining of colonic tissues from the mice treated for 3 days (200 ). (C) Histological damage in the mice treated with TNBS with or without PTX for 3 days was quantified following H&E staining as in (B). (D) TUNEL (brown) staining of colonic tissues from the mice treated for 3 days. Arrows indicate example TUNEL-positive cells. (E) Apoptotic index in the mice treated as indicated for 3 days was calculated by counting TUNEL signal in 100 randomly selected crypts. Values in (C) and (E) were means ± SD (n = 3 in each group). 7


9
10


11
12


13

14
15


16


17
18
19
20
21


22
PUMA-mediated intestinal epithelial apoptosis contributes to ulcerative colitis in humans and mice
 Research article PUMA-mediated intestinal epithelial apoptosis contributes to ulcerative colitis in humans and mice Wei Qiu, 1,2 Bin Wu, 1,3 Xinwei Wang, 1,2 Monica E. Buchanan, 1,3 Miguel D. Regueiro,
Supplementary Figure 1. ETBF activate Stat3 in B6 and Min mice colons
 Supplementary Figure 1 ETBF activate Stat3 in B6 and Min mice colons a pstat3 controls Pos Neg ETBF 1 2 3 4 b pstat1 pstat2 pstat3 pstat4 pstat5 pstat6 Actin Figure Legend: (a) ETBF induce predominantly
Supplementary fig. 1. Crystals induce necroptosis does not involve caspases, TNF receptor or NLRP3. A. Mouse tubular epithelial cells were pretreated
 Supplementary fig. 1. Crystals induce necroptosis does not involve caspases, TNF receptor or NLRP3. A. Mouse tubular epithelial cells were pretreated with zvad-fmk (10µM) and exposed to calcium oxalate
Intestinal epithelial vitamin D receptor signaling inhibits experimental colitis
 Research article Intestinal epithelial vitamin D receptor signaling inhibits experimental colitis Weicheng Liu, 1 Yunzi Chen, 1,2 Maya Aharoni Golan, 1 Maria L. Annunziata, 1 Jie Du, 2 Urszula Dougherty,
Supplementary Figure 1
 Supplementary Figure 1 A B mir-141, human cell lines mir-2c, human cell lines mir-141, hepatocytes mir-2c, hepatocytes Relative RNA.1.8.6.4.2 Relative RNA.3.2.1 Relative RNA 1.5 1..5 Relative RNA 2. 1.5
Supplementary Figure 1: Hsp60 / IEC mice are embryonically lethal (A) Light microscopic pictures show mouse embryos at developmental stage E12.
 Light microscopic pictures show mouse embryos at developmental stage E12.") Supplementary Figure 1: Hsp60 / IEC mice are embryonically lethal (A) Light microscopic pictures show mouse embryos at developmental stage E12.5 and E13.5 prepared from uteri of dams and subsequently genotyped.
Supplementary Figure 1: Hsp60 / IEC mice are embryonically lethal (A) Light microscopic pictures show mouse embryos at developmental stage E12.5 and E13.5 prepared from uteri of dams and subsequently genotyped.
A263 A352 A204. Pan CK. pstat STAT3 pstat3 STAT3 pstat3. Columns Columns 1-6 Positive control. Omentum. Rectosigmoid A195.
 pstat3 75 Pan CK A A263 A352 A24 B Columns 1-6 Positive control A195 A22 A24 A183 Rectal Nodule STAT3 pstat3 STAT3 pstat3 Columns 7-12 Omentum Rectosigmoid Left Ovary Right Ovary Omentum Uterus Uterus
Supplementary Figure 1 IL-27 IL
 Tim-3 Supplementary Figure 1 Tc0 49.5 0.6 Tc1 63.5 0.84 Un 49.8 0.16 35.5 0.16 10 4 61.2 5.53 10 3 64.5 5.66 10 2 10 1 10 0 31 2.22 10 0 10 1 10 2 10 3 10 4 IL-10 28.2 1.69 IL-27 Supplementary Figure 1.
Table S1. New colony formation 7 days after stimulation with doxo and VCR in JURKAT cells
 Table S1. New colony formation 7 days after stimulation with and in JURKAT cells drug co + number of colonies 7±14 4±7 48±11 JURKAT cells were stimulated and analyzed as in Table 1. Drug concentrations
Supplementary Table 1. List of primers used in this study
 Supplementary Table 1. List of primers used in this study Gene Forward primer Reverse primer Rat Met 5 -aggtcgcttcatgcaggt-3 5 -tccggagacacaggatgg-3 Rat Runx1 5 -cctccttgaaccactccact-3 5 -ctggatctgcctggcatc-3
SUPPLEMENTARY METHODS
 SUPPLEMENTARY METHODS Histological analysis. Colonic tissues were collected from 5 parts of the middle colon on day 7 after the start of DSS treatment, and then were cut into segments, fixed with 4% paraformaldehyde,
Programmed necrosis, not apoptosis, is a key mediator of cell loss and DAMP-mediated inflammation in dsrna-induced retinal degeneration
 Programmed necrosis, not apoptosis, is a key mediator of cell loss and DAMP-mediated inflammation in dsrna-induced retinal degeneration The Harvard community has made this article openly available. Please
Plasma exposure levels from individual mice 4 hours post IP administration at the
 Supplemental Figure Legends Figure S1. Plasma exposure levels of MKC-3946 in mice. Plasma exposure levels from individual mice 4 hours post IP administration at the indicated dose mg/kg. Data represent
Balancing intestinal and systemic inflammation through cell type-specific expression of
 Supplementary Information Balancing intestinal and systemic inflammation through cell type-specific expression of the aryl hydrocarbon receptor repressor Olga Brandstätter 1,2,6, Oliver Schanz 1,6, Julia
Supplementary Table 1 Clinicopathological characteristics of 35 patients with CRCs
 Supplementary Table Clinicopathological characteristics of 35 patients with CRCs Characteristics Type-A CRC Type-B CRC P value Sex Male / Female 9 / / 8.5 Age (years) Median (range) 6. (9 86) 6.5 (9 76).95
SOPten flox/flox (KO) Pten flox/flox (WT) flox allele 6.0 kb. Pten. Actin. ! allele 2.3 kb. Supplementary Figure S1. Yanagi, et al.
 Pten flox/flox (WT) flox allele 6.0 kb. Pten. Actin. ! allele 2.3 kb. Supplementary Figure S1. Yanagi, et al.") s1 A Pten flox/flox () SOPten flox/flox () flox allele 6. kb B Pten flox/flox () SOPten flox/flox () Pten Actin! allele 2.3 kb Supplementary Figure S1. Yanagi, et al. A B BrdU BrdU positive cells ( ) 3
s1 A Pten flox/flox () SOPten flox/flox () flox allele 6. kb B Pten flox/flox () SOPten flox/flox () Pten Actin! allele 2.3 kb Supplementary Figure S1. Yanagi, et al. A B BrdU BrdU positive cells ( ) 3
Supplementary Figure 1. Confocal immunofluorescence showing mitochondrial translocation of Drp1. Cardiomyocytes treated with H 2 O 2 were prestained
 Supplementary Figure 1. Confocal immunofluorescence showing mitochondrial translocation of Drp1. Cardiomyocytes treated with H 2 O 2 were prestained with MitoTracker (red), then were immunostained with
Supplementary Figure S I: Effects of D4F on body weight and serum lipids in apoe -/- mice.
 Supplementary Figures: Supplementary Figure S I: Effects of D4F on body weight and serum lipids in apoe -/- mice. Male apoe -/- mice were fed a high-fat diet for 8 weeks, and given PBS (model group) or
Page 39 of 44. 8h LTA & AT h PepG & AT h LTA
 Page 39 of 44 Fig. S1 A: B: C: D: 8h LTA 8h LTA & AT7519 E: F: 8h PepG G: 8h PepG & AT7519 Fig. S1. AT7519 overrides the survival effects of lipoteichoic acid (LTA) and peptidoglycan (PepG). (A) Human
GFP/Iba1/GFAP. Brain. Liver. Kidney. Lung. Hoechst/Iba1/TLR9!
 Supplementary information a +KA Relative expression d! Tlr9 5!! 5! NSC Neuron Astrocyte Microglia! 5! Tlr7!!!! NSC Neuron Astrocyte! GFP/Sβ/! Iba/Hoechst Microglia e Hoechst/Iba/TLR9! GFP/Iba/GFAP f Brain
T H E J O U R N A L O F C E L L B I O L O G Y
 T H E J O U R N A L O F C E L L B I O L O G Y Supplemental material Amelio et al., http://www.jcb.org/cgi/content/full/jcb.201203134/dc1 Figure S1. mir-24 regulates proliferation and by itself induces
SD-1 SD-1: Cathepsin B levels in TNF treated hch
 SD-1 SD-1: Cathepsin B levels in TNF treated hch. A. RNA and B. protein extracts from TNF treated and untreated human chondrocytes (hch) were analyzed via qpcr (left) and immunoblot analyses (right) for
SUPPLEMENTARY INFORMATION
 DOI: 10.1038/ncb3461 In the format provided by the authors and unedited. Supplementary Figure 1 (associated to Figure 1). Cpeb4 gene-targeted mice develop liver steatosis. a, Immunoblot displaying CPEB4
(A) PCR primers (arrows) designed to distinguish wild type (P1+P2), targeted (P1+P2) and excised (P1+P3)14-
 PCR primers (arrows) designed to distinguish wild type (P1+P2), targeted (P1+P2) and excised (P1+P3)14-") 1 Supplemental Figure Legends Figure S1. Mammary tumors of ErbB2 KI mice with 14-3-3σ ablation have elevated ErbB2 transcript levels and cell proliferation (A) PCR primers (arrows) designed to distinguish
1 Supplemental Figure Legends Figure S1. Mammary tumors of ErbB2 KI mice with 14-3-3σ ablation have elevated ErbB2 transcript levels and cell proliferation (A) PCR primers (arrows) designed to distinguish
Supplementary Figure 1
 Combination index (CI) Supplementary Figure 1 2. 1.5 1. Ishikawa AN3CA Nou-1 Hec-18.5...2.4.6.8 1. Fraction affected (Fa) Supplementary Figure 1. The synergistic effect of PARP inhibitor and PI3K inhibitor
Pair-fed % inkt cells 0.5. EtOH 0.0
 MATERIALS AND METHODS Histopathological analysis Liver tissue was collected 9 h post-gavage, and the tissue samples were fixed in 1% formalin and paraffin-embedded following a standard procedure. The embedded
Supplemental Figure 1. Western blot analysis indicated that MIF was detected in the fractions of
 Supplemental Figure Legends Supplemental Figure 1. Western blot analysis indicated that was detected in the fractions of plasma membrane and cytosol but not in nuclear fraction isolated from Pkd1 null
Supplemental Figure 1. (A) The localization of Cre DNA recombinase in the testis of Cyp19a1-Cre mice was detected by immunohistchemical analyses
 The localization of Cre DNA recombinase in the testis of Cyp19a1-Cre mice was detected by immunohistchemical analyses") Supplemental Figure 1. (A) The localization of Cre DNA recombinase in the testis of Cyp19a1-Cre mice was detected by immunohistchemical analyses using an anti-cre antibody; testes at 1 week (left panel),
Supplemental Figure 1. (A) The localization of Cre DNA recombinase in the testis of Cyp19a1-Cre mice was detected by immunohistchemical analyses using an anti-cre antibody; testes at 1 week (left panel),
Expression of acid base transporters in the kidney collecting duct in Slc2a7 -/-
 Supplemental Material Results. Expression of acid base transporters in the kidney collecting duct in Slc2a7 -/- and Slc2a7 -/- mice. The expression of AE1 in the kidney was examined in Slc26a7 KO mice.
Supplementary Information
 Supplementary Information TABLE S1. SUBJECT CHARACTERISTICS* Normal Control Subjects Subjects with Asthma p Value Number 23 48 Age (years) 35±10 35±10 0.75 Sex, M:F (% F) 9:12 (57) 17:26 (60) 0.76 FEV1
Nature Immunology: doi: /ni Supplementary Figure 1
 Supplementary Figure 1 NLRP12 is downregulated in biopsy samples from patients with active ulcerative colitis (UC). (a-g) NLRP12 expression in 7 UC mrna profiling studies deposited in NCBI GEO database.
Primary Cilia Can Both Mediate and Suppress Hedgehog Pathway- Dependent Tumorigenesis (Supplementary Figures and Materials)
") Primary Cilia Can Both Mediate and Suppress Hedgehog Pathway- Dependent Tumorigenesis (Supplementary Figures and Materials) Sunny Y. Wong, Allen D. Seol, Po-Lin So, Alexandre N. Ermilov, Christopher K.
Primary Cilia Can Both Mediate and Suppress Hedgehog Pathway- Dependent Tumorigenesis (Supplementary Figures and Materials) Sunny Y. Wong, Allen D. Seol, Po-Lin So, Alexandre N. Ermilov, Christopher K.
SUPPLEMENTARY FIGURES AND TABLE
 SUPPLEMENTARY FIGURES AND TABLE Supplementary Figure S1: Characterization of IRE1α mutants. A. U87-LUC cells were transduced with the lentiviral vector containing the GFP sequence (U87-LUC Tet-ON GFP).
c Ischemia (30 min) Reperfusion (8 w) Supplementary Figure bp 300 bp Ischemia (30 min) Reperfusion (4 h) Dox 20 mg/kg i.p.
 Reperfusion (8 w) Supplementary Figure bp 300 bp Ischemia (30 min) Reperfusion (4 h) Dox 20 mg/kg i.p.") a Marker Ripk3 +/ 5 bp 3 bp b Ischemia (3 min) Reperfusion (4 h) d 2 mg/kg i.p. 1 w 5 w Sacrifice for IF size A subset for echocardiography and morphological analysis c Ischemia (3 min) Reperfusion (8
a Marker Ripk3 +/ 5 bp 3 bp b Ischemia (3 min) Reperfusion (4 h) d 2 mg/kg i.p. 1 w 5 w Sacrifice for IF size A subset for echocardiography and morphological analysis c Ischemia (3 min) Reperfusion (8
Figure S1 Generation of γ-gt DTR transgenic mice. (A) Schematic construct of the transgene. (B)
 Schematic construct of the transgene. (B)") Figure S1 Generation of γ-gt DTR transgenic mice. (A) Schematic construct of the transgene. (B) PCR identified expected hhb-egf band (left panel) and HA tag band (right) in kidneys of transgenic (TG) mice
Figure S1 Generation of γ-gt DTR transgenic mice. (A) Schematic construct of the transgene. (B) PCR identified expected hhb-egf band (left panel) and HA tag band (right) in kidneys of transgenic (TG) mice
Supplementary Figure 1. Dynamic Response of WT and mir-21 -/- mice to caerulein. (a) Representative histological sections of mouse pancreas stained
 Representative histological sections of mouse pancreas stained") Supplementary Figure 1. Dynamic Response of WT and mir-21 -/- mice to caerulein. (a) Representative histological sections of mouse pancreas stained with hematoxylin from caerulein-treated WT and mir-21
Supplementary Figure 1. Dynamic Response of WT and mir-21 -/- mice to caerulein. (a) Representative histological sections of mouse pancreas stained with hematoxylin from caerulein-treated WT and mir-21
BUT ONLY MINIMALLY AFFECTS OTHER INDICATORS OF COLONIC INTEGRITY IN A RAT MODEL OF
 EMU OIL INCREASES CRYPT DEPTH BUT ONLY MINIMALLY AFFECTS OTHER INDICATORS OF COLONIC INTEGRITY IN A RAT MODEL OF COLITIS SUZANNE MASHTOUB Discipline of Physiology, School of Molecular & Biomedical Science,
SUPPLEMENTARY INFORMATION
 doi:10.1038/nature12652 Supplementary Figure 1. PRDM16 interacts with endogenous EHMT1 in brown adipocytes. Immunoprecipitation of PRDM16 complex by flag antibody (M2) followed by Western blot analysis
Formylpeptide receptor2 contributes to colon epithelial homeostasis, inflammation, and tumorigenesis
 Supplementary Data Formylpeptide receptor2 contributes to colon epithelial homeostasis, inflammation, and tumorigenesis Keqiang Chen, Mingyong Liu, Ying Liu, Teizo Yoshimura, Wei Shen, Yingying Le, Scott
C H A R A C T E R I Z A T I O N O F T H E N O V E L D O M A I N W I T H N O N A M E G E N E I N C O L O N C A N C E R
 C H A R A C T E R I Z A T I O N O F T H E N O V E L D O M A I N W I T H N O N A M E G E N E I N C O L O N C A N C E R Charleen Rupnarain A dissertation submitted to the Faculty of Science, University of
Sestrin2 and BNIP3 (Bcl-2/adenovirus E1B 19kDa-interacting. protein3) regulate autophagy and mitophagy in renal tubular cells in. acute kidney injury
 regulate autophagy and mitophagy in renal tubular cells in. acute kidney injury") Sestrin2 and BNIP3 (Bcl-2/adenovirus E1B 19kDa-interacting protein3) regulate autophagy and mitophagy in renal tubular cells in acute kidney injury by Masayuki Ishihara 1, Madoka Urushido 2, Kazu Hamada
Sestrin2 and BNIP3 (Bcl-2/adenovirus E1B 19kDa-interacting protein3) regulate autophagy and mitophagy in renal tubular cells in acute kidney injury by Masayuki Ishihara 1, Madoka Urushido 2, Kazu Hamada
Supplementary Figure 1. SA-β-Gal positive senescent cells in various cancer tissues. Representative frozen sections of breast, thyroid, colon and
 Supplementary Figure 1. SA-β-Gal positive senescent cells in various cancer tissues. Representative frozen sections of breast, thyroid, colon and stomach cancer were stained with SA-β-Gal and nuclear fast
Supplementary Figure S1. Flow cytometric analysis of the expression of Thy1 in NH cells. Flow cytometric analysis of the expression of T1/ST2 and
 Supplementary Figure S1. Flow cytometric analysis of the expression of Thy1 in NH cells. Flow cytometric analysis of the expression of T1/ST2 and Thy1 in NH cells derived from the lungs of naïve mice.
Connective Tissue Response in IBD
 Connective Tissue Response in IBD Dr I C Lawrance MB BS, PhD FRACP School of Medicine and Pharmacology, University of Western Australia, Fremantle Hospital Intestinal response to Chronic Inflammation Control
IL-12 family members in experimental colitis. Markus F. Neurath I. Medical Clinic Johannes Gutenberg-University Mainz, Germany
 IL-12 family members in experimental colitis Markus F. Neurath I. Medical Clinic Johannes Gutenberg-University Mainz, Germany IBD - Pathogenesis Genetic Predisposition Bacterial Antigens Activation of
Figure S1. Analysis of genomic and cdna sequences of the targeted regions in WT-KI and
 Figure S1. Analysis of genomic and sequences of the targeted regions in and indicated mutant KI cells, with WT and corresponding mutant sequences underlined. (A) cells; (B) K21E-KI cells; (C) D33A-KI cells;
Research progress on the use of estrogen receptor agonist for treatment of spinal cord injury
 Research progress on the use of estrogen receptor agonist for treatment of spinal cord injury Swapan K. Ray, PhD Professor, Department of Pathology, Microbiology, and Immunology USC School of Medicine,
High Fat Diets Induce Colonic Epithelial Cell Stress and Inflammation that is Reversed by IL-22
 Supplementary Information High Fat Diets Induce Colonic Epithelial Cell Stress and Inflammation that is Reversed by IL-22 Max Gulhane 1, Lydia Murray 1, Rohan Lourie 1, Hui Tong 1, Yong H. Sheng 1, Ran
Supplementary Information
 Supplementary Information An orally available, small-molecule interferon inhibits viral replication Hideyuki Konishi 1, Koichi Okamoto 1, Yusuke Ohmori 1, Hitoshi Yoshino 2, Hiroshi Ohmori 1, Motooki Ashihara
SUPPLEMENTARY INFORMATION
 DOI: 10.1038/ncb2607 Figure S1 Elf5 loss promotes EMT in mammary epithelium while Elf5 overexpression inhibits TGFβ induced EMT. (a, c) Different confocal slices through the Z stack image. (b, d) 3D rendering
TGF-β Signaling Regulates Neuronal C1q Expression and Developmental Synaptic Refinement
 Supplementary Information Title: TGF-β Signaling Regulates Neuronal C1q Expression and Developmental Synaptic Refinement Authors: Allison R. Bialas and Beth Stevens Supplemental Figure 1. In vitro characterization
Quantitative Real-Time PCR was performed as same as Materials and Methods.
 Supplemental Material Quantitative Real-Time PCR Quantitative Real-Time PCR was performed as same as Materials and Methods. Expression levels in the aorta were normalized to peptidylprolyl isomerase B
Supplementary Figure 1. EC-specific Deletion of Snail1 Does Not Affect EC Apoptosis. (a,b) Cryo-sections of WT (a) and Snail1 LOF (b) embryos at
 Cryo-sections of WT (a) and Snail1 LOF (b) embryos at") Supplementary Figure 1. EC-specific Deletion of Snail1 Does Not Affect EC Apoptosis. (a,b) Cryo-sections of WT (a) and Snail1 LOF (b) embryos at E10.5 were double-stained for TUNEL (red) and PECAM-1 (green).
Supplementary Figure 1. EC-specific Deletion of Snail1 Does Not Affect EC Apoptosis. (a,b) Cryo-sections of WT (a) and Snail1 LOF (b) embryos at E10.5 were double-stained for TUNEL (red) and PECAM-1 (green).
Figure S1. Reduction in glomerular mir-146a levels correlate with progression to higher albuminuria in diabetic patients.
 Supplementary Materials Supplementary Figures Figure S1. Reduction in glomerular mir-146a levels correlate with progression to higher albuminuria in diabetic patients. Figure S2. Expression level of podocyte
fl/+ KRas;Atg5 fl/+ KRas;Atg5 fl/fl KRas;Atg5 fl/fl KRas;Atg5 Supplementary Figure 1. Gene set enrichment analyses. (a) (b)
 (b)") KRas;At KRas;At KRas;At KRas;At a b Supplementary Figure 1. Gene set enrichment analyses. (a) GO gene sets (MSigDB v3. c5) enriched in KRas;Atg5 fl/+ as compared to KRas;Atg5 fl/fl tumors using gene set
KRas;At KRas;At KRas;At KRas;At a b Supplementary Figure 1. Gene set enrichment analyses. (a) GO gene sets (MSigDB v3. c5) enriched in KRas;Atg5 fl/+ as compared to KRas;Atg5 fl/fl tumors using gene set
Table S1. Primer sequences used for qrt-pcr. CACCATTGGCAATGAGCGGTTC AGGTCTTTGCGGATGTCCACGT ACTB AAGTCCATGTGCTGGCAGCACT ATCACCACTCCGAAGTCCGTCT LCOR
 Table S1. Primer sequences used for qrt-pcr. ACTB LCOR KLF6 CTBP1 CDKN1A CDH1 ATF3 PLAU MMP9 TFPI2 CACCATTGGCAATGAGCGGTTC AGGTCTTTGCGGATGTCCACGT AAGTCCATGTGCTGGCAGCACT ATCACCACTCCGAAGTCCGTCT CGGCTGCAGGAAAGTTTACA
Procaspase-3. Cleaved caspase-3. actin. Cytochrome C (10 M) Z-VAD-fmk. Procaspase-3. Cleaved caspase-3. actin. Z-VAD-fmk
 Z-VAD-fmk. Procaspase-3. Cleaved caspase-3. actin. Z-VAD-fmk") A HeLa actin - + + - - + Cytochrome C (1 M) Z-VAD-fmk PMN - + + - - + actin Cytochrome C (1 M) Z-VAD-fmk Figure S1. (A) Pan-caspase inhibitor z-vad-fmk inhibits cytochrome c- mediated procaspase-3 cleavage.
A HeLa actin - + + - - + Cytochrome C (1 M) Z-VAD-fmk PMN - + + - - + actin Cytochrome C (1 M) Z-VAD-fmk Figure S1. (A) Pan-caspase inhibitor z-vad-fmk inhibits cytochrome c- mediated procaspase-3 cleavage.
Genotype analysis by Southern blots of nine independent recombinated ES cell clones by
 Supplemental Figure 1 Selected ES cell clones show a correctly recombined conditional Ngn3 allele Genotype analysis by Southern blots of nine independent recombinated ES cell clones by hybridization with
Supplementary Figures
 Supplementary Figures Supplementary Figure 1 Characterization of stable expression of GlucB and sshbira in the CT26 cell line (a) Live cell imaging of stable CT26 cells expressing green fluorescent protein
SUPPLEMENTARY INFORMATION
 b 350 300 250 200 150 100 50 0 E0 E10 E50 E0 E10 E50 E0 E10 E50 E0 E10 E50 Number of organoids per well 350 300 250 200 150 100 50 0 R0 R50 R100 R500 1st 2nd 3rd Noggin 100 ng/ml Noggin 10 ng/ml Noggin
Research in IBD at University of Colorado Denver
 Research in IBD at University of Colorado Denver Blair Fennimore, MD Assistant Professor of Medicine Division of Gastroenterology and Hepatology UCH Crohn s and Colitis Center Mucosal Inflammation Program
A role for proteinase-activated receptor 1 in inflammatory bowel diseases
 Research article A role for proteinase-activated receptor 1 in inflammatory bowel diseases Nathalie Vergnolle, 1 Laurie Cellars, 1 Andrea Mencarelli, 2 Giovanni Rizzo, 2 Sunita Swaminathan, 3 Paul Beck,
The transcription factor IFN regulatory factor 4 controls experimental colitis in mice via T cell derived IL-6
 Research article The transcription factor IFN regulatory factor 4 controls experimental colitis in mice via T cell derived IL-6 Jonas Mudter, 1 Lioubov Amoussina, 1,2 Mirjam Schenk, 3 Jingling Yu, 1,2
Supplementary methods:
 Supplementary methods: Primers sequences used in real-time PCR analyses: β-actin F: GACCTCTATGCCAACACAGT β-actin [11] R: AGTACTTGCGCTCAGGAGGA MMP13 F: TTCTGGTCTTCTGGCACACGCTTT MMP13 R: CCAAGCTCATGGGCAGCAACAATA
Nature Immunology: doi: /ni Supplementary Figure 1. Production of cytokines and chemokines after vaginal HSV-2 infection.
 Supplementary Figure 1 Production of cytokines and chemokines after vaginal HSV-2 infection. C57BL/6 mice were (a) treated intravaginally with 20 µl of PBS or infected with 6.7x10 4 pfu of HSV-2 in the
Supplementary Information and Figure legends
 Supplementary Information and Figure legends Table S1. Primers for quantitative RT-PCR Target Sequence (5 -> 3 ) Target Sequence (5 -> 3 ) DAB2IP F:TGGACGATGTGCTCTATGCC R:GGATGGTGATGGTTTGGTAG Snail F:CCTCCCTGTCAGATGAGGAC
(A) RT-PCR for components of the Shh/Gli pathway in normal fetus cell (MRC-5) and a
 RT-PCR for components of the Shh/Gli pathway in normal fetus cell (MRC-5) and a") Supplementary figure legends Supplementary Figure 1. Expression of Shh signaling components in a panel of gastric cancer. (A) RT-PCR for components of the Shh/Gli pathway in normal fetus cell (MRC-5) and
Supplementary figure legends Supplementary Figure 1. Expression of Shh signaling components in a panel of gastric cancer. (A) RT-PCR for components of the Shh/Gli pathway in normal fetus cell (MRC-5) and
Figure S1A. Blood glucose levels in mice after glucose injection
 ## Figure S1A. Blood glucose levels in mice after glucose injection Blood glucose (mm/l) 25 2 15 1 5 # 15 3 6 3+3 Time after glucose injection (min) # Figure S1B. α-kg levels in mouse livers after glucose
PepT1 Expression Helps Maintain Intestinal Homeostasis by Mediating the Differential. Expression of mirnas along the Crypt-Villus Axis
 PepT Expression Helps Maintain Intestinal Homeostasis by Mediating the Differential Expression of mirnas along the Crypt-Villus Axis Yuchen Zhang,*, Emilie Viennois, Mingzhen Zhang, Bo Xiao, 3, Moon Kwon
Supplementary Figure 1. Characterization of basophils after reconstitution of SCID mice
 Supplementary figure legends Supplementary Figure 1. Characterization of after reconstitution of SCID mice with CD4 + CD62L + T cells. (A-C) SCID mice (n = 6 / group) were reconstituted with 2 x 1 6 CD4
SUPPLEMENTARY INFORMATION
 Supplementary Figure 1. Behavioural effects of ketamine in non-stressed and stressed mice. Naive C57BL/6 adult male mice (n=10/group) were given a single dose of saline vehicle or ketamine (3.0 mg/kg,
supplementary information
 DOI: 10.1038/ncb1875 Figure S1 (a) The 79 surgical specimens from NSCLC patients were analysed by immunohistochemistry with an anti-p53 antibody and control serum (data not shown). The normal bronchi served
Astragaloside IV ameliorates 2,4,6-trinitrobenzene sulfonic acid (TNBS)-induced
-induced") Astragaloside IV ameliorates 2,4,6-trinitrobenzene sulfonic acid (TNBS)-induced colitis implicating regulation of energy metabolism Xu-Guang Jiang 1,2,, Kai Sun 1,3,4,5,, Yu-Ying Liu 1,4,5, Li Yan 1,4,5,
Astragaloside IV ameliorates 2,4,6-trinitrobenzene sulfonic acid (TNBS)-induced colitis implicating regulation of energy metabolism Xu-Guang Jiang 1,2,, Kai Sun 1,3,4,5,, Yu-Ying Liu 1,4,5, Li Yan 1,4,5,
Supplementary Figure 1. Prevalence of U539C and G540A nucleotide and E172K amino acid substitutions among H9N2 viruses. Full-length H9N2 NS
 Supplementary Figure 1. Prevalence of U539C and G540A nucleotide and E172K amino acid substitutions among H9N2 viruses. Full-length H9N2 NS nucleotide sequences (a, b) or amino acid sequences (c) from
without LOI phenotype by breeding female wild-type C57BL/6J and male H19 +/.
 Sakatani et al. 1 Supporting Online Material Materials and methods Mice and genotyping: H19 mutant mice with C57BL/6J background carrying a deletion in the structural H19 gene (3 kb) and 10 kb of 5 flanking
Virchow s Hypothesis lymphorecticular infiltration of cancer reflected the origin of cancer at sites of inflammation
 Virchow s Hypothesis 1863 lymphorecticular infiltration of cancer reflected the origin of cancer at sites of inflammation Barrett s esophagus/ Esophageal adenocarcinoma PSC / Cholangiocarcinoma Viral hepatitis
SUPPLEMENTARY INFORMATION
 Figure S1 Induction of non-apoptotic death of SV40-transformed and primary DKO MEFs, and DKO thymocytes. (A-F) STS-induced non-apoptotic death of DKO MEF. (A, B) Reduced viability of DKO MEFs after exposure
a. b. c. d. e. f. g. h. i. j. k. l. m. n. o. p.
 a. b. c. d. e. f. g. h. i. j. k. l. 2.5 2 1.5 1.5 IL-1β 12 8 6 4 2 IL-1β 9 8 7 6 4 3 3 2.9 IL-1β m. n. o. p. 1.8 1.6 1.4 1.2 1.8.6.4.2 6h LPS 2 15 1 5 6h LPS 2 6h LPS 6 4 3 6h LPS Supplementary Figure
Suppl Video: Tumor cells (green) and monocytes (white) are seeded on a confluent endothelial
 and monocytes (white) are seeded on a confluent endothelial") Supplementary Information Häuselmann et al. Monocyte induction of E-selectin-mediated endothelial activation releases VE-cadherin junctions to promote tumor cell extravasation in the metastasis cascade
Supplementary Information Häuselmann et al. Monocyte induction of E-selectin-mediated endothelial activation releases VE-cadherin junctions to promote tumor cell extravasation in the metastasis cascade
Supplementary Figure 1: si-craf but not si-braf sensitizes tumor cells to radiation.
 Supplementary Figure 1: si-craf but not si-braf sensitizes tumor cells to radiation. (a) Embryonic fibroblasts isolated from wildtype (WT), BRAF -/-, or CRAF -/- mice were irradiated (6 Gy) and DNA damage
Reason for Dissection. Pleomorphic adenoma. Tongue base adenocarcinoma
 Supplementary Table S1 Human Patients Patient Sample No. Gender Age Additional Medication Treatment 1 Reason for Dissection Total Irradiation Dose Estimated Irradiation Dose to SG Gland Time of Resection
Supplementary Information
 Supplementary Information mediates STAT3 activation at retromer-positive structures to promote colitis and colitis-associated carcinogenesis Zhang et al. a b d e g h Rel. Luc. Act. Rel. mrna Rel. mrna
SHREE ET AL, SUPPLEMENTAL MATERIALS. (A) Workflow for tumor cell line derivation and orthotopic implantation.
 Workflow for tumor cell line derivation and orthotopic implantation.") SHREE ET AL, SUPPLEMENTAL MATERIALS SUPPLEMENTAL FIGURE AND TABLE LEGENDS Supplemental Figure 1. Derivation and characterization of TS1-TGL and TS2-TGL PyMT cell lines and development of an orthotopic
SHREE ET AL, SUPPLEMENTAL MATERIALS SUPPLEMENTAL FIGURE AND TABLE LEGENDS Supplemental Figure 1. Derivation and characterization of TS1-TGL and TS2-TGL PyMT cell lines and development of an orthotopic
marker. DAPI labels nuclei. Flies were 20 days old. Scale bar is 5 µm. Ctrl is
 Supplementary Figure 1. (a) Nos is detected in glial cells in both control and GFAP R79H transgenic flies (arrows), but not in deletion mutant Nos Δ15 animals. Repo is a glial cell marker. DAPI labels
Supplemental Information. Otic Mesenchyme Cells Regulate. Spiral Ganglion Axon Fasciculation. through a Pou3f4/EphA4 Signaling Pathway
 Neuron, Volume 73 Supplemental Information Otic Mesenchyme Cells Regulate Spiral Ganglion Axon Fasciculation through a Pou3f4/EphA4 Signaling Pathway Thomas M. Coate, Steven Raft, Xiumei Zhao, Aimee K.
SUPPLEMENTARY INFORMATION
 doi: 1.138/nature7221 Brown fat selective genes 12 1 Control Q-RT-PCR (% of Control) 8 6 4 2 Ntrk3 Cox7a1 Cox8b Cox5b ATPase b2 ATPase f1a1 Sirt3 ERRα Elovl3/Cig3 PPARα Zic1 Supplementary Figure S1. stimulates
Supplementary Figure 1. Normal T lymphocyte populations in Dapk -/- mice. (a) Normal thymic development in Dapk -/- mice. Thymocytes from WT and Dapk
 Normal thymic development in Dapk -/- mice. Thymocytes from WT and Dapk") Supplementary Figure 1. Normal T lymphocyte populations in Dapk -/- mice. (a) Normal thymic development in Dapk -/- mice. Thymocytes from WT and Dapk -/- mice were stained for expression of CD4 and CD8.
Supplementary Figure 1. Normal T lymphocyte populations in Dapk -/- mice. (a) Normal thymic development in Dapk -/- mice. Thymocytes from WT and Dapk -/- mice were stained for expression of CD4 and CD8.
Supplementary Figure 1 IMQ-Induced Mouse Model of Psoriasis. IMQ cream was
 Supplementary Figure 1 IMQ-Induced Mouse Model of Psoriasis. IMQ cream was painted on the shaved back skin of CBL/J and BALB/c mice for consecutive days. (a, b) Phenotypic presentation of mouse back skin
Supplementary Figure 1. DNA methylation of the adiponectin promoter R1, Pparg2, and Tnfa promoter in adipocytes is not affected by obesity.
 Supplementary Figure 1. DNA methylation of the adiponectin promoter R1, Pparg2, and Tnfa promoter in adipocytes is not affected by obesity. (a) Relative amounts of adiponectin, Ppar 2, C/ebp, and Tnf mrna
Supplementary Information File
 Supplementary Information File Supplementary Table 1. List of synthesized sirna sequences for target genes sirna Species Sequence Ctrl sirna mouse sense 5 -UUCUCCGAACGUGUCACGUTT-3 Antisense 5 -ACGUGACACGUUCGGAGAATT-3
microrna-200b and microrna-200c promote colorectal cancer cell proliferation via
 Supplementary Materials microrna-200b and microrna-200c promote colorectal cancer cell proliferation via targeting the reversion-inducing cysteine-rich protein with Kazal motifs Supplementary Table 1.
for six pairs of mice. (b) Representative FACS analysis of absolute number of T cells (CD4 + and
 Representative FACS analysis of absolute number of T cells (CD4 + and") SUPPLEMENTARY DATA Supplementary Figure 1: Peripheral lymphoid organs of SMAR1 -/- mice have an effector memory phenotype. (a) Lymphocytes collected from MLNs and Peyer s patches (PPs) of WT and SMAR1
SUPPLEMENTARY DATA Supplementary Figure 1: Peripheral lymphoid organs of SMAR1 -/- mice have an effector memory phenotype. (a) Lymphocytes collected from MLNs and Peyer s patches (PPs) of WT and SMAR1
Zhu et al, page 1. Supplementary Figures
 Zhu et al, page 1 Supplementary Figures Supplementary Figure 1: Visual behavior and avoidance behavioral response in EPM trials. (a) Measures of visual behavior that performed the light avoidance behavior
Supplementary Table 1. The primers used for quantitative RT-PCR. Gene name Forward (5 > 3 ) Reverse (5 > 3 )
 Reverse (5 > 3 )") 770 771 Supplementary Table 1. The primers used for quantitative RT-PCR. Gene name Forward (5 > 3 ) Reverse (5 > 3 ) Human CXCL1 GCGCCCAAACCGAAGTCATA ATGGGGGATGCAGGATTGAG PF4 CCCCACTGCCCAACTGATAG TTCTTGTACAGCGGGGCTTG
770 771 Supplementary Table 1. The primers used for quantitative RT-PCR. Gene name Forward (5 > 3 ) Reverse (5 > 3 ) Human CXCL1 GCGCCCAAACCGAAGTCATA ATGGGGGATGCAGGATTGAG PF4 CCCCACTGCCCAACTGATAG TTCTTGTACAGCGGGGCTTG
Nature Medicine: doi: /nm.4324
 1 2 3 4 5 6 7 8 9 10 11 12 13 14 15 16 17 18 19 20 21 22 23 24 25 Supplementary Figure 1. Kinetics of SnCs development in surgically-induced OA and effect of GCV-induced SnC clearance on OA disease progression
Tumor development in murine ulcerative colitis depends on MyD88 signaling of colonic F4/80 + CD11b high Gr1 low macrophages
 Research article Tumor development in murine ulcerative colitis depends on MyD88 signaling of colonic F4/80 + CD11b high Gr1 low macrophages Gabriela Schiechl, 1 Bernhard Bauer, 1 Ivan Fuss, 2 Sven A.
SUPPLEMENTAL INFORMATIONS
 1 SUPPLEMENTAL INFORMATIONS Figure S1 Cumulative ZIKV production by testis explants over a 9 day-culture period. Viral titer values presented in Figure 1B (viral release over a 3 day-culture period measured
Chemotherapy-induced intestinal mucositis: The role of apoptosis regulators. Joanne M. Bowen BHSc(Hons)
") Chemotherapy-induced intestinal mucositis: The role of apoptosis regulators. Joanne M. Bowen BHSc(Hons) Thesis submitted for degree of Doctor of Philosophy Department of Medicine The University of Adelaide
Chemotherapy-induced intestinal mucositis: The role of apoptosis regulators. Joanne M. Bowen BHSc(Hons) Thesis submitted for degree of Doctor of Philosophy Department of Medicine The University of Adelaide
Serum mirna signature diagnoses and discriminates murine colitis subtypes and predicts ulcerative colitis in humans
 Serum mirna signature diagnoses and discriminates murine colitis subtypes and predicts ulcerative colitis in humans Emilie Viennois 1*, Yuan Zhao 1, 2, Moon Kwon Han 1, Bo Xiao 1, 3, Mingzhen Zhang 1,