Supplemental Information. Induction of Expansion and Folding. in Human Cerebral Organoids
|
|
|
- Marcus Beverly Hicks
- 6 years ago
- Views:
Transcription
1 Cell Stem Cell, Volume 20 Supplemental Information Induction of Expansion and Folding in Human Cerebral Organoids Yun Li, Julien Muffat, Attya Omer, Irene Bosch, Madeline A. Lancaster, Mriganka Sur, Lee Gehrke, Juergen A. Knoblich, and Rudolf Jaenisch
2 Supplemental Information Inventory of Supplemental Information Figure S1. CRISPR/Cas9-mediated deletion of PTEN in hescs, and PTEN expression analysis. Related to Figure 1. Figure S2. Generation of human cerebral organoid culture. Related to Figure 1. Figure S3. Morphological analysis of expansion and folding in PTEN mutant human cerebral organoids. Related to Figure 1. Figure S4. PTEN mutant human and mouse cerebral organoids. Related to Figure 1, 2 and 3. Figure S5. Enhancing proliferation in PTEN mutant human cerebral organoids expands the NP pool. Related to Figure 4. Figure S6. Transiently delayed neuronal differentiation in PTEN mutant human cerebral organoids. Related to Figure 5. Figure S7. PTEN-AKT signaling in human cerebral organoids. Related to Figure 6. Table S1. Antibody information. Related to Figure 1-7. Table S2. Primer information. Related to Figure
3
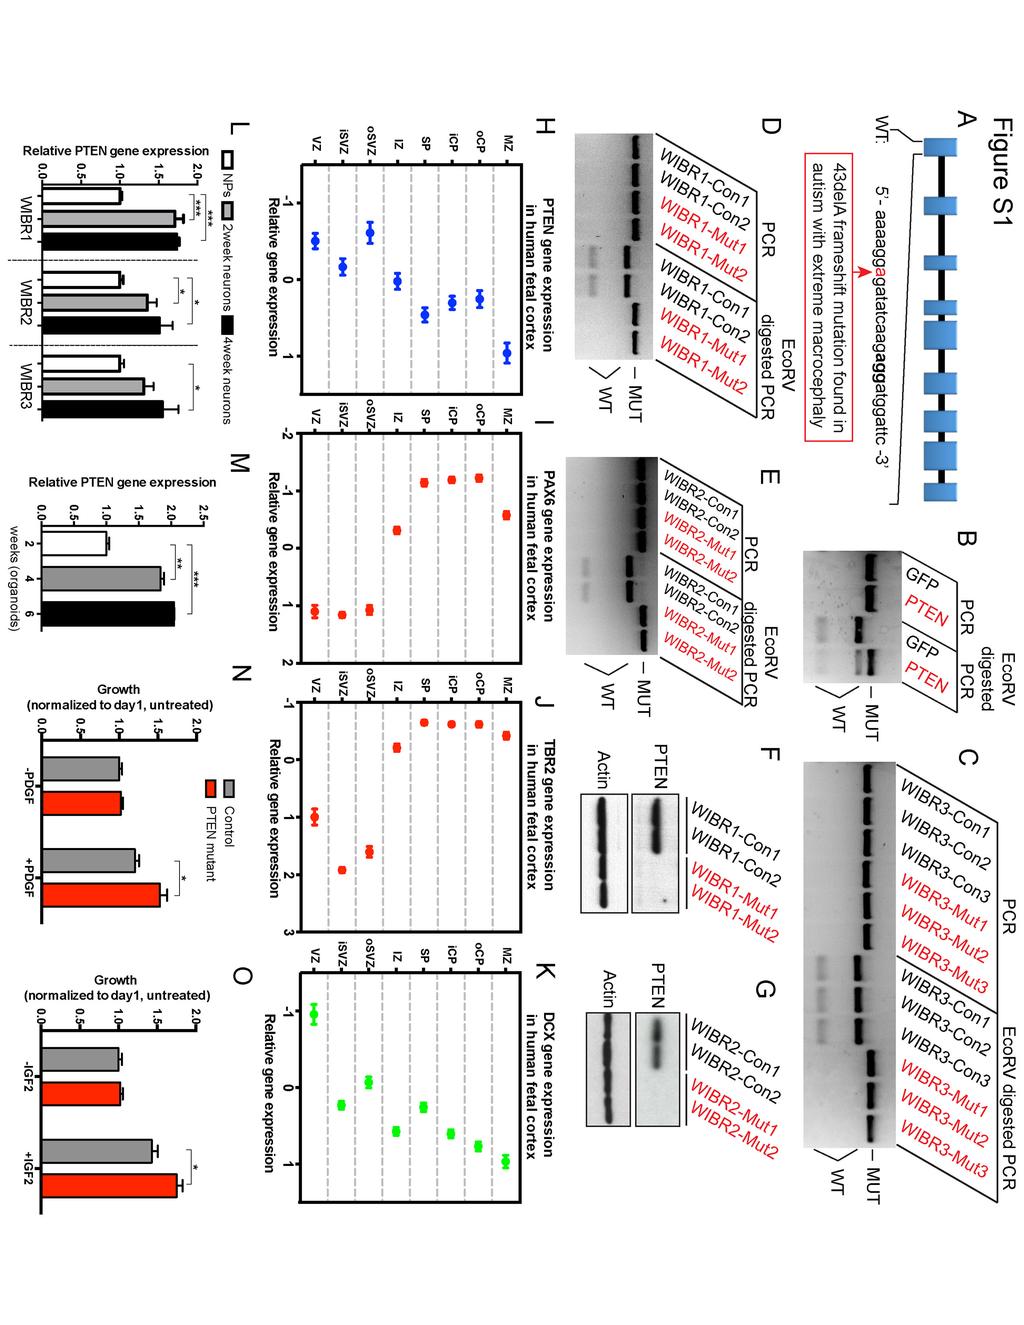
4 Figure S1. CRISPR/Cas9-mediated deletion of PTEN in hescs, and PTEN expression analysis. Related to Figure 1. A) Schematic overview of the human PTEN locus showing the heterozygous 43delA loss-of-function mutation identified in autism patient with macrocephaly(marchese et al., 2014). B) Gel images showing EcoRV digest results from HEK293 cells transfected with PTEN CRISPR/Cas9 and mock control with GFP plasmid. Indels generated in the target regions may lead to disruption of the EcoRV site. C-E) Gel images showing disruption of the EcoRV site in PTEN mutant clones generated from WIBR3 (C), WIBR1 (D) and WIBR2 (E) hescs. F-G) Immuno-blotting showing a complete ablation of wild-type PTEN protein in PTEN mutant clones from WIBR1 (F) and WIBR2 (G) hescs. H-K) Analysis of BrainSpan gene expression data of PTEN (H), PAX6 (I), TBR2 (J) and DCX (K) shows PTEN expression is low in the VZ/SVZ of the human cortex at 15 or 16 post conception weeks, and high in the cortical plate (CP), a spatial pattern similar to DCX and inversely correlated with PAX6 and TBR2. IZ, intermediate zone; SP, subplate zone, MZ, marginal zone. L-M) Quantitative RT-PCR analyses of PTEN in NPs, 2-week and 4-week neurons generated from WIBR1, WIBR2 and WIBR3 hescs (L), and in WIBR3 cerebral organoids at 2, 4 and 6 weeks of age (M). N-O) ATP assay on 2D adherent NP culture, showing enhanced proliferation in WIBR3 PTEN mutants in the presence of low PDGF (N) and IGF2 (O) concentration. Results are mean +/- SEM. *p<0.05, ***p<
5
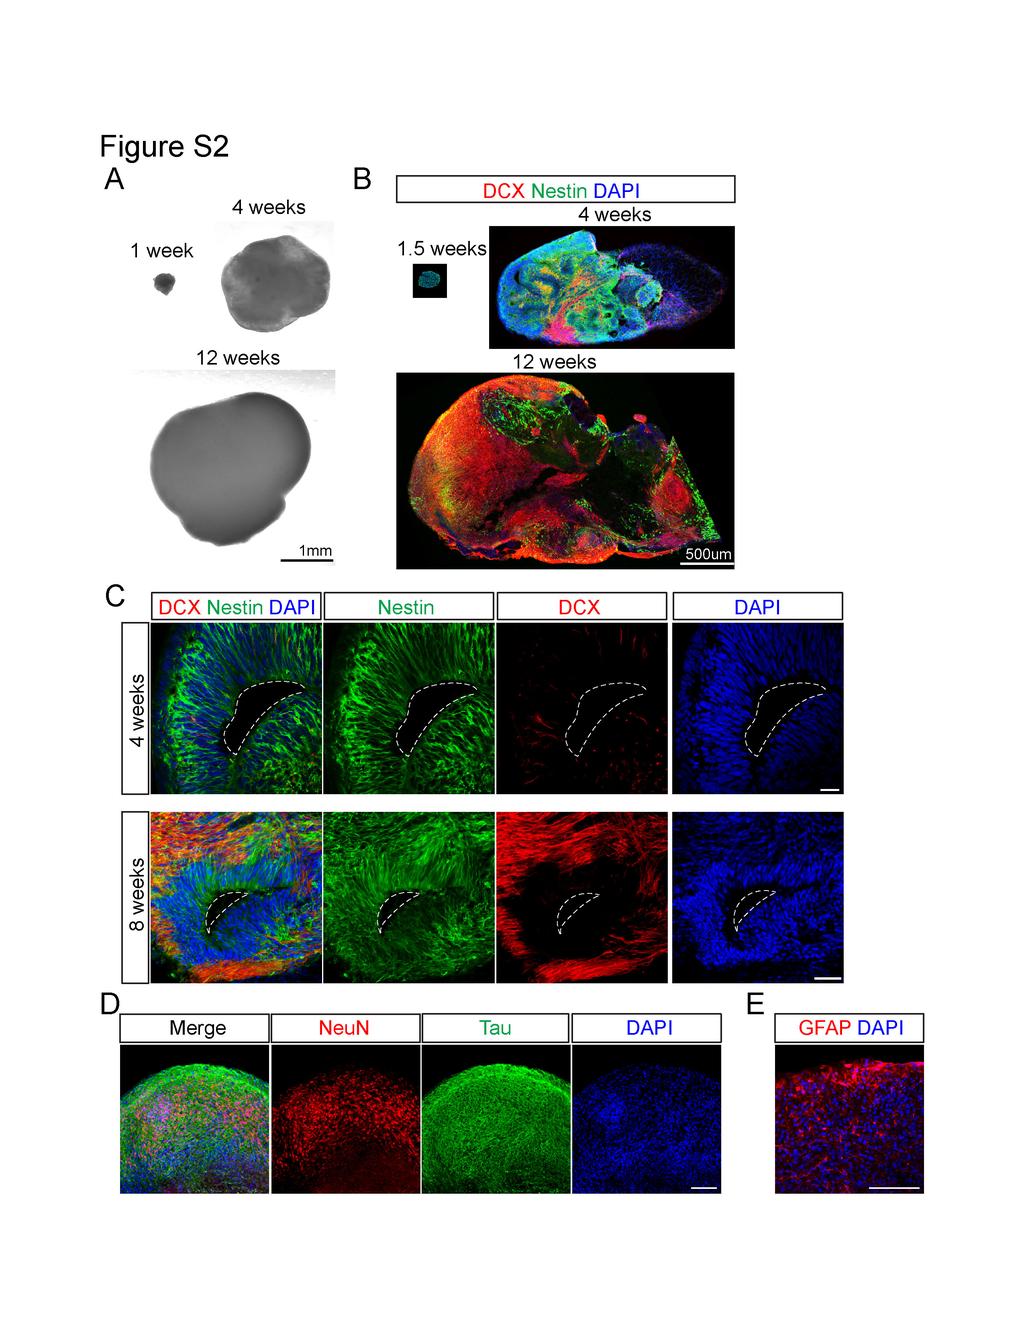
6 Figure S2. Generation of human cerebral organoid culture. Related to Figure 1. A) Representative images of human cerebral organoids from wild-type WIBR3 hescs at 1, 4 and 12 weeks. Scale bar, 1mm. B-C) Immuno-staining with antibodies against DCX (immature neurons, red) and Nestin (NPs, green), on human cerebral organoids from wild-type WIBR3 hescs at 1.5, 4 and 12 weeks. Low magnification images (B) demonstrate the global transition from NPs to neurons. High magnification images (C) show representative ventricle-like structures at 4 and 8 weeks, highlighting the appearance of DCX-positive immature neurons at the latter stage, and the basal location of these cells. Scale bars, 500um (B) and 50um (C). D-E) Immuno-staining in 16-weeks-old cerebral organoids generated from wild-type WIBR3 hescs showing abundant expression of markers for mature neurons such as NeuN and Tau (D) and astrocytes (GFAP, E). Scale bars, 100um. 3
7
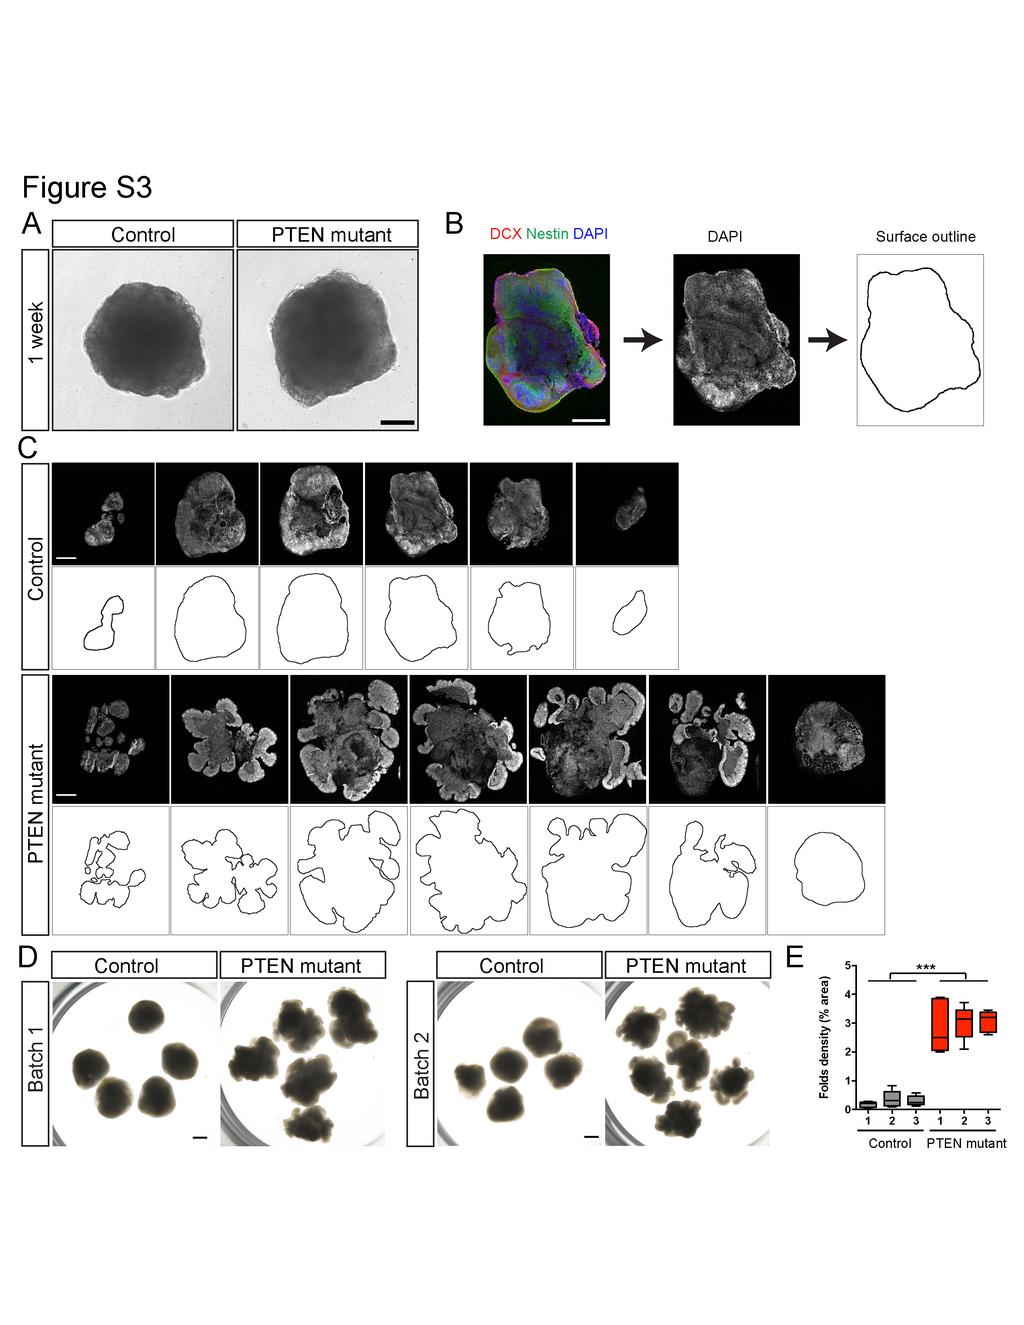
8 Figure S3. Morphological analysis of expansion and folding in PTEN mutant human cerebral organoids. Related to Figure 1. A) Representative images of EBs generated from control and PTEN mutant WIBR3 hescs at 1 week, showing their similar size and shape at this stage. Scale bar, 200um. B-C) Images of serial histological sections from 6-week-old control and PTEN mutant WIBR3 cerebral organoids were converted into outlines for the quantification of total volume, and surface area. Scale bars, 100um. D) Images of multiple WIBR3 organoids generated from two independent experiments showing morphological differences between control and PTEN mutants at 6 weeks of age. Scale bars, 1mm. E) Quantification of surface folds density in Hoechst-stained control and PTEN mutant WIBR3 cerebral organoids from 3 independent experiments. Results are mean +/- SEM. ***p<
9
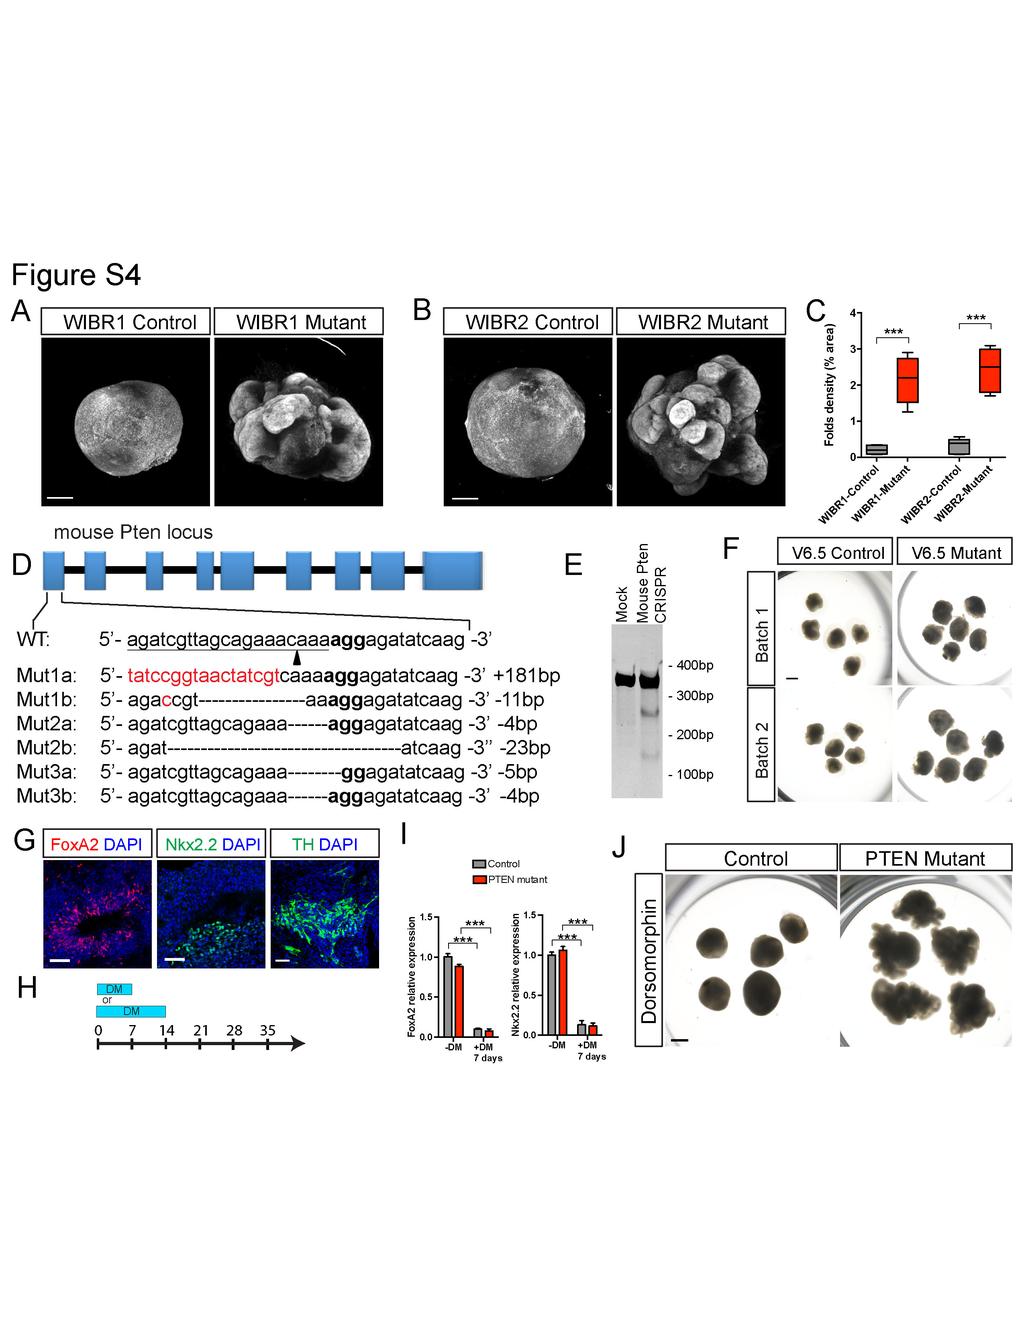
10 Figure S4. PTEN mutant human and mouse cerebral organoids. Related to Figure 1, 2 and 3. A-B) Light sheet images of Hoechst-stained control and PTEN mutant human cerebral organoids generated from WIBR1 (A) and WIBR2 (B) hescs. Scale bar, 500um. C) Quantification of surface folds density in Hoechst-stained control and PTEN mutant human cerebral organoids from WIBR1 and WIBR2. D) Schematic overview of the mouse Pten locus and sequences of mutant V6.5 mouse ESC clones, E) Gel picture of Cel-1 assay with grna against mouse Pten gene. F) Images of multiple mouse control and Pten mutant organoids at 6 weeks of age, generated from two independent experiments. Scale bars, 1mm. G) Immuno-staining with antibodies against FoxA2, Nkx2.2 and TH on human cerebral organoids from wild-type WIBR3 hescs. H) Schematic diagram of dorsomorphin (DM) treatment during the first 7 or 14 days of organoid culture. I) Quantitative RT-PCR for FoxA2 and Nkx2.2 shows dorsomorphin (DM) treatment for 7 days suppressed the expression of these none forebrain markers. J) Images of multiple control and PTEN mutant WIBR3 cerebral organoids treated with dorsomorphin for the first 14 days. Scale bars, 1mm. Results are mean +/- SEM. ***p<
11
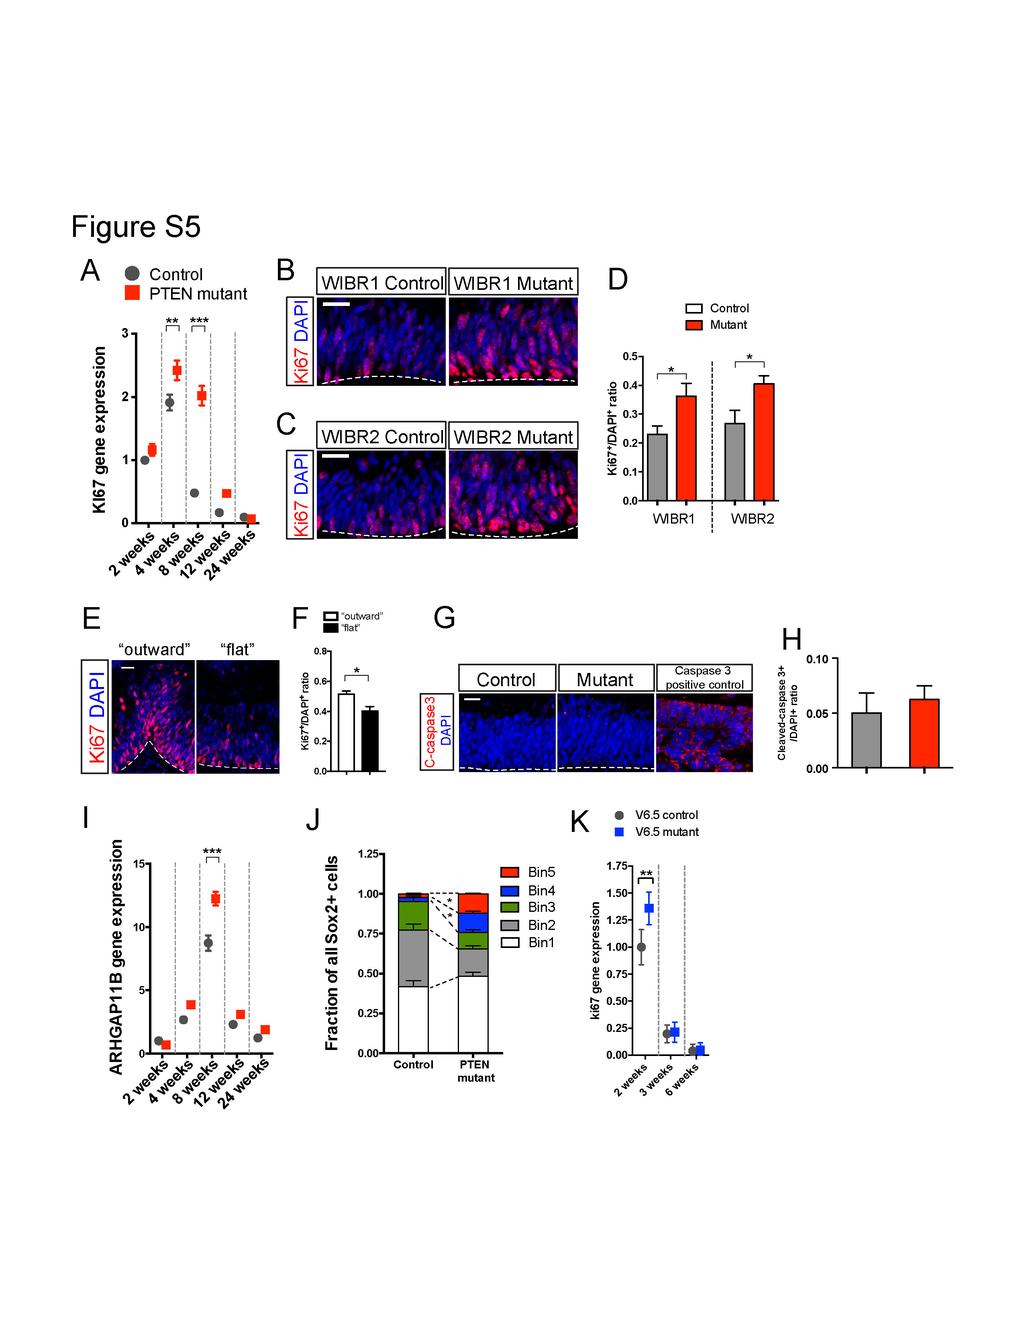
12 Figure S5. Enhancing proliferation in PTEN mutant human cerebral organoids expands the NP pool. Related to Figure 4. A) Quantitative RT-PCR analysis of proliferation marker KI67 demonstrates their temporal-specific over-expression in PTEN mutant WIBR3 cerebral organoids compared to controls. B-D) Representative images and quantification of Ki67 immuno-staining in control and PTEN mutant WIBR3 cerebral organoids generated from WIBR1 and WIBR2. Scale bar, 20um. E-F) Representative images (E) and quantification (F) of Ki67 immuno-staining in PTEN mutant WIBR3 cerebral organoids with outward curvature or flat. Scale bar, 20um. G-H) Representative images (G) and quantification (H) of cleaved-caspase 3 (ccaspase 3) immuno-staining in control and PTEN mutant WIBR3 cerebral organoids. Positive control is a day 34 organoid after 4 days of ZIKV exposure (see later, Figure 7). Scale bar, 20um. I) Quantitative RT-PCR analyses of ARHGAP11B in control and PTEN mutant WIBR3 cerebral organoids. J) Distribution of Sox2+ NPs in the neuroepithelium of PTEN mutant WIBR3 cerebral organoids is significantly enriched towards the basal surface, compared to controls. K) Quantitative RT-PCR for Ki67 in mouse organoids shows mutants had increased expression at 2 weeks but not 3 or 6 weeks. Results are mean +/- SEM. *p<0.05, **p<0.01, ***p<
13
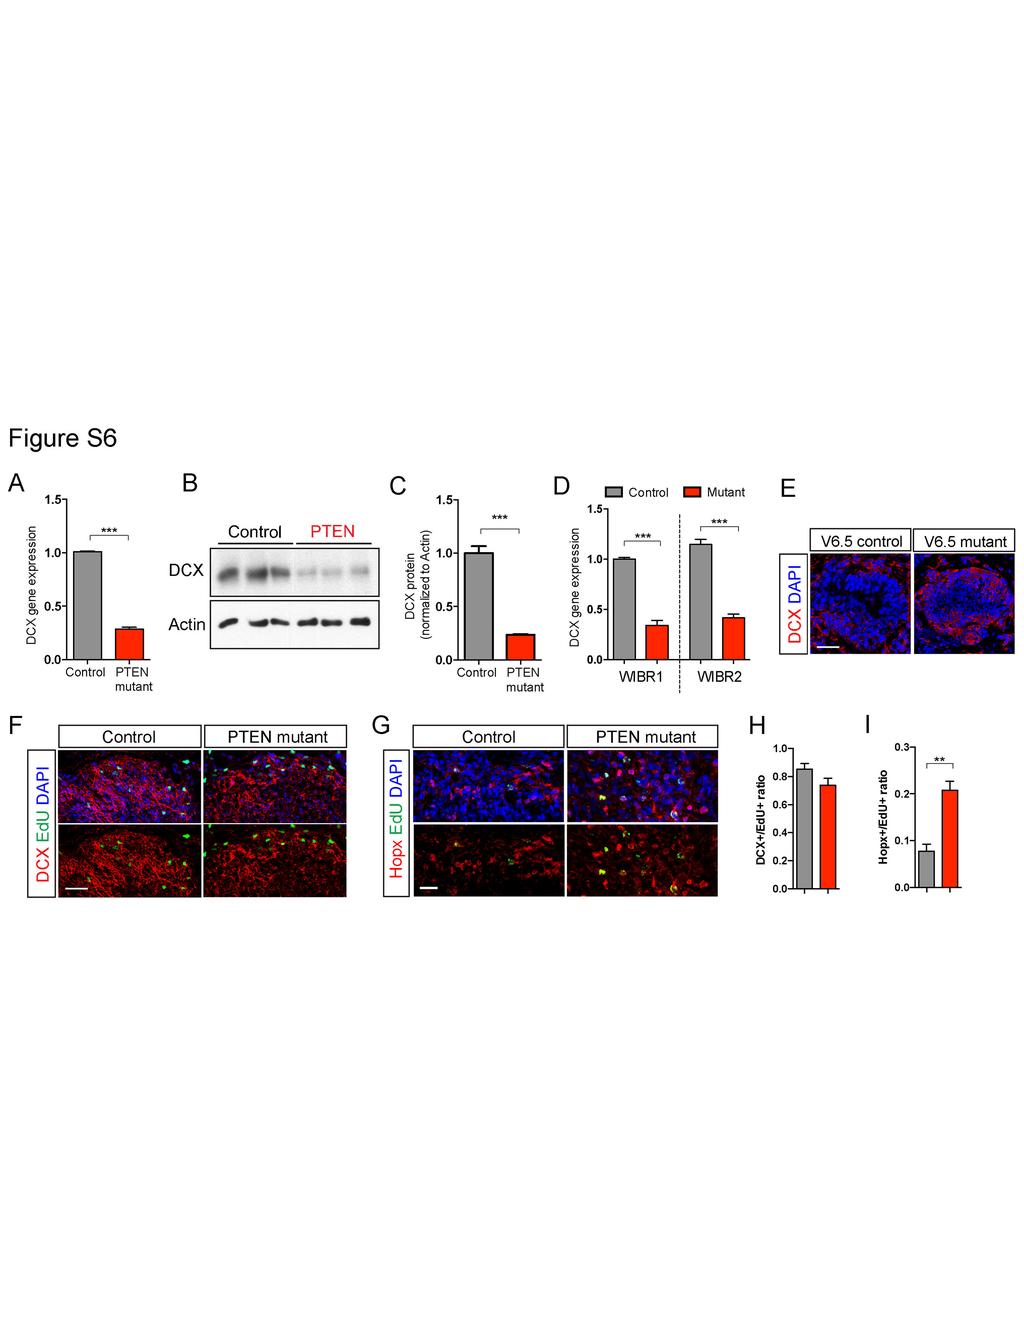
14 Figure S6. Transiently delayed neuronal differentiation in PTEN mutant human cerebral organoids. Related to Figure 5. A-C) PTEN mutant cerebral organoids at 4 weeks showed delayed neuronal differentiation, as measured by reduced DCX mrna (A) and protein (B-C) levels. D) Delayed neuronal differentiation in 4-week-old PTEN mutant cerebral organoids from WIBR1 and WIBR2 as measured by DCX gene expression. E) Immuno-staining for DCX in 3-week-old control and Pten mutant mouse organoids shows comparable levels of expression. F-I) Representative images and quantification of immuno-staining for EdU (labeled at 4 weeks) and DCX (F) or Hopx (G) in 8-week old organoids. Majority of EdU+ cells colocalized with DCX (H), albeit a significantly more co-labeled with Hopx in the PTEN mutant WIBR3 cerebral organoids compared to control (I). Scale bars, 50um (F) and 20um (G). Results are mean +/- SEM. **p<0.01, ***p<
15
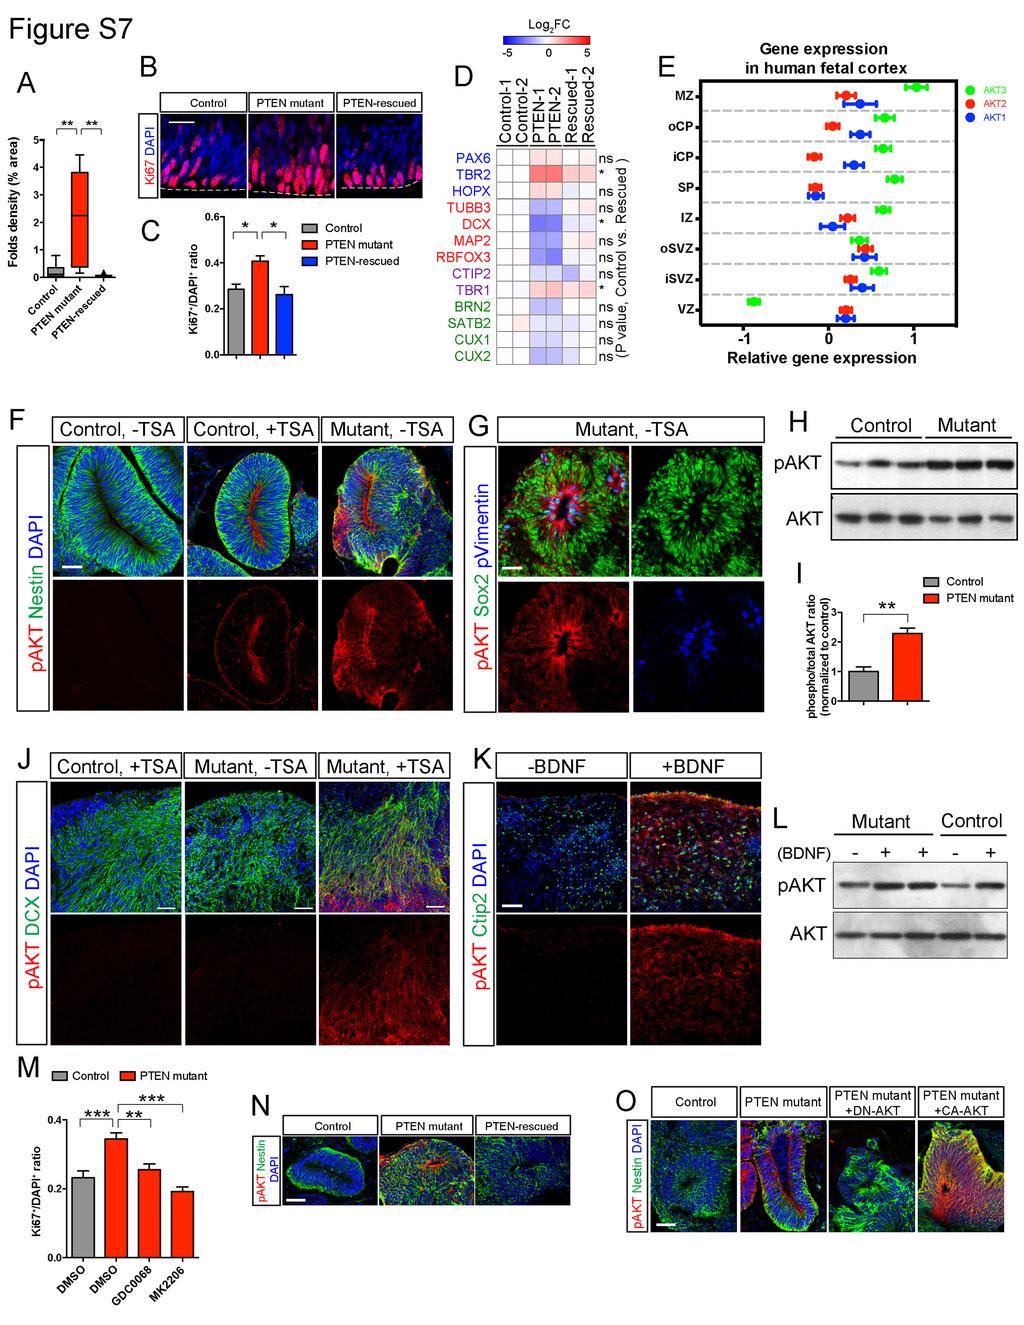
16 Figure S7. PTEN-AKT signaling in human cerebral organoids. Related to Figure 6. A) Quantitative analysis of the density of surface folds in control, PTEN mutant, and PTEN-rescued WIBR3 cerebral organoids at 6 weeks. B-C) Representative images and quantification of Ki67 immuno-staining in control, PTEN mutant, and PTEN-rescued WIBR3 cerebral organoids at 6 weeks. Scale bar, 20um. D) Differential gene expression analyses by quantitative RT-PCR on control, PTEN mutant, and PTEN-rescued WIBR3 cerebral organoids at 6 weeks. Gene expressions are normalized to control-1. P value reflects controls vs. PTEN-rescued mutants. E) Analysis of BrainSpan gene expression data shows AKT1, AKT2 and AKT3 are expressed in the human cortex at 15 or 16 pcw. F) Immuno-staining with tyramide signal amplification (TSA) allowed detection of pakt in control WIBR3 cerebral organoids, showing enrichment towards the apical surface of the VZ, a similar pattern as seen in PTEN mutants without TSA. Scale bar, 50um. G) Immuno-staining in PTEN mutant WIBR3 cerebral organoids shows co-localization of pakt and NP markers Sox2 and phospho-vimentin (pvimentin). Scale bar, 50um. H-I) Immuno-blotting analysis shows increased pakt protein level in PTEN mutant WIBR3 cerebral organoids at 6 weeks. J) Immuno-staining with TSA allowed detection of pakt in DCX+ neurons of 8-week-old PTEN mutant WIBR3 cerebral organoids, no significant signal was detected in controls with or without TSA. Scale bars 50um. K) Immuno-staining for pakt and Ctip2 shows acute treatment with BDNF (30 ) increased pakt immuno-staining in 12-week-old PTEN mutant WIBR3 cerebral organoids, without TSA. Scale bar, 50um. L) Immuno-blotting analysis shows increased pakt protein level upon BDNF treatment in 12-week-old control and mutant organoids. M) Quantification of Ki67 immuno-staining shows AKT inhibitors GDC-0068 (1uM) or MK-2206 (100nM) reduced proliferation in PTEN mutant WIBR3 cerebral organoids. N-O) Cerebral organoids generated from PTEN mutants transduced with GFP-PTEN lentivirus (N) or DN-AKT (O) showed reduced pakt immuno-staining compared to 8
17 PTEN mutants alone, whereas CA-AKT transduced mutants showed high level of pakt. Scale bars, 50um. Results are mean +/- SEM. *p<0.05, **p<0.01, ***p<
18 Table S1. Antibody information. Related to Figure 1-7. S1a. Antibodies for immuno-staining Antibody Vendor Catalog # Species Dilution Phospho-AKT Cell Signaling 4058 Rabbit 1:100 Brn2 Santa Cruz sc6029 Goat 1:500 Cleaved-caspase 3 Cell Signaling 9661 Rabbit 1:1000 Ctip2 Abcam ab18465 Rat 1:500 Doublecortin Santa Cruz sc-8066 Goat 1:500 Flavivirus Santa Cruz sc Mouse 1:100 FoxA2 R&D Systems AF2400 Goat 1:300 FoxG1 Abcam ab18259 Rabbit 1:500 GFAP Dako z0334 Rabbit 1:1000 Phospho-Histone H3 Millipore Rabbit 1:1000 HOPX Santa Cruz sc Rabbit 1:500 Ki67 Dako M7240 Mouse 1:100 Nkx2.2 Santa Cruz sc Goat 1:500 Nestin Millipore MAB5326 Mouse 1:300 NeuN Millipore MAB377 Mouse 1:300 Pax6 Covance PRB-278P Rabbit 1:300 Satb2 Abcam ab51502 Mouse 1:300 Sox2 R&D Systems AF2018 Goat 1:300 Tau Dako A0024 Rabbit 1:500 Tbr1 Abcam ab31940 Rabbit 1:500 Tbr2 Abcam ab23345 Rabbit 1:300 Tbr2 Millipore AB15894 Chicken 1:300 TH Pel-freez P40101 Rabbit 1:500 Phospho-Vimentin MBL D076-3 Mouse 1:1000 S1b. Antibodies for immuno-blotting Antibody Vendor Catalog # Species Dilution Actin Sigma A2228 Mouse 1:1000 Phospho-AKT Cell Signaling 4058 Rabbit 1:1000 AKT Cell Signaling 9272 Rabbit 1:1000 PTEN Cell Signaling 9559 Rabbit 1:
19 Table S2. Primer information. Related to Figure 3-6. S2a. Primers for quantitative PCR Gene Primer (forward) Primer (reverse) Arhgap11b AGAAAAGAAGGGCGTGTACC TTCTTCAAAGCCTTCCAGTGA Brn2 CGGCGGATCAAACTGGGATTT TTGCGCTGCGATCTTGTCTAT Ctip2 GAGTACTGCGGCAAGGTGTT TAGTTGCACAGCTCGCACTT Cux1 GCTCTCATCGGCCAATCACT TCTATGGCCTGCTCCACGT Cux2 AAGGAGATCGAGTCGCAGAA CTCCAGGATGCTCTTGATGG Dcx TCCCGGATGAATGGGTTGC GCGTACACAATCCCCTTGAAGTA FoxA2 TGGGAGCGGTGAAGATGGAAGGGC AC TCATGCCAGCGCCCACGTACGAC GAC Gapdh CGTGGAAGGACTCATGACCA CAGTCTTCTGGGTGGCAGTGA Hopx GAGACCCAGGGTAGTGATTTGA AAAAGTAATCGAAAGCCAAGCAC Map2 CTCAGCACCGCTAACAGAGG CATTGGCGCTTCGGACAAG Mki67 (human) ACGCCTGGTTACTATCAAAAGG CAGACCCATTTACTTGTGTTGGA Mki67 (mouse) ATCATTGACCGCTCCTTTAGGT GCTCGCCTTGATGGTTCCT Nkx2.2 TGCCTCTCCTTCTGAACCTTGG GCGAAATCTGCCACCAGTTG Pax6 ACCCATTATCCAGATGTGTTTGCCC GAG ATGGTGAAGCTGGGCATAGGCGG CAG Pten TGGATTCGACTTAGACTTGACCT TGGCGGTGTCATAATGTCTTTC Rbfox3 CCAAGCGGCTACACGTCTC CGTCCCATTCAGCTTCTCCC Satb2 CCTCCTCCGACTGAAGACAG TGGTCTGGGTACAGGCCTAC Tbr1 ATGGGCAGATGGTGGTTTTA GACGGCGATGAACTGAGTCT Tbr2 CACCGCCACCAAACTGAGAT CGAACACATTGTAGTGGGCAG Tubb3 GGCCAAGGGTCACTACACG GCAGTCGCAGTTTTCACACTC S2b. Primers for genotyping PCR Gene Primer (forward) Primer (reverse) Pten (human genomic) AGCAGCTTCTGCCATCTCTC TAGCCCTCAGGAAGAGACCA Pten (mouse genomic) GAGCCATTTCCATCCTGCAG CTAGCCGAACACTCCCTAGG 11
Neocortex Zbtb20 / NFIA / Sox9
 Neocortex / NFIA / Sox9 Supplementary Figure 1. Expression of, NFIA, and Sox9 in the mouse neocortex at. The lower panels are higher magnification views of the oxed area. Arrowheads indicate triple-positive
SUPPLEMENTARY FIGURES
 SUPPLEMENTARY FIGURES 1 Supplementary Figure 1, Adult hippocampal QNPs and TAPs uniformly express REST a-b) Confocal images of adult hippocampal mouse sections showing GFAP (green), Sox2 (red), and REST
SUPPLEMENTARY DATA. Supplementary Table 2. Antibodies used for Immunofluoresence. Supplementary Table 3. Real-time PCR primer sequences.
 Supplementary Table 2. Antibodies used for Immunofluoresence. Antibody Dilution Source Goat anti-pdx1 1:100 R&D Systems Rabbit anti-hnf6 1:100 Santa Cruz Biotechnology Mouse anti-nkx6.1 1:200 Developmental
Supplementary Figure 1
 Supplementary Figure 1 Kif1a RNAi effect on basal progenitor differentiation Related to Figure 2. Representative confocal images of the VZ and SVZ of rat cortices transfected at E16 with scrambled or Kif1a
marker. DAPI labels nuclei. Flies were 20 days old. Scale bar is 5 µm. Ctrl is
 Supplementary Figure 1. (a) Nos is detected in glial cells in both control and GFAP R79H transgenic flies (arrows), but not in deletion mutant Nos Δ15 animals. Repo is a glial cell marker. DAPI labels
Supplementary Figure S1: Tanycytes are restricted to the central/posterior hypothalamus
 Supplementary Figure S1: Tanycytes are restricted to the central/posterior hypothalamus a: Expression of Vimentin, GFAP, Sox2 and Nestin in anterior, central and posterior hypothalamus. In the anterior
Metformin Activates an Atypical PKC-CBP Pathway to Promote Neurogenesis and Enhance Spatial Memory Formation
 rticle formin ctivates an typical PKC-CBP Pathway to Promote Neurogenesis and Enhance Spatial Memory Formation Jing Wang, 1,2 Denis Gallagher, 1,2,4,9 Loren M. DeVito, 3,9 Gonzalo I. Cancino, 1,2 David
Supplementary Figure 1. HOPX is hypermethylated in NPC. (a) Methylation levels of HOPX in Normal (n = 24) and NPC (n = 24) tissues from the
 Methylation levels of HOPX in Normal (n = 24) and NPC (n = 24) tissues from the") Supplementary Figure 1. HOPX is hypermethylated in NPC. (a) Methylation levels of HOPX in Normal (n = 24) and NPC (n = 24) tissues from the genome-wide methylation microarray data. Mean ± s.d.; Student
Supplementary Figure 1. HOPX is hypermethylated in NPC. (a) Methylation levels of HOPX in Normal (n = 24) and NPC (n = 24) tissues from the genome-wide methylation microarray data. Mean ± s.d.; Student
SUPPLEMENTARY INFORMATION
 DOI: 10.1038/ncb2566 Figure S1 CDKL5 protein expression pattern and localization in mouse brain. (a) Multiple-tissue western blot from a postnatal day (P) 21 mouse probed with an antibody against CDKL5.
Supplementary Figure S1. Monolayer differentiation of mouse ESCs into telencephalic neural precursors. (a) Schematic representation of the protocols
 Schematic representation of the protocols") Supplementary Figure S1. Monolayer differentiation of mouse ESCs into telencephalic neural precursors. (a) Schematic representation of the protocols used to differentiate mouse ESCs. (b) Representative
Supplementary Figure S1. Monolayer differentiation of mouse ESCs into telencephalic neural precursors. (a) Schematic representation of the protocols used to differentiate mouse ESCs. (b) Representative
Supplemental Figure 1. Intracranial transduction of a modified ptomo lentiviral vector in the mouse
 Supplemental figure legends Supplemental Figure 1. Intracranial transduction of a modified ptomo lentiviral vector in the mouse hippocampus targets GFAP-positive but not NeuN-positive cells. (A) Stereotaxic
Supplementary Figure 1: Neuregulin 1 increases the growth of mammary organoids compared to EGF. (a) Mammary epithelial cells were freshly isolated,
 Mammary epithelial cells were freshly isolated,") 1 2 3 4 5 6 7 8 9 10 Supplementary Figure 1: Neuregulin 1 increases the growth of mammary organoids compared to EGF. (a) Mammary epithelial cells were freshly isolated, embedded in matrigel and exposed
1 2 3 4 5 6 7 8 9 10 Supplementary Figure 1: Neuregulin 1 increases the growth of mammary organoids compared to EGF. (a) Mammary epithelial cells were freshly isolated, embedded in matrigel and exposed
Stem Cells and the Study of Neurodegeneration. Tracy Young-Pearse, PhD September 12, 2014!
 Stem Cells and the Study of Neurodegeneration Tracy Young-Pearse, PhD September 12, 2014! Techniques for studying mechanisms of neurological disease Animal models Human subjects Postmortem analyses, imaging
Supplementary Table 1. Characterization of HNSCC PDX models established at MSKCC
 Supplementary Table 1. Characterization of HNSCC PDX models established at MSKCC Supplementary Table 2. Drug content and loading efficiency estimated with F-NMR and UV- Vis Supplementary Table 3. Complete
SUPPLEMENTARY INFORMATION
 DOI: 10.1038/ncb2607 Figure S1 Elf5 loss promotes EMT in mammary epithelium while Elf5 overexpression inhibits TGFβ induced EMT. (a, c) Different confocal slices through the Z stack image. (b, d) 3D rendering
(a) Significant biological processes (upper panel) and disease biomarkers (lower panel)
 Significant biological processes (upper panel) and disease biomarkers (lower panel)") Supplementary Figure 1. Functional enrichment analyses of secretomic proteins. (a) Significant biological processes (upper panel) and disease biomarkers (lower panel) 2 involved by hrab37-mediated secretory
Supplementary Figure 1. Functional enrichment analyses of secretomic proteins. (a) Significant biological processes (upper panel) and disease biomarkers (lower panel) 2 involved by hrab37-mediated secretory
PKCζ Promotes Breast Cancer Invasion by Regulating Expression of E-cadherin and Zonula Occludens-1 (ZO-1) via NFκB-p65
 via NFκB-p65") SUPPLEMENTARY INFORMATION TITLE: PKCζ Promotes Breast Cancer Invasion by Regulating Expression of E-cadherin and Zonula Occludens-1 (ZO-1) via NFκB-p65 RUNNING TITLE: PKCζ-NFκB Signaling in Breast Cancer
SUPPLEMENTARY INFORMATION TITLE: PKCζ Promotes Breast Cancer Invasion by Regulating Expression of E-cadherin and Zonula Occludens-1 (ZO-1) via NFκB-p65 RUNNING TITLE: PKCζ-NFκB Signaling in Breast Cancer
Erzsebet Kokovay, Susan Goderie, Yue Wang, Steve Lotz, Gang Lin, Yu Sun, Badrinath Roysam, Qin Shen,
 Cell Stem Cell, Volume 7 Supplemental Information Adult SVZ Lineage Cells Home to and Leave the Vascular Niche via Differential Responses to SDF1/CXCR4 Signaling Erzsebet Kokovay, Susan Goderie, Yue Wang,
Tuberous sclerosis complex (TSC) is a developmental disorder
 is a developmental disorder") Articles https://doi.org/1.138/s41591-18-139-y Genetically engineered human cortical spheroid models of tuberous sclerosis John D. Blair 1, Dirk Hockemeyer 1 and Helen S. Bateup 1,2 Tuberous sclerosis
Articles https://doi.org/1.138/s41591-18-139-y Genetically engineered human cortical spheroid models of tuberous sclerosis John D. Blair 1, Dirk Hockemeyer 1 and Helen S. Bateup 1,2 Tuberous sclerosis
Supplementary Figure 1. Electroporation of a stable form of β-catenin causes masses protruding into the IV ventricle. HH12 chicken embryos were
 Supplementary Figure 1. Electroporation of a stable form of β-catenin causes masses protruding into the IV ventricle. HH12 chicken embryos were electroporated with β- Catenin S33Y in PiggyBac expression
SUPPLEMENTARY FIGURES AND TABLE
 SUPPLEMENTARY FIGURES AND TABLE Supplementary Figure S1: Characterization of IRE1α mutants. A. U87-LUC cells were transduced with the lentiviral vector containing the GFP sequence (U87-LUC Tet-ON GFP).
Supplemental Information
 Supplemental Information Tobacco-specific Carcinogen Induces DNA Methyltransferases 1 Accumulation through AKT/GSK3β/βTrCP/hnRNP-U in Mice and Lung Cancer patients Ruo-Kai Lin, 1 Yi-Shuan Hsieh, 2 Pinpin
Supplemental Information. Otic Mesenchyme Cells Regulate. Spiral Ganglion Axon Fasciculation. through a Pou3f4/EphA4 Signaling Pathway
 Neuron, Volume 73 Supplemental Information Otic Mesenchyme Cells Regulate Spiral Ganglion Axon Fasciculation through a Pou3f4/EphA4 Signaling Pathway Thomas M. Coate, Steven Raft, Xiumei Zhao, Aimee K.
SUPPLEMENTARY INFORMATION. Supplementary Figures S1-S9. Supplementary Methods
 SUPPLEMENTARY INFORMATION SUMO1 modification of PTEN regulates tumorigenesis by controlling its association with the plasma membrane Jian Huang 1,2#, Jie Yan 1,2#, Jian Zhang 3#, Shiguo Zhu 1, Yanli Wang
Genesis of cerebellar interneurons and the prevention of neural DNA damage require XRCC1.
 Genesis of cerebellar interneurons and the prevention of neural DNA damage require XRCC1. Youngsoo Lee, Sachin Katyal, Yang Li, Sherif F. El-Khamisy, Helen R. Russell, Keith W. Caldecott and Peter J. McKinnon.
Supplementary Table 1. List of primers used in this study
 Supplementary Table 1. List of primers used in this study Gene Forward primer Reverse primer Rat Met 5 -aggtcgcttcatgcaggt-3 5 -tccggagacacaggatgg-3 Rat Runx1 5 -cctccttgaaccactccact-3 5 -ctggatctgcctggcatc-3
Supplementary Figure 1 Cell line TRIB2 status. Supplementary Figure 2 TRIB2 status has no impact on the cell cycle after PI3K inhibition. a. b.
 Supplementary Figure 1 Cell line TRIB2 status. TRIB2 protein expression to determine endogenous expression and to determine the effectiveness of each of our TRIB2 knockdown constructs. Supplementary Figure
Supplementary Information
 Supplementary Information Astrocytes regulate adult hippocampal neurogenesis through ephrin-b signaling Randolph S. Ashton, Anthony Conway, Chinmay Pangarkar, Jamie Bergen, Kwang-Il Lim, Priya Shah, Mina
Targeted mass spectrometry (LC/MS/MS) for Olaparib pharmacokinetics. For LC/MS/MS of Olaparib pharmacokinetics metabolites were extracted from
 for Olaparib pharmacokinetics. For LC/MS/MS of Olaparib pharmacokinetics metabolites were extracted from") Supplementary Methods: Targeted mass spectrometry (LC/MS/MS) for Olaparib pharmacokinetics For LC/MS/MS of Olaparib pharmacokinetics metabolites were extracted from mouse tumor samples and analyzed as
Supplementary Methods: Targeted mass spectrometry (LC/MS/MS) for Olaparib pharmacokinetics For LC/MS/MS of Olaparib pharmacokinetics metabolites were extracted from mouse tumor samples and analyzed as
Supplementary Figure 1: si-craf but not si-braf sensitizes tumor cells to radiation.
 Supplementary Figure 1: si-craf but not si-braf sensitizes tumor cells to radiation. (a) Embryonic fibroblasts isolated from wildtype (WT), BRAF -/-, or CRAF -/- mice were irradiated (6 Gy) and DNA damage
Supplementary Figures
 Supplementary Figures Supplementary Figure 1. Confirmation of Dnmt1 conditional knockout out mice. a, Representative images of sorted stem (Lin - CD49f high CD24 + ), luminal (Lin - CD49f low CD24 + )
Name Animal source Vendor Cat # Dilutions
 Supplementary data Table S1. Primary and Secondary antibody sources Devi et al, TXNIP in mitophagy A. Primary Antibodies Name Animal source Vendor Cat # Dilutions 1. TXNIP mouse MBL KO205-2 1:2000 (WB)
Supplementary Figure 1: Hsp60 / IEC mice are embryonically lethal (A) Light microscopic pictures show mouse embryos at developmental stage E12.
 Light microscopic pictures show mouse embryos at developmental stage E12.") Supplementary Figure 1: Hsp60 / IEC mice are embryonically lethal (A) Light microscopic pictures show mouse embryos at developmental stage E12.5 and E13.5 prepared from uteri of dams and subsequently genotyped.
Supplementary Figure 1: Hsp60 / IEC mice are embryonically lethal (A) Light microscopic pictures show mouse embryos at developmental stage E12.5 and E13.5 prepared from uteri of dams and subsequently genotyped.
Supplementary Figure (OH) 22 nanoparticles did not affect cell viability and apoposis. MDA-MB-231, MCF-7, MCF-10A and BT549 cells were
 22 nanoparticles did not affect cell viability and apoposis. MDA-MB-231, MCF-7, MCF-10A and BT549 cells were") Supplementary Figure 1. Gd@C 82 (OH) 22 nanoparticles did not affect cell viability and apoposis. MDA-MB-231, MCF-7, MCF-10A and BT549 cells were treated with PBS, Gd@C 82 (OH) 22, C 60 (OH) 22 or GdCl
Supplementary Figure 1. Gd@C 82 (OH) 22 nanoparticles did not affect cell viability and apoposis. MDA-MB-231, MCF-7, MCF-10A and BT549 cells were treated with PBS, Gd@C 82 (OH) 22, C 60 (OH) 22 or GdCl
CD31 5'-AGA GAC GGT CTT GTC GCA GT-3' 5 ' -TAC TGG GCT TCG AGA GCA GT-3'
 Table S1. The primer sets used for real-time RT-PCR analysis. Gene Forward Reverse VEGF PDGFB TGF-β MCP-1 5'-GTT GCA GCA TGA ATC TGA GG-3' 5'-GGA GAC TCT TCG AGG AGC ACT T-3' 5'-GAA TCA GGC ATC GAG AGA
SUPPLEMENTARY INFORMATION
 SUPPLEMENTARY INFORMATION Human cerebral cortex development from pluripotent stem cells to functional excitatory synapses Yichen Shi 1,2, Peter Kirwan 1,2, James Smith 1,2, Hugh P.C. Robinson 3 and Frederick
A263 A352 A204. Pan CK. pstat STAT3 pstat3 STAT3 pstat3. Columns Columns 1-6 Positive control. Omentum. Rectosigmoid A195.
 pstat3 75 Pan CK A A263 A352 A24 B Columns 1-6 Positive control A195 A22 A24 A183 Rectal Nodule STAT3 pstat3 STAT3 pstat3 Columns 7-12 Omentum Rectosigmoid Left Ovary Right Ovary Omentum Uterus Uterus
SOPten flox/flox (KO) Pten flox/flox (WT) flox allele 6.0 kb. Pten. Actin. ! allele 2.3 kb. Supplementary Figure S1. Yanagi, et al.
 Pten flox/flox (WT) flox allele 6.0 kb. Pten. Actin. ! allele 2.3 kb. Supplementary Figure S1. Yanagi, et al.") s1 A Pten flox/flox () SOPten flox/flox () flox allele 6. kb B Pten flox/flox () SOPten flox/flox () Pten Actin! allele 2.3 kb Supplementary Figure S1. Yanagi, et al. A B BrdU BrdU positive cells ( ) 3
s1 A Pten flox/flox () SOPten flox/flox () flox allele 6. kb B Pten flox/flox () SOPten flox/flox () Pten Actin! allele 2.3 kb Supplementary Figure S1. Yanagi, et al. A B BrdU BrdU positive cells ( ) 3
Primary Mouse Cerebral Cortex Neurons V: 80% TE: 70%
 Primary Mouse Cerebral Cortex Neurons V: 80% TE: 70% Pictures: 9 days after electroporation Red: MAP2 Blue: GFAP Green: GFP The cells were from Embryonic Day 14 Mouse Cerebral Cortex Primary Mouse Hippocampal
Soft Agar Assay. For each cell pool, 100,000 cells were resuspended in 0.35% (w/v)
") SUPPLEMENTARY MATERIAL AND METHODS Soft Agar Assay. For each cell pool, 100,000 cells were resuspended in 0.35% (w/v) top agar (LONZA, SeaKem LE Agarose cat.5004) and plated onto 0.5% (w/v) basal agar.
SUPPLEMENTARY MATERIAL AND METHODS Soft Agar Assay. For each cell pool, 100,000 cells were resuspended in 0.35% (w/v) top agar (LONZA, SeaKem LE Agarose cat.5004) and plated onto 0.5% (w/v) basal agar.
Supplementary Fig. S1. Schematic diagram of minigenome segments.
 open reading frame 1565 (segment 5) 47 (-) 3 5 (+) 76 101 125 149 173 197 221 246 287 open reading frame 890 (segment 8) 60 (-) 3 5 (+) 172 Supplementary Fig. S1. Schematic diagram of minigenome segments.
Supplementary Figure 1. Lkb1-deficient lung ADC progressively transdifferentiates into SCC. (a) A scheme showing the progression pattern of atypical
 A scheme showing the progression pattern of atypical") Supplementary Figure 1. Lkb1-deficient lung ADC progressively transdifferentiates into SCC. (a) A scheme showing the progression pattern of atypical adenomatous hyperplasia/epithelial hyperplasia (AAH/EH),
Supplementary Figure 1. Lkb1-deficient lung ADC progressively transdifferentiates into SCC. (a) A scheme showing the progression pattern of atypical adenomatous hyperplasia/epithelial hyperplasia (AAH/EH),
Cells and reagents. Synaptopodin knockdown (1) and dynamin knockdown (2)
 and dynamin knockdown (2)") Supplemental Methods Cells and reagents. Synaptopodin knockdown (1) and dynamin knockdown (2) podocytes were cultured as described previously. Staurosporine, angiotensin II and actinomycin D were all obtained
Supplemental Methods Cells and reagents. Synaptopodin knockdown (1) and dynamin knockdown (2) podocytes were cultured as described previously. Staurosporine, angiotensin II and actinomycin D were all obtained
Supplementary Figure 1: Validation of labeling specificity of immature OSNs and presynaptic terminals. (A) (B) (C) (D) (E)
 (B) (C) (D) (E)") Supplementary Figure 1: Validation of labeling specificity of immature OSNs and presynaptic terminals. (A) Confocal images of septal olfactory epithelium of an adult Gγ8-sypGFP-tdTom mouse showing colocalization
Supplementary Figure 1: Validation of labeling specificity of immature OSNs and presynaptic terminals. (A) Confocal images of septal olfactory epithelium of an adult Gγ8-sypGFP-tdTom mouse showing colocalization
SUPPLEMENTARY INFORMATION
 DOI:.38/ncb2822 a MTC02 FAO cells EEA1 b +/+ MEFs /DAPI -/- MEFs /DAPI -/- MEFs //DAPI c HEK 293 cells WCE N M C P AKT TBC1D7 Lamin A/C EEA1 VDAC d HeLa cells WCE N M C P AKT Lamin A/C EEA1 VDAC Figure
Supporting Information. Supporting Tables. S-Table 1 Primer pairs for RT-PCR. Product size. Gene Primer pairs
 Supporting Information Supporting Tables S-Table 1 Primer pairs for RT-PCR. Gene Primer pairs Product size (bp) FAS F: 5 TCTTGGAAGCGATGGGTA 3 429 R: 5 GGGATGTATCATTCTTGGAC 3 SREBP-1c F: 5 CGCTACCGTTCCTCTATCA
Lack of cadherins Celsr2 and Celsr3 impairs ependymal ciliogenesis, leading to fatal
 Lack of cadherins Celsr2 and Celsr3 impairs ependymal ciliogenesis, leading to fatal hydrocephalus Fadel TISSIR, Yibo QU, Mireille MONTCOUQUIOL, Libing ZHOU, Kouji KOMATSU, Dongbo SHI, Toshihiko FUJIMORI,
SUPPLEMENTARY INFORMATION
 doi:10.1038/nature12652 Supplementary Figure 1. PRDM16 interacts with endogenous EHMT1 in brown adipocytes. Immunoprecipitation of PRDM16 complex by flag antibody (M2) followed by Western blot analysis
Supplementary Figure 1 IL-27 IL
 Tim-3 Supplementary Figure 1 Tc0 49.5 0.6 Tc1 63.5 0.84 Un 49.8 0.16 35.5 0.16 10 4 61.2 5.53 10 3 64.5 5.66 10 2 10 1 10 0 31 2.22 10 0 10 1 10 2 10 3 10 4 IL-10 28.2 1.69 IL-27 Supplementary Figure 1.
Supplementary material. Supplementary Figure legends
 Supplementary material Supplementary Figure legends Supplementary Figure 1: Senescence-associated proliferation stop in response to oncogenic N-RAS expression Proliferation of NHEM cells without (ctrl.)
Supplementary Information
 Supplementary Information Title Degeneration and impaired regeneration of gray matter oligodendrocytes in amyotrophic lateral sclerosis Authors Shin H. Kang, Ying Li, Masahiro Fukaya, Ileana Lorenzini,
Supplementary Figure 1. Basal level EGFR across a panel of ESCC lines. Immunoblots demonstrate the expression of phosphorylated and total EGFR as
 Supplementary Figure 1. Basal level EGFR across a panel of ESCC lines. Immunoblots demonstrate the expression of phosphorylated and total EGFR as well as their downstream effectors across a panel of ESCC
Supplementary Figure 1. A. Bar graph representing the expression levels of the 19 indicated genes in the microarrays analyses comparing human lung
 Supplementary Figure 1. A. Bar graph representing the expression levels of the 19 indicated genes in the microarrays analyses comparing human lung immortalized broncho-epithelial cells (AALE cells) expressing
Tumor suppressor Spred2 interaction with LC3 promotes autophagosome maturation and induces autophagy-dependent cell death
 www.impactjournals.com/oncotarget/ Oncotarget, Supplementary Materials 2016 Tumor suppressor Spred2 interaction with LC3 promotes autophagosome maturation and induces autophagy-dependent cell death Supplementary
Supplementary Figure 1
 Supplementary Figure 1 The average sigmoid parametric curves of capillary dilation time courses and average time to 50% peak capillary diameter dilation computed from individual capillary responses averaged
Supplementary Information
 Supplementary Information Supplementary Figure 1. Short-term coreceptor and costimulation blockade induces tolerance to pluripotent human ESCs. (A) Schematic diagram showing experimental approaches and
T H E J O U R N A L O F C E L L B I O L O G Y
 T H E J O U R N A L O F C E L L B I O L O G Y Supplemental material Krenn et al., http://www.jcb.org/cgi/content/full/jcb.201110013/dc1 Figure S1. Levels of expressed proteins and demonstration that C-terminal
Supplemental Figure 1: Lrig1-Apple expression in small intestine. Lrig1-Apple is observed at the crypt base and in insterstial cells of Cajal, but is
 Supplemental Figure 1: Lrig1-Apple expression in small intestine. Lrig1-Apple is observed at the crypt base and in insterstial cells of Cajal, but is not co-expressed in DCLK1-positive tuft cells. Scale
Supplementary Information. Supplementary Figure 1
 Supplementary Information Supplementary Figure 1 1 Supplementary Figure 1. Functional assay of the hcas9-2a-mcherry construct (a) Gene correction of a mutant EGFP reporter cell line mediated by hcas9 or
Social deficits in Shank3-deficient mouse models of autism are rescued by histone deacetylase (HDAC) inhibition
 inhibition") SUPPLEMENTARY INFORMATION Articles https://doi.org/10.1038/s41593-018-0110-8 In the format provided by the authors and unedited. Social deficits in Shank3-deficient mouse models of autism are rescued by
SUPPLEMENTARY INFORMATION Articles https://doi.org/10.1038/s41593-018-0110-8 In the format provided by the authors and unedited. Social deficits in Shank3-deficient mouse models of autism are rescued by
Figure S1. Reduction in glomerular mir-146a levels correlate with progression to higher albuminuria in diabetic patients.
 Supplementary Materials Supplementary Figures Figure S1. Reduction in glomerular mir-146a levels correlate with progression to higher albuminuria in diabetic patients. Figure S2. Expression level of podocyte
Mitosis. Single Nano Micro Milli Macro. Primary. PCNA expression
 a b c DAPI YFP CC3 DAPI YFP PCNA DAPI YFP ph3 DAPI YFP KI67 e 6 Mitosis f 1 PCNA expression %ph3 + /YFP + n= 63 87 61 3 13 8 n= 15 3 9 1 5 %PCNA+/YFP+ 8 6 Supplementary Figure 1. Proliferation/apoptosis
Supplementary Figure 1
 Supplementary Figure 1 Supplementary Figure 1. Neither the activation nor suppression of the MAPK pathway affects the ASK1/Vif interaction. (a, b) HEK293 cells were cotransfected with plasmids encoding
Supplementary Figure 1. Repression of hepcidin expression in the liver of mice treated with
 Supplementary Figure 1. Repression of hepcidin expression in the liver of mice treated with DMN Immunohistochemistry for hepcidin and H&E staining (left). qrt-pcr assays for hepcidin in the liver (right).
mir-7a regulation of Pax6 in neural stem cells controls the spatial origin of forebrain dopaminergic neurons
 Supplemental Material mir-7a regulation of Pax6 in neural stem cells controls the spatial origin of forebrain dopaminergic neurons Antoine de Chevigny, Nathalie Coré, Philipp Follert, Marion Gaudin, Pascal
Zhu et al, page 1. Supplementary Figures
 Zhu et al, page 1 Supplementary Figures Supplementary Figure 1: Visual behavior and avoidance behavioral response in EPM trials. (a) Measures of visual behavior that performed the light avoidance behavior
Table S1. qpcr primer list.
 Table S1. qpr primer list. Genes Forward primer Reverse primer NANOG AAATGGGAAGAATAGA GGTTAGTGGGTTA PAX6 TTTTGTTGGGAAATG TGGTTAAATTTAG ASL1 AAGATGAAAGAAAG GGAGTTTGATTAA NHLH GTGGATAGATATTT ATATTTTGGAATTT
OSVZ progenitors of human and ferret neocortex are epithelial-like and
 OSVZ progenitors of human and ferret neocortex are epithelial-like and expand by integrin signaling Simone A Fietz, Iva Kelava, Johannes Vogt, Michaela Wilsch-Bräuninger, Denise Stenzel, Jennifer L Fish,
Nature Neuroscience: doi: /nn Supplementary Figure 1
 Supplementary Figure 1 Subcellular segregation of VGluT2-IR and TH-IR within the same VGluT2-TH axon (wild type rats). (a-e) Serial sections of a dual VGluT2-TH labeled axon. This axon (blue outline) has
SUPPLEMENTARY INFORMATION
 SUPPLEMENTARY INFORMATION doi:10.1038/nature11306 Supplementary Figures Supplementary Figure 1. Basic characterization of GFP+ RGLs in the dentate gyrus of adult nestin-gfp mice. a, Sample confocal images
Supplemental figure 1. PDGFRα is expressed dominantly by stromal cells surrounding mammary ducts and alveoli. A) IHC staining of PDGFRα in
 IHC staining of PDGFRα in") Supplemental figure 1. PDGFRα is expressed dominantly by stromal cells surrounding mammary ducts and alveoli. A) IHC staining of PDGFRα in nulliparous (left panel) and InvD6 mouse mammary glands (right
Supplemental figure 1. PDGFRα is expressed dominantly by stromal cells surrounding mammary ducts and alveoli. A) IHC staining of PDGFRα in nulliparous (left panel) and InvD6 mouse mammary glands (right
Studying The Role Of DNA Mismatch Repair In Brain Cancer Malignancy
 Kavya Puchhalapalli CALS Honors Project Report Spring 2017 Studying The Role Of DNA Mismatch Repair In Brain Cancer Malignancy Abstract Malignant brain tumors including medulloblastomas and primitive neuroectodermal
Supplementary information
 Supplementary information Human Cytomegalovirus MicroRNA mir-us4-1 Inhibits CD8 + T Cell Response by Targeting ERAP1 Sungchul Kim, Sanghyun Lee, Jinwook Shin, Youngkyun Kim, Irini Evnouchidou, Donghyun
Supplementary Figure 1. Genotyping strategies for Mcm3 +/+, Mcm3 +/Lox and Mcm3 +/- mice and luciferase activity in Mcm3 +/Lox mice. A.
 Supplementary Figure 1. Genotyping strategies for Mcm3 +/+, Mcm3 +/Lox and Mcm3 +/- mice and luciferase activity in Mcm3 +/Lox mice. A. Upper part, three-primer PCR strategy at the Mcm3 locus yielding
a 0,8 Figure S1 8 h 12 h y = 0,036x + 0,2115 y = 0,0366x + 0,206 Labeling index Labeling index ctrl shrna Time (h) Time (h) ctrl shrna S G2 M G1
 Time (h) ctrl shrna S G2 M G1") (GFP+ BrdU+)/GFP+ Labeling index Labeling index Figure S a, b, y =,x +, y =,x +,,,,,,,, Time (h) - - Time (h) c d S G M G h M G S G M G S G h Time of BrdU injection after electroporation (h) M G S G M
(GFP+ BrdU+)/GFP+ Labeling index Labeling index Figure S a, b, y =,x +, y =,x +,,,,,,,, Time (h) - - Time (h) c d S G M G h M G S G M G S G h Time of BrdU injection after electroporation (h) M G S G M
Nature Medicine: doi: /nm.4322
 1 2 3 4 5 6 7 8 9 10 11 Supplementary Figure 1. Predicted RNA structure of 3 UTR and sequence alignment of deleted nucleotides. (a) Predicted RNA secondary structure of ZIKV 3 UTR. The stem-loop structure
Supplementary Materials and Methods
 DD2 suppresses tumorigenicity of ovarian cancer cells by limiting cancer stem cell population Chunhua Han et al. Supplementary Materials and Methods Analysis of publicly available datasets: To analyze
Fbw7 controls neural stem cell differentiation and progenitor apoptosis via Notch and c-jun
 Fbw7 controls neural stem cell differentiation and progenitor apoptosis via Notch and c-jun Joerg D Hoeck, Anett Jandke, Sophia Maria Blake, Emma Nye, Bradley Spencer-Dene, Sebastian Brandner, Axel Behrens
AP VP DLP H&E. p-akt DLP
 A B AP VP DLP H&E AP AP VP DLP p-akt wild-type prostate PTEN-null prostate Supplementary Fig. 1. Targeted deletion of PTEN in prostate epithelium resulted in HG-PIN in all three lobes. (A) The anatomy
SUPPLEMENTARY FIG. S2. Representative counting fields used in quantification of the in vitro neural differentiation of pattern of dnscs.
 Supplementary Data SUPPLEMENTARY FIG. S1. Representative counting fields used in quantification of the in vitro neural differentiation of pattern of anpcs. A panel of lineage-specific markers were used
SUPPLEMENTARY INFORMATION
 Suppl. Fig. 1 in vivo expression of ISL1 in the human fetal heart. a, Hematoxylin eosin staining showing structures of left atrium and left atrium appendage (*) of a human fetal heart at 11 weeks of gestation.
Supplementary Figure 1: Signaling centers contain few proliferating cells, express p21, and
 Supplementary Figure 1: Signaling centers contain few proliferating cells, express p21, and exclude YAP from the nucleus. (a) Schematic diagram of an E10.5 mouse embryo. (b,c) Sections at B and C in (a)
Supplementary Table 1. The primers used for quantitative RT-PCR. Gene name Forward (5 > 3 ) Reverse (5 > 3 )
 Reverse (5 > 3 )") 770 771 Supplementary Table 1. The primers used for quantitative RT-PCR. Gene name Forward (5 > 3 ) Reverse (5 > 3 ) Human CXCL1 GCGCCCAAACCGAAGTCATA ATGGGGGATGCAGGATTGAG PF4 CCCCACTGCCCAACTGATAG TTCTTGTACAGCGGGGCTTG
770 771 Supplementary Table 1. The primers used for quantitative RT-PCR. Gene name Forward (5 > 3 ) Reverse (5 > 3 ) Human CXCL1 GCGCCCAAACCGAAGTCATA ATGGGGGATGCAGGATTGAG PF4 CCCCACTGCCCAACTGATAG TTCTTGTACAGCGGGGCTTG
Expanded View Figures
 PEX13 functions in selective autophagy Ming Y Lee et al Expanded View Figures Figure EV1. PEX13 is required for Sindbis virophagy. A, B Quantification of mcherry-capsid puncta per cell (A) and GFP-LC3
Supplementary Data Cyclophilin B Supports Myc and Mutant p53 Dependent Survival of Glioblastoma Multiforme Cells
 Supplementary Data Cyclophilin B Supports Myc and Mutant p53 Dependent Survival of Glioblastoma Multiforme Cells Jae Won Choi, Mark A. Schroeder, Jann N. Sarkaria, and Richard J. Bram 1 Figure S1. Pharmacological
Silencing neurotransmission with membrane-tethered toxins
 nature methods Silencing neurotransmission with membrane-tethered toxins Sebastian Auer, Annika S Stürzebecher, René Jüttner, Julio Santos-Torres, Christina Hanack, Silke Frahm, Beate Liehl & Inés Ibañez-Tallon
GFP/Iba1/GFAP. Brain. Liver. Kidney. Lung. Hoechst/Iba1/TLR9!
 Supplementary information a +KA Relative expression d! Tlr9 5!! 5! NSC Neuron Astrocyte Microglia! 5! Tlr7!!!! NSC Neuron Astrocyte! GFP/Sβ/! Iba/Hoechst Microglia e Hoechst/Iba/TLR9! GFP/Iba/GFAP f Brain
MicroRNA sponges: competitive inhibitors of small RNAs in mammalian cells
 MicroRNA sponges: competitive inhibitors of small RNAs in mammalian cells Margaret S Ebert, Joel R Neilson & Phillip A Sharp Supplementary figures and text: Supplementary Figure 1. Effect of sponges on
Nature Neuroscience: doi: /nn.2275
 Supplementary Figure S1. The presence of MeCP2 in enriched primary glial cultures from rat or mouse brains is not neuronal. Western blot analysis of protein extracts from (a) rat glial and neuronal cultures.
Supplementary Information Supplementary Fig. 1. Elevated Usp9x in melanoma and NRAS mutant melanoma cells are dependent on NRAS for 3D growth.
 Supplementary Information Supplementary Fig. 1. Elevated Usp9x in melanoma and NRAS mutant melanoma cells are dependent on NRAS for 3D growth. a. Immunoblot for Usp9x protein in NRAS mutant melanoma cells
(A) RT-PCR for components of the Shh/Gli pathway in normal fetus cell (MRC-5) and a
 RT-PCR for components of the Shh/Gli pathway in normal fetus cell (MRC-5) and a") Supplementary figure legends Supplementary Figure 1. Expression of Shh signaling components in a panel of gastric cancer. (A) RT-PCR for components of the Shh/Gli pathway in normal fetus cell (MRC-5) and
Supplementary figure legends Supplementary Figure 1. Expression of Shh signaling components in a panel of gastric cancer. (A) RT-PCR for components of the Shh/Gli pathway in normal fetus cell (MRC-5) and
SUPPLEMENTARY DATA. Supplementary Table 1. Primer sequences for qrt-pcr
 Supplementary Table 1. Primer sequences for qrt-pcr Gene PRDM16 UCP1 PGC1α Dio2 Elovl3 Cidea Cox8b PPARγ AP2 mttfam CyCs Nampt NRF1 16s-rRNA Hexokinase 2, intron 9 β-actin Primer Sequences 5'-CCA CCA GCG
Supplemental Information. Tissue Myeloid Progenitors Differentiate. into Pericytes through TGF-b Signaling. in Developing Skin Vasculature
 Cell Reports, Volume 18 Supplemental Information Tissue Myeloid Progenitors Differentiate into Pericytes through TGF-b Signaling in Developing Skin Vasculature Tomoko Yamazaki, Ani Nalbandian, Yutaka Uchida,
Supplemental Data. TGF-β-mediated mir-181a expression promotes breast cancer metastasis by targeting Bim.
 Supplemental Data TGF-β-mediated mir-181a expression promotes breast cancer metastasis by targeting Bim. Molly A. Taylor 1, Khalid Sossey-Alaoui 2, Cheryl L. Thompson 3, David Danielpour 4, and William
Control of CNS Cell-Fate Decisions by SHP-2 and Its Dysregulation in Noonan Syndrome
 Article Control of CNS Cell-Fate Decisions by SHP-2 and Its Dysregulation in Noonan Syndrome Andrée S. Gauthier, 1,2,3 Olivia Furstoss, 1,2 Toshiyuki Araki, 5 Richard Chan, 5 Benjamin G. Neel, 5 David
Nature Structural and Molecular Biology: doi: /nsmb Supplementary Figure 1
 Supplementary Figure 1 Mutational analysis of the SA2-Scc1 interaction in vitro and in human cells. (a) Autoradiograph (top) and Coomassie stained gel (bottom) of 35 S-labeled Myc-SA2 proteins (input)
Cesarini et al., http ://www.jcb.org /cgi /content /full /jcb /DC1
 Supplemental material JCB Cesarini et al., http ://www.jcb.org /cgi /content /full /jcb.201504035 /DC1 THE JOU RNAL OF CELL BIO LOGY Figure S1. Lamin A/C depletion generates two distinct phenotypes in
Probe. Hind III Q,!?R'!! /0!!!!D1"?R'! vector. Homologous recombination
 Supple-Zhang Page 1 Wild-type locus Targeting construct Targeted allele Exon Exon3 Exon Probe P1 P P3 FRT FRT loxp loxp neo vector amh I Homologous recombination neo P1 P P3 FLPe recombination Q,!?R'!!
Supplementary Materials for
 www.sciencesignaling.org/cgi/content/full/7/308/ra4/dc1 Supplementary Materials for Antipsychotics Activate mtorc1-dependent Translation to Enhance Neuronal Morphological Complexity Heather Bowling, Guoan
Supporting Information
 Supporting Information Franco et al. 10.1073/pnas.1015557108 SI Materials and Methods Drug Administration. PD352901 was dissolved in 0.5% (wt/vol) hydroxyl-propyl-methylcellulose, 0.2% (vol/vol) Tween