Nature Neuroscience: doi: /nn Supplementary Figure 1
|
|
|
- Ethelbert Bell
- 6 years ago
- Views:
Transcription
 for the indicated times followed by Western blot with the indicated antibodies.")
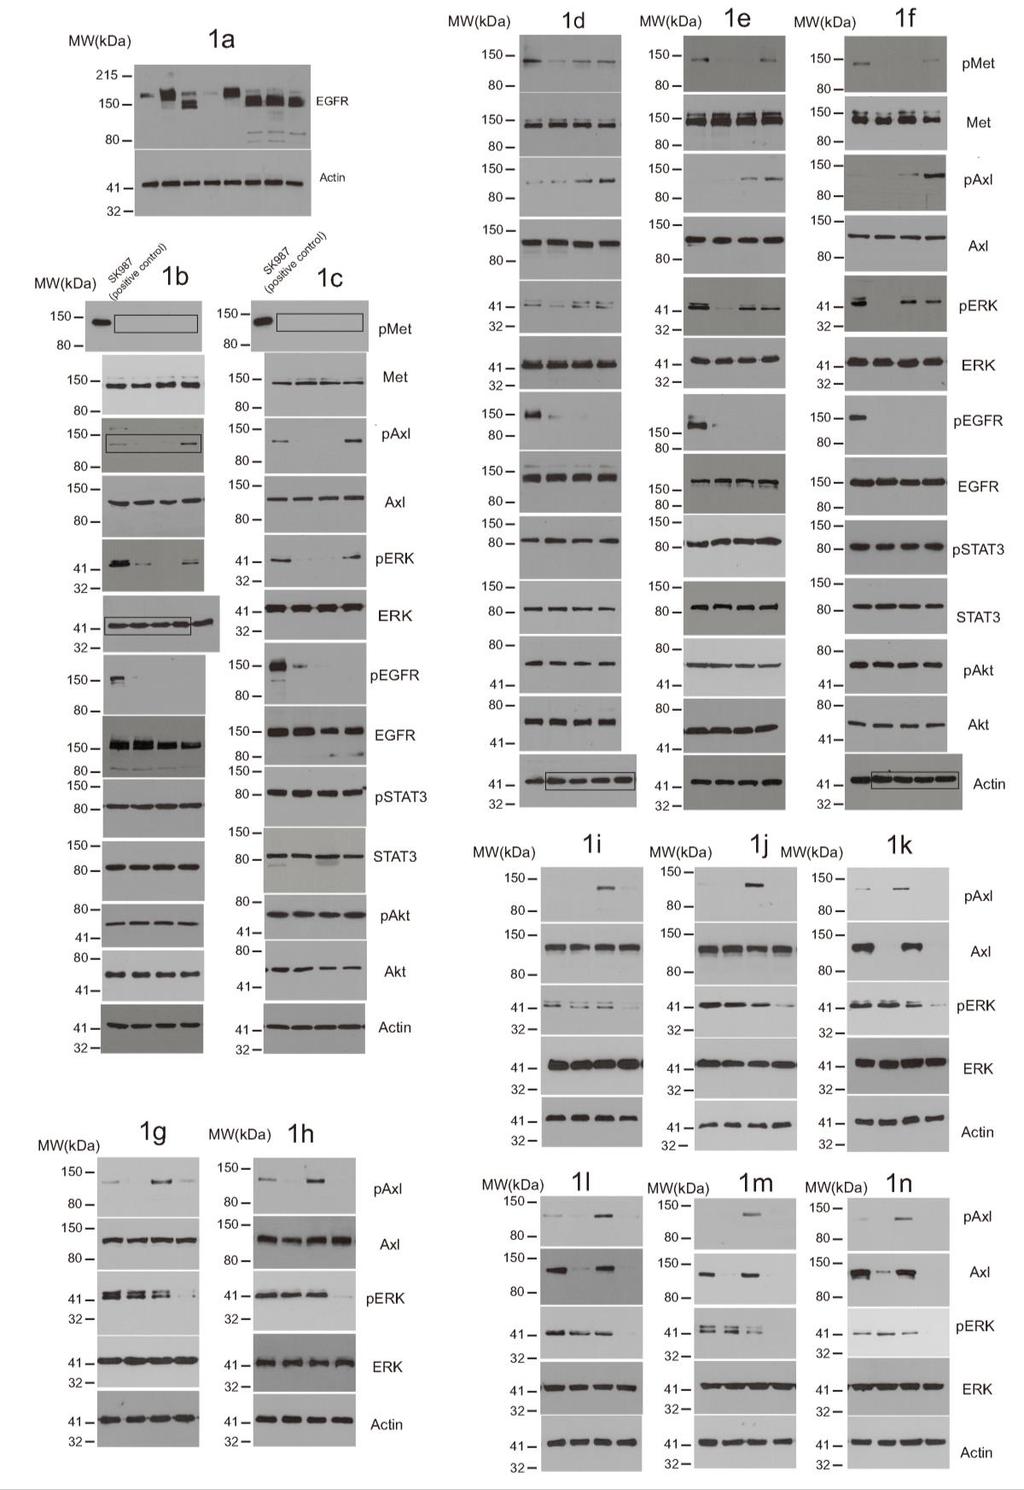
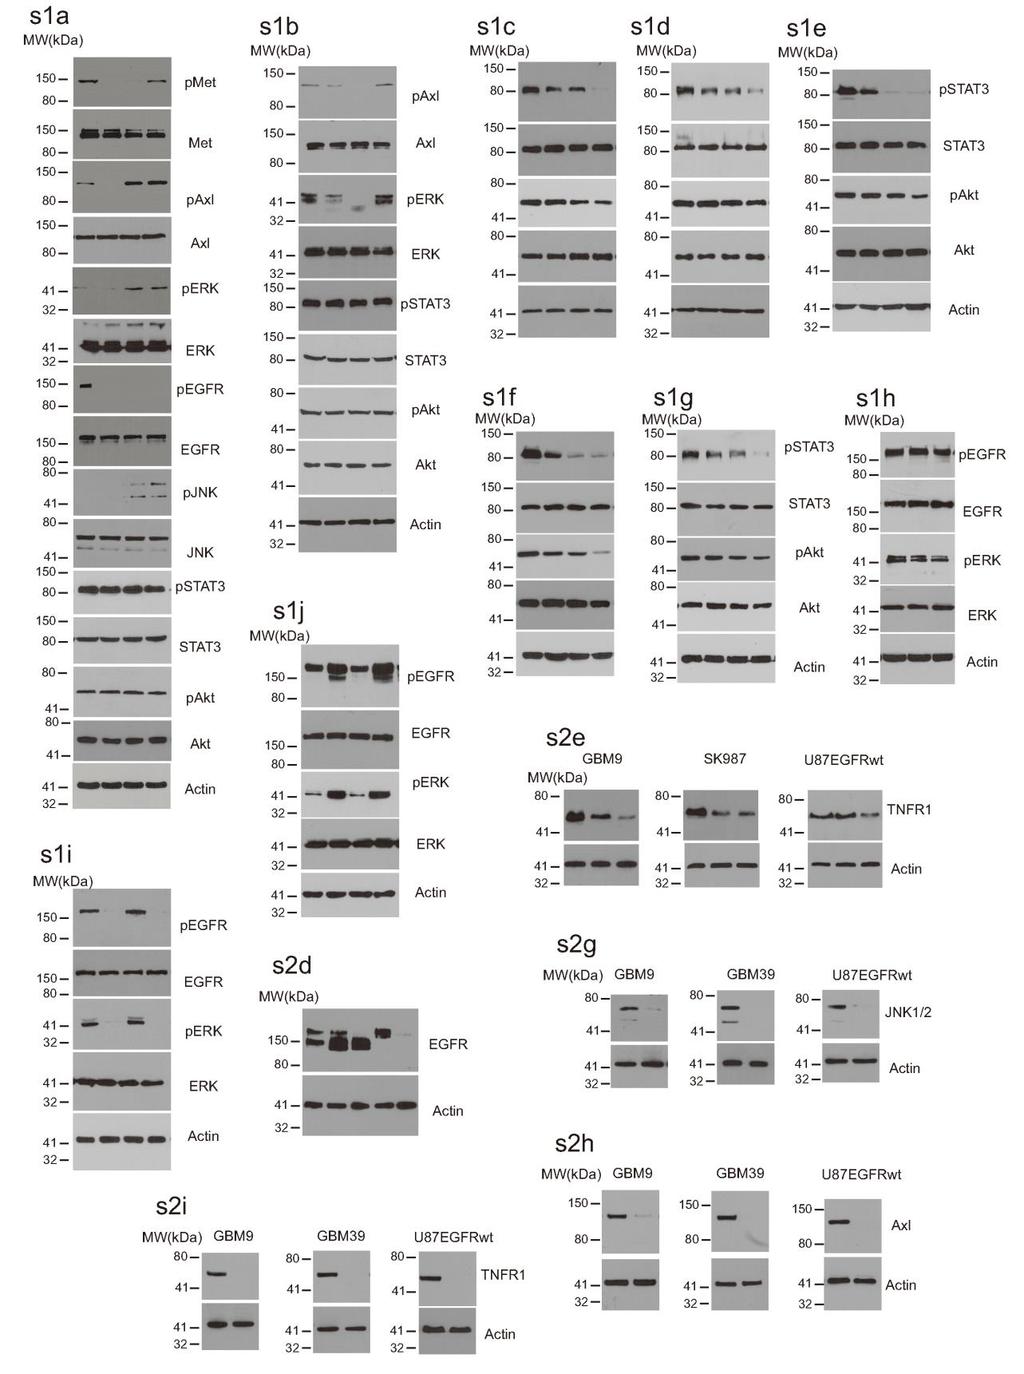
1 Supplementary Figure 1 EGFR inhibition activates signaling pathways (a-b) EGFR inhibition activates signaling pathways (a) U251EGFR cells were treated with erlotinib (1µM) for the indicated times followed by Western blot with the indicated antibodies. (b) GBM9 neurospheres were treated with afatinib (100nM) for the indicated
2 time points followed by Western blot with the indicated antibodies. (c-g) EGFR inhibition decreases pstat3 and pakt activation. Glioma cells were treated with high dosage of erlotinib (10µM) or afatinib (10µM). Western blot showing that pstat3 and pakt decrease upon treatment with erlotinib or afatinib. Western blots are representative of at least three independent replicates. (h-j) perk is activated in U87EGFRwt and blocked by cetuximab. (h) U87EGFRwt cells were cultured in medium with (10%) or without serum in DMEM. perk is activated under both conditions. (i) Cells were serum starved and treated overnight with cetuximab (100 µg/ml). Cetuximab treatment blocks both EGFR and ERK activation. (j) Cells were treated wtith EGF (50 ng/ml) for 15 min. EGF increases perk level in U87EGFRwt cells. SF:Serum free. Western blots are representative of at least three independent replicates. Full-length blots are presented in Supplementary Figure 15.
3 Supplementary Figure 2
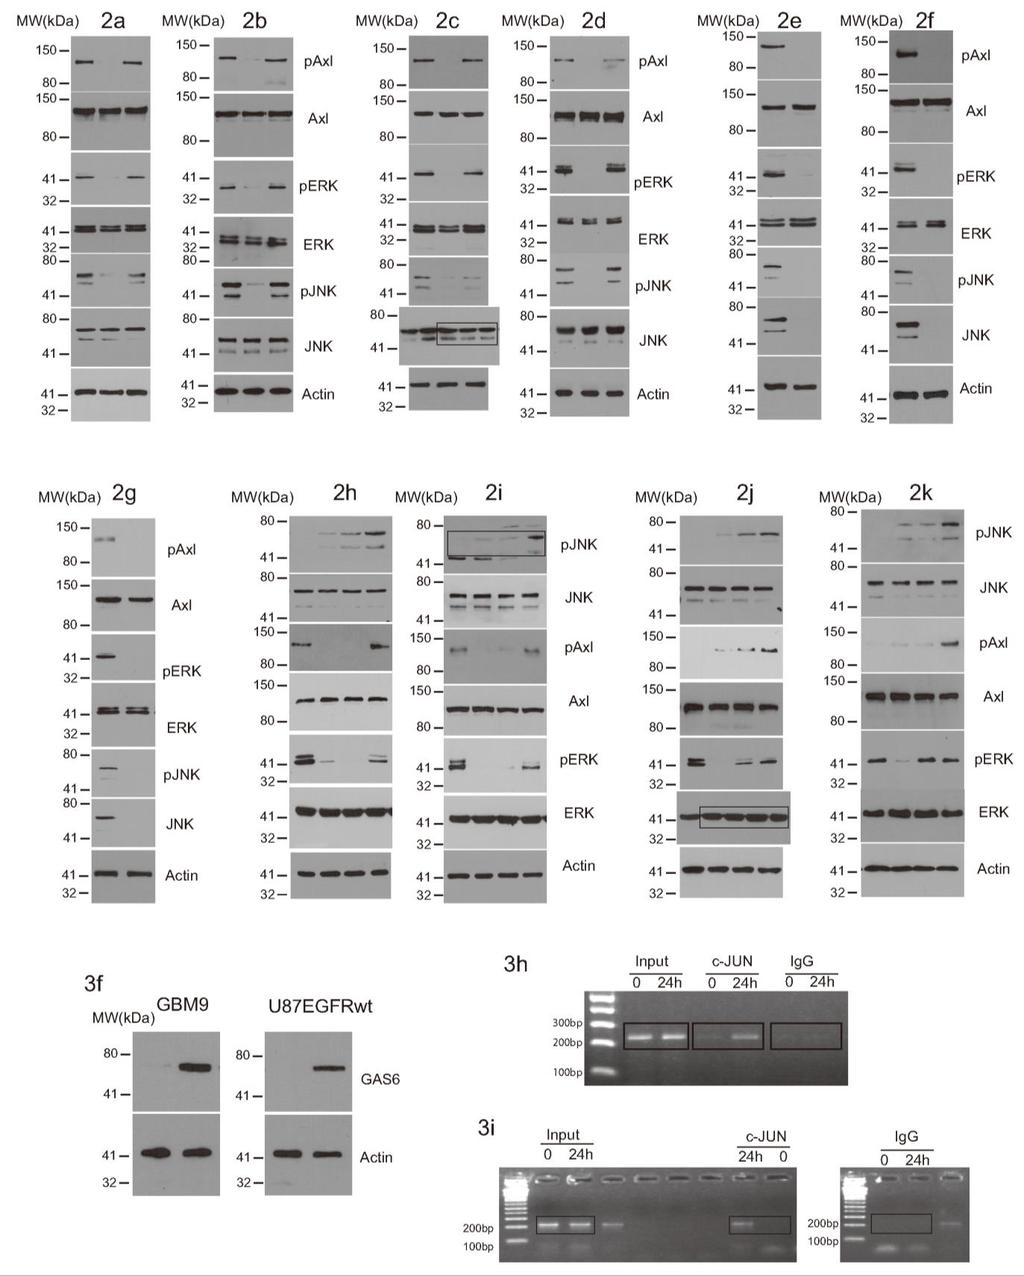
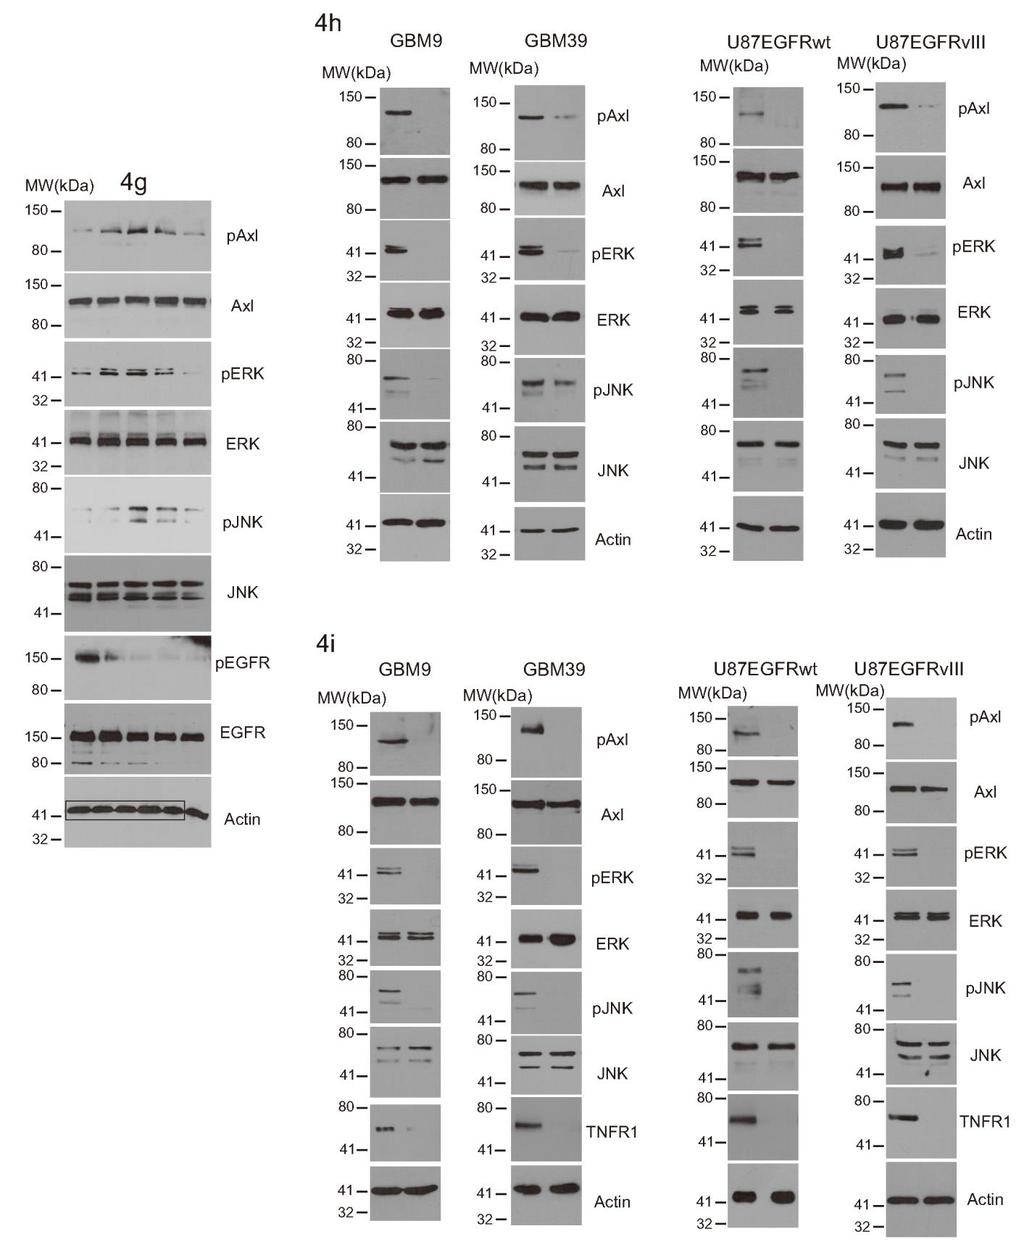
4 Intracellular signaling networks and biological responses to EGFR inhibition in glioma cells. (a-b) EGFR inhibition does not activate NF- B transcriptional activity. (a) A luciferase reporter assay shows that EGFR inhibition with erlotinib does not result in an increase in NF- B reporter activity in GBM9 neurospheres and U87EGFRwt cells. Erlotinib was used for 24h at a concentration of 100 nm for GBM9 neurospheres and 1uM for U87EGFRwt cells. GBM9: Ctrl vs erlotinib: P =0.88, t=0.16, d.f.=4; U87EGFRwt: Ctrl vs erlotinib: P =0.60, t=0.57, d.f.=4. (b) As a positive control we used LPS (1µg/ml) which activates the NF- B reporter. Renilla luciferase was used as an internal control. Ctrl vs LPS: P =0.0012, t=8.27, d.f.=4. Data are presented as mean±s.e.m; **P < 0.01 from two-tailed unpaired Student's t-test ( n = 3 biologically independent experimental replicates). n.s. not significant. (c-d) Upregulation of TNF in response to EGFR inhibition in multiple patient derived samples and established cell lines. (c) SK987, SK748. SK1422, and GBM622 are patient derived primary GBM cells cultured as neurospheres and treated with erlotinib (100nM) for 24h followed by extraction of RNA and qrt-pcr for TNF. SB19vIII and U251EGFRwt cells are established GBM cell lines that were treated with erlotinib (1µM) for 24h followed by qrt-pcr for TNF. SB19vIII: Ctrl vs Erlotinib: P =0.0014,t=7.88, d.f.=4; SK987: Ctrl vs erlotinib: P =0.0024,t=6.83, d.f.=4; SK748: Ctrl vs Erlotinib: P =0.0019, t=7.32, d.f.=4; SK1422: Ctrl vs erlotinib: P =0.0030,t=6.45, d.f.=4; GBM622: Ctrl vs erlotinib: P =0.21,t=1.5, d.f.=4; U251EGFRwt: Ctrl vs erlotinib: P =0.0005, t=10.4, d.f.=4. Data are presented as mean±s.e.m; **P < 0.01, ***P<0.001 from two-tailed unpaired Student's t-test ( n = 3 biologically independent experimental replicates). n.s. not significant. (d) Western blot showing EGFR levels in various neurospheres and cell lines. No increase in TNF is detected in GBM622 cells expressing a very low level of EGFR. Western blots are representative of at least three independent replicates. Fulllength blots are presented in Supplementary Figure 15. (e) Downregulation of TNFR1 in response to EGFR inhibition in patient derived primary GBM neurosphere cultures and established cell lines. GBM9, SK987 and U87EGFRwt cells were treated with erlotinib for the indicated time points followed by Western blot with TNFR1 antibodies. Erlotinib was used at a concentration of 100 nm for GBM9 and SK987 and 1uM for U87EGFRwt cells. Western blots are representative of at least three independent replicates. (f) EGFR inhibition induced effects on cell viability are influenced by specific inhibitors of downstream signaling pathways. In this experiment primary GBM9 neurospheres were exposed to various inhibitors alone or in combination with erlotinib (100 nm) for 72h followed by Alamarblue Cell Viability assay. The concentrations of the various drugs were: SB (10uM), SP (1uM), U0126 (1uM), BMS (10uM), XL765 (10uM), Necrostatin-1 (300nM). Erlotinib vs erlotinib +SP600125: P =0.0001,t=14.96, d.f.=4; Erlotinib vs erlotinib +U0126: P =0.0018, t=7.42, d.f.=4. Data are presented as mean±s.e.m; **P < 0.01, ***P<0.001 from two-tailed unpaired Student's t- test ( n = 3 biologically independent experimental replicates). (g-i) Western blot showing efficient silencing of JNK1/2, Axl and TNFR1. For cell viability experiments involving sirna knockdown of JNK1/2, Axl and TNFR1, we confirmed silencing by Western blot. Western blots are representative of at least three independent replicates. Full-length blots are presented in Supplementary Figure 15.
5 Supplementary Figure 3 EGFR inhibition induces a biologically significant upregulation of TNF in glioma cells.
6 (a-b) Thalidomide blocks EGFR inhibition induced upregulation of TNF. Patient derived GBM9 neurospheres or established GBM cell line U87EGFRwt cells were treated with erlotinib with or without thalidomide (1µM) followed by collection of supernatants and TNF ELISA. (a) Erlotinib vs erlotinib +thalidomide: P =0.0015, t=7.77, d.f.=4. (b) Erlotinib vs erlotinib +thalidomide: P =0.0008, t=8.98, d.f.=4. Data are presented as mean±s.e.m; **P < 0.01, ***P<0.001 from two-tailed unpaired Student's t-test ( n = 3 biologically independent experimental replicates). (c-d) A neutralizing antibody to TNF sensitizes cells to EGFR inhibition. Patient derived GBM9 neurospheres or established GBM cell line U87EGFRwt cells were exposed to erlotinib plus either normal mouse IgG (Ctrl) or a neutralizing antibody to TNF. The TNF neutralizing antibody sensitizes cells to EGFR inhibition as shown by the Alamarblue Cell Viability assay. (c) Erlotinib vs erlotinib+tnf Ab: P =0.0013,t=8.07, d.f.=4. (d) Erlotinib vs erlotinib+tnf Ab: P =0.0012, t=8.13, d.f.=4. Data are presented as mean±s.e.m; **P < 0.01 from two-tailed unpaired Student's t-test ( n =3 biologically independent experimental replicates). (e-f) Thalidomide sensitizes patient derived primary GBM9 and GBM39 neurospheres to EGFR inhibiton. GBM9 or GBM39 neurospheres were exposed to EGFR inhibition using afatinib (100nM) and thalidomide (1µM) alone or in combination concurrently for 72h followed by Alamarblue Cell Viability Assay. DMSO was used as a control (Ctrl). (e) Afatinib vs afatinib+thalidomide: P =0.0001,t=14.47, d.f.=4. (f) Afatinib vs afatinib+thalidomide: P =0.0005, t=10.4, d.f.=4. Data are presented as mean±s.e.m; ***P<0.001 from two-tailed unpaired Student's t-test ( n =3 biologically independent experimental replicates).
7 Supplementary Figure 4 Inhibition of JNK and ERK sensitizes glioma cells to EGFR inhibition. (a-b) GBM9 cells were treated with erlotinib and/or JNK inhibitor SP (1µM), ERK inhibitor U0126 (1µM) for 72 hours followed by Annexin-FACS assay. Unstained cells represent viable cells. Annexin positive cells are undergoing apoptosis. PI (Propidium iodide)
8 positive cells are undergoing late apoptosis. In Control cells are treated with control vehicle (DMSO). The combination treatment decreases the number of viable cells and there is an increase in double stained cells (Annexin+PI Positive). (b) Unstained: Erlotinib vs Erlotinib+SP600125: P =0.0008, t=9.10, d.f.=4; Erlotinib vs erlotinib+u0126: P =0.0036, t=6.14, d.f.=4. Annexin+PI: Erlotinib vs erlotinib+sp600125: P =0.0003, t=11.37, d.f.=4; Erlotinib vs erlotinib+u0126: P =0.0021,t=7.04, d.f.=4. (c-d) A similar experiment was conducted in U87EGFR cells with a similar result. (d) Unstained: Erlotinib vs erlotinib+sp600125: P =0.0045, t=5.77, d.f.=4; Erlotinib vs erlotinib+u0126: P =0.0013,t=8.06, d.f.=4. Annexin+PI: Erlotinib vs erlotinib+sp600125: P =0.0017, t=7.53, d.f.=4; Erlotinib vs erlotinib+u0126: P =0.0006, t=10.04, d.f.=4. Data are presented as mean±s.e.m; **P<0.01, ***P<0.001 using two-tailed unpaired Student's t-test ( n =3 biologically independent experimental replicates).
9 Supplementary Figure 5 Axl and TNF inhibition renders glioma cells sensitive to EGFR inhibition.
10 (a-b) GBM9 cells were treated with erlotinib and/or Axl inhibitor R428 (1µM), Thalidomide (1µM) for 72 hours followed by Annexin- FACS assay. Unstained cells represent viable cells. Annexin positive cells are undergoing apoptosis. PI (Propidium iodide) positive cells are undergoing late apoptosis. In Control cells are treated with control vehicle (DMSO). The combination treatment decreases the number of viable cells and there is an increase in both PI and double stained cells (Annexin+PI Positive). (b) Unstained: Erlotinib vs erlotinib+r428: P =0.0051,t=5.58, d.f.=4; Erlotinib vs erlotinib+thalidomide: P =0.0009,t=8.75, d.f.=4. Annexin+PI: Erlotinib vs erlotinib+r428: P =0.015, t=4.10, d.f.=4; Erlotinib vs erlotinib+thalidomide: P =0.0011,t=8.32, d.f.=4. (c-d) A similar experiment was conducted in U87EGFR cells with a similar result. (d) Unstained: Erlotinib vs erlotinib+r428: P =0.0045, t=5.71, d.f.=4; Erlotinib vs erlotinib+thalidomide: P =0.0036, t=6.13, d.f.=4. Annexin+PI: Erlotinib vs erlotinib+r428: P =0.0014, t=7.83, d.f.=4; Erlotinib vs erlotinib+thalidomide: P =0.0022, t=6.98, d.f.=4. Data are presented as mean±s.e.m; *P<0.05, **P<0.01, ***P<0.001 using two-tailed unpaired Student's t-test ( n =3 biologically independent experimental replicates).
11 Supplementary Figure 6 Etanercept renders glioma cells sensitive to EGFR inhibition.
12 (a-b) GBM9 cells were treated with erlotinib and/or enbrel (1µM) for 72 hours followed by Annexin-FACS assay. Unstained cells represent viable cells. Annexin positive cells are undergoing apoptosis. PI (Propidium iodide) positive cells are undergoing late apoptosis. In Control cells are treated with control vehicle (DMSO). The combination treatment decreases the number of viable cells and there is an increase in double stained cells (Annexin+PI Positive). (b) Unstained: Erlotinib vs erlotinib+enbrel: P =0.0008, t=9.11, d.f.=4; Annexin+PI: Erlotinib vs erlotinib+enbrel: P=0.0012, t=8.18, d.f.=4. (c-d) A similar experiment was conducted in U87EGFRwt cells with a similar result. (d) Unstained: Erlotinib vs erlotinib+enbrel: P =0.0006, t=9.6, d.f.=4; Annexin+PI: Erlotinib vs erlotinib+enbrel: P =0.0003, t=11.34, d.f.=4. Data are presented as mean±s.e.m; **P<0.01, ***P<0.001 using two-tailed unpaired Student's t-test ( n =3 biologically independent experimental replicates).
13 Supplementary Figure 7 Combination treatment increases caspase 3/7 activity in glioma cells.
14 (a) GBM9 cells were treated by erlotinib and/or SP600125, U1026 for 72 hours followed by Caspase-Glo 3/7 Assay. Caspase3/7 activity was evaluated in GBM9 cells exposed to erlotinib plus SP Similar results were obtained using a combination of erlotinib and U1026. Erlotinib vs erlotinib+sp600125: P =0.001, t=8.66, d.f.=4; Erlotinib vs erlotinib+u0126: P =0.0002, t=13.24, d.f.=4. Similar procedures were performed in b-f and similar results were obtained. (b) Erlotinib vs erlotinib+r428: P =0.0004, t=10.76, d.f.=4; Erlotinib vs erlotinib+thalidomide: P=0.0004, t=10.64, d.f.=4. (c) Erlotinib vs erlotinib+sp600125: P<0.0001, t=21.41, d.f.=4; Erlotinib vs erlotinib+u1026: P =0.0007, t=9.49, d.f.=4. (d) Erlotinib vs erlotinib+r428: P=0.0001, t=14.8, d.f.=4; Erlotinib vs erlotinib+t: P <0.0001, t=16.77, d.f.=4. (e) Erlotinib vs erlotinib+enbrel: P =0.0096, t=8.72, d.f.=4. (f) Erlotinib vs erlotinib+enbrel: P =0.0017, t=7.43, d.f.=4. Data are presented as mean±s.e.m; **P<0.01, ***P<0.001, ****P< from two-tailed unpaired Student's t-test ( n =3 biologically independent experimental replicates).
15 Supplementary Figure 8 Combination treatment inhibits glioma cell proliferation.
16 (a) GBM9 cells were plated in 6 well plated and treated with drugs as indicated. Cell proliferation was measured through cell counting using the trypan blue dye exclusion test. A combination of erlotinib and SP (SP) significantly reduces cell growth after 72 hours. Similar results were shown using a combination of erlotinb and U1026 (U). Erlotinib vs erlotinib+sp: P =0.0016, t=7.60, d.f.=4; Erlotinib vs erlotinib+u: P =0.0012, t=8.24, d.f.=4. Similar procedures were performed in b-f and similar results were obtained. (b) Erlotinib vs erlotinib+r428: P =0.0008, t=9.24, d.f.=4; Erlotinib vs erlotinib+t: P =0.0004, t=11.18, d.f.=4. (c) Erlotinib vs erlotinib+sp: P =0.0004, t=10.78, d.f.=4; Erlotinib vs erlotinib+u: P =0.0014, t=7.85, d.f.=4. (d) Erlotinib vs erlotinib+r428: P =0.001, t=8.62, d.f.=4; Erlotinib vs erlotinib+t: P =0.0003, t=11.58, d.f.=4. (e) Erlotinib vs erlotinib+enbrel: P =0.0014, t=7.85, d.f.=4. (f) Erlotinib vs erlotinib+enbrel: P =0.0005, t=10.37, d.f.=4. SP: SP600125; U:U0126; T: Thalidomide. Data are presented as mean±s.e.m; **P<0.01, ***P<0.001 from two-tailed unpaired Student's t-test ( n =3 biologically independent experimental replicates).
17 Supplementary Figure 9
18 TNF inhibition sensitizes mouse tumors to EGFR inhibition with afatinib in vivo. (a) Combined treatment of afatinib and thalidomide prolonged survival and suppressed tumor growth in an orthotropic model. Kaplan- Maier survival curves were calculated using GraphPad Prism 7. Statistical significance verified by the log rank test, P=0.0015,**P<0.01. (b) Representative bioluminescence images from afatinib and afatinib plus thalidomide group at day 1, 10 and 20 post-treatment. Since all mice in vehicle and thalidomide group died within 20 days after transplant, images at day 20 post-treatment were not available. (c-d) Body weight of xenograft mice were monitored regularly and recorded every 2 days. No significant change of body weight was observed in subcutaneous mouse model between groups. (e) Body weight of orthotopic models. Body weight losses are found in vehicle, erlotinib and thalidomide group but not in combination therapy (erlotinib+thalidomide). Erlotinib vs erlotinib+thalidmoide: P<0.0001, t=6.32, d.f.=14; (f) Similar results were obtained in orthotopic models treated by afatinib and/or thalidmide. Afatinib vs afatinib+thalidomide: P =0.0003, t=4.79, d.f.=14.

19 Supplementary Figure 10 Erlotinib treatment activates Axl JNK ERK signaling in orthotopic models; this is suppressed by TNF inhibition. (a) Immunostainig of paxl, pjnk and perk proteins from a representative brain section from vehicle, erlotinb and erlotinib plus
20 thalidomide group. Cells with brown staining are considered as positive. Erlotinib group shows higher expression of paxl, pjnk and perk compared to vehicle group, whereas thaldimide inhibits erlotinib induced paxl-pjnk-perk activation. (b-d) Semi-quantitative analysis of paxl, pjnk and perk immunostaining. Four random fields in 3 tissue blocks at x200 magnification were scored semiquantitatively as: 0=No positive staining; 1=1-25% tumor cells stained, 2=26%-75% tumor cells stained and 3=>75% tumor cells stained. Differences between treatment groups were analyzed by the Mann-Whitney U test (n=12). (b) paxl: Erlotinib vs. vehicle, p=0.0062, U=26; Erlotinib vs. erlotinib+thalidomide, p=0.0093, U=28. (c) pjnk: Erlotinib vs. vehicle, p=0.022, U=32; Erlotinib vs. erlotinib+thalidomide, p=0.014, U=29.5. (d) perk: Erlotinib vs. vehicle, p=0.0040, U=23.5; Erlotinib vs. erlotinib+thalidomide, p=0.0026, U=21.
21
22 Supplementary Figure 11 Full-length western blots. Full-length Western blots for cropped images in Fig. 1.
23 Supplementary Figure 12
24 Full-length western blots and DNA agarose gel. Full-length Western blots for cropped images in Fig. 2 and Fig. 3f, 3h, 3i.
25 Supplementary Figure 13
26 Full-length western blots. Full-length Western blots for cropped images in Fig. 4g, 4h, 4i.
27 Supplementary Figure 14
28 Full-length western blots. Full-length Western blots for cropped images in Fig. 6j-l and Fig. 7f, 7g.
29 Supplementary Figure 15
30 Full-length western blots. Full-length Western blots for cropped images in Supplementary Fig. 1 and 2d,e,g i.
Supplementary Figure 1
 Supplementary Figure 1 Constitutive EGFR signaling does not activate canonical EGFR signals (a) U251EGFRInd cells with or without tetracycline exposure (24h, 1µg/ml) were treated with EGF for 15 minutes
Supplementary Figure 1. Basal level EGFR across a panel of ESCC lines. Immunoblots demonstrate the expression of phosphorylated and total EGFR as
 Supplementary Figure 1. Basal level EGFR across a panel of ESCC lines. Immunoblots demonstrate the expression of phosphorylated and total EGFR as well as their downstream effectors across a panel of ESCC
Supplementary Information
 Supplementary Information Figure S1. Int6 gene silencing efficiency. (A) Western Blot analysis of Int6 expression at different times after sirna transfection. Int6 expression is strongly silenced in Int6
- 1 - Cell types Monocytes THP-1 cells Macrophages. LPS Treatment time (Hour) IL-6 level (pg/ml)
 IL-6 level (pg/ml)") Supplementary Table ST1: The dynamic effect of LPS on IL-6 production in monocytes and THP-1 cells after GdA treatment. Monocytes, THP-1 cells and macrophages (5x10 5 ) were incubated with 10 μg/ml of
Supplementary Table ST1: The dynamic effect of LPS on IL-6 production in monocytes and THP-1 cells after GdA treatment. Monocytes, THP-1 cells and macrophages (5x10 5 ) were incubated with 10 μg/ml of
Supplementary fig. 1. Crystals induce necroptosis does not involve caspases, TNF receptor or NLRP3. A. Mouse tubular epithelial cells were pretreated
 Supplementary fig. 1. Crystals induce necroptosis does not involve caspases, TNF receptor or NLRP3. A. Mouse tubular epithelial cells were pretreated with zvad-fmk (10µM) and exposed to calcium oxalate
Supplementary Fig. 1. GPRC5A post-transcriptionally down-regulates EGFR expression. (a) Plot of the changes in steady state mrna levels versus
 Plot of the changes in steady state mrna levels versus") Supplementary Fig. 1. GPRC5A post-transcriptionally down-regulates EGFR expression. (a) Plot of the changes in steady state mrna levels versus changes in corresponding proteins between wild type and Gprc5a-/-
Supplementary Fig. 1. GPRC5A post-transcriptionally down-regulates EGFR expression. (a) Plot of the changes in steady state mrna levels versus changes in corresponding proteins between wild type and Gprc5a-/-
Supplementary Fig. 1 p38 MAPK negatively regulates DC differentiation. (a) Western blot analysis of p38 isoform expression in BM cells, immature DCs
 Western blot analysis of p38 isoform expression in BM cells, immature DCs") Supplementary Fig. 1 p38 MAPK negatively regulates DC differentiation. (a) Western blot analysis of p38 isoform expression in BM cells, immature DCs (idcs) and mature DCs (mdcs). A myeloma cell line expressing
Supplementary Fig. 1 p38 MAPK negatively regulates DC differentiation. (a) Western blot analysis of p38 isoform expression in BM cells, immature DCs (idcs) and mature DCs (mdcs). A myeloma cell line expressing
SUPPLEMENTARY INFORMATION
 DOI: 10.1038/ncb2607 Figure S1 Elf5 loss promotes EMT in mammary epithelium while Elf5 overexpression inhibits TGFβ induced EMT. (a, c) Different confocal slices through the Z stack image. (b, d) 3D rendering
SUPPLEMENTARY FIGURES AND TABLES
 SUPPLEMENTARY FIGURES AND TABLES Supplementary Figure S1: CaSR expression in neuroblastoma models. A. Proteins were isolated from three neuroblastoma cell lines and from the liver metastasis of a MYCN-non
Supplementary Figure S I: Effects of D4F on body weight and serum lipids in apoe -/- mice.
 Supplementary Figures: Supplementary Figure S I: Effects of D4F on body weight and serum lipids in apoe -/- mice. Male apoe -/- mice were fed a high-fat diet for 8 weeks, and given PBS (model group) or
Title:Role of LPAR3, PKC and EGFR in LPA-induced cell migration in oral squamous carcinoma cells
 Author's response to reviews Title:Role of LPAR3, PKC and EGFR in LPA-induced cell migration in oral squamous carcinoma cells Authors: Ingvild J Brusevold (i.j.brusevold@medisin.uio.no) Ingun H Tveteraas
Type of file: PDF Size of file: 0 KB Title of file for HTML: Supplementary Information Description: Supplementary Figures
 Type of file: PDF Size of file: 0 KB Title of file for HTML: Supplementary Information Description: Supplementary Figures Supplementary Figure 1 mir-128-3p is highly expressed in chemoresistant, metastatic
Figures S1-S5, Figure Legends, Table S1 List of primers used in the study
 Insulin receptor alternative splicing is regulated by insulin signaling and modulates beta cell survival Pushkar Malakar,4, Lital Chartarifsky,4, Ayat Hija, Gil Leibowitz 3, Benjamin Glaser 3, Yuval Dor,
Supporting Information. FADD regulates NF-кB activation and promotes ubiquitination of cflip L to induce. apoptosis
 1 2 Supporting Information 3 4 5 FADD regulates NF-кB activation and promotes ubiquitination of cflip L to induce apoptosis 6 7 Kishu Ranjan and Chandramani Pathak* 8 9 Department of Cell Biology, School
mtor Inhibition Specifically Sensitizes Colorectal Cancers with KRAS or BRAF Mutations to BCL-2/BCL-
 Supplementary Material for mtor Inhibition Specifically Sensitizes Colorectal Cancers with KRAS or BRAF Mutations to BCL-2/BCL- XL Inhibition by Suppressing MCL-1 Anthony C. Faber 1,2 *, Erin M. Coffee
PID1 increases chemotherapy-induced apoptosis in medulloblastoma and glioblastoma cells in a manner that involves NFκB
 SUPPLEMENTARY FIGURES: PID1 increases chemotherapy-induced apoptosis in medulloblastoma and glioblastoma cells in a manner that involves NFκB Jingying Xu, Xiuhai Ren, Anup Singh Pathania, G. Esteban Fernandez,
Programmed necrosis, not apoptosis, is a key mediator of cell loss and DAMP-mediated inflammation in dsrna-induced retinal degeneration
 Programmed necrosis, not apoptosis, is a key mediator of cell loss and DAMP-mediated inflammation in dsrna-induced retinal degeneration The Harvard community has made this article openly available. Please
Supplementary Figure 1: Digitoxin induces apoptosis in primary human melanoma cells but not in normal melanocytes, which express lower levels of the
 Supplementary Figure 1: Digitoxin induces apoptosis in primary human melanoma cells but not in normal melanocytes, which express lower levels of the cardiac glycoside target, ATP1A1. (a) The percentage
SHREE ET AL, SUPPLEMENTAL MATERIALS. (A) Workflow for tumor cell line derivation and orthotopic implantation.
 Workflow for tumor cell line derivation and orthotopic implantation.") SHREE ET AL, SUPPLEMENTAL MATERIALS SUPPLEMENTAL FIGURE AND TABLE LEGENDS Supplemental Figure 1. Derivation and characterization of TS1-TGL and TS2-TGL PyMT cell lines and development of an orthotopic
SHREE ET AL, SUPPLEMENTAL MATERIALS SUPPLEMENTAL FIGURE AND TABLE LEGENDS Supplemental Figure 1. Derivation and characterization of TS1-TGL and TS2-TGL PyMT cell lines and development of an orthotopic
Supplementary Information
 Supplementary Information mediates STAT3 activation at retromer-positive structures to promote colitis and colitis-associated carcinogenesis Zhang et al. a b d e g h Rel. Luc. Act. Rel. mrna Rel. mrna
HCC1937 is the HCC1937-pcDNA3 cell line, which was derived from a breast cancer with a mutation
 SUPPLEMENTARY INFORMATION Materials and Methods Human cell lines and culture conditions HCC1937 is the HCC1937-pcDNA3 cell line, which was derived from a breast cancer with a mutation in exon 20 of BRCA1
ANGPTL2 increases bone metastasis of breast cancer cells through. Tetsuro Masuda, Motoyoshi Endo, Yutaka Yamamoto, Haruki Odagiri, Tsuyoshi
 Masuda et al. Supplementary information for ANGPTL2 increases bone metastasis of breast cancer cells through enhancing CXCR4 signaling Tetsuro Masuda, Motoyoshi Endo, Yutaka Yamamoto, Haruki Odagiri, Tsuyoshi
SUPPLEMENTARY INFORMATION
 DOI: 10.1038/ncb3461 In the format provided by the authors and unedited. Supplementary Figure 1 (associated to Figure 1). Cpeb4 gene-targeted mice develop liver steatosis. a, Immunoblot displaying CPEB4
HEK293FT cells were transiently transfected with reporters, N3-ICD construct and
 Supplementary Information Luciferase reporter assay HEK293FT cells were transiently transfected with reporters, N3-ICD construct and increased amounts of wild type or kinase inactive EGFR. Transfections
Figure S1. The PDE5 inhibitor sildenafil interacts with celecoxib to kill cancer cell lines. (A) Hepatoma
 Hepatoma") Figure S1. The PDE5 inhibitor sildenafil interacts with celecoxib to kill cancer cell lines. (A) Hepatoma cells were treated with celecoxib ( 5.0 M) and/or sildenafil (, 2.0 M). ls were isolated after
Figure S1. The PDE5 inhibitor sildenafil interacts with celecoxib to kill cancer cell lines. (A) Hepatoma cells were treated with celecoxib ( 5.0 M) and/or sildenafil (, 2.0 M). ls were isolated after
Intrinsic and chemo-sensitizing activity of SMAC-mimetics on high-risk childhood acute lymphoblastic leukemia
 SUPPLEMENTARY INFORMATION Intrinsic and chemo-sensitizing activity of SMAC-mimetics on high-risk childhood acute lymphoblastic leukemia Melanie Schirmer, Luca Trentin, Manon Queudeville, Felix Seyfried,
Supplemental Figure 1. Western blot analysis indicated that MIF was detected in the fractions of
 Supplemental Figure Legends Supplemental Figure 1. Western blot analysis indicated that was detected in the fractions of plasma membrane and cytosol but not in nuclear fraction isolated from Pkd1 null
Supplementary Figures
 Supplementary Figures Supplementary Figure 1. Confirmation of Dnmt1 conditional knockout out mice. a, Representative images of sorted stem (Lin - CD49f high CD24 + ), luminal (Lin - CD49f low CD24 + )
Supplementary Figure 1. A. Bar graph representing the expression levels of the 19 indicated genes in the microarrays analyses comparing human lung
 Supplementary Figure 1. A. Bar graph representing the expression levels of the 19 indicated genes in the microarrays analyses comparing human lung immortalized broncho-epithelial cells (AALE cells) expressing
Supplementary Figure 1 (Related with Figure 4). Molecular consequences of Eed deletion. (a) ChIP analysis identifies 3925 genes that are associated
. Molecular consequences of Eed deletion. (a) ChIP analysis identifies 3925 genes that are associated") Supplementary Figure 1 (Related with Figure 4). Molecular consequences of Eed deletion. (a) ChIP analysis identifies 3925 genes that are associated with the H3K27me3 mark in chondrocytes (see Table S1,
Supplementary Figure 1 (Related with Figure 4). Molecular consequences of Eed deletion. (a) ChIP analysis identifies 3925 genes that are associated with the H3K27me3 mark in chondrocytes (see Table S1,
Supplementary Figure 1. Establishment of prostacyclin-secreting hmscs. (a) PCR showed the integration of the COX-1-10aa-PGIS transgene into the
 PCR showed the integration of the COX-1-10aa-PGIS transgene into the") Supplementary Figure 1. Establishment of prostacyclin-secreting hmscs. (a) PCR showed the integration of the COX-1-10aa-PGIS transgene into the genomic DNA of hmscs (PGI2- hmscs). Native hmscs and plasmid
Supplementary Figure 1. Establishment of prostacyclin-secreting hmscs. (a) PCR showed the integration of the COX-1-10aa-PGIS transgene into the genomic DNA of hmscs (PGI2- hmscs). Native hmscs and plasmid
RAW264.7 cells stably expressing control shrna (Con) or GSK3b-specific shrna (sh-
 or GSK3b-specific shrna (sh-") 1 a b Supplementary Figure 1. Effects of GSK3b knockdown on poly I:C-induced cytokine production. RAW264.7 cells stably expressing control shrna (Con) or GSK3b-specific shrna (sh- GSK3b) were stimulated
1 a b Supplementary Figure 1. Effects of GSK3b knockdown on poly I:C-induced cytokine production. RAW264.7 cells stably expressing control shrna (Con) or GSK3b-specific shrna (sh- GSK3b) were stimulated
a. b. c. d. e. f. g. h. i. j. k. l. m. n. o. p.
 a. b. c. d. e. f. g. h. i. j. k. l. 2.5 2 1.5 1.5 IL-1β 12 8 6 4 2 IL-1β 9 8 7 6 4 3 3 2.9 IL-1β m. n. o. p. 1.8 1.6 1.4 1.2 1.8.6.4.2 6h LPS 2 15 1 5 6h LPS 2 6h LPS 6 4 3 6h LPS Supplementary Figure
Supplementary Materials for
 www.sciencesignaling.org/cgi/content/full/7/310/ra11/dc1 Supplementary Materials for STAT3 Induction of mir-146b Forms a Feedback Loop to Inhibit the NF-κB to IL-6 Signaling Axis and STAT3-Driven Cancer
Supplementary Materials for
 www.sciencesignaling.org/cgi/content/full/7/322/ra38/dc1 Supplementary Materials for Dynamic Reprogramming of Signaling Upon Met Inhibition Reveals a Mechanism of Drug Resistance in Gastric Cancer Andrea
Supplementary Figure 1. Expression of CUGBP1 in non-parenchymal liver cells treated with TGF-β
 Supplementary Figures Supplementary Figure 1. Expression of CUGBP1 in non-parenchymal liver cells treated with TGF-β and LPS. Non-parenchymal liver cells were isolated and treated with or without TGF-β
Pharmacologic inhibition of histone demethylation as a therapy for pediatric brainstem glioma
 Supplementary information for: Pharmacologic inhibition of histone demethylation as a therapy for pediatric brainstem glioma Rintaro Hashizume 1, Noemi Andor 2, Yuichiro Ihara 2, Robin Lerner 2, Haiyun
Supplementary Figure 1. IL-12 serum levels and frequency of subsets in FL patients. (A) IL-12
 IL-12") 1 Supplementary Data Figure legends Supplementary Figure 1. IL-12 serum levels and frequency of subsets in FL patients. (A) IL-12 serum levels measured by multiplex ELISA (Luminex) in FL patients before
1 Supplementary Data Figure legends Supplementary Figure 1. IL-12 serum levels and frequency of subsets in FL patients. (A) IL-12 serum levels measured by multiplex ELISA (Luminex) in FL patients before
SUPPLEMENTARY FIGURES
 SUPPLEMENTARY FIGURES Supplementary Figure S1: Fibroblast-induced elongation of cancer cells requires direct contact with living fibroblasts. A. Representative images of HT29-GFP cultured in the presence
Page 39 of 44. 8h LTA & AT h PepG & AT h LTA
 Page 39 of 44 Fig. S1 A: B: C: D: 8h LTA 8h LTA & AT7519 E: F: 8h PepG G: 8h PepG & AT7519 Fig. S1. AT7519 overrides the survival effects of lipoteichoic acid (LTA) and peptidoglycan (PepG). (A) Human
Supplementary material. Supplementary Figure legends
 Supplementary material Supplementary Figure legends Supplementary Figure 1: Senescence-associated proliferation stop in response to oncogenic N-RAS expression Proliferation of NHEM cells without (ctrl.)
X P. Supplementary Figure 1. Nature Medicine: doi: /nm Nilotinib LSK LT-HSC. Cytoplasm. Cytoplasm. Nucleus. Nucleus
 a b c Supplementary Figure 1 c-kit-apc-eflu780 Lin-FITC Flt3-Linc-Kit-APC-eflu780 LSK Sca-1-PE-Cy7 d e f CD48-APC LT-HSC CD150-PerCP-cy5.5 g h i j Cytoplasm RCC1 X Exp 5 mir 126 SPRED1 SPRED1 RAN P SPRED1
L1 on PyMT tumor cells but Py117 cells are more responsive to IFN-γ. (A) Flow
 Flow") A MHCI B PD-L1 Fold expression 8 6 4 2 Fold expression 3 2 1 No tx 1Gy 2Gy IFN Py117 Py117 Supplementary Figure 1. Radiation and IFN-γ enhance MHCI expression and PD- L1 on PyMT tumor cells but Py117 cells
A MHCI B PD-L1 Fold expression 8 6 4 2 Fold expression 3 2 1 No tx 1Gy 2Gy IFN Py117 Py117 Supplementary Figure 1. Radiation and IFN-γ enhance MHCI expression and PD- L1 on PyMT tumor cells but Py117 cells
Supplementary Information
 Supplementary Information Supplementary Figure 1. Effect of mir mimics and anti-mirs on DTPs a, Representative fluorescence microscopy images of GFP vector control or mir mimicexpressing parental and DTP
Supplementary Figure 1. Repression of hepcidin expression in the liver of mice treated with
 Supplementary Figure 1. Repression of hepcidin expression in the liver of mice treated with DMN Immunohistochemistry for hepcidin and H&E staining (left). qrt-pcr assays for hepcidin in the liver (right).
Supplementary Figure 1: si-craf but not si-braf sensitizes tumor cells to radiation.
 Supplementary Figure 1: si-craf but not si-braf sensitizes tumor cells to radiation. (a) Embryonic fibroblasts isolated from wildtype (WT), BRAF -/-, or CRAF -/- mice were irradiated (6 Gy) and DNA damage
Supplementary Materials
 Supplementary Materials Figure S1. MTT Cell viability assay. To measure the cytotoxic potential of the oxidative treatment, the MTT [3-(4,5-dimethylthiazol- 2-yl)-2,5-diphenyl tetrazolium bromide] assay
ERK1/2/MAPK pathway-dependent regulation of the telomeric factor TRF2
 ERK1/2/MAPK pathway-dependent regulation of the telomeric factor TRF2 SUPPLEMENTARY FIGURES AND TABLE Supplementary Figure S1: Conservation of the D domain throughout evolution. Alignment of TRF2 sequences
Supplementary Figure 1. BMS enhances human T cell activation in vitro in a
 Supplementary Figure 1. BMS98662 enhances human T cell activation in vitro in a concentration-dependent manner. Jurkat T cells were activated with anti-cd3 and anti-cd28 antibody in the presence of titrated
Supplementary Figure 1 IMQ-Induced Mouse Model of Psoriasis. IMQ cream was
 Supplementary Figure 1 IMQ-Induced Mouse Model of Psoriasis. IMQ cream was painted on the shaved back skin of CBL/J and BALB/c mice for consecutive days. (a, b) Phenotypic presentation of mouse back skin
Supplementary Figure 1: Tissue of Origin analysis on 152 cell lines. (a) Heatmap representation of the 30 Tissue scores for the 152 cell lines.
 Heatmap representation of the 30 Tissue scores for the 152 cell lines.") Supplementary Figure 1: Tissue of Origin analysis on 152 cell lines. (a) Heatmap representation of the 30 Tissue scores for the 152 cell lines. The scores summarize the global expression of the tissue
Supplementary Figure 1: Tissue of Origin analysis on 152 cell lines. (a) Heatmap representation of the 30 Tissue scores for the 152 cell lines. The scores summarize the global expression of the tissue
Supplementary Figure 1:
 Supplementary Figure 1: (A) Whole aortic cross-sections stained with Hematoxylin and Eosin (H&E), 7 days after porcine-pancreatic-elastase (PPE)-induced AAA compared to untreated, healthy control aortas
Fang et al. NMuMG. PyVmT unstained Anti-CCR2-PE MDA-MB MCF MCF10A
 A NMuMG PyVmT 16.5+.5 47.+7.2 Fang et al. unstained Anti-CCR2-PE 4T1 Control 37.6+6.3 56.1+.65 MCF1A 16.1+3. MCF-7 3.1+5.4 MDA-M-231 42.1+5.5 unstained Secondary antibody only Anti-CCR2 SUPPLEMENTAL FIGURE
Supplementary Appendix
 Supplementary Appendix This appendix has been provided by the authors to give readers additional information about their work. Supplement to: Bredel M, Scholtens DM, Yadav AK, et al. NFKBIA deletion in
Complexity of intra- and inter-pathway loops in colon cancer and melanoma: implications for targeted therapies
 Complexity of intra- and inter-pathway loops in colon cancer and melanoma: implications for targeted therapies René Bernards The Netherlands Cancer Institute Amsterdam The Netherlands Molecular versus
SUPPLEMENTARY INFORMATION. Involvement of IL-21 in the epidermal hyperplasia of psoriasis
 SUPPLEMENTARY INFORMATION Involvement of IL-21 in the epidermal hyperplasia of psoriasis Roberta Caruso 1, Elisabetta Botti 2, Massimiliano Sarra 1, Maria Esposito 2, Carmine Stolfi 1, Laura Diluvio 2,
A263 A352 A204. Pan CK. pstat STAT3 pstat3 STAT3 pstat3. Columns Columns 1-6 Positive control. Omentum. Rectosigmoid A195.
 pstat3 75 Pan CK A A263 A352 A24 B Columns 1-6 Positive control A195 A22 A24 A183 Rectal Nodule STAT3 pstat3 STAT3 pstat3 Columns 7-12 Omentum Rectosigmoid Left Ovary Right Ovary Omentum Uterus Uterus
Supplementary Figure 1. mrna targets were found in exosomes and absent in free-floating supernatant. Serum exosomes and exosome-free supernatant were
 Supplementary Figure 1. mrna targets were found in exosomes and absent in free-floating supernatant. Serum exosomes and exosome-free supernatant were separated via ultracentrifugation and lysed to analyze
Nature Medicine: doi: /nm.4078
 Supplementary Figure 1. Cetuximab induces ER stress response in DiFi cells. (a) Scheme of SILAC proteome. (b) MS-base read out of SILAC experiment. The histogram of log 2 -transformed normalized H/L ratios
Supplementary Figure 1. IDH1 and IDH2 mutation site sequences on WHO grade III
 Supplementary Materials: Supplementary Figure 1. IDH1 and IDH2 mutation site sequences on WHO grade III patient samples. Genomic DNA samples extracted from punch biopsies from either FFPE or frozen tumor
(A) RT-PCR for components of the Shh/Gli pathway in normal fetus cell (MRC-5) and a
 RT-PCR for components of the Shh/Gli pathway in normal fetus cell (MRC-5) and a") Supplementary figure legends Supplementary Figure 1. Expression of Shh signaling components in a panel of gastric cancer. (A) RT-PCR for components of the Shh/Gli pathway in normal fetus cell (MRC-5) and
Supplementary figure legends Supplementary Figure 1. Expression of Shh signaling components in a panel of gastric cancer. (A) RT-PCR for components of the Shh/Gli pathway in normal fetus cell (MRC-5) and
Supplementary Information
 Supplementary Information Temozolomide suppresses MYC via activation of TAp63 to inhibit progression of human glioblastoma Tomohiro Yamaki, Yusuke Suenaga, Toshihiko Iuchi, Jennifer Alagu, Atsushi Takatori,
Bmi-1 regulates stem cell-like properties of gastric cancer cells via modulating mirnas
 Wang et al. Journal of Hematology & Oncology (2016) 9:90 DOI 10.1186/s13045-016-0323-9 RESEARCH Bmi-1 regulates stem cell-like properties of gastric cancer cells via modulating mirnas Open Access Xiaofeng
Supplementary Figure 1.TRIM33 binds β-catenin in the nucleus. a & b, Co-IP of endogenous TRIM33 with β-catenin in HT-29 cells (a) and HEK 293T cells
 and HEK 293T cells") Supplementary Figure 1.TRIM33 binds β-catenin in the nucleus. a & b, Co-IP of endogenous TRIM33 with β-catenin in HT-29 cells (a) and HEK 293T cells (b). TRIM33 was immunoprecipitated, and the amount of
Supplementary Figure 1.TRIM33 binds β-catenin in the nucleus. a & b, Co-IP of endogenous TRIM33 with β-catenin in HT-29 cells (a) and HEK 293T cells (b). TRIM33 was immunoprecipitated, and the amount of
Supplementary Figures
 Supplementary Figures Figure S1. Validation of kinase regulators of ONC201 sensitivity. Validation and screen results for changes in cell viability associated with the combination of ONC201 treatment (1
Supplemental Figures:
 Supplemental Figures: Figure 1: Intracellular distribution of VWF by electron microscopy in human endothelial cells. a) Immunogold labeling of LC3 demonstrating an LC3-positive autophagosome (white arrow)
SUPPLEMENTARY INFORMATION
 DOI:.38/ncb3399 a b c d FSP DAPI 5mm mm 5mm 5mm e Correspond to melanoma in-situ Figure a DCT FSP- f MITF mm mm MlanaA melanoma in-situ DCT 5mm FSP- mm mm mm mm mm g melanoma in-situ MITF MlanaA mm mm
SUPPLEMENTARY INFORMATION
 DOI: 1.138/ncb3355 a S1A8 + cells/ total.1.8.6.4.2 b S1A8/?-Actin c % T-cell proliferation 3 25 2 15 1 5 T cells Supplementary Figure 1 Inter-tumoral heterogeneity of MDSC accumulation in mammary tumor
Supplementary Materials for
 www.sciencesignaling.org/cgi/content/full/2/1/ra81/dc1 Supplementary Materials for Delivery of MicroRNA-126 by Apoptotic Bodies Induces CXCL12- Dependent Vascular Protection Alma Zernecke,* Kiril Bidzhekov,
Integrin CD11b negatively regulates TLR-triggered inflammatory responses by. activating Syk and promoting MyD88 and TRIF degradation via cbl-b
 Integrin CD11b negatively regulates TLR-triggered inflammatory responses by activating Syk and promoting MyD88 and TRIF degradation via cbl-b Chaofeng Han, Jing Jin, Sheng Xu, Haibo Liu, Nan Li, and Xuetao
Intracellular MHC class II molecules promote TLR-triggered innate. immune responses by maintaining Btk activation
 Intracellular MHC class II molecules promote TLR-triggered innate immune responses by maintaining Btk activation Xingguang Liu, Zhenzhen Zhan, Dong Li, Li Xu, Feng Ma, Peng Zhang, Hangping Yao and Xuetao
Supplementary Figures
 Supplementary Figures Supplementary Figure 1 Characterization of stable expression of GlucB and sshbira in the CT26 cell line (a) Live cell imaging of stable CT26 cells expressing green fluorescent protein
Supplementary Figure 1. Deletion of Smad3 prevents B16F10 melanoma invasion and metastasis in a mouse s.c. tumor model.
 A B16F1 s.c. Lung LN Distant lymph nodes Colon B B16F1 s.c. Supplementary Figure 1. Deletion of Smad3 prevents B16F1 melanoma invasion and metastasis in a mouse s.c. tumor model. Highly invasive growth
Doctoral Degree Program in Marine Biotechnology, College of Marine Sciences, Doctoral Degree Program in Marine Biotechnology, Academia Sinica, Taipei,
 Cyclooxygenase 2 facilitates dengue virus replication and serves as a potential target for developing antiviral agents Chun-Kuang Lin 1,2, Chin-Kai Tseng 3,4, Yu-Hsuan Wu 3,4, Chih-Chuang Liaw 1,5, Chun-
p47 negatively regulates IKK activation by inducing the lysosomal degradation of polyubiquitinated NEMO
 Supplementary Information p47 negatively regulates IKK activation by inducing the lysosomal degradation of polyubiquitinated NEMO Yuri Shibata, Masaaki Oyama, Hiroko Kozuka-Hata, Xiao Han, Yuetsu Tanaka,
EPIGENETIC RE-EXPRESSION OF HIF-2α SUPPRESSES SOFT TISSUE SARCOMA GROWTH
 EPIGENETIC RE-EXPRESSION OF HIF-2α SUPPRESSES SOFT TISSUE SARCOMA GROWTH Supplementary Figure 1. Supplementary Figure 1. Characterization of KP and KPH2 autochthonous UPS tumors. a) Genotyping of KPH2
Supplementary Figure 1 ITGB1 and ITGA11 increase with evidence for heterodimers following HSC activation. (a) Time course of rat HSC activation
 Time course of rat HSC activation") Supplementary Figure 1 ITGB1 and ITGA11 increase with evidence for heterodimers following HSC activation. (a) Time course of rat HSC activation indicated by the detection of -SMA and COL1 (log scale).
Supplementary Figure 1 ITGB1 and ITGA11 increase with evidence for heterodimers following HSC activation. (a) Time course of rat HSC activation indicated by the detection of -SMA and COL1 (log scale).
Effective Targeting of Quiescent Chronic Myelogenous
 Cancer Cell, Volume 7 Supplemental Information Effective Targeting of Quiescent Chronic Myelogenous Leukemia Stem Cells by Histone Deacetylase Inhibitors in Combination with Imatinib Mesylate Bin Zhang,
Pro-apoptotic signalling through Toll-like receptor 3 involves TRIF-dependent
 Pro-apoptotic signalling through Toll-like receptor 3 involves TRIF-dependent activation of caspase-8 and is under the control of inhibitor of apoptosis proteins in melanoma cells Arnim Weber, Zofia Kirejczyk,
Supplementary Figure 1. Supernatants electrophoresis from CD14+ and dendritic cells. Supernatants were resolved by SDS-PAGE and stained with
 Supplementary Figure 1. Supernatants electrophoresis from CD14+ and dendritic cells. Supernatants were resolved by SDS-PAGE and stained with Coomassie brilliant blue. One µg/ml recombinant human (rh) apo-e
Irf1 fold changes (D) 24h 48h. p-p65. t-p65. p-irf3. t-irf3. β-actin SKO TKO 100% 80% 60% 40% 20%
 24h 48h. p-p65. t-p65. p-irf3. t-irf3. β-actin SKO TKO 100% 80% 60% 40% 20%") Irf7 Fold changes 3 1 Irf1 fold changes 3 1 8h h 8h 8h h 8h p-p6 p-p6 t-p6 p-irf3 β-actin p-irf3 t-irf3 β-actin TKO TKO STKO (E) (F) TKO TKO % of p6 nuclear translocation % % 1% 1% % % p6 TKO % of IRF3
Irf7 Fold changes 3 1 Irf1 fold changes 3 1 8h h 8h 8h h 8h p-p6 p-p6 t-p6 p-irf3 β-actin p-irf3 t-irf3 β-actin TKO TKO STKO (E) (F) TKO TKO % of p6 nuclear translocation % % 1% 1% % % p6 TKO % of IRF3
Supporting Information
 Supporting Information Desnues et al. 10.1073/pnas.1314121111 SI Materials and Methods Mice. Toll-like receptor (TLR)8 / and TLR9 / mice were generated as described previously (1, 2). TLR9 / mice were
Supplementary Data. Supplementary Methods:
 Supplementary Data Supplementary Methods: Cell viability assay. Cells were seeded overnight at a density of 2,000 cells per well in 96-well plates in RPMI with 10% FBS and then treated with the relevant
Soft Agar Assay. For each cell pool, 100,000 cells were resuspended in 0.35% (w/v)
") SUPPLEMENTARY MATERIAL AND METHODS Soft Agar Assay. For each cell pool, 100,000 cells were resuspended in 0.35% (w/v) top agar (LONZA, SeaKem LE Agarose cat.5004) and plated onto 0.5% (w/v) basal agar.
SUPPLEMENTARY MATERIAL AND METHODS Soft Agar Assay. For each cell pool, 100,000 cells were resuspended in 0.35% (w/v) top agar (LONZA, SeaKem LE Agarose cat.5004) and plated onto 0.5% (w/v) basal agar.
Supplementary Methods: IGFBP7 Drives Resistance to Epidermal Growth Factor Receptor Tyrosine Kinase Inhibition in Lung Cancer
 S1 of S6 Supplementary Methods: IGFBP7 Drives Resistance to Epidermal Growth Factor Receptor Tyrosine Kinase Inhibition in Lung Cancer Shang-Gin Wu, Tzu-Hua Chang, Meng-Feng Tsai, Yi-Nan Liu, Chia-Lang
Supplemental Materials for. Effects of sphingosine-1-phosphate receptor 1 phosphorylation in response to. FTY720 during neuroinflammation
 Supplemental Materials for Effects of sphingosine-1-phosphate receptor 1 phosphorylation in response to FTY7 during neuroinflammation This file includes: Supplemental Table 1. EAE clinical parameters of
SUPPLEMENTARY INFORMATION
 doi:10.1038/nature12215 Supplementary Figure 1. The effects of full and dissociated GR agonists in supporting BFU-E self-renewal divisions. BFU-Es were cultured in self-renewal medium with indicated GR
Supplementary Figure S1. PTPN2 levels are not altered in proliferating CD8+ T cells. Lymph node (LN) CD8+ T cells from C57BL/6 mice were stained with
 CD8+ T cells from C57BL/6 mice were stained with") Supplementary Figure S1. PTPN2 levels are not altered in proliferating CD8+ T cells. Lymph node (LN) CD8+ T cells from C57BL/6 mice were stained with CFSE and stimulated with plate-bound α-cd3ε (10µg/ml)
Supplementary Figure S1. PTPN2 levels are not altered in proliferating CD8+ T cells. Lymph node (LN) CD8+ T cells from C57BL/6 mice were stained with CFSE and stimulated with plate-bound α-cd3ε (10µg/ml)
Ephrin receptor A2 is an epithelial cell receptor for Epstein Barr virus entry
 SUPPLEMENTARY INFORMATION Letters https://doi.org/10.1038/s41564-017-0080-8 In the format provided by the authors and unedited. Ephrin receptor A2 is an epithelial cell receptor for Epstein Barr virus
Targeted mass spectrometry (LC/MS/MS) for Olaparib pharmacokinetics. For LC/MS/MS of Olaparib pharmacokinetics metabolites were extracted from
 for Olaparib pharmacokinetics. For LC/MS/MS of Olaparib pharmacokinetics metabolites were extracted from") Supplementary Methods: Targeted mass spectrometry (LC/MS/MS) for Olaparib pharmacokinetics For LC/MS/MS of Olaparib pharmacokinetics metabolites were extracted from mouse tumor samples and analyzed as
Supplementary Methods: Targeted mass spectrometry (LC/MS/MS) for Olaparib pharmacokinetics For LC/MS/MS of Olaparib pharmacokinetics metabolites were extracted from mouse tumor samples and analyzed as
Supplemental information
 Supplemental information PI(3)K p11δ controls the sucellular compartmentalization of TLR4 signaling and protects from endotoxic shock Ezra Aksoy, Salma Taoui, David Torres, Sandrine Delauve, Aderrahman
Islet viability assay and Glucose Stimulated Insulin Secretion assay RT-PCR and Western Blot
 Islet viability assay and Glucose Stimulated Insulin Secretion assay Islet cell viability was determined by colorimetric (3-(4,5-dimethylthiazol-2-yl)-2,5- diphenyltetrazolium bromide assay using CellTiter
Supplementary Figure 1. Validation of astrocytes. Primary astrocytes were
 Supplementary Figure 1. Validation of astrocytes. Primary astrocytes were separated from the glial cultures using a mild trypsinization protocol. Anti-glial fibrillary acidic protein (GFAP) immunofluorescent
Supplementary Figure 1: Expression of NFAT proteins in Nfat2-deleted B cells (a+b) Protein expression of NFAT2 (a) and NFAT1 (b) in isolated splenic
 Protein expression of NFAT2 (a) and NFAT1 (b) in isolated splenic") Supplementary Figure 1: Expression of NFAT proteins in Nfat2-deleted B cells (a+b) Protein expression of NFAT2 (a) and NFAT1 (b) in isolated splenic B cells from WT Nfat2 +/+, TCL1 Nfat2 +/+ and TCL1 Nfat2
Supplementary Figure 1: Expression of NFAT proteins in Nfat2-deleted B cells (a+b) Protein expression of NFAT2 (a) and NFAT1 (b) in isolated splenic B cells from WT Nfat2 +/+, TCL1 Nfat2 +/+ and TCL1 Nfat2
Supplementary Materials for
 www.sciencesignaling.org/cgi/content/full/7/318/ra29/dc1 Supplementary Materials for Antagonism of EGFR and HER3 Enhances the Response to Inhibitors of the PI3K-Akt Pathway in Triple-Negative Breast Cancer
Supplementary Figures
 Supplementary Figures Supplementary Figure 1 Correlation between LKB1 and YAP expression in human lung cancer samples. (a) Representative photos showing LKB1 and YAP immunohistochemical staining in human
Antitumor Activity of CUDC-305, a Novel Oral HSP90 Inhibitor, in Solid and Hematological Tumor Xenograft Models
 Antitumor Activity of CUDC-5, a Novel Oral HSP Inhibitor, in Solid and Hematological Tumor Xenograft Models Rudi Bao, MD/PhD April 1, 2 AACR 1th Annual Meeting 2 Experimental and Molecular Therapeutics
Supplemental Figure 1. Signature gene expression in in vitro differentiated Th0, Th1, Th2, Th17 and Treg cells. (A) Naïve CD4 + T cells were cultured
 Naïve CD4 + T cells were cultured") Supplemental Figure 1. Signature gene expression in in vitro differentiated Th0, Th1, Th2, Th17 and Treg cells. (A) Naïve CD4 + T cells were cultured under Th0, Th1, Th2, Th17, and Treg conditions. mrna
Supplemental Figure 1. Signature gene expression in in vitro differentiated Th0, Th1, Th2, Th17 and Treg cells. (A) Naïve CD4 + T cells were cultured under Th0, Th1, Th2, Th17, and Treg conditions. mrna
SUPPLEMENTARY MATERIAL
 SUPPLEMENTARY MATERIAL IL-1 signaling modulates activation of STAT transcription factors to antagonize retinoic acid signaling and control the T H 17 cell it reg cell balance Rajatava Basu 1,5, Sarah K.
BRaf V600E cooperates with Pten silencing to elicit metastatic melanoma (Nature Genetics Supplementary Information)
") BRaf V600E cooperates with Pten silencing to elicit metastatic melanoma (Nature Genetics Supplementary Information) David Dankort, David P. Curley, Robert A. Cartlidge, Betsy Nelson, Anthony N. Karnezis,
BRaf V600E cooperates with Pten silencing to elicit metastatic melanoma (Nature Genetics Supplementary Information) David Dankort, David P. Curley, Robert A. Cartlidge, Betsy Nelson, Anthony N. Karnezis,