CD14 + S100A9 + Monocytic Myeloid-Derived Suppressor Cells and Their Clinical Relevance in Non-Small Cell Lung Cancer
|
|
|
- Mitchell Stevenson
- 5 years ago
- Views:
Transcription
1 CD14 + S1A9 + Monocytic Myeloid-Derived Suppressor Cells and Their Clinical Relevance in Non-Small Cell Lung Cancer Po-Hao, Feng M.D., Kang-Yun, Lee, M.D. Ph.D., Ya-Ling Chang, Yao-Fei Chan, Lu- Wei, Kuo,Ting-Yu Lin, M.D., Fu-Tsai, Chung, M.D., Chih-Shi Kuo, M.D., Chih-Teng Yu, M.D., Shu-Min Lin, M.D., Chun-Hua Wang, M.D., Chun-Liang Chou, M.D., Chien-Da, Huang M.D., Han-Pin, Kuo M.D. Ph.D Online Data Supplement
2 Material and Methods Oxidative stress measurement The intracellular oxidation levels were determined by using 5-(and-6)-chloromethyl-2,7 - dichlorodihydrofluoresceindiacetate-acetyl-ester (DCFDA, Invitrogen, Carlsbad, CA), which is metabolized to fluorescent (FL-1) 2,7 -dichlorofluorescein (DCF) upon oxidation. Briefly, PBMCs were incubated with.25 μmol DCFDA for 1 minutes at 37 C, washed twice in ice-cold PBS and stained for surface markers, and the mean fluorescence intensity (MFI) of intracellularly retained DCF was determined by flow cytometry. Activation of T cells T cells in the PBMCs with or without depletion of MDSCs were stimulated in 24-well flatbottomed plates with immobilized anti-cd3 antibody (prepared by pre-coating with 5 µg/ml Ab at 4 C overnight, BioLegend, San Diego, CA, USA) and anti-cd28 antibody (2 µg/ml, BioLegend, San Diego, CA, USA). The cells were pre-labeled with 5-carboxyfluorescein diacetate succinimidyl ester (CFSE, CellTrace TM CFSE Cell Proliferation Kit, 5 mm, Invitrogen, Eugene, Oregon, USA), and proliferation was determined by FACS analysis after 96 hours of stimulation. Fluorescence confocal microscopy The expression of and interaction between S1A9 and RAGE in freshly isolated CD11b+CD14+ cells were determined by immunofluorescence staining using an anti- S1A9-Rhodamine antibody and anti-rage-fitc antibody and visualized with a Leica TCS 4D confocal laser microscope (Leica Microsystem, Wetzlar, Germany). All cell images were obtained using a 4X dry objective lens on the confocal microscope with Leica Confocal Software.
3 Supplemental Table E1 Marker Clone Isotype Fluorochrome Manufacturer CD4 SK3 IgG1 PE BD CD8 RPA-T8 IgG1,kappa PE BioLegend CD11b ICRF44 IgG1,kappa PE/Cy5 BD CD11b 2LPM19c IgG1,kappa PE DAKO CD14 TUK4 IgG2a,kappa PE/Alexa Serotec CD14 M5E2 IgG2a,kappa FITC Santa Cruz CD15 TG-1 IgM FITC BD CD33 P67.6 IgG1 FITC BD IL-4Rα IgG2A PE R&D HLA-DR G46-6 IgG2a, kappa FITC BD RAGE (1 Ab) IgG2a, kappa Abcom inos N-2 IgG1 FITC Santa Cruz Arginase 1 (1 Ab) IgG Serotec S1A8 MAC387 IgG1 FITC GeneTex S1A9 (1 Ab) 4G9 IgG1 Abnova Isotype control MOPC-21 IgG1 kappa PE/Cy5 BD G IgG2a kappa FITC BD IgG2a PE/Alexa Serotec X4 IgG1 PE BD X4 IgG1 FITC BD Primary antibody, negative control, anti-mouse DAK-G1 IgG1 Dako Polyclonal rabbit anti mouse IgG PE Dako IgG PE Polyclonal rabbit anti-mouse IgG FITC Dako IgG FITC Primary antibody, negative IgG Dako control, anti-rabbit Polyclonal swine anti-rabbit IgG FITC Dako IgG FITC Goat anti-mouse IgG FITC IgM FITC Santa Cruz
4 Figure legend Supplement E1. A. Percentage of non-lymphocytic mononuclear cells (NLMNC) in the PBMCs of healthy donors (n=17) or NSCLC patients (n=36). NC vs. CA: 14±1.3 vs. 28±2.4, p<.5 B. Percentage of CD11b+CD14+ and CD11b+CD14- cells in NLMNC of NC (n=17) and CA patients (n=36). CD14+ in NC vs. CA: 79.3±1.8 vs ±1.1, p<.5; CD14- in NC vs. CA: 9.8±.6 vs. 21.8±2.7, p<.5. E2. Column bar graph analysis of the data in Figure 2A. The data are the mean fluorescence intensity (MFI). Empty bars, normal CD11b + /CD14 + cells; black bars, NSCLC CD11b + /CD14 + cells; gray bars, NSCLC CD11b + /CD14 - cells; n=4. The data are the mean ± SEM; p<.5. E3. Representative dot plots of CFSE-labeled T cell proliferation assay in response to CD3/CD28 co-stimulation in the PBMCs from healthy donors (NC) or NSCLC patients (CA). E4. Effects of CD11b + CD14 + cells from healthy donors on CD3/CD28-stimulated IFN-γ production in the cultured supernatants of effector cells analyzed by ELISA. n=3 independent experiments. The data are the mean ± SEM and are presented as the percentage of maximal IFN-γ production. E5. Representative dot plots of flow cytometry analysis of HLA-DR expression on CD11b + /CD14 + cells from normal subjects (left panel) and NSCLC patients (middle panel). The data from magnetic bead enriching HLA-DR -/low cells are also shown (right panel). E6. Column bar graph analysis of the mean fluorescence intensity (MFI) of designated intracellular staining. The data are presented as the mean ± SEM. n=5; p<.5 E7. A. Correlation of the percentage of S1A9 + cells in CD11b + CD14 + cells with the T cell suppression ability of CD11b + CD14 + cells from healthy donors. n=4, Spearman r=, p=1.8. B. Correlation of the MFI of S1A9 in CD11b + CD14 + cells to the T cell suppression ability from healthy donors. Spearman r=, n=4, p=1.8.
5 E8. Correlation of the percentage of CD11b + CD14 + IL-4Rα + cells in PBMCs with progression-free survival after platinum-based doublet chemotherapy. Spearman r=-.2, n=14, p=.93. E9. Fluorescence confocal microscopic analysis of CD11b+CD14+ cells from healthy donors or NSCLC patients that were stained with anti-rage-fitc (Green), anti-s1a9- Rhodamine (Red), and DAPI. Insets showed a magnification of the merged image. CD11b + CD14 + cells had significant yellow fluorescence in the merged image. E1. MTT assay for the cell viability of A549 cells (2x1 3 cells/ml) with or without CD14 + MDSC cells (5x1 5 cells/ml) co-cultured in 1 ml RPMI and 1% FBS medium in a 24-well plate. The cells were treated with 1 μm cisplatin in the presence or absence of anti-human RAGE blocking antibody (1 μg/ml) or IgG control (1 μg/ml) for 96 hr. n=4, p<.5, p<.1, p<.1.
6 E1 A 8 NLMNC B 1 CD11b+/CD14+ CD11b+/CD14- % PBMC NC Non Lym M % of NC CA NC CA NC CA
7 E NC CD11b+/CD14+ CA CD11b+/CD14+ CA CD11b+/CD14- Mean MFI CD15 CD33 IL-4Rα HLA-DR
8 E3
9 E4 25 % Ma ax IFN-γ Non 1:4 1:2 1:1 Ratio of CD11b + CD14 + : Effector cells
10 E5 A
11 E6 8 NC CD11b+CD14+ 6 CA CD11b+CD14+ CA CD11b+CD14- MFI 4 2 inos Arginase DCFH
12 E7 A B %M Max T cell proliferatio n Spearmn r= p= % of A9+ ( CD11b+/CD14+) Prolifera ation % Ma ax T cell Spearmn r= p= S1A9 MFI
13 E8 CD14+/ /IL-4Rα α% of PBMC Spearmen r= p = PFS (Months)


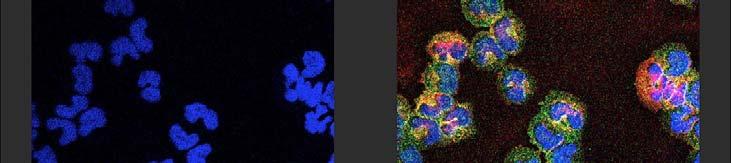
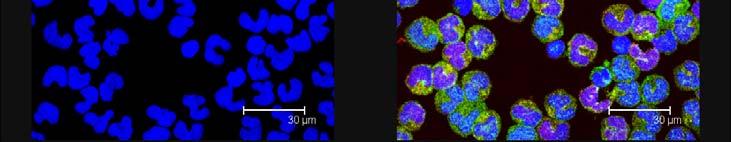
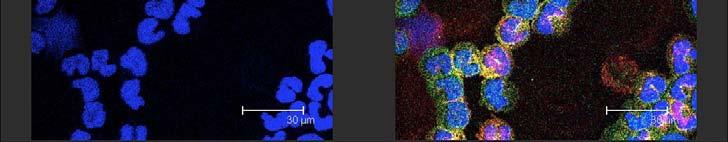
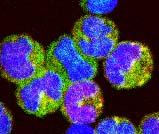
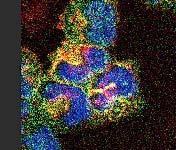
14 E9 NC CD14+ CA CD14+ RAGE RAGE S1A9 RAGE RAGE S1A9 DAPI Merge DAPI Merge
15 GE G Cis+M MDSC+aRAGE E Cis+MDSC Cis + MDSC + IgG Cis - 2 % Cell viability
Detailed step-by-step operating procedures for NK cell and CTL degranulation assays
 Supplemental methods Detailed step-by-step operating procedures for NK cell and CTL degranulation assays Materials PBMC isolated from patients, relatives and healthy donors as control K562 cells (ATCC,
Online supplement. Phenotypic, functional and plasticity features of classical and alternatively activated
 Online supplement Phenotypic, functional and plasticity features of classical and alternatively activated human macrophages Abdullah Al Tarique*, Jayden Logan *, Emma Thomas *, Patrick G Holt *, Peter
Human Immunodeficiency Virus Type-1 Myeloid Derived Suppressor Cells Inhibit Cytomegalovirus Inflammation through Interleukin-27 and B7-H4
 Human Immunodeficiency Virus Type-1 Myeloid Derived Suppressor Cells Inhibit Cytomegalovirus Inflammation through Interleukin-27 and B7-H4 Ankita Garg, Rodney Trout and Stephen A. Spector,,* Department
Supplementary Figure 1. IL-12 serum levels and frequency of subsets in FL patients. (A) IL-12
 IL-12") 1 Supplementary Data Figure legends Supplementary Figure 1. IL-12 serum levels and frequency of subsets in FL patients. (A) IL-12 serum levels measured by multiplex ELISA (Luminex) in FL patients before
1 Supplementary Data Figure legends Supplementary Figure 1. IL-12 serum levels and frequency of subsets in FL patients. (A) IL-12 serum levels measured by multiplex ELISA (Luminex) in FL patients before
In vitro human regulatory T cell suppression assay
 Human CD4 + CD25 + regulatory T cell isolation, in vitro suppression assay and analysis In vitro human regulatory T cell suppression assay Introduction Regulatory T (Treg) cells are a subpopulation of
Supplementary Figure 1. Characterization of basophils after reconstitution of SCID mice
 Supplementary figure legends Supplementary Figure 1. Characterization of after reconstitution of SCID mice with CD4 + CD62L + T cells. (A-C) SCID mice (n = 6 / group) were reconstituted with 2 x 1 6 CD4
Blocking antibodies and peptides. Rat anti-mouse PD-1 (29F.1A12, rat IgG2a, k), PD-
, PD-") Supplementary Methods Blocking antibodies and peptides. Rat anti-mouse PD-1 (29F.1A12, rat IgG2a, k), PD- L1 (10F.9G2, rat IgG2b, k), and PD-L2 (3.2, mouse IgG1) have been described (24). Anti-CTLA-4 (clone
Supplementary Methods Blocking antibodies and peptides. Rat anti-mouse PD-1 (29F.1A12, rat IgG2a, k), PD- L1 (10F.9G2, rat IgG2b, k), and PD-L2 (3.2, mouse IgG1) have been described (24). Anti-CTLA-4 (clone
Supplementary Information. Tissue-wide immunity against Leishmania. through collective production of nitric oxide
 Supplementary Information Tissue-wide immunity against Leishmania through collective production of nitric oxide Romain Olekhnovitch, Bernhard Ryffel, Andreas J. Müller and Philippe Bousso Supplementary
VEGFR2-Mediated Vascular Dilation as a Mechanism of VEGF-Induced Anemia and Bone Marrow Cell Mobilization
 Cell Reports, Volume 9 Supplemental Information VEGFR2-Mediated Vascular Dilation as a Mechanism of VEGF-Induced Anemia and Bone Marrow Cell Mobilization Sharon Lim, Yin Zhang, Danfang Zhang, Fang Chen,
Supplemental Methods. CD107a assay
 Supplemental Methods CD107a assay For each T cell culture that was tested, two tubes were prepared. One tube contained BCMA-K562 cells, and the other tube contained NGFR-K562 cells. Both tubes contained
ImageStream cytometer analysis. Cells were cultured as described above in vented-cap
 ImageStream cytometer analysis. Cells were cultured as described above in vented-cap polypropylene tubes, stained with αcd66b-fitc, αm-dc8-pe and αcd56-pe-cy5.5 mabs, washed and fixed with 4 % (w/v) paraformaldehyde.
Fluorochrome Panel 1 Panel 2 Panel 3 Panel 4 Panel 5 CTLA-4 CTLA-4 CD15 CD3 FITC. Bio) PD-1 (MIH4, BD) ICOS (C398.4A, Biolegend) PD-L1 (MIH1, BD)
 PD-1 (MIH4, BD) ICOS (C398.4A, Biolegend) PD-L1 (MIH1, BD)") Additional file : Table S. Antibodies used for panel stain to identify peripheral immune cell subsets. Panel : PD- signaling; Panel : CD + T cells, CD + T cells, B cells; Panel : Tregs; Panel :, -T, cdc,
Additional file : Table S. Antibodies used for panel stain to identify peripheral immune cell subsets. Panel : PD- signaling; Panel : CD + T cells, CD + T cells, B cells; Panel : Tregs; Panel :, -T, cdc,
In vitro human regulatory T cell expansion
 - 1 - Human CD4 + CD25 + regulatory T cell isolation, Workflow in vitro expansion and analysis In vitro human regulatory T cell expansion Introduction Regulatory T (Treg) cells are a subpopulation of T
In vitro human regulatory T cell expansion
 - 1 - Human CD4 + CD25 + CD127 dim/- regulatory T cell Workflow isolation, in vitro expansion and analysis In vitro human regulatory T cell expansion Introduction Regulatory T (Treg) cells are a subpopulation
Supplementary Figure 1. Enhanced detection of CTLA-4 on the surface of HIV-specific
 SUPPLEMENTARY FIGURE LEGEND Supplementary Figure 1. Enhanced detection of CTLA-4 on the surface of HIV-specific CD4 + T cells correlates with intracellular CTLA-4 levels. (a) Comparative CTLA-4 levels
Supplementary Data Table of Contents:
 Supplementary Data Table of Contents: - Supplementary Methods - Supplementary Figures S1(A-B) - Supplementary Figures S2 (A-B) - Supplementary Figures S3 - Supplementary Figures S4(A-B) - Supplementary
BMDCs were generated in vitro from bone marrow cells cultured in 10 % RPMI supplemented
 Supplemental Materials Figure S1. Cultured BMDCs express CD11c BMDCs were generated in vitro from bone marrow cells cultured in 10 % RPMI supplemented with 15 ng/ml GM-CSF. Media was changed and fresh
Human and mouse T cell regulation mediated by soluble CD52 interaction with Siglec-10. Esther Bandala-Sanchez, Yuxia Zhang, Simone Reinwald,
 Human and mouse T cell regulation mediated by soluble CD52 interaction with Siglec-1 Esther Bandala-Sanchez, Yuxia Zhang, Simone Reinwald, James A. Dromey, Bo Han Lee, Junyan Qian, Ralph M Böhmer and Leonard
Commercially available HLA Class II tetramers (Beckman Coulter) conjugated to
 conjugated to") Class II tetramer staining Commercially available HLA Class II tetramers (Beckman Coulter) conjugated to PE were combined with dominant HIV epitopes (DRB1*0101-DRFYKTLRAEQASQEV, DRB1*0301- PEKEVLVWKFDSRLAFHH,
Class II tetramer staining Commercially available HLA Class II tetramers (Beckman Coulter) conjugated to PE were combined with dominant HIV epitopes (DRB1*0101-DRFYKTLRAEQASQEV, DRB1*0301- PEKEVLVWKFDSRLAFHH,
CD14 1 S100A9 1 Monocytic Myeloid-derived Suppressor Cells and Their Clinical Relevance in Non Small Cell Lung Cancer
 CD14 1 S100A9 1 Monocytic Myeloid-derived Suppressor Cells and Their Clinical Relevance in Non Small Cell Lung Cancer Po-Hao Feng 1,2 *, Kang-Yun Lee 1,3 *, Ya-Ling Chang 1, Yao-Fei Chan 1, Lu-Wei Kuo
SUPPLEMENTARY INFORMATION
 doi:1.138/nature1554 a TNF-α + in CD4 + cells [%] 1 GF SPF 6 b IL-1 + in CD4 + cells [%] 5 4 3 2 1 Supplementary Figure 1. Effect of microbiota on cytokine profiles of T cells in GALT. Frequencies of TNF-α
Supporting Information
 Supporting Information lpek et al. 1.173/pnas.1121217 SI Materials and Methods Mice. cell knockout, inos / (Taconic arms), Rag1 /, INγR /, and IL-12p4 / mice (The Jackson Laboratory) were maintained and/or
L-selectin Is Essential for Delivery of Activated CD8 + T Cells to Virus-Infected Organs for Protective Immunity
 Cell Reports Supplemental Information L-selectin Is Essential for Delivery of Activated CD8 + T Cells to Virus-Infected Organs for Protective Immunity Rebar N. Mohammed, H. Angharad Watson, Miriam Vigar,
Vasoactive intestinal peptide inhibits IFN-α secretion and modulates the immune function of plasmacytoid dendritic cells
 Excerpt from MACS&more Vol 12 1/21 Vasoactive intestinal peptide inhibits IFN-α secretion and modulates the immune function of plasmacytoid dendritic cells Dorit Fabricius 1, 2,, M. Sue O Dorisio 1, 2,
SUPPLEMENTARY INFORMATION
 doi:10.1038/nature10134 Supplementary Figure 1. Anti-inflammatory activity of sfc. a, Autoantibody immune complexes crosslink activating Fc receptors, promoting activation of macrophages, and WWW.NATURE.COM/NATURE
Serafino et al. Thymosin α1 activates complement receptor-mediated phagocytosis in human monocyte-derived macrophages. SUPPLEMENTARY FIGURES
 Supplementary Fig. S1. Evaluation of the purity and maturation of macrophage cultures tested by flow cytometry. The lymphocytic/monocytic cellular fraction was isolated from buffy coats of healthy donors
NK cell flow cytometric assay In vivo DC viability and migration assay
 NK cell flow cytometric assay 6 NK cells were purified, by negative selection with the NK Cell Isolation Kit (Miltenyi iotec), from spleen and lymph nodes of 6 RAG1KO mice, injected the day before with
Supplementary Information
 Supplementary Information Supplementary Figure 1. CD4 + T cell activation and lack of apoptosis after crosslinking with anti-cd3 + anti-cd28 + anti-cd160. (a) Flow cytometry of anti-cd160 (5D.10A11) binding
SUPPLEMENT Supplementary Figure 1: (A) (B)
 (B)") SUPPLEMENT Supplementary Figure 1: CD4 + naïve effector T cells (CD4 effector) were labeled with CFSE, stimulated with α-cd2/cd3/cd28 coated beads (at 2 beads/cell) and cultured alone or cocultured with
SUPPLEMENT Supplementary Figure 1: CD4 + naïve effector T cells (CD4 effector) were labeled with CFSE, stimulated with α-cd2/cd3/cd28 coated beads (at 2 beads/cell) and cultured alone or cocultured with
CD25-PE (BD Biosciences) and labeled with anti-pe-microbeads (Miltenyi Biotec) for depletion of CD25 +
 and labeled with anti-pe-microbeads (Miltenyi Biotec) for depletion of CD25 +") Supplements Supplemental Materials and Methods Depletion of CD25 + T-cells from PBMC. Fresh or HD precultured PBMC were stained with the conjugate CD25-PE (BD Biosciences) and labeled with anti-pe-microbeads
Supplements Supplemental Materials and Methods Depletion of CD25 + T-cells from PBMC. Fresh or HD precultured PBMC were stained with the conjugate CD25-PE (BD Biosciences) and labeled with anti-pe-microbeads
SUPPLEMENTARY INFORMATION
 Complete but curtailed T-cell response to very-low-affinity antigen Dietmar Zehn, Sarah Y. Lee & Michael J. Bevan Supp. Fig. 1: TCR chain usage among endogenous K b /Ova reactive T cells. C57BL/6 mice
sequences of a styx mutant reveals a T to A transversion in the donor splice site of intron 5
 sfigure 1 Styx mutant mice recapitulate the phenotype of SHIP -/- mice. (A) Analysis of the genomic sequences of a styx mutant reveals a T to A transversion in the donor splice site of intron 5 (GTAAC
Table S1. Viral load and CD4 count of HIV-infected patient population
 Table S1. Viral load and CD4 count of HIV-infected patient population Subject ID Viral load (No. of copies per ml of plasma) CD4 count (No. of cells/µl of blood) 28 7, 14 29 7, 23 21 361,99 94 217 7, 11
SUPPLEMENTARY INFORMATION. Involvement of IL-21 in the epidermal hyperplasia of psoriasis
 SUPPLEMENTARY INFORMATION Involvement of IL-21 in the epidermal hyperplasia of psoriasis Roberta Caruso 1, Elisabetta Botti 2, Massimiliano Sarra 1, Maria Esposito 2, Carmine Stolfi 1, Laura Diluvio 2,
Primary Adult Naïve CD4+ CD45RA+ Cells. Prepared by: David Randolph at University of Alabama, Birmingham
 Primary Adult Naïve CD4+ CD45RA+ Cells Prepared by: David Randolph (drdrdr@uab.edu) at University of Alabama, Birmingham Goal: To obtain large numbers of highly pure primary CD4+ CD45RO- CD25- cells from
Supplementary Figure 1 Protease allergens induce IgE and IgG1 production. (a-c)
") 1 Supplementary Figure 1 Protease allergens induce IgE and IgG1 production. (a-c) Serum IgG1 (a), IgM (b) and IgG2 (c) concentrations in response to papain immediately before primary immunization (day
1 Supplementary Figure 1 Protease allergens induce IgE and IgG1 production. (a-c) Serum IgG1 (a), IgM (b) and IgG2 (c) concentrations in response to papain immediately before primary immunization (day
Supporting Information
 Supporting Information Bellora et al. 10.1073/pnas.1007654108 SI Materials and Methods Cells. NK cells purified from peripheral blood mononuclear cells (PBMC) of healthy donors (Human NK Cell Isolation
90 min 18 min. 45 min. 14 d
 Isolation, cultivation, and expansion of Pan T cells from human PBMCs In vitro expansion of human Pan T cells Introduction T lymphocytes (T cells) play a central role in the adaptive immune system by controlling
(a) Significant biological processes (upper panel) and disease biomarkers (lower panel)
 Significant biological processes (upper panel) and disease biomarkers (lower panel)") Supplementary Figure 1. Functional enrichment analyses of secretomic proteins. (a) Significant biological processes (upper panel) and disease biomarkers (lower panel) 2 involved by hrab37-mediated secretory
Supplementary Figure 1. Functional enrichment analyses of secretomic proteins. (a) Significant biological processes (upper panel) and disease biomarkers (lower panel) 2 involved by hrab37-mediated secretory
Supplementary Figure 1. Example of gating strategy
 Supplementary Figure 1. Example of gating strategy Legend Supplementary Figure 1: First, gating is performed to include only single cells (singlets) (A) and CD3+ cells (B). After gating on the lymphocyte
Supplementary Figure 1. Efficient DC depletion in CD11c.DOG transgenic mice
 Supplementary Figure 1. Efficient DC depletion in CD11c.DOG transgenic mice (a) CD11c.DOG transgenic mice (tg) were treated with 8 ng/g body weight (b.w.) diphtheria toxin (DT) i.p. on day -1 and every
Pearson r = P (one-tailed) = n = 9
 = n = 9") 8F4-Specific Lysis, % 1 UPN1 UPN3 8 UPN7 6 Pearson r =.69 UPN2 UPN5 P (one-tailed) =.192 4 UPN8 n = 9 2 UPN9 UPN4 UPN6 5 1 15 2 25 8 8F4, % Max MFI Supplementary Figure S1. AML samples UPN1-UPN9 show variable
8F4-Specific Lysis, % 1 UPN1 UPN3 8 UPN7 6 Pearson r =.69 UPN2 UPN5 P (one-tailed) =.192 4 UPN8 n = 9 2 UPN9 UPN4 UPN6 5 1 15 2 25 8 8F4, % Max MFI Supplementary Figure S1. AML samples UPN1-UPN9 show variable
well for 2 h at rt. Each dot represents an individual mouse and bar is the mean ±
 Supplementary data: Control DC Blimp-1 ko DC 8 6 4 2-2 IL-1β p=.5 medium 8 6 4 2 IL-2 Medium p=.16 8 6 4 2 IL-6 medium p=.3 5 4 3 2 1-1 medium IL-1 n.s. 25 2 15 1 5 IL-12(p7) p=.15 5 IFNγ p=.65 4 3 2 1
Supplementary Figure 1. Double-staining immunofluorescence analysis of invasive colon and breast cancers. Specimens from invasive ductal breast
 Supplementary Figure 1. Double-staining immunofluorescence analysis of invasive colon and breast cancers. Specimens from invasive ductal breast carcinoma (a) and colon adenocarcinoma (b) were staining
Cover Page. The handle holds various files of this Leiden University dissertation.
 Cover Page The handle http://hdl.handle.net/1887/23854 holds various files of this Leiden University dissertation. Author: Marel, Sander van der Title: Gene and cell therapy based treatment strategies
Supplemental Figure 1
 Supplemental Figure 1 1a 1c PD-1 MFI fold change 6 5 4 3 2 1 IL-1α IL-2 IL-4 IL-6 IL-1 IL-12 IL-13 IL-15 IL-17 IL-18 IL-21 IL-23 IFN-α Mut Human PD-1 promoter SBE-D 5 -GTCTG- -1.2kb SBE-P -CAGAC- -1.kb
Supporting Information
 Supporting Information Desnues et al. 10.1073/pnas.1314121111 SI Materials and Methods Mice. Toll-like receptor (TLR)8 / and TLR9 / mice were generated as described previously (1, 2). TLR9 / mice were
Rapid antigen-specific T cell enrichment (Rapid ARTE)
") Direct ex vivo characterization of human antigen-specific CD154+CD4+ T cell Rapid antigen-specific T cell enrichment (Rapid ARTE) Introduction Workflow Antigen (ag)-specific T cells play a central role
Direct ex vivo characterization of human antigen-specific CD154+CD4+ T cell Rapid antigen-specific T cell enrichment (Rapid ARTE) Introduction Workflow Antigen (ag)-specific T cells play a central role
pro-b large pre-b small pre-b CCCP (µm) Rag1 -/- ;33.C9HCki
 Rag1 -/- ;33.C9HCki") a TMRM FI (Median) b TMRM FI (Median) c 20 15 10 5 0 8 6 4 2 0 pro-b large pre-b small pre-b 0 10 20 30 40 50 60 70 80 90 100 TMRM (nm) pro-b large pre-b small pre-b 0 1 2 4 8 16 32 64 128 256 CCCP (mm)
a TMRM FI (Median) b TMRM FI (Median) c 20 15 10 5 0 8 6 4 2 0 pro-b large pre-b small pre-b 0 10 20 30 40 50 60 70 80 90 100 TMRM (nm) pro-b large pre-b small pre-b 0 1 2 4 8 16 32 64 128 256 CCCP (mm)
Supplementary Figure S1. Flow cytometric analysis of the expression of Thy1 in NH cells. Flow cytometric analysis of the expression of T1/ST2 and
 Supplementary Figure S1. Flow cytometric analysis of the expression of Thy1 in NH cells. Flow cytometric analysis of the expression of T1/ST2 and Thy1 in NH cells derived from the lungs of naïve mice.
Supporting Information
 Copyright WILEY-VCH Verlag GmbH & Co. KGaA, 69469 Weinheim, Germany, 212. Supporting Information for Adv. Funct. Mater., DOI:.2/adfm.2122233 MnO Nanocrystals: A Platform for Integration of MRI and Genuine
B6/COLODR/SPL/11C/83/LAP/#2.006 B6/COLODR/SPL/11C/86/LAP/#2.016 CD11C B6/COLODR/SPL/11C/80/LAP/#2.011 CD11C
 CD3-specific antibody-induced immune tolerance and suppression of autoimmune encephalomyelitis involves TGF-β production through phagocytes digesting apoptotic T cells Sylvain Perruche 1,3, Pin Zhang 1,
HCC1937 is the HCC1937-pcDNA3 cell line, which was derived from a breast cancer with a mutation
 SUPPLEMENTARY INFORMATION Materials and Methods Human cell lines and culture conditions HCC1937 is the HCC1937-pcDNA3 cell line, which was derived from a breast cancer with a mutation in exon 20 of BRCA1
Supplementary Figure 1
 Supplementary Figure 1 Identification of IFN-γ-producing CD8 + and CD4 + T cells with naive phenotype by alternative gating and sample-processing strategies. a. Contour 5% probability plots show definition
Technical Resources. BD Immunocytometry Systems. FastImmune Intracellular Cytokine Staining Procedures
 FastImmune Intracellular Cytokine Staining Procedures BD has developed protocols for the detection of intracellular cytokines in activated lymphocytes and in activated monocytes. The procedures have been
Hua Tang, Weiping Cao, Sudhir Pai Kasturi, Rajesh Ravindran, Helder I Nakaya, Kousik
 SUPPLEMENTARY FIGURES 1-19 T H 2 response to cysteine-proteases requires dendritic cell-basophil cooperation via ROS mediated signaling Hua Tang, Weiping Cao, Sudhir Pai Kasturi, Rajesh Ravindran, Helder
Bead Based Assays for Cytokine Detection
 Bead Based Assays for Cytokine Detection September 27, 2014 6 th EFIS-EJI South East European Immunology School SEEIS 2014 Timisoara, Romania The Cells of the Immune System The Immune Reaction (Th2) (Th1)
Supplementary Data. Treg phenotype
 Supplementary Data Additional Experiment An additional experiment was performed using cryopreserved peripheral blood mononuclear cells (PBMC) derived from five renal cell carcinoma (RCC) patients [see
Supplementary Figures
 Inhibition of Pulmonary Anti Bacterial Defense by IFN γ During Recovery from Influenza Infection By Keer Sun and Dennis W. Metzger Supplementary Figures d a Ly6G Percentage survival f 1 75 5 1 25 1 5 1
were isolated from the freshly drawn blood of healthy donors and ACS patients using the
 Supplemental Figure 1. Quality control of CD4 + T-cell purification. CD4 + T cells were isolated from the freshly drawn blood of healthy donors and ACS patients using the RosetteSep CD4 + T Cell Enrichment
MATERIALS AND METHODS. Neutralizing antibodies specific to mouse Dll1, Dll4, J1 and J2 were prepared as described. 1,2 All
 MATERIALS AND METHODS Antibodies (Abs), flow cytometry analysis and cell lines Neutralizing antibodies specific to mouse Dll1, Dll4, J1 and J2 were prepared as described. 1,2 All other antibodies used
Figure S1. Gating strategy used in NK cells and γδ T lymphocytes coculture An example of flow cytometry analysis shows the gating of NK cells and γδ
 Figure S1. Gating strategy used in NK cells and γδ T lymphocytes coculture An example of flow cytometry analysis shows the gating of NK cells and γδ T lymphocytes used in all NK activation and cytotoxicity
Protein tyrosine phosphatase 1B targets PITX1/p120RasGAP. thus showing therapeutic potential in colorectal carcinoma
 Protein tyrosine phosphatase 1B targets PITX1/p120RasGAP thus showing therapeutic potential in colorectal carcinoma Hao-Wei Teng, Man-Hsin Hung, Li-Ju Chen, Mao-Ju Chang, Feng-Shu Hsieh, Ming-Hsien Tsai,
Programmed necrosis, not apoptosis, is a key mediator of cell loss and DAMP-mediated inflammation in dsrna-induced retinal degeneration
 Programmed necrosis, not apoptosis, is a key mediator of cell loss and DAMP-mediated inflammation in dsrna-induced retinal degeneration The Harvard community has made this article openly available. Please
Figure S1. PMVs from THP-1 cells expose phosphatidylserine and carry actin. A) Flow
 Flow") SUPPLEMENTARY DATA Supplementary Figure Legends Figure S1. PMVs from THP-1 cells expose phosphatidylserine and carry actin. A) Flow cytometry analysis of PMVs labelled with annexin-v-pe (Guava technologies)
SUPPLEMENTARY DATA Supplementary Figure Legends Figure S1. PMVs from THP-1 cells expose phosphatidylserine and carry actin. A) Flow cytometry analysis of PMVs labelled with annexin-v-pe (Guava technologies)
Acid sphingomyelinase is a critical regulator of cytotoxic granule secretion by
 Supplementary Data Acid sphingomyelinase is a critical regulator of cytotoxic granule secretion by primary T lymphocytes Jasmin Herz, Julian Pardo, Hamid Kashkar, Michael Schramm, Elza Kuzmenkina, Erik
Supplementary Figure 1 Lymphocytes can be tracked for at least 4 weeks after
 Supplementary Figure 1 Lymphocytes can be tracked for at least 4 weeks after photoconversion by using H2B-Dendra2. 4-5 PPs of H2B-Dendra2 BM chimeras were photoconverted and analyzed 7 days (upper panel)
Supplemental Information
 Supplemental Information Tobacco-specific Carcinogen Induces DNA Methyltransferases 1 Accumulation through AKT/GSK3β/βTrCP/hnRNP-U in Mice and Lung Cancer patients Ruo-Kai Lin, 1 Yi-Shuan Hsieh, 2 Pinpin
Supplementary Figure 1. Ex vivo IFNγ production by Tregs. Nature Medicine doi: /nm % CD127. Empty SSC 98.79% CD25 CD45RA.
 SSC CD25 1.8% CD127 Empty 98.79% FSC CD45RA CD45RA Foxp3 %IFNγ + cells 4 3 2 1 + IL-12 P =.3 IFNγ p=.9 %IL-4+ cells 3 2 1 IL-4 P =.4 c %IL-1 + cells IFNγ 4 3 2 1 Control Foxp3 IL-1 P =.41.64 4.76 MS 2.96
PBMC from each patient were suspended in AIM V medium (Invitrogen) with 5% human
 with 5% human") Anti-CD19-CAR transduced T-cell preparation PBMC from each patient were suspended in AIM V medium (Invitrogen) with 5% human AB serum (Gemini) and 300 international units/ml IL-2 (Novartis). T cell proliferation
Anti-CD19-CAR transduced T-cell preparation PBMC from each patient were suspended in AIM V medium (Invitrogen) with 5% human AB serum (Gemini) and 300 international units/ml IL-2 (Novartis). T cell proliferation
for six pairs of mice. (b) Representative FACS analysis of absolute number of T cells (CD4 + and
 Representative FACS analysis of absolute number of T cells (CD4 + and") SUPPLEMENTARY DATA Supplementary Figure 1: Peripheral lymphoid organs of SMAR1 -/- mice have an effector memory phenotype. (a) Lymphocytes collected from MLNs and Peyer s patches (PPs) of WT and SMAR1
SUPPLEMENTARY DATA Supplementary Figure 1: Peripheral lymphoid organs of SMAR1 -/- mice have an effector memory phenotype. (a) Lymphocytes collected from MLNs and Peyer s patches (PPs) of WT and SMAR1
Supplementary Information. A vital role for IL-2 trans-presentation in DC-mediated T cell activation in humans as revealed by daclizumab therapy
 Supplementary Information A vital role for IL-2 trans-presentation in DC-mediated T cell activation in humans as revealed by daclizumab therapy Simone C. Wuest 1, Jehad Edwan 1, Jayne F. Martin 1, Sungpil
SUPPLEMENTARY INFORMATION
 Supplemental Figure 1. Furin is efficiently deleted in CD4 + and CD8 + T cells. a, Western blot for furin and actin proteins in CD4cre-fur f/f and fur f/f Th1 cells. Wild-type and furin-deficient CD4 +
Supplementary Data 1. Alanine substitutions and position variants of APNCYGNIPL. Applied in
 Supplementary Data 1. Alanine substitutions and position variants of APNCYGNIPL. Applied in Supplementary Fig. 2 Substitution Sequence Position variant Sequence original APNCYGNIPL original APNCYGNIPL
Spleen. mlns. E Spleen 4.1. mlns. Spleen. mlns. Mock 17. Mock CD8 HIV-1 CD38 HLA-DR. Ki67. Spleen. Spleen. mlns. Cheng et al. Fig.
 C D E F Mock 17 Mock 4.1 CD38 57 CD8 23.7 HLA-DR Ki67 G H I Cheng et al. Fig.S1 Supplementary Figure 1. persistent infection leads to human T cell depletion and hyper-immune activation. Humanized mice
Supplementary Table 1
 Supplementary Table 1 Flow Cytometry Antibodies Antibody Fluorochrome Clone Vendor CD45 PE-cyanine 7 30-F11 D ioscience CD3 Pacific lue 17A2 iolegend (San Diego, CA) CD11b APC M1/70 iolegend (San Diego,
<10. IL-1β IL-6 TNF + _ TGF-β + IL-23
 3 ns 25 ns 2 IL-17 (pg/ml) 15 1 ns ns 5 IL-1β IL-6 TNF
Supplementary Table; Supplementary Figures and legends S1-S21; Supplementary Materials and Methods
 Silva et al. PTEN posttranslational inactivation and hyperactivation of the PI3K/Akt pathway sustain primary T cell leukemia viability Supplementary Table; Supplementary Figures and legends S1-S21; Supplementary
Serum IgE clearance is facilitated by human FcεRI internalization
 Serum IgE clearance is facilitated by human FcεRI internalization Research article Alexandra M. Greer, 1 Nan Wu, 1 Amy L. Putnam, 2 Prescott G. Woodruff, 3 Paul Wolters, 3 Jean-Pierre Kinet, 4 and Jeoung-Sook
Concentration Estimation from Flow Cytometry Exosome Data Protocol
 Concentration Estimation from Flow Cytometry Exosome Data Protocol 1. STANDARD CURVE Create a standard curve for the target exosome by plotting the mean fluorescence (y axis) against the protein concentration
- 1 - Cell types Monocytes THP-1 cells Macrophages. LPS Treatment time (Hour) IL-6 level (pg/ml)
 IL-6 level (pg/ml)") Supplementary Table ST1: The dynamic effect of LPS on IL-6 production in monocytes and THP-1 cells after GdA treatment. Monocytes, THP-1 cells and macrophages (5x10 5 ) were incubated with 10 μg/ml of
Supplementary Table ST1: The dynamic effect of LPS on IL-6 production in monocytes and THP-1 cells after GdA treatment. Monocytes, THP-1 cells and macrophages (5x10 5 ) were incubated with 10 μg/ml of
IgG3 regulates tissue-like memory B cells in HIV-infected individuals
 SUPPLEMENTARY INFORMATION Articles https://doi.org/10.1038/s41590-018-0180-5 In the format provided by the authors and unedited. IgG3 regulates tissue-like memory B cells in HIV-infected individuals Lela
Electron micrograph of phosphotungstanic acid-stained exosomes derived from murine
 1 SUPPLEMENTARY INFORMATION SUPPLEMENTARY FIGURES Supplementary Figure 1. Physical properties of murine DC-derived exosomes. a, Electron micrograph of phosphotungstanic acid-stained exosomes derived from
Supplementary information. Characterization of c-maf + Foxp3 - Regulatory T Cells Induced by. Repeated Stimulation of Antigen-Presenting B Cells
 Chien 1 Supplementary information Manuscript: SREP-16-42480A Characterization of c-maf + Foxp3 - Regulatory T Cells Induced by Repeated Stimulation of Antigen-Presenting B Cells Chien-Hui Chien 1, Hui-Chieh
Supplementary Figure S1. DD2 reactivity on human tonsils and analysis of slandc proliferation. Sections are from a representative human tonsil (a-f;
 Supplementary Figure S1. DD2 reactivity on human tonsils and analysis of slandc proliferation. Sections are from a representative human tonsil (a-f; n=10) and a representative M- TDLN (g-h; n=5) and stained
Effective Targeting of Quiescent Chronic Myelogenous
 Cancer Cell, Volume 7 Supplemental Information Effective Targeting of Quiescent Chronic Myelogenous Leukemia Stem Cells by Histone Deacetylase Inhibitors in Combination with Imatinib Mesylate Bin Zhang,
SUPPLEMENTARY INFORMATION
 DOI: 1.138/ncb3355 a S1A8 + cells/ total.1.8.6.4.2 b S1A8/?-Actin c % T-cell proliferation 3 25 2 15 1 5 T cells Supplementary Figure 1 Inter-tumoral heterogeneity of MDSC accumulation in mammary tumor
SUPPLEMENTARY INFORMATION. Supplementary Figures S1-S9. Supplementary Methods
 SUPPLEMENTARY INFORMATION SUMO1 modification of PTEN regulates tumorigenesis by controlling its association with the plasma membrane Jian Huang 1,2#, Jie Yan 1,2#, Jian Zhang 3#, Shiguo Zhu 1, Yanli Wang
Supplementary Figure 1. ETBF activate Stat3 in B6 and Min mice colons
 Supplementary Figure 1 ETBF activate Stat3 in B6 and Min mice colons a pstat3 controls Pos Neg ETBF 1 2 3 4 b pstat1 pstat2 pstat3 pstat4 pstat5 pstat6 Actin Figure Legend: (a) ETBF induce predominantly
Supplemental Information. Human CD1c + Dendritic Cells Drive. the Differentiation of CD103 + CD8 + Mucosal Effector T Cells via the Cytokine TGF-
 Immunity, Volume 38 Supplemental Information Human CD1c + Dendritic Cells Drive the Differentiation of CD103 + CD8 + Mucosal Effector T Cells via the Cytokine TGF- Chun I. Yu Christian Becker Yuanyuan
MAIT cell function is modulated by PD-1 signaling in patients with active
 MAIT cell function is modulated by PD-1 signaling in patients with active tuberculosis Jing Jiang, M.D., Xinjing Wang, M.D., Hongjuan An, M.Sc., Bingfen Yang, Ph.D., Zhihong Cao, M.Sc., Yanhua Liu, Ph.D.,
BD Pharmingen. Human Th1/Th2/Th17 Phenotyping Kit. Technical Data Sheet. Product Information. Description Components:
 Technical Data Sheet Human Th1/Th2/Th17 Phenotyping Kit Product Information Material Number: Size: Description Components: 560751 50 Tests BD Pharmingen 51-9006615 Human Th1/Th2/Th17 Phenotyping Cocktail
Supporting Information
 Supporting Information Valkenburg et al. 10.1073/pnas.1403684111 SI Materials and Methods ELISA and Microneutralization. Sera were treated with Receptor Destroying Enzyme II (RDE II, Accurate) before ELISA
Direct ex vivo characterization of human antigen-specific CD154 + CD4 + T cells Rapid antigen-reactive T cell enrichment (Rapid ARTE)
") Direct ex vivo characterization of human antigen-specific CD154 + CD4 + T cells Rapid antigen-reactive T cell enrichment (Rapid ARTE) Introduction Workflow Antigen (ag)-specific T cells play a central
Direct ex vivo characterization of human antigen-specific CD154 + CD4 + T cells Rapid antigen-reactive T cell enrichment (Rapid ARTE) Introduction Workflow Antigen (ag)-specific T cells play a central
Supplementary Materials for
 www.sciencesignaling.org/cgi/content/full/8/366/ra25/dc1 Supplementary Materials for Viral entry route determines how human plasmacytoid dendritic cells produce type I interferons Daniela Bruni, Maxime
Supplementary Materials and Methods
 Supplementary Materials and Methods Immunoblotting Immunoblot analysis was performed as described previously (1). Due to high-molecular weight of MUC4 (~ 950 kda) and MUC1 (~ 250 kda) proteins, electrophoresis
In vitro expansion of mouse CD4 + T cells
 Direct ex vivo isolation, cultivation and expansion of CD4 + T cells from mouse spleen In vitro expansion of mouse CD4 + T cells Introduction CD4 + T helper (TH) cells play a central role in the adaptive
Supplemental Figure 1. IL-3 blockade with Fab CSL362 depletes plasmacytoid dendritic cells (pdcs), but not basophils, at higher doses.
, but not basophils, at higher doses.") Supplemental Figure 1. IL-3 blockade with Fab CSL362 depletes plasmacytoid dendritic cells (pdcs), but not basophils, at higher doses. Percentage of viable (A) pdcs (Sytox Blue-, Lin1-, HLADR+, BDCA2++)
Supplemental Figure 1. IL-3 blockade with Fab CSL362 depletes plasmacytoid dendritic cells (pdcs), but not basophils, at higher doses. Percentage of viable (A) pdcs (Sytox Blue-, Lin1-, HLADR+, BDCA2++)
Supplementary Figure 1. Immune profiles of untreated and PD-1 blockade resistant EGFR and Kras mouse lung tumors (a) Total lung weight of untreated
 Total lung weight of untreated") 1 Supplementary Figure 1. Immune profiles of untreated and PD-1 blockade resistant EGFR and Kras mouse lung tumors (a) Total lung weight of untreated (U) EGFR TL mice (n=7), Kras mice (n=7), PD-1 blockade
1 Supplementary Figure 1. Immune profiles of untreated and PD-1 blockade resistant EGFR and Kras mouse lung tumors (a) Total lung weight of untreated (U) EGFR TL mice (n=7), Kras mice (n=7), PD-1 blockade
Ex vivo Human Antigen-specific T Cell Proliferation and Degranulation Willemijn Hobo 1, Wieger Norde 1 and Harry Dolstra 2*
 Ex vivo Human Antigen-specific T Cell Proliferation and Degranulation Willemijn Hobo 1, Wieger Norde 1 and Harry Dolstra 2* 1 Department of Laboratory Medicine - Laboratory of Hematology, Radboud University