Nature Biotechnology: doi: /nbt.3828
|
|
|
- Allen Cain
- 6 years ago
- Views:
Transcription
1
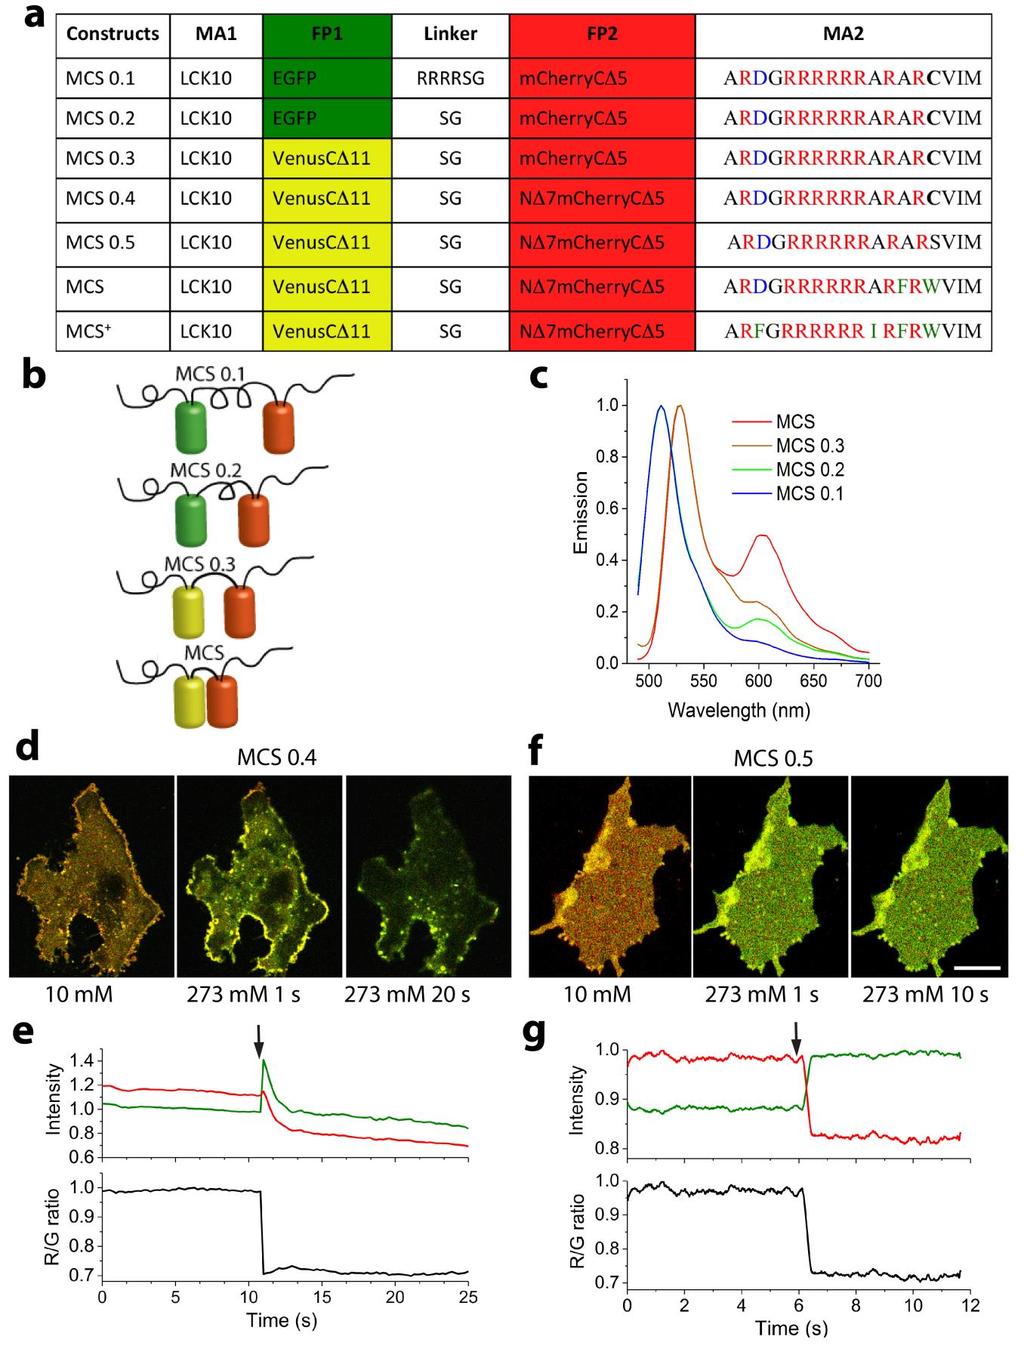
2 Supplementary Figure 1 Development of a FRET-based MCS. (a) Linker and MA2 modification are indicated by single letter amino acid code. indicates deletion of amino acids and N or C indicate the terminus where the amino acids were deleted from. Negatively charged amino acids are highlighted in blue, positively charged amino acids in red, hydrophobic residues in green and farnesylated residues are marked with C. Lck10 is the first 10 amino acid sequence of tyrosine kinase Lck. (b-c). Schematic drawings (b) and emission spectra (c) of MCS 0.1, MCS 0.2 MCS 0.3 and MCS. The emission spectra were averaged over 50 cells. (d-g) Membrane association (d, f) and change in donor (green) and acceptor (red) intensity and FRET efficiency (R/G ratio, black, e, g) when ionic strength was changed from 10 mm to 275 mm (indicated by arrows) in membrane lawns containing MCS 0.4 (d-e) and MCS 0.5 (fg). Please note that MCS 0.4 (and previous versions) partially dissociated from the plasma membrane at high ionic strength, resulting in a 49 ± 10% decrease in total donor and acceptor intensity. When the farnesylated cysteine residue at the C-terminus was removed, MCS 0.5 (and subsequent versions) remained at the plasma membrane even when exposed to high ionic strength solutions. Scale bar in d and f = 5 µm. Data are representative of n = 10 independent experiments.
3 Supplementary Figure 2 Membrane association of MCS R-pre only, MCS Lck only, MCS 0.4 and MCS during ionomyocin-induced Ca 2+ influx. (a-d) Intensity line profile across HeLa cells that expressed MCS R-Pre only (a), MCS Lck only (b), MCS 0.4 (c) and MCS (d) 0 s (black line), 100 s (red line) and 200 s (blue line) after treatment with 3 μm ionomycin to induce Ca 2+ flux. Note MCS R-Pre only that lacks the hydrophobic membrane anchor unit (MA1 in Fig. 1) completely detached from membrane. MCS 0.4 partially detached due to farnesylation (Supplementary Fig. 1). MCS Lck only and MCS remained attached to plasma membrane. Data are representative of n = 5 independent experiments.
 Change of donor (green) and acceptor (red) fluorescence and normalized donor/acceptor fluorescence (R/G) ratio as a function of ionic strength from 10 mm to 400 mm in membrane lawns containing")
4 Supplementary Figure 3 FRET readout of MCS during ionic titration. (a) Change of donor (green) and acceptor (red) fluorescence and normalized donor/acceptor fluorescence (R/G) ratio as a function of ionic strength from 10 mm to 400 mm in membrane lawns containing MCS. Measurements were taken at equilibrium for each ionic strength. The R/G ratios were normalized to the maxima. (b) Emission spectra of MCS at the indicated ionic strength values. Data in a-b are representative of n = 7 independent replicates. (c) Merged donor (green) and acceptor (red) intensity image. Two membrane sheets (highlighted by dashed lines) were compared with non-photobleached acceptor in the region of interest (ROI) 1 and photobleached acceptor in ROI 2. Scale bar = 5 μm (d) Donor (green) and acceptor (red) intensity and R/G ratio profile for ROI 1 and ROI 2 in (c) following the exchange of ionic strength from 10 mm to 275 mm. Note that acceptor photobleached ROI2 did not exhibit an increase of donor fluorescence as observed in ROI1, suggesting the increase of donor fluorescence in ROI1 was due to FRET. Data are representative of n = 3 independent experiments.
 Merged donor (green) and acceptor (red) intensity images of MCS Lck only in membrane sheets before and after solution change from 10 mm to 275 mm. Scale bar = 5 μm.")
5 Supplementary Figure 4 MCS Lck only was insensitive to ionic strength change. MCS Lck only is MCS + without the electrostatic membrane attachment unit (MA2 in Fig. 1). (a) Merged donor (green) and acceptor (red) intensity images of MCS Lck only in membrane sheets before and after solution change from 10 mm to 275 mm. Scale bar = 5 μm. (b) Donor (green) and acceptor (red) and acceptor/donor (R/G) ratio before and after solution change (black arrow) from 10 mm to 275 mm. MCS Lck only was insensitive to the effective electrostatic potential as the R/G ratio changed by < 5%. Please note that MCS Lck only remained attached to the membrane lawn indicated that the hydrophobic anchor (MA1 in Fig. 1) was sufficient for membrane attachment. Data are representative of n = 7 independent experiments.
6
7 Supplementary Figure 5 Acceptor fluorescence was not directly influenced by the change in ionic strength, and change in objective focus during solution exchange had a negligibly impact on MCS FRET measurement. (a) Change of donor intensity (green), acceptor intensity (red) under 488 nm excitation and acceptor intensity (blue) under 561 nm excitation of MCS + -containing membrane lawns exposed to solution of increasing ionic strengths. (b) The acceptor/ donor (R/G) ratio under 488 excitation at the corresponding ionic strengths. Images were taken sequentially under 488 nm and 561 nm excitation at each ionic strength. Note that the directly excited acceptor (blue) was unaffected by the ionic strength of the solution and did not mirror the intensity change of donor acceptor under 488 nm excitation. This suggested that the acceptor fluorescence was not directly influence by the ionic strength of the solution. Data are representative of n = 5 biological replicates. (c-d) Solution exchange during ionic strength titration experiments could cause a shift in focus that potentially affected R/G ratio values. Here, the maximal variations in R/G values (Max - Min) were determined by adding 300 µl of 10 mm PBS to 600 µl of 10 mm PBS. 6 reprehensive solution exchanges are shown in c, causing an average variation in R/G ratio of 7.5 ±1.0%. Data are mean and standard error of n = 10 measurements. (d) The impact of the loss of focus on R/G values was also directly measured by manually changing the objective focus up and down, causing a maximal change in R/G ratio of 11.8 ± 3.1%. Note the concurrent change of donor (green) and acceptor (red) intensity due to change in focus.
.")
8 Supplementary Figure 6 MCS R-Pre only detached from the plasma membrane at high ionic strength and after incorporation of the cationic lipid DOTAP. MCS R-Pre only is MCS + without the hydrophobic membrane attachment unit (MA1 in Fig. 1). (a) Merged donor (green) acceptor (red) intensity images of MCS R-Pre only in membrane lawns before and after solution change from 10 mm to 275 mm. Scale bar = 5 μm. (b) Donor (green) and acceptor (red) and acceptor/donor (R/G) ratio before and after the solution change (black arrow) from 10 mm to 275 mm. 75 ± 10% of the total donor and acceptor intensity of MCS R-Pre only was lost from the membrane sheet after solution change, indicating that the hydrophobic membrane anchor was required to retain MCS at the plasma membrane. Data are representative of n = 5 independent experiments. (c) Donor (green) acceptor (red) intensity images of MCS R-pre only in membrane lawn of COS-7 cell at the indicated time point during fusion of DOTAP-enriched lipid vesicles. (d) Intensity plot of donor (green) acceptor (red) of MCS R-pre only and membrane fused DOTAP lipids (cyan) that were labeled with a far-red fluorescent dye, DiR. The fusion of positively charged DOTAP lipids caused R-pre only to detach from the membrane.
9 Supplementary Figure 7 The Debye Hückel model described MCS and MCS + FRET efficiencies for a wide range of ionic strengths, demonstrating a linear relationship between FRET efficiency and the effective electrostatic potential of the membrane. (a-d) Ionic strength titration curve of MCS and MCS + is fitted to the Debye Hückel model (a, c): K -1 = M+N/sqrt(I) and extended Debye Hückel model (b, d): K -1 = M+N/{10^[-0.5*I^0.5/(1+0.98*I^0.5)]*I^0.5}^0.5 where, K -1 is electric charge potential, I is ionic strength, M is the shifting factor and N the scaling factor. Data are mean and standard error of maxima normalized R/G curves for MCS and MCS + averaged over n = 7 membrane sheets (black) with each measurement taken at equilibrium. The plot of Debye Hückel model and extended Debye Hückel model are shown in red. Fitting residuals is plotted in black dots (R 2 = in a, R 2 = in b, R 2 = in c and R 2 = in d).
10 Supplementary Figure 8
11 Membrane disassociation k off rates and association k on rate demonstrated reversibility of the MCS. (a, b) Change in donor (green) acceptor (red) intensity (a) and R/G ratio (b) of MCS when the solutions to which membrane lawns were exposed were rapidly changed from 10 mm to 275 mm. The decrease of R/G ratio in (b) could be fitted to a single exponential decay function, R/G=(R/G) max exp(-kt) (red solid line, R 2 =0.95), indicating that membrane disassociation of MCS was a first-order reaction. A magnified region of the fitting is shown in the inset with fit residuals plotted below. For fast acquisition, the images were acquired at 100 Hz using a resonance scanner. (c) Determination of T 1/2, i.e. the time it took to reach 50% of overall FRET efficiency change after the solution change. The values for k off rates were calculated from the membrane residence time T 1/2 as k off rate is the inverse of membrane residence time. For MCS, k off = 12 ± 2 s -1 (n = 21 independent measurements). (d) Comparison of k off rate of MCS 0.5 and MCS. Each symbol is one membrane sheet i.e. corresponds to one measurement. Black horizontal lines indicate the means and vertical bars the standard errors. No statistical significant difference was found between the two sensors (n = 21, * P<0.05, two-sample two tailed t-test). The data suggest that enhanced hydrophobicity of the MA2 anchor arm did not affect MCS membrane disassociation rate. (e) Donor (green) and acceptor (red) intensity and acceptor/donor (R/G) ratio of MCS on the membrane lawn before and after the ionic strength of the solution was rapidly changed from 275 mm to 35 mm (indicated by arrow). R/G ratio curve was fitted to R/G=(R/G) min exp(kt) (blue solid line, R 2 =0.991) and yielded k on = 0.5 ± 0.05 s -1, indicating that membrane association of MCS + is a first-order reaction. Data are representative of n = 7 independent experiments.
 were treated with 10")
12 Supplementary Figure 9 Electrostatic membrane potential at the endoplasmic reticulum (ER) after induction of calcium fluxes. COS-7 cells expressing MCS + and a TagRFP657-tagged ER marker (which consisted of the peptide sequence MLLSVPLLLGLLGLAVAGPVAT at N-terminus and KDEL at C-terminus of TagRFP657) were treated with 10 µm ionomycin to induce intracellular calcium fluxes. (a) Merged intensity image of MCS + (green) and TagRFP657-tagged ER marker (magenta) before and after ionomycin treatment. Two regions of interest (ROI) were selected corresponding to the ER (blue, ROI1) and a region outside the ER that contained the plasma membrane (red, ROI2). (b) Corresponding ratiometric FRET images of MCS + at the indicated time points. Scale bar = 5 μm. (c) Normalized R/G ratio of ROI1 (blue) and ROI2 (red) that were identified in a. In this example, the electrostatic membrane potential dropped much faster in ER-containing ROI1 compared to plasma membrane-containing ROI2. Data are representative of n = 5 cells.
13 Supplementary Figure 10 MCS Lck only and MCS Hras FI were largely unresponsive to calcium fluxes induced by thapsigargin and hypotonic and hypertonic treatments. FRET efficiency of MCS Lck only (a) and MCS Hras FI (b) in COS-7 cells before (black symbols) and after (red symbols) thapsigargin, hypotonic (150 mm to 40 mm) and hypertonic (150 mm to 450 mm) treatments. FRET efficiencies were normalized to the mean of untreated cells. Each symbol is one measurement in one cell; horizontal and vertical bars represent mean and standard error, respectively. ns, not significant (P > 0.05); * P < 0.05; ** P < 0.01 (unpaired, two-tailed t-test).
 Ratiometric images (R/G ratio, pseudo-colored as indicated) of MCS + in live COS-7 cells before and after exchange to hypotonic (150 mm to 40 mm) and hypertonic (150 mm to 450 mm) buffers.")
14 Supplementary Figure 11 MCS + revealed the dynamics of the electrostatic potential of the inner plasma membrane in response to osmolality shock. (a) Ratiometric images (R/G ratio, pseudo-colored as indicated) of MCS + in live COS-7 cells before and after exchange to hypotonic (150 mm to 40 mm) and hypertonic (150 mm to 450 mm) buffers. Scale bar = 10 µm. (b) Change in in donor (green) and acceptor (red) intensity and FRET efficiency (R/G ratio) for the cells shown in (a). Arrows indicate when solutions were added. Images and data in a-d are representative of n = 5 independent experiments per condition. It is noteworthy that hypotonic treatments resulted solely in an increase in FRET efficiency while hypertonic treatments caused first a rapid loss in FRET efficiency followed by a small increase. Thus quantitative live cell measurements of the effective electrostatic potential with MCS + may be able to identify compensatory mechanisms of membrane channels and pumps to hypertonic treatments because of the reversible response of the sensor.
15 Supplementary Figure 12 FRET efficiency of MCS Lck only and MCS Hras FI in response to fendiline and wortmannin treatments. (a-b) FRET efficiency of MCS Lck only (a) and MCS Hras FI (b) in COS-7 cells before (black symbols) and after (red symbols) fendiline (60 µm) and wortmannin (10 µm) treatments in fixed cells. FRET efficiencies were normalized to the mean of untreated cells. Each symbol is one cell of n = 30 independent measurements; horizontal and vertical bars represent mean and standard error, respectively. ns, not significant (P > 0.05); * P < 0.05 (unpaired, two-tailed t-test).
 reduced the effective electrostatic")
16 Supplementary Figure 13 Overexpression of the phosphatidylinositol 4,5-bisphosphate 5-phosphatase (Inp54p) reduced the effective electrostatic potential of the inner
17 plasma membrane. COS-7 cells were transfected to co-express MCS + and the CFP-tagged phosphatase Inp54p. (a, b) Intensity images of Inp54p expression (cyan) and FRET efficiency images of MCS + (pseudo-colored as indicated by the color scale). In a, a correlation between high Inp54p expression and low FRET efficiency is visible. Scale bar in a = 30 μm; Scale bar in b = 10 μm. (c) FRET efficiency (R/G ratio) of MCS + in control cells and cells overexpressing Inp54p CFP. Data were from n = 30 cells; horizontal lines indicate the means and vertical bars the standard errors. ** P < 0.01 (unpaired, two-tailed t-test). (d) R/G ratio line profile (red, 1 st y-axis) and intensity profile of Inp54p (cyan, 2 nd y-axis) across the cell shown in b; position of line profile is indicated by white line. Note that FRET efficiency was low in regions with high Inp54p expression and vice versa, even in a single cell. Taken together, the data demonstrate that chronic manipulations of phosphatidylinositol levels, here by converting phosphatidylinositol 4,5-bisphosphate to phosphatidylinositol 4-phosphate, reset the electrostatic potential as sensed by MCS +.
18 Supplementary Figure 14
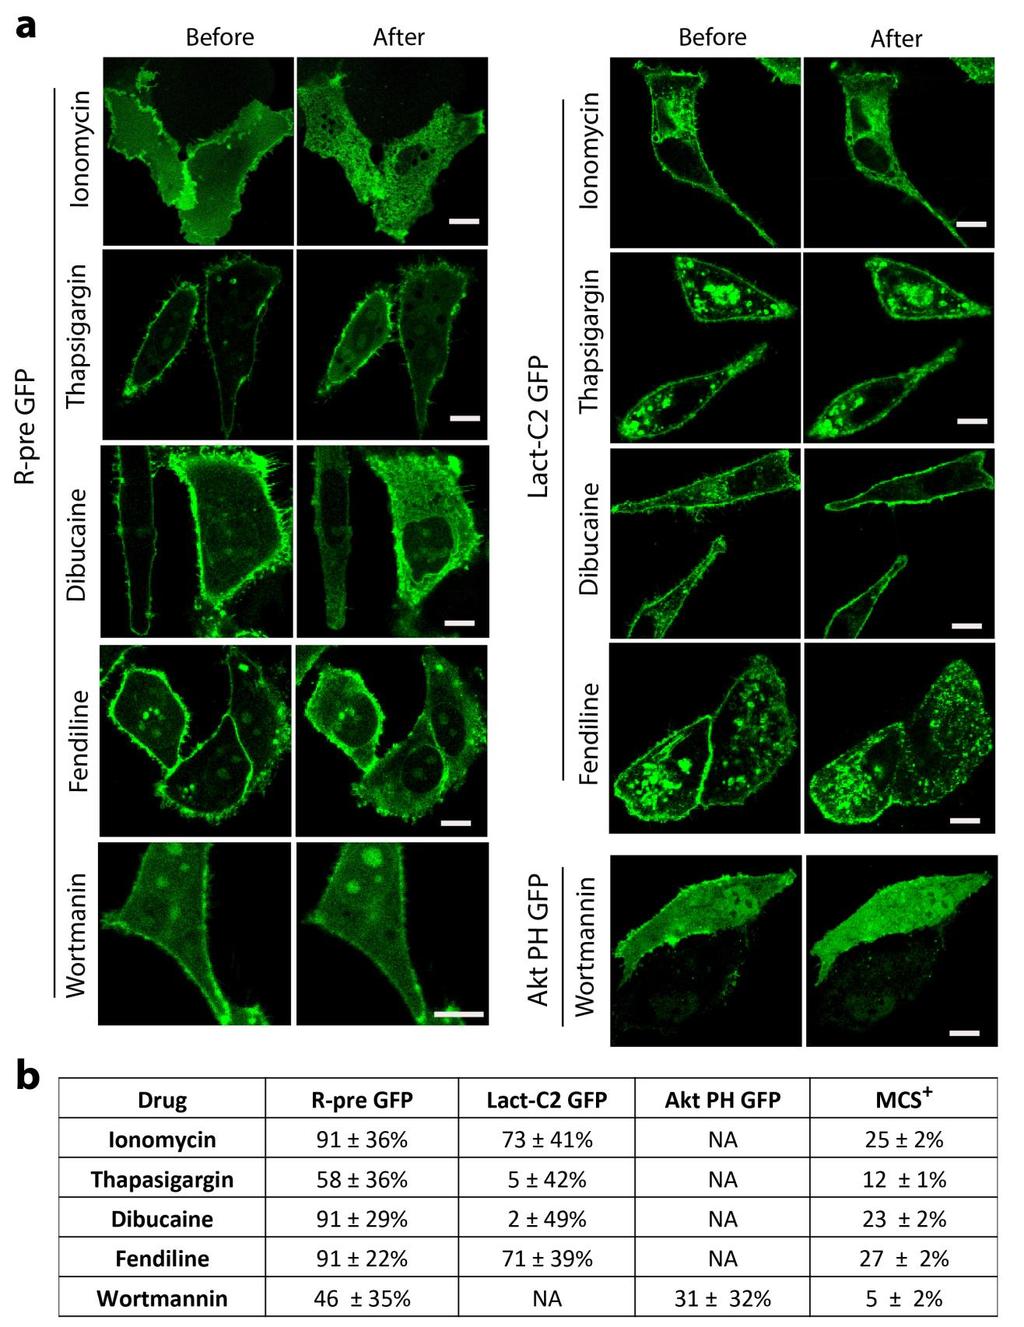
19 Comparison of MCS + to intensity-based sensors R-Pre GFP, Lact-C2 GFP and Akt PH GFP. (a) Images of R-pre GFP (membrane charge sensor), Lact-C2 GFP Lact-C2 (PS) sensor) and Akt PH GFP (which senses PIP 3 ) in COS-7 cells before and after the indicated drug treatments (3 min of 10 µm ionomycin, 20 µm thapsigargin, 1 mm dibucaine, 60 µm fendiline, or 10 µm wortmannin). The intensity ratio of plasma membrane (outer 10 pixels, ~1 µm) to cytoplasm (cell area minus outer 10 pixels) was measured with an semi-automated MATLAB routine (see Methods). Scale bar = 10 um. (b) Sensor responses as normalized plasma membrane-to-cytoplasm intensity ratios (R-pre GFP, Lact-C2 GFP and Akt PH GFP) and normalized FRET efficiency (MCS + ) in response to drug treatments. Data are mean and standard error of n = 25 cells per condition; NA = not applicable.

20 Supplementary Figure 15 FRET efficiency of MCS revealed changes of electrostatic potential at T cell activation sites, and the expression of MCS + did not affect T cell activation conditions.
21 (a-c) Merged donor (green) and acceptor (red) intensity images of Jurkat E6.1 cells expressing MCS activated with polystyrene beads coated in anti-human CD3 and anti-human CD28 antibodies (anti-cd3+28 Ab beads). Beads can be identified in the transmitted region (right). In b, regions were identified that corresponded to the central synapse (blue dotted regions) and the plasma membrane that was not part of the synapse (green dotted regions). Their corresponding R/G ratio values were plotted in c. In c, black horizontal and vertical lines indicate mean and standard error, respectively (** P<0.01, paired t-test, n = 14 cells). (d, e) Fluorescence donor lifetime image (d) and values (e) of MCS in Jurkat cells activated with anti-cd3+28 Ab beads. Fluorescence donor lifetime image was photon-weighted and pseudo-colored (blue to red) reflecting short to long lifetimes and high to low FRET, respectively. Regions corresponding to synapse (blue region and symbols) and plasma membrane that was not part of the synapse (green regions and symbols) were identified and their lifetime values were compared. In e, * P<0.05 (paired t- test, n = 5 cells). (f) Jurkat cells transfected with Lck10-GFP or MCS + were activated on anti-cd3+cd28 Ab coated coverslips. T cells were immuno-stained for phosphorylated CD3ζ and phosphorylated TCR-CD3 clusters per um 2 measured as described in Methods. ns, not significant, P > 0.05 (unpaired, two-tailed t-test).
Nature Immunology: doi: /ni.3631
 Supplementary Figure 1 SPT analyses of Zap70 at the T cell plasma membrane. (a) Total internal reflection fluorescent (TIRF) excitation at 64-68 degrees limits single molecule detection to 100-150 nm above
d e f Spatiotemporal quantification of subcellular ATP levels in a single HeLa cell during changes in morphology Supplementary Information
 Ca 2+ level (a. u.) Area (a. u.) Normalized distance Normalized distance Center Edge Center Edge Relative ATP level Relative ATP level Supplementary Information Spatiotemporal quantification of subcellular
SDS-Assisted Protein Transport Through Solid-State Nanopores
 Supplementary Information for: SDS-Assisted Protein Transport Through Solid-State Nanopores Laura Restrepo-Pérez 1, Shalini John 2, Aleksei Aksimentiev 2 *, Chirlmin Joo 1 *, Cees Dekker 1 * 1 Department
Supplementary Information. Conformational states of Lck regulate clustering in early T cell signaling
 Supplementary Information Conformational states of Lck regulate clustering in early T cell signaling Jérémie Rossy, Dylan M. Owen, David J. Williamson, Zhengmin Yang and Katharina Gaus Centre for Vascular
Supplementary Figure 1
 Supplementary Figure 1 Supplementary Figure 1 SNARE Probes for FRET/2pFLIM Analysis Used in the Present Study. mturquoise (mtq) and Venus (Ven) are in blue and yellow, respectively. The soluble N-ethylmaleimide-sensitive
El Azzouzi et al., http ://www.jcb.org /cgi /content /full /jcb /DC1
 Supplemental material JCB El Azzouzi et al., http ://www.jcb.org /cgi /content /full /jcb.201510043 /DC1 THE JOURNAL OF CELL BIOLOGY Figure S1. Acquisition of -phluorin correlates negatively with podosome
Cell Biology Lecture 9 Notes Basic Principles of cell signaling and GPCR system
 Cell Biology Lecture 9 Notes Basic Principles of cell signaling and GPCR system Basic Elements of cell signaling: Signal or signaling molecule (ligand, first messenger) o Small molecules (epinephrine,
Practice Exam 2 MCBII
 1. Which feature is true for signal sequences and for stop transfer transmembrane domains (4 pts)? A. They are both 20 hydrophobic amino acids long. B. They are both found at the N-terminus of the protein.
Supplementary Materials for
 www.sciencesignaling.org/cgi/content/full/7/334/rs4/dc1 Supplementary Materials for Rapidly rendering cells phagocytic through a cell surface display technique and concurrent Rac activation Hiroki Onuma,
Signal Transduction Cascades
 Signal Transduction Cascades Contents of this page: Kinases & phosphatases Protein Kinase A (camp-dependent protein kinase) G-protein signal cascade Structure of G-proteins Small GTP-binding proteins,
Chapter 3 subtitles Action potentials
 CELLULAR NEUROPHYSIOLOGY CONSTANCE HAMMOND Chapter 3 subtitles Action potentials Introduction (3:15) This third chapter explains the calcium current triggered by the arrival of the action potential in
Supplementary Figure 1. Overview of steps in the construction of photosynthetic protocellular systems
 Supplementary Figure 1 Overview of steps in the construction of photosynthetic protocellular systems (a) The small unilamellar vesicles were made with phospholipids. (b) Three types of small proteoliposomes
Lecture Series 4 Cellular Membranes. Reading Assignments. Selective and Semi-permeable Barriers
 Lecture Series 4 Cellular Membranes Reading Assignments Read Chapter 11 Membrane Structure Review Chapter 12 Membrane Transport Review Chapter 15 regarding Endocytosis and Exocytosis Read Chapter 20 (Cell
Bioluminescence Resonance Energy Transfer (BRET)-based studies of receptor dynamics in living cells with Berthold s Mithras
-based studies of receptor dynamics in living cells with Berthold s Mithras") Bioluminescence Resonance Energy Transfer (BRET)-based studies of receptor dynamics in living cells with Berthold s Mithras Tarik Issad, Ralf Jockers and Stefano Marullo 1 Because they play a pivotal role
Bioluminescence Resonance Energy Transfer (BRET)-based studies of receptor dynamics in living cells with Berthold s Mithras Tarik Issad, Ralf Jockers and Stefano Marullo 1 Because they play a pivotal role
nature methods Organelle-specific, rapid induction of molecular activities and membrane tethering
 nature methods Organelle-specific, rapid induction of molecular activities and membrane tethering Toru Komatsu, Igor Kukelyansky, J Michael McCaffery, Tasuku Ueno, Lidenys C Varela & Takanari Inoue Supplementary
Lecture Series 4 Cellular Membranes
 Lecture Series 4 Cellular Membranes Reading Assignments Read Chapter 11 Membrane Structure Review Chapter 12 Membrane Transport Review Chapter 15 regarding Endocytosis and Exocytosis Read Chapter 20 (Cell
CD3 coated cover slips indicating stimulatory contact site, F-actin polymerization and
 SUPPLEMENTAL FIGURES FIGURE S1. Detection of MCs. A, Schematic representation of T cells stimulated on anti- CD3 coated cover slips indicating stimulatory contact site, F-actin polymerization and microclusters.
The pi-value distribution of single-pass membrane proteins at the plasma membrane in immune cells and in total cells.
 Supplementary Figure 1 The pi-value distribution of single-pass membrane proteins at the plasma membrane in immune cells and in total cells. The PI values were measured for the first 10 amino acids in
Cell Membranes. Dr. Diala Abu-Hassan School of Medicine Cell and Molecular Biology
 Cell Membranes Dr. Diala Abu-Hassan School of Medicine Dr.abuhassand@gmail.com Cell and Molecular Biology Organelles 2Dr. Diala Abu-Hassan Membrane proteins Major components of cells Nucleic acids DNA
Validation & Assay Performance Summary
 Validation & Assay Performance Summary LanthaScreen IGF-1R GripTite Cells Cat. no. K1834 Modification Detected: Phosphorylation of Multiple Tyr Residues on IGF-1R LanthaScreen Cellular Assay Validation
Concentration Estimation from Flow Cytometry Exosome Data Protocol
 Concentration Estimation from Flow Cytometry Exosome Data Protocol 1. STANDARD CURVE Create a standard curve for the target exosome by plotting the mean fluorescence (y axis) against the protein concentration
Biology Open (2014) 000, 1 10 doi: /bio
 000, 1 10 doi: /bio") (2014) 000, 1 10 doi:10.1242/bio.201410041 Supplementary Material Michael Brauchle et al. doi: 10.1242/bio.201410041 Fig. S1. Alignment of GFP, sfgfp, egfp, eyfp, mcherry and mruby2. Sequence-based alignment
(2014) 000, 1 10 doi:10.1242/bio.201410041 Supplementary Material Michael Brauchle et al. doi: 10.1242/bio.201410041 Fig. S1. Alignment of GFP, sfgfp, egfp, eyfp, mcherry and mruby2. Sequence-based alignment
The clathrin adaptor Numb regulates intestinal cholesterol. absorption through dynamic interaction with NPC1L1
 The clathrin adaptor Numb regulates intestinal cholesterol absorption through dynamic interaction with NPC1L1 Pei-Shan Li 1, Zhen-Yan Fu 1,2, Ying-Yu Zhang 1, Jin-Hui Zhang 1, Chen-Qi Xu 1, Yi-Tong Ma
Supplementary Figure 1. Properties of various IZUMO1 monoclonal antibodies and behavior of SPACA6. (a) (b) (c) (d) (e) (f) (g) .
 (b) (c) (d) (e) (f) (g) .") Supplementary Figure 1. Properties of various IZUMO1 monoclonal antibodies and behavior of SPACA6. (a) The inhibitory effects of new antibodies (Mab17 and Mab18). They were investigated in in vitro fertilization
Supplementary Figure 1. Properties of various IZUMO1 monoclonal antibodies and behavior of SPACA6. (a) The inhibitory effects of new antibodies (Mab17 and Mab18). They were investigated in in vitro fertilization
Supplementary Figure 1 CD4 + T cells from PKC-θ null mice are defective in NF-κB activation during T cell receptor signaling. CD4 + T cells were
 Supplementary Figure 1 CD4 + T cells from PKC-θ null mice are defective in NF-κB activation during T cell receptor signaling. CD4 + T cells were isolated from wild type (PKC-θ- WT) or PKC-θ null (PKC-θ-KO)
1. endoplasmic reticulum This is the location where N-linked oligosaccharide is initially synthesized and attached to glycoproteins.
 Biology 4410 Name Spring 2006 Exam 2 A. Multiple Choice, 2 pt each Pick the best choice from the list of choices, and write it in the space provided. Some choices may be used more than once, and other
Supplemental Data. Hao et al. (2014). Plant Cell /tpc
. Plant Cell /tpc") Supplemental Figure 1. Confocal Images and VA-TIRFM Analysis of GFP-RbohD in Arabidopsis Seedlings. (A) RbohD expression in whole Arabidopsis seedlings. RbohD was expressed in the leaves, hypocotyl, and
Supplemental Figure 1. Confocal Images and VA-TIRFM Analysis of GFP-RbohD in Arabidopsis Seedlings. (A) RbohD expression in whole Arabidopsis seedlings. RbohD was expressed in the leaves, hypocotyl, and
Supplementary Figure 1. Procedures for p38 activity imaging in living cells. (a) Schematic model of the p38 activity reporter. The reporter consists
 Schematic model of the p38 activity reporter. The reporter consists") Supplementary Figure 1. Procedures for p38 activity imaging in living cells. (a) Schematic model of the p38 activity reporter. The reporter consists of: (i) the YPet domain (an enhanced YFP); (ii) the
Supplementary Figure 1. Procedures for p38 activity imaging in living cells. (a) Schematic model of the p38 activity reporter. The reporter consists of: (i) the YPet domain (an enhanced YFP); (ii) the
Lecture Series 4 Cellular Membranes
 Lecture Series 4 Cellular Membranes Reading Assignments Read Chapter 11 Membrane Structure Review Chapter 21 pages 709-717 717 (Animal( Cell Adhesion) Review Chapter 12 Membrane Transport Review Chapter
Peroxisomes. Endomembrane System. Vacuoles 9/25/15
 Contains enzymes in a membranous sac that produce H 2 O 2 Help survive environmental toxins including alcohol Help the cell use oxygen to break down fatty acids Peroxisomes Endo System Components of the
Fusion (%) = 100 (B-A)/(C-A)
 = 100 (B-A)/(C-A)") 6 Fusion (%) = 1 (B-A)/(C-A) fluorescence, a.u. x 1 C 1 B A 6 1 A Supplementary Figure 1. Fusion of lipid vesicles studied with cobalt-calcein liquid content transfer assay. An example of fusion % calibration
6 Fusion (%) = 1 (B-A)/(C-A) fluorescence, a.u. x 1 C 1 B A 6 1 A Supplementary Figure 1. Fusion of lipid vesicles studied with cobalt-calcein liquid content transfer assay. An example of fusion % calibration
Equilibrium is a condition of balance. Changes in temperature, pressure or concentration can cause a shift in the equilibrium.
 Copy into Note Packet and Return to Teacher Cells and Their Environment Section 1: Passive Transport Objectives Relate concentration gradients, diffusion, and equilibrium. Predict the direction of water
1. This is the location where N-linked oligosaccharide is initially synthesized and attached to glycoproteins.
 Biology 4410 Name Spring 2006 Exam 2 A. Multiple Choice, 2 pt each Pick the best choice from the list of choices, and write it in the space provided. Some choices may be used more than once, and other
Zool 3200: Cell Biology Exam 4 Part I 2/3/15
 Name: Key Trask Zool 3200: Cell Biology Exam 4 Part I 2/3/15 Answer each of the following questions in the space provided, explaining your answers when asked to do so; circle the correct answer or answers
Chapter 4: Cell Membrane Structure and Function
 Chapter 4: Cell Membrane Structure and Function Plasma Membrane: Thin barrier separating inside of cell (cytoplasm) from outside environment Function: 1) Isolate cell s contents from outside environment
Supplementary Figure 1. Using DNA barcode-labeled MHC multimers to generate TCR fingerprints
 Supplementary Figure 1 Using DNA barcode-labeled MHC multimers to generate TCR fingerprints (a) Schematic overview of the workflow behind a TCR fingerprint. Each peptide position of the original peptide
Light-based feedback for controlling intracellular signaling dynamics
 Nature Methods Light-based feedback for controlling intracellular signaling dynamics Jared E Toettcher, Delquin Gong, Wendell A Lim & Orion D Weiner Supplementary Figure 1 Supplementary Figure 2 Supplementary
Authors: K. L. Arendt, M. Royo, M. Fernández-Monreal, S. Knafo, C. N. Petrok, J.
 SUPPLEMENTARY INFORMATION Title: PIP 3 controls synaptic function by maintaining AMPA receptor clustering at the postsynaptic membrane Authors: K. L. Arendt, M. Royo, M. Fernández-Monreal, S. Knafo, C.
SUPPLEMENTARY INFORMATION. Supplementary Figures
 SUPPLEMENTARY INFORMATION Supplementary Figures Supplementary Figure 1: Characterization of CerTN-L15 expressed in Arabidopsis roots. a. Ratiometric images of CerTN-L15 in roots under osmotic stress Ratiometric
Supplementary Figure S1
 Supplementary Figure S1 Supplementary Figure S1. PARP localization patterns using GFP-PARP and PARP-specific antibody libraries GFP-PARP localization in non-fixed (A) and formaldehyde fixed (B) GFP-PARPx
crossmark Ca V subunits interact with the voltage-gated calcium channel
 crossmark THE JOURNAL OF BIOLOGICAL CHEMISTRY VOL. 291, NO. 39, pp. 20402 20416, September 23, 2016 Author s Choice 2016 by The American Society for Biochemistry and Molecular Biology, Inc. Published in
Signal Transduction: G-Protein Coupled Receptors
 Signal Transduction: G-Protein Coupled Receptors Federle, M. (2017). Lectures 4-5: Signal Transduction parts 1&2: nuclear receptors and GPCRs. Lecture presented at PHAR 423 Lecture in UIC College of Pharmacy,
I. Fluid Mosaic Model A. Biological membranes are lipid bilayers with associated proteins
 Lecture 6: Membranes and Cell Transport Biological Membranes I. Fluid Mosaic Model A. Biological membranes are lipid bilayers with associated proteins 1. Characteristics a. Phospholipids form bilayers
Human Anatomy & Physiology
 PowerPoint Lecture Slides prepared by Barbara Heard, Atlantic Cape Community College Ninth Edition Human Anatomy & Physiology C H A P T E R 3 Annie Leibovitz/Contact Press Images 2013 Pearson Education,
SUPPLEMENTARY FIGURE LEGENDS
 SUPPLEMENTARY FIGURE LEGENDS Supplemental FIG. 1. Localization of myosin Vb in cultured neurons varies with maturation stage. A and B, localization of myosin Vb in cultured hippocampal neurons. A, in DIV
Supplemental Figures:
 Supplemental Figures: Figure 1: Intracellular distribution of VWF by electron microscopy in human endothelial cells. a) Immunogold labeling of LC3 demonstrating an LC3-positive autophagosome (white arrow)
SUPPLEMENTARY INFORMATION
 doi: 1.138/nature6416 Supplementary Notes Spine Ca 2+ signals produced by glutamate uncaging We imaged uncaging-evoked [Ca 2+ ] transients in neurons loaded with a green Ca 2+ - sensitive indicator (G;
Supplementary Figure 1. SybII and Ceb are sorted to distinct vesicle populations in astrocytes. Nature Neuroscience: doi: /nn.
 Supplementary Figure 1 SybII and Ceb are sorted to distinct vesicle populations in astrocytes. (a) Exemplary images for cultured astrocytes co-immunolabeled with SybII and Ceb antibodies. SybII accumulates
Lecture: CHAPTER 13 Signal Transduction Pathways
 Lecture: 10 17 2016 CHAPTER 13 Signal Transduction Pathways Chapter 13 Outline Signal transduction cascades have many components in common: 1. Release of a primary message as a response to a physiological
Propagation of the Signal
 OpenStax-CNX module: m44452 1 Propagation of the Signal OpenStax College This work is produced by OpenStax-CNX and licensed under the Creative Commons Attribution License 3.0 By the end of this section,
Nature Methods: doi: /nmeth.4257
 Supplementary Figure 1 Screen for polypeptides that affect cellular actin filaments. (a) Table summarizing results from all polypeptides tested. Source shows organism, gene, and amino acid numbers used.
Alpha-Tubulin Housekeeping 10,000 tests
 Headquarters & Europe Office Cisbio Bioassays Phone: +33 (0)4 66 79 67 05 Fax: +33 (0)4 66 79 19 20 bioassays@cisbio.com cisbio_dd_pi_64atubpeh USA Office Cisbio US, Inc. Phone: +1 888 963 4567 Fax: +1
Supplementary Figure 1. ALVAC-protein vaccines and macaque immunization. (A) Maximum likelihood
 Maximum likelihood") Supplementary Figure 1. ALVAC-protein vaccines and macaque immunization. (A) Maximum likelihood tree illustrating CRF01_AE gp120 protein sequence relationships between 107 Envs sampled in the RV144 trial
Supplementary Figure 1. ALVAC-protein vaccines and macaque immunization. (A) Maximum likelihood tree illustrating CRF01_AE gp120 protein sequence relationships between 107 Envs sampled in the RV144 trial
Rama Abbady. Odai Bani-Monia. Diala Abu-Hassan
 5 Rama Abbady Odai Bani-Monia Diala Abu-Hassan Lipid Rafts Lipid rafts are aggregates (accumulations) of sphingolipids. They re semisolid clusters (10-200 nm) of cholesterol and sphingolipids (sphingomyelin
Fig. S1. Subcellular localization of overexpressed LPP3wt-GFP in COS-7 and HeLa cells. Cos7 (top) and HeLa (bottom) cells expressing for 24 h human
 and HeLa (bottom) cells expressing for 24 h human") Fig. S1. Subcellular localization of overexpressed LPP3wt-GFP in COS-7 and HeLa cells. Cos7 (top) and HeLa (bottom) cells expressing for 24 h human LPP3wt-GFP, fixed and stained for GM130 (A) or Golgi97
Fig. S1. Subcellular localization of overexpressed LPP3wt-GFP in COS-7 and HeLa cells. Cos7 (top) and HeLa (bottom) cells expressing for 24 h human LPP3wt-GFP, fixed and stained for GM130 (A) or Golgi97
THE ROLE OF ALTERED CALCIUM AND mtor SIGNALING IN THE PATHOGENESIS OF CYSTINOSIS
 Research Foundation, 18 month progress report THE ROLE OF ALTERED CALCIUM AND mtor SIGNALING IN THE PATHOGENESIS OF CYSTINOSIS Ekaterina Ivanova, doctoral student Elena Levtchenko, MD, PhD, PI Antonella
Supplemental Materials Molecular Biology of the Cell
 Supplemental Materials Molecular Biology of the Cell Garcia-Alvarez et al. Supplementary Figure Legends Figure S1.Expression and RNAi-mediated silencing of STIM1 in hippocampal neurons (DIV, days in vitro).
Cell Membranes and Signaling
 5 Cell Membranes and Signaling Concept 5.1 Biological Membranes Have a Common Structure and Are Fluid A membrane s structure and functions are determined by its constituents: lipids, proteins, and carbohydrates.
Receptor mediated Signal Transduction
 Receptor mediated Signal Transduction G-protein-linked receptors adenylyl cyclase camp PKA Organization of receptor protein-tyrosine kinases From G.M. Cooper, The Cell. A molecular approach, 2004, third
Lecture Series 5 Cellular Membranes
 Lecture Series 5 Cellular Membranes Cellular Membranes A. Membrane Composition and Structure B. Animal Cell Adhesion C. Passive Processes of Membrane Transport D. Active Transport E. Endocytosis and Exocytosis
A. Membrane Composition and Structure. B. Animal Cell Adhesion. C. Passive Processes of Membrane Transport. D. Active Transport
 Cellular Membranes A. Membrane Composition and Structure Lecture Series 5 Cellular Membranes B. Animal Cell Adhesion E. Endocytosis and Exocytosis A. Membrane Composition and Structure The Fluid Mosaic
T H E J O U R N A L O F C E L L B I O L O G Y
 T H E J O U R N A L O F C E L L B I O L O G Y Supplemental material Krenn et al., http://www.jcb.org/cgi/content/full/jcb.201110013/dc1 Figure S1. Levels of expressed proteins and demonstration that C-terminal
Supplementary Materials for
 www.sciencesignaling.org/cgi/content/full/6/283/ra57/dc1 Supplementary Materials for JNK3 Couples the Neuronal Stress Response to Inhibition of Secretory Trafficking Guang Yang,* Xun Zhou, Jingyan Zhu,
CELLS. Cells. Basic unit of life (except virus)
") Basic unit of life (except virus) CELLS Prokaryotic, w/o nucleus, bacteria Eukaryotic, w/ nucleus Various cell types specialized for particular function. Differentiation. Over 200 human cell types 56%
Basic unit of life (except virus) CELLS Prokaryotic, w/o nucleus, bacteria Eukaryotic, w/ nucleus Various cell types specialized for particular function. Differentiation. Over 200 human cell types 56%
SUPPLEMENTARY INFORMATION
 Supplementary Figure 1. Normal AMPAR-mediated fepsp input-output curve in CA3-Psen cdko mice. Input-output curves, which are plotted initial slopes of the evoked fepsp as function of the amplitude of the
F-actin VWF Vinculin. F-actin. Vinculin VWF
 a F-actin VWF Vinculin b F-actin VWF Vinculin Supplementary Fig. 1. WPBs in HUVECs are located along stress fibers and at focal adhesions. (a) Immunofluorescence images of f-actin (cyan), VWF (yellow),
Intra- and inter-molecular interactions of Protein Kinase B define its activation in vivo
 Intra- and inter-molecular interactions of Protein Kinase B define its activation in vivo Véronique Calleja *, Damien Alcor *, Michel Laguerre, Jongsun Park, Brian A. Hemmings, Borivoj Vojnovic, Julian
2. Which is likely to be a nonpolar solvent? A. B. B shows a carboxyl group, while A is only carbons and hydrogens.
 An organic chemistry lab uses thin layer chromatography to determine the relative polarity of different molecules. The molecules are added to the bottom of a glass plate covered with polar silicone gel
Nature Neuroscience: doi: /nn Supplementary Figure 1. Trial structure for go/no-go behavior
 Supplementary Figure 1 Trial structure for go/no-go behavior a, Overall timeline of experiments. Day 1: A1 mapping, injection of AAV1-SYN-GCAMP6s, cranial window and headpost implantation. Water restriction
CRY2 binding to CIB1N w/ MTHF
 Supplemental Figures: CRY2 binding to CIB1N w/ MTHF.36 Polarization.34.32.3.28 Blue.26 5 1 15 [Cry2] in nm Figure S1: Addition of MTHF does not significantly change CRY2- CIB1N binding. Direct fluorescence
Cell Membrane and Transport
 Cell Membrane and Transport 29/06/2015 11:08 AM Describe the Characteristics of the phospholipid Bilayer. The Phospholipid bilayer is made up of a double layer of membrane lipids that have a hydrophobic
Supplementary Figure 1. Basic properties of compound EPSPs at
 Supplementary Figure 1. Basic properties of compound EPSPs at hippocampal CA3 CA3 cell synapses. (a) EPSPs were evoked by extracellular stimulation of the recurrent collaterals and pharmacologically isolated
MEMBRANE STRUCTURE AND FUNCTION
 MEMBRANE STRUCTURE AND FUNCTION 2.4.2 Membranes organize the chemical activities of cells Membranes provide structural order for metabolism Form most of the cell's organelles Compartmentalize chemical
SUPPLEMENTARY INFORMATION
 High-speed atomic force microscopy shows that annexin V stabilizes membranes on the second timescale Atsushi Miyagi, Chris Chipot, Martina Rangl & Simon Scheuring Supplementary Movies: Supplementary Movie
Cytoskeleton. Provide shape and support for the cell. Other functions of the cytoskeleton. Nucleolus. Nucleus
 Chapter 4: Cell Structure and Function Cytoskeleton The cytoskeleton is a network of fibers that organizes structures and activities in the cell. Microtubules (the largest) Intermediate fibers Microfilaments
Nature Structural & Molecular Biology: doi: /nsmb Supplementary Figure 1
 Supplementary Figure 1 Design of isolated protein and RNC constructs, and homogeneity of purified RNCs. (a) Schematic depicting the design and nomenclature used for all the isolated proteins and RNCs used
T H E J O U R N A L O F C E L L B I O L O G Y
 Supplemental material Chen et al., http://www.jcb.org/cgi/content/full/jcb.201210119/dc1 T H E J O U R N A L O F C E L L B I O L O G Y Figure S1. Lack of fast reversibility of UVR8 dissociation. (A) HEK293T
were isolated from the freshly drawn blood of healthy donors and ACS patients using the
 Supplemental Figure 1. Quality control of CD4 + T-cell purification. CD4 + T cells were isolated from the freshly drawn blood of healthy donors and ACS patients using the RosetteSep CD4 + T Cell Enrichment
T H E J O U R N A L O F C E L L B I O L O G Y
 T H E J O U R N A L O F C E L L B I O L O G Y Supplemental material Lu et al., http://www.jcb.org/cgi/content/full/jcb.201012063/dc1 Figure S1. Kinetics of nuclear envelope assembly, recruitment of Nup133
Dynamic Partitioning of a GPI-Anchored Protein in Glycosphingolipid-Rich Microdomains Imaged by Single-Quantum Dot Tracking
 Additional data for Dynamic Partitioning of a GPI-Anchored Protein in Glycosphingolipid-Rich Microdomains Imaged by Single-Quantum Dot Tracking Fabien Pinaud 1,3, Xavier Michalet 1,3, Gopal Iyer 1, Emmanuel
Danish Research Institute of Translational Neuroscience DANDRITE, Nordic-EMBL Partnership
 Supplementary Information for Tuning of the Na,K-ATPase by the beta subunit Florian Hilbers 1,2,3, Wojciech Kopec 4, Toke Jost Isaksen 3,5, Thomas Hellesøe Holm 3,5, Karin Lykke- Hartmann 3,5,6, Poul Nissen
BIOL1040 Study Guide Sample
 BIOL1040 Study Guide Sample Introduction: BIOL1040 is perhaps one of the hardest first year subjects due to both the 85% final exam and the amount of content involved. However it is conquerable and these
ATP-independent reversal of a membrane protein aggregate by a chloroplast SRP
 ATP-independent reversal of a membrane protein aggregate by a chloroplast SRP Peera Jaru-Ampornpan 1, Kuang Shen 1,3, Vinh Q. Lam 1,3, Mona Ali 2, Sebastian Doniach 2, Tony Z. Jia 1, Shu-ou Shan 1 Supplementary
B16-F10 (Mus musculus skin melanoma), NCI-H460 (human non-small cell lung cancer
, NCI-H460 (human non-small cell lung cancer") Electronic Supplementary Material (ESI) for ChemComm. This journal is The Royal Society of Chemistry 2017 Experimental Methods Cell culture B16-F10 (Mus musculus skin melanoma), NCI-H460 (human non-small
Electronic Supplementary Material (ESI) for ChemComm. This journal is The Royal Society of Chemistry 2017 Experimental Methods Cell culture B16-F10 (Mus musculus skin melanoma), NCI-H460 (human non-small
Ch7: Membrane Structure & Function
 Ch7: Membrane Structure & Function History 1915 RBC membranes studied found proteins and lipids 1935 membrane mostly phospholipids 2 layers 1950 electron microscopes supported bilayer idea (Sandwich model)
Gel-assisted formation of giant unilamellar vesicles
 Gel-assisted formation of giant unilamellar vesicles Andreas Weinberger 1, Feng-Ching Tsai 2, Gijsje H. Koenderink 2, Thais F. Schmidt 3, Rosângela Itri 4, Wolfgang Meier 5, Tatiana Schmatko 1, André Schröder
Lecture 15. Membrane Proteins I
 Lecture 15 Membrane Proteins I Introduction What are membrane proteins and where do they exist? Proteins consist of three main classes which are classified as globular, fibrous and membrane proteins. A
Summary and Discussion antigen presentation
 Summary and Discussion antigen presentation 247 248 Summary & Discussion Summary and discussion: antigen presentation For a cell to communicate information about its internal health and status to the immune
BCOR 011 Lecture 19 Oct 12, 2005 I. Cell Communication Signal Transduction Chapter 11
 BCOR 011 Lecture 19 Oct 12, 2005 I. Cell Communication Signal Transduction Chapter 11 External signal is received and converted to another form to elicit a response 1 Lecture Outline 1. Types of intercellular
Supplementary Figure 1. Mother centrioles can reduplicate while in the close association
 C1-GFP distance (nm) C1-GFP distance (nm) a arrested HeLa cell expressing C1-GFP and Plk1TD-RFP -3 s 1 2 3 4 5 6 7 8 9 11 12 13 14 16 17 18 19 2 21 22 23 24 26 27 28 29 3 b 9 8 7 6 5 4 3 2 arrested HeLa
Zool 3200: Cell Biology Exam 4 Part I 2/3/15
 Name: Trask Zool 3200: Cell Biology Exam 4 Part I 2/3/15 Answer each of the following questions in the space provided, explaining your answers when asked to do so; circle the correct answer or answers
Chapter 11. Cell Communication
 Chapter 11 Cell Communication Overview: The Cellular Internet Cell-to-cell communication Is absolutely essential for multicellular organisms Concept 11.1: External signals are converted into responses
The Cell Membrane & Movement of Materials In & Out of Cells PACKET #11
 1 February 26, The Cell Membrane & Movement of Materials In & Out of Cells PACKET #11 Introduction I 2 Biological membranes are phospholipid bilayers with associated proteins. Current data support a fluid
SUPPORTING INFORMATION. Evidence for Regulation of Hemoglobin Metabolism and Intracellular Ionic Flux
 SUPPORTING INFORMATION Evidence for Regulation of Hemoglobin Metabolism and Intracellular Ionic Flux by the Plasmodium falciparum Chloroquine Resistance Transporter Andrew H. Lee, Satish K. Dhingra, Ian
Meaning-based guidance of attention in scenes as revealed by meaning maps
 SUPPLEMENTARY INFORMATION Letters DOI: 1.138/s41562-17-28- In the format provided by the authors and unedited. -based guidance of attention in scenes as revealed by meaning maps John M. Henderson 1,2 *
Lipids and Membranes
 Lipids and Membranes Presented by Dr. Mohammad Saadeh The requirements for the Pharmaceutical Biochemistry I Philadelphia University Faculty of pharmacy Membrane transport D. Endocytosis and Exocytosis
Phosphoinositides Regulate Ciliary Protein Trafficking to Modulate Hedgehog Signaling
 Developmental Cell Supplemental Information Phosphoinositides Regulate Ciliary Protein Trafficking to Modulate Hedgehog Signaling Francesc R. Garcia-Gonzalo, Siew Cheng Phua, Elle C. Roberson, Galo Garcia
Tala Saleh. Ahmad Attari. Mamoun Ahram
 23 Tala Saleh Ahmad Attari Minna Mushtaha Mamoun Ahram In the previous lecture, we discussed the mechanisms of regulating enzymes through inhibitors. Now, we will start this lecture by discussing regulation
Chapter 9 - Biological Membranes. Membranes form a semi-permeable boundary between a cell and its environment.
 Chapter 9 - Biological Membranes www.gsbs.utmb.edu/ microbook/ch037.htmmycoplasma Membranes form a semi-permeable boundary between a cell and its environment. Membranes also permit subcellular organization
A genetically targeted optical sensor to monitor calcium signals in astrocyte processes
 A genetically targeted optical sensor to monitor calcium signals in astrocyte processes 1 Eiji Shigetomi, 1 Sebastian Kracun, 2 Michael V. Sofroniew & 1,2 *Baljit S. Khakh Ψ 1 Departments of Physiology