Type of file: PDF Title of file for HTML: Supplementary Information Description: Supplementary Figures
|
|
|
- Georgia Kelley
- 6 years ago
- Views:
Transcription
1 Type of file: PDF Title of file for HTML: Supplementary Information Description: Supplementary Figures Type of file: MOV Title of file for HTML: Supplementary Movie 1 Description: NLRP3 is moving along microtubule. PMA-differentiated THP-1 cells stably expressing Cherry-NLRP3 (red) were stained with TubulinTracker green to label microtubules (green), and Mitotracker Deep Red FM to label mitochondria (magenta). Arrow indicates a NLRP3 particle, and arrowhead indicates a mitochondrion. Cells were stimulated with nigericin (3 µm). Video corresponds to seconds; width of the movie is 23.3 µm. Type of file: MOV Title of file for HTML: Supplementary Movie 2 Description: Movement of NLRP3 in MARK4 knock-down cells. PMA-differentiated THP-1 cells stably expressing Cherry-NLRP3 and shrna (scrambled control or MARK4) were stimulated with nigericin (3 µm). Video corresponds to 291 seconds; width of each movie is 25.5 µm. Type of file: MOV Title of file for HTML: Supplementary Movie 3 Description: Knock-down of MARK4 affects translocation of NLRP3 on mitochondria. PMAdifferentiated THP-1 cells stably expressing Cherry-NLRP3 (red) and shrna (scrambled control or MARK4) were stimulated with nigericin (3 µm for 2 hrs), and then stained with mitotracker dye to label mitochondrion (green). Z section pictures were stacked to reconstitute 3D view. Type of file: MOV Title of file for HTML: Supplementary Movie 4 Description: MARK4 and NLRP3 are moving together to MTOC. PMA-differentiated THP-1 cells stably expressing Cherry-NLRP3 (red) and GFPMARK4 (green) were stimulated with nigericin (10 µm). Arrowhead indicates MTOC where MARK4 is accumulated. Video corresponds to seconds; width of the movie is 30.3 µm. Type of file: MOV Title of file for HTML: Supplementary Movie 5 Description: NLRP3 is shuttling towards MTOC. PMA-differentiated THP-1 cells stably expressing Cherry-NLRP3 (red) were stained with Tubulin Tracker green to label microtubules (green) before or after nigericin stimulation (10 µm for 2 hrs). Z section pictures were stacked to reconstitute 3D view. Type of file: MOV Title of file for HTML: Supplementary Movie 6 Description: Insufficient MARK4 causes dilated ring structure of NLRP3. HEK293T cells were cooverexpressed with GFP-MARK4, Cherry-NLRP3 and ASC-Flag (indicated as MARK4 GFP o.e.); or cooverexpressed with MARK4 shrna (shown by green GFP), Cherry-NLRP3 and ASC-Flag (indicated as MARK4 shrna). One day after expression, cells were subject to imaging. Z section pictures were stacked to reconstitute 3D view. Type of file: PDF Title of file for HTML: Peer Review File Description:
2 Supplementary Figure 1. Microtubule-disrupting drugs reduce IL-1β production. Microtubule disrupting drugs colchicine (10 µm), nocodazole (10 µm) and vinblastine (10 µm) were used to pretreat WT BMDM 30 minutes before ATP stimulation (5 mm) for half an hour. Supernatant was collected, and IL-1β was measured using ELISA. Mean ± SEM, three experiments. Comparisons of the two different groups were analysed by unpaired t test. P < 0.01 (**) were considered as statistically significant (a, b, c, d).
 Western blots to confirm MARK4 and NLRP3 expression in undifferentiated THP-1 monocytes or PMAdifferentiated THP-1 macrophages (b), or wild type BMDM before or after LPS priming (c).")
3 Supplementary Figure 2. MARK4 expression in macrophages. (a) MARK4 expression under nigericin (3 µm for 2 hrs) stimulated conditions in differentiated human THP1 cells. Scale bar = 10 µ m. (b, c) Western blots to confirm MARK4 and NLRP3 expression in undifferentiated THP-1 monocytes or PMAdifferentiated THP-1 macrophages (b), or wild type BMDM before or after LPS priming (c). (d) MARK4 expression in THP-1 cells after knocking-down by shrna MARK4 or shrna scrambled control.
.(b) A time course of LPS priming (100 ng/ml) on BMDM of wild type or MARK4 KO cells.")
4 Supplementary Figure 3. The expression profile of MARK4 knock-out cells. (a) Western blot of cell lysates collected from BMDM of wild type or MARK4 KO mice. Cells were primed with LPS (100 ng/ml).(b) A time course of LPS priming (100 ng/ml) on BMDM of wild type or MARK4 KO cells. Western blot of cell lysates collected from these cells.
5 Supplementary Figure 4. The differentiation of MARK4 knock-out cells. (a) Flow cytometry analysis of macrophage differentiation using CD11b (+) F4/80(+) double positive markers. (b) LPS receptor TLR4, M- CSF receptor (CD115), and macrophage differentiation markers were compared between wild-type and MARK4 deficient BMDMs. Comparisons of the two different groups were analysed by unpaired t test. NS was considered as not statistically significant.

6 Supplementary Figure 5. Phagocytosis ability of MARK4 knockout cells. (a) Wild-type or MARK4 deficient BMDM were incubated with MSU crystals. Phagocytosed MSU was taken by reflection microscopy and plasma membrane was highlighted by cholera toxin staining. Scale bar= 40 µm. (b) Phagocytosis ability of MARK4 knockout cells was also analyzed by Vybrant phagocytosis assay following manufacturer s instruction. Comparisons of the two different groups were analysed by unpaired t test. NS was considered as not statistically significant.
7 Supplementary Figure 6. The effect of stimulation on MARK4 knock-out cells. (a, b, c,d ) BMDM derived from MARK4 WT or KO mice were treated with various stimuli indicated. TNF (a), IL-1α (b), and IL-18(c) were measured using ELISA, and cell death was measured by using LDH cytotoxicity assay (d). (e) Cell death induced by ATP (5 mm) over a time course was measured by LDH cytotoxicity assay. Mean ± SEM, three to four experiments. Comparisons of the two different groups were analysed by unpaired t test. P < 0.05 (*), P < 0.01 (**), P < 0.001(***), and P < (****) were considered as statistically significant.
 was considered as statistically significant.")
8 Supplementary Figure 7. MARK4 selectively binds to NLRP3. (a) PLA signal of NLRP3 and MARK4 in THP-1 cells, with or without nigericin stimulation (3 µm for 2 hrs). Scale bar= 10 µm. Comparisons of the two different groups were analysed by unpaired t test. P < 0.001(***) was considered as statistically significant. (b) Western blots of co- immunoprecipitated NLRP1, NLRC4, or Aim2 respectively with MARK4. (c) Western blots of co- immunoprecipited MARK1, 2, 3, or 4 respectively with NLRP3. Proteins were transiently co-overexpressed in HEK-293T cells. Results are representatives of three experiments.

9 Supplementary Figure 8. Interaction of MARK4 and ASC. PLA signal of MARK4 and ASC in BMDM, with or without nigericin stimulation (3 µm for 2 hrs). Mean ± SEM for all the cells taken from at least 5 different views at 40X magnification for each group. Experiments have been repeated three times. Scale bar = 10 µm. Comparisons of the two different groups were analysed by unpaired t test. NS was considered as not statistically significant.
10 Supplementary Figure 9. Analysis of NLRP3 motility. (a) Representative kymographs showing uni and bidirectional movements of NLRP3 particles in differentiated THP-1 cells after stimulation with nigericin (3 µm). It illustrates an example when fluorescent spots did not show any displacement over time. Yellow arrowheads show reversal of movement direction by an individual particle, while white arrowhead depicts pause event before the particle continues to travel in the same direction. Scale bars for X (displacement in µm, d ) and Y (time in s, t ) axis are shown as yellow lines in the kymograph. (b) Box and whisker plots presents dispersion of run lengths measured for the NLRP3 particle movements in Control or MARK4 shrna background. Mean run length is illustrated by + sign in box and whisker plot, while horizontal line describes median. Mean run length of ± µm (Mean ± SEM) and ± µm was observed in cells with Control and MARK4 shrna respectively. Mean velocity of ± µm/s and ± µm/s was observed in cells with Control and MARK4 shrna respectively. See also Supplementary Movie 3.
 PLA signal of NLRP3 and ASC complex on mitochondria in WT or MARK4 KO BMDM cells after nigericin stimulation (3 µm for 2 hrs).")
11 Supplementary Figure 10. MARK4 is involved in positioning NLRP3 onto mitochondria. (a) PLA signal of NLRP3 and ASC complex on mitochondria in WT or MARK4 KO BMDM cells after nigericin stimulation (3 µm for 2 hrs).. Overlap coefficient was shown as Mean ± SEM for all the cells taken from at least 5 different views at 40x magnification for each group. Scale bar= 10 µm. (b) Subcellular fractionation of WT and MARK4 KO BMDMs after nigericin stimulation (7.5 µm for 30 mins). C indicates cytosol, M indicates mitochondria. Western blots are representatives of 3 independent experiments. Comparisons of the two different groups were analysed by unpaired t test. P < 0.001(***) was considered as statistically significant.

12 Supplementary Figure 11. MARK4 and NLRP3 are co-localized on MTOC after inflammasome activation. HEK293T cells co-overexpressing NLRP3-Cherry, MARK4- GFP, and ASC-Flag were fixed and stained with γ-tubulin. Arrowhead indicates γ-tubulin, and arrows indicate co-localized NLRP3 with MARK4. Scale bar = 10 µm.
 HEK293T cells were co-overexpressed with GFP- MARK4, NLRP3-Flag and Cherry-ASC (indicated as MARK4 GFP o.e.); or co- overexpressed with MARK4 shrna (shown by green GFP), NLRP3-Flag and Cherry-ASC (indicated as MARK4 shrna).")
13 Supplementary Figure 12. ASC speck is localized on the MTOC. (a) Differentiated THP-1 cells were stimulated with nigericin (10 µμ for 1.5 hrs) or left untreated (control). Endogeneous ASC forms speck on MTOC, indicated by γ- tubulin. Scale bar = 10 µm. (b) HEK293T cells were co-overexpressed with GFP- MARK4, NLRP3-Flag and Cherry-ASC (indicated as MARK4 GFP o.e.); or co- overexpressed with MARK4 shrna (shown by green GFP), NLRP3-Flag and Cherry-ASC (indicated as MARK4 shrna). In HEK293T cells, knock down of MARK4 by shrna (indicated by GFP) led to an enlarged structure of ASC. Quantification of ASC speck size is shown. Scale bar = 40 µm. Comparisons of the two different groups were analysed by unpaired t test. P < (****) was considered as statistically significant.

14 Supplementary Figure 13. ASC oligomerization is altered in MARK4 deficient cells. ASC oligomerization induced by indicated stimuli in MARK4+/+ and MARK4-/- LPS- primed BMDMs. TX, Triton X-100.
 Alignment of pyrin domain-containing proteins NLRP3, NLRP1, ASC, And AIM2 with CagA peptide. (c) Control peptides by mutating the predicted binding sites to glycine were employed.")
15 Supplementary Figure 14. CagA peptide exhibits structural similarity with pyrin domain of NLRP3. (a) Structural alignment of CagA peptide (blue) (PDB: 3IEC) with pyrin domain of NLRP3 (PDB: 3QF2). (b) Alignment of pyrin domain-containing proteins NLRP3, NLRP1, ASC, And AIM2 with CagA peptide. (c) Control peptides by mutating the predicted binding sites to glycine were employed. (d) Representative western blots of Caspase-1 (CASP1) and IL-1β in the supernatant (Sup.) in CagA peptide and control peptide-treated macrophages activated with indicated stimuli. Cell lysates were used as controls to indicate equal amount of cells for analysis.
 Mouse neutrophils isolated from blood (a) were subject to transwell migration")
 KC levels in peritoneal exudate of mice (MARK4 -/-, MARK4 +/+, NLRP3 -/- )")
 Example of flow cytometry gating strategy for peritoneal exudates.")


16 d Supplementary Figure 15. The effect of MARK4 deficiency on neutrophil migration. (a) Mouse neutrophils isolated from blood (a) were subject to transwell migration assay. (b) Migrated neutrophil number was counted upon chemokine CXCL12 attraction. (c) KC levels in peritoneal exudate of mice (MARK4 -/-, MARK4 +/+, NLRP3 -/- ) injected i.p. with MSU, with or without IL- 1β blocking antibody. (d) Example of flow cytometry gating strategy for peritoneal exudates. Total cells were gated at single cells, then single cells were gated at CD11b positive cells, and then CD11b positive cells were gated at Ly6G high Ly6C high as neutrophils. Comparisons of the two different groups were analysed by unpaired t test. NS was considered as not statistically significant. P < 0.05 (*), and P < 0.01 (**) were considered as statistically significant.
 Upon NLRP3 inflammasome stimulation, MARK4 binds to NLRP3 and transports it along microtubules to ensure optimal positioning and activation.")
17 Supplementary Figure 16. Schematic representation of the role of MARK4 in positioning NLRP3. (a) In the resting state, MARK4 and NLRP3 are distributed throughout the cytoplasm. (b) Upon NLRP3 inflammasome stimulation, MARK4 binds to NLRP3 and transports it along microtubules to ensure optimal positioning and activation. During the transport process, they can encounter mitochondria. (c) Where NLRP3 may receive additional activatory cues, NLRP3 and MARK4 are further transported along microtubules to reach MTOC, where NLRP3 forms the characteristic speck structure required for optimal inflammasome activation.

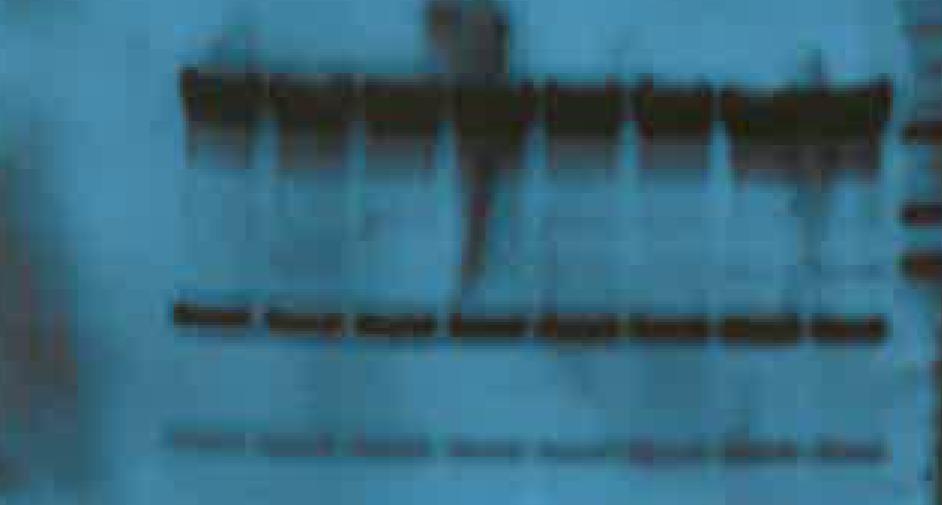
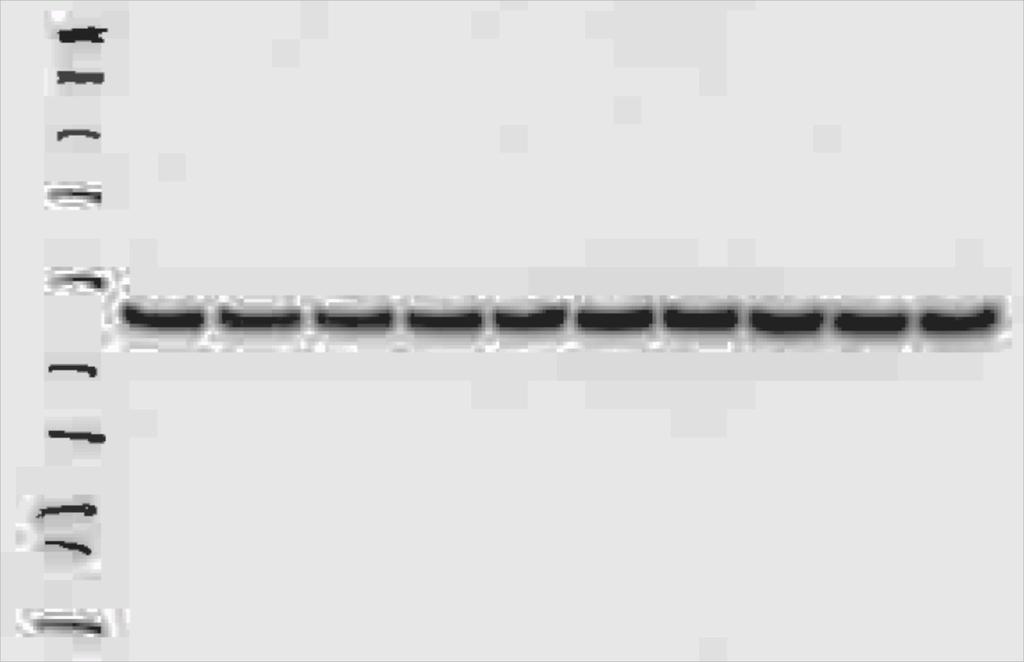
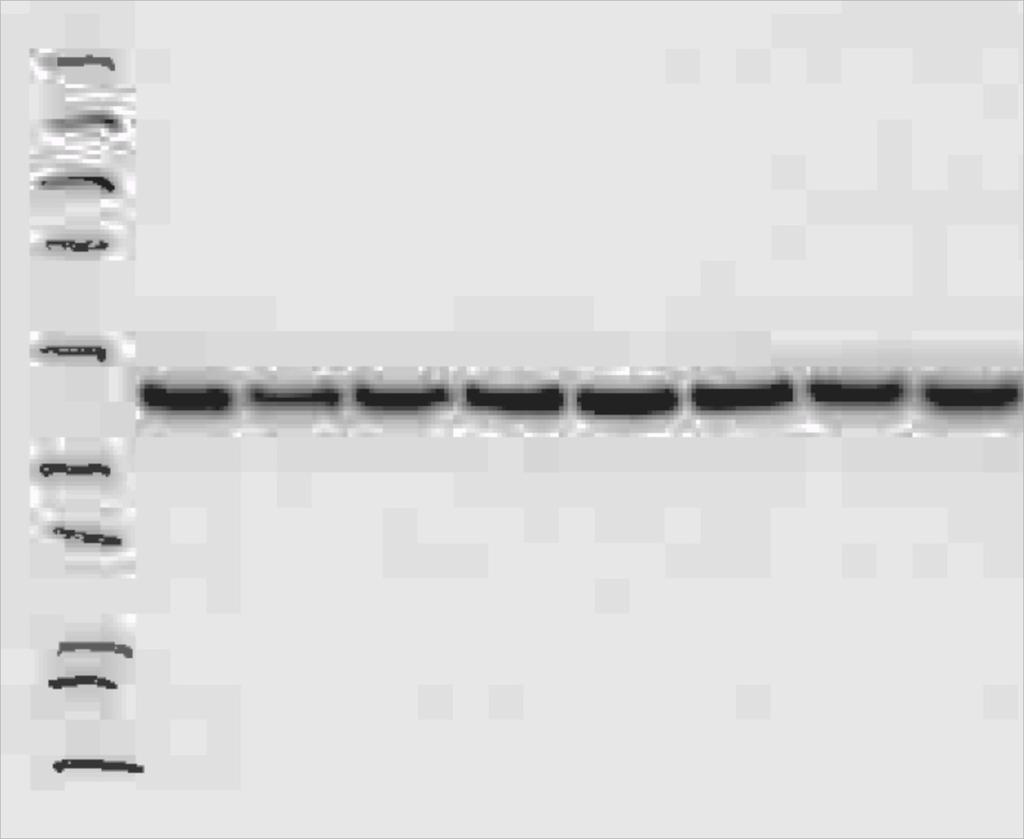
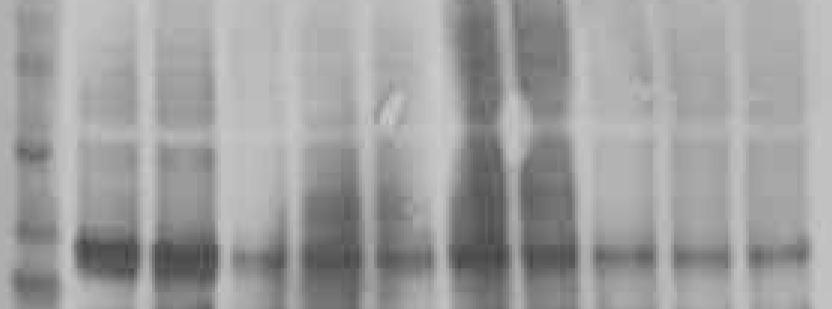

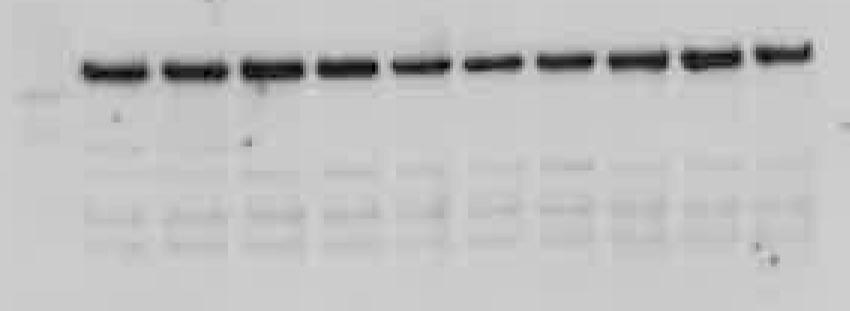
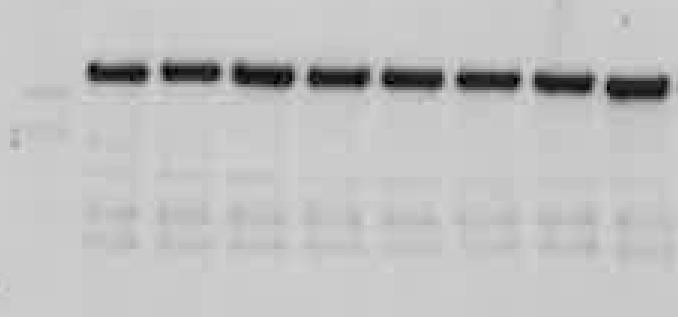
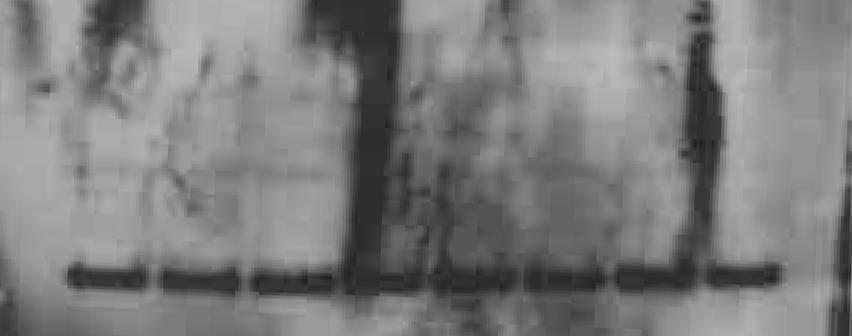
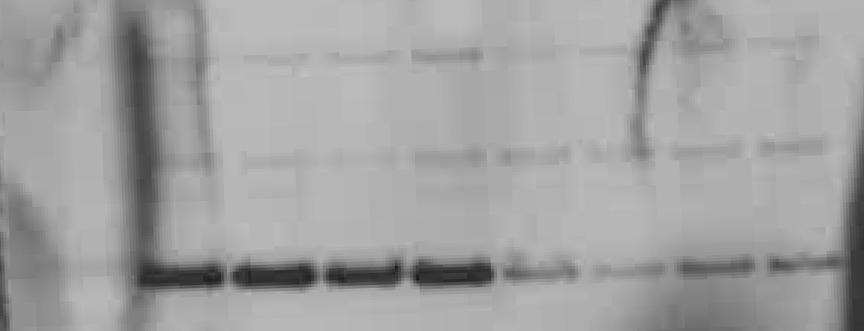

18 52# 38# 31# Fig.#1e#(Gel#source#data)## 24# 17# 12# 52# 38# 31# 24# 17# 12# 52# 38# 76# 52# 38# 76# 38# 31# 52# 76# 38# 31# 52# 76# 52# 150# 76# 102# 52# 150# 76# 102# 31# 31# 31# 24# 17# 31# 24# 17# 150# 102# 76# 52# 38# 150# 102# 76# 52# 38#
19

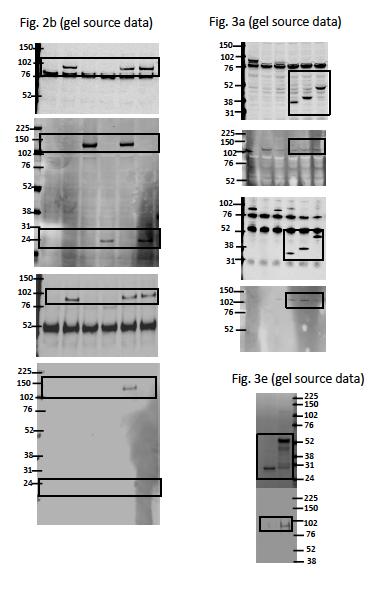
20 Supplementary Figure 17. Gel source data. The original western blot examples of Figure 1, 2 and 3 were displayed with molecular weight marker positions labeled on each blot.
21 Supplementary Movie 1. NLRP3 is moving along microtubule. PMA-differentiated THP-1 cells stably expressing Cherry-NLRP3 (red) were stained with TubulinTracker green to label microtubules (green), and Mitotracker Deep Red FM to label mitochondria (magenta). Arrow indicates a NLRP3 particle, and arrowhead indicates a mitochondrion. Cells were stimulated with nigericin (3 µm). Video corresponds to seconds; width of the movie is 23.3 µm. Supplementary Movie 2. Movement of NLRP3 in MARK4 knock-down cells. PMA-differentiated THP-1 cells stably expressing Cherry-NLRP3 and shrna (scrambled control or MARK4) were stimulated with nigericin (3 µm). Video corresponds to 291 seconds; width of each movie is 25.5 µm. Supplementary Movie 3. Knock-down of MARK4 affects translocation of NLRP3 on mitochondria. PMA-differentiated THP-1 cells stably expressing Cherry-NLRP3 (red) and shrna (scrambled control or MARK4) were stimulated with nigericin (3 µm for 2 hrs), and then stained with mitotracker dye to label mitochondrion (green). Z section pictures were stacked to reconstitute 3D view. Supplementary Movie 4. MARK4 and NLRP3 are moving together to MTOC. PMA-differentiated THP-1 cells stably expressing Cherry-NLRP3 (red) and GFP- MARK4 (green) were stimulated with nigericin (10 µm). Arrowhead indicates MTOC where MARK4 is accumulated. Video corresponds to seconds; width of the movie is 30.3 µm. Supplementary Movie 5. NLRP3 is shuttling towards MTOC. PMA-differentiated
22 THP-1 cells stably expressing Cherry-NLRP3 (red) were stained with Tubulin Tracker green to label microtubules (green) before or after nigericin stimulation (10 µm for 2 hrs). Z section pictures were stacked to reconstitute 3D view. Supplementary Movie 6. Insufficient MARK4 causes dilated ring structure of NLRP3. HEK293T cells were co-overexpressed with GFP-MARK4, Cherry-NLRP3 and ASC-Flag (indicated as MARK4 GFP o.e.); or co-overexpressed with MARK4 shrna (shown by green GFP), Cherry-NLRP3 and ASC-Flag (indicated as MARK4 shrna). One day after expression, cells were subject to imaging. Z section pictures were stacked to reconstitute 3D view.
Supplementary Video 1. Loss of MitoTracker in WT BMDM. WT BMDM were LPS primed
 Supplementary Video 1. Loss of MitoTracker in WT BMDM. WT BMDM were LPS primed for 3-4 hrs and treated with 20 μm nigericin two minutes into imagining. Cells were labeled with MitoTracker (red) and psiva
SUPPLEMENTARY INFORMATION
 DOI: 10.1038/ncb2988 Supplementary Figure 1 Kif7 L130P encodes a stable protein that does not localize to cilia tips. (a) Immunoblot with KIF7 antibody in cell lysates of wild-type, Kif7 L130P and Kif7
Nature Immunology: doi: /ni.3866
 Nature Immunology: doi:10.1038/ni.3866 Supplementary Figure 1 The effect of TIPE2 on chemotaxis. a, The expression of TIPE2 in dhl-60c, dhl-60t, TIPE2-expressing and 15/16Q-expressing dhl-60t neutrophils
SUPPLEMENTARY INFORMATION
 SUPPLEMENTARY INFORMATION doi:10.1038/nature11429 S1a 6 7 8 9 Nlrc4 allele S1b Nlrc4 +/+ Nlrc4 +/F Nlrc4 F/F 9 Targeting construct 422 bp 273 bp FRT-neo-gb-PGK-FRT 3x.STOP S1c Nlrc4 +/+ Nlrc4 F/F casp1
Title of file for HTML: Supplementary Information Description: Supplementary Figures and Supplementary Table
 Title of file for HTML: Supplementary Information Description: Supplementary Figures and Supplementary Table Title of file for HTML: Peer Review File Description: Innate Scavenger Receptor-A regulates
LPS LPS P6 - + Supplementary Fig. 1.
 P6 LPS - - - + + + - LPS + + - - P6 + Supplementary Fig. 1. Pharmacological inhibition of the JAK/STAT blocks LPS-induced HMGB1 nuclear translocation. RAW 267.4 cells were stimulated with LPS in the absence
Supplementary Figure 1 Chemokine and chemokine receptor expression during muscle regeneration (a) Analysis of CR3CR1 mrna expression by real time-pcr
 Analysis of CR3CR1 mrna expression by real time-pcr") Supplementary Figure 1 Chemokine and chemokine receptor expression during muscle regeneration (a) Analysis of CR3CR1 mrna expression by real time-pcr at day 0, 1, 4, 10 and 21 post- muscle injury. (b)
Supplementary Figure 1 Chemokine and chemokine receptor expression during muscle regeneration (a) Analysis of CR3CR1 mrna expression by real time-pcr at day 0, 1, 4, 10 and 21 post- muscle injury. (b)
WT Xid (h) poly(da:dt) Alum. Poly(dA:dT) 0.05
 poly(da:dt) Alum. Poly(dA:dT) 0.05") IL1 (ng/ml) (1 x 1 3 cells) DMSO LFMA13 R46 IL1 (ng/ml) Control shrna TNFa (ng/ml) Alum Nigericin ATP IL1 (ng/ml) IL1 (ng/ml) IL1 (ng/ml) a c f 3 2 1 1 8 6 4 2 Sup 1 8 6 4 DMSO Alum/DMSO Alum/LFMA13 ***
IL1 (ng/ml) (1 x 1 3 cells) DMSO LFMA13 R46 IL1 (ng/ml) Control shrna TNFa (ng/ml) Alum Nigericin ATP IL1 (ng/ml) IL1 (ng/ml) IL1 (ng/ml) a c f 3 2 1 1 8 6 4 2 Sup 1 8 6 4 DMSO Alum/DMSO Alum/LFMA13 ***
Supplementary information
 Supplementary information Supplementary Figure S1: Ex[Ca 2+ ]-induced IL-1ß production of monocytes primed with different TLR ligands IL-1ß release of CD14+ monocytes in response to stimulation for 16
SUPPLEMENTARY INFORMATION
 SUPPLEMENTARY INFORMATION doi:1.138/nature9814 a A SHARPIN FL B SHARPIN ΔNZF C SHARPIN T38L, F39V b His-SHARPIN FL -1xUb -2xUb -4xUb α-his c Linear 4xUb -SHARPIN FL -SHARPIN TF_LV -SHARPINΔNZF -SHARPIN
Supplementary fig. 1. Crystals induce necroptosis does not involve caspases, TNF receptor or NLRP3. A. Mouse tubular epithelial cells were pretreated
 Supplementary fig. 1. Crystals induce necroptosis does not involve caspases, TNF receptor or NLRP3. A. Mouse tubular epithelial cells were pretreated with zvad-fmk (10µM) and exposed to calcium oxalate
Supplementary Information. Tissue-wide immunity against Leishmania. through collective production of nitric oxide
 Supplementary Information Tissue-wide immunity against Leishmania through collective production of nitric oxide Romain Olekhnovitch, Bernhard Ryffel, Andreas J. Müller and Philippe Bousso Supplementary
Nature Immunology doi: /ni.3268
 Supplementary Figure 1 Loss of Mst1 and Mst2 increases susceptibility to bacterial sepsis. (a) H&E staining of colon and kidney sections from wild type and Mst1 -/- Mst2 fl/fl Vav-Cre mice. Scale bar,
Supplementary Material
 Supplementary Material accompanying the manuscript Interleukin 37 is a fundamental inhibitor of innate immunity Marcel F Nold, Claudia A Nold-Petry, Jarod A Zepp, Brent E Palmer, Philip Bufler & Charles
Trim29 gene-targeting strategy. (a) Genotyping of wildtype mice (+/+), Trim29 heterozygous mice (+/ ) and homozygous mice ( / ).
 Genotyping of wildtype mice (+/+), Trim29 heterozygous mice (+/ ) and homozygous mice ( / ).") Supplementary Figure 1 Trim29 gene-targeting strategy. (a) Genotyping of wildtype mice (+/+), Trim29 heterozygous mice (+/ ) and homozygous mice ( / ). (b) Immunoblot analysis of TRIM29 in lung primary
Supplementary Figure 1 Trim29 gene-targeting strategy. (a) Genotyping of wildtype mice (+/+), Trim29 heterozygous mice (+/ ) and homozygous mice ( / ). (b) Immunoblot analysis of TRIM29 in lung primary
Intracellular MHC class II molecules promote TLR-triggered innate. immune responses by maintaining Btk activation
 Intracellular MHC class II molecules promote TLR-triggered innate immune responses by maintaining Btk activation Xingguang Liu, Zhenzhen Zhan, Dong Li, Li Xu, Feng Ma, Peng Zhang, Hangping Yao and Xuetao
RAW264.7 cells stably expressing control shrna (Con) or GSK3b-specific shrna (sh-
 or GSK3b-specific shrna (sh-") 1 a b Supplementary Figure 1. Effects of GSK3b knockdown on poly I:C-induced cytokine production. RAW264.7 cells stably expressing control shrna (Con) or GSK3b-specific shrna (sh- GSK3b) were stimulated
1 a b Supplementary Figure 1. Effects of GSK3b knockdown on poly I:C-induced cytokine production. RAW264.7 cells stably expressing control shrna (Con) or GSK3b-specific shrna (sh- GSK3b) were stimulated
Supplementary Figure 1. Expression of EPO and EPOR during self-limited versus delayed
 Supplementary Figure 1. Expression of EPO and EPOR during self-limited versus delayed inflammation resolution. a: Flow cytometry analysis showing the electronic gating strategy used to identify peritoneal
Supplementary Figure 1
 Supplementary Figure 1 YAP negatively regulates IFN- signaling. (a) Immunoblot analysis of Yap knockdown efficiency with sh-yap (#1 to #4 independent constructs) in Raw264.7 cells. (b) IFN- -Luc and PRDs
Supplementary Figure 1.TRIM33 binds β-catenin in the nucleus. a & b, Co-IP of endogenous TRIM33 with β-catenin in HT-29 cells (a) and HEK 293T cells
 and HEK 293T cells") Supplementary Figure 1.TRIM33 binds β-catenin in the nucleus. a & b, Co-IP of endogenous TRIM33 with β-catenin in HT-29 cells (a) and HEK 293T cells (b). TRIM33 was immunoprecipitated, and the amount of
Supplementary Figure 1.TRIM33 binds β-catenin in the nucleus. a & b, Co-IP of endogenous TRIM33 with β-catenin in HT-29 cells (a) and HEK 293T cells (b). TRIM33 was immunoprecipitated, and the amount of
Supplementary Figure 1. PD-L1 is glycosylated in cancer cells. (a) Western blot analysis of PD-L1 in breast cancer cells. (b) Western blot analysis
 Western blot analysis of PD-L1 in breast cancer cells. (b) Western blot analysis") Supplementary Figure 1. PD-L1 is glycosylated in cancer cells. (a) Western blot analysis of PD-L1 in breast cancer cells. (b) Western blot analysis of PD-L1 in ovarian cancer cells. (c) Western blot analysis
Supplementary Figure 1. PD-L1 is glycosylated in cancer cells. (a) Western blot analysis of PD-L1 in breast cancer cells. (b) Western blot analysis of PD-L1 in ovarian cancer cells. (c) Western blot analysis
ERK1/2/MAPK pathway-dependent regulation of the telomeric factor TRF2
 ERK1/2/MAPK pathway-dependent regulation of the telomeric factor TRF2 SUPPLEMENTARY FIGURES AND TABLE Supplementary Figure S1: Conservation of the D domain throughout evolution. Alignment of TRF2 sequences
Supplementary Figure 1. Normal T lymphocyte populations in Dapk -/- mice. (a) Normal thymic development in Dapk -/- mice. Thymocytes from WT and Dapk
 Normal thymic development in Dapk -/- mice. Thymocytes from WT and Dapk") Supplementary Figure 1. Normal T lymphocyte populations in Dapk -/- mice. (a) Normal thymic development in Dapk -/- mice. Thymocytes from WT and Dapk -/- mice were stained for expression of CD4 and CD8.
Supplementary Figure 1. Normal T lymphocyte populations in Dapk -/- mice. (a) Normal thymic development in Dapk -/- mice. Thymocytes from WT and Dapk -/- mice were stained for expression of CD4 and CD8.
Rescue of mutant rhodopsin traffic by metformin-induced AMPK activation accelerates photoreceptor degeneration Athanasiou et al
 Supplementary Material Rescue of mutant rhodopsin traffic by metformin-induced AMPK activation accelerates photoreceptor degeneration Athanasiou et al Supplementary Figure 1. AICAR improves P23H rod opsin
Supplementary Figure 1. Generation of knockin mice expressing L-selectinN138G. (a) Schematics of the Sellg allele (top), the targeting vector, the
 Schematics of the Sellg allele (top), the targeting vector, the") Supplementary Figure 1. Generation of knockin mice expressing L-selectinN138G. (a) Schematics of the Sellg allele (top), the targeting vector, the targeted allele in ES cells, and the mutant allele in
Supplementary Figure 1. Generation of knockin mice expressing L-selectinN138G. (a) Schematics of the Sellg allele (top), the targeting vector, the targeted allele in ES cells, and the mutant allele in
(a) Significant biological processes (upper panel) and disease biomarkers (lower panel)
 Significant biological processes (upper panel) and disease biomarkers (lower panel)") Supplementary Figure 1. Functional enrichment analyses of secretomic proteins. (a) Significant biological processes (upper panel) and disease biomarkers (lower panel) 2 involved by hrab37-mediated secretory
Supplementary Figure 1. Functional enrichment analyses of secretomic proteins. (a) Significant biological processes (upper panel) and disease biomarkers (lower panel) 2 involved by hrab37-mediated secretory
Supplementary Materials for
 www.sciencesignaling.org/cgi/content/full/6/283/ra57/dc1 Supplementary Materials for JNK3 Couples the Neuronal Stress Response to Inhibition of Secretory Trafficking Guang Yang,* Xun Zhou, Jingyan Zhu,
Suppl Video: Tumor cells (green) and monocytes (white) are seeded on a confluent endothelial
 and monocytes (white) are seeded on a confluent endothelial") Supplementary Information Häuselmann et al. Monocyte induction of E-selectin-mediated endothelial activation releases VE-cadherin junctions to promote tumor cell extravasation in the metastasis cascade
Supplementary Information Häuselmann et al. Monocyte induction of E-selectin-mediated endothelial activation releases VE-cadherin junctions to promote tumor cell extravasation in the metastasis cascade
Pathologic Stage. Lymph node Stage
 ASC ASC a c Patient ID BMI Age Gleason score Non-obese PBMC 1 22.1 81 6 (3+3) PBMC 2 21.9 6 6 (3+3) PBMC 3 22 84 8 (4+4) PBMC 4 24.6 68 7 (3+4) PBMC 24. 6 (3+3) PBMC 6 24.7 73 7 (3+4) PBMC 7 23. 67 7 (3+4)
Supplementary Figure 1. Spatial distribution of LRP5 and β-catenin in intact cardiomyocytes. (a) and (b) Immunofluorescence staining of endogenous
 and (b) Immunofluorescence staining of endogenous") Supplementary Figure 1. Spatial distribution of LRP5 and β-catenin in intact cardiomyocytes. (a) and (b) Immunofluorescence staining of endogenous LRP5 in intact adult mouse ventricular myocytes (AMVMs)
Supplementary Figure 1. Spatial distribution of LRP5 and β-catenin in intact cardiomyocytes. (a) and (b) Immunofluorescence staining of endogenous LRP5 in intact adult mouse ventricular myocytes (AMVMs)
293T cells were transfected with indicated expression vectors and the whole-cell extracts were subjected
 SUPPLEMENTARY INFORMATION Supplementary Figure 1. Formation of a complex between Slo1 and CRL4A CRBN E3 ligase. (a) HEK 293T cells were transfected with indicated expression vectors and the whole-cell
Supplementary Information
 Supplementary Information mediates STAT3 activation at retromer-positive structures to promote colitis and colitis-associated carcinogenesis Zhang et al. a b d e g h Rel. Luc. Act. Rel. mrna Rel. mrna
William C. Comb, Jessica E. Hutti, Patricia Cogswell, Lewis C. Cantley, and Albert S. Baldwin
 Molecular Cell, Volume 45 Supplemental Information p85 SH2 Domain Phosphorylation by IKK Promotes Feedback Inhibition of PI3K and Akt in Response to Cellular Starvation William C. Comb, Jessica E. Hutti,
SUPPLEMENTARY INFORMATION
 DOI: 10.1038/ncb2566 Figure S1 CDKL5 protein expression pattern and localization in mouse brain. (a) Multiple-tissue western blot from a postnatal day (P) 21 mouse probed with an antibody against CDKL5.
d e f Spatiotemporal quantification of subcellular ATP levels in a single HeLa cell during changes in morphology Supplementary Information
 Ca 2+ level (a. u.) Area (a. u.) Normalized distance Normalized distance Center Edge Center Edge Relative ATP level Relative ATP level Supplementary Information Spatiotemporal quantification of subcellular
Supplementary information. The Light Intermediate Chain 2 Subpopulation of Dynein Regulates Mitotic. Spindle Orientation
 Supplementary information The Light Intermediate Chain 2 Subpopulation of Dynein Regulates Mitotic Spindle Orientation Running title: Dynein LICs distribute mitotic functions. Sagar Mahale a, d, *, Megha
S1a S1b S1c. S1d. S1f S1g S1h SUPPLEMENTARY FIGURE 1. - si sc Il17rd Il17ra bp. rig/s IL-17RD (ng) -100 IL-17RD
 -100 IL-17RD") SUPPLEMENTARY FIGURE 1 0 20 50 80 100 IL-17RD (ng) S1a S1b S1c IL-17RD β-actin kda S1d - si sc Il17rd Il17ra rig/s15-574 - 458-361 bp S1f S1g S1h S1i S1j Supplementary Figure 1. Knockdown of IL-17RD enhances
SUPPLEMENTARY FIGURE 1 0 20 50 80 100 IL-17RD (ng) S1a S1b S1c IL-17RD β-actin kda S1d - si sc Il17rd Il17ra rig/s15-574 - 458-361 bp S1f S1g S1h S1i S1j Supplementary Figure 1. Knockdown of IL-17RD enhances
Programmed necrosis, not apoptosis, is a key mediator of cell loss and DAMP-mediated inflammation in dsrna-induced retinal degeneration
 Programmed necrosis, not apoptosis, is a key mediator of cell loss and DAMP-mediated inflammation in dsrna-induced retinal degeneration The Harvard community has made this article openly available. Please
SUPPLEMENTARY FIGURES
 SUPPLEMENTARY FIGURES Supplementary Figure 1. (A) Left, western blot analysis of ISGylated proteins in Jurkat T cells treated with 1000U ml -1 IFN for 16h (IFN) or left untreated (CONT); right, western
% of live splenocytes. STAT5 deletion. (open shapes) % ROSA + % floxed
 % ROSA + % floxed") Supp. Figure 1. a 14 1 1 8 6 spleen cells (x1 6 ) 16 % of live splenocytes 5 4 3 1 % of live splenocytes 8 6 4 b 1 1 c % of CD11c + splenocytes (closed shapes) 8 6 4 8 6 4 % ROSA + (open shapes) % floxed
Supp. Figure 1. a 14 1 1 8 6 spleen cells (x1 6 ) 16 % of live splenocytes 5 4 3 1 % of live splenocytes 8 6 4 b 1 1 c % of CD11c + splenocytes (closed shapes) 8 6 4 8 6 4 % ROSA + (open shapes) % floxed
Fig. S1. Subcellular localization of overexpressed LPP3wt-GFP in COS-7 and HeLa cells. Cos7 (top) and HeLa (bottom) cells expressing for 24 h human
 and HeLa (bottom) cells expressing for 24 h human") Fig. S1. Subcellular localization of overexpressed LPP3wt-GFP in COS-7 and HeLa cells. Cos7 (top) and HeLa (bottom) cells expressing for 24 h human LPP3wt-GFP, fixed and stained for GM130 (A) or Golgi97
Fig. S1. Subcellular localization of overexpressed LPP3wt-GFP in COS-7 and HeLa cells. Cos7 (top) and HeLa (bottom) cells expressing for 24 h human LPP3wt-GFP, fixed and stained for GM130 (A) or Golgi97
Figure S1: Effects on haptotaxis are independent of effects on cell velocity A)
") Supplemental Figures Figure S1: Effects on haptotaxis are independent of effects on cell velocity A) Velocity of MV D7 fibroblasts expressing different GFP-tagged Ena/VASP family proteins in the haptotaxis
Supplemental Figures Figure S1: Effects on haptotaxis are independent of effects on cell velocity A) Velocity of MV D7 fibroblasts expressing different GFP-tagged Ena/VASP family proteins in the haptotaxis
Supplementary Figures
 Supplementary Figures Supplementary Figure 1. NKT ligand-loaded tumour antigen-presenting B cell- and monocyte-based vaccine induces NKT, NK and CD8 T cell responses. (A) The cytokine profiles of liver
Supplementary Figure 1. IDH1 and IDH2 mutation site sequences on WHO grade III
 Supplementary Materials: Supplementary Figure 1. IDH1 and IDH2 mutation site sequences on WHO grade III patient samples. Genomic DNA samples extracted from punch biopsies from either FFPE or frozen tumor
a surface permeabilized
 a surface permeabilized RAW 64.7 P388D1 J774 b CD11b + Ly-6G - Blood Monocytes WT Supplementary Figure 1. Cell surface expression on macrophages and DCs. (a) RAW64.7, P388D1, and J774 cells were subjected
Understanding the Role of the Inflammasome in Inflammation
 Understanding the Role of the Inflammasome in Inflammation Martha O Brien, Ph.D. Assay Design Group 215 Innate Immune Response in Inflammation LPS flagellin TLR-1/2/6 TLR-4 TLR-5 Adaptor proteins PAMPs,
Supplementary Information
 Nature Immunology doi:1.138/ni.2477 Supplementary Information Capillary and arteriolar pericytes attract innate leukocytes exiting through venules and instruct them with pattern recognition and motility
Supplemental Figure 1. Western blot analysis indicated that MIF was detected in the fractions of
 Supplemental Figure Legends Supplemental Figure 1. Western blot analysis indicated that was detected in the fractions of plasma membrane and cytosol but not in nuclear fraction isolated from Pkd1 null
Aggregated neutrophil extracellular traps limit inflammation by degrading cytokines and chemokines
 CORRECTION NOTICE Nat. Med. doi:10.1038/nm.3547; corrected online 25 August 2014 Aggregated neutrophil extracellular traps limit inflammation by degrading cytokines and chemokines Christine Schauer, Christina
a 10 4 Link et al. Supplementary Figure 1 Nature Immunology: doi: /ni.1842 Cells per mouse ( 10 5 ) TRPV2KO anti-gr1 anti-gr anti-f4/80
 TRPV2KO anti-gr1 anti-gr anti-f4/80") a 10 4 WT 10 4 TRPV2KO 10 3 10 3 anti-gr1 10 2 10 1 anti-gr1 10 2 10 1 10 0 10 0 10 1 10 2 10 3 10 4 anti-f4/80 42.3 45.2 10 0 10 0 10 1 10 2 10 3 10 4 anti-f4/80 10 4 10 4 40 42.5 anti-cd11b 10 3 10 2
a 10 4 WT 10 4 TRPV2KO 10 3 10 3 anti-gr1 10 2 10 1 anti-gr1 10 2 10 1 10 0 10 0 10 1 10 2 10 3 10 4 anti-f4/80 42.3 45.2 10 0 10 0 10 1 10 2 10 3 10 4 anti-f4/80 10 4 10 4 40 42.5 anti-cd11b 10 3 10 2
Supplementary Materials for
 www.sciencetranslationalmedicine.org/cgi/content/full/8/352/352ra110/dc1 Supplementary Materials for Spatially selective depletion of tumor-associated regulatory T cells with near-infrared photoimmunotherapy
SUPPLEMENTARY INFORMATION
 doi: 1.138/nature775 4 O.D. (595-655) 3 1 -ζ no antibody isotype ctrl Plated Soluble 1F6 397 7H11 Supplementary Figure 1 Soluble and plated anti- Abs induce -! signalling. B3Z cells stably expressing!
SUPPLEMENTARY INFORMATION
 DOI:.38/ncb2822 a MTC02 FAO cells EEA1 b +/+ MEFs /DAPI -/- MEFs /DAPI -/- MEFs //DAPI c HEK 293 cells WCE N M C P AKT TBC1D7 Lamin A/C EEA1 VDAC d HeLa cells WCE N M C P AKT Lamin A/C EEA1 VDAC Figure
F-actin VWF Vinculin. F-actin. Vinculin VWF
 a F-actin VWF Vinculin b F-actin VWF Vinculin Supplementary Fig. 1. WPBs in HUVECs are located along stress fibers and at focal adhesions. (a) Immunofluorescence images of f-actin (cyan), VWF (yellow),
Supplementary Figure 1. The CagA-dependent wound healing or transwell migration of gastric cancer cell. AGS cells transfected with vector control or
 Supplementary Figure 1. The CagA-dependent wound healing or transwell migration of gastric cancer cell. AGS cells transfected with vector control or 3xflag-CagA expression vector were wounded using a pipette
Nature Immunology: doi: /ni eee Supplementary Figure 1
 eee Supplementary Figure 1 Hyphae induce NET release, but yeast do not. (a) NET release by human peripheral neutrophils stimulated with a hgc1 yeast-locked C. albicans mutant (yeast) or pre-formed WT C.
Supplementary information
 Supplementary information Intrahepatic myeloid cell-aggregates enable local CD8 + T cell expansion and successful immunotherapy against chronic viral liver infection Li- Rung Huang, Dirk Wohlleber, Florian
Supplementary Materials
 Supplementary Materials Supplementary Figure S1 Regulation of Ubl4A stability by its assembly partner A, The translation rate of Ubl4A is not affected in the absence of Bag6. Control, Bag6 and Ubl4A CRISPR
Supplementary Figure 1. Rab27a-KD inhibits speed and persistence of HEp3 cells migrating in the chick CAM. (a) Western blot analysis of Rab27a
 Western blot analysis of Rab27a") Supplementary Figure 1. Rab27a-KD inhibits speed and persistence of HEp3 cells migrating in the chick CAM. (a) Western blot analysis of Rab27a expression in GFP-expressing HEp3 cells. (b) Representative
Supplementary Figure 1. Rab27a-KD inhibits speed and persistence of HEp3 cells migrating in the chick CAM. (a) Western blot analysis of Rab27a expression in GFP-expressing HEp3 cells. (b) Representative
Supplemental Figure 1.
 antifas CD40L 0 15 30 60 0 15 30 60 min piκbα IκBα p38 Supplemental Figure 1. CD40L and antifas stimulation induces NFkB activation. BMDM were stimulated with CD40L (1ug/ml) or antifas (10ug/ml). Cell
Supplementary Figure 1
 Supplementary Figure 1 AAV-GFP injection in the MEC of the mouse brain C57Bl/6 mice at 4 months of age were injected with AAV-GFP into the MEC and sacrificed at 7 days post injection (dpi). (a) Brains
Live cell imaging of trafficking of the chaperone complex vaccine to the ER. BMDCs were incubated with ER-Tracker Red (1 M) in staining solution for
 in staining solution for") Live cell imaging of trafficking of the chaperone complex vaccine to the ER. BMDCs were incubated with ER-Tracker Red (1 M) in staining solution for 15 min at 37 C and replaced with fresh complete medium.
Live cell imaging of trafficking of the chaperone complex vaccine to the ER. BMDCs were incubated with ER-Tracker Red (1 M) in staining solution for 15 min at 37 C and replaced with fresh complete medium.
Supplementary Figure 1. Dynamic Response of WT and mir-21 -/- mice to caerulein. (a) Representative histological sections of mouse pancreas stained
 Representative histological sections of mouse pancreas stained") Supplementary Figure 1. Dynamic Response of WT and mir-21 -/- mice to caerulein. (a) Representative histological sections of mouse pancreas stained with hematoxylin from caerulein-treated WT and mir-21
Supplementary Figure 1. Dynamic Response of WT and mir-21 -/- mice to caerulein. (a) Representative histological sections of mouse pancreas stained with hematoxylin from caerulein-treated WT and mir-21
SUPPLEMENTARY INFORMATION
 doi: 10.1038/nature06994 A phosphatase cascade by which rewarding stimuli control nucleosomal response A. Stipanovich*, E. Valjent*, M. Matamales*, A. Nishi, J.H. Ahn, M. Maroteaux, J. Bertran-Gonzalez,
Mice. Mice genetically deficient for IRAK-1, IRAK-2, IRAK-1/2, MyD88, TRIF, NLRP3,
 Supporting Information SI Text Mice. Mice genetically deficient for IRAK-1, IRAK-2, IRAK-1/2, MyD88, TRIF, NLRP3, MyD88/TRIF, TLR2/TLR4, TLR7, caspase-1, IL-1R1 and IL-18R, control C57BL/6 mice as well
fig. S1 Gene silencing of LC3B by sirna enhances IL-1β secretion. Peritoneal
 15 Scramble sirna LC3B sirna IL-1β (pg/ml) 1 5 LC3B (kda) - 18 (LC3B I) - 16 (LC3B II) β-actin - 42 ( _ ) LPS LPS ATP fig. S1 Gene silencing of LC3B by sirna enhances IL-1β secretion. Peritoneal macrophages
Supplementary Figure 1. Confocal immunofluorescence showing mitochondrial translocation of Drp1. Cardiomyocytes treated with H 2 O 2 were prestained
 Supplementary Figure 1. Confocal immunofluorescence showing mitochondrial translocation of Drp1. Cardiomyocytes treated with H 2 O 2 were prestained with MitoTracker (red), then were immunostained with
(a) Schematic diagram of the FS mutation of UVRAG in exon 8 containing the highly instable
 Schematic diagram of the FS mutation of UVRAG in exon 8 containing the highly instable") Supplementary Figure 1. Frameshift (FS) mutation in UVRAG. (a) Schematic diagram of the FS mutation of UVRAG in exon 8 containing the highly instable A 10 DNA repeat, generating a premature stop codon
Supplementary Figure 1. Frameshift (FS) mutation in UVRAG. (a) Schematic diagram of the FS mutation of UVRAG in exon 8 containing the highly instable A 10 DNA repeat, generating a premature stop codon
Serafino et al. Thymosin α1 activates complement receptor-mediated phagocytosis in human monocyte-derived macrophages. SUPPLEMENTARY FIGURES
 Supplementary Fig. S1. Evaluation of the purity and maturation of macrophage cultures tested by flow cytometry. The lymphocytic/monocytic cellular fraction was isolated from buffy coats of healthy donors
File Name: Supplementary Information Description: Supplementary Figures and Supplementary Tables. File Name: Peer Review File Description:
 File Name: Supplementary Information Description: Supplementary Figures and Supplementary Tables File Name: Peer Review File Description: Primer Name Sequence (5'-3') AT ( C) RT-PCR USP21 F 5'-TTCCCATGGCTCCTTCCACATGAT-3'
Supplementary Figure 1
 Supplementary Figure 1 a γ-h2ax MDC1 RNF8 FK2 BRCA1 U2OS Cells sgrna-1 ** 60 sgrna 40 20 0 % positive Cells (>5 foci per cell) b ** 80 sgrna sgrna γ-h2ax MDC1 γ-h2ax RNF8 FK2 MDC1 BRCA1 RNF8 FK2 BRCA1
Crucial role for human Toll-like receptor 4 in the development of contact allergy to nickel
 Supplementary Figures 1-8 Crucial role for human Toll-like receptor 4 in the development of contact allergy to nickel Marc Schmidt 1,2, Badrinarayanan Raghavan 1,2, Verena Müller 1,2, Thomas Vogl 3, György
Supplementary Materials for
 www.sciencesignaling.org/cgi/content/full/4/199/ra75/dc1 Supplementary Materials for Signaling by the Matrix Proteoglycan Decorin Controls Inflammation and Cancer Through PDCD4 and MicroRNA-21 Rosetta
SUPPLEMENTAL FIGURE LEGENDS
 SUPPLEMENTAL FIGURE LEGENDS Supplemental Figure S1: Endogenous interaction between RNF2 and H2AX: Whole cell extracts from 293T were subjected to immunoprecipitation with anti-rnf2 or anti-γ-h2ax antibodies
SUPPLEMENTARY INFORMATION
 doi:10.1038/nature12652 Supplementary Figure 1. PRDM16 interacts with endogenous EHMT1 in brown adipocytes. Immunoprecipitation of PRDM16 complex by flag antibody (M2) followed by Western blot analysis
genome edited transient transfection, CMV promoter
 Supplementary Figure 1. In the absence of new protein translation, overexpressed caveolin-1-gfp is degraded faster than caveolin-1-gfp expressed from the endogenous caveolin 1 locus % loss of total caveolin-1-gfp
Figure S1. Reduction in glomerular mir-146a levels correlate with progression to higher albuminuria in diabetic patients.
 Supplementary Materials Supplementary Figures Figure S1. Reduction in glomerular mir-146a levels correlate with progression to higher albuminuria in diabetic patients. Figure S2. Expression level of podocyte
Supporting Information. FADD regulates NF-кB activation and promotes ubiquitination of cflip L to induce. apoptosis
 1 2 Supporting Information 3 4 5 FADD regulates NF-кB activation and promotes ubiquitination of cflip L to induce apoptosis 6 7 Kishu Ranjan and Chandramani Pathak* 8 9 Department of Cell Biology, School
Supplementary Materials
 Supplementary Materials Figure S1. MTT Cell viability assay. To measure the cytotoxic potential of the oxidative treatment, the MTT [3-(4,5-dimethylthiazol- 2-yl)-2,5-diphenyl tetrazolium bromide] assay
GFP/Iba1/GFAP. Brain. Liver. Kidney. Lung. Hoechst/Iba1/TLR9!
 Supplementary information a +KA Relative expression d! Tlr9 5!! 5! NSC Neuron Astrocyte Microglia! 5! Tlr7!!!! NSC Neuron Astrocyte! GFP/Sβ/! Iba/Hoechst Microglia e Hoechst/Iba/TLR9! GFP/Iba/GFAP f Brain
Supplementary Figures
 Supplementary Figures Supplementary Figure 1 Characterization of stable expression of GlucB and sshbira in the CT26 cell line (a) Live cell imaging of stable CT26 cells expressing green fluorescent protein
Supplementary table I. Real-time primers used in the study. The fold change was obtained by
 Supplementary table I. Real-time primers used in the study. The fold change was obtained by normalizing the gene expression number to those of HPRT, then comparing the samples to untreated or naive mice.
Supplementary Figure S1 Supplementary Figure S2
 Supplementary Figure S A) The blots shown in Figure B were qualified by using Gel-Pro analyzer software (Rockville, MD, USA). The ratio of LC3II/LC3I to actin was then calculated. The data are represented
PHENOTYPIC DYNAMICS OF MICROGLIAL AND MONOCYTE-DERIVED CELLS IN GLIOBLASTOMA-BEARING MICE.
 SUPPLEMENTARY FIGURES, TABLES AND VIDEOS PHENOTYPIC DYNAMICS OF MICROGLIAL AND MONOCYTE-DERIVED CELLS IN GLIOBLASTOMA-BEARING MICE. Clément Ricard 1,2,3,4, Aurélie Tchoghandjian 2,4, Hervé Luche 5, Pierre
Integrin CD11b negatively regulates TLR-triggered inflammatory responses by. activating Syk and promoting MyD88 and TRIF degradation via cbl-b
 Integrin CD11b negatively regulates TLR-triggered inflammatory responses by activating Syk and promoting MyD88 and TRIF degradation via cbl-b Chaofeng Han, Jing Jin, Sheng Xu, Haibo Liu, Nan Li, and Xuetao
Supplemental Materials. STK16 regulates actin dynamics to control Golgi organization and cell cycle
 Supplemental Materials STK16 regulates actin dynamics to control Golgi organization and cell cycle Juanjuan Liu 1,2,3, Xingxing Yang 1,3, Binhua Li 1, Junjun Wang 1,2, Wenchao Wang 1, Jing Liu 1, Qingsong
Stewart et al. CD36 ligands promote sterile inflammation through assembly of a TLR 4 and 6 heterodimer
 NFκB (fold induction) Stewart et al. ligands promote sterile inflammation through assembly of a TLR 4 and 6 heterodimer a. mrna (fold induction) 5 4 3 2 1 LDL oxldl Gro1a MIP-2 RANTES mrna (fold induction)
Prolonged mitotic arrest induces a caspase-dependent DNA damage
 SUPPLEMENTARY INFORMATION Prolonged mitotic arrest induces a caspase-dependent DNA damage response at telomeres that determines cell survival Karolina O. Hain, Didier J. Colin, Shubhra Rastogi, Lindsey
Nature Immunology: doi: /ni.3631
 Supplementary Figure 1 SPT analyses of Zap70 at the T cell plasma membrane. (a) Total internal reflection fluorescent (TIRF) excitation at 64-68 degrees limits single molecule detection to 100-150 nm above
A. Generation and characterization of Ras-expressing autophagycompetent
 Supplemental Material Supplemental Figure Legends Fig. S1 A. Generation and characterization of Ras-expressing autophagycompetent and -deficient cell lines. HA-tagged H-ras V12 was stably expressed in
Nature Structural and Molecular Biology: doi: /nsmb Supplementary Figure 1
 Supplementary Figure 1 Mutational analysis of the SA2-Scc1 interaction in vitro and in human cells. (a) Autoradiograph (top) and Coomassie stained gel (bottom) of 35 S-labeled Myc-SA2 proteins (input)
SUPPLEMENTARY INFORMATION
 DOI:.38/ncb3399 a b c d FSP DAPI 5mm mm 5mm 5mm e Correspond to melanoma in-situ Figure a DCT FSP- f MITF mm mm MlanaA melanoma in-situ DCT 5mm FSP- mm mm mm mm mm g melanoma in-situ MITF MlanaA mm mm
Supplementary Figure 1 IMQ-Induced Mouse Model of Psoriasis. IMQ cream was
 Supplementary Figure 1 IMQ-Induced Mouse Model of Psoriasis. IMQ cream was painted on the shaved back skin of CBL/J and BALB/c mice for consecutive days. (a, b) Phenotypic presentation of mouse back skin
SUPPLEMENTARY INFORMATION
 DOI: 10.1038/ncb3076 Supplementary Figure 1 btrcp targets Cep68 for degradation during mitosis. a) Cep68 immunofluorescence in interphase and metaphase. U-2OS cells were transfected with control sirna
Supplementary Figure 1. Nature Neuroscience: doi: /nn.4547
 Supplementary Figure 1 Characterization of the Microfetti mouse model. (a) Gating strategy for 8-color flow analysis of peripheral Ly-6C + monocytes from Microfetti mice 5-7 days after TAM treatment. Living
Hua Tang, Weiping Cao, Sudhir Pai Kasturi, Rajesh Ravindran, Helder I Nakaya, Kousik
 SUPPLEMENTARY FIGURES 1-19 T H 2 response to cysteine-proteases requires dendritic cell-basophil cooperation via ROS mediated signaling Hua Tang, Weiping Cao, Sudhir Pai Kasturi, Rajesh Ravindran, Helder
Kidney. Heart. Lung. Sirt1. Gapdh. Mouse IgG DAPI. Rabbit IgG DAPI
 a e Na V 1.5 Ad-LacZ Ad- 110KD b Scn5a/ (relative to Ad-LacZ) f 150 100 50 0 p = 0.65 Ad-LacZ Ad- c Heart Lung Kidney Spleen 110KD d fl/fl c -/- DAPI 20 µm Na v 1.5 250KD fl/fl Rabbit IgG DAPI fl/fl Mouse
Caspase-11 Activation in Response to Bacterial Secretion Systems That Access the Host Cytosol
 University of Pennsylvania ScholarlyCommons Department of Microbiology Perelman School of Medicine 6-6-2013 Caspase-11 Activation in Response to Bacterial Secretion Systems That Access the Host Cytosol
Supplementary Fig. 1. GPRC5A post-transcriptionally down-regulates EGFR expression. (a) Plot of the changes in steady state mrna levels versus
 Plot of the changes in steady state mrna levels versus") Supplementary Fig. 1. GPRC5A post-transcriptionally down-regulates EGFR expression. (a) Plot of the changes in steady state mrna levels versus changes in corresponding proteins between wild type and Gprc5a-/-
Supplementary Fig. 1. GPRC5A post-transcriptionally down-regulates EGFR expression. (a) Plot of the changes in steady state mrna levels versus changes in corresponding proteins between wild type and Gprc5a-/-
Nature Neuroscience: doi: /nn Supplementary Figure 1
 Supplementary Figure 1 Bidirectional optogenetic modulation of the tonic activity of CEA PKCδ + neurons in vitro. a, Top, Cell-attached voltage recording illustrating the blue light-induced increase in