BMI risk SNPs associate with increased CADM1 and CADM2 expression in the cerebellum of human subjects.
|
|
|
- Allan Beasley
- 5 years ago
- Views:
Transcription
1 Supplementary Figure 1 BMI risk SNPs associate with increased CADM1 and CADM2 expression in the cerebellum of human subjects. Boxplots show the 25% and 75% quantiles of normalized mrna expression levels (y-axis), solid horizontal lines indicate the median, and whiskers indicate the 10% and 90% quantiles. (a) Elevated expression of CADM1 associates with risk allele (G) of rs in cerebellum. (b) Genotype dependent expression levels of CADM2 for the SNP rs The risk allele (G) is associated with higher expression levels in human cerebellum. Statistical analyses are described in the Methods and Supplementary Table 3.
 Schematic representation of Cadm1 and Cadm2 engaged in homophilic (homo) and heterophilic (het) interactions.")
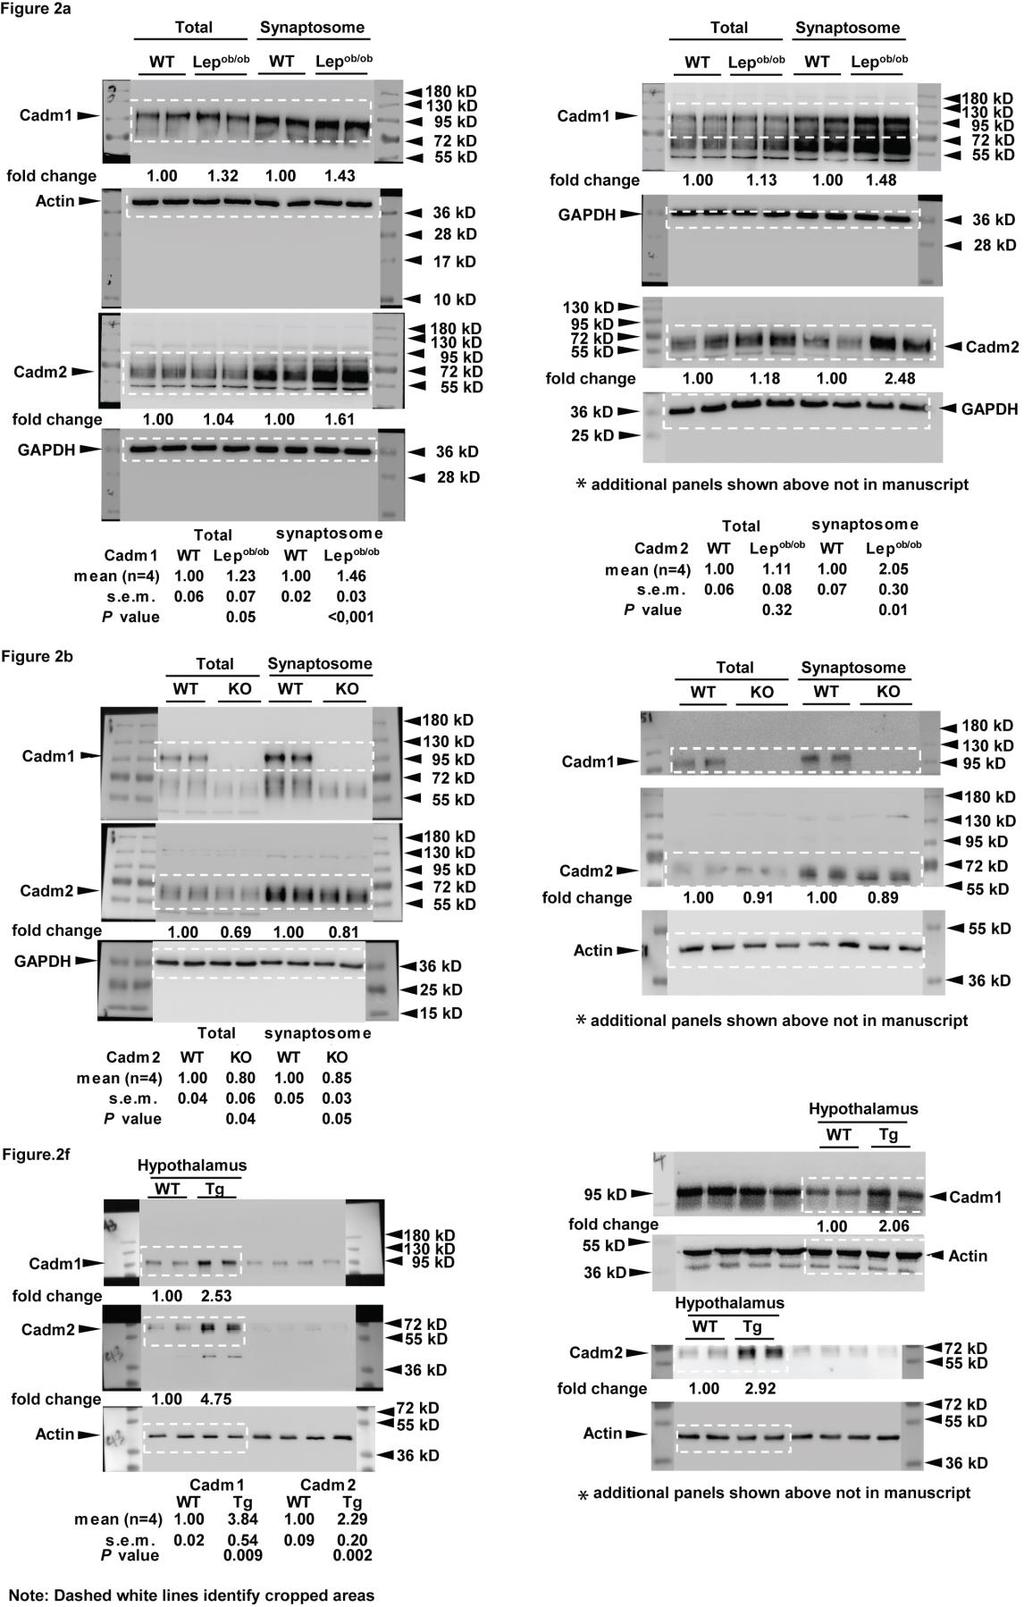
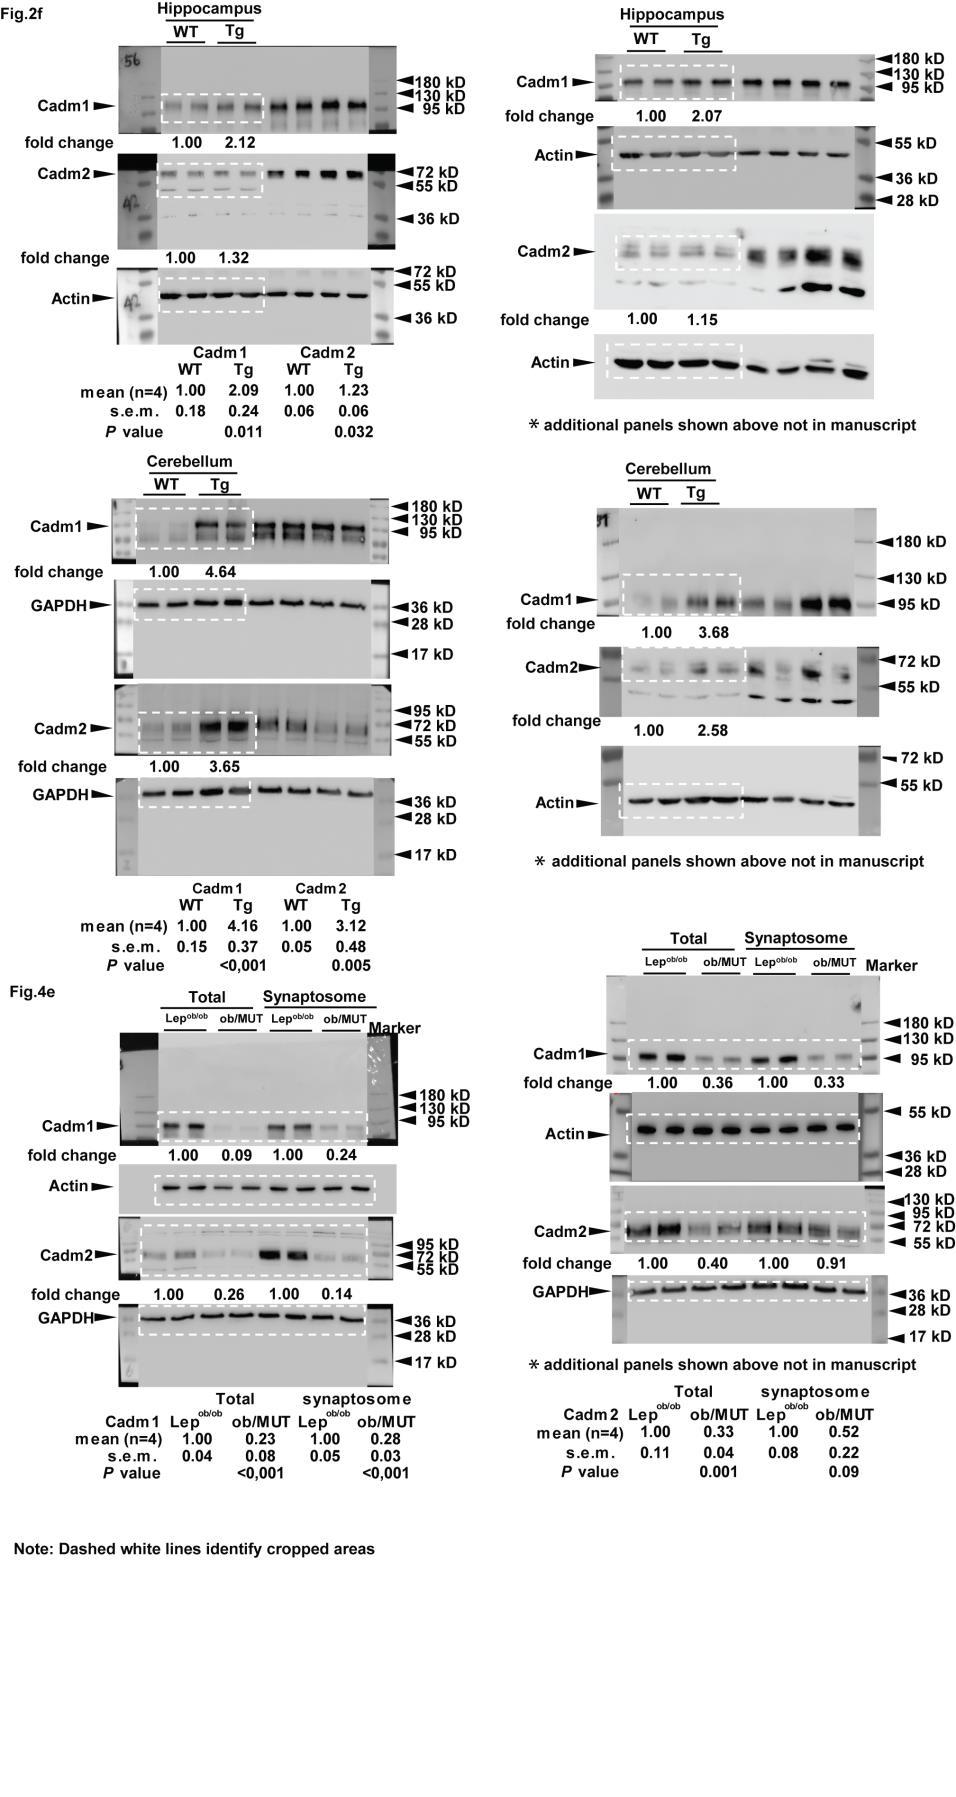
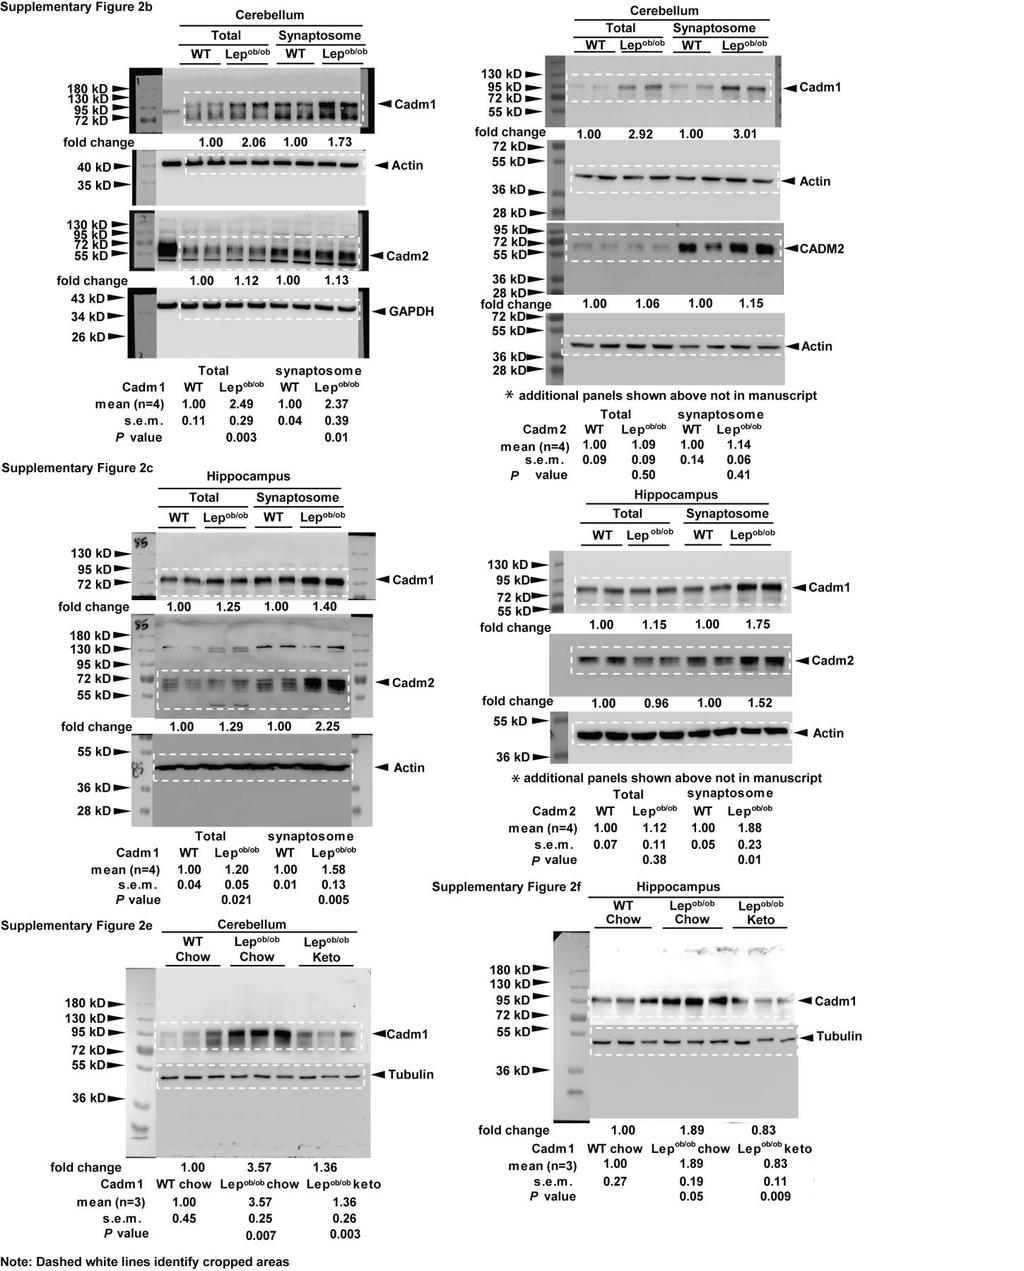
2 Supplementary Figure 2 Increased Cadm1 expression in multiple brain regions of Lepob/ob mice is reversed upon ketogenic diet feeding. (a) Schematic representation of Cadm1 and Cadm2 engaged in homophilic (homo) and heterophilic (het) interactions. (b) (c) Western blot analysis of Cadm1 and Cadm2 in total and synaptosome-enriched lysates from cerebellum and hippocampus of 4-week-old Lep ob/ob mice and littermate controls. (d) Quantification of western blot analysis of Cadm1 in multiple brain regions of 16-week-old WT and Lep ob/ob mice on chow or ketogenic diet for 45 days. Cortex (ctx), striatum (str), hippocampus (hpc), hypothalamus (hyp), midbrain
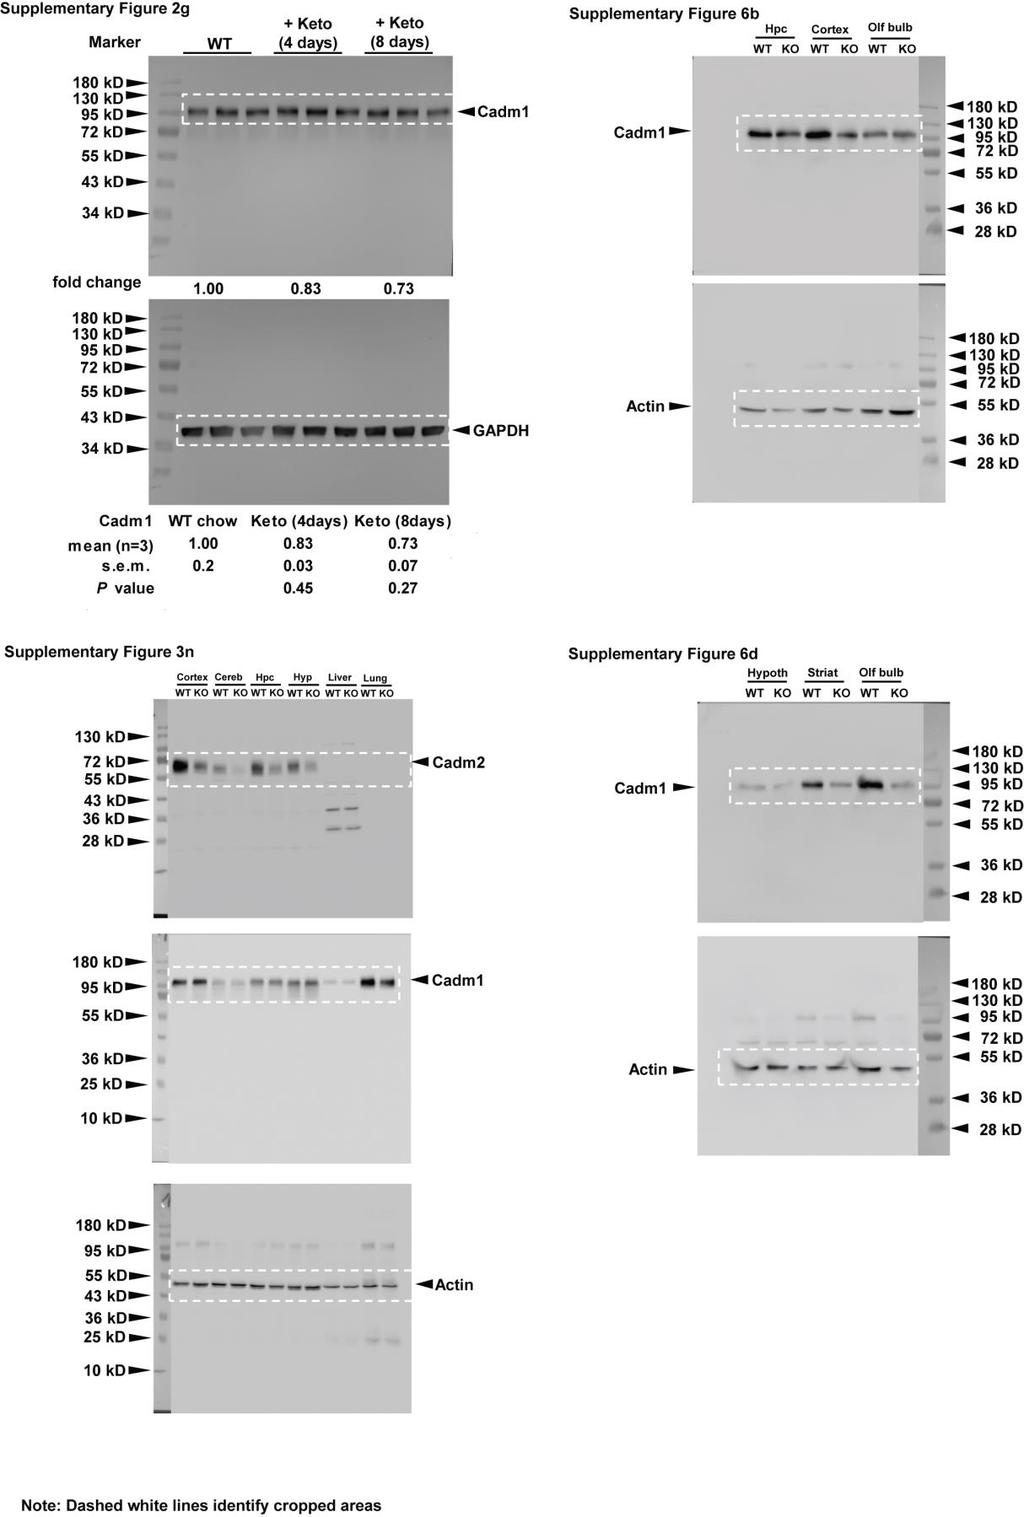
3 (mid), hindbrain (hind), and cerebellum (cer) are shown. (e, f) Western blot analysis of Cadm1 in cerebellum and hippocampus of 16- week-old wild-type on normal chow (WT/chow) and Lep ob/ob mice on normal chow (Lep ob/ob /chow) or ketogenic diet (Lep ob/ob /keto). (g) Western blot analysis of Cadm1 from isolated hippocampus of 12-week old C57Bl/6 mice after administration of ketogenic diet for 4 or 8 days. Results are presented as mean ± s.e.m. *P<0.05 and **P<0.01. Boxplots show median, lower and upper quartiles (box), and minimum and maximum (whiskers). Statistical analyses are described in the Methods and Supplementary Table 3.
4
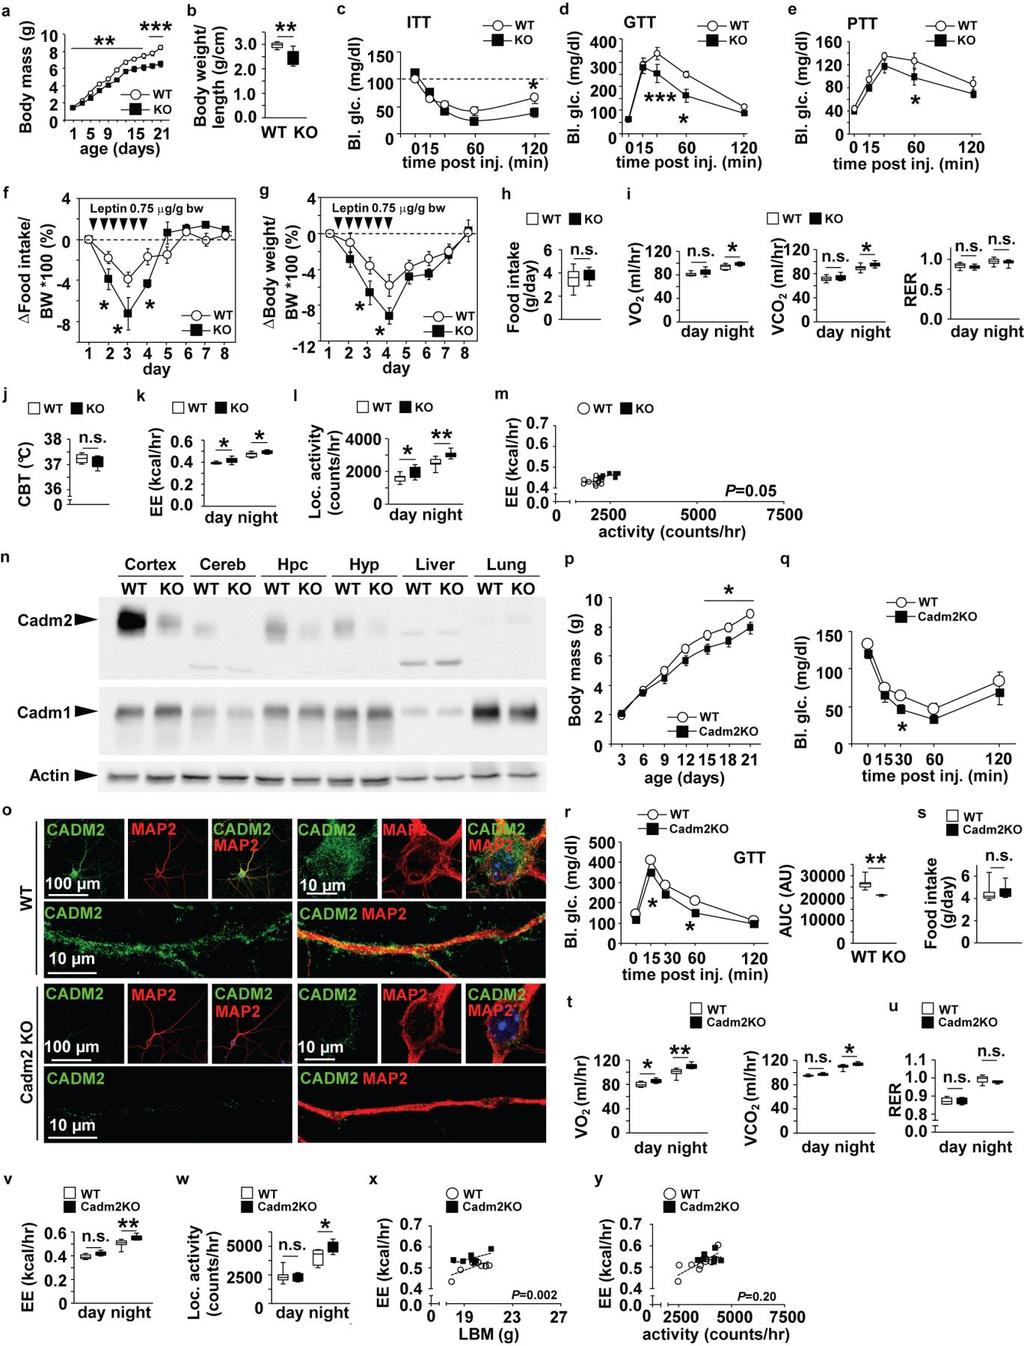
5 Supplementary Figure 3 Cadm1 and Cadm2 total knockout mice exhibit decreased body weight, and increased insulin sensitivity and energy expenditure. (a) Body weight curves of Cadm1KO mice (n=10) and littermate controls (n=12). (b) Body weight-to-length ratio in Cadm1KO mice (n=10) and control littermates at age 12-weeks (n=13). (c) Glucose measurements during an insulin tolerance test (ITT) on 12-week old Cadm1KO mice (n=5) and control littermates (n=5). (d) Glucose measurements during an intraperitoneal glucose tolerance test (GTT) on 12-week old Cadm1KO mice (n=5) and control littermates (n=6). (e) Glucose measurements during a pyruvate tolerance test (PTT) on 12-week old Cadm1KO mice (n=5) and control littermates (n=6). (f) Quantification of food intake in 12-week old Cadm1KO (n=5) and littermate controls (n=6) during leptin challenge. Daily food intake and body weight was measured for 5 days prior to leptin administration for base line. Differences in daily food intake were normalized to daily body weight. (g) Quantification of body weight change in 12-week old Cadm1KO (n=5) and littermate controls (n=6) during leptin challenge. Differences in daily body weight were normalized to daily body weight. (h) Quantification of daily food intake in 12-week old Cadm1KO (n=10) and littermate controls (n=10). (i) Quantification of O 2 consumption, CO 2 production, and RER, respectively in 12-week old male Cadm1KO mice (KO) (n=9) and control littermates (WT) (n=11). (j) Quantification of core body temperature (CBT) in 12-week old male Cadm1KO mice (KO) (n=5) and control littermates (WT) (n=5). (k) Quantification of energy expenditure during day and night phases in 12-week old male Cadm1KO mice (n=9) and control littermates (n=11). (l) Locomotor activity measured during day and night phases in 12-week old male Cadm1KO mice (n=8) and control littermates (n=8). (m) Energy expenditure of individual animals plotted against locomotor activity in 12-week old Cadm1KO (n=7) and littermate controls (n=11). (n) Western blot analysis of Cadm2 and Cadm1 in cortex, cerebellum (cereb), hippocampus (hpc), hypothalamus (hyp), liver and lung from Cadm2KO (KO) mice compared to littermate controls (WT). (o) Representative confocal images of primary hippocampal neurons isolated from Cadm2KO and littermate control mice, stained for Cadm2 (green) and MAP2 (red). (p) Body weight curves of Cadm2KO mice (n=8) and littermate controls (n=8) from age post-natal day (q) Glucose measurements during an ITT on 9-week old Cadm2KO mice (n=6) and control littermates (n=6). (r) Glucose measurements during a GTT on Cadm2KO mice (n=3) and littermates (n=8) and quantification of area under the curve (AUC). (s) Quantification of food intake in 10-week old Cadm2KO mice (n=7) and littermate controls (n=9). (t, u) Quantification of O 2 consumption, CO 2 production, and RER, respectively in 10-week old Cadm2KO mice (n=6) and littermate controls (n=8). (v) Quantification of energy expenditure in 10-week old Cadm2KO mice (n=6) and littermate controls (n=8). (w) Quantification of locomotor activity in 10-week old Cadm2KO mice (n=6) and littermate controls (n=8). (x) Energy expenditure of individual animals plotted against lean body mass (LBM) in 10-week old Cadm2KO mice (n=7) and littermate controls (n=8). (y) Energy expenditure of individual animals plotted against locomotor activity in 10-week old Cadm2KO mice (n=7) and littermate controls (n=8). Results in panels a, c, d, e, f, g, p, g, and r are presented as mean ± s.e.m. *P<0.05, and **P<0.01. Boxplots show median, lower and upper quartiles (box), and minimum and maximum (whiskers). Statistical analyses are described in the Methods and Supplementary Table 3.
6 Supplementary Figure 4
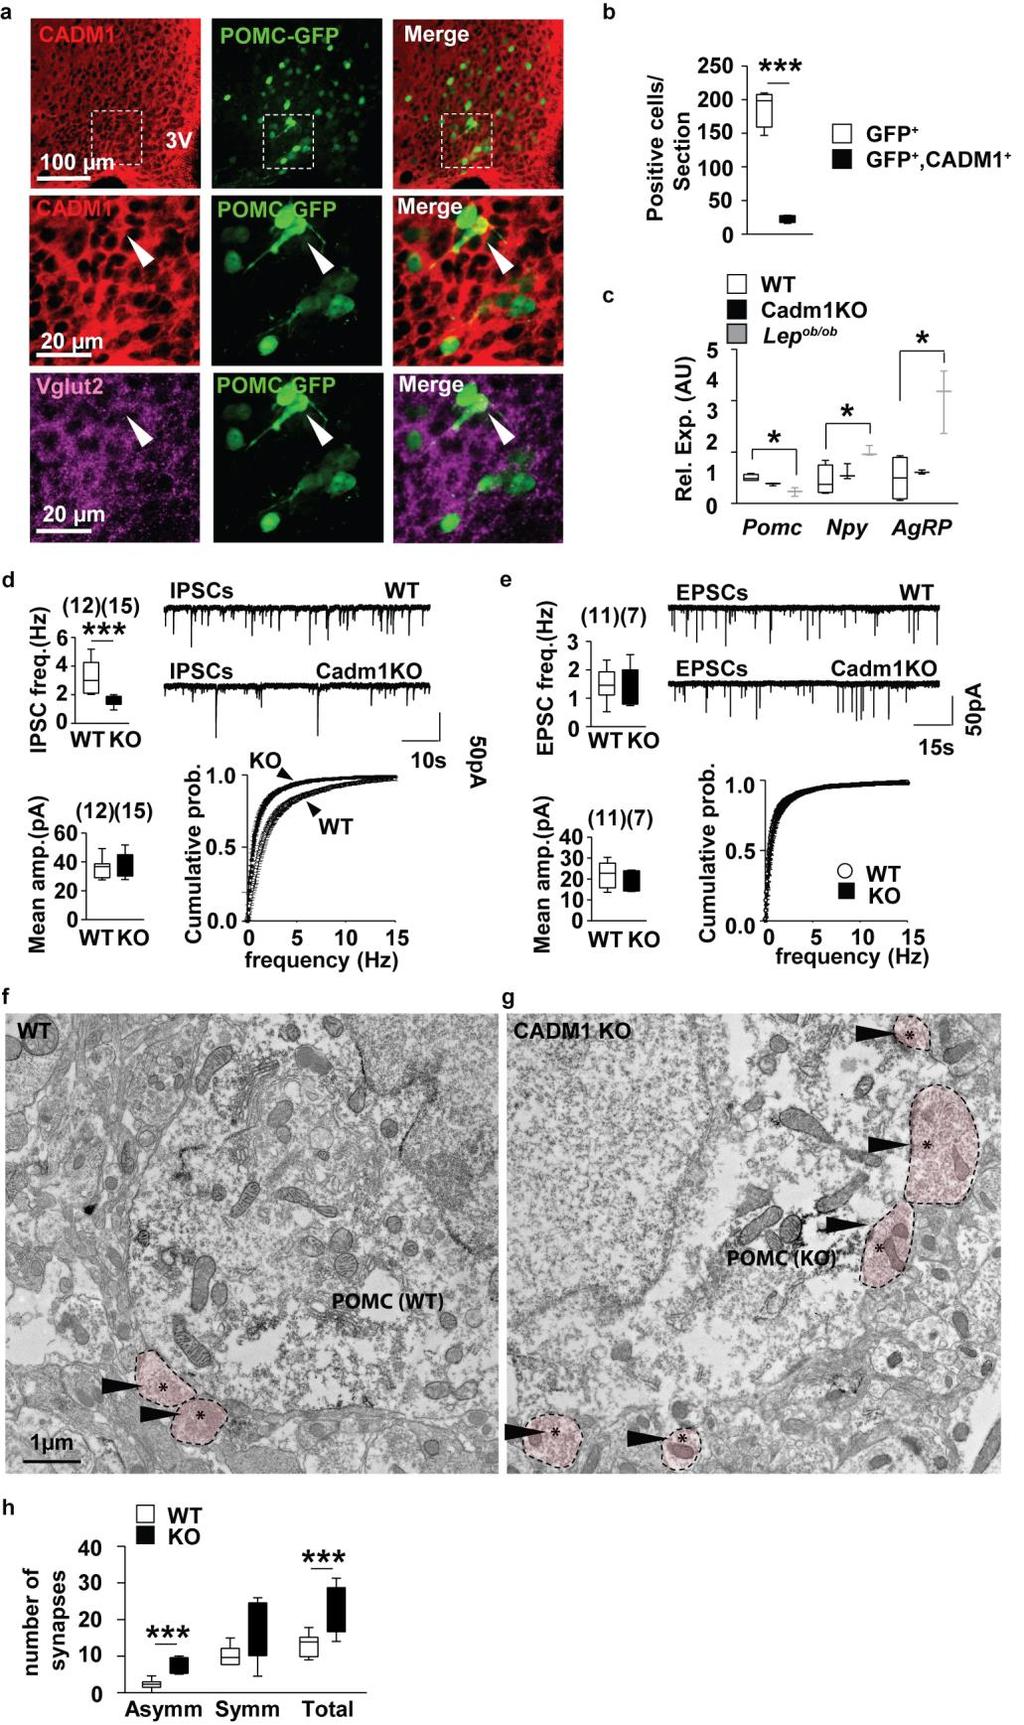
7 Loss of Cadm1 reduces inhibitory post-synaptic currents in POMC neurons. (a) Immunostaining of Cadm1 (red), POMC-eGFP (green) and VGLUT2 (magenta) identifies limited Cadm1 and VGLUT2 expression in POMC neurons in the arcuate nucleus region (ARC) of the hypothalamus. High magnification images are outlined by white boxes. (b) Immunostaining quantification of POMC-GFP and Cadm1-positive cells in the ARC (GFP-positive cells: 188±28; GFP- and CADM1- positive cells: 23±5). (c) qrt-pcr analysis of Pomc, Npy and Agrp expression in the ARC region of 12-week old Cadm1KO mice (n=3), Lep ob/ob mice (n=3) and control littermates (WT) (n=4). (d) Summary of miniature IPSC frequency in POMC neurons from Cadm1KO and control littermates at the age of 3 weeks (top left). Example traces of IPSCs recorded from POMC neurons of Cadm1KO or control littermates (top right). Mean amplitude and cumulative probability distribution of IPSC frequencies from POMC neurons showing a significant shift in Cadm1KO mice (n=15) compared to littermate control mice (n=12) (lower left and right). (e) Summary of miniature EPSC frequency in POMC neurons from Cadm1KO and control littermates (top left). Example traces of EPSCs recorded from POMC neurons of Cadm1KO or control littermates (top right). Mean amplitude and cumulative probability distribution of EPSC frequencies from POMC neurons showing no change in Cadm1KO mice (n=7) compared to littermate control mice (n=11) (lower left and right). (f, g) Representative electron micrographs showing perikaryal membranes of egfp-expressing POMC neurons from Cadm1KO (KO) and wild-type littermates (WT) mice identify marked differences in the asymmetrical (excitatory) synaptic inputs contacting POMC neurons (Scale bar, 1 μm). (h) Quantification of asymmetrical, symmetrical and total synapse numbers in in Cadm1KO mice (n=6) and littermate controls (n=8). Results are presented as mean ± s.e.m. *P<0.05, **P<0.01 and ***P< Boxplots show median, lower and upper quartiles (box), and minimum and maximum (whiskers). Statistical analyses are described in the Methods and Supplementary Table 3.
8
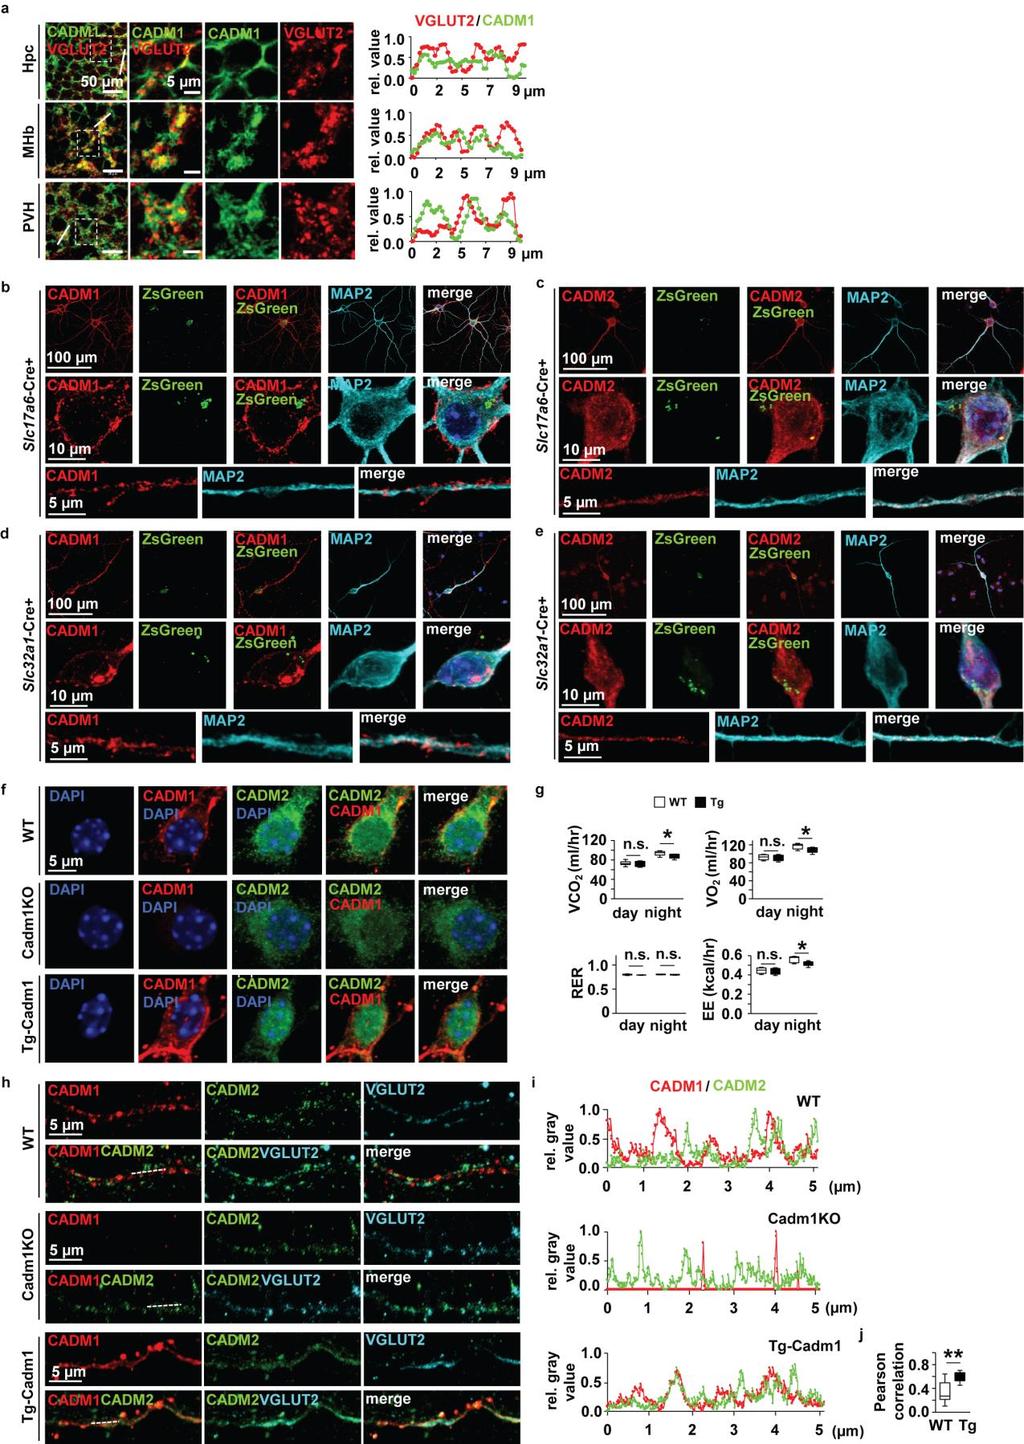
9 Supplementary Figure 5 Induction of Cadm1 in excitatory neurons increases co-localization with Cadm2. (a) Confocal images revealing partial co-localization of Cadm1 and VGLUT2 in the different mouse brain regions. Cadm1 (green) and VGLUT2 (red) co-localize in hippocampus (Hpc), medial habenula (MHb), and paraventricular hypothalamus (PVH) regions. High magnification images are identified by white boxes. Fluorescent intensity profiles of Cadm1 and VGLUT2 (measured along white lines) quantify the co-localization of Cadm1 and VGLUT2. (b, c) Representative confocal images of Cadm1 and Cadm2 expression in Slc17a6-Cre and (d, e) Slc32a1-Cre-positive primary hippocampal neurons. Immunostaining for Cadm1 or Cadm2 (red), ZsGreen (green), and Map2 (cyan). (f) Representative confocal images of Cadm1 and Cadm2 expression in primary hippocampal neurons of Cadm1KO, Tg-Cadm1, and WT mice. (g) Quantification of O 2 consumption, CO 2 production, RER and energy expenditure (EE), in 14- week old Tg-Cadm1 mice (n=6) and littermate controls (n=8). (h) Representative confocal images of Cadm1, Cadm2, and VGLUT2 expression in primary hippocampal neurons of Cadm1KO, Tg-Cadm1, and WT mice. Immunofluorescence detection of Cadm1 (red), Cadm2 (green), and VGLUT2 (cyan) in dendritic branches identifies areas of co-localization. (i) Fluorescence intensity profiles of Cadm1 and Cadm2 (measured along white dashed lines in (h) quantify areas of co-localization. (j) Pearson correlation indicates increased association between Cadm1 and Cadm2 expression in Tg-Cadm1 (n=9) mice compared to wild-type control littermates (n=10). Results are presented as mean ± s.e.m. *P<0.05. Boxplots show median, lower and upper quartiles (box), and minimum and maximum (whiskers). Statistical analyses are described in the Methods and Supplementary Table 3.
10 Supplementary Figure 6 Loss of Cadm1 in excitatory neurons improves glucose homeostasis and insulin sensitivity. (a) Confocal imaging of coronal brain slice identifying ZsGreen expression in Slc17a6-ires-Cre, lox-zsgreen mice at age 12 weeks. (b) Western blot analysis of Slc17a6-Cre-mediated reduction of Cadm1 expression in hippocampus (hpc), cortex, and olfactory bulb (Olf bulb). (c) Confocal imaging of coronal brain slice identifying egfp expression in Slc32a1-ires-Cre, lox-zsgreen mice at age 12 weeks. (d) Western blot analysis of Slc32a1-Cre-mediated reduction of Cadm1 expression in hypothalamus (Hypoth), striatum (Striat), and olfactory bulb (Olf bulb). (e) Body weight curves in Cadm1 flox/flox mice (n=6) and littermate controls (n=6) from age postnatal day (f) Body weight-to-length ratio in Cadm1 flox/flox mice (n=4) and control littermates (n=8) at age 3-weeks. (g) Body weight curves in Slc32a1-Cre, Cadm1 flox/flox mice (n=8) and littermate controls from 4-12 weeks of age (n=8). (h) Glucose measurements during an ITT on 12-week old Slc32a1-Cre, Cadm1 flox/flox mice (n=4) and control littermates (n=6) and quantification of area under the curve (AUC). (i) Glucose measurements during a GTT on Slc32a1-Cre, Cadm1 flox/flox mice (n=5) and control littermates (n=8). (j) Energy expenditure of individual animals plotted against lean body mass in 12-week old Slc32a1-Cre, Cadm1 flox/flox mice (n=7) and littermate controls (n=8). (k) Energy expenditure of individual animals plotted against locomotor activity in 12-week old
11 Slc32a1-Cre, Cadm1 flox/flox mice (n=7) and littermate controls (n=8). (l) Quantification of locomotor activity and food intake measured in 12-week old Slc32a1-Cre, Cadm1 flox/flox mice (n=8) and littermate controls (n=8). (m) Body weight, blood glucose, and plasma insulin values before initiating hyperinsulinemic-euglycemic clamp studies on 12-week old Cadm1 flox/flox mice (n=6) and control littermates (n=4). (n) Plasma glucose concentrations and glucose infusion rate during hyperinsulinemic-euglycemic clamp studies on 12-week old Cadm1 flox/flox mice (n=6) and control littermates (n=4). (o) Endogenous glucose production in the basal and the clamped state and suppression of hepatic glucose production in Cadm1 flox/flox mice (n=6) and control littermates (n=4). (p) Peripheral glucose uptake, glycolysis rate, glycogen synthesis, plasma insulin levels during the hyperinsulinemic-euglycemic clamp studies in 12-week old Cadm1 flox/flox mice (n=6) and control littermates (n=4). Results in panels e, g, h, I, and n are presented as mean ± s.e.m. *P<0.05, **P<0.01 and ***P< Boxplots show median, lower and upper quartiles (box), and minimum and maximum (whiskers). Statistical analyses are described in the Methods and Supplementary Table 3.
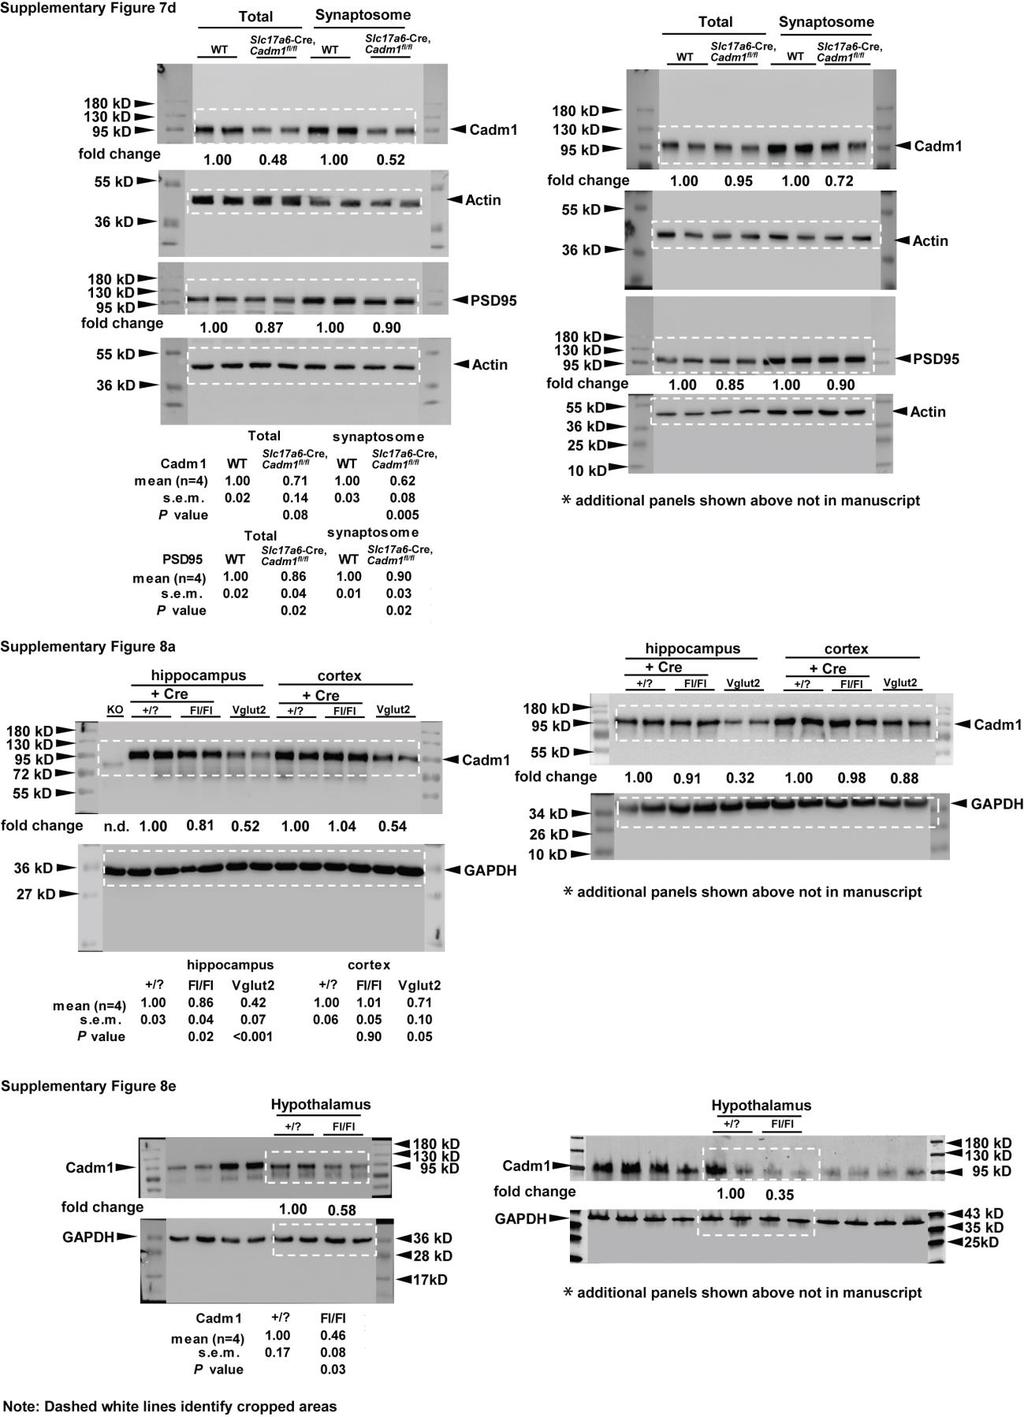
12 Supplementary Figure 7 Loss of Cadm1 in excitatory neurons increases long-term potentiation and long-term depression in hippocampal neurons. (a) Representative electron micrograph images from hippocampus of Cadm1 flox/flox mice and littermate controls. (b) Quantification of excitatory synapse number per volume fraction or per area and (c) Relative post-synaptic densities (PSD) length in hippocampus in Cadm1 flox/flox mice (n=3) and littermate controls (n=3). (d) Western blotting analysis of Cadm1 and PSD95 in total and synaptosome-enriched lysates from hippocampus of 12-week old Cadm1 flox/flox mice (n=2) and control littermates (n=2). (e) Cadm1 glutamatergic deficiency results in increased basal synaptic transmission. Representative fepsps responses at increasing stimulation intensities ( µa, color coded) show higher amplitudes for Cadm1 flox/flox as compared to WT controls. Synaptic transmission was measured as the relationship of fepsp slope vs fiber volley (FV) amplitudes. Two-way RM ANOVA revealed no significant changes for FV amplitudes (P=0.739). Slope of fepsp was significantly facilitated (P=0.029) in Cadm1 flox/flox mice (WT n=18, N=9; Cadm1 flox/flox n=20, N=9). (f) LTP induction in MPP-DG
13 synapses is facilitated in Cadm1 flox/flox mice. Representative traces are the average of 20 fepsps recorded 10 min before (black) and min after LTP induction (grey). Higher LTP values measured min after induction were detected in Slc17a6- Cre, Cadm1 flox/flox as compared to WT control (P=0.021, WT n=8, N=8; Cadm1 flox/flox n=9, N=8). (g) LTD induction in MPP- DG synapses is facilitated in Cadm1 flox/flox mice. Representative traces are the average of 20 fepsps recorded 10 min before (black) and min after LTD induction (grey). Facilitated LTD values measured min after induction were detected in Cadm1 flox/flox as compared to WT control (P=0.032, WT n=9, N=8; Cadm1 flox/flox n=10, N=9). Results are presented as mean ± s.e.m. *P<0.05. Boxplots show median, lower and upper quartiles (box), and minimum and maximum (whiskers). Statistical analyses are described in the Methods and Supplementary Table 3.
14
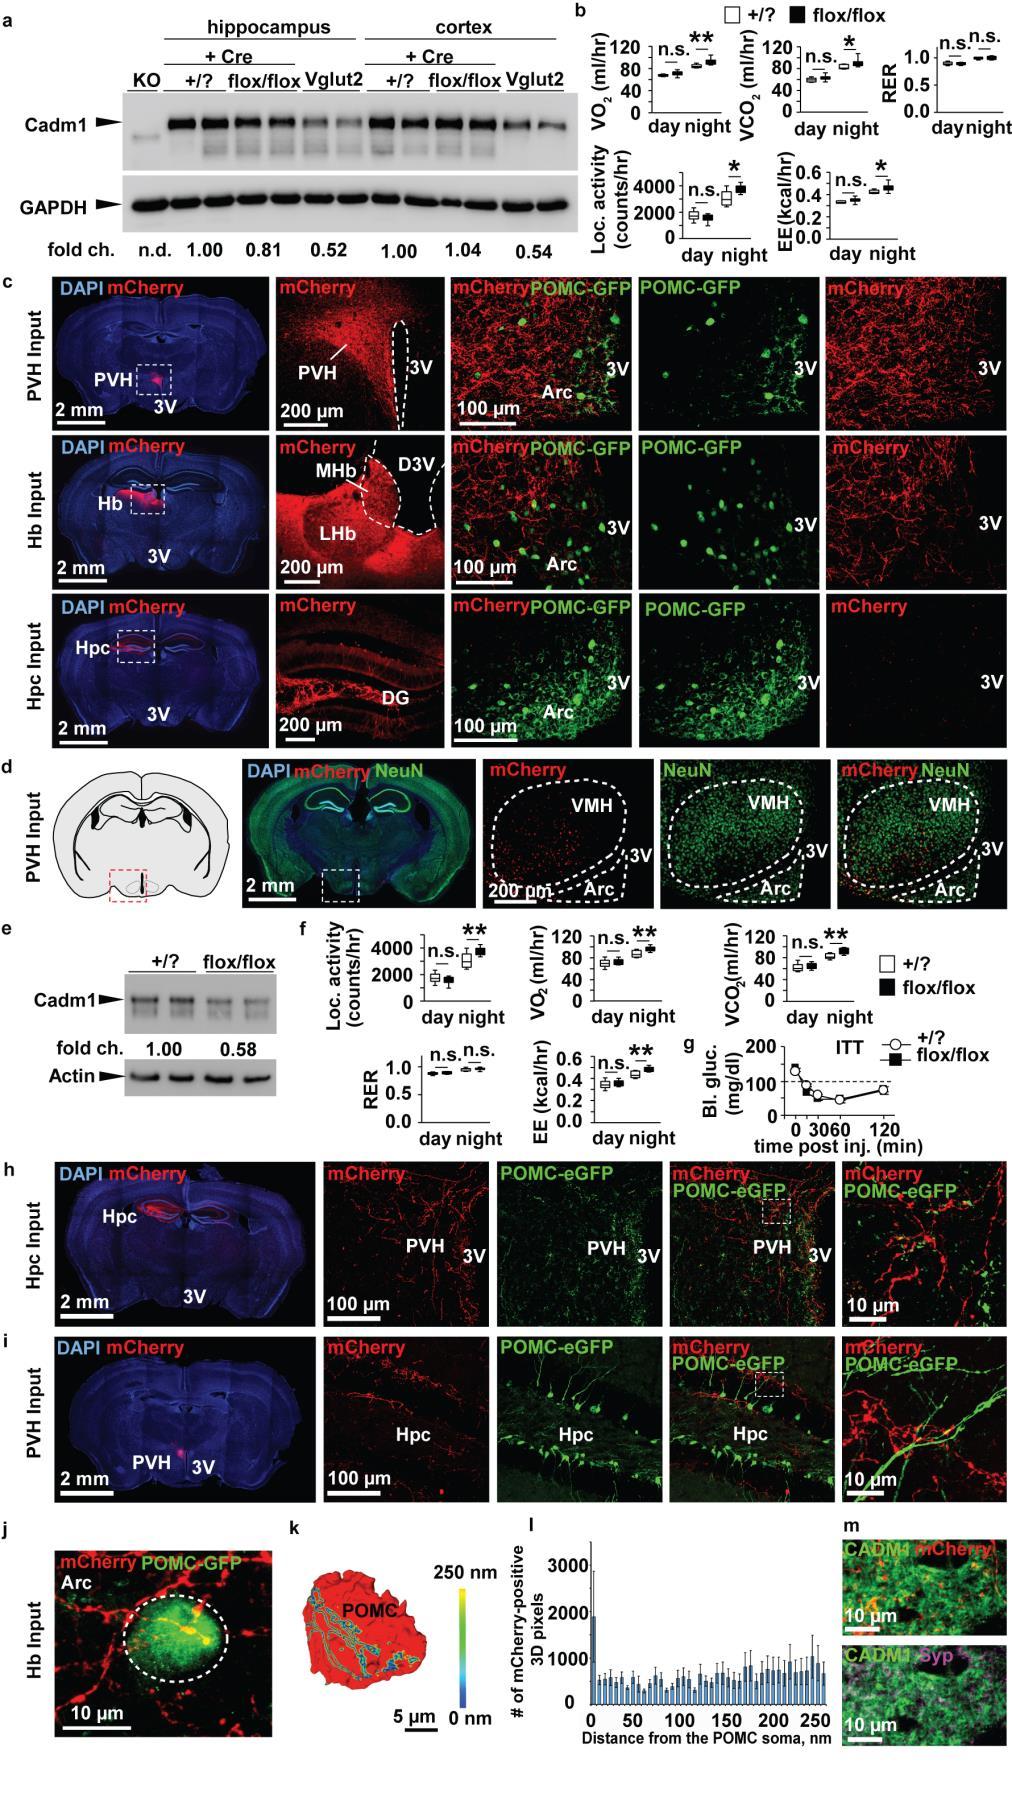
15 Supplementary Figure 8 Tracing analysis identifies VGLUT2-positive afferent inputs to the ARC originating from the PVH, MHb, and Hpc regions. (a) Western blot analysis of Cadm1 expression in total lysates from hippocampus and cortex after delivery of AAV-Cre to floxed Cadm1 mice (flox/flox) and control littermates (+/?). Total hippocampal lysates from Cadm1KO (KO) and Cadm1 flox/flox (Vglut2) serve as positive controls for loss of Cadm1 expression. (b) Quantification of O 2 consumption, CO 2 production, energy expenditure, locomotor activity and RER in 9-week old floxed Cadm1 mice (flox/flox) (n=7) and control littermates (+/?) (n=6). (c) Representative confocal images of coronal sections through the brain of Slc17a6-Cre/POMC-eGFP transgenic mice stereotaxically injected with AAV2/EF1a-DIO-hChR2(H134R)-mCherry into the paraventricular hypothalamus (PVH), habenular nuclei (Hb), and hippocampus (Hpc). Nuclei have been visualized with DAPI staining. High magnification images are identified by white boxes. (d) Representative coronal brain section of Cadm1 floxed mice after stereotaxic raav8-camkiia-mcherry-cre injection to hypothalamic neurons in the paraventricaular hypothalamus (PVH), and ventromedial hypothalamus (VMH) regions to target Cre expression to excitatory neurons in these areas; confocal imaging of mcherry and the neuronal marker NeuN. (e) Representative western blot analysis showing AAV-Cremediated deletion of Cadm1 after stereotaxic injection of raav8-camkiia-mcherry-cre into the PVH region of the hypothalamus. (f) Quantification of locomotor activity, O 2 consumption, CO 2 production, RER, and energy expenditure from 9-week old floxed Cadm1 mice (n=9) and control littermates (n=8) after stereotaxic injection of raav8/camkii-mcherry-cre injection into the hypothalamus. (g) Glucose measurements during an ITT on 9-week floxed Cadm1 mice (n=6) and control littermates (n=6) after stereotaxic injection of raav8/camkii-mcherry-cre injection into the hypothalamus. (h) Representative confocal images of coronal sections through the brain of Slc17a6-Cre/POMC-eGFP transgenic mice stereotaxically injected with AAV2/EF1a-DIO-hChR2(H134R)-mCherry into the hippocampus (Hpc). High magnification image of the PVH is identified by dashed box. (i) Representative confocal images of coronal sections through the brain of Slc17a6-Cre/POMC-eGFP transgenic mice stereotaxically injected with AAV2/EF1a-DIO-hChR2(H134R)- mcherry into the paraventricular hypothalamus (PVH). High magnification image of the hippocampus is identified by dashed box. (j) Confocal image analysis after stereotaxic injection of AAV2/EF1a-DIO-hChR2(H134R)-mCherry to the habenular nuclei (Hb) of Slc17a6-Cre/POMC-eGFP transgenic mice. Axonal varicosities (red) and POMC-positive neurons (green) are visualized within the ARC region of the hypothalamus. Dotted white circles outline egfp-pomc-positive cell body, used for 3D reconstruction analysis. (k) Surface rendering of Amira 3D reconstruction of egfp-pomc-positive cell body receiving afferent inputs from the MHb. Cell is represented in red, while the synaptic input is color-coded, with the cold to warm colors spreading from 0 to 250nm distance between axonal varicosities and the soma (see color-coded horizontal bar for the distance definition). (l) Histogram shows the number of anterograde AAV-mCherry-labelled MHb axonal varicosities found within 250nm distance from the POMC cell body. (m) Double immunostaining of Cadm1 and mcherry in MHb region identify Cadm1-positive anterograde projections to the ARC region of hypothalamus. Results in panel g are presented as mean ± s.e.m. *P<0.05, and **P<0.01. Boxplots show median, lower and upper quartiles (box), and minimum and maximum (whiskers). Statistical analyses are described in the Methods and Supplementary Table 3.
16 Supplementary Figure 9 Lepr-Cre-mediated deletion of Cadm1 impacts insulin sensitivity. (a) Glucose measurements during an ITT on 12-week old Agrp-Cre, Cadm1 flox/flox mice (n=3) and control littermates (n=5). (b) Glucose measurements during an ITT on 12-week old Pomc-Cre, Cadm1 flox/flox mice (n=6) and control littermates (n=6). (c) Glucose measurements during an ITT on 12-week old Sim1-Cre, Cadm1 flox/flox mice (n=6) and control littermates (n=10). (d) Body weight in Lepr- Cre, Cadm1 flox/flox mice (n=4) and littermate controls (n=7). (e) Glucose measurements during an ITT on 12-week old Lepr-Cre, Cadm1 flox/flox mice (n=3) and control littermates (n=5). (f) Correlation of energy expenditure of individual animals plotted against lean body mass in in 12-week old male Lepr-Cre, Cadm1 flox/flox mice (n=7) and littermate controls (n=8). (g) Quantification of locomotor activity and daily food intake in 12-week old Lepr-Cre, Cadm1 flox/flox mice (n=12) and littermate controls (n=12). (h) Body weight in ob/lepr-cre, Cadm1 flox/flox mice (n=3) and Lep ob/ob littermates (n=3). (i) Random-fed and fasted blood glucose and random-fed plasma insulin in 12-week old ob/lepr-cre, Cadm1 flox/flox mice (n=5) and Lep ob/ob littermates (n=7). (j) Glucose measurements during an insulin tolerance test on 12-week old ob/lepr-cre, Cadm1 flox/flox mice (n=5) and Lep ob/ob littermates (n=7). (k) Glucose measurements during a glucose tolerance test on 12-week old ob/lepr-cre, Cadm1 flox/flox mice (n=5) and Lep ob/ob littermates (n=6). (l) Glucose measurements during a pyruvate tolerance test on 12-week old ob/lepr-cre, Cadm1 flox/flox mice (n=3) and Lep ob/ob littermates (n=4). (m) Pancreatic β- cell mass and insulin content measurements in Lepr-Cre, Cadm1 flox/flox (n=5), ob/lepr-cre, Cadm1 flox/flox (n=7), Lep ob/ob (n=5), and wildtype (WT) littermate controls (n=6) from 12 weeks of age. (n) Energy expenditure per individual animals plotted against lean body mass in 12-week old ob/lepr-cre, Cadm1 flox/flox mice (n=6) and Lep ob/ob littermates (n=7). (o) Quantification of locomotor activity and daily food intake in 12-week old ob/lepr-cre, Cadm1 flox/flox mice (n=6) and Lep ob/ob littermates. (n=8). Results in panels a-e, h, and j-l are presented as mean ± s.e.m. *P<0.05, and **P<0.01. Boxplots show median, lower and upper quartiles (box), and minimum and maximum (whiskers). Statistical analyses are described in the Methods and Supplementary Table 3.
 Quadruple immunostaining within the ARC region showing Cadm1 and Vglut2-positive afferent projections in contact with POMC neuron.")
17 Supplementary Figure 10 Immunostaining of Cadm1 with Vglut2-positive afferent projections in contact with POMC neurons. (a) Quadruple immunostaining within the ARC region showing Cadm1 and Vglut2-positive afferent projections in contact with POMC neuron. Arrows indicate colocalization of mcherry punctas with Cadm1 and Vglut2. Slc17a6-Cre-positive mice received stereotaxic injection of AAV2-mCherry to the PVH, and were subsequently immunostained for POMC (green), mcherry (red), Cadm1 (magenta) and Vglut2 (cyan). (b) Visualization of Cadm1, mcherry, and Vglut2. Arrows indicate colocalization of mcherry punctas with Cadm1 and Vglut2.
18
19 Supplementary Figure 11 Original western blot panels with gel markers for Figures 2a, 2b, and 2f. Complete scanned gels for western blots shown in Figures 2a, 2b, and 2f. Western images are overlaid onto image containing MW markers. White dashed line identifies cropped region shown in respective figure. Replicate experiments are shown at the right and unlabeled lanes contain samples not included in this study. All results are presented as mean ± s.e.m.
20
21 Supplementary Figure 12 Original western blot panels with gel markers for Figures 2f and 4e. Complete scanned gels for western blots shown in Figures 2f, and 4e. Western images are overlaid onto image containing MW markers. White dashed line identifies cropped region shown in respective figure. All results are presented as mean ± s.e.m.
22
23 Supplementary Figure 13 Original western blot panels with gel markers for Supplementary Figures 2b, 2c, and 2e. Complete scanned gels for western blots shown in Supplementary Figures 2b, 2c, and 2e. Western images are overlaid onto image containing MW markers. White dashed line identifies cropped region shown in respective figure. All results are presented as mean ± s.e.m.
24
25 Supplementary Figure 14 Original western blot panels with gel markers for Supplementary Figures 2g, 3n, 6b, and 6d. Complete scanned gels for western blots shown in Supplementary Figures 2g, 3n, 6b, and 6d. Western images are overlaid onto image containing MW markers. White dashed line identifies cropped region shown in respective figure. All results are presented as mean ± s.e.m.
26
27 Supplementary Figure 15 Original western blot panels with gel markers for Supplementary Figures 7d, 8a, and 8e. Complete scanned gels for western blots shown in Supplementary Figures 7d, 8a, and 8e. Western images are overlaid onto image containing MW markers. White dashed line identifies cropped region shown in respective figure. All results are presented as mean ± s.e.m.
28 Supplementary Table 1. mice. Plasma measurements from wild-type and Cadm1KO Feeding state Wild-type (WT) Cadm1KO Glucose (mg/dl) Random fed ± 11.58, n= ± 13.22, n=6 Fasted 50.3 ± 2.595, n= ± 3.177, n=6 Insulin (ng/ml) Random fed ± , n= ± , n=6 Fasted ± , n= ± , n=8 Leptin (ng/ml) Random fed 6.38 ± , n= ± , n=6* Adiponectin ( g/ml) Random fed ± 1.235, n= ± 4.429, n=6* Analysis performed on Cadm1KO and littermate controls at 12-weeks of age. Results are presented as mean ± s.e.m. *P<
29 42 43 Supplementary Table 2. Body composition analysis of male Cadm mutant mouse lines and control littermates. Body composition of Cadm1KO mice and control littermates. body mass (g) body fat (%) lean mass (%) body fat (g) lean mass (g) Cadm1 +/? (n=11) ± ± ± ± ± 0.32 Cadm1KO (n=9) ± 0.94 * ± 0.69 * ± 0.58 * ± 0.26 ** ± 0.59 * Data is presented as means ± s.e.m. **P<0.01. Body composition of Cadm2KO mice and control littermates. body mass (g) body fat (%) lean mass (%) body fat (g) lean mass (g) Cadm2 +/? (n=7) ± ± ± ± ± 0.21 Cadm2KO (n=6) ± 0.62 * ± ± ± ± 0.39 * Data is presented as means ± s.e.m. *P<0.05. Body composition of Tg-Cadm1 mice and Slc17a6-Cre + littermates body mass (g) body fat (%) lean mass (%) body fat (g) lean mass (g) Slc17a6-Cre + (n=8) ± ± ± ± ± 0.39 Tg-Cadm1 (n=10) ± 0.48 ** ± 0.61 * ± 0.63 * 7.67 ± 0.20 ** ± 0.40 Data is presented as means ± s.e.m. *P<0.05, ** P<0.01. Body composition of Cadm1 flox/flox mice and Slc17a6-Cre + littermates. body mass (g) body fat (%) lean mass (%) body fat (g) lean mass (g) Slc17a6-Cre + (n=9) ± ± ± ± ± 0.62 Cadm1 flox/flox (n=8) ± 0.53 * ± ± ± 0.19 * ± 0.46 * Data is presented as means ± s.e.m. *P<0.05, **P<0.01. Body composition of ob/mut mice and Lep ob/ob ; Slc17a6-Cre + littermates. body mass (g) body fat (%) lean mass (%) body fat (g) lean mass (g) Lep ob/ob ; Slc17a6- Cre + (n=6) ± ± ± ± ± 0.66 ob/mut (n=5) 36 ± 1.24 * ± 0.70 * 39.5 ± 0.93 * ± 0.78 * 14.2 ± 0.43 * Data is presented as means ± s.e.m. *P<0.05, **P<0.01. Body composition of Slc32a1-Cre, Cadm1 flox/flox mice and Slc32a1-Cre + littermates. body mass (g) body fat (%) lean mass (%) body fat (g) lean mass (g) Slc32a1-Cre + (n=6) ± ± ± ± ± 0.45 Slc32a1-Cre +, Cadm1 flox/flox (n=6) ± ± ± ± ± 0.55 Data is presented as means ± s.e.m. Body composition of ob/lepr-cre, Cadm1 flox/flox mice and Lep ob/ob ; Lepr-Cre + littermates. body mass (g) body fat (%) lean mass (%) body fat (g) lean mass (g) Lep ob/ob ; Lepr-Cre + (n=5) ± ± ± ± ± 0.28 ob/lepr-cre, Cadm1 flox/flox (n=4) ± ± ± ± ± 0.23 Data is presented as means ± s.e.m. *P<
30 44 45 Supplementary Table 3. Summary of statistical analyses Figure Sample size (n) Statistical Test Values 1a AA: n=14 Linear regression t=1.963, P = 0.05 AG: n=44 GG: n=23 1b AA: n=56 Linear regression t=1.984, P = 0.05 AG: n=24 GG: n=1 2c Wild-type (n=4) Cadm1 +/- (n=3) Cadm1KO (n=3) One-way ANOVA 2d 2e 2g 2h 2i 2j 2k 2l 2m 2n 3a 3b 3c 3d Wild-type (n=10), Cadm1KO (n=10) Wild-type (n=12) Cadm1 KO (n=9) Wild-type (n=6) Tg-Cadm1 (n=6) Tg-Cadm1 (n=5) Wild-type (n=10) Tg- Cadm1 (n=7) Tg-Cadm1 (n=7) Wild-type (n=10) Tg- Cadm1 (n=7) Wild-type (n=6), Tg-Cadm1 (n=5) Wild-type (n=7), Tg-Cadm1 (n=5) Tg-Cadm1 (n=7) Wild-type (n=14), Cadm1 fl/fl (n=12) Wild-type (n=6), Cadm1 fl/fl (n=5) Wild-type (n=10), Cadm1 fl/fl (n=9) Wild-type (n=10), Cadm1 fl/fl (n=9) Cadm1: Genotype: F=243.9, P< Cadm2: Genotype: F= 0.229, P=0.801 Multiple comparison: ***P<0.001 Interaction: F=0.2169, P = Time: F=185.3, P < Genotype: F=39.41, P < Multiple comparison: *P<0.05, **P<0.01, ***P<0.001 Linear regression F=6.232, P = Cadm1: t=6.363, P = Cadm2: t= , P = Interaction: F=2.990, P = Time: F=77.91, P < Genotype: F=6.454, P = Multiple comparison: ***P<0.001 Linear regression F=5.559, P = Interaction: F = 5.383, P = Time: F = 83.91, P < Genotype: F = 10.93, P = Multiple comparison: **P<0.01 Linear regression F=0.367, P = Interaction: F=0.6532, P = Time: F=18.79, P < Genotype: F=20.40, P = Multiple comparison: *P<0.05 Interaction: F=2.990, P = Time: F=77.91, P < Genotype3b: F=6.454, P = Multiple comparison: *P<0.05, **P<0.01 t=0.5769, P= Interaction: F=0.3766, P = Time: F=511.9, P < Genotype: F=16.33, P = Multiple comparison: **P<0.01, ***P<0.001 Interaction: F=2.495, P = Time: F=189.4, P < Genotype: F=10.51, P = Multiple comparison: *P<0.05 VO 2: Interaction: F = 3.188, P = Time: F = 130.4, P < Genotype: F = 9.781, P = VCO 2: Interaction: F = 6.209, P = Time: F = 247.8, P < Genotype: F = 7.570, P = Multiple comparison: **P<0.01 RER: Interaction: F = 1.604, P = Time: F = 87.90, P < Genotype: F = 1.669, P = EE: Interaction: F = 4.130, P =
31 3d 3e 3f 3g 3h 3i 3k 4a 4b 4c 4d 4f 4g 4h 4i Wild-type (n=10), Cadm1 fl/fl (n=9) Wild-type (n=10) Slc17a6 -Cre, Cadm1 fl/fl (n=9) Wild-type (n=10) Slc17a6 -Cre, Cadm1 fl/fl (n=9), Cadm1 fl/fl (n=5), Cadm1 fl/fl (n=5), Cadm1 fl/fl (n=5), Cadm1 fl/fl (n=5) Wild-type (n=6), Cadm1 fl/fl (n=10) Wild-type (n=10), Cadm1 fl/fl (n=7) Wild-type (n=10) Slc17a6 -Cre, Cadm1 fl/fl (n=9) Wild-type (n=10) Slc17a6 -Cre, Cadm1 fl/fl (n=9) Lep ob/ob (n=9), ob/mut (n=5) Lep ob/ob (n=8), ob/mut (n=4) Lep ob/ob (n=9), ob/mut (n=5) Lep ob/ob (n=4), ob/mut (n=4) Time: F = 155.7, P < Genotype: F = 8.980, P = Activity: Interaction: F = 6.224, P = Time: F = 64.24, P < Genotype: F = 4.052, P = Multiple comparison: **P<0.01 t=1.670, P= Linear Regression F=15.397, P = Linear Regression F=5.133, P = Interaction: F=2.480, P = Time: F=46.22, P < Genotype: F=7.328, P = Multiple comparison: **P<0.01 Interaction: F=0.1424, P = Time: F=7.334, P = Genotype: F=27.93, P = Multiple comparison: *P<0.05 BAT: t=2.435, P = isat: t=3.125, P = Eye: t=2.998, P = t=0.8458, P = Interaction: F= , P = Time: F=347.7, P < Genotype: F=15.37, P = Multiple comparison: *P<0.05, **P<0.01 Interaction: F=3.658, P = Time: F=60.61, P < Genotype: F=6.238, P = Multiple comparison: **P<0.01 Linear regression F=15.243, P = Linear regression F=5.167, P = Interaction: F=1.432, P = Time: F=77.53, P < Genotype: F=16.44, P = Multiple comparison: **P<0.01 Glucose: t=2.962, P = Insulin: t=4.872, P = Interaction: F=2.883, P = Time: F=12.68, P < Genotype: F=8.184, P = Multiple comparison: *P<0.05, **P<0.01 G6pc: t=2.512, P = Pck1: t=4.731, P = j Lep ob/ob (n=4), t=3.373, P =
32 46 ob/mut (n=3) 4k Lepob/ob (n=6), Linear Regression F=5.600, P = ob/mut (n=5) 4l Lep ob/ob (n=7), t=0.7152, P = ob/mut (n=6) 5c +/? (n=6), Fl/fl (n=6) Interaction: F=8.020, P < Time: F=91.72, P < Genotype: F=5.403, P = Multiple comparison: **P<0.01 5d +/? (n=6), Linear Regression F=7.923, P = Fl/fl (n=7) 5e +/? (n=6), Linear Regression F=0.802, P = Fl/fl (n=7) 5f +/? (n=6), Fl/fl (n=7) t=0.5845, P = m +/? (n=11), Fl/fl (n=9) Interaction: F=3.439, P = Time: F=83.35, P < Genotype: F=9.483, P = Multiple comparison: *P<0.05, **P<0.01 5n +/? (n=9), Linear Regression F=11.57, P = Fl/fl (n=10) 5o +/? (n=9), Linear Regression F=4.433, P = Fl/fl (n=10) 5p +/? (n=9), Fl/fl (n=10) t=0.9483, P = Main Text Wild-type (n=9) Cadm1 KO (n=7) t=7, P < Suppl. Sample size (n) Statistical Test Values Fig. 1a AA: n=19 Linear regression t=2.476, P = AG: n=50 GG: n=34 1b AA: n=74 Linear regression t=2.476, P = AG: n=29 GG: n=0 2d Wild-type (n=3) Lep ob/ob (n=3) Lep ob/ob /Keto (n=3) One-way ANOVA Cortex: F=0.2879, P= Striatum: F=3.963, P= HPF: F=8.276, P= HY: F=0.4978, P= Midbrain: F=3.213, P= Hindbrain: F=3.255, P= Cerebellum: F=12.87, P=< a 3b 3c Wild-type (n=12) Cadm1KO (n=10) Wild-type (n=13) Cadm1KO (n=10) Wild-type (n=5) Cadm1KO (n=5) t=3.761, P= Multiple comparison: *P<0.05, **P<0.01 Interaction: F = 3.626, P = Time: F = 158.2, P < Genotype: F = 27.33, P < Multiple comparison: **P<0.01, ***P<0.001 Interaction: F = 2.126, P = Time: F = 32.14, P < Genotype: F = 6.426, P = Multiple comparison: *P<0.05 3d Wild-type (n=6) Cadm1KO (n=5) Interaction: F = 3.305, P = Time: F = 82.72, P < Genotype: F = 13.97, P = Multiple comparison: *P<0.05, ***P< e Wild-type (n=6) Cadm1KO (n=5) Interaction: F = , P = Time: F = 36.12, P < Genotype: F = 5.651, P = Multiple comparison: *P<0.05 3f Wild-type (n=6) Interaction: F = 3.154, P =
33 3g 3h 3i 3j 3k 3l 3m 3p 3q 3r 3s 3t 3u 3v 3w Cadm1KO (n=5) Wild-type (n=6) Cadm1KO (n=5) Wild-type (n=10) Cadm1KO (n=10) Wild-type (n=11) Cadm1KO (n=9) Wild-type (n=5) Cadm1KO (n=5) Wild-type (n=11) Cadm1KO (n=9) Wild-type (n=11) Cadm1KO (n=9) Wild-type (n=11) Cadm1 KO (n=7) Cadm2KO (n=8) Wild-type (n=5) Cadm2KO (n=3) Wild-type (n=7) Cadm2KO (n=3) Wild-type (n=9) Cadm2KO (n=7) Cadm2KO (n=6) Cadm2KO (n=6) Cadm2KO (n=6) Cadm2KO (n=6) 6 Time: F = 18.25, P < Genotype: F = , P = Multiple comparison: *P<0.05 Interaction: F = 2.171, P = Time: F = 31.02, P < Genotype: F = 3.454, P = Multiple comparison: *P<0.05 t=1.080, P= VO 2: Interaction: F = , P = Time: F = 173.3, P < Genotype: F = 9.411, P = VCO 2: Interaction: F = 2.267, P = Time: F = 357.9, P < Genotype: F = 5.951, P = RER: Interaction: F = , P = Time: F = 146.0, P < Genotype: F = 1.038, P = Multiple comparison: *P<0.05 t=0.8894, P= Linear Regression F=4.508, P = Interaction: F = , P = Time: F = 220.0, P < Genotype: F = 14.31, P = Multiple comparison: *P<0.05 Interaction: F = 1.130, P = Time: F = 147.9, P < Genotype: F = 22.33, P = Multiple comparison: *P<0.05, ***P<0.001 Interaction: F = 3.325, P = Time: F = 227.7, P < Genotype: F = 7.764, P = Multiple comparison: *P<0.05 Interaction: F = , P = Time: F = 24.84, P < Genotype: F = 6.296, P = Interaction: F = Time: F = Genotype: F = Multiple comparison: *P<0.05 t=3.495, P= (AUC) t=0.5274, P= VO 2: Interaction: F = 1.830, P = Time: F = 406.6, P < Genotype: F = 10.83, P = VCO 2: Interaction: F = , P = Time: F = 434.1, P < Genotype: F = 7.411, P = Multiple comparison: *P<0.05, **P<0.01 Interaction: F = 2.580, P = Time: F = 537.1, P < Genotype: F = 1.006, P = Interaction: F = 1.546, P = Time: F = 420.0, P < Genotype: F = 10.12, P = Multiple comparison: **P<0.01 Interaction: F = 5.887, P = Time: F = 149.7, P < Genotype: F = 2.953, P =
34 3x 3y Cadm2 KO (n=7) Cadm2 KO (n=7) Multiple comparison: *P<0.05 Linear Regression F=14.893, P = Linear Regression F=1.884, P = b n=4 t=11.46, P < c Wild-type (n=4) Cadm1KO (n=3) Lep ob/ob (n=3) One-way ANOVA 4d 4e 4h 5g 5j 6e 6f 6g 6h Wild-type (n=12) Cadm1 KO (n=15) Wild-type (n=11) Cadm1 KO (n=7) Cadm1KO (n=6) Tg-Cadm1 (n=6) Wild-type (n=10) Tg-Cadm1 (n=9) Wild-type (n=6) Cadm1 fl/fl (n=6) Cadm1 fl/fl (n=4) Slc32a1-Cre, Cadm1 fl/fl (n=8) Wild-type (n=6) Slc32a1-Cre, Cadm1 fl/fl (n=4) POMC: F = 15.47, P = Npy: F = 6.103, P = AgrP: F = 12.24, P = Multiple comparison: *P<0.05, **P<0.01 Frequency: t=5.54, P< Amplitude: t=1.167, P = Frequency: t=0.3743, P = Amplitude: t=1.179, P = Asymm: P= Symm: P= Total: P= VO 2: Interaction: F = 14.34, P = Time: F = 543.0, P < Genotype: F = 2.360, P = VCO 2: Interaction: F = 14.79, P = Time: F = 761.7, P < Genotype: F = 2.325, P = RER: Interaction: F = 1.431, P = Time: F = 4.515, P = Genotype: F = 2.807, P = EE: Interaction: F = 11.62, P = Time: F = 298.4, P < Genotype: F =3.330, P = Multiple comparison: *P<0.05 t=3.805, P= Interaction: F = 21.24, P < Time: F = 976.2, P < Genotype: F =8.715, P = Multiple comparison: ***P<0.001 t=7.010, P < Interaction: F = Time: F = Genotype: F =3.593 Interaction: F = , P = Time: F = 23.69, P < Genotype: F =6.625, P = AUC: t=2.379, P= i 6j Slc32a1-Cre, Cadm1 fl/fl (n=5) Slc32a1 -Cre, Cadm1 7 Interaction: F = 1.273, P = Time: F = 110.0, P < Genotype: F = , P = Linear Regression F=1.279, P = 0.280
35 6k 6l 6m 6n 6o 6p 7b 7c fl/fl (n=7) Slc32a1 -Cre, Cadm1 fl/fl (n=7) Slc32a1-Cre, Cadm1 fl/fl (n=8) Wild-type (n=4) Cadm1 fl/fl (n=6) Wild-type (n=4) Cadm1 fl/fl (n=6) Wild-type (n=4) Cadm1 fl/fl (n=6) Wild-type (n=4) Cadm1 fl/fl (n=6) Wild-type (n=4) Cadm1 fl/fl (n=4) Wild-type (n=3) Cadm1 fl/fl (n=3) Linear Regression F=0.608, P = Activity: Interaction: F = 2.252, P = Time: F = 33.35, P < Genotype: F = , P = Food: Interaction: F = , P = Time: F = 242.2, P < Genotype: F =1.143, P = Body Weight: t=1.686, P= Blood Glucose: t=0.1078, P= Insulin: t=1.417, P= Glucose: Interaction: F = 1.546, P = Time: F = 1.290, P = Genotype: F =0.5860, P = GIR: Interaction: F = 2.304, P = Time: F = 60.97, P < Genotype: F =6.661, P = Multiple comparison: *P<0.05 t=2.653, P= Basal output: t=1.675, P= Clamped output: t=2.557, P= Clamped suppression: t=5.739, P= Glc Uptake: t=0.7176, P= Glycolysis rate: t=1.236, Glyc. Synth.: t=1.346, P= Insulin: t=0.9284, P= Synapse number per m 2 : n.s. Synapse profiles per m 2 : n.s. t=3.001, P= b +/? (n=6), Fl/fl (n=7) VO 2: Interaction: F = 4.537, P = Time: F = 294.3, P < Genotype: F = 8.264, P = VCO 2: Interaction: F = 4.400, P = Time: F = 443.1, P < Genotype: F = 4.954, P = RER: Interaction: F = , P = Time: F = 453.0, P < Genotype: F =0.1127, P = Activity: Interaction: F = 4.814, P = Time: F = 310.6, P < Genotype: F =7.113, P = EE: Interaction: F = 5.747, P = Time: F = 635.3, P <
36 Genotype: F =4.674, P = Multiple comparison: *P<0.05, **P<0.01 VO 2: Interaction: F = 12.08, P = Time: F = 593.1, P < Genotype: F = 5.415, P = VCO 2: Interaction: F = 12.37, P = Time: F = 626.8, P < Genotype: F = 5.785, P = RER: Interaction: F = , P = Time: F = 97.55, P < Genotype: F =1.203, P = Activity: Interaction: F = 17.10, P = Time: F = 280.2, P < Genotype: F =3.298, P = EE: Interaction: F = 12.98, P = Time: F = 604.9, P < Genotype: F =5.687, P = Multiple comparison: *P<0.05, **P<0.01 Interaction: F = 1.318, P = Time: F = 41.35, P < Genotype: F =0.1742, P = Interaction: F = 2.143, P = Time: F = 32.61, P < Genotype: F =1.151, P = Interaction: F = 1.059, P = Time: F = 46.59, P < Genotype: F =0.9397, P = Interaction: F = , P = Time: F = 76.77, P < Genotype: F =0.1604, P = Interaction: F = , P = Time: F = 168.9, P < Genotype: F =0.2692, P = Interaction: F = , P = Time: F = 26.95, P < Genotype: F =0.3345, P = Linear Regression F=0.002, P = f +/? (n=8), Fl/fl (n=9) 8g +/? (n=6), Fl/fl (n=6) 9a 9b 9c 9d 9e 9f 9g 9h 9i 9j 9k 9l Wild-type (n=5) Agrp-Cre, Cadm1 fl/fl (n=3) Wild-type (n=6) Pomc-Cre, Cadm1 fl/fl (n=6) Wild-type (n=10) Sim1-Cre, Cadm1 fl/fl (n=6) Wild-type (n=7) Lepr-Cre, Cadm1 fl/fl (n=4) Wild-type (n=5) Lepr-Cre, Cadm1 fl/fl (n=3) Lepr -Cre, Cadm1 fl/fl (n=7) Wild-type (n=12) Lepr-Cre, Cadm1 fl/fl (n=12) Lep ob/ob (n=3) ob/lepr-cre, Cadm1 fl/fl (n=3) Lep ob/ob (n=7) ob/lepr-cre, Cadm1 fl/fl (n=5) Lep ob/ob (n=6) ob/lepr-cre, Cadm1 fl/fl (n=5) Lep ob/ob (n=6) ob/lepr-cre, Cadm1 fl/fl (n=5) Lep ob/ob (n=4) ob/lepr-cre, Cadm1 fl/fl (n=3) 9 Activity: t=1.225, P= Food: t=0.2306, P= Interaction: F = , P = Time: F = 312.3, P < Genotype: F = , P = Random fed: t=2.816, P= Fasted: t=2.294, P= Insulin: t=3.353, P= Interaction: F = 5.885, P = Time: F = 29.97, P < Genotype: F =10.40, P = Multiple comparison: ***P<0.001 Interaction: F = 1.571, P = Time: F = 35.12, P < Genotype: F =10.43, P = Multiple comparison: **P<0.01 Interaction: F = , P = Time: F = 19.65, P < Genotype: F =17.04, P = Multiple comparison: *P<0.05, **P<0.01
37 9m 9n 9o Supp Tab. 1 Supp Tab. 1 Supp Tab. 1 Supp Tab. 1 Supp Tab. 2 Supp Tab. 2 Supp Tab. 2 Wild-type (n=6) Lepr-Cre, Cadm1 fl/fl (n=5) Lep ob/ob (n=5) ob/lepr-cre, Cadm1 fl/fl (n=7) Lepr-Cre, Cadm1 fl/fl (n=5) Lep ob/ob (n=6) ob/lepr-cre, Cadm1 fl/fl (n=4) Lep ob/ob (n=6) ob/lepr -Cre, Cadm1 fl/fl (n=7) Lep ob/ob (n=8) ob/lepr-cre, Cadm1 fl/fl (n=6) Wild-type (n=10-12) Cadm1 KO (n=6) Wild-type (n=7-9) Cadm1 KO (n=6-8) Wild-type (n=10) Cadm1 KO (n=6) Cadm1 KO (n=6) Wild-type (n=11) Cadm1 KO (n=9) Wild-type (n=7) Cadm2 KO (n=6) Tg- Cadm1 (n=10) One-way ANOVA 10 Beta cell mass: F= 39.63, P < Multiple comparison: ***P<0.001 Insulin Content: F= 103.5, P= < Multiple comparison: ***P<0.001 Linear Regression F=1.215, P = Activity: t=1.126, P = Food: t= , P = Glucose random fed: t= , P = fasted: t=0.3685, P = Insulin random fed: t=0.5844, P = fasted: t=0.2725, P = Leptin t=2.521, P = Adiponectin t=2.451, P = body mass: t=2.74, P = body fat (%): t=2.752, P = lean mass (%): t=2.175, P = body fat (g): t=3.317, P = lean mass (g): t=2.45, P = body mass: t=2.27, P = body fat (%): t=0.9068, P = lean mass (%): t=0.9418, P = body fat (g): t=0.1477, P = lean mass (g): t=3.067, P = body mass: t=3.023, P = body fat (%): t=2.299, P = lean mass (%): t=2.263, P = body fat (g): t=2.975, P = lean mass (g): t=1.918, P = Supp Tab. Wild-type (n=9), body mass:
38 47 2 Cadm1 fl/fl (n=8) Supp Tab. 2 Supp Tab. 2 Supp Tab. 2 Lepob/ob (n=6), ob/mut (n=5) Wild-type (n=6) Slc32a1 -Cre, Cadm1 fl/fl (n=6) Lep ob/ob (n=5) ob/lepr -Cre, Cadm1 fl/fl (n=4) t=2.81, P = body fat (%): t=1.131, P = lean mass (%): t=0.7095, P = body fat (g): t=2.741, P = lean mass (g): t=2.44, P = body mass: t=2.857, P = body fat (%): t=2.935, P = lean mass (%): t=2.789, P = body fat (g): t=2.79, P = lean mass (g): t=3.011, P = body mass: t=0.167, P = body fat (%): t=0.6027, P = lean mass (%): t=0.5265, P = body fat (g): t=0.568, P = lean mass (g): t= , P = body mass: t=1.131, P = body fat (%): t=1.257, P = lean mass (%): t=1.161, P = body fat (g): t=1.247, P = lean mass (g): t=0.6805, P =
Zhu et al, page 1. Supplementary Figures
 Zhu et al, page 1 Supplementary Figures Supplementary Figure 1: Visual behavior and avoidance behavioral response in EPM trials. (a) Measures of visual behavior that performed the light avoidance behavior
SUPPLEMENTARY INFORMATION
 Supplementary Figure 1. Normal AMPAR-mediated fepsp input-output curve in CA3-Psen cdko mice. Input-output curves, which are plotted initial slopes of the evoked fepsp as function of the amplitude of the
Nature Neuroscience: doi: /nn Supplementary Figure 1. Diverse anorexigenic signals induce c-fos expression in CEl PKC-δ + neurons
 Supplementary Figure 1 Diverse anorexigenic signals induce c-fos expression in CEl PKC-δ + neurons a-c. Quantification of CEl c-fos expression in mice intraperitoneal injected with anorexigenic drugs (a),
Supplementary Figure 1
 Supplementary Figure 1 Arcuate ChIEF-tdTomato neurons expressed TH These micrographs show that TH-Cre-ChIEF-tdTomato (magenta), expressed by AAV in a TH-Cre mouse, were immunostained with TH (green) in
Nature Neuroscience: doi: /nn Supplementary Figure 1
 Supplementary Figure 1 Subcellular segregation of VGluT2-IR and TH-IR within the same VGluT2-TH axon (wild type rats). (a-e) Serial sections of a dual VGluT2-TH labeled axon. This axon (blue outline) has
SUPPLEMENTARY INFORMATION
 DOI: 10.1038/ncb2566 Figure S1 CDKL5 protein expression pattern and localization in mouse brain. (a) Multiple-tissue western blot from a postnatal day (P) 21 mouse probed with an antibody against CDKL5.
Supplementary Figure 1. Nature Neuroscience: doi: /nn.4547
 Supplementary Figure 1 Characterization of the Microfetti mouse model. (a) Gating strategy for 8-color flow analysis of peripheral Ly-6C + monocytes from Microfetti mice 5-7 days after TAM treatment. Living
a Supplementary Figure 1 Celastrol Withaferin A Individual drugs
 Supplementary Figure 1 a 17 27 HSPA1A SLC7A11 HMOX1 GSTA1 DUSP4 GML CHAC1 CDKN1A GSTA4 CA6 BHLHE41 NR1D1 HSPB1 PTX3 HP NFKBIA VDR MVD HAS2 ANGPT1 WDR6 TGFB3 IDI1 VCAM1 H1F HMGCS1 CXCL5 STEAP4 NOS2 b Enrichment
Nature Neuroscience: doi: /nn Supplementary Figure 1. Splenic atrophy and leucopenia caused by T3 SCI.
 Supplementary Figure 1 Splenic atrophy and leucopenia caused by T3 SCI. (a) Gross anatomy of representative spleens from control and T3 SCI mice at 28 days post-injury. (b and c) Hematoxylin and eosin
Nature Neuroscience: doi: /nn Supplementary Figure 1
 Supplementary Figure 1 Atlas representations of the midcingulate (MCC) region targeted in this study compared against the anterior cingulate (ACC) region commonly reported. Coronal sections are shown on
SUPPLEMENTARY INFORMATION
 doi:10.1038/nature12652 Supplementary Figure 1. PRDM16 interacts with endogenous EHMT1 in brown adipocytes. Immunoprecipitation of PRDM16 complex by flag antibody (M2) followed by Western blot analysis
Nature Neuroscience: doi: /nn Supplementary Figure 1
 Supplementary Figure 1 Drd1a-Cre driven ChR2 expression in the SCN. (a) Low-magnification image of a representative Drd1a-ChR2 coronal brain section (n = 2) showing endogenous tdtomato fluorescence (magenta).
Supplemental information Acid-sensing ion channel 1a contributes to hippocampal LTP inducibility through multiple mechanisms
 Supplemental information Acid-sensing ion channel 1a contributes to hippocampal LTP inducibility through multiple mechanisms Ming-Gang Liu, Hu-Song Li, Wei-Guang Li, Yan-Jiao Wu, Shi-Ning Deng, Chen Huang,
SUPPLEMENTARY INFORMATION
 Supplementary Figure 1. Behavioural effects of ketamine in non-stressed and stressed mice. Naive C57BL/6 adult male mice (n=10/group) were given a single dose of saline vehicle or ketamine (3.0 mg/kg,
Supplementary Figure 1. DJ-1 modulates ROS concentration in mouse skeletal muscle.
 Supplementary Figure 1. DJ-1 modulates ROS concentration in mouse skeletal muscle. (a) mrna levels of Dj1 measured by quantitative RT-PCR in soleus, gastrocnemius (Gastroc.) and extensor digitorum longus
Supplementary Materials for VAMP4 directs synaptic vesicles to a pool that selectively maintains asynchronous neurotransmission
 Supplementary Materials for VAMP4 directs synaptic vesicles to a pool that selectively maintains asynchronous neurotransmission Jesica Raingo, Mikhail Khvotchev, Pei Liu, Frederic Darios, Ying C. Li, Denise
Supplementary Figure 1) GABAergic enhancement by leptin hyperpolarizes POMC neurons A) Representative recording samples showing the membrane
 GABAergic enhancement by leptin hyperpolarizes POMC neurons A) Representative recording samples showing the membrane") Supplementary Figure 1) GABAergic enhancement by leptin hyperpolarizes POMC neurons A) Representative recording samples showing the membrane potential recorded from POMC neurons following treatment with
Supplementary Figure 1) GABAergic enhancement by leptin hyperpolarizes POMC neurons A) Representative recording samples showing the membrane potential recorded from POMC neurons following treatment with
Supplementary Figure 1
 Supplementary Figure 1 Localization of virus injections. (a) Schematic showing the approximate center of AAV-DIO-ChR2-YFP injection sites in the NAc of Dyn-cre mice (n=8 mice, 16 injections; caudate/putamen,
Supplemental data Supplemental Figure Legends Supplemental Figure 1. Supplemental Figure 2.
 Supplemental data Supplemental Figure Legends Supplemental Figure 1. Analysis of deletion of AMPK!2 in POMC and AgRP neurons in control and POMC!2KO and AgRP!2KO mice. (A) mmunofluorescence analysis for
mtorc2 controls actin polymerization required for consolidation of long-term memory
 CORRECTION NOTICE Nat. Neurosci.; doi:1.138/nn.3351 mtorc2 controls actin polymerization required for consolidation of long-term memory Wei Huang, Ping Jun Zhu, Shixing Zhang, Hongyi Zhou, Loredana Stoica,
Supplementary figure 1: LII/III GIN-cells show morphological characteristics of MC
 1 2 1 3 Supplementary figure 1: LII/III GIN-cells show morphological characteristics of MC 4 5 6 7 (a) Reconstructions of LII/III GIN-cells with somato-dendritic compartments in orange and axonal arborizations
Nature Neuroscience: doi: /nn Supplementary Figure 1. Large-scale calcium imaging in vivo.
 Supplementary Figure 1 Large-scale calcium imaging in vivo. (a) Schematic illustration of the in vivo camera imaging set-up for large-scale calcium imaging. (b) High-magnification two-photon image from
Nature Neuroscience: doi: /nn Supplementary Figure 1
 Supplementary Figure 1 Quantification of myelin fragments in the aging brain (a) Electron microscopy on corpus callosum is shown for a 18-month-old wild type mice. Myelin fragments (arrows) were detected
Supplementary Fig. 1: TBR2+ cells in different brain regions.
 Hip SVZ OB Cere Hypo Supplementary Fig. 1: TBR2 + cells in different brain regions. Three weeks after the last tamoxifen injection, TBR2 immunostaining images reveal a large reduction of TBR2 + cells in
Supplemental Information. FGF19, FGF21, and an FGFR1/b-Klotho-Activating. Antibody Act on the Nervous System. to Regulate Body Weight and Glycemia
 Cell Metabolism, Volume 26 Supplemental Information FGF19, FGF21, and an FGFR1/b-Klotho-Activating Antibody Act on the Nervous System to Regulate Body Weight and Glycemia Tian Lan, Donald A. Morgan, Kamal
Role of the ventromedial hypothalamic Steroidogenic Factor 1/ Adrenal 4. glucose metabolism in mice.
 Role of the ventromedial hypothalamic Steroidogenic Factor 1/ Adrenal 4 Binding Protein neurons in the regulation of whole body energy and glucose metabolism in mice. Eulalia Coutinho Department of Physiological
Supplementary Materials for. c-abl Activation Plays a Role in α-synucleinopathy Induced Neurodegeneration
 Supplementary Materials for c-abl Activation Plays a Role in α-synucleinopathy Induced Neurodegeneration Saurav Brahmachari, Preston Ge, Su Hyun Lee, Donghoon Kim, Senthilkumar S. Karuppagounder, Manoj
Central injection of fibroblast growth factor 1 induces sustained remission of diabetic hyperglycemia in rodents
 Central injection of fibroblast growth factor 1 induces sustained remission of diabetic hyperglycemia in rodents Jarrad M Scarlett 1,,1, Jennifer M Rojas 1,1, Miles E Matsen 1, Karl J Kaiyala 3, Darko
glucagon receptor AgRP merged color map I corr = 0.76±0.024 glucagon receptor DAPI merged
 Hypothalamic glucagon signaling inhibits glucose production Patricia I. Mighiu*, Jessica T.Y. Yue*, Beatrice M. Filippi, Mona A. Abraham, Madhu Chari, Carol K.L. Lam, Clair S. Yang, Nikita R. Christian,
Supplementary Materials for
 www.sciencesignaling.org/cgi/content/full/8/407/ra127/dc1 Supplementary Materials for Loss of FTO in adipose tissue decreases Angptl4 translation and alters triglyceride metabolism Chao-Yung Wang,* Shian-Sen
Diabetic pdx1-mutant zebrafish show conserved responses to nutrient overload and anti-glycemic treatment
 Supplementary Information Diabetic pdx1-mutant zebrafish show conserved responses to nutrient overload and anti-glycemic treatment Robin A. Kimmel, Stefan Dobler, Nicole Schmitner, Tanja Walsen, Julia
Supplementary Information
 Supplementary Information Akt regulates hepatic metabolism by suppressing a Foxo1 dependent global inhibition of adaptation to nutrient intake Mingjian Lu 1, Min Wan 1, Karla F. Leavens 1, Qingwei Chu
Nature Neuroscience doi: /nn Supplementary Figure 1. Characterization of viral injections.
 Supplementary Figure 1 Characterization of viral injections. (a) Dorsal view of a mouse brain (dashed white outline) after receiving a large, unilateral thalamic injection (~100 nl); demonstrating that
Hypothalamic TLR2 triggers sickness behavior via a microglia-neuronal axis
 Hypothalamic TLR triggers sickness behavior via a microglia-neuronal axis Sungho Jin, *, Jae Geun Kim,, *, Jeong Woo Park, Marco Koch,, Tamas L. Horvath and Byung Ju Lee Department of Biological Sciences,
Nature Neuroscience: doi: /nn Supplementary Figure 1. MADM labeling of thalamic clones.
 Supplementary Figure 1 MADM labeling of thalamic clones. (a) Confocal images of an E12 Nestin-CreERT2;Ai9-tdTomato brain treated with TM at E10 and stained for BLBP (green), a radial glial progenitor-specific
Supplementary Figure 1
 Supplementary Figure 1 Supplementary Figure 1 Schematic depiction of the tandem Fc GDF15. Supplementary Figure 2 Supplementary Figure 2 Gfral mrna levels in the brains of both wild-type and knockout Gfral
Nature Neuroscience: doi: /nn Supplementary Figure 1. Distribution of starter cells for RV-mediated retrograde tracing.
 Supplementary Figure 1 Distribution of starter cells for RV-mediated retrograde tracing. Parcellation of cortical areas is based on Allen Mouse Brain Atlas and drawn to scale. Thick white curves, outlines
a b c Physical appearance of mice Lean mass Adipocyte size d e f
 LFD HFD LFD HFD Area under curve (GTT) HFD-VSL#3 LFD HFD Area under curve (ITT) HFD-VSL#3 Liver TG content (% l) HFD-VSL#3 LFD HFD HFD-VSL#3 LFD HFD HFD-VSL#3 LFD HFD HFD + VSL#3 Lean mass (gm) Mean adipocyte
Lack of GPR88 enhances medium spiny neuron activity and alters. motor- and cue- dependent behaviors
 Lack of GPR88 enhances medium spiny neuron activity and alters motor- and cue- dependent behaviors Albert Quintana, Elisenda Sanz, Wengang Wang, Granville P. Storey, Ali D. Güler Matthew J. Wanat, Bryan
SUPPLEMENTARY INFORMATION
 SUPPLEMENTARY INFORMATION doi:10.1038/nature11306 Supplementary Figures Supplementary Figure 1. Basic characterization of GFP+ RGLs in the dentate gyrus of adult nestin-gfp mice. a, Sample confocal images
Nature Neuroscience: doi: /nn Supplementary Figure 1. Trial structure for go/no-go behavior
 Supplementary Figure 1 Trial structure for go/no-go behavior a, Overall timeline of experiments. Day 1: A1 mapping, injection of AAV1-SYN-GCAMP6s, cranial window and headpost implantation. Water restriction
Nature Neuroscience: doi: /nn.4335
 Supplementary Figure 1 Cholinergic neurons projecting to the VTA are concentrated in the caudal mesopontine region. (a) Schematic showing the sites of retrograde tracer injections in the VTA: cholera toxin
SUPPLEMENTARY INFORMATION
 doi: 10.1038/nature06994 A phosphatase cascade by which rewarding stimuli control nucleosomal response A. Stipanovich*, E. Valjent*, M. Matamales*, A. Nishi, J.H. Ahn, M. Maroteaux, J. Bertran-Gonzalez,
Supplementary Figure 1: Hsp60 / IEC mice are embryonically lethal (A) Light microscopic pictures show mouse embryos at developmental stage E12.
 Light microscopic pictures show mouse embryos at developmental stage E12.") Supplementary Figure 1: Hsp60 / IEC mice are embryonically lethal (A) Light microscopic pictures show mouse embryos at developmental stage E12.5 and E13.5 prepared from uteri of dams and subsequently genotyped.
Supplementary Figure 1: Hsp60 / IEC mice are embryonically lethal (A) Light microscopic pictures show mouse embryos at developmental stage E12.5 and E13.5 prepared from uteri of dams and subsequently genotyped.
Supplementary Figure 1
 Supplementary Figure 1 how HFD how HFD Epi WT p p Hypothalamus p p Inguinal WT T Liver Lean mouse adipocytes p p p p p p Obese mouse adipocytes Kidney Muscle Spleen Heart p p p p p p p p Extracellular
SUPPLEMENTARY FIGURES
 SUPPLEMENTARY FIGURES 1 Supplementary Figure 1, Adult hippocampal QNPs and TAPs uniformly express REST a-b) Confocal images of adult hippocampal mouse sections showing GFAP (green), Sox2 (red), and REST
control kda ATGL ATGLi HSL 82 GAPDH * ** *** WT/cTg WT/cTg ATGLi AKO/cTg AKO/cTg ATGLi WT/cTg WT/cTg ATGLi AKO/cTg AKO/cTg ATGLi iwat gwat ibat
 body weight (g) tissue weights (mg) ATGL protein expression (relative to GAPDH) HSL protein expression (relative to GAPDH) ### # # kda ATGL 55 HSL 82 GAPDH 37 2.5 2. 1.5 1..5 2. 1.5 1..5.. Supplementary
Supplemental Information. Otic Mesenchyme Cells Regulate. Spiral Ganglion Axon Fasciculation. through a Pou3f4/EphA4 Signaling Pathway
 Neuron, Volume 73 Supplemental Information Otic Mesenchyme Cells Regulate Spiral Ganglion Axon Fasciculation through a Pou3f4/EphA4 Signaling Pathway Thomas M. Coate, Steven Raft, Xiumei Zhao, Aimee K.
Supplementary Figure 1. SybII and Ceb are sorted to distinct vesicle populations in astrocytes. Nature Neuroscience: doi: /nn.
 Supplementary Figure 1 SybII and Ceb are sorted to distinct vesicle populations in astrocytes. (a) Exemplary images for cultured astrocytes co-immunolabeled with SybII and Ceb antibodies. SybII accumulates
How Nicotinic Signaling Shapes Neural Networks
 How Nicotinic Signaling Shapes Neural Networks Darwin K. Berg Division of Biological Sciences University of California, San Diego Nicotinic Cholinergic Signaling Uses the transmitter ACh to activate cation-selective
Supplementary Figure 1. DNA methylation of the adiponectin promoter R1, Pparg2, and Tnfa promoter in adipocytes is not affected by obesity.
 Supplementary Figure 1. DNA methylation of the adiponectin promoter R1, Pparg2, and Tnfa promoter in adipocytes is not affected by obesity. (a) Relative amounts of adiponectin, Ppar 2, C/ebp, and Tnf mrna
SUPPLEMENTARY INFORMATION
 DOI: 10.1038/ncb2211 a! mir-143! b! mir-103/107! let-7a! mir-144! mir-122a! mir-126-3p! mir-194! mir-27a! mir-30c! Figure S1 Northern blot analysis of mir-143 expression dependent on feeding conditions.
18s AAACGGCTACCACATCCAAG CCTCCAATGGATCCTCGTTA. 36b4 GTTCTTGCCCATCAGCACC AGATGCAGCAGATCCGCAT. Acc1 AGCAGATCCGCAGCTTG ACCTCTGCTCGCTGAGTGC
 Supplementary Table 1. Quantitative PCR primer sequences Gene symbol Sequences (5 to 3 ) Forward Reverse 18s AAACGGCTACCACATCCAAG CCTCCAATGGATCCTCGTTA 36b4 GTTCTTGCCCATCAGCACC AGATGCAGCAGATCCGCAT Acc1
293T cells were transfected with indicated expression vectors and the whole-cell extracts were subjected
 SUPPLEMENTARY INFORMATION Supplementary Figure 1. Formation of a complex between Slo1 and CRL4A CRBN E3 ligase. (a) HEK 293T cells were transfected with indicated expression vectors and the whole-cell
Supplementary Figure S1. Effect of Glucose on Energy Balance in WT and KHK A/C KO
 Supplementary Figure S1. Effect of Glucose on Energy Balance in WT and KHK A/C KO Mice. WT mice and KHK-A/C KO mice were provided drinking water containing 10% glucose or tap water with normal chow ad
Supplemental Figure 1. Intracranial transduction of a modified ptomo lentiviral vector in the mouse
 Supplemental figure legends Supplemental Figure 1. Intracranial transduction of a modified ptomo lentiviral vector in the mouse hippocampus targets GFAP-positive but not NeuN-positive cells. (A) Stereotaxic
Supplementary Figure 1: Validation of labeling specificity of immature OSNs and presynaptic terminals. (A) (B) (C) (D) (E)
 (B) (C) (D) (E)") Supplementary Figure 1: Validation of labeling specificity of immature OSNs and presynaptic terminals. (A) Confocal images of septal olfactory epithelium of an adult Gγ8-sypGFP-tdTom mouse showing colocalization
Supplementary Figure 1: Validation of labeling specificity of immature OSNs and presynaptic terminals. (A) Confocal images of septal olfactory epithelium of an adult Gγ8-sypGFP-tdTom mouse showing colocalization
Supplemental Figure 1. Western blot analysis indicated that MIF was detected in the fractions of
 Supplemental Figure Legends Supplemental Figure 1. Western blot analysis indicated that was detected in the fractions of plasma membrane and cytosol but not in nuclear fraction isolated from Pkd1 null
Dep. Control Time (min)
") aa Control Dep. RP 1s 1 mv 2s 1 mv b % potentiation of IPSP 2 15 1 5 Dep. * 1 2 3 4 Time (min) Supplementary Figure 1. Rebound potentiation of IPSPs in PCs. a, IPSPs recorded with a K + gluconate pipette
aa Control Dep. RP 1s 1 mv 2s 1 mv b % potentiation of IPSP 2 15 1 5 Dep. * 1 2 3 4 Time (min) Supplementary Figure 1. Rebound potentiation of IPSPs in PCs. a, IPSPs recorded with a K + gluconate pipette
1.5 ASK1KO fed. fasted 16 hrs w/o water. Fed. 4th. 4th WT ASK1KO N=29, 11(WT), ,5(ASK1KO) ASK1KO ASK1KO **** Time [h]
![1.5 ASK1KO fed. fasted 16 hrs w/o water. Fed. 4th. 4th WT ASK1KO N=29, 11(WT), ,5(ASK1KO) ASK1KO ASK1KO **** Time [h]](/thumbs/87/97258189.jpg "1.5 ASK1KO fed. fasted 16 hrs w/o water. Fed. 4th. 4th WT ASK1KO N=29, 11(WT), ,5(ASK1KO) ASK1KO ASK1KO **** Time [h]") 7: 13: 19: 1: 7: 151117 a 151117 4th 4th b c RQ.95 KO.9.85.8.75.7 light dark light dark.65 7: 19: 7: 19: 7: Means ± SEM, N=6 RQ 1..9.8.7.6.6 KO CL (-) CL (+) ibat weight ratio (/body weight) [%].5.4.3.2.1
7: 13: 19: 1: 7: 151117 a 151117 4th 4th b c RQ.95 KO.9.85.8.75.7 light dark light dark.65 7: 19: 7: 19: 7: Means ± SEM, N=6 RQ 1..9.8.7.6.6 KO CL (-) CL (+) ibat weight ratio (/body weight) [%].5.4.3.2.1
Supplemental Information. Increased 4E-BP1 Expression Protects. against Diet-Induced Obesity and Insulin. Resistance in Male Mice
 Cell Reports, Volume 16 Supplemental Information Increased 4E-BP1 Expression Protects against Diet-Induced Obesity and Insulin Resistance in Male Mice Shih-Yin Tsai, Ariana A. Rodriguez, Somasish G. Dastidar,
Authors: K. L. Arendt, M. Royo, M. Fernández-Monreal, S. Knafo, C. N. Petrok, J.
 SUPPLEMENTARY INFORMATION Title: PIP 3 controls synaptic function by maintaining AMPA receptor clustering at the postsynaptic membrane Authors: K. L. Arendt, M. Royo, M. Fernández-Monreal, S. Knafo, C.
Supplementary Information
 1 Supplementary Information A role for primary cilia in glutamatergic synaptic integration of adult-orn neurons Natsuko Kumamoto 1,4,5, Yan Gu 1,4, Jia Wang 1,4, Stephen Janoschka 1,2, Ken-Ichi Takemaru
1,8 1,6 1,4 1,2 1. EE/g lean mass 0,8 0,6 0,4 0,2. Ambulatory locomotor activity. (beam brakes/48h) V MCH MCHpf 0,86 0,85 0,84 0,83 0,82 0,81 0,8
 V MCH MCHpf 0,86 0,85 0,84 0,83 0,82 0,81 0,8") Supplementary figure 1 vehicle A -pf Energy expenditure (kcal/kg/48h) 25 2 15 1 5 V pf EE/g lean mass 1,8 1,6 1,4 1,2 1,8,6,4,2 Total locomotor activity (beam brakes/48h) C D E 7 6 5 4 3 2 1 V pf Ambulatory
Supplementary figure 1 vehicle A -pf Energy expenditure (kcal/kg/48h) 25 2 15 1 5 V pf EE/g lean mass 1,8 1,6 1,4 1,2 1,8,6,4,2 Total locomotor activity (beam brakes/48h) C D E 7 6 5 4 3 2 1 V pf Ambulatory
GPR120 *** * * Liver BAT iwat ewat mwat Ileum Colon. UCP1 mrna ***
 a GPR120 GPR120 mrna/ppia mrna Arbitrary Units 150 100 50 Liver BAT iwat ewat mwat Ileum Colon b UCP1 mrna Fold induction 20 15 10 5 - camp camp SB202190 - - - H89 - - - - - GW7647 Supplementary Figure
Supplementary Figure 1
 Supplementary Figure 1 AAV-GFP injection in the MEC of the mouse brain C57Bl/6 mice at 4 months of age were injected with AAV-GFP into the MEC and sacrificed at 7 days post injection (dpi). (a) Brains
F-actin VWF Vinculin. F-actin. Vinculin VWF
 a F-actin VWF Vinculin b F-actin VWF Vinculin Supplementary Fig. 1. WPBs in HUVECs are located along stress fibers and at focal adhesions. (a) Immunofluorescence images of f-actin (cyan), VWF (yellow),
SUPPLEMENTARY INFORMATION
 DOI: 10.1038/ncb3461 In the format provided by the authors and unedited. Supplementary Figure 1 (associated to Figure 1). Cpeb4 gene-targeted mice develop liver steatosis. a, Immunoblot displaying CPEB4
Supplementary Figure 1
 Supplementary Figure 1 Supplementary Figure 1. Short latency of the fepsp evoked in CA3 by electrical stimulation of perforant path inputs (a) Single and superimposed representative perforant pathway-ca3
Insulin-Leptin Interactions
 Insulin-Leptin Interactions Ahmed S., Al-Azzam N., Cao B. Karshaleva B., Sriram S., Vu K. If you understand a system, you can predict it. Agenda - Energy homeostasis Overview of leptin and insulin Signaling
Supplementary Figure 1
 VO (ml kg - min - ) VCO (ml kg - min - ) Respiratory exchange ratio Energy expenditure (cal kg - min - ) Locomotor activity (x count) Body temperature ( C) Relative mrna expression TA Sol EDL PT Heart
Supplementary Figure 1 Validation of Per2 deletion in neuronal cells in N Per2 -/- mice. (a) Western blot from liver extracts of mice held under ad
 Western blot from liver extracts of mice held under ad") Supplementary Figure 1 Validation of Per2 deletion in neuronal cells in N Per2 -/- mice. (a) Western blot from liver extracts of mice held under ad libitum conditions detecting PER2 protein in brain and
Supplementary Figure 1 Validation of Per2 deletion in neuronal cells in N Per2 -/- mice. (a) Western blot from liver extracts of mice held under ad libitum conditions detecting PER2 protein in brain and
Supplementary Figure 1: Steviol and stevioside potentiate TRPM5 in a cell-free environment. (a) TRPM5 currents are activated in inside-out patches
 TRPM5 currents are activated in inside-out patches") Supplementary Figure 1: Steviol and stevioside potentiate TRPM5 in a cell-free environment. (a) TRPM5 currents are activated in inside-out patches during application of 500 µm Ca 2+ at the intracellular
Supplementary Figure 1: Steviol and stevioside potentiate TRPM5 in a cell-free environment. (a) TRPM5 currents are activated in inside-out patches during application of 500 µm Ca 2+ at the intracellular
Supplementary Table 1. The primers used for quantitative RT-PCR. Gene name Forward (5 > 3 ) Reverse (5 > 3 )
 Reverse (5 > 3 )") 770 771 Supplementary Table 1. The primers used for quantitative RT-PCR. Gene name Forward (5 > 3 ) Reverse (5 > 3 ) Human CXCL1 GCGCCCAAACCGAAGTCATA ATGGGGGATGCAGGATTGAG PF4 CCCCACTGCCCAACTGATAG TTCTTGTACAGCGGGGCTTG
770 771 Supplementary Table 1. The primers used for quantitative RT-PCR. Gene name Forward (5 > 3 ) Reverse (5 > 3 ) Human CXCL1 GCGCCCAAACCGAAGTCATA ATGGGGGATGCAGGATTGAG PF4 CCCCACTGCCCAACTGATAG TTCTTGTACAGCGGGGCTTG
Supplementary Figure 1. Identification of the type II spiral ganglion neurons (SGN) via immunofluorescence of peripherin protein (PRPH).
 via immunofluorescence of peripherin protein (PRPH).") Supplementary Figure 1. Identification of the type II spiral ganglion neurons (SGN) via immunofluorescence of peripherin protein (PRPH). (a), (b), PRPH immunolabelling of cryosections from post-natal day
Supplementary Figure 1. Identification of the type II spiral ganglion neurons (SGN) via immunofluorescence of peripherin protein (PRPH). (a), (b), PRPH immunolabelling of cryosections from post-natal day
Supplementary Figure 1.
 Supplementary Figure 1. FGF21 does not exert direct effects on hepatic glucose production. The liver explants from C57BL/6J mice (A, B) or primary rat hepatocytes (C, D) were incubated with rmfgf21 (2
Supplementary Table 2. Plasma lipid profiles in wild type and mutant female mice submitted to a HFD for 12 weeks wt ERα -/- AF-1 0 AF-2 0
 Supplementary Table 1. List of specific primers used for gene expression analysis. Genes Primer forward Primer reverse Hprt GCAGTACAGCCCCAAAATGG AACAAAGTCTGGCCTGTATCCA Srebp-1c GGAAGCTGTCGGGGTAGCGTC CATGTCTTCAAATGTGCAATCCAT
Supplementary Figure 1. A. Bar graph representing the expression levels of the 19 indicated genes in the microarrays analyses comparing human lung
 Supplementary Figure 1. A. Bar graph representing the expression levels of the 19 indicated genes in the microarrays analyses comparing human lung immortalized broncho-epithelial cells (AALE cells) expressing
TGF-β Signaling Regulates Neuronal C1q Expression and Developmental Synaptic Refinement
 Supplementary Information Title: TGF-β Signaling Regulates Neuronal C1q Expression and Developmental Synaptic Refinement Authors: Allison R. Bialas and Beth Stevens Supplemental Figure 1. In vitro characterization
Supplemental Information. Menin Deficiency Leads to Depressive-like. Behaviors in Mice by Modulating. Astrocyte-Mediated Neuroinflammation
 Neuron, Volume 100 Supplemental Information Menin Deficiency Leads to Depressive-like Behaviors in Mice by Modulating Astrocyte-Mediated Neuroinflammation Lige Leng, Kai Zhuang, Zeyue Liu, Changquan Huang,
Supplementary Information
 Supplementary Information Overexpression of Fto leads to increased food intake and results in obesity Chris Church, Lee Moir, Fiona McMurray, Christophe Girard, Gareth T Banks, Lydia Teboul, Sara Wells,
1.0. FSL NMDAR-fEPSP 0.8. amplitude (mv) Intensity (µa) 2.0 SD FSL Time (ms)
 Intensity (µa) 2.0 SD FSL Time (ms)") a 2.5 1. AMPAR-fEPSP slope (mv/ms) 2. 1. NMDAR-fEPSP amplitude (mv).8.6.4.5.2. 2 4 6 8. 1 2 3 4 5 Intensity (µa) Intensity (µa) b 2. PPF Ratio (fepsp2/fepsp1) 1..5. 5 1 2 5 Time (ms) Supplementary Figure
a 2.5 1. AMPAR-fEPSP slope (mv/ms) 2. 1. NMDAR-fEPSP amplitude (mv).8.6.4.5.2. 2 4 6 8. 1 2 3 4 5 Intensity (µa) Intensity (µa) b 2. PPF Ratio (fepsp2/fepsp1) 1..5. 5 1 2 5 Time (ms) Supplementary Figure
SUPPLEMENTARY INFORMATION
 DOI: 10.1038/ncb2607 Figure S1 Elf5 loss promotes EMT in mammary epithelium while Elf5 overexpression inhibits TGFβ induced EMT. (a, c) Different confocal slices through the Z stack image. (b, d) 3D rendering
Nature Neuroscience: doi: /nn Supplementary Figure 1. Visualization of AT1a-positive cells using AT1a lacz/+ mouse.
 Supplementary Figure 1 Visualization of AT1a-positive cells using AT1a lacz/+ mouse. (a f) Immunohistochemical detection of β-gal in the mouse brain. Coronal sections at the respective anteroposterior
Supplemental Table 1. Plasma NEFA and liver triglyceride levels in ap2-hif1ako and ap2-hif2ako mice under control and high fat diets.
 Supplemental Table 1. Plasma NEFA and liver triglyceride levels in Hif1aKO and Hif2aKO mice under control and high fat diets. Hif1a (n=6) Hif1aK O (n=6) Hif2a Hif2aK O Hif1a (n=5) Hif1aKO (n=5) Hif2a Hif2aK
Supplementary Figures
 Supplementary Figures Supplementary Figure 1 Characterization of stable expression of GlucB and sshbira in the CT26 cell line (a) Live cell imaging of stable CT26 cells expressing green fluorescent protein
Supplemental Figure S1. RANK expression on human lung cancer cells.
 Supplemental Figure S1. RANK expression on human lung cancer cells. (A) Incidence and H-Scores of RANK expression determined from IHC in the indicated primary lung cancer subgroups. The overall expression
Prss56, a novel marker of adult neurogenesis in the mouse brain. - Supplemental Figures 1 to 5- Brain Structure and Function
 Prss56, a novel marker of adult neurogenesis in the mouse brain - Supplemental Figures 1 to 5- Brain Structure and Function Alexandre Jourdon 1,2, Aurélie Gresset 1, Nathalie Spassky 1, Patrick Charnay
Social deficits in Shank3-deficient mouse models of autism are rescued by histone deacetylase (HDAC) inhibition
 inhibition") SUPPLEMENTARY INFORMATION Articles https://doi.org/10.1038/s41593-018-0110-8 In the format provided by the authors and unedited. Social deficits in Shank3-deficient mouse models of autism are rescued by
SUPPLEMENTARY INFORMATION Articles https://doi.org/10.1038/s41593-018-0110-8 In the format provided by the authors and unedited. Social deficits in Shank3-deficient mouse models of autism are rescued by
Nature Biotechnology: doi: /nbt Supplementary Figure 1. Analysis of hair bundle morphology in Ush1c c.216g>a mice at P18 by SEM.
 Supplementary Figure 1 Analysis of hair bundle morphology in Ush1c c.216g>a mice at P18 by SEM. (a-c) Heterozygous c.216ga mice displayed normal hair bundle morphology at P18. (d-i) Disorganized hair bundles
Supplementary Materials for
 www.sciencetranslationalmedicine.org/cgi/content/full/4/117/117ra8/dc1 Supplementary Materials for Notch4 Normalization Reduces Blood Vessel Size in Arteriovenous Malformations Patrick A. Murphy, Tyson
Supplementary Figures
 Supplementary Figures Supplementary Figure 1. Confirmation of Dnmt1 conditional knockout out mice. a, Representative images of sorted stem (Lin - CD49f high CD24 + ), luminal (Lin - CD49f low CD24 + )
SORCS1 and SORCS3 control energy balance and orexigenic peptide production
 Article SORCS1 and SORCS3 control energy balance and orexigenic peptide production Aygul Subkhangulova 1,*, Anna R Malik 1, Guido Hermey 2, Oliver Popp 1, Gunnar Dittmar 1,3,, Thomas Rathjen 1, Matthew
Supplemental Information. Dorsal Raphe Dual Serotonin-Glutamate Neurons. Drive Reward by Establishing Excitatory Synapses
 Cell Reports, Volume 26 Supplemental Information Dorsal Raphe Dual Serotonin-Glutamate Neurons Drive Reward by Establishing Excitatory Synapses on VTA Mesoaccumbens Dopamine Neurons Hui-Ling Wang, Shiliang
File name: Supplementary Information Description: Supplementary Figures, Supplementary Table and Supplementary References
 File name: Supplementary Information Description: Supplementary Figures, Supplementary Table and Supplementary References File name: Supplementary Data 1 Description: Summary datasheets showing the spatial
Supplementary Figure 1 Information on transgenic mouse models and their recording and optogenetic equipment. (a) 108 (b-c) (d) (e) (f) (g)
 108 (b-c) (d) (e) (f) (g)") Supplementary Figure 1 Information on transgenic mouse models and their recording and optogenetic equipment. (a) In four mice, cre-dependent expression of the hyperpolarizing opsin Arch in pyramidal cells
Supplementary Figure 1 Information on transgenic mouse models and their recording and optogenetic equipment. (a) In four mice, cre-dependent expression of the hyperpolarizing opsin Arch in pyramidal cells
AAV-TBGp-Cre treatment resulted in hepatocyte-specific GH receptor gene recombination
 AAV-TBGp-Cre treatment resulted in hepatocyte-specific GH receptor gene recombination Supplementary Figure 1. Generation of the adult-onset, liver-specific GH receptor knock-down (alivghrkd, Kd) mouse
Supplementary Figure 1
 Supplementary Figure 1 5 microns C7 B6 unclassified H19 C7 signal H19 guide signal H19 B6 signal C7 SNP spots H19 RNA spots B6 SNP spots colocalization H19 RNA classification Supplementary Figure 1. Allele-specific
SUPPLEMENTARY INFORMATION
 doi:1.138/nature1139 a d Whisker angle (deg) Whisking repeatability Control Muscimol.4.3.2.1 -.1 8 4-4 1 2 3 4 Performance (d') Pole 8 4-4 1 2 3 4 5 Time (s) b Mean protraction angle (deg) e Hit rate (p
Supplementary Materials for
 advances.sciencemag.org/cgi/content/full/1/10/e1500775/dc1 Supplementary Materials for Structural-functional connectivity deficits of neocortical circuits in the Fmr1 /y mouse model of autism Matthias