Running title: IL-6 impairs insulin signal pathway through down-regulation
|
|
|
- Lillian Black
- 6 years ago
- Views:
Transcription
1 JBC Papers in Press. Published on June 24, 2013 as Manuscript M The latest version is at MiR-200s contribute to IL-6-induced insulin resistance in hepatocytes Lin Dou 1,2*, Ting Zhao 1,2*, Lilin Wang 2, Xiuqing Huang 2, Juan Jiao 1,2, Dan Gao 1,2, Hangxiang Zhang 1,2, Tao Shen 2, Yong Man 2, Shu Wang 2, Jian Li 1,2# 1 Graduate School of Peking Union Medical College and Chinese Academy of Medical Sciences, Beijing , China 2 The Key Laboratory of Geriatrics, Beijing Institute of Geriatrics & Beijing Hospital, Ministry of Health, Beijing , China * These authors contributed equally to this work. # Corresponding author: Jian Li. The Key Laboratory of Geriatrics, Beijing Institute of Geriatrics & Beijing Hospital, Ministry of Health, Beijing , China. Tel: ; fax: ; address: lijian@bjhmoh.cn Running title: IL-6 impairs insulin signal pathway through down-regulation of mir-200s. Abstract Background MiR-200s have been shown to control growth by regulating PI3K but the role of mir-200s in the resistance remains unclear. Results IL-6 inhibited the phosphorylation of AKT and GSK through down-regulation of mir-200s. development of hepatic insulin 1 Copyright 2013 by The American Society for Biochemistry and Molecular Biology, Inc.
2 Conclusion IL-6 may impair the activation of PI3K/AKT/GSK pathway via down-regulating mir-200s while augmenting FOG2 expression. Significance These findings provide a mechanistic insight on regulation of PI3K/AKT pathway by mir-200s. Keywords mir-200; IL-6; glycogenesis; AKT/GSK pathway; FOG2 Summary By influencing the activity of PI3K/AKT pathway IL-6 acts as an important regulator of hepatic insulin resistance. MiR-200s have been shown to control growth by regulating PI3K but the role of mir-200s in the development of hepatic insulin resistance remains unclear. The present study showed that elevated serum concentration of IL-6 is associated with decreased levels of mir-200s, impaired activation of glycogenesis that occurred in the livers of db/db mice. As shown in the murine NCTC 1469 hepatocytes and the primary hepatocytes treated with 10ng/ml IL-6 for 24 h, and in 12-week-old male C57BL/6J mice injected with 16µg/ml IL-6 by pumps for 7 days, IL-6 administration induced insulin resistance through down-regulation of mir-200s. Moreover, IL-6 treatment inhibited the phosphorylation of AKT and GSK, and decreased the glycogenesis. The effects of IL-6 could be diminished by suppression of FOG2 expression. Conclusion: IL-6 treatment may impair the activities of PI3K/AKT/GSK pathway and inhibit the synthesis of glycogen perhaps via down-regulating mir-200s while augmenting FOG2 expression. AKT/GSK pathway and reduced 2
3 1. Introduction Insulin resistance, defined as a diminished ability of cells, such as adipocytes, skeletal muscle cells and hepatocytes, to respond to the action of insulin, plays a central role in the development of several metabolic abnormalities and diseases, such as obesity, type 2 diabetes and the metabolic syndrome (1,2). Decreased glycogen levels are the hallmark of insulin resistant in the hepatocytes. Underlying mechanisms of insulin resistant in the hepatocytes include decreased glycogen synthesis and failure to suppress glucose production (3). Interleukin-6 (IL-6) has been recognized as an important mediator of insulin resistance by impairing insulin signaling pathway. It has well demonstrated that IL-6 may lead to block the phosphoinositide-3 kinase (PI3K) /AKT pathway (4). Moreover, both in vitro evidences and in vivo observations support that elevated levels of IL-6 selectively induced insulin resistance in the liver, while systemic depletion of IL-6 improved hepatic insulin action in an obese mouse model (5-7). However, molecular mechanisms linking IL-6 to hepatic insulin resistance remain poorly understood. MicroRNAs (mirnas) are small, noncoding 20-to 24-nt RNAs that negatively regulate their target gene expression at the posttranscriptional level by binding to specific, partially complementary regions in the 3 -UTR of the target mrnas (8). Recent studies have shown the involvement of mirnas in the pathogenesis of type 2 diabetes. For instance, mir-375, mir-29, mir-9 and Let-7 could regulate insulin secretion (9,10). MiR-375 and mir-124a 3
4 also participated in the pancreatic islet development (11,12) and beta-cell differentiation (13). In addition, Let-7, mir-33, mir-122 and mir-143 could indirectly control the metabolism of glucose and lipid (14-17). Moreover, mir-133 and mir-146a were involved in secondary complications associated with diabetes (18,19). Although it was reported that mir-126 was actively involved in the development of insulin resistance induced by mitochondrial dysfunction in the hepatocytes (20), the role of mirnas in hepatic insulin resistance is not understood well. MiR-200 family including mir-200a, regulating PI3K (22). However, the role of mir-200s in the development of hepatic insulin resistance has not been reported. The present study identified a group of mirnas, e.g., mir-200a, mir-200b and mir-200c (so called mir-200s) that contribute to IL-6-induced insulin resistance in the hepatocytes. For the first time this study has raised new experimental evidence showing that IL-6 impairs the activation of PI3K/AKT pathway and the synthesis of glycogen via down-regulating mir-200s, accompanied by up-regulating the expression of FOG2. mir-200b, mir-200c, mir-141 and mir-429 is highly conserved in the bilateral animals, and upregulated in the endometrial carcinoma (21). Previous study showed that mir-200s and their target FOG2 could control growth by 2. Experimental procedures 2.1 Animals We obtained db/db mice (C57BL/KsJ) from the Peking University Health Science Center 4
5 (originally purchased form Jackson Laboratory). Briefly, db/db mice (n=5) and age-matched wild-type (WT) mice (n=5) were fed a standard laboratory diet for 12 weeks. 12-week-old male C57BL/6J mice were provided from Peking University Health Science Center. The mice (n=10) were separated for two groups and fed a standard laboratory diet. For all experiments examining chronic IL-6 exposure, Alzet osmotic pumps (Durect, Cupertino, CA) with a 7-day pumping capacity and infusion rate of 1µl/h were used. Pumps were filled to capacity with 16 µg/ml hil-6 diluted in carrier (0.9% NaCl and 0.1% BSA) (6). Following induction of the halothane general All animal procedures were performed in accordance with the National Institutes of Health Animal Care and Use Guidelines. All animal protocols were approved by the Animal Ethics Committee at the Beijing Institute of Geriatrics. 2.2 Microarray analysis for mirnas To profile the expression of mirnas between two group mice, the mirnas in the liver samples from 5 db/db mice and 5 control mice were analyzed by the mircurylna Array (version 14.0) system. Total RNA was harvested using TRIzol (Invitrogen) and RNeasy mini kit (QIAGEN) according to manufacturer s instructions. The samples were labeled using the anesthesia, pumps were implanted into mircury TM Hy3 TM /Hy5 TM Power the intrascapular subcutaneous space. Incisions were closed with interrupted absorbable sutures. labeling kit and hybridized on the mircury TM LNA Array (version 14.0). Scanning was performed with Axon 5
6 GenePix 400B microarray scanner. GenePix pro version 6.0 was used to read image raw intensity. 2.3 Measurement of serum glucose, FFA and IL-6 The levels of serum free fatty acids (FFA), glucose and IL-6 were examined using a kit from Sigma Diagnostics. 2.4 Cell culture NCTC 1469 cells derived from mouse liver cells (American Type culture Collection) were cultured in low-glucose Dulbecco s modified Eagle s medium (5mmol/L glucose, Gibico) supplemented with 10% horse serum (Hyclone), 100U/ml penicilin (Gibico) and 0.1mg/ml streptomycin (Gibico) at 37 C in a humidified atmosphere of 95% O 2, 5% CO Isolation of mouse primary hepatocytes Male C57BL/6J mice (12-week-old) were provided from Peking University Health Science Center. Primary hepatocytes were isolated by a two-step collagenase perfusion (0.2mg/ml type IV collagenase (Sigma) in Hanks balanced salt solution), as described previously (23). The hepatocytes were collected by centrifugation at 800 rpm for 8 min. Immediately after harvesting, the cells were suspended in pre-warmed William s E medium (Sigma) supplemented with 10% fetal bovine serum, 20ng/ml dexamethasone (Sigma), ITS (5mg/l insulin, 5mg/l trasferrin, 5µg/l sodium selenate) (Sigma) and 10µg/ml gentamicin (Invitrogen). The hepatocytes were plated in collagen-coated 25 cm 2 flask at cells. 2.6 Transfection of mirna mimics and inhibitors The mimics and inhibitors of 6
 was used for the transfection of mir-200 mimics and inhibitors. 48 h after transfection, the expression of mir-200s was detected by real-time PCR. 2.")
. The amplification and detection of specific products were performed according to the manufacturer s protocol with the ABI PRISM 7500 system (Applied Biosystems).")
7 mir-200s were purchased from Genepharm. The mirna mimic control and inhibitor control were used as negative controls. Hiperfect Transfection Reagent (QIAGEN) was used for the transfection of mir-200 mimics and inhibitors. 48 h after transfection, the expression of mir-200s was detected by real-time PCR. 2.7 RNA isolation and real-time PCR Enriched mirna was isolated using mirna Isolation Kit (TaKaRa). (TaKaRa). The amplification and detection of specific products were performed according to the manufacturer s protocol with the ABI PRISM 7500 system (Applied Biosystems). The U6 small nucleolar RNA was used as the house-keeping small RNA reference gene. The relative gene expression was normalized to U6 small nucleolar RNA. Each reaction was performed in triplicate, and analysis was performed by the 2 - CT method. Stem-loop reverse Nucleotide of primers used for transcription-polymerase chain reaction reverse transcription (RT-PCR) was also executed on samples to detect and quantify mature mirnas by using stem-loop antisense primer mix and AMV transcriptase (TaKaRa). The cdna preparations were routinely tested by real-time PCR based on the SYBR Green I method, according Nucleotide of primers used for real-time PCR to the manufacturer s instruction 7
 were separated by 10% SDS-PAGE, transferred to PVDF membrane (Millipore), blocked with 8% nonfat dry milk, and probed with the antibodies at")
.")
8 in the cells or liver tissues incubated for 3 h in the presence of 1nmol/L insulin (Usbio), using a glycogen assay kit (Biovision) Statistical analysis 2.8 Western blot analysis Cell lysates (15-30µg of protein) were separated by 10% SDS-PAGE, transferred to PVDF membrane (Millipore), blocked with 8% nonfat dry milk, and probed with the antibodies at All values are represented as means ± SEM of the indicated number of measurements. A one-way ANOVA test was used to determine significance, with values of P < 0.05 indicating statistical significance. 4 C overnight. The blots were incubated with HRP-conjugated anti-igg, followed by detection with ECL (Millipore). The antibodies against AKT, phosphorylation of AKT (Ser 473 ), glycogen synthase kinase (GSK), and phosphorylation of GSK (Ser 9 ) were purchased from Cell Signaling. The antibodies to FOG2 and β-actin were obtained from Santa Cruz. 2.9 Measurement of glycogen content The glycogen levels were measured 8 3. Results 3.1 Expression of mir-200s is inhibited in the livers of db/db mice The levels of serum glucose and FFA were significantly increased in the db/db mice (Fig.1A). The concentration of IL-6 in serum was also elevated in the db/db mice (Fig.1B). Moreover, the glycogen levels in the livers of db/db mice were significantly decreased, demonstrating a state of insulin
9 resistance (Fig.1C). It is noteworthy that the phosphorylation of AKT and GSK was reduced in the livers of db/db mice, indicating impaired activation of AKT/GSK pathway (Fig.1D). To examine the expression of mir-200 family including mir-200a, mir-200b, mir-200c, mir-141 and mir-429 in the livers of db/db mice, the mirnas of the livers of db/db mice (n=5) and control mice (n=5) were analyzed by mirna microarray. The results of mirna microarray showed that the levels of mir-200a and mir-200b were decreased while the expression of mir-200c was increased, and there was no difference in the expression of mir-141 and mir-429 (Table 1). The results of mirna microarray were verified by real-time PCR. As shown in Fig.1E, the levels of mir-200a, mir-200b and mir-200c were reduced. The result of mir-200c was not consistent with that from microarray. Microarray was used for genome-wide profiling of mirnas. However, the results of mirna microarray were affected by many factors. Therefore, the results of microarray need to be further validated by real-time PCR. These in vivo observations suggest that decreased expression of mir-200s likely contributes to hepatic insulin resistance. 3.2 IL-6 treatment down-regulates the expression of mir-200s These observations in the db/db mice were extended to a cellular model of insulin resistance. Mouse NCTC 1469 hepatocytes were treated with 33.3mmol/L glucose for 48 h and 0.25mmol/L palmitate for 24 h respectively to induce insulin resistance, as described previously (24). In addition, NCTC 1469 cells were treated with 9
10 different concentrations of IL-6 (10, 20, 40ng/ml) for different time (12, 24, 48 h) to induce insulin resistance (data not shown). The treatment of 10ng/ml IL-6 for 24 h was chose in following experiments. The expression of mir-200s was analyzed by real-time PCR. The results showed that IL-6, but not glucose and palmitate, can suppress the expression of mir-200s (Fig.2 A, B, C). We also analyzed the effect of glucose and palmitate on the expression of other micrornas such as mir-320. Our results showed that mir-320 level was increased in the NCTC 1469 cells treated with glucose and palmitate for 48 h. Therefore, mir-320 could be used as positive control in experiments with glucose and palmitate (Fig.2 A, B). Moreover, down-regulation of mir-200s by IL-6 was assessed in the mouse primary hepatocytes exposure to 10ng/ml IL-6 for 24 h (Fig.2 D). In order to confirm the effect of IL-6 on the expression of mir-200s in vivo, 12-week-old male C57BL/6J mice were injected with 16µg/ml IL-6 by pumps for 7 days and the livers of mice were collected. As shown in Fig.2 E, the expression of mir-200s was also significantly decreased in the livers of mice injected with IL-6. Our results suggest that IL-6 could down-regulate the expression of mir-200s in vitro and in vivo. 3.3 IL-6 inactivates AKT/GSK pathway and reduces glycogenesis in hepatocytes To determine the effect of IL-6 on the glycogenesis, NCTC 1469 cells and mouse primary hepatocytes were treated with 10ng/ml IL-6 for 24 h. The IL-6 treatment significantly decreased the glycogen levels in both NCTC
11 cells and mouse primary hepatocytes (Fig.3 A, B). Moreover, we analyzed the effect of IL-6 on the phosphorylation of AKT and GSK3 in insulin-treated and untreated NCTC1469 cells, and primary hepatocytes. In parallel with decreased phosphorylation of AKT, the phosphorylation of GSK was reduced in both NCTC 1469 cells and primary hepatocytes exposure to IL-6 (Fig.3 A, B). Next, the synthesis of glycogen and the activation of AKT/GSK pathway in the livers of C57BL/6J mice injected with IL-6 were analyzed. As shown in Fig. 3C, the levels of glycogen were dramatically decreased, accompanied by impaired phosphorylation of AKT and GSK in the livers of mice injected with IL-6. These results suggest that IL-6 could suppress the activation of AKT/GSK pathway and the glycogenesis in the hepatocytes of mice. 3.4 MiR-200s regulate the activation of AKT/GSK pathway and the glycogenesis in the hepatocytes We test the notion that mir-200s serve as a link between IL-6 and hepatic insulin resistance. Therefore, we next observed the effect of mir-200s on the activation of AKT/GSK pathway and the glycogenesis in the hepatocytes. Firstly, the mimics of mir-200a, mir-200b and mir-200c were transfected into the NCTC 1469 cells for 48 h. The results of real-time PCR showed that the levels of mir-200s were increased to 15- to 30-fold in the NCTC 1469 cells transfected with the mimics of mir-200s compared with those transfected with the negative mirna mimic control (Fig.4A). Moreover, over-expression of mir-200s rescued IL-6 induced suppression of glycogenesis in the 11
12 NCTC 1469 cells. Secondly, the inhibitors of mir-200a, mir-200b and mir-200c were transfected into the NCTC 1469 cells for 48 h. The levels of mir-200s were decreased by 20% to 30% compared with those transfected with negative mirna inhibitor control (Fig. 4B). Next, we examined the effects of mir-200s on the phosphorylation of AKT and GSK3 in both insulin-treated and untreated NCTC1469 cells. The results showed that mir-200s could improve insulin sensitivity in both insulin-treated and untreated NCTC1469 cells (Fig. 4C). Importantly, the transfection of mir-200 mimics could rescue IL-6-induced impaired phosphorylation of AKT and GSK, and reduced glycogenesis (Fig. 4D). As shown in Fig. 4E, down-regulation of mir-200s induced impaired activation of AKT and GSK, accompanied by reduced glycogenesis in the NCTC 1469 cells. Taken together, these results suggest mir-200s as a link between IL-6 and hepatic insulin resistance. MiR-200s modulate the activation of AKT/GSK pathway and the glycogenesis in the hepatocytes. 3.5 MiR-200s regulate the expression of FOG2 in the NCTC 1469 cells MiR-200s was highly conserved in the mammal animals (Fig. 5A). It was reported that there are several target sits for mir-200 family in the 3 UTR of FOG2, and mir-200 family down-regulates the expression of FOG2 (22). To further assess whether FOG2 is regulated by mir-200s, NCTC 1469 cells were transfected with the mimics and inhibitors of mir-200s, respectively. The results showed that the expression of FOG2 was down-regulated in the NCTC 1469 cells transfected with the 12
13 mimics of mir-200s (Fig. 5B). In contrast, the transfection of NCTC 1469 cells with the inhibitors of mir-200s up-regulated the expression of FOG2 (Fig. 5C). 3.6 FOG2 participates in IL-6-induced hepatic insulin resistance In the present study, we found that the expression of FOG2 was significantly increased in the db/db mice (Fig.6A). As shown in Fig. 6B and Fig. 6C, IL-6 increased the levels of FOG2 mrna and protein in both NCTC 1469 cells and mouse primary hepatocytes. Moreover, the levels of FOG2 mrna and protein were enhanced in the livers of mice injected with IL-6 (Fig.6D). These observations indicate that FOG2 may involve in IL-6-induced insulin resistance. To further assess the role of FOG2 in IL-6-induced hepatic insulin resistance, six sirnas (si-676, si-1341, 3445, si-2530, si-2590, si-3510) targeting FOG2 mrna were transfected into the NCTC 1469 cells. Western blot analysis indicated that both si-676-fog2 and si-3510-fog2 significantly down-regulated the expression of FOG2 (Fig. 6E). The effects of IL-6 on the phosphorylation of AKT and GSK were rescued by the transfection of si-3510-fog2 and si-676-fog2 into the NCTC 1469 cells (Fig. 6F, G). Furthermore, FOG2 down-regulation reversed IL-6-induced impaired glycogenesis in the NCTC 1469 cells (Fig. 6F, G). In order to determine whether the inhibitory effect of FOG2 should point towards PI3K pathway, we used PI3K inhibitor LY to block PI3K pathway in the NCTC1469 cell transfected by 13
14 sirna-fog2. The results showed that FOG2 could not affect the glycogenesis after treatment with 10nM PI3K inhibitor LY for 24h (Fig. 6H). Taken together, these results suggest that suppression of FOG2 substantially blocked IL-6-induced impaired activation of PI3K/AKT/GSK pathway and glycogenesis in the hepatocytes. glucose, it is difficult to determine the contribution of IL-6 to down-regulation of mir-200s. Therefore, we extended these observations from db/db mice to a mouse hepatocyte cell line NCTC The results show that the treatment of 10ng/ml IL-6 for 24 h suppressed the expression of mir-200s while there was no change in the expression of mir-200s in the NCTC 1469 cells treated with 4. Discussion There is increasing evidence that mirnas play a role in many aspects of insulin resistance and hence may be involved in the pathogenesis of type 2 diabetes. In the present study, we found that the expression of mir-200s was decreased in the liver of db/db mice, accompanied by elevated level of IL-6. Because db/db mice are complex and accompanied by other factors such as elevated levels of serum FFA and either 33.3mmol/L glucose or 0.25mmol/L palmitate. Similarly, down-regulation of mir-200s by IL-6 was assessed in the mouse primary hepatocytes exposure to 10ng/ml IL-6 for 24 h and in the livers of C57BL/6J mice injected with IL-6. Moreover, we found that IL-6 suppressed the expression of mir-200s, accompanied by down-regulation of mir-152 in the NCTC 1469 hepatocytes and the primary hepatocytes treated with 14
15 10ng/ml IL-6 for 24 h, and in 12-week-old male C57BL/6J mice injected with 16µg/ml IL-6 by pumps for 7 days. Importantly, the transfection by mir-152 inhibitor led to reduced expression of mir-200s in the NCTC 1469 hepatocytes, suggesting that mir-152 could regulate mir-200s expression (data not shown). Our study demonstrates for the first time that IL-6 suppresses the expression of mir-200s in the hepatocytes. Accordingly, it has been proposed that IL-6 contributes to the pathogenesis of insulin resistance in type 2 diabetes (4). Both in vitro evidences and in vivo observations support that elevated levels of IL-6 selectively induce insulin resistance in the liver, while systemic depletion of IL-6 improves hepatic insulin action in an obese mouse model (5-7). In the liver, insulin activates the PI3K/AKT signaling cascade, leading to the phosphorylation and inactivation of GSK. Hence, glycogen synthase (GS), the target of GSK, is freed of inhibitory phosphorylation, and glycogen synthesis is induced upon insulin stimulation (25). In our study, we found that the levels of phosphorylation of AKT and GSK were reduced in both NCTC 1469 cells and primary hepatocytes exposure to 10ng/ml IL-6 for 24 h. Similarly, the levels of glycogen were dramatically decreased, accompanied by impaired phosphorylation of AKT and GSK in the livers of mice injected with IL-6. These results suggest that IL-6 induces hepatic insulin resistance by suppression of AKT/GSK pathway. What is a link between IL-6 and hepatic insulin resistance? Accumulating evidence suggested that mirnas were involved in glucose and fat uptake in the 15
16 liver of type 2 diabetes individuals (26). Previous study showed that mir-200s promote cell proliferation in human cell lines. The mice lacking mir-200 family including mir-200a, mir-200b, mir-200c, mir-141 and mir-429 display reduced body size, indicating mir-200s control growth by regulating PI3K (22). Moreover, it is reported that mir-200s express in various adult organs including liver, pancreatic islet, testes, prostate and ovary (27). Recently, Reddy et al reported the pro-inflammatory role of mir-200 in vascular smooth muscle cells from diabetic mice (28). However, the role of mir-200s in the development of hepatic insulin resistance has not been reported to date. In the present study, we found impaired activity of PI3K/AKT pathway and reduced level of glycogen, accompanied by decreased expression of mir-200s in the lever, and elevated concentration of IL-6 in serum of db/db mice. We transfected the mimics and inhibitors of mir-200s into the NCTC 1469 cells to further investigate the role of mir-200s in IL-6-induced insulin resistance. Our results suggest mir-200s as a link between IL-6 and hepatic insulin resistance. MiR-200s can modulate the activation of AKT/GSK pathway and the glycogenesis in the hepatocytes. Next, we looked for a correlation between the expression of FOG2 and mir-200s in hepatic insulin resistance. FOG2 is expressed in many tissues such as liver, heart, brain, testes, lung, and skeletal muscle. Despite its relatively broad expression in adult tissues, little is known about the function of FOG2 beyond its role in embryonic heart development. Previous studies suggested 16
17 that FOG2 may function as either transcriptional coactivators or corepressors by partnering with various GATA transcription factors. FOG2 is involved in the control of adipocyte proliferation and differentiation (29). FOG2 also acts as a negative modulator of PI3K/AKT pathway. Hyun et al found that FOG2 binds p85α, a regulatory subunit of PI3K, thereby inhibiting formation of the insulin receptor substrate-1 (IRS-1)/p85α/p110 (a catalytic subunit of PI3K) complex and, consequently, PI3K activation (22). Moreover, FOG2 has at least three predicted sits for mir-200s. These predicted sites in the 3 -UTR of FOG2 are, therefore, responsible for mir-200-mediated FOG2 regulation. In the present study, we found that there is generally a negative correlation between mir-200s and FOG2 in the livers of db/db mice and C57BL/6J mice injected with IL-6, and in both NCTC 1469 cells and primary hepatocytes exposure to IL-6, consistent with a suppressive role for mir-200 in FOG2 regulation. We next sought to confirm the repression of FOG2 by mir-200s. The transfection of mir-200 mimics significantly reduced the levels of FOG2, whereas mir-200 inhibitors increased the expression of FOG2 in the NCTC 1469 cells. These data demonstrate that FOG2 is an authentic target of endogenous mir-200s. To further assess the role of FOG2 in IL-6-induced hepatic insulin resistance, sirna targeting FOG2 mrna was transfected into the NCTC 1469 cells. The results show that the effects of IL-6 on the phosphorylation of AKT and GSK were rescued by transfection of sirna-fog2 into the NCTC 1469 cells. FOG2 17
18 down-regulation reversed IL-6-induced impaired glycogenesis in the NCTC 1469 cells. Furthermore, FOG2 could study suggests that IL-6 impairs the activation of PI3K/AKT/GSK pathway and the synthesis of glycogen via not affect the glycogenesis after down-regulating mir-200s, treatment with PI3K inhibitor LY These results suggest that FOG2 regulated the glycogenesis through PI3K pathway. Our results show that mir-200s overexpression and FOG2 knockdown accompanied by up-regulating the expression of FOG2. These findings provide a mechanistic insight on the effects of mir-200 on the regulation of PI3K/AKT pathway and the synthesis of glycogen in the hepatocytes. could improve the glycogenesis in the NCTC1469 cells. However, in the present study, we did not investigate the effects of mir-200s overexpression and FOG2 knockdown in the liver of db/db mice or FOG2 overexpression in the normal mice on glucose metabolism. It is a limitation in the present study. In conclusion, as shown in Fig.7, this study provides novel data to show Acknowledgements This work was supported by grants from National Basic Research Program of China (2012CB517502) and National Natural Science Foundation of China ( , , ). We thank Prof. Youfei Guan (Peking University Health Science Center) for providing db/db mice. that mir-200s contribute to hepatic insulin resistance induced by IL-6. Our References 18
19 1. Petersen, K. F., and Shulman, G. I. (2006) Obesity (Silver Spring) 14 Suppl 1, 34S-40S 2. Hirabara, S. M., Silveira, L. R., Abdulkader, F., Carvalho, C. R., Procopio, J., and Curi, R. (2007) J Cell Physiol 210, Leclercq, I. A., Da Silva Morais, A., Schroyen, B., Van Hul, N., and Geerts, A. (2007) J Hepatol 47, Allen, T. L., and Febbraio, M. A. (2010) Diabetologia 53, Klover, P. J., Clementi, A. H., and Mooney, R. A. (2005) Endocrinology 146, Klover, P. J., Zimmers, T. A., Koniaris, L. G., and Mooney, R. A. (2003) Diabetes 52, Kim, J. H., Bachmann, R. A., and Chen, J. (2009) Vitam Horm 80, Bartel, D. P. (2004) Cell 116, Frost, R. J., and Olson, E. N. (2011) Proc Natl Acad Sci U S A 108, Ramachandran, D., Roy, U., Garg, S., Ghosh, S., Pathak, S., and Kolthur-Seetharam, U. (2011) FEBS J 278, Kloosterman, W. P., Lagendijk, A. K., Ketting, R. F., Moulton, J. D., and Plasterk, R. H. (2007) PLoS Biol 5, e Joglekar, M. V., Parekh, V. S., and Hardikar, A. A. (2011) Indian J Exp Biol 49, Poy, M. N., Hausser, J., Trajkovski, M., Braun, M., Collins, S., Rorsman, P., Zavolan, M., and Stoffel, M. (2009) Proc Natl Acad Sci U S A 106, 19
20 Zhu, H., Shyh-Chang, N., Segre, A. V., Shinoda, G., Shah, S. P., Einhorn, W. S., Takeuchi, A., Engreitz, J. M., Hagan, J. P., Kharas, M. G., Urbach, A., Thornton, J. E., Triboulet, R., Gregory, R. I., Altshuler, D., and Daley, G. Q. (2011) Cell 147, Ono, K. (2011) Cell Res 21, Jordan, S. D., Kruger, M., Willmes, D. M., Redemann, N., Wunderlich, F. T., Bronneke, H. S., Merkwirth, C., Kashkar, H., Olkkonen, V. M., Bottger, T., Braun, T., Seibler, J., and Bruning, J. C. (2011) Nat Cell Biol 13, Moore, K. J., Rayner, K. J., Suarez, Y., and Fernandez-Hernando, C. (2011) Annu Rev Nutr 31, Xiao, J., Luo, X., Lin, H., Zhang, Y., Lu, Y., Wang, N., Yang, B., and Wang, Z. (2007) J Biol Chem 282, Shantikumar, S., Caporali, A., and Emanueli, C. (2011) Cardiovasc Res 20. Ryu, H. S., Park, S. Y., Ma, D., Zhang, J., and Lee, W. (2011) PLoS One 6, e Snowdon, J., Zhang, X., Childs, T., Tron, V. A., and Feilotter, H. (2011) PLoS One 6, e Hyun, S., Lee, J. H., Jin, H., Nam, J., Namkoong, B., Lee, G., Chung, J., and Kim, V. N. (2009) Cell 139, Ulvila, J., Arpiainen, S., Pelkonen, O., Aida, K., Sueyoshi, T., Negishi, M., and Hakkola, J. 20
21 (2004) Biochem J 381, Gao, D., Nong, S., Huang, X., Lu, Y., Zhao, H., Lin, Y., Man, Y., Wang, S., Yang, J., and Li, J. (2010) J Biol Chem 285, Oh, Y. S., Lee, Y. J., Park, E. Y., and Jun, H. S. (2011) Diabetes Metab Res Rev 27, David, M. (2010) J Interferon Cytokine Res 30, Landgraf, P., Rusu, M., Sheridan, R., Sewer, A., Iovino, N., Aravin, A., Pfeffer, S., Rice, A., Kamphorst, A. O., Landthaler, M., Lin, C., Socci, N. D., Hermida, L., Fulci, V., Chiaretti, S., Foa, R., Schliwka, J., Fuchs, U., Novosel, A., Muller, R. U., Frezzetti, D., Trompeter, H. I., Hornung, V., Teng, G., Hartmann, G., Palkovits, M., Di Lauro, R., Wernet, P., Macino, G., Rogler, C. E., Nagle, J. W., Ju, J., Papavasiliou, F. N., Benzing, T., Lichter, P., Tam, W., Brownstein, M. J., Bosio, A., Borkhardt, A., Russo, J. J., Sander, C., Zavolan, M., and Tuschl, T. (2007) Cell 129, Reddy, M. A., Jin, W., Villeneuve, L., Wang, M., Lanting, L., Todorov, I., Kato, M., and Natarajan, R. (2012) Arterioscler Thromb Vasc Biol 29. Jack, B. H., and Crossley, M. (2010) J Biol Chem 285, Schermer, B., Bissels, U., Inman, J., Phan, Q., Chien, M., Weir, D. B., Choksi, R., De Vita, G., 21
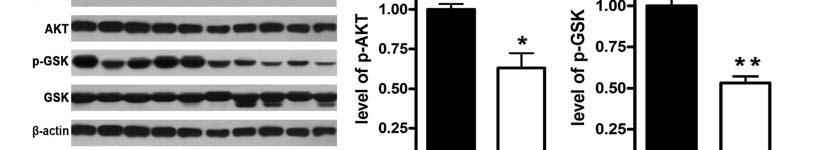
22 Figure legends Fig.1. MiR-200s are down-regulated in the livers of db/db mice. The db/db mice were fed with standard diet for 12 weeks. The levels of serum FFA and glucose (A), IL-6 (B), glycogen (C), the activation of AKT/GSK pathway (D) were measured. The levels of mir-200 family were analyzed by real-time PCR (E). Data represent the means±s.e.m., n=5. * P< 0.05 versus control; ** P < 0.01 versus control. Fig.2. IL-6 reduces the expression of mir-200s. The levels of mir-200s were analyzed in the mouse NCTC 1469 hepatocytes treated with 33.3mmol/L glucose for 48 h (A) or 0.25mmol/L palmitate for 24 h (B) or 10ng/ml IL-6 for 24 h (C), and the mouse primary hepatocytes treated with 10ng/ml IL-6 for 24 h (D), as well as in the livers of mouse injected by IL-6 (E). mir-320 was used as positive control in experiments with glucose and palmitate. Data represent the means±s.e.m., n=5 independent experiments. * P < 0.05 versus control; ** P < 0.01 versus control. Fig.3. IL-6 suppresses the activation of AKT/GSK pathway and the glycogenesis in the hepatocytes. The glycogen content and the activation of AKT/GSK pathway were measured in the NCTC 1469 cells treated with 10ng/ml IL-6 for 24 h (A) and mouse primary hepatocytes exposure to 10ng/ml IL-6 for 24 h (B), and in the livers of mice injected with IL-6 for 7 days (C). Data represent the means± S.E.M., n=3 independent experiments in the NCTC 1469 cells and the mouse primary hepatocytes; n=4 independent experiments in the mice injected with IL-6). * P < 0.05 versus control; ** P < 22
23 0.01 versus control. Fig.4. MiR-200s modulate the activation of AKT/GSK pathway and the glycogenesis in the hepatocytes. The levels of mir-200s were detected in the NCTC 1469 cells transfected with mir-200 mimics (A) and mir-200 inhibitors (B). The effects of mir-200s on the phosphorylation of AKT and GSK3 in both insulin-treated and untreated NCTC1469 cells were analyzed (C). The activation of AKT/GSK pathway and the content of glycogen were measured in the NCTC 1469 cells transfected with mir-200 mimics (D) and mir-200 inhibitors (E). Data represent the means±s.e.m., n=3 independent experiments. * P< 0.05 versus control; ** P < 0.01 versus control. Fig.5. MiR-200s regulate FOG2 expression in NCTC 1469 cells. The sequence of mir-200s and mir-200s binding sites of FOG2 were analyzed by pictar (A). The levels of FOG2 in the NCTC 1469 cells transfected with mir-200 mimics (B) and mir-200 inhibitors (C) were tested by Western blot. Data represent the means±s.e.m., n=3 independent experiments. * P< 0.05 versus control. Fig.6. FOG2 participates in IL-6-induced hepatic insulin resistance. The levels of FOG2 protein were measured in the livers of db/db mice (A). The levels of FOG2 mrna and protein were also analyzed in the NCTC 1469 cells treated with 10ng/ml IL-6 for 24 h (B), the mouse primary hepatocytes exposure to 10ng/ml IL-6 for 24 h (C) and in the livers of mice injected with IL-6 for 7 days (D). Six sirnas (si-676, si-1341, 3445, si-2530, si-2590, si-3510) targeting FOG2 23
 targeting FOG2 mrna for 48 h followed by 10ng/ml IL-6 treatment for 24 h.")
 were both NCTC 1469 cells and mouse primary hepatocytes; n=4 independent experiments in the mice injected with IL-6. * P< 0.")
24 mrna were transfected into the NCTC 1469 cells. The NCTC 1469 cells were transfected with six sirnas (si-676, si-1341, 3445, si-2530, si-2590, si-3510) targeting FOG2 mrna for 48 h followed by 10ng/ml IL-6 treatment for 24 h. The FOG2 expression was determined by Western blots (E). The activation of AKT/GSK pathway and the content of glycogen (F, G) were both NCTC 1469 cells and mouse primary hepatocytes; n=4 independent experiments in the mice injected with IL-6. * P< 0.05 versus control. Fig.7. The proposed mechanisms that mir-200s contribute to IL-6-induced insulin resistance in the hepatocytes. IL-6 impairs the activation of PI3K/AKT/GSK pathway and the synthesis of glycogen via analyzed in the NCTC 1469 cells down-regulating mir-200s, transfected with si-3510-fog2 and si-676-fog2 for 48 h followed by accompanied by up-regulating the expression of FOG2. 10ng/ml IL-6 treatment for 24 h. The level of GSK phosphorylation and the content of glycogen (H) were measured Tables Table 1 The results of microrna microarray analysis in the NCTC1469 cells transfected with si-3510-fog2 for 48 h followed by treatment with 30μM LY for 24 h. Data represent the means±s.e.m., n=5 independent experiments in the db/db mice; n=3 independent experiments in 24


25 25


26 26


27 27


28 28


29 29


30 30

31 31
32 32
High glucose reduces hepatic glycogenesis by suppression of microrna 152
 MOLECULAR MEDICINE REPORTS 10: 2073-2078, 2014 High glucose reduces hepatic glycogenesis by suppression of microrna 152 XIAOYUN ZHAO 1, YONGGANG LU 1, FENGHONG WANG 1, LIN DOU 2, LILIN WANG 2, JUN GUO
Patrocles: a database of polymorphic mirna-mediated gene regulation
 Patrocles: a database of polymorphic mirna-mediated gene regulation Satellite Eadgene Course "A primer in mirna biology" Liège, 3 march 2008 S. Hiard, D. Baurain, W. Coppieters, X. Tordoir, C. Charlier,
SUPPLEMENTARY INFORMATION
 SUPPLEMENTARY INFORMATION FOR Liver X Receptor α mediates hepatic triglyceride accumulation through upregulation of G0/G1 Switch Gene 2 (G0S2) expression I: SUPPLEMENTARY METHODS II: SUPPLEMENTARY FIGURES
A Hepatocyte Growth Factor Receptor (Met) Insulin Receptor hybrid governs hepatic glucose metabolism SUPPLEMENTARY FIGURES, LEGENDS AND METHODS
 Insulin Receptor hybrid governs hepatic glucose metabolism SUPPLEMENTARY FIGURES, LEGENDS AND METHODS") A Hepatocyte Growth Factor Receptor (Met) Insulin Receptor hybrid governs hepatic glucose metabolism Arlee Fafalios, Jihong Ma, Xinping Tan, John Stoops, Jianhua Luo, Marie C. DeFrances and Reza Zarnegar
A Hepatocyte Growth Factor Receptor (Met) Insulin Receptor hybrid governs hepatic glucose metabolism Arlee Fafalios, Jihong Ma, Xinping Tan, John Stoops, Jianhua Luo, Marie C. DeFrances and Reza Zarnegar
Serum Amyloid A3 Gene Expression in Adipocytes is an Indicator. of the Interaction with Macrophages
 Serum Amyloid A3 Gene Expression in Adipocytes is an Indicator of the Interaction with Macrophages Yohei Sanada, Takafumi Yamamoto, Rika Satake, Akiko Yamashita, Sumire Kanai, Norihisa Kato, Fons AJ van
General Laboratory methods Plasma analysis: Gene Expression Analysis: Immunoblot analysis: Immunohistochemistry:
 General Laboratory methods Plasma analysis: Plasma insulin (Mercodia, Sweden), leptin (duoset, R&D Systems Europe, Abingdon, United Kingdom), IL-6, TNFα and adiponectin levels (Quantikine kits, R&D Systems
HEK293FT cells were transiently transfected with reporters, N3-ICD construct and
 Supplementary Information Luciferase reporter assay HEK293FT cells were transiently transfected with reporters, N3-ICD construct and increased amounts of wild type or kinase inactive EGFR. Transfections
mirna Interference Technologies: An Overview
 Chapter 2 mirna Interference Technologies: An Overview Abstract The mirna pathways are highly responsive to interventions of any kind, being excellent candidates for pharmacological manipulation. Mature
Original Article Regulation of diabetes-induced inflammation in macrophages by microrna-26a-5p
 Int J Clin Exp Pathol 2016;9(10):10074-10079 www.ijcep.com /ISSN:1936-2625/IJCEP0034290 Original Article Regulation of diabetes-induced inflammation in macrophages by microrna-26a-5p Xin-Ge Yue, Su-Jun
Supplementary information
 Supplementary information Human Cytomegalovirus MicroRNA mir-us4-1 Inhibits CD8 + T Cell Response by Targeting ERAP1 Sungchul Kim, Sanghyun Lee, Jinwook Shin, Youngkyun Kim, Irini Evnouchidou, Donghyun
Quantitative differential expression analysis reveals mir-7 as major islet microrna
 Available online at www.sciencedirect.com Biochemical and Biophysical Research Communications 366 (2008) 922 926 www.elsevier.com/locate/ybbrc Quantitative differential expression analysis reveals mir-7
FOR REVIEW. BMB Reports - Manuscript Submission. Manuscript Draft. Manuscript Number: BMB
 BMB Reports - Manuscript Submission Manuscript Draft Manuscript Number: BMB-18-095 Title: Insulin Receptor Substrate 2:A Bridge between Hippo and AKT Pathways Article Type: Perspective (Invited Only) Keywords:
SUPPLEMENTARY INFORMATION
 DOI: 10.1038/ncb3461 In the format provided by the authors and unedited. Supplementary Figure 1 (associated to Figure 1). Cpeb4 gene-targeted mice develop liver steatosis. a, Immunoblot displaying CPEB4
Supplementary Information
 Supplementary Information GADD34-deficient mice develop obesity, nonalcoholic fatty liver disease, hepatic carcinoma and insulin resistance Naomi Nishio and Ken-ichi Isobe Department of Immunology, Nagoya
Supplementary Figure 1:
 Supplementary Figure 1: (A) Whole aortic cross-sections stained with Hematoxylin and Eosin (H&E), 7 days after porcine-pancreatic-elastase (PPE)-induced AAA compared to untreated, healthy control aortas
Supplemental Data. TGF-β-mediated mir-181a expression promotes breast cancer metastasis by targeting Bim.
 Supplemental Data TGF-β-mediated mir-181a expression promotes breast cancer metastasis by targeting Bim. Molly A. Taylor 1, Khalid Sossey-Alaoui 2, Cheryl L. Thompson 3, David Danielpour 4, and William
Downregulation of serum mir-17 and mir-106b levels in gastric cancer and benign gastric diseases
 Brief Communication Downregulation of serum mir-17 and mir-106b levels in gastric cancer and benign gastric diseases Qinghai Zeng 1 *, Cuihong Jin 2 *, Wenhang Chen 2, Fang Xia 3, Qi Wang 3, Fan Fan 4,
Online Data Supplement. Anti-aging Gene Klotho Enhances Glucose-induced Insulin Secretion by Upregulating Plasma Membrane Retention of TRPV2
 Online Data Supplement Anti-aging Gene Klotho Enhances Glucose-induced Insulin Secretion by Upregulating Plasma Membrane Retention of TRPV2 Yi Lin and Zhongjie Sun Department of physiology, college of
Berberine Sensitizes Human Ovarian Cancer Cells to Cisplatin Through mir-93/ PTEN/Akt Signaling Pathway
 Chen Accepted: et al.: February Berberine 24, Sensitizes 2015 Ovarian Cancer Cells to Cisplatin www.karger.com/cpb 956 1421-9778/15/0363-0956$39.50/0 Original Paper This is an Open Access article licensed
MicroRNA sponges: competitive inhibitors of small RNAs in mammalian cells
 MicroRNA sponges: competitive inhibitors of small RNAs in mammalian cells Margaret S Ebert, Joel R Neilson & Phillip A Sharp Supplementary figures and text: Supplementary Figure 1. Effect of sponges on
SUPPLEMENTAL MATERIAL. Supplementary Methods
 SUPPLEMENTAL MATERIAL Supplementary Methods Culture of cardiomyocytes, fibroblasts and cardiac microvascular endothelial cells The isolation and culturing of neonatal rat ventricular cardiomyocytes was
Soft Agar Assay. For each cell pool, 100,000 cells were resuspended in 0.35% (w/v)
") SUPPLEMENTARY MATERIAL AND METHODS Soft Agar Assay. For each cell pool, 100,000 cells were resuspended in 0.35% (w/v) top agar (LONZA, SeaKem LE Agarose cat.5004) and plated onto 0.5% (w/v) basal agar.
SUPPLEMENTARY MATERIAL AND METHODS Soft Agar Assay. For each cell pool, 100,000 cells were resuspended in 0.35% (w/v) top agar (LONZA, SeaKem LE Agarose cat.5004) and plated onto 0.5% (w/v) basal agar.
Supplementary data Supplementary Figure 1 Supplementary Figure 2
 Supplementary data Supplementary Figure 1 SPHK1 sirna increases RANKL-induced osteoclastogenesis in RAW264.7 cell culture. (A) RAW264.7 cells were transfected with oligocassettes containing SPHK1 sirna
Impact factor: Reporter:4A1H0019 Chen Zi Hao 4A1H0023 Huang Wan ting 4A1H0039 Sue Yi Zhu 4A1H0070 Lin Guan cheng 4A1H0077 Chen Bo xuan
 Curcumin Protects Neonatal Rat Cardiomyocytes against High Glucose-Induced Apoptosis via PI3K/Akt Signalling Pathway Wei Yu,1,2 Wenliang Zha,1 Zhiqiang Ke,1 Qing Min,2 Cairong Li,1 Huirong Sun,3 and Chao
Strathprints Institutional Repository
 Strathprints Institutional Repository Tate, Rothwelle and Rotondo, Dino and Davidson, Jillian (2015) Regulation of lipid metabolism by micrornas. Current Opinion in Lipidology, 26 (3). pp. 243-244. ISSN
Original Article Differential expression profile analysis of mirnas with HER-2 overexpression and intervention in breast cancer cells
 Int J Clin Exp Pathol 2017;10(5):5039-5062 www.ijcep.com /ISSN:1936-2625/IJCEP0052419 Original Article Differential expression profile analysis of mirnas with HER-2 overexpression and intervention in breast
Role of fatty acids in the development of insulin resistance and type 2 diabetes mellitus
 Emerging Science Role of fatty acids in the development of insulin resistance and type 2 diabetes mellitus George Wolf Insulin resistance is defined as the reduced responsiveness to normal circulating
Supplemental Information
 Supplemental Information Tobacco-specific Carcinogen Induces DNA Methyltransferases 1 Accumulation through AKT/GSK3β/βTrCP/hnRNP-U in Mice and Lung Cancer patients Ruo-Kai Lin, 1 Yi-Shuan Hsieh, 2 Pinpin
Profiles of gene expression & diagnosis/prognosis of cancer. MCs in Advanced Genetics Ainoa Planas Riverola
 Profiles of gene expression & diagnosis/prognosis of cancer MCs in Advanced Genetics Ainoa Planas Riverola Gene expression profiles Gene expression profiling Used in molecular biology, it measures the
Supplementary Materials and Methods
 Supplementary Materials and Methods Immunoblotting Immunoblot analysis was performed as described previously (1). Due to high-molecular weight of MUC4 (~ 950 kda) and MUC1 (~ 250 kda) proteins, electrophoresis
Supplementary Materials for
 www.sciencesignaling.org/cgi/content/full/8/364/ra18/dc1 Supplementary Materials for The tyrosine phosphatase (Pez) inhibits metastasis by altering protein trafficking Leila Belle, Naveid Ali, Ana Lonic,
2.5. AMPK activity
 Supplement Fig. A 3 B phos-ampk 2.5 * Control AICAR AMPK AMPK activity (Absorbance at 45 nm) 2.5.5 Control AICAR Supplement Fig. Effects of AICAR on AMPK activation in macrophages. J774. macrophages were
Oncolytic Adenovirus Complexes Coated with Lipids and Calcium Phosphate for Cancer Gene Therapy
 Oncolytic Adenovirus Complexes Coated with Lipids and Calcium Phosphate for Cancer Gene Therapy Jianhua Chen, Pei Gao, Sujing Yuan, Rongxin Li, Aimin Ni, Liang Chu, Li Ding, Ying Sun, Xin-Yuan Liu, Yourong
m 6 A mrna methylation regulates AKT activity to promote the proliferation and tumorigenicity of endometrial cancer
 SUPPLEMENTARY INFORMATION Articles https://doi.org/10.1038/s41556-018-0174-4 In the format provided by the authors and unedited. m 6 A mrna methylation regulates AKT activity to promote the proliferation
Defective Hepatic Autophagy in Obesity Promotes ER Stress and Causes Insulin Resistance
 Cell Metabolism, Volume 11 Supplemental Information Defective Hepatic Autophagy in Obesity Promotes ER Stress and Causes Insulin Resistance Ling Yang, Ping Li, Suneng Fu, Ediz S. Calay, and Gökhan S. Hotamisligil
Advances in Computer Science Research, volume 59 7th International Conference on Education, Management, Computer and Medicine (EMCM 2016)
") 7th International Conference on Education, Management, Computer and Medicine (EMCM 2016) Expression of Beta-Adrenergic Receptor in Glioma LN229 Cells and Its Effect on Cell Proliferation Ping Wang1, Qingluan
7th International Conference on Education, Management, Computer and Medicine (EMCM 2016) Expression of Beta-Adrenergic Receptor in Glioma LN229 Cells and Its Effect on Cell Proliferation Ping Wang1, Qingluan
Supplementary Information. Glycogen shortage during fasting triggers liver-brain-adipose. neurocircuitry to facilitate fat utilization
 Supplementary Information Glycogen shortage during fasting triggers liver-brain-adipose neurocircuitry to facilitate fat utilization Supplementary Figure S1. Liver-Brain-Adipose neurocircuitry Starvation
Insulin Resistance. Biol 405 Molecular Medicine
 Insulin Resistance Biol 405 Molecular Medicine Insulin resistance: a subnormal biological response to insulin. Defects of either insulin secretion or insulin action can cause diabetes mellitus. Insulin-dependent
Supplementary Figure 1 Role of Raf-1 in TLR2-Dectin-1-mediated cytokine expression
 Supplementary Figure 1 Supplementary Figure 1 Role of Raf-1 in TLR2-Dectin-1-mediated cytokine expression. Quantitative real-time PCR of indicated mrnas in DCs stimulated with TLR2-Dectin-1 agonist zymosan
Protection against doxorubicin-induced myocardial dysfunction in mice by cardiac-specific expression of carboxyl terminus of hsp70-interacting protein
 Protection against doxorubicin-induced myocardial dysfunction in mice by cardiac-specific expression of carboxyl terminus of hsp70-interacting protein Lei Wang 1, Tian-Peng Zhang 1, Yuan Zhang 2, Hai-Lian
Supplementary Fig. 1 eif6 +/- mice show a reduction in white adipose tissue, blood lipids and normal glycogen synthesis. The cohort of the original
 Supplementary Fig. 1 eif6 +/- mice show a reduction in white adipose tissue, blood lipids and normal glycogen synthesis. The cohort of the original phenotypic screening was n=40. For specific tests, the
Synthesis of Substituted 2H-Benzo[e]indazole-9-carboxylate as Potent Antihyperglycemic Agent that May Act through IRS-1, Akt and GSK-3β Pathways
![Synthesis of Substituted 2H-Benzo[e]indazole-9-carboxylate as Potent Antihyperglycemic Agent that May Act through IRS-1, Akt and GSK-3β Pathways](/thumbs/96/128474991.jpg "Synthesis of Substituted 2H-Benzo[e]indazole-9-carboxylate as Potent Antihyperglycemic Agent that May Act through IRS-1, Akt and GSK-3β Pathways") Electronic Supplementary Material (ESI) for MedChemComm. This journal is The Royal Society of Chemistry 2016 Supplementary Data Synthesis of Substituted 2H-Benzo[e]indazole-9-carboxylate as Potent Antihyperglycemic
Electronic Supplementary Material (ESI) for MedChemComm. This journal is The Royal Society of Chemistry 2016 Supplementary Data Synthesis of Substituted 2H-Benzo[e]indazole-9-carboxylate as Potent Antihyperglycemic
Department of Pharmaceutical Sciences, School of Pharmacy, Northeastern University, Boston, MA 02115, USA 2
 Pancreatic Cancer Cell Exosome-Mediated Macrophage Reprogramming and the Role of MicroRNAs 155 and 125b2 Transfection using Nanoparticle Delivery Systems Mei-Ju Su 1, Hibah Aldawsari 2, and Mansoor Amiji
Supplementary Table 1. Metabolic parameters in GFP and OGT-treated mice
 Supplementary Table 1. Metabolic parameters in GFP and OGT-treated mice Fasted Refed GFP OGT GFP OGT Liver G6P (mmol/g) 0.03±0.01 0.04±0.02 0.60±0.04 0.42±0.10 A TGs (mg/g of liver) 20.08±5.17 16.29±0.8
Trehalose, sucrose and raffinose are novel activators of autophagy in human. keratinocytes through an mtor-independent pathway
 Title page Trehalose, sucrose and raffinose are novel activators of autophagy in human keratinocytes through an mtor-independent pathway Xu Chen 1*, Min Li 1*, Li Li 1, Song Xu 1, Dan Huang 1, Mei Ju 1,
Supplementary Figure S1. Venn diagram analysis of mrna microarray data and mirna target analysis. (a) Western blot analysis of T lymphoblasts (CLS)
 Western blot analysis of T lymphoblasts (CLS)") Supplementary Figure S1. Venn diagram analysis of mrna microarray data and mirna target analysis. (a) Western blot analysis of T lymphoblasts (CLS) and their exosomes (EXO) in resting (REST) and activated
Supplementary Figure S1. Venn diagram analysis of mrna microarray data and mirna target analysis. (a) Western blot analysis of T lymphoblasts (CLS) and their exosomes (EXO) in resting (REST) and activated
Supplemental Material:
 Supplemental Material: MATERIALS AND METHODS RNA interference Mouse CHOP sirna (ON-TARGETplus SMARTpool Cat# L-062068-00) and control sirna (ON-TARGETplus Control) were purchased from Dharmacon. Transfection
Supplemental Figure 1. Western blot analysis indicated that MIF was detected in the fractions of
 Supplemental Figure Legends Supplemental Figure 1. Western blot analysis indicated that was detected in the fractions of plasma membrane and cytosol but not in nuclear fraction isolated from Pkd1 null
Supplementary Fig. 1. Identification of acetylation of K68 of SOD2
 Supplementary Fig. 1. Identification of acetylation of K68 of SOD2 A B H. sapiens 54 KHHAAYVNNLNVTEEKYQEALAK 75 M. musculus 54 KHHAAYVNNLNATEEKYHEALAK 75 X. laevis 55 KHHATYVNNLNITEEKYAEALAK 77 D. rerio
Supporting Information
 Supporting Information Pang et al. 10.1073/pnas.1322009111 SI Materials and Methods ELISAs. These assays were performed as previously described (1). ELISA plates (MaxiSorp Nunc; Thermo Fisher Scientific)
(A) PCR primers (arrows) designed to distinguish wild type (P1+P2), targeted (P1+P2) and excised (P1+P3)14-
 PCR primers (arrows) designed to distinguish wild type (P1+P2), targeted (P1+P2) and excised (P1+P3)14-") 1 Supplemental Figure Legends Figure S1. Mammary tumors of ErbB2 KI mice with 14-3-3σ ablation have elevated ErbB2 transcript levels and cell proliferation (A) PCR primers (arrows) designed to distinguish
1 Supplemental Figure Legends Figure S1. Mammary tumors of ErbB2 KI mice with 14-3-3σ ablation have elevated ErbB2 transcript levels and cell proliferation (A) PCR primers (arrows) designed to distinguish
Regulation of cell signaling cascades by influenza A virus
 The Second International Symposium on Optimization and Systems Biology (OSB 08) Lijiang, China, October 31 November 3, 2008 Copyright 2008 ORSC & APORC, pp. 389 394 Regulation of cell signaling cascades
Islet viability assay and Glucose Stimulated Insulin Secretion assay RT-PCR and Western Blot
 Islet viability assay and Glucose Stimulated Insulin Secretion assay Islet cell viability was determined by colorimetric (3-(4,5-dimethylthiazol-2-yl)-2,5- diphenyltetrazolium bromide assay using CellTiter
SUPPLEMENTARY INFORMATION
 Supplementary Figures Supplementary Figure S1. Binding of full-length OGT and deletion mutants to PIP strips (Echelon Biosciences). Supplementary Figure S2. Binding of the OGT (919-1036) fragments with
Part-4. Cell cycle regulatory protein 5 (Cdk5) A novel target of ERK in Carb induced cell death
 A novel target of ERK in Carb induced cell death") Part-4 Cell cycle regulatory protein 5 (Cdk5) A novel target of ERK in Carb induced cell death 95 1. Introduction The process of replicating DNA and dividing cells can be described as a series of coordinated
Part-4 Cell cycle regulatory protein 5 (Cdk5) A novel target of ERK in Carb induced cell death 95 1. Introduction The process of replicating DNA and dividing cells can be described as a series of coordinated
MTC-TT and TPC-1 cell lines were cultured in RPMI medium (Gibco, Breda, The Netherlands)
") Supplemental data Materials and Methods Cell culture MTC-TT and TPC-1 cell lines were cultured in RPMI medium (Gibco, Breda, The Netherlands) supplemented with 15% or 10% (for TPC-1) fetal bovine serum
Supplemental data Materials and Methods Cell culture MTC-TT and TPC-1 cell lines were cultured in RPMI medium (Gibco, Breda, The Netherlands) supplemented with 15% or 10% (for TPC-1) fetal bovine serum
Supplementary Materials for
 www.sciencesignaling.org/cgi/content/full/2/1/ra81/dc1 Supplementary Materials for Delivery of MicroRNA-126 by Apoptotic Bodies Induces CXCL12- Dependent Vascular Protection Alma Zernecke,* Kiril Bidzhekov,
An excessive increase in glutamate contributes to glucose-toxicity in. β-cells via activation of pancreatic NMDA receptors in rodent diabetes
 An excessive increase in glutamate contributes to glucose-toxicity in β-cells via activation of pancreatic NMDA receptors in rodent diabetes Xiao-Ting Huang 1, Chen Li 1,3, Xiang-Ping Peng 1, Jia Guo 1,5,
Introduction: 年 Fas signal-mediated apoptosis. PI3K/Akt
 Fas-ligand (CD95-L; Fas-L) Fas (CD95) Fas (apoptosis) 年 了 不 度 Fas Fas-L 力 不 Fas/Fas-L T IL-10Fas/Fas-L 不 年 Fas signal-mediated apoptosis 度降 不 不 力 U-118, HeLa, A549, Huh-7 MCF-7, HepG2. PI3K/Akt FasPI3K/Akt
Supplementary Information Titles Journal: Nature Medicine
 Supplementary Information Titles Journal: Nature Medicine Article Title: Corresponding Author: Supplementary Item & Number Supplementary Fig.1 Fig.2 Fig.3 Fig.4 Fig.5 Fig.6 Fig.7 Fig.8 Fig.9 Fig. Fig.11
FH- FH+ DM. 52 Volunteers. Oral & IV Glucose Tolerance Test Hyperinsulinemic Euglycemic Clamp in Non-DM Subjects ACADSB MYSM1. Mouse Skeletal Muscle
 A 52 Volunteers B 6 5 4 3 2 FH- FH+ DM 1 Oral & IV Glucose Tolerance Test Hyperinsulinemic Euglycemic Clamp in Non-DM Subjects ZYX EGR2 NR4A1 SRF target TPM1 ACADSB MYSM1 Non SRF target FH- FH+ DM2 C SRF
Supplementary Information
 Supplementary Information Supplementary Figure 1. CD4 + T cell activation and lack of apoptosis after crosslinking with anti-cd3 + anti-cd28 + anti-cd160. (a) Flow cytometry of anti-cd160 (5D.10A11) binding
Supplemental Materials. STK16 regulates actin dynamics to control Golgi organization and cell cycle
 Supplemental Materials STK16 regulates actin dynamics to control Golgi organization and cell cycle Juanjuan Liu 1,2,3, Xingxing Yang 1,3, Binhua Li 1, Junjun Wang 1,2, Wenchao Wang 1, Jing Liu 1, Qingsong
INTRODUCTION. Induction of Monocyte Chemoattractant Protein-1 (MCP-1) Expression by Angiotensin II (AngII) in the Pancreatic Islets and Beta Cells
 Expression by Angiotensin II (AngII) in the Pancreatic Islets and Beta Cells") Induction of Monocyte Chemoattractant Protein-1 (MCP-1) Expression by Angiotensin II (AngII) in the Pancreatic Islets and Beta Cells Galina Chipitsyna, Qiaoke Gong, Chance F. Gray et al. Endocrinology,
Induction of Monocyte Chemoattractant Protein-1 (MCP-1) Expression by Angiotensin II (AngII) in the Pancreatic Islets and Beta Cells Galina Chipitsyna, Qiaoke Gong, Chance F. Gray et al. Endocrinology,
RNA extraction, RT-PCR and real-time PCR. Total RNA were extracted using
 Supplementary Information Materials and Methods RNA extraction, RT-PCR and real-time PCR. Total RNA were extracted using Trizol reagent (Invitrogen,Carlsbad, CA) according to the manufacturer's instructions.
A Central Role of MG53 in Metabolic Syndrome. and Type-2 Diabetes
 A Central Role of MG53 in Metabolic Syndrome and Type-2 Diabetes Yan Zhang, Chunmei Cao, Rui-Ping Xiao Institute of Molecular Medicine (IMM) Peking University, Beijing, China Accelerated Aging in China
Ling Xu, Wei-Qi Dai, Xuan-Fu Xu, Fan Wang, Lei He, Chuan-Yong Guo*
 DOI:http://dx.doi.org/10.7314/APJCP.2012.13.7.3203 RESEARCH ARTICLE Effects of Multiple-target Anti-microRNA Antisense Oligodeoxyribonucleotides on Proliferation and Migration of Gastric Cancer Cells Ling
Supplementary Figure 1. Deletion of Smad3 prevents B16F10 melanoma invasion and metastasis in a mouse s.c. tumor model.
 A B16F1 s.c. Lung LN Distant lymph nodes Colon B B16F1 s.c. Supplementary Figure 1. Deletion of Smad3 prevents B16F1 melanoma invasion and metastasis in a mouse s.c. tumor model. Highly invasive growth
Supplementary Information
 Supplementary Information Akt regulates hepatic metabolism by suppressing a Foxo1 dependent global inhibition of adaptation to nutrient intake Mingjian Lu 1, Min Wan 1, Karla F. Leavens 1, Qingwei Chu
(A) RT-PCR for components of the Shh/Gli pathway in normal fetus cell (MRC-5) and a
 RT-PCR for components of the Shh/Gli pathway in normal fetus cell (MRC-5) and a") Supplementary figure legends Supplementary Figure 1. Expression of Shh signaling components in a panel of gastric cancer. (A) RT-PCR for components of the Shh/Gli pathway in normal fetus cell (MRC-5) and
Supplementary figure legends Supplementary Figure 1. Expression of Shh signaling components in a panel of gastric cancer. (A) RT-PCR for components of the Shh/Gli pathway in normal fetus cell (MRC-5) and
Analysis of small RNAs from Drosophila Schneider cells using the Small RNA assay on the Agilent 2100 bioanalyzer. Application Note
 Analysis of small RNAs from Drosophila Schneider cells using the Small RNA assay on the Agilent 2100 bioanalyzer Application Note Odile Sismeiro, Jean-Yves Coppée, Christophe Antoniewski, and Hélène Thomassin
FOXO Reporter Kit PI3K/AKT Pathway Cat. #60643
 Data Sheet FOXO Reporter Kit PI3K/AKT Pathway Cat. #60643 Background The PI3K/AKT signaling pathway is essential for cell growth and survival. Disruption of this pathway or its regulation has been linked
SUPPLEMENTARY INFORMATION
 doi:10.1038/nature12652 Supplementary Figure 1. PRDM16 interacts with endogenous EHMT1 in brown adipocytes. Immunoprecipitation of PRDM16 complex by flag antibody (M2) followed by Western blot analysis
MicroRNA and Male Infertility: A Potential for Diagnosis
 Review Article MicroRNA and Male Infertility: A Potential for Diagnosis * Abstract MicroRNAs (mirnas) are small non-coding single stranded RNA molecules that are physiologically produced in eukaryotic
Supplementary Figure 1: si-craf but not si-braf sensitizes tumor cells to radiation.
 Supplementary Figure 1: si-craf but not si-braf sensitizes tumor cells to radiation. (a) Embryonic fibroblasts isolated from wildtype (WT), BRAF -/-, or CRAF -/- mice were irradiated (6 Gy) and DNA damage
RNA interference induced hepatotoxicity results from loss of the first synthesized isoform of microrna-122 in mice
 SUPPLEMENTARY INFORMATION RNA interference induced hepatotoxicity results from loss of the first synthesized isoform of microrna-122 in mice Paul N Valdmanis, Shuo Gu, Kirk Chu, Lan Jin, Feijie Zhang,
Circular RNAs (circrnas) act a stable mirna sponges
 act a stable mirna sponges") Circular RNAs (circrnas) act a stable mirna sponges cernas compete for mirnas Ancestal mrna (+3 UTR) Pseudogene RNA (+3 UTR homolgy region) The model holds true for all RNAs that share a mirna binding
Circular RNAs (circrnas) act a stable mirna sponges cernas compete for mirnas Ancestal mrna (+3 UTR) Pseudogene RNA (+3 UTR homolgy region) The model holds true for all RNAs that share a mirna binding
Protein extraction and western blot analysis Protein extraction was performed as
 ESM Methods Protein extraction and western blot analysis Protein extraction was performed as previously described [1]. 2 g protein was loaded on SDSPAGE and immunoblotted with antibodies to mouse AKT (1:1,
Figure S1. ERBB3 mrna levels are elevated in Luminal A breast cancers harboring ERBB3
 Supplemental Figure Legends. Figure S1. ERBB3 mrna levels are elevated in Luminal A breast cancers harboring ERBB3 ErbB3 gene copy number gain. Supplemental Figure S1. ERBB3 mrna levels are elevated in
Supplementary Figure 1
 Supplementary Figure 1 6 HE-50 HE-116 E-1 HE-108 Supplementary Figure 1. Targeted drug response curves of endometrial cancer cells. Endometrial cancer cell lines were incubated with serial dilutions of
Supplementary Materials and Methods
 Supplementary Materials and Methods Hepatocyte toxicity assay. Freshly isolated hepatocytes were incubated for overnight with varying concentrations (-25 µm) of sodium glycochenodeoxycholate (GCDC) or
Requires Signaling though Akt2 Independent of the. Transcription Factors FoxA2, FoxO1, and SREBP1c
 Cell Metabolism, Volume 14 Supplemental Information Postprandial Hepatic Lipid Metabolism Requires Signaling though Akt2 Independent of the Transcription Factors FoxA2, FoxO1, and SREBP1c Min Wan, Karla
Expression of mir-146a-5p in patients with intracranial aneurysms and its association with prognosis
 European Review for Medical and Pharmacological Sciences 2018; 22: 726-730 Expression of mir-146a-5p in patients with intracranial aneurysms and its association with prognosis H.-L. ZHANG 1, L. LI 2, C.-J.
p47 negatively regulates IKK activation by inducing the lysosomal degradation of polyubiquitinated NEMO
 Supplementary Information p47 negatively regulates IKK activation by inducing the lysosomal degradation of polyubiquitinated NEMO Yuri Shibata, Masaaki Oyama, Hiroko Kozuka-Hata, Xiao Han, Yuetsu Tanaka,
The lncrna MIR4435-2HG is upregulated in hepatocellular carcinoma and promotes cancer cell proliferation by upregulating mirna-487a
 Kong et al. Cellular & Molecular Biology Letters (2019) 24:26 https://doi.org/10.1186/s11658-019-0148-y Cellular & Molecular Biology Letters RESEARCH LETTER Open Access The lncrna MIR4435-2HG is upregulated
York criteria, 6 RA patients and 10 age- and gender-matched healthy controls (HCs).
.") MATERIALS AND METHODS Study population Blood samples were obtained from 15 patients with AS fulfilling the modified New York criteria, 6 RA patients and 10 age- and gender-matched healthy controls (HCs).
MATERIALS AND METHODS Study population Blood samples were obtained from 15 patients with AS fulfilling the modified New York criteria, 6 RA patients and 10 age- and gender-matched healthy controls (HCs).
STAT1 regulates microrna transcription in interferon γ stimulated HeLa cells
 CAMDA 2009 October 5, 2009 STAT1 regulates microrna transcription in interferon γ stimulated HeLa cells Guohua Wang 1, Yadong Wang 1, Denan Zhang 1, Mingxiang Teng 1,2, Lang Li 2, and Yunlong Liu 2 Harbin
mir-577 inhibits pancreatic β-cell function and survival by targeting fibroblast growth factor 21 (FGF-21) in pediatric diabetes
 in pediatric diabetes") mir-577 inhibits pancreatic β-cell function and survival by targeting fibroblast growth factor 21 (FGF-21) in pediatric diabetes X.Y. Chen 2, G.M. Li 1, Q. Dong 1,2 and H. Peng 1,3 1 Pediatric Department,
mir-577 inhibits pancreatic β-cell function and survival by targeting fibroblast growth factor 21 (FGF-21) in pediatric diabetes X.Y. Chen 2, G.M. Li 1, Q. Dong 1,2 and H. Peng 1,3 1 Pediatric Department,
Supplementary Materials for
 www.sciencesignaling.org/cgi/content/full/8/407/ra127/dc1 Supplementary Materials for Loss of FTO in adipose tissue decreases Angptl4 translation and alters triglyceride metabolism Chao-Yung Wang,* Shian-Sen
Supplementary Figure 1 CD4 + T cells from PKC-θ null mice are defective in NF-κB activation during T cell receptor signaling. CD4 + T cells were
 Supplementary Figure 1 CD4 + T cells from PKC-θ null mice are defective in NF-κB activation during T cell receptor signaling. CD4 + T cells were isolated from wild type (PKC-θ- WT) or PKC-θ null (PKC-θ-KO)
MicroRNAs Modulate the Noncanonical NF- B Pathway by Regulating IKK Expression During Macrophage Differentiation
 MicroRNAs Modulate the Noncanonical NF- B Pathway by Regulating IKK Expression During Macrophage Differentiation Tao Li 1 *, Michael J. Morgan 1 *, Swati Choksi 1, Yan Zhang 1, You-Sun Kim 2#, Zheng-gang
Spherical Nucleic Acids For Advanced Wound Healing Applications Chad A. Mirkin
 Spherical Nucleic Acids For Advanced Wound Healing Applications Chad A. Mirkin Departments of Chemistry, Infectious Disease, Materials Science & Engineering, Chemical & Biological Engineering, and Biomedical
SUPPLEMENTARY INFORMATION
 SUPPLEMENTARY INFORMATION doi:10.1038/nature11464 Supplemental Figure S1. The expression of Vegfb is increased in obese and diabetic mice as compared to lean mice. a-b, Body weight and postprandial blood
Supplementary Figure 1. DNA methylation of the adiponectin promoter R1, Pparg2, and Tnfa promoter in adipocytes is not affected by obesity.
 Supplementary Figure 1. DNA methylation of the adiponectin promoter R1, Pparg2, and Tnfa promoter in adipocytes is not affected by obesity. (a) Relative amounts of adiponectin, Ppar 2, C/ebp, and Tnf mrna
Supplemental Information. Increased 4E-BP1 Expression Protects. against Diet-Induced Obesity and Insulin. Resistance in Male Mice
 Cell Reports, Volume 16 Supplemental Information Increased 4E-BP1 Expression Protects against Diet-Induced Obesity and Insulin Resistance in Male Mice Shih-Yin Tsai, Ariana A. Rodriguez, Somasish G. Dastidar,
Cellular Physiology and Biochemistry
 Original Paper 2015 The Author(s). 2015 Published The Author(s) by S. Karger AG, Basel Published online: November 27, 2015 www.karger.com/cpb Published by S. Karger AG, Basel 2194 1421-9778/15/0376-2194$39.50/0
SUPPLEMENTARY INFORMATION
 -. -. SUPPLEMENTARY INFORMATION DOI: 1.1/ncb86 a WAT-1 WAT- BAT-1 BAT- sk-muscle-1 sk-muscle- mir-133b mir-133a mir-6 mir-378 mir-1 mir-85 mir-378 mir-6a mir-18 mir-133a mir- mir- mir-341 mir-196a mir-17
Supplementary Figure S I: Effects of D4F on body weight and serum lipids in apoe -/- mice.
 Supplementary Figures: Supplementary Figure S I: Effects of D4F on body weight and serum lipids in apoe -/- mice. Male apoe -/- mice were fed a high-fat diet for 8 weeks, and given PBS (model group) or
Sestrin2 and BNIP3 (Bcl-2/adenovirus E1B 19kDa-interacting. protein3) regulate autophagy and mitophagy in renal tubular cells in. acute kidney injury
 regulate autophagy and mitophagy in renal tubular cells in. acute kidney injury") Sestrin2 and BNIP3 (Bcl-2/adenovirus E1B 19kDa-interacting protein3) regulate autophagy and mitophagy in renal tubular cells in acute kidney injury by Masayuki Ishihara 1, Madoka Urushido 2, Kazu Hamada
Sestrin2 and BNIP3 (Bcl-2/adenovirus E1B 19kDa-interacting protein3) regulate autophagy and mitophagy in renal tubular cells in acute kidney injury by Masayuki Ishihara 1, Madoka Urushido 2, Kazu Hamada
Protocol for Gene Transfection & Western Blotting
 The schedule and the manual of basic techniques for cell culture Advanced Protocol for Gene Transfection & Western Blotting Schedule Day 1 26/07/2008 Transfection Day 3 28/07/2008 Cell lysis Immunoprecipitation