BMP6 treatment compensates for the molecular defect and ameliorates hemochromatosis in Hfe knockout mice
|
|
|
- Bethany Ramsey
- 6 years ago
- Views:
Transcription
1 SUPPLEMENTARY MATERIALS BMP6 treatment compensates for the molecular defect and ameliorates hemochromatosis in Hfe knockout mice Elena Corradini, Paul J. Schmidt, Delphine Meynard, Cinzia Garuti, Giuliana Montosi, Shanzhuo Chen, Slobodan Vukicevic, Antonello Pietrangelo, Herbert Y. Lin, and Jodie L. Babitt
2 SUPPLEMENTARY MATERIALS AND METHODS Animals All animal protocols were approved by the Institutional Animal Care and Use Committee at the Massachusetts General Hospital (MGH), Children s Hospital Boston (CHB), or the University Hospital of Modena (UHM). Wildtype mice with iron deficiency anemia (WT anemic) were housed in the MGH rodent facility and were generated by placing female C57BL/6 mice on an iron deficient diet (2-6 ppm iron, TD.80396, Harlan Teklad) for 3 weeks until 8-10 weeks of age followed by phlebotomy of 0.4 ml blood by retro-orbital puncture. Mice were sacrificed 24 hours after phlebotomy. In parallel, a control group of female WT C57BL/6 mice were housed in the MGH rodent facility and maintained on a Prolab 5P75 Isopro RMH 3000 diet with 380 ppm iron until sacrifice at 8-10 weeks of age. For BMP6 time course experiments, eight-week-old male 129S6/SvEvTac WT mice housed in the MGH rodent facility and maintained on a Prolab 5P75 Isopro RMH 3000 diet with 380 ppm iron were treated with a single intraperitoneal injection of BMP6 at 500 µg/kg or an equal volume of vehicle alone. Six, 8, or 24 hours after injection, mice were sacrificed and analyzed for serum iron and transferrin saturation. Tissue iron measurement Quantitative measurement of nonheme iron was performed on liver, spleen, heart, and pancreas as previously described (Babitt et al. J Clin Invest. 2007; 117: ). Quantitative real-time RT-PCR Total RNA was isolated from mouse livers and real-time quantification of Hfe or Crp 1
3 relative to Rpl19 mrna were performed using two-step quantitative real-time RT-PCR as previously described (Babitt et al. Nat Genet. 2006; 38: ) using primers: Hfe forward 5 -CACCGCGTTCACATTCTCTAA-3, Hfe reverse 5 - CTGGCTTGAGGTTTGCTCC-3 (Primer Bank ID a1; Spandidos et al. Nucl. Acids Res :D792-9.); and Crp forward 5' ATG GAG AAG CTA CTC TGG TGC 3', Crp reverse 5' ACA CAC AGT AAA GGT GTT CAG TG 3'. Western blot Western blot of liver lysates for phosphorylated Smad1/5/8 relative to total Smad1 and Actin and chemiluminescence quantitation was performed as previously described (Corradini et al. Gastroenterology. 2009;137: ). For Ferroportin Western blots, membrane proteins were extracted using the ProteoJET Membrane Protein Kit (Fermentas), following the manufacturer s instructions. After dilution in 1x NuPAGE LDS Sample Buffer and Sample Reducing Agent (Invitrogen), samples were incubated for 10 minutes at 70 C and 5 minute on ice. Then, 2 µg of spleen proteins or 10 µg of liver proteins per sample were resolved by SDS- PAGE using pre-cast NuPAGE Novex 4 12% Bis-Tris gels (Invitrogen) and transferred onto PDVF membranes, using the liquid transfer method. The blots were blocked with 5% of non-fat dry milk in TBS containing 0.1% Tween-20 (Sigma) and probed overnight at 4 C with rabbit polyclonal antibodies to Ferroportin (1:1000, Alpha Diagnostic) diluted in the same blocking solution. Following washes, the blots were incubated for 1 hour with peroxidase-coupled goat anti-rabbit IgG (1:5000, Sigma). Blots were stripped and re-probed with mouse anti-actin monoclonal antibody (1:10000 Chemicon). Enzyme activity was detected by the Western Lightning Plus-ECL method (Perkin Elmer). Chemiluminescence was quantitated using IPLab Spectrum software version r2 (Scanalytics), by normalizing Ferroportin to Actin. 2
4 3
5 Supplementary Figure 1. Hepatic Hfe mrna is increased in Hfe Tg mice relative to WT mice. Eight-week-old female Hfe Tg mice (N = 6) versus littermate WT mice (N = 6) were analyzed for hepatic Hfe relative to Rpl19 mrna by quantitative real-time RT-PCR. Results are reported as the mean ± SD for the fold change from WT mice. Exact P values are shown for the comparison with WT mice. 4
6 Supplementary Table 1. Hematologic and iron parameters of Hfe Tg male versus female mice Gender n Hgb (g/dl) HCT (%) Serum iron (µg/dl) Tf Sat (%) LIC (µg/g) Male ± ± ± ± ± 2.1 Female ± ± ± ± ± 4.0 Hemoglobin (Hgb), serum iron, transferrin saturation (Tf Sat), and liver iron content (LIC) were measured in 8-week old Hfe Tg male versus female mice on a C57BL/6 background. Data are presented as the mean ± SD. P > 0.05 between genders for all parameters. Male Hfe Tg mice have a similar iron deficiency anemia phenotype compared with female Hfe Tg mice, although there was a trend for a more severe phenotype in the male mice. Genders were therefore matched between treatment groups in BMP6 antibody treatment experiments. 5
7 Supplementary Table 2. Hematologic and iron parameters of Hfe Tg, WT, and anemic WT mice Genotype/ n Hgb (g/dl) Serum iron (µg/dl) Tf Sat (%) LIC (µg/g) Treatment WT ± ± ± 5 55 ± 12 Hfe Tg ± 0.4 ** 82 ± 4 ** 36 ± 2 ** 40 ± 2 ** WT ± ± ± 4 86 ± 9 Anemic WT ± 1.0 ** 154 ± ± 5 * 58 ± 17 ** The hemoglobin (Hgb), serum iron, transferrin saturation (Tf Sat), and liver iron content (LIC) were measured in 8-week old female Hfe Tg versus littermate WT mice, or in 8-10-week-old female control WT mice maintained on a normal diet versus WT mice maintained on an iron deficient diet for 3 weeks and phlebotomized (Anemic WT). All mice were on a C57BL/6 background. Data are presented as the mean ± SD. **P for Hfe Tg versus WT mice or anemic WT mice versus control WT mice. * P = 0.01 for anemic WT mice versus control WT mice. P not significant from WT. Anemic WT mice had a similar reduction in hemoglobin and liver iron content relative to matched WT mice compared with the Hfe Tg mice relative to their WT littermates. Although the anemic WT mice also had slightly reduced serum Tf Sat compared with WT mice, this was considerably less pronounced than in Hfe Tg mice. 6
8 7
9 Supplementary Figure 2. Hepcidin (Hamp), Id1, and Smad7 mrna are decreased in anemic WT mice relative to control WT mice. Eight- to ten-week-old female WT mice maintained on a normal diet (WT, N = 6) versus WT mice maintained on an iron deficient diet for three weeks followed by phlebotomy of 0.4 ml blood (Anemic WT, N = 10) from Supplementary Table 2 were analyzed 24-hours after phlebotomy for hepatic Hamp, Id1, Smad7, and Bmp6 mrna relative to Rpl19 mrna by quantitative real-time RT-PCR. Results are reported as the mean ± SD for the fold change from WT mice. Exact P values (or NS if not significant) are shown for the comparison with control WT mice. 8
10 9
11 Supplementary Figure 3. There is a nonsignificant trend toward increased hepatic P-Smad1/5/8 in Hfe Tg mice versus WT mice. Eight-week-old Hfe Tg mice (N = 6) versus littermate WT mice (N = 6) were analyzed for hepatic P-Smad1/5/8 relative to total Smad1 and Actin by Western blot (A) followed by chemiluminescence quantitation (B-C). Results are reported as the mean ± SD. 10
12 11
13 Supplementary Figure 4. Neutralizing anti-bmp6 antibody decreases hepatic Id1 mrna in Hfe Tg mice. Eight to ten-week-old Hfe Tg mice that received an intraperitoneal injection of BMP6 antibody (BMP6 Ab, N = 5) or vehicle alone (Mock, N = 5) once daily for ten days from Figure 2 were analyzed for hepatic Id1 relative to Rpl19 mrna by quantitative real-time RT-PCR. Results are reported as the mean ± SD. Exact P values are shown for the comparison of BMP6 Ab treatment versus mock treatment. 12
14 13
15 Supplementary Figure 5. Dose and time curve of the effects of exogenous BMP6 administration on serum iron and transferrin saturation in mice. A) Eight to ten week-old male and female Hfe -/- mice and WT mice receiving a single intraperitoneal injection of BMP6 at 100 µg/kg or 250 µg/kg or vehicle alone (Control) as indicated (N = 6-10 per group, genders were matched between groups) from Figure 3 were analyzed for serum transferrin saturation (Tf Sat). BMP6 at 250 µg/kg caused only a nonsignificant trend toward reduced transferrin saturation in Hfe -/- mice. A higher dose of BMP6 at 500 µg/kg was therefore chosen for further experiments. B-C) Eight week-old WT mice on a 129S6/SvEvTac background received a single intraperitoneal injection of BMP6 at 500 µg/kg or an equal volume of vehicle alone (Control), and were sacrificed 6, 8, or 24 hours after injection (N = 6 per group). Serum was analyzed for iron (B) and transferrin saturation (C). Results are reported as the mean ± SD. Exact P values (or NS if not significant) are shown for the comparison between BMP6-treated versus Control mice. 14
16 15
17 Supplementary Figure 6. Exogenous BMP6 administration in Hfe -/- mice causes a trend toward increased hepatic Id1 mrna but does not affect hepatic Crp mrna. Eight-to-ten week-old Hfe -/- mice treated with BMP6 at 500 µg/kg or vehicle alone (Mock) twice daily for 10 days from Figure 4 (N = 8 per group) were analyzed for A) hepatic Id1 relative to Rpl19 mrna and B) hepatic Crp relative to Rpl19 mrna by quantitative realtime RT-PCR. Results are reported as the mean ± SD. NS indicates P > 0.05 for BMP6 treated mice compared to vehicle treated mice. 16
18 17
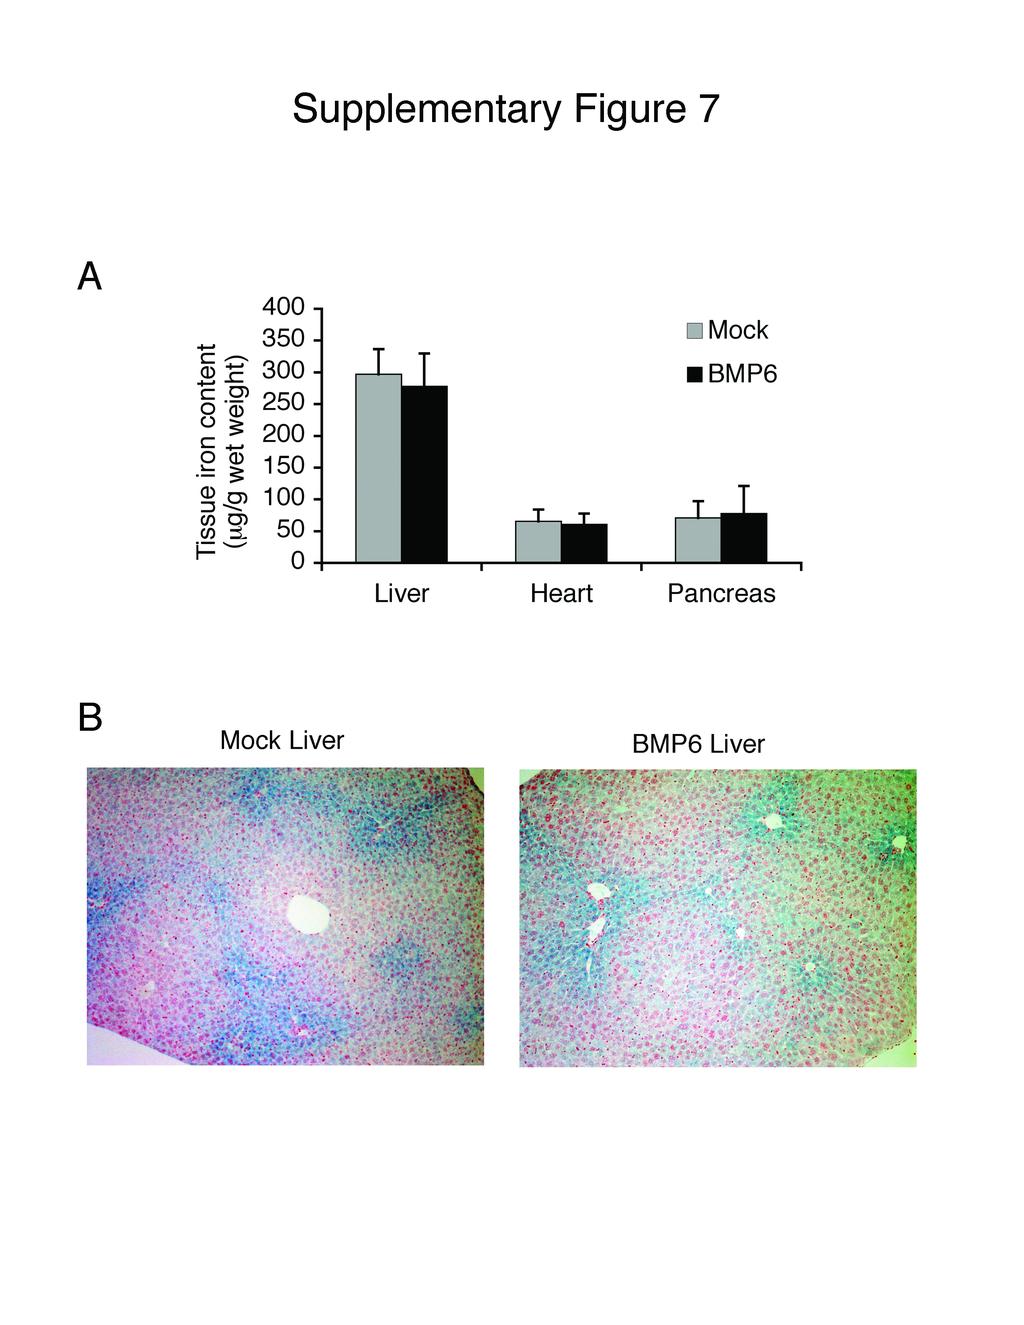
19 Supplementary Figure 7. Exogenous BMP6 does not affect liver, heart, or pancreas iron content in Hfe -/- mice. A) Eight-to-ten week-old Hfe -/- mice treated with BMP6 at 500 µg/kg or vehicle alone (Mock) twice daily for 10 days from Figure 4 (N = 8 per group) were analyzed for liver, heart, and pancreas iron content. Results are reported as the mean ± SD. All P values were non-significant for the comparison of BMP6 treated mice (black bars) with vehicle treated mice (grey bars). B) Perls Prussian blue staining of liver iron in Mock versus BMP6-treated Hfe -/- mice from panel A (original magnification x10). 18
20 19
21 Supplementary Figure 8. Splenic Ferroportin protein expression is not affected by exogenous BMP6 treatment in Hfe -/- mice, and is not significantly changed in Hfe -/- mice compared with WT mice. A) Eight-to-ten week-old male Hfe -/- mice treated with BMP6 at 500 µg/kg or vehicle alone (Mock) twice daily for 10 days from Figure 4 were analyzed for splenic Ferroportin relative to Actin protein expression by Western blot followed by chemiluminescence quantitation. B) Eight-to-ten week-old male WT mice versus Hfe-/- mice on a C57BL/6 background were analyzed for splenic Ferroportin relative to Actin protein expression by Western blot followed by chemiluminescence quantitation. BMP6 treated Hfe-/- mice on a C57BL/6 background from panel A are also shown as a comparison. Results are reported as the mean ± SD. P values were nonsignificant for comparison between all groups. 20
22 21
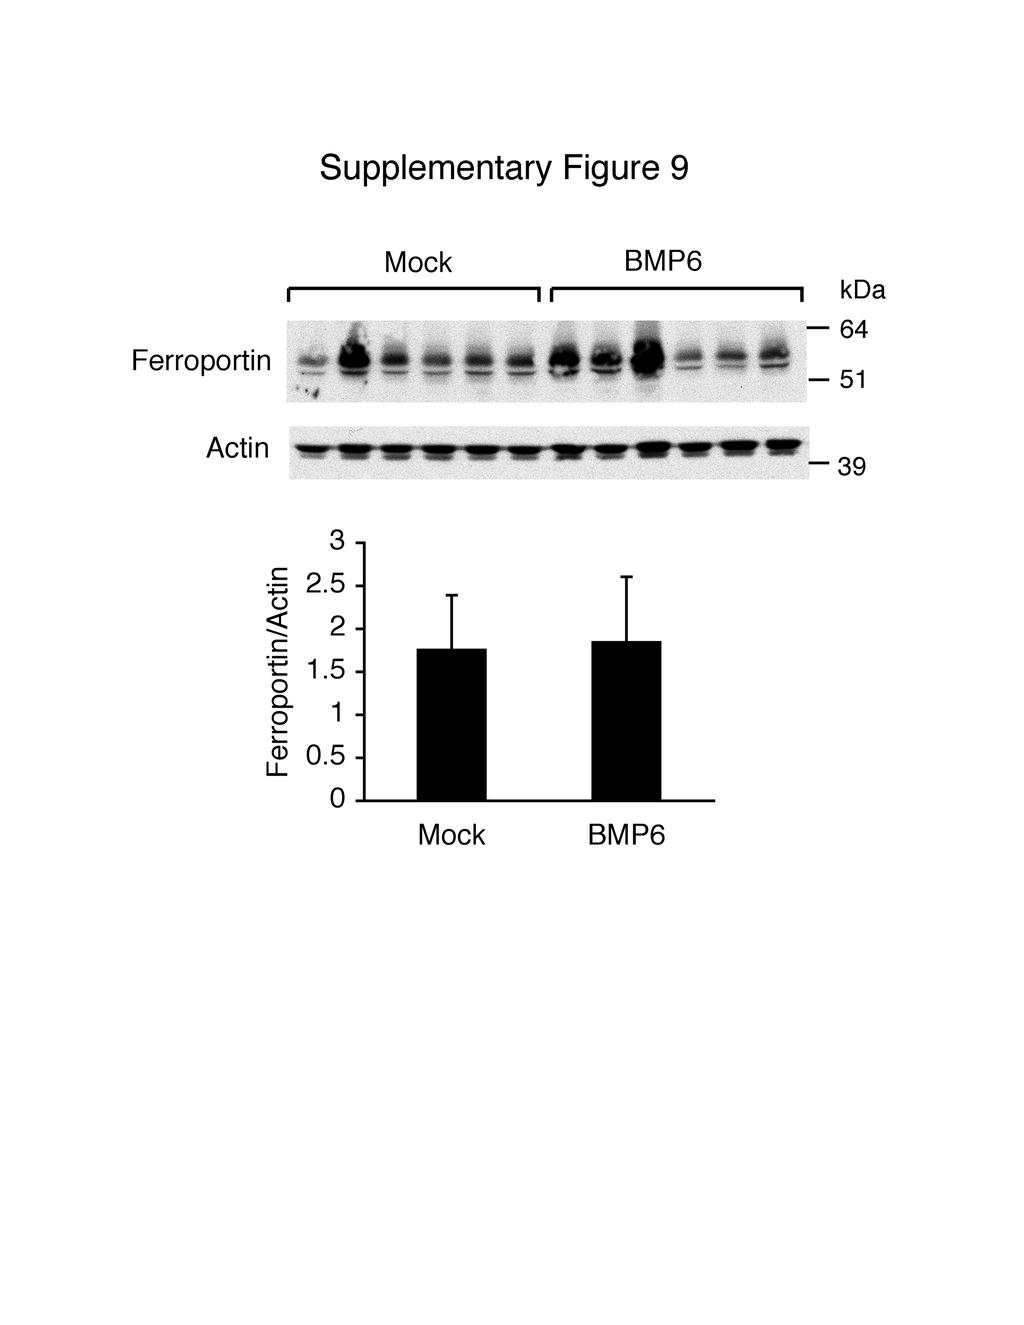
23 Supplementary Figure 9. Exogenous BMP6 does not affect liver Ferroportin expression in Hfe -/- mice. Eight-to-ten week-old Hfe -/- mice treated with BMP6 at 500 µg/kg or vehicle alone (Mock) twice daily for 10 days from Figure 4 were analyzed for liver Ferroportin relative to Actin protein expression by Western blot followed by chemiluminescence quantitation. Results are reported as the mean ± SD. The P value was non-significant for the comparison of BMP6 treated mice with vehicle treated mice. 22
BMP6 Treatment Compensates for the Molecular Defect and Ameliorates Hemochromatosis in Hfe Knockout Mice
 GASTROENTEROLOGY 2010;139:1721 1729 BMP6 Treatment Compensates for the Molecular Defect and Ameliorates Hemochromatosis in Hfe Knockout Mice ELENA CORRADINI,*, PAUL J. SCHMIDT, DELPHINE MEYNARD,* CINZIA
CD31 5'-AGA GAC GGT CTT GTC GCA GT-3' 5 ' -TAC TGG GCT TCG AGA GCA GT-3'
 Table S1. The primer sets used for real-time RT-PCR analysis. Gene Forward Reverse VEGF PDGFB TGF-β MCP-1 5'-GTT GCA GCA TGA ATC TGA GG-3' 5'-GGA GAC TCT TCG AGG AGC ACT T-3' 5'-GAA TCA GGC ATC GAG AGA
2011 ASH Annual Meeting Targeting the Hepcidin Pathway with RNAi Therapeutics for the Treatment of Anemia. December 12, 2011
 211 ASH Annual Meeting Targeting the Hepcidin Pathway with RNAi Therapeutics for the Treatment of Anemia December 12, 211 Hepcidin is Central Regulator of Iron Homeostasis Hepcidin is liver-expressed,
Islet viability assay and Glucose Stimulated Insulin Secretion assay RT-PCR and Western Blot
 Islet viability assay and Glucose Stimulated Insulin Secretion assay Islet cell viability was determined by colorimetric (3-(4,5-dimethylthiazol-2-yl)-2,5- diphenyltetrazolium bromide assay using CellTiter
Supplementary data Supplementary Figure 1 Supplementary Figure 2
 Supplementary data Supplementary Figure 1 SPHK1 sirna increases RANKL-induced osteoclastogenesis in RAW264.7 cell culture. (A) RAW264.7 cells were transfected with oligocassettes containing SPHK1 sirna
Supplementary Materials
 Supplementary Materials 1 Supplementary Table 1. List of primers used for quantitative PCR analysis. Gene name Gene symbol Accession IDs Sequence range Product Primer sequences size (bp) β-actin Actb gi
Modulation of bone morphogenetic protein signaling in vivo regulates systemic iron balance
 Related Commentary, page 1755 Research article Modulation of bone morphogenetic protein signaling in vivo regulates systemic iron balance Jodie L. Babitt, 1 Franklin W. Huang, 2 Yin Xia, 1 Yisrael Sidis,
General Laboratory methods Plasma analysis: Gene Expression Analysis: Immunoblot analysis: Immunohistochemistry:
 General Laboratory methods Plasma analysis: Plasma insulin (Mercodia, Sweden), leptin (duoset, R&D Systems Europe, Abingdon, United Kingdom), IL-6, TNFα and adiponectin levels (Quantikine kits, R&D Systems
TSH Receptor Monoclonal Antibody (49) Catalog Number MA3-218 Product data sheet
 Catalog Number MA3-218 Product data sheet") Website: thermofisher.com Customer Service (US): 1 800 955 6288 ext. 1 Technical Support (US): 1 800 955 6288 ext. 441 TSH Receptor Monoclonal Antibody (49) Catalog Number MA3-218 Product data sheet Details
Website: thermofisher.com Customer Service (US): 1 800 955 6288 ext. 1 Technical Support (US): 1 800 955 6288 ext. 441 TSH Receptor Monoclonal Antibody (49) Catalog Number MA3-218 Product data sheet Details
Plasmids Western blot analysis and immunostaining Flow Cytometry Cell surface biotinylation RNA isolation and cdna synthesis
 Plasmids psuper-retro-s100a10 shrna1 was constructed by cloning the dsdna oligo 5 -GAT CCC CGT GGG CTT CCA GAG CTT CTT TCA AGA GAA GAA GCT CTG GAA GCC CAC TTT TTA-3 and 5 -AGC TTA AAA AGT GGG CTT CCA GAG
Abbreviations: P- paraffin-embedded section; C, cryosection; Bio-SA, biotin-streptavidin-conjugated fluorescein amplification.
 Supplementary Table 1. Sequence of primers for real time PCR. Gene Forward primer Reverse primer S25 5 -GTG GTC CAC ACT ACT CTC TGA GTT TC-3 5 - GAC TTT CCG GCA TCC TTC TTC-3 Mafa cds 5 -CTT CAG CAA GGA
Toluidin-Staining of mast cells Ear tissue was fixed with Carnoy (60% ethanol, 30% chloroform, 10% acetic acid) overnight at 4 C, afterwards
 overnight at 4 C, afterwards") Toluidin-Staining of mast cells Ear tissue was fixed with Carnoy (60% ethanol, 30% chloroform, 10% acetic acid) overnight at 4 C, afterwards incubated in 100 % ethanol overnight at 4 C and embedded in
Toluidin-Staining of mast cells Ear tissue was fixed with Carnoy (60% ethanol, 30% chloroform, 10% acetic acid) overnight at 4 C, afterwards incubated in 100 % ethanol overnight at 4 C and embedded in
Supplementary Figure 1 a
 Supplementary Figure a Normalized expression/tbp (A.U.).6... Trip-br transcripts Trans Trans Trans b..5. Trip-br Ctrl LPS Normalized expression/tbp (A.U.) c Trip-br transcripts. adipocytes.... Trans Trans
Supplementary Figure 1: si-craf but not si-braf sensitizes tumor cells to radiation.
 Supplementary Figure 1: si-craf but not si-braf sensitizes tumor cells to radiation. (a) Embryonic fibroblasts isolated from wildtype (WT), BRAF -/-, or CRAF -/- mice were irradiated (6 Gy) and DNA damage
a) Primary cultures derived from the pancreas of an 11-week-old Pdx1-Cre; K-MADM-p53
 Primary cultures derived from the pancreas of an 11-week-old Pdx1-Cre; K-MADM-p53") 1 2 3 4 5 6 7 8 9 10 Supplementary Figure 1. Induction of p53 LOH by MADM. a) Primary cultures derived from the pancreas of an 11-week-old Pdx1-Cre; K-MADM-p53 mouse revealed increased p53 KO/KO (green,
1 2 3 4 5 6 7 8 9 10 Supplementary Figure 1. Induction of p53 LOH by MADM. a) Primary cultures derived from the pancreas of an 11-week-old Pdx1-Cre; K-MADM-p53 mouse revealed increased p53 KO/KO (green,
Supplementary Figures
 Supplementary Figures Supplementary Figure 1 Characterization of stable expression of GlucB and sshbira in the CT26 cell line (a) Live cell imaging of stable CT26 cells expressing green fluorescent protein
Supplementary Figures
 Supplementary Figures Supplementary Figure 1. H3F3B expression in lung cancer. a. Comparison of H3F3B expression in relapsed and non-relapsed lung cancer patients. b. Prognosis of two groups of lung cancer
Iron Regulation of Hepcidin Despite Attenuated Smad1,5,8 Signaling in Mice Without Transferrin Receptor 2 or Hfe
 GASTROENTEROLOGY 2011;141:1907 1914 Iron Regulation of Hepcidin Despite Attenuated Smad1,5,8 Signaling in Mice Without Transferrin Receptor 2 or Hfe ELENA CORRADINI,* MOLLY ROZIER, DELPHINE MEYNARD,* ADAM
Anti-Lamin B1/LMNB1 Picoband Antibody
 Anti-Lamin B1/LMNB1 Picoband Antibody Catalog Number:PB9611 About LMNB1 Lamin-B1 is a protein that in humans is encoded by the LMNB1 gene. The nuclear lamina consists of a two-dimensional matrix of proteins
Supplementary Figure 1. Repression of hepcidin expression in the liver of mice treated with
 Supplementary Figure 1. Repression of hepcidin expression in the liver of mice treated with DMN Immunohistochemistry for hepcidin and H&E staining (left). qrt-pcr assays for hepcidin in the liver (right).
Figure S1. Analysis of genomic and cdna sequences of the targeted regions in WT-KI and
 Figure S1. Analysis of genomic and sequences of the targeted regions in and indicated mutant KI cells, with WT and corresponding mutant sequences underlined. (A) cells; (B) K21E-KI cells; (C) D33A-KI cells;
MicroRNA sponges: competitive inhibitors of small RNAs in mammalian cells
 MicroRNA sponges: competitive inhibitors of small RNAs in mammalian cells Margaret S Ebert, Joel R Neilson & Phillip A Sharp Supplementary figures and text: Supplementary Figure 1. Effect of sponges on
Supplementary Table 3. 3 UTR primer sequences. Primer sequences used to amplify and clone the 3 UTR of each indicated gene are listed.
 Supplemental Figure 1. DLKI-DIO3 mirna/mrna complementarity. Complementarity between the indicated DLK1-DIO3 cluster mirnas and the UTR of SOX2, SOX9, HIF1A, ZEB1, ZEB2, STAT3 and CDH1with mirsvr and PhastCons
The Interaction of Alcohol and Iron-Overload in the in-vivo Regulation of Iron Responsive Genes
 Cantaurus, Vol. 5, -, May 7 McPherson College Division of Science and Technology The Interaction of Alcohol and Iron-Overload in the in-vivo Regulation of Iron Responsive Genes Callie Crist, Elizabeth
SUPPLEMENTARY INFORMATION
 SUPPLEMENTARY INFORMATION FOR Liver X Receptor α mediates hepatic triglyceride accumulation through upregulation of G0/G1 Switch Gene 2 (G0S2) expression I: SUPPLEMENTARY METHODS II: SUPPLEMENTARY FIGURES
Supplementary Figure 1 MicroRNA expression in human synovial fibroblasts from different locations. MicroRNA, which were identified by RNAseq as most
 Supplementary Figure 1 MicroRNA expression in human synovial fibroblasts from different locations. MicroRNA, which were identified by RNAseq as most differentially expressed between human synovial fibroblasts
SUPPLEMENTARY DATA. Supplementary Table 1. Primer sequences for qrt-pcr
 Supplementary Table 1. Primer sequences for qrt-pcr Gene PRDM16 UCP1 PGC1α Dio2 Elovl3 Cidea Cox8b PPARγ AP2 mttfam CyCs Nampt NRF1 16s-rRNA Hexokinase 2, intron 9 β-actin Primer Sequences 5'-CCA CCA GCG
TFEB-mediated increase in peripheral lysosomes regulates. Store Operated Calcium Entry
 TFEB-mediated increase in peripheral lysosomes regulates Store Operated Calcium Entry Luigi Sbano, Massimo Bonora, Saverio Marchi, Federica Baldassari, Diego L. Medina, Andrea Ballabio, Carlotta Giorgi
marker. DAPI labels nuclei. Flies were 20 days old. Scale bar is 5 µm. Ctrl is
 Supplementary Figure 1. (a) Nos is detected in glial cells in both control and GFAP R79H transgenic flies (arrows), but not in deletion mutant Nos Δ15 animals. Repo is a glial cell marker. DAPI labels
Supplementary Table 2. Conserved regulatory elements in the promoters of CD36.
 Supplementary Table 1. RT-qPCR primers for CD3, PPARg and CEBP. Assay Forward Primer Reverse Primer 1A CAT TTG TGG CCT TGT GCT CTT TGA TGA GTC ACA GAA AGA ATC AAT TC 1B AGG AAA TGA ACT GAT GAG TCA CAG
Supplemental Data. Shin et al. Plant Cell. (2012) /tpc YFP N
 /tpc YFP N") MYC YFP N PIF5 YFP C N-TIC TIC Supplemental Data. Shin et al. Plant Cell. ()..5/tpc..95 Supplemental Figure. TIC interacts with MYC in the nucleus. Bimolecular fluorescence complementation assay using
MYC YFP N PIF5 YFP C N-TIC TIC Supplemental Data. Shin et al. Plant Cell. ()..5/tpc..95 Supplemental Figure. TIC interacts with MYC in the nucleus. Bimolecular fluorescence complementation assay using
Supplementary Figure 1 IMQ-Induced Mouse Model of Psoriasis. IMQ cream was
 Supplementary Figure 1 IMQ-Induced Mouse Model of Psoriasis. IMQ cream was painted on the shaved back skin of CBL/J and BALB/c mice for consecutive days. (a, b) Phenotypic presentation of mouse back skin
VEGFR2-Mediated Vascular Dilation as a Mechanism of VEGF-Induced Anemia and Bone Marrow Cell Mobilization
 Cell Reports, Volume 9 Supplemental Information VEGFR2-Mediated Vascular Dilation as a Mechanism of VEGF-Induced Anemia and Bone Marrow Cell Mobilization Sharon Lim, Yin Zhang, Danfang Zhang, Fang Chen,
condition. Left panel, the HCT-116 cells were lysed with RIPA buffer containing 0.1%
 FIGURE LEGENDS Supplementary Fig 1 (A) sumoylation pattern detected under denaturing condition. Left panel, the HCT-116 cells were lysed with RIPA buffer containing 0.1% SDS in the presence and absence
Supplementary Figure 1
 Supplementary Figure 1 Supplementary Figure 1: Cryopreservation alters CD62L expression by CD4 T cells. Freshly isolated (left) or cryopreserved PBMCs (right) were stained with the mix of antibodies described
Supplementary Appendix
 Supplementary Appendix This appendix has been provided by the authors to give readers additional information about their work. Supplement to: Sherman SI, Wirth LJ, Droz J-P, et al. Motesanib diphosphate
The liver hormone hepcidin is a main regulator
 Serum and Liver Iron Differently Regulate the Bone Morphogenetic Protein 6 (BMP6)-SMAD Signaling Pathway in Mice Elena Corradini, 1,2 Delphine Meynard, 1 Qifang Wu, 1 Shan Chen, 1 Paolo Ventura, 2 Antonello
Phylogenetic analysis of human and chicken importins. Only five of six importins were studied because
 Supplementary Figure S1 Phylogenetic analysis of human and chicken importins. Only five of six importins were studied because importin-α6 was shown to be testis-specific. Human and chicken importin protein
Supplementary Document
 Supplementary Document 1. Supplementary Table legends 2. Supplementary Figure legends 3. Supplementary Tables 4. Supplementary Figures 5. Supplementary References 1. Supplementary Table legends Suppl.
c Tuj1(-) apoptotic live 1 DIV 2 DIV 1 DIV 2 DIV Tuj1(+) Tuj1/GFP/DAPI Tuj1 DAPI GFP
 apoptotic live 1 DIV 2 DIV 1 DIV 2 DIV Tuj1(+) Tuj1/GFP/DAPI Tuj1 DAPI GFP") Supplementary Figure 1 Establishment of the gain- and loss-of-function experiments and cell survival assays. a Relative expression of mature mir-484 30 20 10 0 **** **** NCP mir- 484P NCP mir- 484P b Relative
Supplementary Figure 1 Establishment of the gain- and loss-of-function experiments and cell survival assays. a Relative expression of mature mir-484 30 20 10 0 **** **** NCP mir- 484P NCP mir- 484P b Relative
Systemic iron homeostasis is dependent on the hepatic
 LIVER BIOLOGY/PATHOBIOLOGY Evidence for Distinct Pathways of Hepcidin Regulation by Acute and Chronic Iron Loading in Mice Emilio Ramos, 1 Léon Kautz, 4,5 Richard Rodriguez, 2 Michael Hansen, 2 Victoria
Supporting Information. Supporting Tables. S-Table 1 Primer pairs for RT-PCR. Product size. Gene Primer pairs
 Supporting Information Supporting Tables S-Table 1 Primer pairs for RT-PCR. Gene Primer pairs Product size (bp) FAS F: 5 TCTTGGAAGCGATGGGTA 3 429 R: 5 GGGATGTATCATTCTTGGAC 3 SREBP-1c F: 5 CGCTACCGTTCCTCTATCA
Supplementary Information
 Supplementary Information Supplementary Figure 1. CD4 + T cell activation and lack of apoptosis after crosslinking with anti-cd3 + anti-cd28 + anti-cd160. (a) Flow cytometry of anti-cd160 (5D.10A11) binding
Description of Supplementary Files. File Name: Supplementary Information Description: Supplementary Figures and Supplementary Tables
 Description of Supplementary Files File Name: Supplementary Information Description: Supplementary Figures and Supplementary Tables Supplementary Figure 1: (A), HCT116 IDH1-WT and IDH1-R132H cells were
Supplementary Figure 1
 Supplementary Figure 1 3 3 3 1 1 Bregma -1.6mm 3 : Bregma Ref) Http://www.mbl.org/atlas165/atlas165_start.html Bregma -.18mm Supplementary Figure 1 Schematic representation of the utilized brain slice
A Hepatocyte Growth Factor Receptor (Met) Insulin Receptor hybrid governs hepatic glucose metabolism SUPPLEMENTARY FIGURES, LEGENDS AND METHODS
 Insulin Receptor hybrid governs hepatic glucose metabolism SUPPLEMENTARY FIGURES, LEGENDS AND METHODS") A Hepatocyte Growth Factor Receptor (Met) Insulin Receptor hybrid governs hepatic glucose metabolism Arlee Fafalios, Jihong Ma, Xinping Tan, John Stoops, Jianhua Luo, Marie C. DeFrances and Reza Zarnegar
A Hepatocyte Growth Factor Receptor (Met) Insulin Receptor hybrid governs hepatic glucose metabolism Arlee Fafalios, Jihong Ma, Xinping Tan, John Stoops, Jianhua Luo, Marie C. DeFrances and Reza Zarnegar
Supplementary Figure S I: Effects of D4F on body weight and serum lipids in apoe -/- mice.
 Supplementary Figures: Supplementary Figure S I: Effects of D4F on body weight and serum lipids in apoe -/- mice. Male apoe -/- mice were fed a high-fat diet for 8 weeks, and given PBS (model group) or
Supporting Information
 Supporting Information Franco et al. 10.1073/pnas.1015557108 SI Materials and Methods Drug Administration. PD352901 was dissolved in 0.5% (wt/vol) hydroxyl-propyl-methylcellulose, 0.2% (vol/vol) Tween
Protocol for Gene Transfection & Western Blotting
 The schedule and the manual of basic techniques for cell culture Advanced Protocol for Gene Transfection & Western Blotting Schedule Day 1 26/07/2008 Transfection Day 3 28/07/2008 Cell lysis Immunoprecipitation
Supplementary Figure 1. ROS induces rapid Sod1 nuclear localization in a dosagedependent manner. WT yeast cells (SZy1051) were treated with 4NQO at
 were treated with 4NQO at") Supplementary Figure 1. ROS induces rapid Sod1 nuclear localization in a dosagedependent manner. WT yeast cells (SZy1051) were treated with 4NQO at different concentrations for 30 min and analyzed for
Supplementary Figure 1. ROS induces rapid Sod1 nuclear localization in a dosagedependent manner. WT yeast cells (SZy1051) were treated with 4NQO at different concentrations for 30 min and analyzed for
An epithelial circadian clock controls pulmonary inflammation and glucocorticoid action
 An epithelial circadian clock controls pulmonary inflammation and glucocorticoid action Supplementary Figure : Expression levels of toll-like receptor 4 (Tlr4) in muse lung does not change throughout the
without LOI phenotype by breeding female wild-type C57BL/6J and male H19 +/.
 Sakatani et al. 1 Supporting Online Material Materials and methods Mice and genotyping: H19 mutant mice with C57BL/6J background carrying a deletion in the structural H19 gene (3 kb) and 10 kb of 5 flanking
Formylpeptide receptor2 contributes to colon epithelial homeostasis, inflammation, and tumorigenesis
 Supplementary Data Formylpeptide receptor2 contributes to colon epithelial homeostasis, inflammation, and tumorigenesis Keqiang Chen, Mingyong Liu, Ying Liu, Teizo Yoshimura, Wei Shen, Yingying Le, Scott
Supplementary Figure 1
 Supplementary Figure 1 a Percent of body weight! (%) 4! 3! 1! Epididymal fat Subcutaneous fat Liver SD Percent of body weight! (%) ** 3! 1! SD Percent of body weight! (%) 6! 4! SD ** b Blood glucose (mg/dl)!
Nature Structural & Molecular Biology: doi: /nsmb Supplementary Figure 1
 Supplementary Figure 1 U1 inhibition causes a shift of RNA-seq reads from exons to introns. (a) Evidence for the high purity of 4-shU-labeled RNAs used for RNA-seq. HeLa cells transfected with control
Figure S1. Body composition, energy homeostasis and substrate utilization in LRH-1 hep+/+ (white bars) and LRH-1 hep-/- (black bars) mice.
 and LRH-1 hep-/- (black bars) mice.") Figure S1. Body composition, energy homeostasis and substrate utilization in LRH-1 hep+/+ (white bars) and LRH-1 hep-/- (black bars) mice. (A) Lean and fat masses, determined by EchoMRI. (B) Food and water
Figure S1. Body composition, energy homeostasis and substrate utilization in LRH-1 hep+/+ (white bars) and LRH-1 hep-/- (black bars) mice. (A) Lean and fat masses, determined by EchoMRI. (B) Food and water
3) The sheer number of and inconsistency between different animal models used make the paper difficult to follow and may impact data interpretation:
 The sheer number of and inconsistency between different animal models used make the paper difficult to follow and may impact data interpretation:") Reviewers' comments: Reviewer #1 (Remarks to the Author): In this manuscript, Pasricha et al. show that iron deficiency (ID) and stimulated erythropoiesis suppress hepcidin via distinct processes. They
Reviewers' comments: Reviewer #1 (Remarks to the Author): In this manuscript, Pasricha et al. show that iron deficiency (ID) and stimulated erythropoiesis suppress hepcidin via distinct processes. They
Supplementary Figure 1. ETBF activate Stat3 in B6 and Min mice colons
 Supplementary Figure 1 ETBF activate Stat3 in B6 and Min mice colons a pstat3 controls Pos Neg ETBF 1 2 3 4 b pstat1 pstat2 pstat3 pstat4 pstat5 pstat6 Actin Figure Legend: (a) ETBF induce predominantly
MTC-TT and TPC-1 cell lines were cultured in RPMI medium (Gibco, Breda, The Netherlands)
") Supplemental data Materials and Methods Cell culture MTC-TT and TPC-1 cell lines were cultured in RPMI medium (Gibco, Breda, The Netherlands) supplemented with 15% or 10% (for TPC-1) fetal bovine serum
Supplemental data Materials and Methods Cell culture MTC-TT and TPC-1 cell lines were cultured in RPMI medium (Gibco, Breda, The Netherlands) supplemented with 15% or 10% (for TPC-1) fetal bovine serum
Supplementary Materials and Methods
 Supplementary Materials and Methods Immunoblotting Immunoblot analysis was performed as described previously (1). Due to high-molecular weight of MUC4 (~ 950 kda) and MUC1 (~ 250 kda) proteins, electrophoresis
ZL ZDF ZDF + E2 *** Visceral (g) ZDF
 ZDF") Body Weight (g) 4 3 2 1 ** * ZL ZDF 6 8 1 12 14 16 Age (weeks) B * Sub-cutaneous (g) 16 12 8 4 ZL ZDF Visceral (g) 25 2 15 1 5 ZL ZDF Total fat pad weight (g) 4 3 2 1 ZDF ZL Supplemental Figure 1: Effect
Body Weight (g) 4 3 2 1 ** * ZL ZDF 6 8 1 12 14 16 Age (weeks) B * Sub-cutaneous (g) 16 12 8 4 ZL ZDF Visceral (g) 25 2 15 1 5 ZL ZDF Total fat pad weight (g) 4 3 2 1 ZDF ZL Supplemental Figure 1: Effect
CHAPTER 4 RESULTS. showed that all three replicates had similar growth trends (Figure 4.1) (p<0.05; p=0.0000)
 (p<0.05; p=0.0000)") CHAPTER 4 RESULTS 4.1 Growth Characterization of C. vulgaris 4.1.1 Optical Density Growth study of Chlorella vulgaris based on optical density at 620 nm (OD 620 ) showed that all three replicates had similar
CHAPTER 4 RESULTS 4.1 Growth Characterization of C. vulgaris 4.1.1 Optical Density Growth study of Chlorella vulgaris based on optical density at 620 nm (OD 620 ) showed that all three replicates had similar
HCC1937 is the HCC1937-pcDNA3 cell line, which was derived from a breast cancer with a mutation
 SUPPLEMENTARY INFORMATION Materials and Methods Human cell lines and culture conditions HCC1937 is the HCC1937-pcDNA3 cell line, which was derived from a breast cancer with a mutation in exon 20 of BRCA1
ECL Plex Western Blotting Detection System
 Part of GE Healthcare Data File 28-415-39 AA ECL Plex Western Blotting Detection System Multiplex protein detection based on direct fluorescent CyDye-labeled conjugates ECL Plex fluorescent Western blotting
Supplementary Table 1. The primers used for quantitative RT-PCR. Gene name Forward (5 > 3 ) Reverse (5 > 3 )
 Reverse (5 > 3 )") 770 771 Supplementary Table 1. The primers used for quantitative RT-PCR. Gene name Forward (5 > 3 ) Reverse (5 > 3 ) Human CXCL1 GCGCCCAAACCGAAGTCATA ATGGGGGATGCAGGATTGAG PF4 CCCCACTGCCCAACTGATAG TTCTTGTACAGCGGGGCTTG
770 771 Supplementary Table 1. The primers used for quantitative RT-PCR. Gene name Forward (5 > 3 ) Reverse (5 > 3 ) Human CXCL1 GCGCCCAAACCGAAGTCATA ATGGGGGATGCAGGATTGAG PF4 CCCCACTGCCCAACTGATAG TTCTTGTACAGCGGGGCTTG
Dissected tissues were minced and lysed in lysis buffer (1x Tris buffered saline (TBS), 1% NP-40,
, 1% NP-40,") Data Supplement for Dincheva et al., Effect of Early-Life Fluoxetine on Anxiety-Like Behaviors in BDNF Val66Met Mice. Am J Psychiatry (doi: 10.1176/appi.ajp.2017.15121592) Contents Supplemental Methods
Data Supplement for Dincheva et al., Effect of Early-Life Fluoxetine on Anxiety-Like Behaviors in BDNF Val66Met Mice. Am J Psychiatry (doi: 10.1176/appi.ajp.2017.15121592) Contents Supplemental Methods
Nature Medicine: doi: /nm.3922
 Title: Glucocorticoid-induced tumor necrosis factor receptor-related protein co-stimulation facilitates tumor regression by inducing IL-9-producing helper T cells Authors: Il-Kyu Kim, Byung-Seok Kim, Choong-Hyun
(A) PCR primers (arrows) designed to distinguish wild type (P1+P2), targeted (P1+P2) and excised (P1+P3)14-
 PCR primers (arrows) designed to distinguish wild type (P1+P2), targeted (P1+P2) and excised (P1+P3)14-") 1 Supplemental Figure Legends Figure S1. Mammary tumors of ErbB2 KI mice with 14-3-3σ ablation have elevated ErbB2 transcript levels and cell proliferation (A) PCR primers (arrows) designed to distinguish
1 Supplemental Figure Legends Figure S1. Mammary tumors of ErbB2 KI mice with 14-3-3σ ablation have elevated ErbB2 transcript levels and cell proliferation (A) PCR primers (arrows) designed to distinguish
Gallic acid prevents isoproterenol-induced cardiac hypertrophy and fibrosis through regulation of JNK2 signaling and Smad3 binding activity
 Gallic acid prevents isoproterenol-induced cardiac hypertrophy and fibrosis through regulation of JNK2 signaling and Smad3 binding activity Yuhee Ryu 1,+, Li Jin 1,2+, Hae Jin Kee 1,, Zhe Hao Piao 3, Jae
Supplementary Fig. 1 No relative growth advantage of Foxp3 negative cells.
 Supplementary Fig. 1 Supplementary Figure S1: No relative growth advantage of Foxp3 negative cells. itreg were induced from WT (A) or FIR (B) CD4 + T cells. FIR itregs were then removed from the TCR signal
Supplementary Figure 1
 Metastatic melanoma Primary melanoma Healthy human skin Supplementary Figure 1 CD22 IgG4 Supplementary Figure 1: Immunohisochemical analysis of CD22+ (left) and IgG4 (right), cells (shown in red and indicated
SUPPLEMENTARY FIGURES
 SUPPLEMENTARY FIGURES 1 Supplementary Figure 1, Adult hippocampal QNPs and TAPs uniformly express REST a-b) Confocal images of adult hippocampal mouse sections showing GFAP (green), Sox2 (red), and REST
Supplementary Figure 1. Expression of CUGBP1 in non-parenchymal liver cells treated with TGF-β
 Supplementary Figures Supplementary Figure 1. Expression of CUGBP1 in non-parenchymal liver cells treated with TGF-β and LPS. Non-parenchymal liver cells were isolated and treated with or without TGF-β
BHP 2-7 and Nthy-ori 3-1 cells were grown in RPMI1640 medium (Hyclone) supplemented with 10% fetal bovine serum (Gibco), 2mM L-glutamine, and 100 U/mL
 supplemented with 10% fetal bovine serum (Gibco), 2mM L-glutamine, and 100 U/mL") 1 2 3 4 Materials and Methods Cell culture BHP 2-7 and Nthy-ori 3-1 cells were grown in RPMI1640 medium (Hyclone) 5 supplemented with 10% fetal bovine serum (Gibco), 2mM L-glutamine, and 100 U/mL 6 penicillin-streptomycin.
1 2 3 4 Materials and Methods Cell culture BHP 2-7 and Nthy-ori 3-1 cells were grown in RPMI1640 medium (Hyclone) 5 supplemented with 10% fetal bovine serum (Gibco), 2mM L-glutamine, and 100 U/mL 6 penicillin-streptomycin.
SUPPLEMENTARY FIGURES AND TABLE
 SUPPLEMENTARY FIGURES AND TABLE Supplementary Figure S1: Characterization of IRE1α mutants. A. U87-LUC cells were transduced with the lentiviral vector containing the GFP sequence (U87-LUC Tet-ON GFP).
Supporting Information Table of Contents
 Supporting Information Table of Contents Supporting Information Figure 1 Page 2 Supporting Information Figure 2 Page 4 Supporting Information Figure 3 Page 5 Supporting Information Figure 4 Page 6 Supporting
SUPPLEMENTARY INFORMATION
 doi: 10.1038/nature05883 SUPPLEMENTARY INFORMATION Supplemental Figure 1 Prostaglandin agonists and antagonists alter runx1/cmyb expression. a-e, Embryos were exposed to (b) PGE2 and (c) PGI2 (20μM) and
The Harvard community has made this article openly available. Please share how this access benefits you. Your story matters.
 Combination therapy with a Tmprss6 RNAi-therapeutic and the oral iron chelator deferiprone additively diminishes secondary iron overload in a mouse model of β-thalassemia intermedia The Harvard community
A smart acid nanosystem for ultrasensitive. live cell mrna imaging by the target-triggered intracellular self-assembly
 Electronic Supplementary Material (ESI) for Chemical Science. This journal is The Royal Society of Chemistry 2017 A smart ZnO@polydopamine-nucleic acid nanosystem for ultrasensitive live cell mrna imaging
Supplemental Information
 Supplemental Information Tobacco-specific Carcinogen Induces DNA Methyltransferases 1 Accumulation through AKT/GSK3β/βTrCP/hnRNP-U in Mice and Lung Cancer patients Ruo-Kai Lin, 1 Yi-Shuan Hsieh, 2 Pinpin
The Schedule and the Manual of Basic Techniques for Cell Culture
 The Schedule and the Manual of Basic Techniques for Cell Culture 1 Materials Calcium Phosphate Transfection Kit: Invitrogen Cat.No.K2780-01 Falcon tube (Cat No.35-2054:12 x 75 mm, 5 ml tube) Cell: 293
Figure S1. Sorting nexin 9 (SNX9) specifically binds psmad3 and not psmad 1/5/8. Lysates from AKR-2B cells untreated (-) or stimulated (+) for 45 min
 specifically binds psmad3 and not psmad 1/5/8. Lysates from AKR-2B cells untreated (-) or stimulated (+) for 45 min") Figure S1. Sorting nexin 9 (SNX9) specifically binds psmad3 and not psmad 1/5/8. Lysates from AKR2B cells untreated () or stimulated () for 45 min with 5 ng/ml TGFβ or 10 ng/ml BMP4 were incubated with
Figure S1. Sorting nexin 9 (SNX9) specifically binds psmad3 and not psmad 1/5/8. Lysates from AKR2B cells untreated () or stimulated () for 45 min with 5 ng/ml TGFβ or 10 ng/ml BMP4 were incubated with
Supplementary Figures
 Supplementary Figures Supplementary Figure 1. Confirmation of Dnmt1 conditional knockout out mice. a, Representative images of sorted stem (Lin - CD49f high CD24 + ), luminal (Lin - CD49f low CD24 + )
OxiSelect Malondialdehyde (MDA) Immunoblot Kit
 Immunoblot Kit") Product Manual OxiSelect Malondialdehyde (MDA) Immunoblot Kit Catalog Number STA- 331 10 blots FOR RESEARCH USE ONLY Not for use in diagnostic procedures Introduction Lipid peroxidation is a well-defined
Product Manual OxiSelect Malondialdehyde (MDA) Immunoblot Kit Catalog Number STA- 331 10 blots FOR RESEARCH USE ONLY Not for use in diagnostic procedures Introduction Lipid peroxidation is a well-defined
Supplementary Figure S1. Flow cytometric analysis of the expression of Thy1 in NH cells. Flow cytometric analysis of the expression of T1/ST2 and
 Supplementary Figure S1. Flow cytometric analysis of the expression of Thy1 in NH cells. Flow cytometric analysis of the expression of T1/ST2 and Thy1 in NH cells derived from the lungs of naïve mice.
Males- Western Diet WT KO Age (wks) Females- Western Diet WT KO Age (wks)
 Females- Western Diet WT KO Age (wks)") Relative Arv1 mrna Adrenal 33.48 +/- 6.2 Skeletal Muscle 22.4 +/- 4.93 Liver 6.41 +/- 1.48 Heart 5.1 +/- 2.3 Brain 4.98 +/- 2.11 Ovary 4.68 +/- 2.21 Kidney 3.98 +/-.39 Lung 2.15 +/-.6 Inguinal Subcutaneous
Relative Arv1 mrna Adrenal 33.48 +/- 6.2 Skeletal Muscle 22.4 +/- 4.93 Liver 6.41 +/- 1.48 Heart 5.1 +/- 2.3 Brain 4.98 +/- 2.11 Ovary 4.68 +/- 2.21 Kidney 3.98 +/-.39 Lung 2.15 +/-.6 Inguinal Subcutaneous
Proposal form for the evaluation of a genetic test for NHS Service Gene Dossier
 Proposal form for the evaluation of a genetic test for NHS Service Gene Dossier Test Disease Population Triad Disease name HEMOCHROMATOSIS, TYPE 4; HFE4 OMIM number for disease #606069 Disease alternative
Online Appendix Material and Methods: Pancreatic RNA isolation and quantitative real-time (q)rt-pcr. Mice were fasted overnight and killed 1 hour (h)
rt-pcr. Mice were fasted overnight and killed 1 hour (h)") Online Appendix Material and Methods: Pancreatic RNA isolation and quantitative real-time (q)rt-pcr. Mice were fasted overnight and killed 1 hour (h) after feeding. A small slice (~5-1 mm 3 ) was taken
Online Appendix Material and Methods: Pancreatic RNA isolation and quantitative real-time (q)rt-pcr. Mice were fasted overnight and killed 1 hour (h) after feeding. A small slice (~5-1 mm 3 ) was taken
Supplemental Figure 1 ELISA scheme to measure plasma total, mature and furin-cleaved
 1 Supplemental Figure Legends Supplemental Figure 1 ELISA scheme to measure plasma total, mature and furin-cleaved PCSK9 concentrations. 4 Plasma mature and furin-cleaved PCSK9s were measured by a sandwich
Programmed necrosis, not apoptosis, is a key mediator of cell loss and DAMP-mediated inflammation in dsrna-induced retinal degeneration
 Programmed necrosis, not apoptosis, is a key mediator of cell loss and DAMP-mediated inflammation in dsrna-induced retinal degeneration The Harvard community has made this article openly available. Please
Supplementary Materials and Methods
 Supplementary Materials and Methods Hepatocyte toxicity assay. Freshly isolated hepatocytes were incubated for overnight with varying concentrations (-25 µm) of sodium glycochenodeoxycholate (GCDC) or
Supplementary Figure 1
 Combination index (CI) Supplementary Figure 1 2. 1.5 1. Ishikawa AN3CA Nou-1 Hec-18.5...2.4.6.8 1. Fraction affected (Fa) Supplementary Figure 1. The synergistic effect of PARP inhibitor and PI3K inhibitor
Supplementary Figure S1. Venn diagram analysis of mrna microarray data and mirna target analysis. (a) Western blot analysis of T lymphoblasts (CLS)
 Western blot analysis of T lymphoblasts (CLS)") Supplementary Figure S1. Venn diagram analysis of mrna microarray data and mirna target analysis. (a) Western blot analysis of T lymphoblasts (CLS) and their exosomes (EXO) in resting (REST) and activated
Supplementary Figure S1. Venn diagram analysis of mrna microarray data and mirna target analysis. (a) Western blot analysis of T lymphoblasts (CLS) and their exosomes (EXO) in resting (REST) and activated
B. SDS-PAGE. Western blot MW (kda) Supplementary Information. Supplementary Figure 1. MW (kda) Glutelin. Prolamin. 3 E.coli. 3 E.
 Supplementary Information. Supplementary Figure 1. MW (kda) Glutelin. Prolamin. 3 E.coli. 3 E.") Supplementary Information Supplementary Figure 1. A. MW (kda) B. SDS-PAGE Western blot MW (kda) 50 40 100 75 50 37 30 Glutelin 25 20 15 20 Prolamin 10 ARP1 1 2 3 E.coli MucoRice ARP1 (RNAi +) 4 5 ARP1
Supplementary Information Supplementary Figure 1. A. MW (kda) B. SDS-PAGE Western blot MW (kda) 50 40 100 75 50 37 30 Glutelin 25 20 15 20 Prolamin 10 ARP1 1 2 3 E.coli MucoRice ARP1 (RNAi +) 4 5 ARP1
Supplemental Figure 1
 Supplemental Figure 1 1a 1c PD-1 MFI fold change 6 5 4 3 2 1 IL-1α IL-2 IL-4 IL-6 IL-1 IL-12 IL-13 IL-15 IL-17 IL-18 IL-21 IL-23 IFN-α Mut Human PD-1 promoter SBE-D 5 -GTCTG- -1.2kb SBE-P -CAGAC- -1.kb
") Supplementary Figure 1 (Mu) SBP (mmhg) 2 18 16 p
Supplementary Figure 1 (Mu) SBP (mmhg) 2 18 16 p Primer sequences Target Sequence F Sequence R TNF-α (Tnfa) TCAGCCGATTTGCTATCTCAT A
 TCAGCCGATTTGCTATCTCAT A") Supplementary Table 1. Q- and RT-PR primers used in this study. Primer sequences Target Sequence F Sequence R TNF-α (Tnfa) TGGTTTGTTTT GTTTGGGGTTG T hemokine (- motif) ligand 5 (cl5) GTGTTTGTTT TGGTGGTG
Supplementary Table 1. Q- and RT-PR primers used in this study. Primer sequences Target Sequence F Sequence R TNF-α (Tnfa) TGGTTTGTTTT GTTTGGGGTTG T hemokine (- motif) ligand 5 (cl5) GTGTTTGTTT TGGTGGTG
(a) Schematic diagram of the FS mutation of UVRAG in exon 8 containing the highly instable
 Schematic diagram of the FS mutation of UVRAG in exon 8 containing the highly instable") Supplementary Figure 1. Frameshift (FS) mutation in UVRAG. (a) Schematic diagram of the FS mutation of UVRAG in exon 8 containing the highly instable A 10 DNA repeat, generating a premature stop codon
Supplementary Figure 1. Frameshift (FS) mutation in UVRAG. (a) Schematic diagram of the FS mutation of UVRAG in exon 8 containing the highly instable A 10 DNA repeat, generating a premature stop codon
Protein MultiColor Stable, Low Range
 Product Name: DynaMarker Protein MultiColor Stable, Low Range Code No: DM670L Lot No: ******* Size: 200 μl x 3 (DM670 x 3) (120 mini-gel lanes) Storage: 4 C Stability: 12 months at 4 C Storage Buffer:
Supplementary fig. 1. Crystals induce necroptosis does not involve caspases, TNF receptor or NLRP3. A. Mouse tubular epithelial cells were pretreated
 Supplementary fig. 1. Crystals induce necroptosis does not involve caspases, TNF receptor or NLRP3. A. Mouse tubular epithelial cells were pretreated with zvad-fmk (10µM) and exposed to calcium oxalate