A toolbox of Cre-dependent optogenetic transgenic mice for light-induced activation and silencing
|
|
|
- Archibald O’Brien’
- 5 years ago
- Views:
Transcription
1 A toolox of Cre-dependent optogenetic transgenic mice for light-induced activation and silencing Linda Madisen 1, Tianyi Mao 2,7, Henner Koch 3, Jia-min Zhuo, Antal Berenyi 5, Shigeyoshi Fujisawa 5, Yun-Wei A. Hsu 3, Alfredo J. Garcia III 3, Xuan Gu, Seastien Zanella 3, Jolene Kidney 1, Hong Gu 1, Yimei Mao, Bryan M. Hooks 2, Edward S. Boyden 6, György Buzsáki 5, Jan Marino Ramirez 3, Allan R. Jones 1, Karel Svooda 2, Xue Han, Eric E. Turner 3, Hongkui Zeng 1 * Supplementary Information Supplementary Figure 1. Baseline fluorescence level in the reporter lines in the asence of Cre, as well as Cre-induced transgene expression in Pval-IRES-Cre. (a) No aseline fluorescence aove ackground in Ai27, Ai32, Ai35 and Ai39 reporter mice alone (without Cre induction). Areas shown: first row, cortex; second row, hippocampus; third row, striatum and thalamus. Scale ar, 2 µm. Bottom row shows confocal images of the CA1 pyramidal neurons. Scale ar, 2 µm. () Confocal images in the cortex showing Cre-induced transgene expression at native fluorescence level in Pval+ neurons in Pval-IRES-Cre;Ai27, Pval-IRES-Cre;Ai32, Pval- IRES-Cre;Ai35, Pval-IRES-Cre;Ai39 mice. White arrowheads point to ring-shaped cell odies with no intracellular aggregates, indicating protein localization to the cell memrane and processes. Scale ar, 2 µm. Both ChR2-EYFP in Ai32 and Arch-EGFP-ER2 in Ai35 exhiit strong fluorescence, indicating they have high-level protein expression. Strong fluorescence for ChR2-tdTomato in Ai27 was also oserved, however, ecause of the fast leaching of tdtomato under confocal microscope, the ChR2-tdTomato fluorescence does not appear to e prominent in the image shown. On the other hand, enphr3.-eyfp in Ai39 exhiits significantly weaker fluorescence, indicating lower-level protein expression. Nature Neuroscience: doi:1.13/nn.37
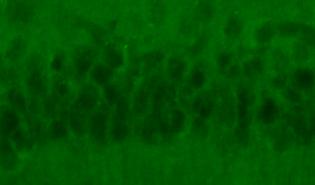
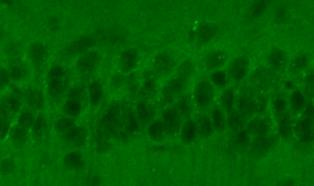
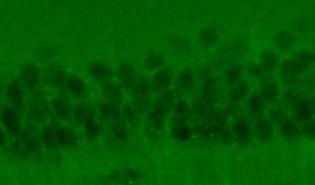
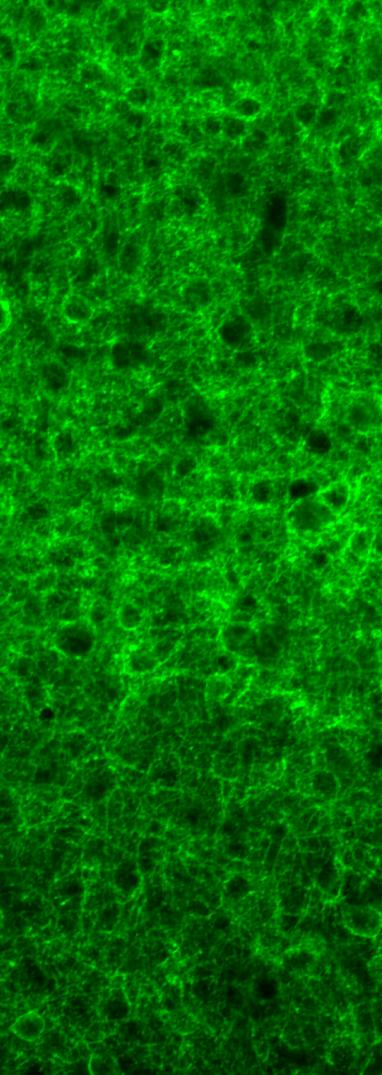
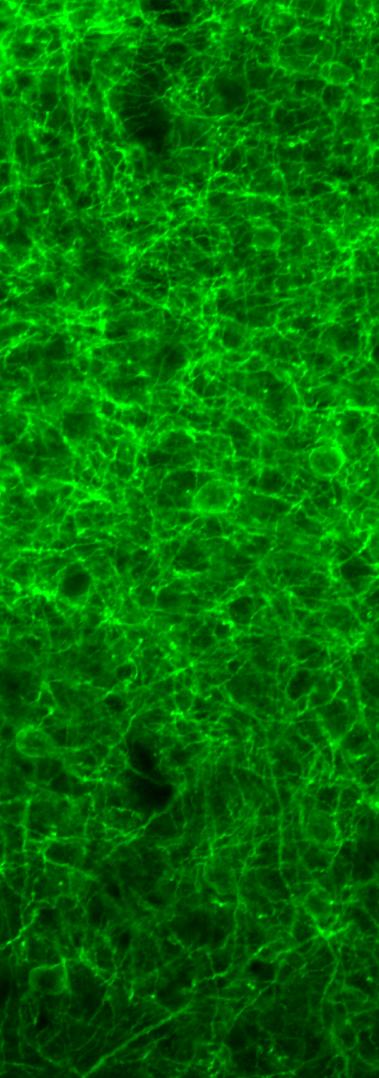
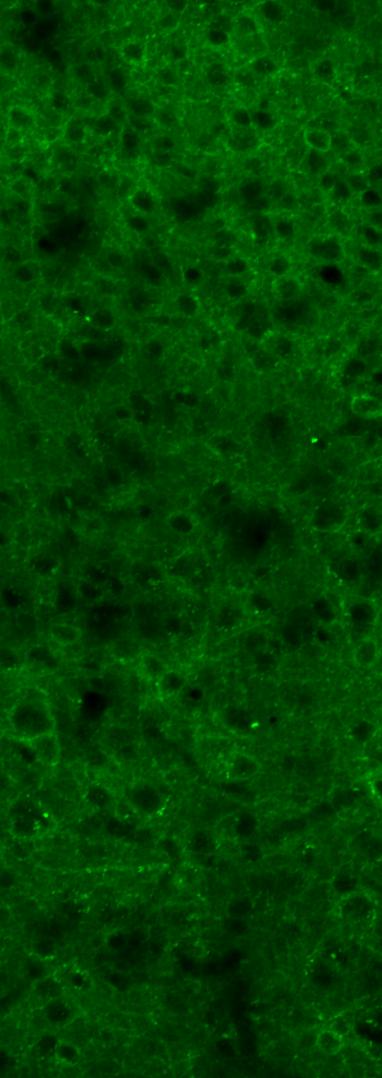
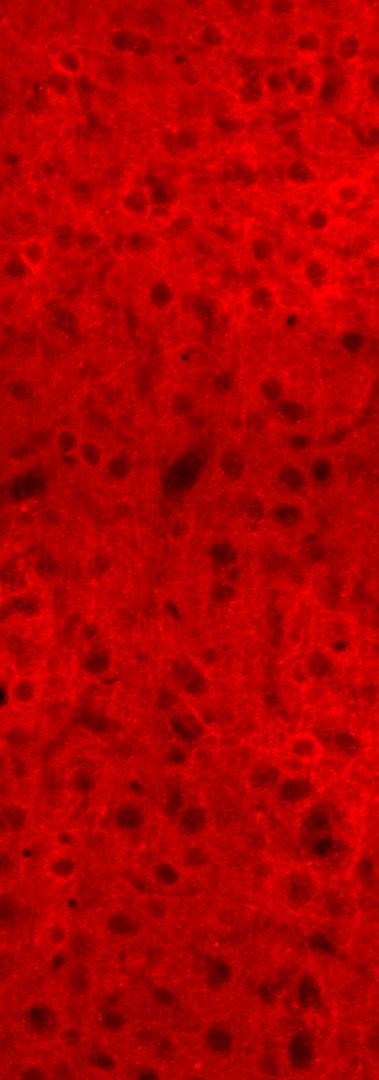
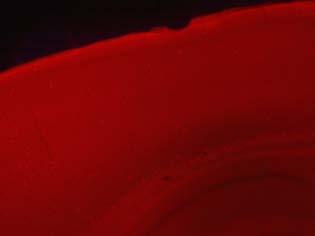
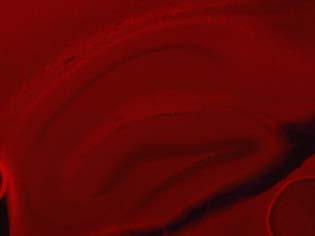
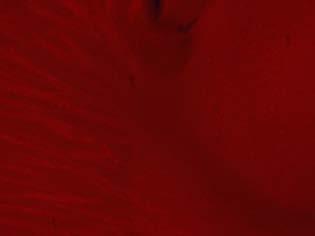
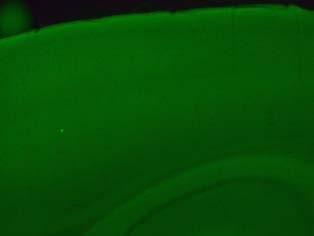
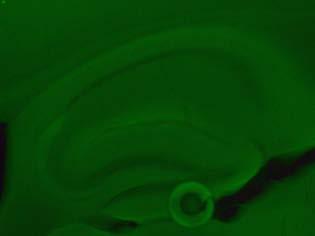
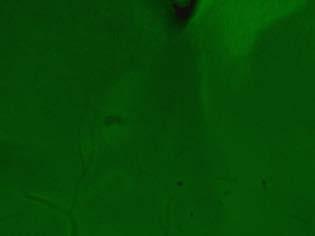
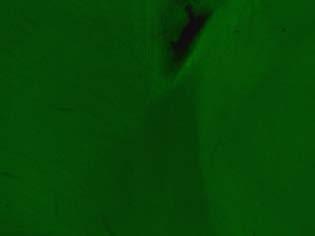
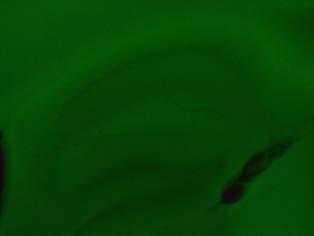
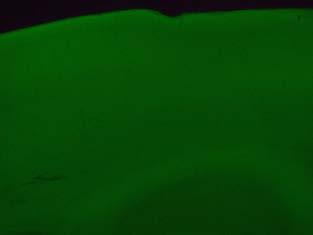
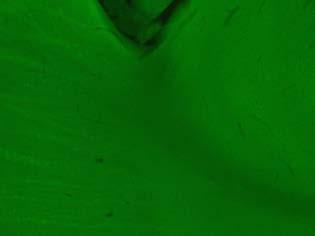
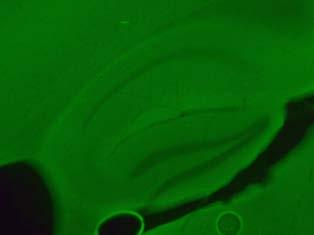
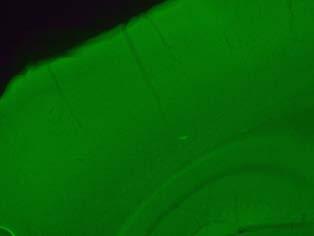
2 Supplementary Figure 1 a Ai27 Pval-IRES-Cre;Ai27 Ai32 Pval-IRES-Cre;Ai32 Nature Neuroscience: doi:1.13/nn.37 Ai35 Pval-IRES-Cre;Ai35 Ai39 Pval-IRES-Cre;Ai39


3 a Supplementary Figure 2 WT (tdt) Ai27 WT (YFP) Ai32 Ai35 Ai39 Pval-IRES-Cre;Ai27 Pval-IRES-Cre;Ai32 Pval-IRES-Cre;Ai35 Pval-IRES-Cre;Ai39 Nature Neuroscience: doi:1.13/nn.37
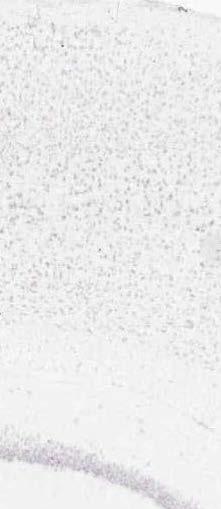
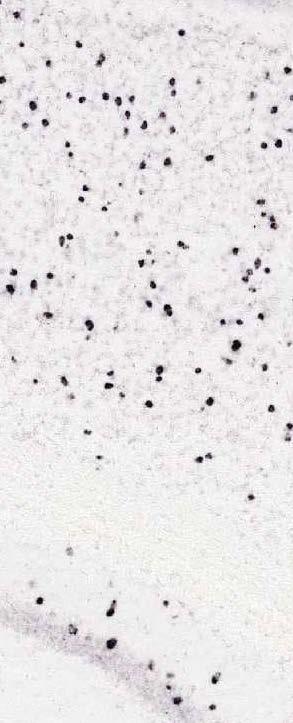
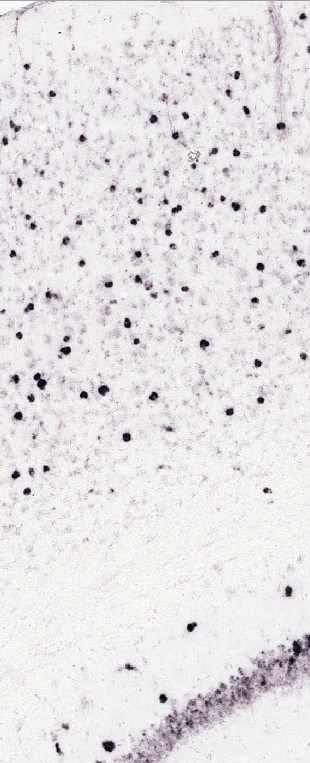
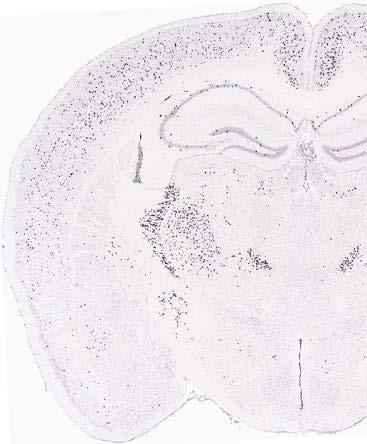
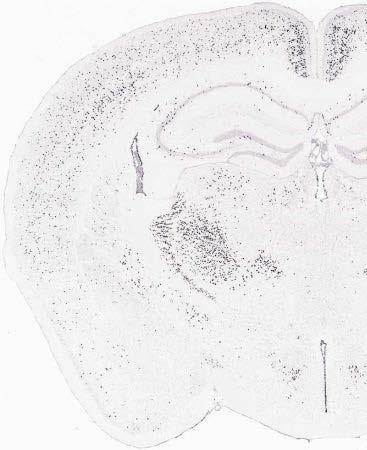
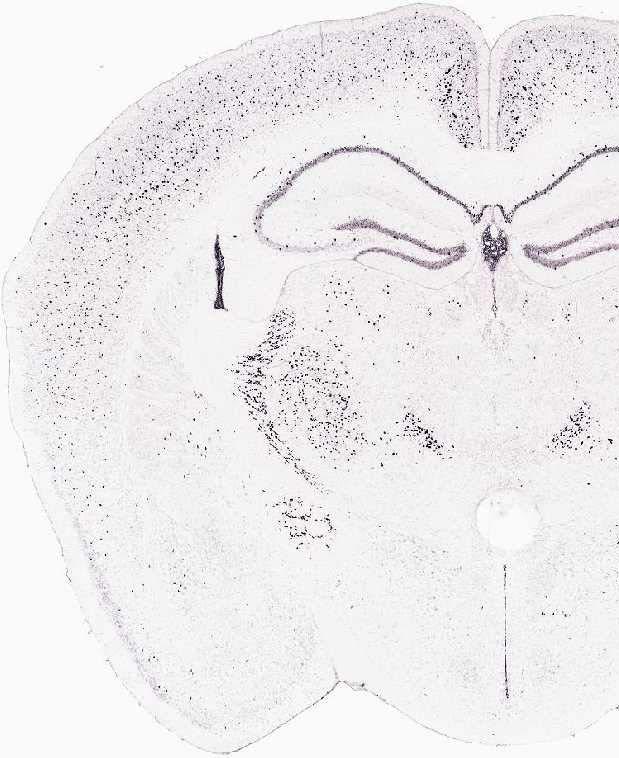
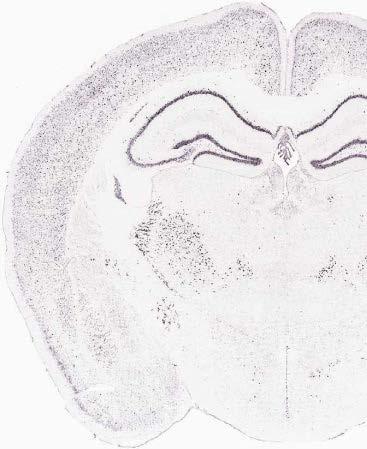
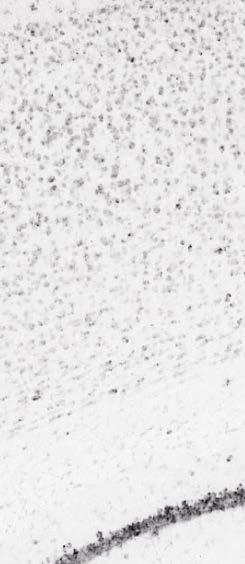
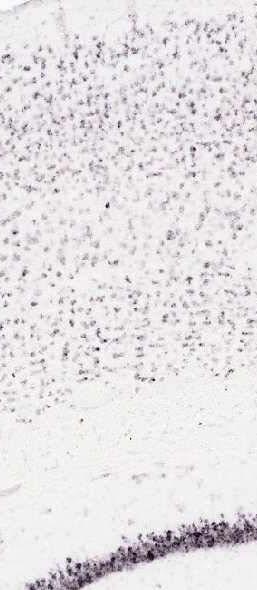
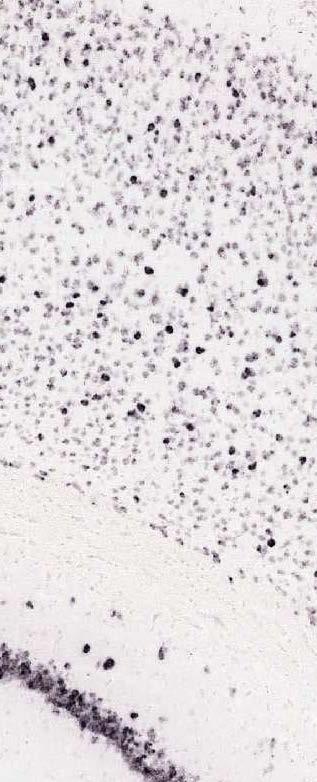
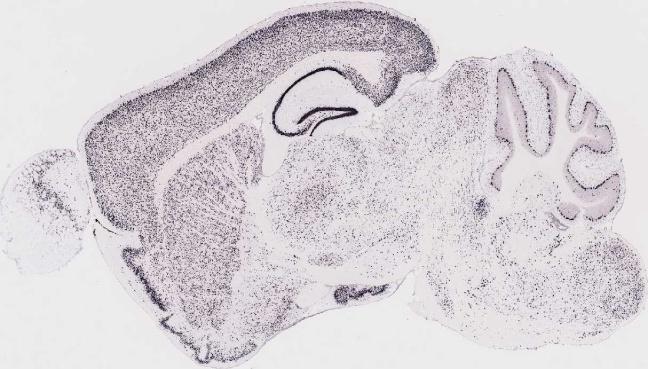
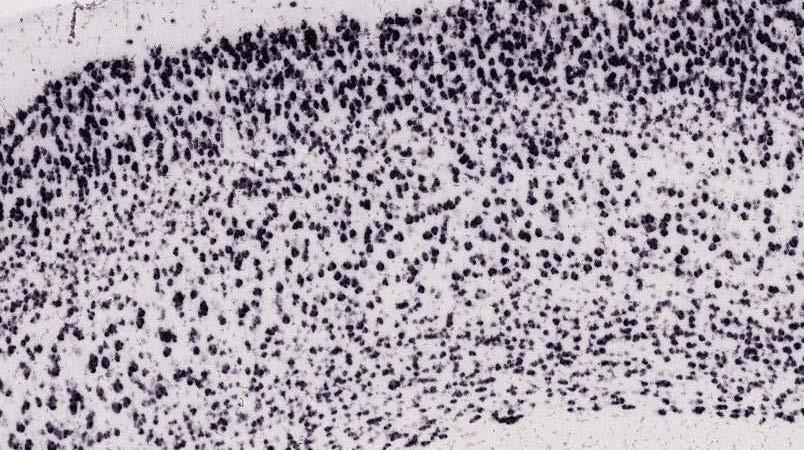
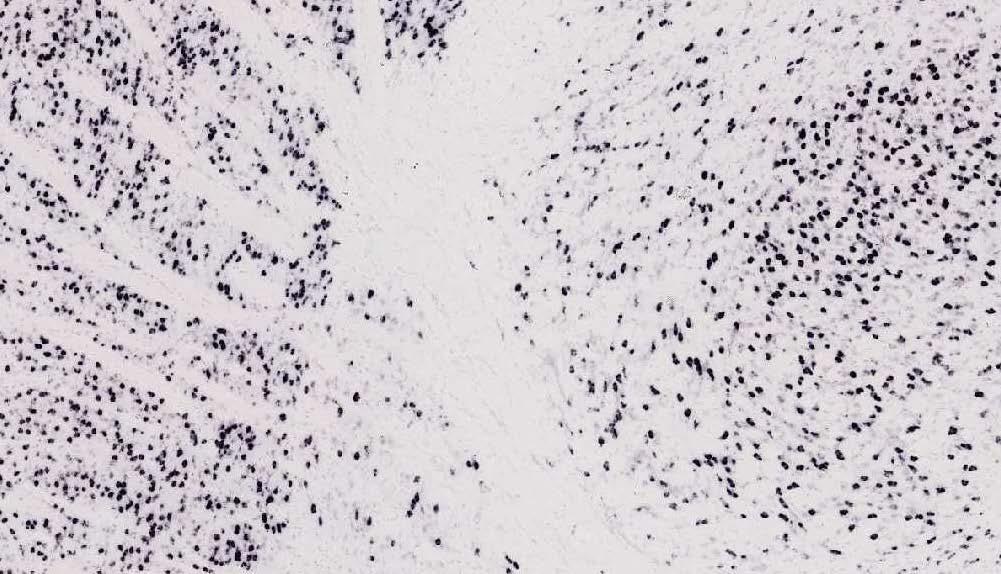
4 Supplementary Figure 2. Additional ISH expression data showing aseline mrna levels in the reporter lines in the asence of Cre, as well as Cre-induced mrna levels in reporters crossed to Pval-IRES-Cre. (a) Baseline mrna levels in cortex and hippocampus in Ai27, Ai32, Ai35 and Ai39 reporter mice alone (without Cre induction). Wildtype (WT) mouse sections were used as negative controls for the tdtomato (tdt) proe used in Ai27 and the EYFP proe used in Ai32, Ai35 and Ai39. Leaky expression in these areas at the mrna level was oserved in Ai35 mice at low level (mainly in hippocampus), and in Ai39 mice at significant level (mainly in cortex and hippocampus) (also oservale in ). Although the cause of this unexpected leakage in only certain lines is unknown, as the sequences of the targeting vectors were identical except for the transgenes themselves and their neighoring restriction sites for cloning, one possiility might e that there is cryptic transcriptional start or splicing acceptor site(s) in the transgene sequence that could lead to low-level skipping of the stop cassette in front of the transgene. () Strong Creinduced transgene expression at mrna levels in Pval+ neurons in Pval-IRES-Cre;Ai27, Pval-IRES-Cre;Ai32, Pval-IRES-Cre;Ai35, Pval-IRES-Cre;Ai39 mice (ages P1-151). Note the sustantially higher signals in targeted cells aove the aseline ackground in each mouse line. Scale ars, 2 µm. Supplementary Figure 3. Additional ISH expression data showing strong Cre-induced transgene expression throughout the rain. The ages of all mice used were ~P56. (a) ChR2- tdtomato mrna expression in cholinergic neurons in the asal forerain (middle panel) and rainstem (ottom panel) in Chat-IRES-Cre;Ai27 mice. () ChR2-EYFP mrna expression in cholinergic neurons in the asal forerain (middle panel) and rainstem (ottom panel) in Chat- IRES-Cre;Ai32 mice. (c) Arch-EGFP-ER2 mrna expression in widespread rain regions, including cortex (middle panel), striatum and thalamus (oth shown in ottom panel) in Camk2a- CreERT2;Ai35 mice after tamoxifen induction. (d) enphr3.-eyfp mrna expression in widespread rain regions, including cortex (middle panel), striatum and thalamus (oth shown in ottom panel) in Camk2a-CreERT2;Ai39 mice after tamoxifen induction. Scale ar, 2 µm. Nature Neuroscience: doi:1.13/nn.37
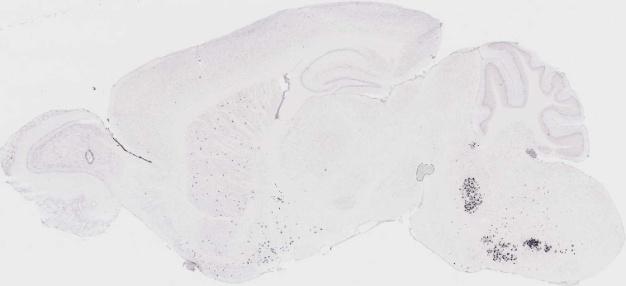
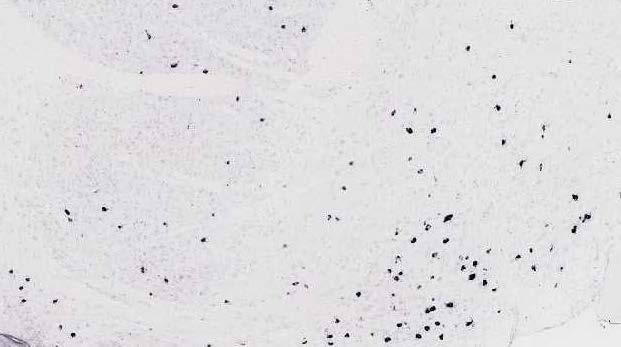
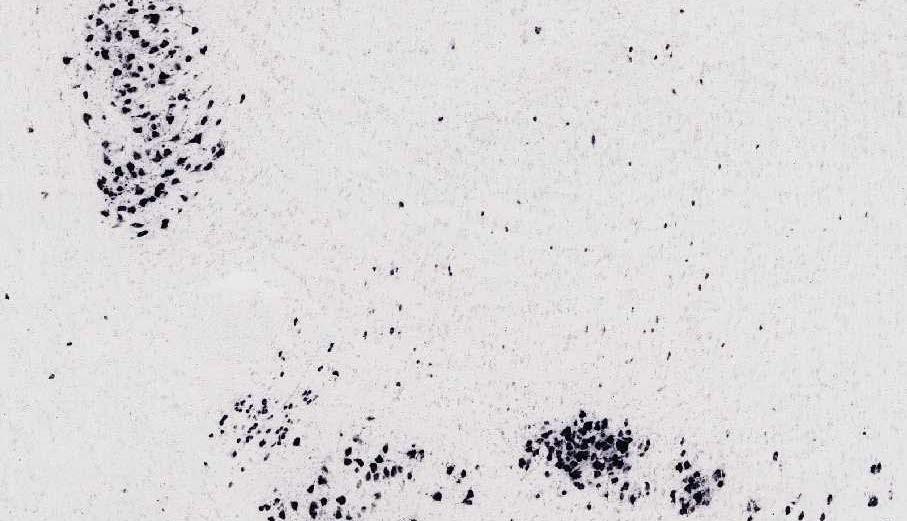
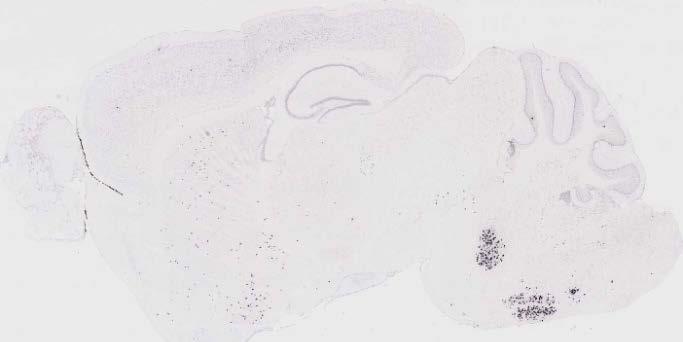
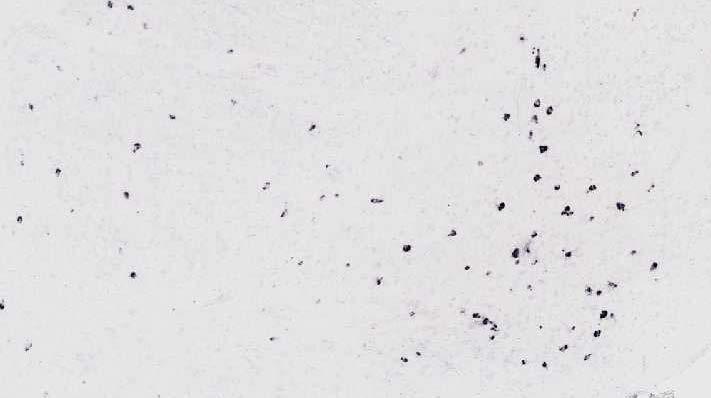
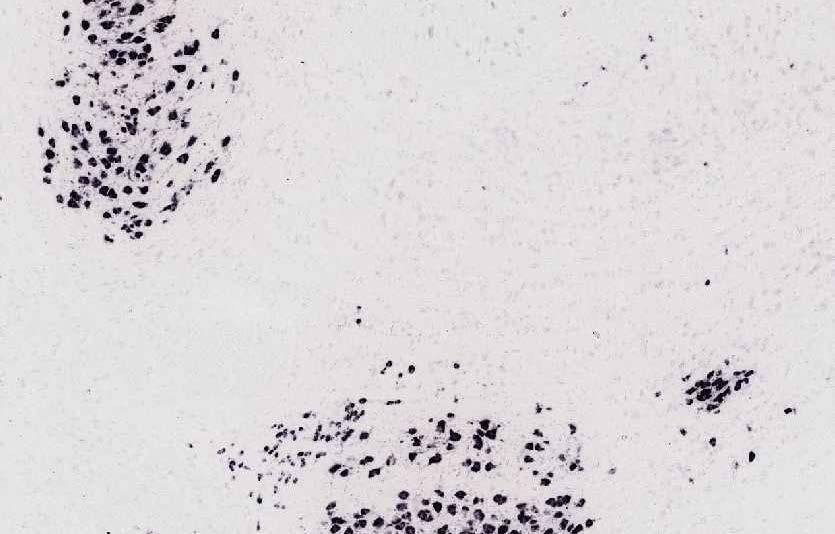
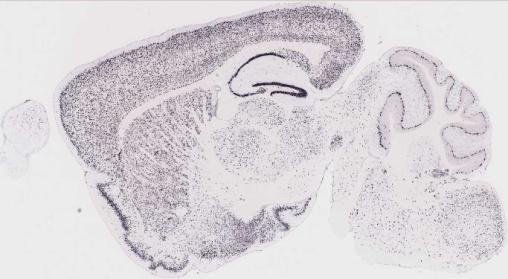
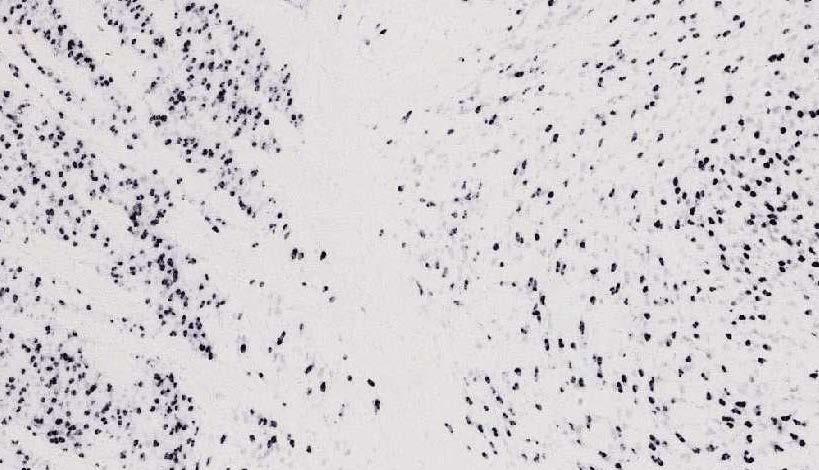
5 a Chat-IRES-Cre;Ai27 Supplementary Figure 3 Chat-IRES-Cre;Ai32 c Camk2a-CreERT2;Ai35 d Camk2a-CreERT2;Ai39 Nature Neuroscience: doi:1.13/nn.37

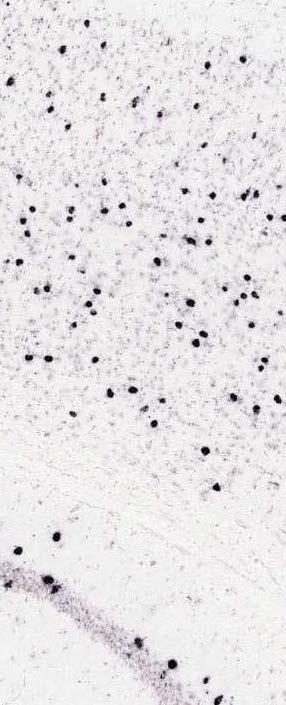
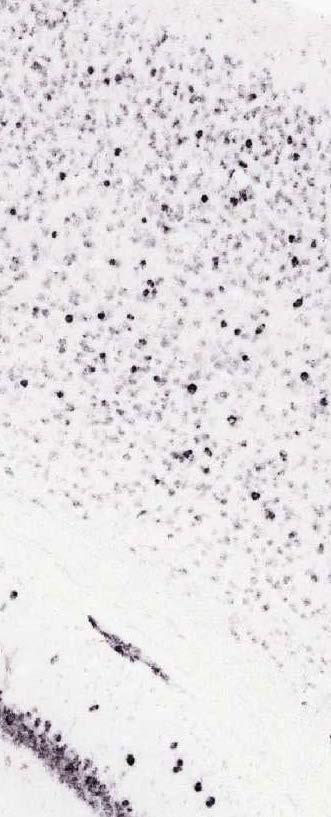
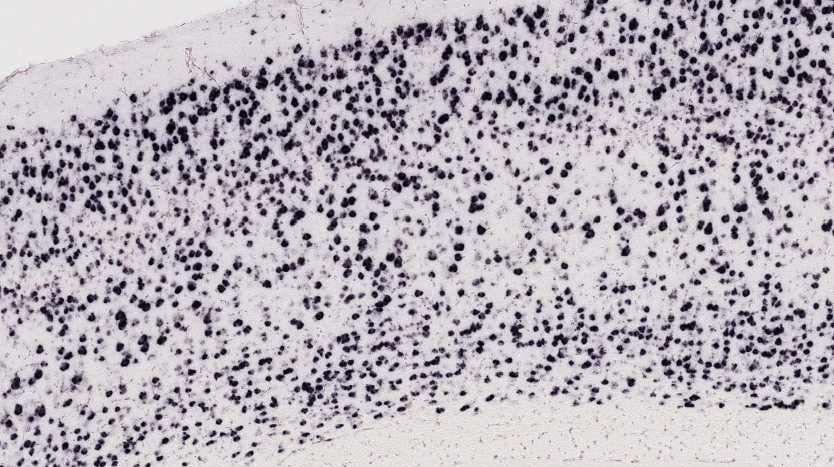
6 Supplementary Figure Normalized cell counts All reporters crossed to Emx1-Cre Supplementary Figure. Quantification of the numer of Cre-induced reporterexpressing cells from reporter ISH images in the cortex of Emx1-Cre;Ai27, Emx1- Cre;Ai32, Emx1-Cre;Ai35 and Emx1-Cre;Ai39 mice of various ages. Each data point represents the average cell count from one mouse. For each line, one younger mouse (P56 or P61) and 1-2 older mice (P157-P3, oldest availale ones in our mouse colony at the time of experiment) were used for the cell counting. A P56 Emx1-Cre;Ai9 mouse was used as control (Ai9: the tdtomato-expressing Cre reporter 9 ). Although not fully shown here, the reporter ISH pattern of every mouse used appeared identical to that shown in Figure 1d. For counting of transgene-expressing cells, 3 ROIs (regions of interest) spanning the entire cortical depth were chosen, one each from motor, somatosensory or visual cortical area. The numer of expressing cells in each ROI was estimated using the Analyze Particles application in the Fiji image analysis software. One example ROI (from the oldest mouse, P3 Emx1-Cre;Ai27) is shown here. Upper panel is the raw ISH image, and lower panel is the image after thresholding with particles to e counted highlighted in red. Normalized cell counts (Y-axis) refer to the average cell count per unit area for each mouse normalized to that of the Emx1-Cre;Ai9 control mouse which was set to 1. Each data point is mean ± s.d. There is no significant difference etween Emx1-Cre;Ai9 and any of the other mouse (p >.1, unpaired student s t-test). The normal ISH expression pattern and normal cell counts for all these mice indicate that long-term expression of all the optogenetic molecules at levels attained in these transgenic lines did not have toxicity. Nature Neuroscience: doi:1.13/nn.37
7 Supplementary Figure 5 a c d 12 Numer of APs Numer of APs Numer of APs Numer of APs Memrane depolarization (mv) Memrane depolarization (mv) Memrane depolarization (mv) Memrane depolarization (mv) e f 2 DAR 2 1 E-Ai27 E-Ai32 IUE Numer of dendritic sites triggering an AP Laser power (mw) 6 12 Total numer of sites triggering an AP Supplementary Figure 5. Preferential photoexcitaility in dendrites or axons of Emx1- Cre;Ai27 (areviated as E-Ai27) and Emx1-Cre;Ai32 (areviated as E-Ai32) mice. (a-d) Histograms of memrane potentials at the inflection points (also see Methods) for (a) in utero electroporated (IUE) cells (n = 6), () E-Ai32 cells (n = 9), (c) E-Ai32 cells around threshold laser power (n = 9, laser power 3-2 µw), and (d) E-Ai27 cells (n = 12). For each cell, responses from all laser power stimulations are included. Red dashed lines indicate the threshold (15 mv) for determining axonal versus somatic/dendritic responses. Somatic/dendritic components are indicated y arrows. In oth ChR2-Venus IUE cells (a) and E-Ai32 cells (, c), more AP events had pre-spiking memrane potentials greater than the 15- mv threshold, indicating a somatic/dendritic component that was nearly asent in E-Ai27 cells (d). (e) The ratio of the numer of the photostimulation sites triggering action potentials in somata and dendrites to the numer of sites triggering action potentials in axons (DAR) plotted against the laser power used for photostimulation. Green circles: E-Ai32 cells; red squares: E-Ai27 cells; gray triangles: ChR2-Venus IUE cells. Each point represents DAR calculated from one trial in the corresponding animal group. (f) The numer of the photostimulation sites triggering action potentials in somata and dendrites plotted against the total numer of photostimulation sites triggering action potentials. The lack dotted line (slope of 1) indicates the positions when all stimulation sites are somatic/dendritic. Nature Neuroscience: doi:1.13/nn.37

8 Supplementary Figure 6 a R CA1 CA1 CA3 R CA3 LASER LASER (.2-mm diameter) (1.25-mm diameter) CA1 CA1 Instantaneous urst frequency (normalized to no laser) c 1. CA1 d **.5 Laser Supplementary Figure 6. Inhiition of the hippocampal network in Emx1-Cre;Ai35 mice is dependent on the area of illumination of CA3. The experimental design was similar to that in Figure 5, in which activity in CA1 was inhiited y optogenetic silencing of CA3. However, in this experiment, a laser (6 nm) was used instead of an LED to give more precise control over the area of illumination, and the total light power was varied to maintain constant illumination per unit area (35 mw mm-2) while the area was varied y changing the distance from the end of the optical fier to the surface of the slice. Adult mice approximately 6 months of age were used. (a) Illumination of a.2mm diameter area of CA3 reversily attenuated, ut did not completely inhiit, postsynaptic ursting of area CA1 neurons. () Increasing the diameter of the area of illumination to 1.25 mm of CA3 resulted in nearly complete inhiition of the postsynaptic ursting of area CA1 neurons, ut still allowed reversal, with some reound increase in activity noted. (c) Summary of the degree of lasermediated inhiition of postsynaptic CA1 neuronal ursting ased on the instantaneous frequency of population ursting normalized to the period prior to laser exposure, for three separate trials. Smaller circle (left) represents a light zone with a.2-mm diameter (n = 3). Larger circle (right) represents a light zone with a 1.25-mm diameter (n = 3). Increasing the diameter of the light zone significantly increases the degree of inhiition in area CA1 (** p <.1, paired student s t-test). Data expressed as mean ± s.d. (d) Reporter transgene expression y ISH in the hippocampus of Emx1-Cre;Ai35 mouse, showing near 1% expression in the excitatory neurons in the CA1, CA3 and dentate gyrus sufields. Nature Neuroscience: doi:1.13/nn.37 5s 5 µv 5s 5 µv CA1
9 Supplementary Figure ms 2.5 ms 2.5 ms Supplementary Figure 7. Light evoked spiking in Emx1-Cre;Ai32 mouse with the sumillisecond temporal precision. Spike raster plot and waveforms in a representative neuron upon lue light illumination (2-Hz pulse trains with 2.5-ms pulses, ~3 mw mm -2 at the optical fier tip which is ~5 µm aove recording electrode). The upper inserts A, B and C demonstrate the timing of each spike upon illumination y the 1st, 3rd, and 19th pulse of the light pulse train, across 2 repetitions. Nature Neuroscience: doi:1.13/nn.37
10 Supplementary Figure a Light activated neurons Not activated neurons ACG ACG Cell 27 Cell 16 Cell 7 Cell Time Cell 3 Cell 25 Cell 36 Cell Time mv.5 ms 1. Light activated 1. Putative excitatory CCG 2 % % a Width at 2% depth [a] (ms) Cell Trough-to-peak time [] (ms) Width at 2% depth [a] (ms) Cell 7 Cell 5 Putative inhiitory Trough-to-peak time [] (ms) Counts Supplementary Figure. Excitation of ChR2-expressing neurons in the hippocampal CA1 of Pval-IRES-Cre;Ai32 mice during waking state. (a) PSTHs of example neurons (additional to Fig. 7a), which were transiently activated (left neurons) and transiently suppressed (right neurons) y a single light pulse and sinus ( Hz) stimulation. Autocorrelogram (ACG) and waveform of each neuron are also shown. Light intensity was 1 mw. () Physiological and optogenetic classification of neuron types in the hippocampus. Left panel, spike width and trough-to-peak time of the wide-and (1 Hz - 5 khz) waveform of pyramidal neuron spikes. Middle panels, segregation of simultaneously recorded neurons y these two parameters. Middle left, light-activated neurons are marked with orange stars. Middle right, putative pyramidal cells and interneurons are indicated in the same plot as middle left. Red triangles and lue circles (Middle panels) indicate excitatory and inhiitory neurons identified y monosynaptic interactions, calculated from their cross-correlogram (Right panel). Note strong overlap etween the physiologically characterized groups and the optogenetically characterized groups. Nature Neuroscience: doi:1.13/nn.37
11 Supplementary Figure 9 a ACG ACG 3 15 Cell Cell Cell Cell Cell 3-15 Cell 2-23 Cell 2-1 Cell Cell Time mv.5 ms 16 Cell Time mv.5 ms Supplementary Figure 9. Light activation of Pval+ neurons in the reticular nucleus of the thalamus in the Pval-IRES-Cre;Ai32 mice (providing additional examples to Fig. 7c). (a) Each row is an activated reticular neuron. Evoked responses y single pulse (2 ms) or sinus (1 Hz) stimulation, ACG, and mean waveform of the neurons recorded at each of the sites of the silicon proe shank (-shank proes were used to record simultaneously from oth reticular nucleus and neighoring ventrolateral nucleus of thalamus). () Same arrangement, showing 5 example thalamocortical neurons. Note ACG typical of ursting thalamocortical cells and their difference from the light-activated reticular neurons. Nature Neuroscience: doi:1.13/nn.37
Supplementary figure 1: LII/III GIN-cells show morphological characteristics of MC
 1 2 1 3 Supplementary figure 1: LII/III GIN-cells show morphological characteristics of MC 4 5 6 7 (a) Reconstructions of LII/III GIN-cells with somato-dendritic compartments in orange and axonal arborizations
Supplementary Figure 1 Information on transgenic mouse models and their recording and optogenetic equipment. (a) 108 (b-c) (d) (e) (f) (g)
 108 (b-c) (d) (e) (f) (g)") Supplementary Figure 1 Information on transgenic mouse models and their recording and optogenetic equipment. (a) In four mice, cre-dependent expression of the hyperpolarizing opsin Arch in pyramidal cells
Supplementary Figure 1 Information on transgenic mouse models and their recording and optogenetic equipment. (a) In four mice, cre-dependent expression of the hyperpolarizing opsin Arch in pyramidal cells
SUPPLEMENTARY MATERIAL
 SUPPLEMENTARY MATERIAL Closed-loop optogenetic control of thalamus as a new tool to interrupt seizures after cortical injury Jeanne T. Paz, Thomas J. Davidson, Eric S. Frechette, Bruno Delord, Isael Parada,
Supplementary Figure 1. ACE robotic platform. A. Overview of the rig setup showing major hardware components of ACE (Automatic single Cell
 2 Supplementary Figure 1. ACE robotic platform. A. Overview of the rig setup showing major hardware components of ACE (Automatic single Cell Experimenter) including the MultiClamp 700B, Digidata 1440A,
Nature Neuroscience: doi: /nn Supplementary Figure 1. Diverse anorexigenic signals induce c-fos expression in CEl PKC-δ + neurons
 Supplementary Figure 1 Diverse anorexigenic signals induce c-fos expression in CEl PKC-δ + neurons a-c. Quantification of CEl c-fos expression in mice intraperitoneal injected with anorexigenic drugs (a),
Unique functional properties of somatostatin-expressing GABAergic neurons in mouse barrel cortex
 Supplementary Information Unique functional properties of somatostatin-expressing GABAergic neurons in mouse barrel cortex Luc Gentet, Yves Kremer, Hiroki Taniguchi, Josh Huang, Jochen Staiger and Carl
Supplementary Figure 1
 Supplementary Figure 1 Miniature microdrive, spike sorting and sleep stage detection. a, A movable recording probe with 8-tetrodes (32-channels). It weighs ~1g. b, A mouse implanted with 8 tetrodes in
Nature Neuroscience: doi: /nn Supplementary Figure 1. Trial structure for go/no-go behavior
 Supplementary Figure 1 Trial structure for go/no-go behavior a, Overall timeline of experiments. Day 1: A1 mapping, injection of AAV1-SYN-GCAMP6s, cranial window and headpost implantation. Water restriction
Nature Neuroscience: doi: /nn Supplementary Figure 1
 Supplementary Figure 1 Drd1a-Cre driven ChR2 expression in the SCN. (a) Low-magnification image of a representative Drd1a-ChR2 coronal brain section (n = 2) showing endogenous tdtomato fluorescence (magenta).
Astrocyte signaling controls spike timing-dependent depression at neocortical synapses
 Supplementary Information Astrocyte signaling controls spike timing-dependent depression at neocortical synapses Rogier Min and Thomas Nevian Department of Physiology, University of Berne, Bern, Switzerland
Nature Neuroscience: doi: /nn Supplementary Figure 1
 Supplementary Figure 1 Atlas representations of the midcingulate (MCC) region targeted in this study compared against the anterior cingulate (ACC) region commonly reported. Coronal sections are shown on
SUPPLEMENTARY INFORMATION
 SUPPLEMENTARY INFORMATION doi:10.1038/nature11306 Supplementary Figures Supplementary Figure 1. Basic characterization of GFP+ RGLs in the dentate gyrus of adult nestin-gfp mice. a, Sample confocal images
Nature Methods: doi: /nmeth Supplementary Figure 1. Activity in turtle dorsal cortex is sparse.
 Supplementary Figure 1 Activity in turtle dorsal cortex is sparse. a. Probability distribution of firing rates across the population (notice log scale) in our data. The range of firing rates is wide but
File name: Supplementary Information Description: Supplementary Figures, Supplementary Table and Supplementary References
 File name: Supplementary Information Description: Supplementary Figures, Supplementary Table and Supplementary References File name: Supplementary Data 1 Description: Summary datasheets showing the spatial
Nature Neuroscience doi: /nn Supplementary Figure 1. Characterization of viral injections.
 Supplementary Figure 1 Characterization of viral injections. (a) Dorsal view of a mouse brain (dashed white outline) after receiving a large, unilateral thalamic injection (~100 nl); demonstrating that
Supplementary Figure 1
 8w Pia II/III IV V VI PV EYFP EYFP PV EYFP PV d PV EYFP Supplementary Figure a Spike probability x - PV-Cre d Spike probability x - RS RS b e Spike probability Spike probability.6......8..... FS FS c f
Nature Neuroscience: doi: /nn Supplementary Figure 1. Lick response during the delayed Go versus No-Go task.
 Supplementary Figure 1 Lick response during the delayed Go versus No-Go task. Trial-averaged lick rate was averaged across all mice used for pyramidal cell imaging (n = 9). Different colors denote different
Supplementary Information
 1 Supplementary Information A role for primary cilia in glutamatergic synaptic integration of adult-orn neurons Natsuko Kumamoto 1,4,5, Yan Gu 1,4, Jia Wang 1,4, Stephen Janoschka 1,2, Ken-Ichi Takemaru
Supplementary Figure 1: Kv7 currents in neonatal CA1 neurons measured with the classic M- current voltage-clamp protocol.
 Supplementary Figures 1-11 Supplementary Figure 1: Kv7 currents in neonatal CA1 neurons measured with the classic M- current voltage-clamp protocol. (a), Voltage-clamp recordings from CA1 pyramidal neurons
Supplementary Figure 1
 Supplementary Figure 1 Arcuate ChIEF-tdTomato neurons expressed TH These micrographs show that TH-Cre-ChIEF-tdTomato (magenta), expressed by AAV in a TH-Cre mouse, were immunostained with TH (green) in
Nature Neuroscience: doi: /nn Supplementary Figure 1. Distribution of starter cells for RV-mediated retrograde tracing.
 Supplementary Figure 1 Distribution of starter cells for RV-mediated retrograde tracing. Parcellation of cortical areas is based on Allen Mouse Brain Atlas and drawn to scale. Thick white curves, outlines
Stereotyped connectivity and computations in higher order olfactory neurons Mehmet Fisek and Rachel I. Wilson
 Stereotyped connectivity and computations in higher order olfactory neurons Mehmet Fisek and Rachel I. Wilson Supplementary Tale 1: Genotypes The genotypes used y figure are as follows: Figure 1a Figure
Supplementary Information. Gauge size. midline. arcuate 10 < n < 15 5 < n < 10 1 < n < < n < 15 5 < n < 10 1 < n < 5. principal principal
 Supplementary Information set set = Reward = Reward Gauge size Gauge size 3 Numer of correct trials 3 Numer of correct trials Supplementary Fig.. Principle of the Gauge increase. The gauge size (y axis)
Nature Neuroscience: doi: /nn.4335
 Supplementary Figure 1 Cholinergic neurons projecting to the VTA are concentrated in the caudal mesopontine region. (a) Schematic showing the sites of retrograde tracer injections in the VTA: cholera toxin
Nature Neuroscience: doi: /nn Supplementary Figure 1
 Supplementary Figure 1 Relative expression of K IR2.1 transcript to enos was reduced 29-fold in capillaries from knockout animals. Relative expression of K IR2.1 transcript to enos was reduced 29-fold
Reward and choice encoding in terminals of midbrain dopamine neurons depends on striatal target
 Reward and encoding in terminals of midrain dopamine neurons depends on striatal target Nathan F Parker, Courtney M Cameron, Joshua P Taliaferro, Junuk Lee, Jung Yoon Choi, Thomas J Davidson, Nathaniel
Zhu et al, page 1. Supplementary Figures
 Zhu et al, page 1 Supplementary Figures Supplementary Figure 1: Visual behavior and avoidance behavioral response in EPM trials. (a) Measures of visual behavior that performed the light avoidance behavior
Supplementary Figure 1. SDS-FRL localization of CB 1 in the distal CA3 area of the rat hippocampus. (a-d) Axon terminals (t) in stratum pyramidale
 Axon terminals (t) in stratum pyramidale") Supplementary Figure 1. SDS-FRL localization of CB 1 in the distal CA3 area of the rat hippocampus. (a-d) Axon terminals (t) in stratum pyramidale (b) show stronger immunolabeling for CB 1 than those in
Supplementary Figure 1. SDS-FRL localization of CB 1 in the distal CA3 area of the rat hippocampus. (a-d) Axon terminals (t) in stratum pyramidale (b) show stronger immunolabeling for CB 1 than those in
Nature Neuroscience: doi: /nn.4642
 Supplementary Figure 1 Recording sites and example waveform clustering, as well as electrophysiological recordings of auditory CS and shock processing following overtraining. (a) Recording sites in LC
Is action potential threshold lowest in the axon?
 Supplementary information to: Is action potential threshold lowest in the axon? Maarten H. P. Kole & Greg J. Stuart Supplementary Fig. 1 Analysis of action potential (AP) threshold criteria. (a) Example
Supplementary Figure 1. GABA depolarizes the majority of immature neurons in the
 Supplementary Figure 1. GABA depolarizes the majority of immature neurons in the upper cortical layers at P3 4 in vivo. (a b) Cell-attached current-clamp recordings illustrate responses to puff-applied
An acetylcholine-activated microcircuit drives temporal dynamics of cortical activity
 An acetylcholine-activated microcircuit drives temporal dynamics of cortical activity Naiyan Chen, Hiroki Sugihara, & Mriganka Sur Nature America, nc. All rights reserved. Cholinergic modulation of cortex
Hormonal gain control of a medial preoptic area social reward circuit
 CORRECTION NOTICE Nat. Neurosci. 20, 449 458 (2017) Hormonal gain control of a medial preoptic area social reward circuit Jenna A McHenry, James M Otis, Mark A Rossi, J Elliott Robinson, Oksana Kosyk,
mm Distance (mm)
") b a Magnet Illumination Coverslips MPs Objective 2575 µm 1875 µm 1575 µm 1075 µm 875 µm 545 µm 20µm 2 3 0.5 0.3mm 1 1000 100 10 1 0.1 1000 100 10 1 0.1 Field Induction (Gauss) 1.5 0 5 10 15 20 Distance
b a Magnet Illumination Coverslips MPs Objective 2575 µm 1875 µm 1575 µm 1075 µm 875 µm 545 µm 20µm 2 3 0.5 0.3mm 1 1000 100 10 1 0.1 1000 100 10 1 0.1 Field Induction (Gauss) 1.5 0 5 10 15 20 Distance
Nature Neuroscience: doi: /nn Supplementary Figure 1
 Supplementary Figure 1 Reward rate affects the decision to begin work. (a) Latency distributions are bimodal, and depend on reward rate. Very short latencies (early peak) preferentially occur when a greater
SUPPLEMENTARY INFORMATION
 doi:10.1038/nature22324 Effects of photoinhibition on licking Photoinhibition of ALM or thalamus caused only small changes in lick early rates, no response rates, and licking latency. ALM photoinhibition
Supplementary Information. Cofilin Regulates Nuclear Architecture through a Myosin-II Dependent Mechanotransduction Module
 Supplementary Information Cofilin Regulates Nuclear Architecture through a Myosin-II Dependent Mechanotransduction Module O Neil Wiggan, Bryce Schroder, Diego Krapf, James R. Bamurg and Jennifer G. DeLuca
Microcircuitry coordination of cortical motor information in self-initiation of voluntary movements
 Y. Isomura et al. 1 Microcircuitry coordination of cortical motor information in self-initiation of voluntary movements Yoshikazu Isomura, Rie Harukuni, Takashi Takekawa, Hidenori Aizawa & Tomoki Fukai
Nature Neuroscience: doi: /nn Supplementary Figure 1. MADM labeling of thalamic clones.
 Supplementary Figure 1 MADM labeling of thalamic clones. (a) Confocal images of an E12 Nestin-CreERT2;Ai9-tdTomato brain treated with TM at E10 and stained for BLBP (green), a radial glial progenitor-specific
Supplementary Information Supplementary Table 1. Quantitative features of EC neuron dendrites
 Supplementary Information Supplementary Table 1. Quantitative features of EC neuron dendrites Supplementary Table 2. Quantitative features of EC neuron axons 1 Supplementary Figure 1. Layer distribution
SUPPLEMENTARY INFORMATION. Supplementary Figure 1
 SUPPLEMENTARY INFORMATION Supplementary Figure 1 The supralinear events evoked in CA3 pyramidal cells fulfill the criteria for NMDA spikes, exhibiting a threshold, sensitivity to NMDAR blockade, and all-or-none
Supplementary Figure 1. Basic properties of compound EPSPs at
 Supplementary Figure 1. Basic properties of compound EPSPs at hippocampal CA3 CA3 cell synapses. (a) EPSPs were evoked by extracellular stimulation of the recurrent collaterals and pharmacologically isolated
Nature Neuroscience: doi: /nn Supplementary Figure 1. ACx plasticity is required for fear conditioning.
 Supplementary Figure 1 ACx plasticity is required for fear conditioning. (a) Freezing time of conditioned and control mice before CS presentation and during CS presentation in a new context. Student s
Mnemonic representations of transient stimuli and temporal sequences in the rodent hippocampus in vitro
 Supplementary Material Mnemonic representations of transient stimuli and temporal sequences in the rodent hippocampus in vitro Robert. Hyde and en W. Strowbridge Mossy ell 1 Mossy ell Mossy ell 3 Stimulus
Tuning properties of individual circuit components and stimulus-specificity of experience-driven changes.
 Supplementary Figure 1 Tuning properties of individual circuit components and stimulus-specificity of experience-driven changes. (a) Left, circuit schematic with the imaged component (L2/3 excitatory neurons)
Nature Neuroscience: doi: /nn Supplementary Figure 1. Large-scale calcium imaging in vivo.
 Supplementary Figure 1 Large-scale calcium imaging in vivo. (a) Schematic illustration of the in vivo camera imaging set-up for large-scale calcium imaging. (b) High-magnification two-photon image from
-51mV 30s 3mV. n=14 n=4 p=0.4. Depolarization (mv) 3
 3") Supplementary Figure 1 a optoβ 2 -AR b ChR2-51mV 30s 3mV -50mV 30s 3mV c 4 n=14 n=4 p=0.4 Depolarization (mv) 3 2 1 0 Both optogenetic actuators, optoβ 2 AR and ChR2, were effective in stimulating astrocytes
Supplementary Figure 1 a optoβ 2 -AR b ChR2-51mV 30s 3mV -50mV 30s 3mV c 4 n=14 n=4 p=0.4 Depolarization (mv) 3 2 1 0 Both optogenetic actuators, optoβ 2 AR and ChR2, were effective in stimulating astrocytes
To Accompany: Thalamic Synchrony and the Adaptive Gating of Information Flow to Cortex Wang, Webber, & Stanley
 SUPPLEMENTARY MATERIAL To Accompany: Thalamic Synchrony and the Adaptive Gating of Information Flow to Cortex Wang, Webber, & Stanley Supplementary Note 1: Parametric fits of spike count distributions
Supplementary Figure 1. Nature Neuroscience: doi: /nn.4547
 Supplementary Figure 1 Characterization of the Microfetti mouse model. (a) Gating strategy for 8-color flow analysis of peripheral Ly-6C + monocytes from Microfetti mice 5-7 days after TAM treatment. Living
Nature Neuroscience: doi: /nn Supplementary Figure 1
 Supplementary Figure 1 Bidirectional optogenetic modulation of the tonic activity of CEA PKCδ + neurons in vitro. a, Top, Cell-attached voltage recording illustrating the blue light-induced increase in
Short- and long-lasting consequences of in vivo nicotine treatment
 Short- and long-lasting consequences of in vivo nicotine treatment on hippocampal excitability Rachel E. Penton, Michael W. Quick, Robin A. J. Lester Supplementary Figure 1. Histogram showing the maximal
Ube3a is required for experience-dependent maturation of the neocortex
 Ube3a is required for experience-dependent maturation of the neocortex Koji Yashiro, Thorfinn T. Riday, Kathryn H. Condon, Adam C. Roberts, Danilo R. Bernardo, Rohit Prakash, Richard J. Weinberg, Michael
SUPPLEMENTARY INFORMATION
 SUPPLEMENTARY INFORMATION doi:10.1038/nature12024 entary Figure 1. Distribution of the number of earned cocaine Supplementary Figure 1. Distribution of the number of earned cocaine infusions in Shock-sensitive
Wenqin Hu, Cuiping Tian, Tun Li, Mingpo Yang, Han Hou & Yousheng Shu
 Distinct contributions of Na v 1.6 and Na v 1.2 in action potential initiation and backpropagation Wenqin Hu, Cuiping Tian, Tun Li, Mingpo Yang, Han Hou & Yousheng Shu Supplementary figure and legend Supplementary
Beyond Vanilla LTP. Spike-timing-dependent-plasticity or STDP
 Beyond Vanilla LTP Spike-timing-dependent-plasticity or STDP Hebbian learning rule asn W MN,aSN MN Δw ij = μ x j (v i - φ) learning threshold under which LTD can occur Stimulation electrode Recording electrode
Theta sequences are essential for internally generated hippocampal firing fields.
 Theta sequences are essential for internally generated hippocampal firing fields. Yingxue Wang, Sandro Romani, Brian Lustig, Anthony Leonardo, Eva Pastalkova Supplementary Materials Supplementary Modeling
Supplementary Information
 Supplementary Information Optial ontrolling reveals time-dependent roles for adult-orn dentate granule ells Yan Gu, Maithe Arruda-Carvalho 3,4, Jia Wang, Stephen Janoshka,, Sheena Josselyn 3-5, Paul Frankland
SUPPLEMENTARY INFORMATION
 Supplementary Figure 1. Normal AMPAR-mediated fepsp input-output curve in CA3-Psen cdko mice. Input-output curves, which are plotted initial slopes of the evoked fepsp as function of the amplitude of the
Nature Neuroscience: doi: /nn Supplementary Figure 1. Confirmation that optogenetic inhibition of dopaminergic neurons affects choice
 Supplementary Figure 1 Confirmation that optogenetic inhibition of dopaminergic neurons affects choice (a) Sample behavioral trace as in Figure 1d, but with NpHR stimulation trials depicted as green blocks
Thalamic control of cortical states
 Supplementary Information Thalamic control of cortical states James F.A. Poulet, Laura M.J. Fernandez, Sylvain Crochet & Carl C.H. Petersen Supplementary Information consists of: 1. Methods 2. Supplementary
Ivy/Neurogliaform Interneurons Coordinate Activity in the Neurogenic Niche
 Ivy/Neurogliaform Interneurons Coordinate Activity in the Neurogenic Niche Sean J. Markwardt, Cristina V. Dieni, Jacques I. Wadiche & Linda Overstreet-Wadiche Supplementary Methods. Animals We used hemizygous
Supplementary Information
 Supplementary Information D-Serine regulates cerebellar LTD and motor coordination through the 2 glutamate receptor Wataru Kakegawa, Yurika Miyoshi, Kenji Hamase, Shinji Matsuda, Keiko Matsuda, Kazuhisa
Supplementary Figure 1
 Supplementary Figure 1 Localization of virus injections. (a) Schematic showing the approximate center of AAV-DIO-ChR2-YFP injection sites in the NAc of Dyn-cre mice (n=8 mice, 16 injections; caudate/putamen,
Supplementary Materials for
 advances.sciencemag.org/cgi/content/full/3/3/e1600955/dc1 Supplementary Materials for Flexible and stretchable nanowire-coated fibers for optoelectronic probing of spinal cord circuits Chi Lu, Seongjun
Synaptic plasticityhippocampus. Neur 8790 Topics in Neuroscience: Neuroplasticity. Outline. Synaptic plasticity hypothesis
 Synaptic plasticityhippocampus Neur 8790 Topics in Neuroscience: Neuroplasticity Outline Synaptic plasticity hypothesis Long term potentiation in the hippocampus How it s measured What it looks like Mechanisms
Supplementary Figure 1
 Supplementary Figure 1 Supplementary Figure 1 SNARE Probes for FRET/2pFLIM Analysis Used in the Present Study. mturquoise (mtq) and Venus (Ven) are in blue and yellow, respectively. The soluble N-ethylmaleimide-sensitive
Dep. Control Time (min)
") aa Control Dep. RP 1s 1 mv 2s 1 mv b % potentiation of IPSP 2 15 1 5 Dep. * 1 2 3 4 Time (min) Supplementary Figure 1. Rebound potentiation of IPSPs in PCs. a, IPSPs recorded with a K + gluconate pipette
aa Control Dep. RP 1s 1 mv 2s 1 mv b % potentiation of IPSP 2 15 1 5 Dep. * 1 2 3 4 Time (min) Supplementary Figure 1. Rebound potentiation of IPSPs in PCs. a, IPSPs recorded with a K + gluconate pipette
A genetically targeted optical sensor to monitor calcium signals in astrocyte processes
 A genetically targeted optical sensor to monitor calcium signals in astrocyte processes 1 Eiji Shigetomi, 1 Sebastian Kracun, 2 Michael V. Sofroniew & 1,2 *Baljit S. Khakh Ψ 1 Departments of Physiology
Movement Initiation Signals in Mouse Whisker Motor Cortex
 Article Movement Initiation Signals in Mouse Whisker Motor Cortex Highlights d Optogenetic excitation (inactivation) of wm1 evokes (inhibits) whisking d d d Layer-specific neuronal activity in wm1 encodes
Supplemental Information. Differential Regulation. of Evoked and Spontaneous Release. by Presynaptic NMDA Receptors
 Neuron, Volume 96 Supplemental Information Differential Regulation of Evoked and Spontaneous Release by Presynaptic NMDA Receptors Therése Abrahamsson, hristina You hien hou, Si Ying Li, Adamo Mancino,
Figure 1. Excerpt of stimulus presentation paradigm for Study I.
 Transition Visual Auditory Tactile Time 14 s Figure 1. Excerpt of stimulus presentation paradigm for Study I. Visual, auditory, and tactile stimuli were presented to sujects simultaneously during imaging.
Resonant synchronization of heterogeneous inhibitory networks
 Cerebellar oscillations: Anesthetized rats Transgenic animals Recurrent model Review of literature: γ Network resonance Life simulations Resonance frequency Conclusion Resonant synchronization of heterogeneous
HHS Public Access Author manuscript Nat Neurosci. Author manuscript; available in PMC 2014 September 19.
 Selective optical drive of thalamic reticular nucleus generates thalamic bursts & cortical spindles Michael M. Halassa 1,2,4, Joshua H. Siegle 2,4, Jason T. Ritt 3, Jonathan T. Ting 2, Guoping Feng 2,
Basal Ganglia Anatomy, Physiology, and Function. NS201c
 Basal Ganglia Anatomy, Physiology, and Function NS201c Human Basal Ganglia Anatomy Basal Ganglia Circuits: The Classical Model of Direct and Indirect Pathway Function Motor Cortex Premotor Cortex + Glutamate
Supplemental Information. Dorsal Raphe Dual Serotonin-Glutamate Neurons. Drive Reward by Establishing Excitatory Synapses
 Cell Reports, Volume 26 Supplemental Information Dorsal Raphe Dual Serotonin-Glutamate Neurons Drive Reward by Establishing Excitatory Synapses on VTA Mesoaccumbens Dopamine Neurons Hui-Ling Wang, Shiliang
Electrophysiological and firing properties of neurons: categorizing soloists and choristers in primary visual cortex
 *Manuscript Click here to download Manuscript: Manuscript revised.docx Click here to view linked Referenc Electrophysiological and firing properties of neurons: categorizing soloists and choristers in
Supplementary Figure 1. Schematic illustrating major conclusions of this study.
 ORNs GABA A GABA B glomeruli LN PNs Supplementary Figure 1. Shemati illustrating major onlusions of this study. This study represents the most diret evidene to date of inhiitory interations etween olfatory
Brain Forum, presented by Mark J. Schnitzer, HHMI / Stanford Univ.
 Imaging large-scale ensemble neural codes underlying learning and long-term memory Portable microscopy for mice Brain Forum, presented by Mark J. Schnitzer, HHMI / Stanford Univ. Imaging CA1, amygdala
Supplementary Figure 1. Recording sites.
 Supplementary Figure 1 Recording sites. (a, b) Schematic of recording locations for mice used in the variable-reward task (a, n = 5) and the variable-expectation task (b, n = 5). RN, red nucleus. SNc,
Structural basis for the role of inhibition in facilitating adult brain plasticity
 Structural basis for the role of inhibition in facilitating adult brain plasticity Jerry L. Chen, Walter C. Lin, Jae Won Cha, Peter T. So, Yoshiyuki Kubota & Elly Nedivi SUPPLEMENTARY FIGURES 1-6 a b M
Thalamo-Cortical Relationships Ultrastructure of Thalamic Synaptic Glomerulus
 Central Visual Pathways V1/2 NEUR 3001 dvanced Visual Neuroscience The Lateral Geniculate Nucleus () is more than a relay station LP SC Professor Tom Salt UCL Institute of Ophthalmology Retina t.salt@ucl.ac.uk
Supplementary Figure 1. Microglia do not show signs of classical immune activation following MD a-b. Images showing immunoreactivity for MHCII (a)
") 1 Supplementary Figure 1. Microglia do not show signs of classical immune activation following MD a-b. Images showing immunoreactivity for MHCII (a) and CD45 (b) in fixed sections of binocular visual cortex
1 Supplementary Figure 1. Microglia do not show signs of classical immune activation following MD a-b. Images showing immunoreactivity for MHCII (a) and CD45 (b) in fixed sections of binocular visual cortex
T H E J O U R N A L O F C E L L B I O L O G Y
 Supplemental material Chen et al., http://www.jcb.org/cgi/content/full/jcb.201210119/dc1 T H E J O U R N A L O F C E L L B I O L O G Y Figure S1. Lack of fast reversibility of UVR8 dissociation. (A) HEK293T
Part 11: Mechanisms of Learning
 Neurophysiology and Information: Theory of Brain Function Christopher Fiorillo BiS 527, Spring 2012 042 350 4326, fiorillo@kaist.ac.kr Part 11: Mechanisms of Learning Reading: Bear, Connors, and Paradiso,
Lack of GPR88 enhances medium spiny neuron activity and alters. motor- and cue- dependent behaviors
 Lack of GPR88 enhances medium spiny neuron activity and alters motor- and cue- dependent behaviors Albert Quintana, Elisenda Sanz, Wengang Wang, Granville P. Storey, Ali D. Güler Matthew J. Wanat, Bryan
Authors: K. L. Arendt, M. Royo, M. Fernández-Monreal, S. Knafo, C. N. Petrok, J.
 SUPPLEMENTARY INFORMATION Title: PIP 3 controls synaptic function by maintaining AMPA receptor clustering at the postsynaptic membrane Authors: K. L. Arendt, M. Royo, M. Fernández-Monreal, S. Knafo, C.
Layer-Specific Physiological Features and Interlaminar Interactions in the Primary Visual Cortex of the Mouse
 Article Layer-Specific Physiological Features and Interlaminar Interactions in the Primary Visual Cortex of the Mouse Highlights d Multisite LFP recording and LFP-spike coupling identified physiological
SUPPLEMENTARY INFORMATION
 doi:1.138/nature1139 a d Whisker angle (deg) Whisking repeatability Control Muscimol.4.3.2.1 -.1 8 4-4 1 2 3 4 Performance (d') Pole 8 4-4 1 2 3 4 5 Time (s) b Mean protraction angle (deg) e Hit rate (p
Nature Neuroscience: doi: /nn Supplementary Figure 1. Splenic atrophy and leucopenia caused by T3 SCI.
 Supplementary Figure 1 Splenic atrophy and leucopenia caused by T3 SCI. (a) Gross anatomy of representative spleens from control and T3 SCI mice at 28 days post-injury. (b and c) Hematoxylin and eosin
Nature Medicine: doi: /nm.4084
 Supplementary Figure 1: Sample IEDs. (a) Sample hippocampal IEDs from different kindled rats (scale bar = 200 µv, 100 ms). (b) Sample temporal lobe IEDs from different subjects with epilepsy (scale bar
High-performance and site-directed in utero electroporation with a triple-electrode probe
 High-performance and site-directed in utero electroporation with a triple-electrode probe Marco dal Maschio 1 *, Diego Ghezzi 1 *, Guillaume Bony 1 *, Alessandro Alabastri 2, Gabriele Deidda 1, Marco Brondi
Brain anatomy and artificial intelligence. L. Andrew Coward Australian National University, Canberra, ACT 0200, Australia
 Brain anatomy and artificial intelligence L. Andrew Coward Australian National University, Canberra, ACT 0200, Australia The Fourth Conference on Artificial General Intelligence August 2011 Architectures
Supplemental Materials Molecular Biology of the Cell
 Supplemental Materials Molecular Biology of the Cell Garcia-Alvarez et al. Supplementary Figure Legends Figure S1.Expression and RNAi-mediated silencing of STIM1 in hippocampal neurons (DIV, days in vitro).
Transcranial Pulsed Ultrasound Stimulates Intact Brain Circuits
 Neuron, Volume 66 Supplemental Information Transcranial Pulsed Ultrasound Stimulates Intact Brain Circuits Yusuf Tufail, Alexei Matyushov, Nathan Baldwin, Monica L. Tauchmann, Joseph Georges, Anna Yoshihiro,
SUPPLEMENTARY INFORMATION
 doi:1.138/nature9553 Supplementary Table 1. Overlap of neuronal marker and PKC- expression in CEl. Marker/PKC- PKC- Marker Gad65 87.4±4.7 5.3±12.6 CRH 1.2±1. 16.9±15.2 Dyn 1.9±1.2 4.5±2.9 Enk 42.8±7.4
SUPPLEMENTARY INFORMATION
 doi:10.1038/nature10776 Supplementary Information 1: Influence of inhibition among blns on STDP of KC-bLN synapses (simulations and schematics). Unconstrained STDP drives network activity to saturation
Supporting Information
 ATP from synaptic terminals and astrocytes regulates NMDA receptors and synaptic plasticity through PSD- 95 multi- protein complex U.Lalo, O.Palygin, A.Verkhratsky, S.G.N. Grant and Y. Pankratov Supporting
POSTSYNAPTIC INHIBITION OF CRAYFISH TONIC FLEXOR MOTOR NEURONES BY ESCAPE COMMANDS
 J. exp. Biol. (1980), 85, 343-347 343 With a figures Printed in Great Britain POSTSYNAPTIC INHIBITION OF CRAYFISH TONIC FLEXOR MOTOR NEURONES BY ESCAPE COMMANDS BY J. Y. KUWADA, G. HAGIWARA AND J. J. WINE
Cholinergic Activation of M2 Receptors Leads to Context- Dependent Modulation of Feedforward Inhibition in the Visual Thalamus
 Cholinergic Activation of M2 Receptors Leads to Context- Dependent Modulation of Feedforward Inhibition in the Visual Thalamus Miklos Antal., Claudio Acuna-Goycolea., R. Todd Pressler, Dawn M. Blitz, Wade
Supplemental information Acid-sensing ion channel 1a contributes to hippocampal LTP inducibility through multiple mechanisms
 Supplemental information Acid-sensing ion channel 1a contributes to hippocampal LTP inducibility through multiple mechanisms Ming-Gang Liu, Hu-Song Li, Wei-Guang Li, Yan-Jiao Wu, Shi-Ning Deng, Chen Huang,