Ekg pra pr c a tice D.HAMMOUDI.MD
|
|
|
- Wesley Brown
- 6 years ago
- Views:
Transcription

1 Ekg practice D.HAMMOUDI.MD
 LCA (Left Coronary Artery) Septal wall of LV Anterior wall of LV Inferior wall of LV Posterior wall of LV")
2 Anatomy Revisited RCA (Right Coronary Artery) Right ventricle Inferior wall of LV Posterior wall of LV (75%) SA Node (60%) AV Node (>80%) LCA (Left Coronary Artery) Septal wall of LV Anterior wall of LV Inferior wall of LV Posterior wall of LV (10%)

3

4 Interpretation of ECG Normal heart rhythm has consistent R- R interval. Mild variations due to breathing also normal.

5 Interpretation of ECG Normal Sinus Rhythm Rate: b/min Rhythm: regular P waves: upright in leads I, II, av F PR interval: <.20 s QRS: <.10 s

6
7
8 ECG machines can run at 50 or 25 mm/sec. Major grid lines are 5 mm apart, at standard 25 mm/s, 5 mm corresponds to.20 seconds. Minor lines are 1 mm apart, at standard 25 mm/s, 1 mm corresponds to.04 seconds. Voltage is measured on vertical axis. Standard calibration is 0.1 mv per mm of deflection. ECG Time & Voltage
9 TO REMEMBER Normal adult 12-lead ECG The diagnosis of the normal electrocardiogram is made by excluding any recognised abnormality. It's description is therefore quite lengthy. normal sinus rhythm each P wave is followed by a QRS P waves normal for the subject P wave rate bpm with <10% variation rate <60 = sinus bradycardia rate >100 = sinus tachycardia variation >10% = sinus arrhythmia
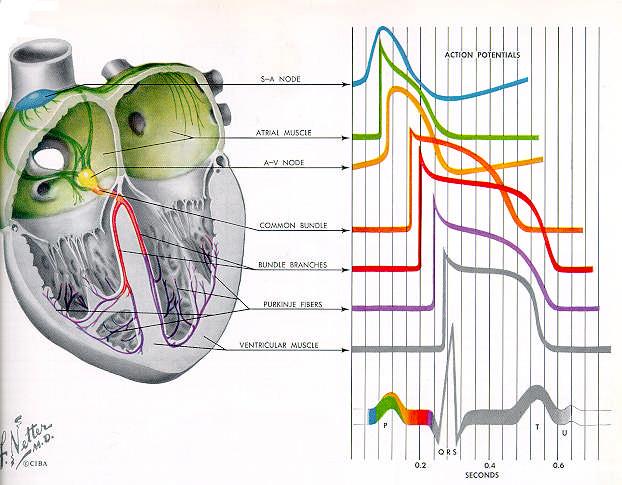
10 Electrophysiology
11 Cardiac Current Flow
12 Cardiac Current Flow
13 normal P waves height < 2.5 mm in lead II width < 0.11 s in lead II normal PR interval 0.12 to 0.20 s (3-5 small squares) for short PR segment consider Wolff- Parkinson-White syndrome or Lown- Ganong-Levine syndrome (other causes - Duchenne muscular dystrophy, type II glycogen storage disease (Pompe's), HOCM) for long PR interval see first degree heart block
14 normal QRS complex < 0.12 s duration (3 small squares) normal QRS complex < 0. for abnormally wide QRS consider right or left bundle branch block, ventricular rhythm, hyperkalaemia, etc. no pathological Q waves no evidence of left or right ventricular hypertrophy normal QT interval Calculate the corrected QT interval (QTc) by dividing the QT interval by the square root of the preceeding R - R interval. Normal = 0.42 s. Causes of long QT interval myocardial infarction, myocarditis, diffuse myocardial disease hypocalcaemia, hypothyrodism subarachnoid haemorrhage, intracerebral haemorrhage drugs (e.g. sotalol, amiodarone) hereditary
15 normal ST segment normal ST segment no elevation or depression causes of elevation include acute MI (e.g. anterior, inferior), left bundle branch block, normal variants (e.g. athletic heart, Edeiken pattern, high-take off), acute pericarditis causes of depression include myocardial ischaemia, digoxin effect, ventricular hypertrophy, acute posterior MI, pulmonary embolus, left bundle branch block normal T wave normal T wave causes of tall T waves include hyperkalaemia, hyperacute myocardial infarction and left bundle branch block causes of small, flattened or inverted T waves are numerous and include ischaemia, age, race, hyperventilation, anxiety, drinking iced water, LVH, drugs (e.g. digoxin), pericarditis, PE, intraventricular conduction delay (e.g. RBBB)and electrolyte disturbance. normal U wave
16 A positive wave form (QRS mainly above the baseline) results from the wave of depolarization moving towards the positive end of the lead. Normal EKG e.g. A negative waveform (QRS mainly below the baseline) is when a wave of depolarization is moving away from the positive electrode (towards the negative end of the lead). EKG paper has 1 millimeter small squares - so height and depth of wave is measured in millimeters. 10 mm = 1.0 mvolt Horizontal axis is time seconds for 1 mm (1 small box). 0.2 seconds for 1 large box = 5 small boxes = 5 x.04 seconds. QRS P 0.5mV 0.2sec T 7.0mV 0.06sec Positive QRS in Lead I. Negative QRS in Lead avr. R wave = 7-8 mm high in Lead I = 7-8mV. QRS wave = 0.06 seconds long in Lead I.
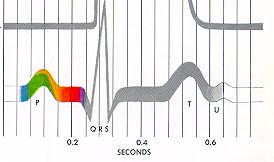
17 What these intervals represents? P wave PR interval QRS Complex ST Segment T Wave U Wave RR Interval -
18 Intervals P wave - atrial depolarization PR interval - time from sinoatrial node (S-A) to atrioventricular node (A-Vnode) QRS Complex ventricular depolarization ST Segment - beginning of ventricular repolarization T Wave - later stages of ventricular repolarization U Wave - final component of ventricular repolarization RR Interval - represents the time for one complete cardiac cycle
19 Lead Placement V1 = V2 = V3 = V4 = V5 = V6 =
20 Lead Placement V1 = 4th intercostal space, right border of sternum V2 = 4th intercostal space, left border of sternum V3 = midway between V2 and V4 V4 = 5th intercostal space, midclavicular line V5 = anteroaxillary line at level of V4 V6 = midaxillary line at level of V4 and V5
21 The standard EKG has 12 leads:what THEY EKG Leads
22 The standard EKG has 12 leads: 3 Standard Limb Leads 3 Augmented Limb Leads 6 Precordial Leads The axis of a particular lead represents the viewpoint from which it looks at the heart. EKG Leads
23 What is the PR interval in this ECG? A sec B sec C sec D E sec sec
24 You measure PR from the beginning of P to the beginning of QRS. The normal PR interval is sec, or 120 to 200 ms. 1st degree AV block is defined by PR intervals greater than 200 ms.
25 What is the QT interval of this ECG, and is it normal for this heart rate? A sec & no B sec & yes C sec & no D sec & yes E sec & maybe
26 b The QT interval is from the beginning of QRS to the end of the T wave. In this case it is between 8 and 9 small boxes long (~0.34 sec.). The upper limit of the QT is bpm. For every 10 bpm above 70, subtract 0.02 sec. Add 0.02 sec for every 10 bpm below 70. This ECG has a heart rate of about 80, so the upper limit of normal is 0.38 sec.

27 What is the PR interval of this ECG? A sec B sec C sec D sec E. 80 msec
28 c PR is from the beginning of P to the beginning of QRS. This PR is slightly prolonged.
29 What is the QRS duration seen here? A sec B sec C sec D sec E sec
30 B Measure from the beginning to the end of the QRS complex.
31 A B C D E sec sec sec sec sec
32 The correct answer is A. Measure from the beginning of the QRS complex to the end of the T wave.
33 A. 50 bpm B. 65 bpm C. 75 bpm D. 90 bpm E. 100 bpm
34 The correct answer is D. Each QRS complex is separated by about 3 1/2 big boxes. Thus the rate is between 100 and 75, or about 90 bpm.
35

36
37
38
39 The P wave corresponds to:. The QRS wave corresponds:. The T wave corresponds to :. Positive deflections mean
40 The P wave corresponds to atrial depolarization. The QRS wave corresponds to ventricular depolarization. The T wave corresponds to ventricular repolarization. Atrial repolarization is usually not seen as it is masked in the QRS wave. Positive deflections mean electrical energy is traveling toward the lead being examined
41 Inherent Rates SA: AV: Ventricles: Normal PRI: Normal QRS: Normal QTc:
42 Inherent Rates SA: 60 to 100 AV: 40 to 60 Ventricles: 20 to 40 Normal PRI: 0.12 to to 5 small boxes Normal QRS: < 0.12 Less than 3 small boxes Normal QTc: 0.35 to 0.45 QT < 1/2 RR; QTc = QT / sqrt(rr)
43 A higher pacemaker site will, normally, overdrive suppress the lower sites. SA > AV > Ventricles. So a rate of 40 could be parasympathetic drive or loss of the SA node; the pwaves will answer this question. A short PR interval is usually do to an accessory pathway, such as in Wolff Parkinson White syndrome. A long PR interval is associated with AV conduction (heart) blocks. A narrow QRS means fast conduction through the ventricles, such as superventricular tachycardia (SVT). A wide QRS is seen if the ventricles act as the pacemaker or if an electrical pacemaker is pacing the ventricles. Other things that widen a QRS are bundle branch blocks (BBB) and ventricular tachycardia with or without pulse. Abnormal QT interval (QTc) may be congenital, electrolyte imbalances, or due to drugs. Abnormal QTc has a risk of ventricular arrhythmias (e.g. Torsade). The QT interval should be less than 1/2 the RR interval (easier to determine than QTc).
44 Septal leads are Anterior leads Lateral leads
45 Septal leads are V1 and V2 Anterior leads V3 and V4 Lateral leads V5 and V6 Basically V1 and V2 are right sided and V5 and V6 are left sided Remembering this should help with axis rotation, hypertrophy, and BBBs.
 Ventricular rate [many ways to do it find yours] Count the number of R waves over 15 large squares (3 seconds) and multiply")
46 Rhythm and Rate Are there P waves? Are they regular? Does every one precede a QRS? Is the PR interval constant? What is the PR interval? The PR interval should be between 120 and 240 msec (3 to 6 small squares) Ventricular rate [many ways to do it find yours] Count the number of R waves over 15 large squares (3 seconds) and multiply by 20. To be slightly more accurate count the number of R waves over 30 large squares (6 seconds) and multiply by 10. LIMB LEAD I: Right arm -> left arm LIMB LEAD avr: right arm LIMB LEAD II: Right arm -> left leg LIMB LEAD avl: left arm LIMB LEAD III: Left arm -> left leg Rhythm strip LIMB LEAD avf: left leg (foot) CHEST LEADS V1-V6

47 Axis: Leads I, II, III
48 Normal is -30 to +90 or, in some books, 0 to +90 Lead I +: 0 degrees, Lead II +: 60 degrees, Lead III +: 120 degrees It may be helpful to draw this diagram out a few times so you re sure you can recreate it.


 is perpendicular to avr.")
49 The QRS complexes are reaching toward eachother, so Right axis. Right axis goes from +90 to +180, so we should be in that range. range Now, which lead is the most isoelectric? Meaning, the Q wave matches the height of the S wave. avr most isoelectric, so our actual axis is perpendicular to avr. Use the diagram on the previous slide. avr is at +30 degrees, so = (Lead III) is perpendicular to avr. So our axis is Right Leads V3 and V4 appear to be the most isoslectric precordial leads, so there is no obvious rotation in the horizontal plane Determining Axis: An Example

50 Normal Sinus Rhythm
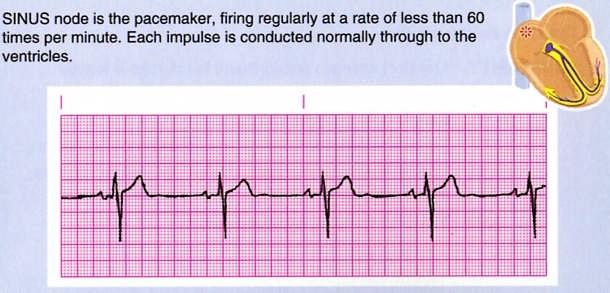
51 Sinus Bradycardia
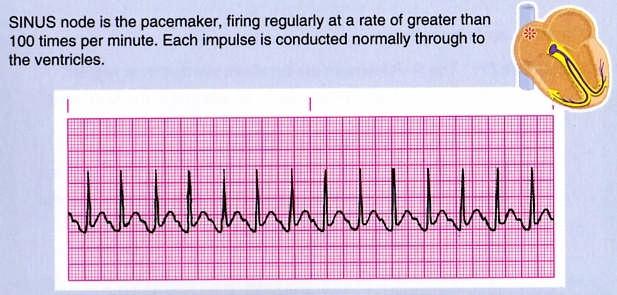
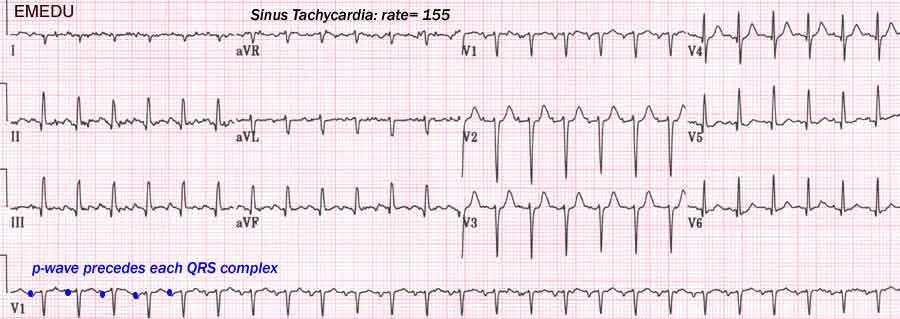
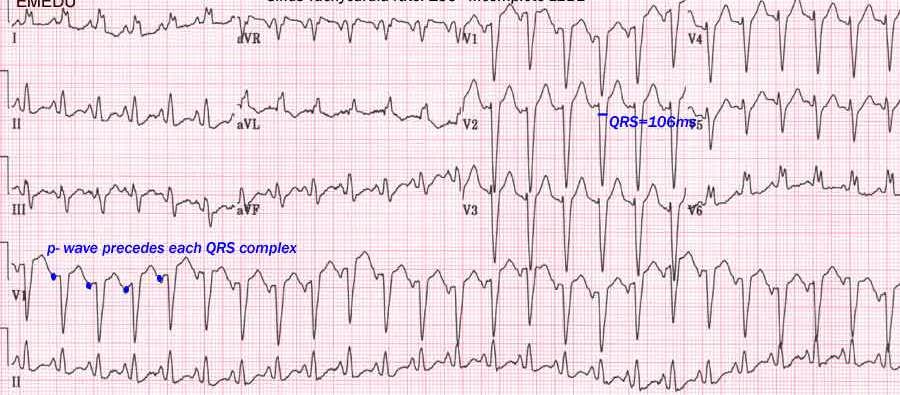
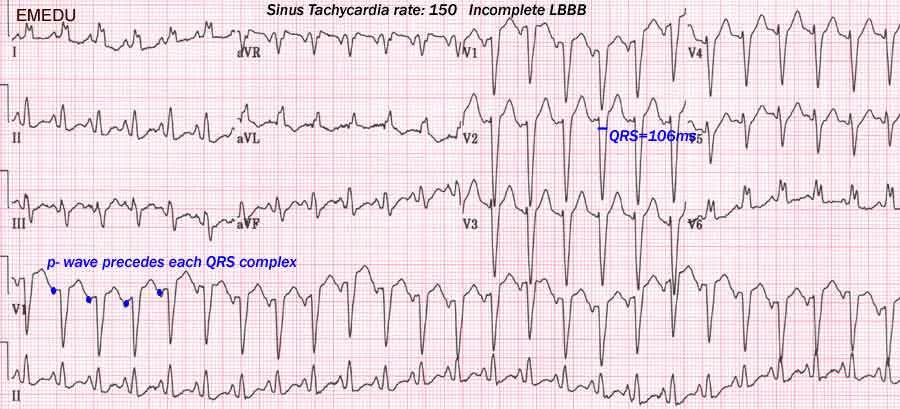
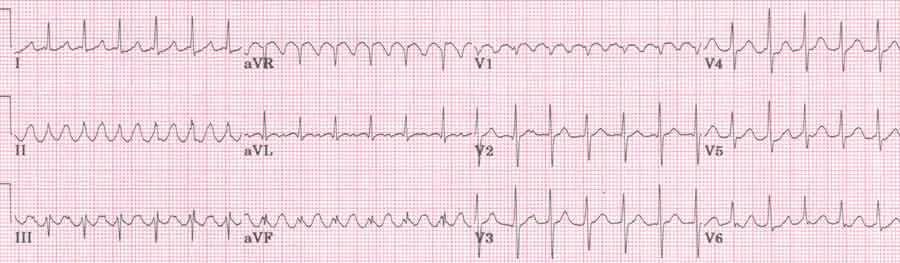
52 * Sinus Tachycardia
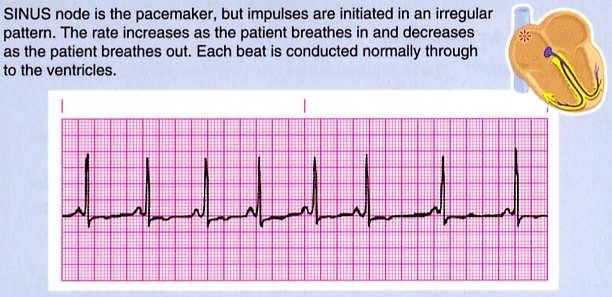
53 Sinus Arrhythmia
, but again electrical depolarization does not always mean mechanical contraction.")
54 Premature atrial contraction acronym is PAC; sort of a misnomer as this is a premature atrial depolarization. Some also call this a premature atrial beat (PAB), but again electrical depolarization does not always mean mechanical contraction. Here there is a focus other than the SA node that is firing, which causes a QRS. What is they underlying rate? 7*10 using 6-second. Or, 75 using 4 big boxes per QRS. The PAC is the third QRS; you can see there is only about 1 big box between the 2nd and 3rd QRS. Usually the abnormal focus will cause a p-wave the looks different from the other p-waves (the SA node p-waves). Here the aberrant atrial depolarization appears as a peaked p-wave in comparison. Premature Atrial Contraction

55
56
57
58
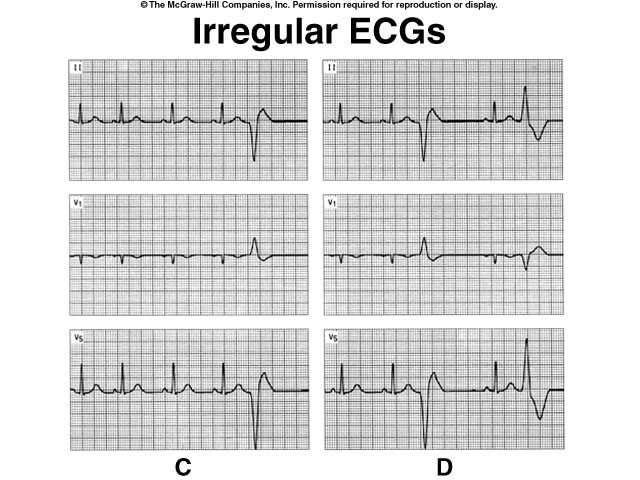
59 What do you think? a b
60 A: normal B: sinus tachycardia a b
61 What do you think? a b
62 a b A: normal B:sinus bradycardia
63
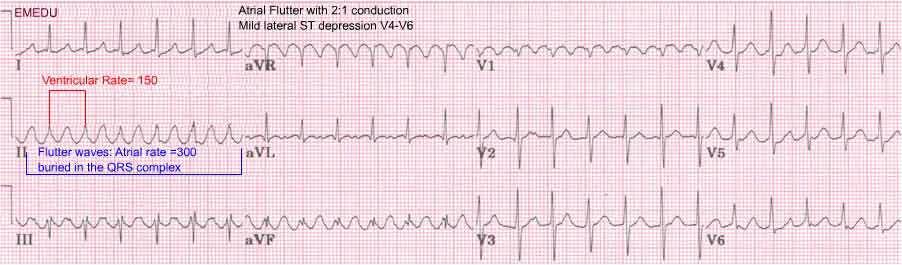
64 Normal Atrial Flutter
65
66 Normal Atrial Fibrillation
67
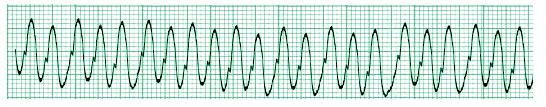
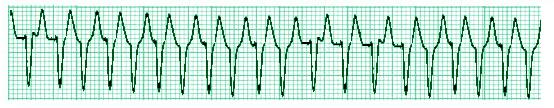
68 Normal Ventricular Tachycardia (VT)
69
70

71 Anatomic Groups (Septum)
")
72 Anatomic Groups (Anterior Wall)

73 Anatomic Groups (Lateral Wall)
")
74 Anatomic Groups (Inferior Wall)

75 Anatomic Groups (Summary)
76 Significant Q wave = Necrosis ST elevation = Injury T wave inversion = Ischemia Myocardial Infarction

77 MI Location
78 Myocardial involvement EKG leads Anterior V2, V3, V4 (at least 2) Anteroseptal V1, V2, V3 (+V4) Anterolateral V4, V5, V6 (+V3, +V2) Extensive Anterior V1 through V6 (all) Lateral V5, V6 (+I, +avl) High lateral I, avl Inferior II, III, avf (at least 2) Inferolateral as above, +V6 (+V5) Posterior V1, V2 (*recip. changes) Inferoposterolateral Combine above 3 items Right Ventricular V4R, +V3R and/or V5R
79 ELEVATION Electrolytes Left bundle branch block Early repolarization Ventricular hypertrophy Aneurysm Treatment (pericardiocentesis) Injury (acute MI, contusion) Osborne waves (hypothermia) Nonocclusive vasospasm ST Segment Elevation
80 DEPRESSED ST Drooping valve (mitral valve prolapse) Enlargement or LV with strain Potassium loss (hypokalemia) Reciprocal ST depression (inferior MI) Embolism (PE) Subendocardial ischemia Subendocardial infarct Encephalon hemorrhage Dilated cardiomyopathy Shock Toxicity of digitalis, quinidine ST Segment Depression


81 Hyperkalemia High K+ Peaked T Hypokalemia Low K+ Flat T, U Wave Electrolytes & Drugs
82
Electrical System Overview Electrocardiograms Action Potentials 12-Lead Positioning Values To Memorize Calculating Rates
 Electrocardiograms Electrical System Overview James Lamberg 2/ 74 Action Potentials 12-Lead Positioning 3/ 74 4/ 74 Values To Memorize Inherent Rates SA: 60 to 100 AV: 40 to 60 Ventricles: 20 to 40 Normal
The Electrocardiogram part II. Dr. Adelina Vlad, MD PhD
 The Electrocardiogram part II Dr. Adelina Vlad, MD PhD Basic Interpretation of the ECG 1) Evaluate calibration 2) Calculate rate 3) Determine rhythm 4) Determine QRS axis 5) Measure intervals 6) Analyze
Introduction to Electrocardiography
 Introduction to Electrocardiography Class Objectives: Introduction to ECG monitoring Discuss principles of interpretation Identify the components and measurements of the ECG ECG analysis ECG Monitoring
By the end of this lecture, you will be able to: Understand the 12 lead ECG in relation to the coronary circulation and myocardium Perform an ECG
 By the end of this lecture, you will be able to: Understand the 12 lead ECG in relation to the coronary circulation and myocardium Perform an ECG recording Identify the ECG changes that occur in the presence
ECG ABNORMALITIES D R. T AM A R A AL Q U D AH
 ECG ABNORMALITIES D R. T AM A R A AL Q U D AH When we interpret an ECG we compare it instantaneously with the normal ECG and normal variants stored in our memory; these memories are stored visually in
UNDERSTANDING YOUR ECG: A REVIEW
 UNDERSTANDING YOUR ECG: A REVIEW Health professionals use the electrocardiograph (ECG) rhythm strip to systematically analyse the cardiac rhythm. Before the systematic process of ECG analysis is described
12-Lead ECG Interpretation. Kathy Kuznar, RN, ANP
 12-Lead ECG Interpretation Kathy Kuznar, RN, ANP The 12-Lead ECG Objectives Identify the normal morphology and features of the 12- lead ECG. Perform systematic analysis of the 12-lead ECG. Recognize abnormalities
ECGs: Everything a finalist needs to know. Dr Amy Coulden As part of the Simply Finals series
 ECGs: Everything a finalist needs to know Dr Amy Coulden As part of the Simply Finals series Aims and objectives To be able to interpret basic ECG abnormalities To be able to recognise commonly tested
Family Medicine for English language students of Medical University of Lodz ECG. Jakub Dorożyński
 Family Medicine for English language students of Medical University of Lodz ECG Jakub Dorożyński Parts of an ECG The standard ECG has 12 leads: six of them are considered limb leads because they are placed
EKG. Danil Hammoudi.MD
 EKG Danil Hammoudi.MD What is an EKG? The electrocardiogram (EKG) is a representation of the electrical events of the cardiac cycle. Each event has a distinctive waveform, the study of which can lead to
ECG CONVENTIONS AND INTERVALS
 1 ECG Waveforms and Intervals ECG waveforms labeled alphabetically P wave== represents atrial depolarization QRS complex=ventricular depolarization ST-T-U complex (ST segment, T wave, and U wave)== V repolarization.
Please check your answers with correct statements in answer pages after the ECG cases.
 ECG Cases ECG Case 1 Springer International Publishing AG, part of Springer Nature 2018 S. Okutucu, A. Oto, Interpreting ECGs in Clinical Practice, In Clinical Practice, https://doi.org/10.1007/978-3-319-90557-0
12 Lead ECG. Presented by Rebecca Sevigny BSN, RN Professional Practice & Development Dept.
 12 Lead ECG Presented by Rebecca Sevigny BSN, RN Professional Practice & Development Dept. Two Main Coronary Arteries RCA LCA which branches into Left Anterior Descending Circumflex Artery Two Main Coronary
Electrocardiogram ECG. Hilal Al Saffar FRCP FACC College of medicine,baghdad University
 Electrocardiogram ECG Hilal Al Saffar FRCP FACC College of medicine,baghdad University Tuesday 29 October 2013 ECG introduction Wednesday 30 October 2013 Abnormal ECG ( ischemia, chamber hypertrophy, heart
ECG Basics Sonia Samtani 7/2017 UCI Resident Lecture Series
 ECG Basics Sonia Samtani 7/2017 UCI Resident Lecture Series Agenda I. Introduction II.The Conduction System III.ECG Basics IV.Cardiac Emergencies V.Summary The Conduction System Lead Placement avf Precordial
Basic electrocardiography reading. R3 lee wei-chieh
 Basic electrocardiography reading R3 lee wei-chieh The Normal Conduction System Lead Placement avf Limb Leads Precordial Leads Interpretation Rate Rhythm Interval Axis Chamber abnormality QRST change What
12 Lead ECG Skills: Building Confidence for Clinical Practice. Presented By: Cynthia Webner, BSN, RN, CCRN-CMC. Karen Marzlin, BSN, RN,CCRN-CMC
 12 Lead ECG Skills: Building Confidence for Clinical Practice NTI 2009 Preconference Session 803 Presented By: Karen Marzlin, BSN, RN,CCRN-CMC 1 12 Lead ECG Fundamentals: The Starting Place for Linking
REtrive. REpeat. RElearn Design by. Test-Enhanced Learning based ECG practice E-book
 Test-Enhanced Learning Test-Enhanced Learning Test-Enhanced Learning Test-Enhanced Learning based ECG practice E-book REtrive REpeat RElearn Design by S I T T I N U N T H A N G J U I P E E R I Y A W A
DR QAZI IMTIAZ RASOOL OBJECTIVES
 PRACTICAL ELECTROCARDIOGRAPHY DR QAZI IMTIAZ RASOOL OBJECTIVES Recording of electrical events in heart Established electrode pattern results in specific tracing pattern Health of heart i. e. Anatomical
Section V. Objectives
 Section V Landscape of an MI Objectives At the conclusion of this presentation the participant will be able to Outline a systematic approach to 12 lead ECG interpretation Demonstrate the process for determining
ELECTROCARDIOGRAPH. General. Heart Rate. Starship Children s Health Clinical Guideline
 General Heart Rate QRS Axis T Wave Axis PR Interval according to Heart Rate & Age P Wave Duration and Amplitude QRS Duration according to Age QT Interval R & S voltages according to Lead & Age R/S ratio
Pennsylvania Academy of Family Physicians Foundation & UPMC 43rd Refresher Course in Family Medicine CME Conference March 10-13, 2016
 Pennsylvania Academy of Family Physicians Foundation & UPMC 43rd Refresher Course in Family Medicine CME Conference March 10-13, 2016 Disclosures: EKG Workshop Louis Mancano, MD Speaker has no disclosures
ECG Interpretation Cat Williams, DVM DACVIM (Cardiology)
") ECG Interpretation Cat Williams, DVM DACVIM (Cardiology) Providing the best quality care and service for the patient, the client, and the referring veterinarian. GOAL: Reduce Anxiety about ECGs Back to
ECG Interpretation Cat Williams, DVM DACVIM (Cardiology) Providing the best quality care and service for the patient, the client, and the referring veterinarian. GOAL: Reduce Anxiety about ECGs Back to
Relax and Learn At the Farm 2012
 Relax and Learn At the Farm 2012 Session 2: 12 Lead ECG Fundamentals 101 Cynthia Webner DNP, RN, CCNS, CCRN-CMC, CHFN Though for Today Mastery is not something that strikes in an instant, like a thunderbolt,
Electrocardiography Abnormalities (Arrhythmias) 7. Faisal I. Mohammed, MD, PhD
 7. Faisal I. Mohammed, MD, PhD") Electrocardiography Abnormalities (Arrhythmias) 7 Faisal I. Mohammed, MD, PhD 1 Causes of Cardiac Arrythmias Abnormal rhythmicity of the pacemaker Shift of pacemaker from sinus node Blocks at different
Electrocardiography Abnormalities (Arrhythmias) 7 Faisal I. Mohammed, MD, PhD 1 Causes of Cardiac Arrythmias Abnormal rhythmicity of the pacemaker Shift of pacemaker from sinus node Blocks at different
Introduction to ECG Gary Martin, M.D.
 Brief review of basic concepts Introduction to ECG Gary Martin, M.D. The electrical activity of the heart is caused by a sequence of rapid ionic movements across cell membranes resulting first in depolarization
402 Index. B β-blockers, 4, 5 Bradyarrhythmias, 76 77
 Index A Acquired immunodeficiency syndrome (AIDS), 126, 163 Action potentials, 1, 5, 27 Acute coronary syndromes, 123t, 129 Adenosine, intravenous, 277 Alcohol abuse, as T wave inversion cause, 199 Aneurysm,
12 LEAD EKG BASICS. By: Steven Jones, NREMT P CLEMC
 12 LEAD EKG BASICS By: Steven Jones, NREMT P CLEMC ECG Review Waves and Intervals P wave: the sequential activation (depolarization) of the right and left atria QRS complex: right and left ventricular
Paediatric ECG Interpretation
 Paediatric ECG Interpretation Dr Sanj Fernando (thanks to http://lifeinthefastlane.com/ecg-library/paediatric-ecginterpretation/) 3 yo boy complaining of abdominal pain and chest pain Child ECG vs Adult
ECG Interpretation. Best to have a system to methodically evaluate ECG (from Dubin) * Rate * Rhythm * Axis * Intervals * Hypertrophy * Infarction
 * Rate * Rhythm * Axis * Intervals * Hypertrophy * Infarction") ECG to save Babies ECG Interpretation Best to have a system to methodically evaluate ECG (from Dubin) * Rate * Rhythm * Axis * Intervals * Hypertrophy * Infarction Electrical Activity in the heart 5 events
ECG to save Babies ECG Interpretation Best to have a system to methodically evaluate ECG (from Dubin) * Rate * Rhythm * Axis * Intervals * Hypertrophy * Infarction Electrical Activity in the heart 5 events
also aid the clinician in recognizing both the obvious and subtle abnormalities that may help guide therapy.
 Karen Lieberman, MS, CRNP f the many diagnostic tools used to screen for and evaluate cardiac abnormalities, the 12-lead electrocardiogram (ECG) is among the most basic. This inexpensive and noninvasive
Appendix D Output Code and Interpretation of Analysis
 Appendix D Output Code and Interpretation of Analysis 8 Arrhythmia Code No. Description 8002 Marked rhythm irregularity 8110 Sinus rhythm 8102 Sinus arrhythmia 8108 Marked sinus arrhythmia 8120 Sinus tachycardia
12 Lead EKG. The Basics
 12 Lead EKG The Basics Objectives Demonstrate proper 12 EKG lead placement Determine electrical axis Identify ST and T wave changes as they relate to myocardial ischemia Describe possible complications
ECG (MCQs) In the fundamental rules of the ECG all the following are right EXCEP:
 In the fundamental rules of the ECG all the following are right EXCEP:") ECG (MCQs) 2010 1- In the fundamental rules of the ECG all the following are right EXCEP: a- It is a biphasic record of myocardial action potential fluctuations. b- Deflection record occurs only during
ECG (MCQs) 2010 1- In the fundamental rules of the ECG all the following are right EXCEP: a- It is a biphasic record of myocardial action potential fluctuations. b- Deflection record occurs only during
ECG INTERPRETATION MANUAL
 Lancashire & South Cumbria Cardiac Network ECG INTERPRETATION MANUAL THE NORMAL ECG Lancashire And South Cumbria Cardiac Physiologist Training Manual THE NORMAL ECG E.C.G CHECKLIST 1) Name, Paper Speed,
ECG pre-reading manual. Created for the North West Regional EMET training program
 ECG pre-reading manual Created for the North West Regional EMET training program Author:- Dr Juan Carlos Ascencio-Lane juan.ascencio-lane@ths.tas.gov.au 1 Disclaimer This handbook has been created for
12 Lead ECG Interpretation: Color Coding for MI s
 12 Lead ECG Interpretation: Color Coding for MI s Anna E. Story, RN, MS Director, Continuing Professional Education Critical Care Nurse Online Instructional Designer 2004 Anna Story 1 Objectives review
If the P wave > 0.12 sec( 3 mm) usually in any lead. Notched P wave usually in lead I,aVl may be lead II Negative terminal portion of P wave in V1, 1
 usually in any lead. Notched P wave usually in lead I,aVl may be lead II Negative terminal portion of P wave in V1, 1") If the P wave > 0.12 sec( 3 mm) usually in any lead. Notched P wave usually in lead I,aVl may be lead II Negative terminal portion of P wave in V1, 1 mm depth and 3 mm width( most specific) Since Mitral
If the P wave > 0.12 sec( 3 mm) usually in any lead. Notched P wave usually in lead I,aVl may be lead II Negative terminal portion of P wave in V1, 1 mm depth and 3 mm width( most specific) Since Mitral
This presentation will deal with the basics of ECG description as well as the physiological basics of
 Snímka 1 Electrocardiography basics This presentation will deal with the basics of ECG description as well as the physiological basics of Snímka 2 Lecture overview 1. Cardiac conduction system functional
5- The normal electrocardiogram (ECG)
") 5- The (ECG) Introduction Electrocardiography is a process of recording electrical activities of heart muscle at skin surface. The electrical current spreads into the tissues surrounding the heart, a small
5- The (ECG) Introduction Electrocardiography is a process of recording electrical activities of heart muscle at skin surface. The electrical current spreads into the tissues surrounding the heart, a small
Diploma in Electrocardiography
 The Society for Cardiological Science and Technology Diploma in Electrocardiography The Society makes this award to candidates who can demonstrate the ability to accurately record a resting 12-lead electrocardiogram
Electrocardiography for Healthcare Professionals. Chapter 14 Basic 12-Lead ECG Interpretation
 Electrocardiography for Healthcare Professionals Chapter 14 Basic 12-Lead ECG Interpretation 2012 The Companies, Inc. All rights reserved. Learning Outcomes 14.1 Discuss the anatomic views seen on a 12-lead
Acute Coronary Syndromes. Disclosures
 Acute Coronary Syndromes Disclosures I work for Virginia Garcia Memorial Health Center, Beaverton, OR. Jon Tardiff, BS, PA-C OHSU Clinical Assistant Professor And I am a medical editor for Jones & Bartlett
12 Lead ECG Interpretation
 12 Lead ECG Interpretation Julie Zimmerman, MSN, RN, CNS, CCRN Significant increase in mortality for every 15 minutes of delay! N Engl J Med 2007;357:1631-1638 Who should get a 12-lead ECG? Also include
BASIC PRINCIPLES OF ECG INTERPRETATION
 Chapter 1 BASIC PRINCIPLES OF ECG INTERPRETATION Cardiac rhythm analysis may be accomplished informally via cardiac monitoring and more diagnostically via a 12-lead electrocardiogram (ECG). An electrocardiogram
Acute Coronary Syndromes Unstable Angina Non ST segment Elevation MI (NSTEMI) ST segment Elevation MI (STEMI)
 ST segment Elevation MI (STEMI)") Leanna R. Miller, RN, MN, CCRN-CSC, PCCN-CMC, CEN, CNRN, CMSRN, NP Education Specialist LRM Consulting Nashville, TN Objectives Evaluate common abnormalities that mimic myocardial infarction. Identify
Leanna R. Miller, RN, MN, CCRN-CSC, PCCN-CMC, CEN, CNRN, CMSRN, NP Education Specialist LRM Consulting Nashville, TN Objectives Evaluate common abnormalities that mimic myocardial infarction. Identify
SIMPLY ECGs. Dr William Dooley
 SIMPLY ECGs Dr William Dooley 1 No anatomy just interpretation 2 Setting up an ECG 3 Setting up an ECG 1 V1-4 th Right intercostal space at sternal border 2 V2-4 th Left intercostal space at sternal border
SIMPLY ECGs. Dr William Dooley
 SIMPLY ECGs Dr William Dooley Content Basic ECG interpretation pattern Some common (examined) abnormalities Presenting ECGs in context Setting up an ECG Setting up an ECG 1 V1-4 th Right intercostal space
All About STEMIs. Presented By: Brittney Urvand, RN, BSN, CCCC. Essentia Health Fargo Cardiovascular Program Manager.
 All About STEMIs Presented By: Brittney Urvand, RN, BSN, CCCC Essentia Health Fargo Cardiovascular Program Manager Updated 10/2/2018 None Disclosures Objectives Identify signs and symptoms of a heart attack
2017 EKG Workshop Advanced. Family Medicine Review Course Lou Mancano, MD, FAAFP Reading Health System Family and Community Medicine Reading, PA
 2017 EKG Workshop Advanced Family Medicine Review Course Lou Mancano, MD, FAAFP Reading Health System Family and Community Medicine Reading, PA Part II - Objective Describe a useful approach to interpreting
Understanding basics of EKG
 Understanding basics of EKG By Alula A.(R III) www.le.ac.uk Topic for discussion Understanding of cellular electrophysiology Basics Rate Rhythm Axis Intervals P wave QRS ST/T wave Abnormal EKGs Understanding
Lab Activity 24 EKG. Portland Community College BI 232
 Lab Activity 24 EKG Reference: Dubin, Dale. Rapid Interpretation of EKG s. 6 th edition. Tampa: Cover Publishing Company, 2000. Portland Community College BI 232 Graph Paper 1 second equals 25 little boxes
ECG. Prepared by: Dr.Fatima Daoud Reference: Guyton and Hall Textbook of Medical Physiology,12 th edition Chapters: 11,12,13
 ECG Prepared by: Dr.Fatima Daoud Reference: Guyton and Hall Textbook of Medical Physiology,12 th edition Chapters: 11,12,13 The Concept When the cardiac impulse passes through the heart, electrical current
General Introduction to ECG. Reading Assignment (p2-16 in PDF Outline )
") General Introduction to ECG Reading Assignment (p2-16 in PDF Outline ) Objectives 1. Practice the 5-step Method 2. Differential Diagnosis: R & L axis deviation 3. Differential Diagnosis: Poor R-wave progression
General Introduction to ECG Reading Assignment (p2-16 in PDF Outline ) Objectives 1. Practice the 5-step Method 2. Differential Diagnosis: R & L axis deviation 3. Differential Diagnosis: Poor R-wave progression
ECG interpretation basics
 ECG interpretation basics Michał Walczewski, MD Krzysztof Ozierański, MD 21.03.18 Electrical conduction system of the heart Limb leads Precordial leads 21.03.18 Precordial leads Precordial leads 21.03.18
CORONARY ARTERIES HEART
 CARDIAC/ECG MODULE THE HEART CORONARY ARTERIES FIBRILLATING HEART CORONARY ARTERIES HEART PRACTICE RHYTHMS PRACTICE RHYTHMS ELECTRICAL CONDUCTION SA Node (60 100) Primary pacemaker AV Node (40 60) ***Creates
BASIC CONCEPT OF ECG
 BASIC CONCEPT OF ECG Electrocardiogram The electrocardiogram (ECG) is a recording of cardiac electrical activity. The electrical activity is readily detected by electrodes attached to the skin. After the
15 16 September Seminar W10O. ECG for General Practice
 15 16 September 2012 Seminar W10O ECG for General Practice Speaker: Ms Natasha Eaton ECG for General Practice Speaker: Natasha Eaton Cardiac CNC Executive Representative Electrocardiography The graphic
ECG Interpretation Made Easy
 ECG Interpretation Made Easy Dr. A Tageldien Abdellah, MSc MD EBSC Lecturer of Cardiology- Hull University Hull York Medical School 2007-2008 ECG Interpretation Made Easy Synopsis Benefits Objectives Process
- why the T wave is deflected upwards although it's a repolarization wave?
 Cardiac Electrograph: - why the T wave is deflected upwards although it's a repolarization wave? After depolarization the ventricle contracts but since the heart is a volume conductor (3D not 2D), when
Electrocardiography Normal 5. Faisal I. Mohammed, MD, PhD
 Electrocardiography Normal 5 Faisal I. Mohammed, MD, PhD 1 Objectives 2 1. Describe the different waves in a normal electrocardiogram. 2. Recall the normal P-R and Q-T interval time of the QRS wave. 3.
CRC 431 ECG Basics. Bill Pruitt, MBA, RRT, CPFT, AE-C
 CRC 431 ECG Basics Bill Pruitt, MBA, RRT, CPFT, AE-C Resources White s 5 th ed. Ch 6 Electrocardiography Einthoven s Triangle Chest leads and limb leads Egan s 10 th ed. Ch 17 Interpreting the Electrocardiogram
Preface: Wang s Viewpoints
 AHA/ACCF/HRS Recommendations for the Standardization and Interpretation of the Electrocardiogram: Part IV, Ischemia and Infarction Presented by: WANG, TZONG LUEN, MD, PhD, JM, FACC, FESC, FCAPSC Professor,
2017 EKG Workshop Basic. Family Medicine Review Course Lou Mancano, MD, FAAFP Reading Health System Family and Community Medicine Reading, PA
 2017 EKG Workshop Basic Family Medicine Review Course Lou Mancano, MD, FAAFP Reading Health System Family and Community Medicine Reading, PA Part I - Objectives Discuss a systematic approach to EKG interpretation
12 Lead ECG Interpretation: The Basics and Beyond
 12 Lead ECG Interpretation: The Basics and Beyond Cindy Weston, DNP, RN, CCRN, CNS-CC, FNP-BC Assistant Professor Texas A&M University College of Nursing cweston@tamhsc.edu Objectives Review the basics
ECG Cases and Questions. Ashish Sadhu, MD, FHRS, FACC Electrophysiology/Cardiology
 ECG Cases and Questions Ashish Sadhu, MD, FHRS, FACC Electrophysiology/Cardiology 32 yo female Life Insurance Physical 56 yo male with chest pain Terminology Injury ST elevation Ischemia T wave inversion
PATIENT S NAME, DATE/TIME,
 ECG and Arrhythmias Dec, 1 st 2014 Doctor Mohammad Jarrah References: - Lecture and Slides - ECG Made Easy - Davidson Principles of Medicine - First Aid Cases for the USMLE Step 1 - Mini-OSCE Archive ECG
INTRODUCTION TO ECG. Dr. Tamara Alqudah
 INTRODUCTION TO ECG Dr. Tamara Alqudah Excitatory & conductive system of the heart + - The ECG The electrocardiogram, or ECG, is a simple & noninvasive diagnostic test which records the electrical
ELECTROCARDIOGRAPHY KEVIN REBECK PA-C. For more presentations
 ELECTROCARDIOGRAPHY KEVIN REBECK PA-C For more presentations www.medicalppt.blogspot.com Objectives ECG History Pathophysiology Basics Case Historys Electrical activation of the heart In the heart
ECG Practice Strips Discussion part 1:
 ECG Practice Strips Discussion part 1: The first 20 strips are for teaching various abnormalities of the morphology of the waves of the ECG. Strips 21 and following are for teaching some abnormalities
PEDIATRIC EKG WORKSHOP
 WHAT s NEW IN MEDICINE 2018 PEDIATRIC EKG WORKSHOP Salaam Sallaam, MD Asst. Prof, Division of Cardiology Department of Pediatrics Seattle Children s Hospital OVERVIEW Pediatric EKG interpretation Normal
ECG Interpretation. Introduction to Cardiac Telemetry. Michael Peters, RN, CCRN, CFRN CALSTAR Air Medical Services
 ECG Interpretation Introduction to Cardiac Telemetry Michael Peters, RN, CCRN, CFRN CALSTAR Air Medical Services Disclosures Nothing to disclose Objectives Describe the electrical conduction pathway in
ECG WORKBOOK. Rohan Jayasinghe
 ECG WORKBOOK Rohan Jayasinghe Contents Preface vii Foreword viii Acknowledgements ix The author x Reviewers xi Section 1 Basics of the ECG 1 Section 2 ECG-based diagnosis: pathology by ECG 21 Section 3
Understanding the 12-lead ECG, part II
 Bundle-branch blocks Understanding the 12-lead ECG, part II Most common electrocardiogram (ECG) abnormality Appears as a wider than normal S complex Occurs when one of the two bundle branches can t conduct
CORONARY ARTERIES. LAD Anterior wall of the left vent Lateral wall of left vent Anterior 2/3 of interventricluar septum R & L bundle branches
 CORONARY ARTERIES RCA Right atrium Right ventricle SA node 55% AV node 90% Posterior wall of left ventricle in 90% Posterior third of interventricular septum 90% LAD Anterior wall of the left vent Lateral
12-Lead EKG Interpretation for the Primary Care Provider
 21 st Annual Southwestern Regional Nurse Practitioner Symposium July 26, 2009 12-Lead EKG Interpretation for the Primary Care Provider Fran Stier MSN, ANP-BC, ACNP-BC Heart Health Care LLC Show Low, AZ
Cardiology Flash Cards
 Cardiology Flash Cards EKG in a nut shell www.brain101.info Conduction System www.brain101.info 2 Analyzing EKG Step by step Steps in Analyzing ECG'S 1. Rhythm: - Regular _ Sinus, Junctional or Ventricular.
3/26/15 HTEC 91. EKG Sign-in Book. The Cardiac Cycle. Parts of the ECG. Waves. Waves. Review of protocol Review of placement of chest leads (V1, V2)
") EKG Sign-in Book HTEC 91 Review of protocol Review of placement of chest leads (V1, V2) Medical Office Diagnostic Tests Week 2 http://www.cvphysiology.com/arrhythmias/a013c.htm The Cardiac Cycle Represents
EKG Sign-in Book HTEC 91 Review of protocol Review of placement of chest leads (V1, V2) Medical Office Diagnostic Tests Week 2 http://www.cvphysiology.com/arrhythmias/a013c.htm The Cardiac Cycle Represents
1/22/2007 Fernald Medical Monitoring Program Sort Code EKG coding
 1/22/2007 Fernald Medical Monitoring Program Sort Code EKG coding PLEASE NOTE THAT ALL EKG CODES MUST RANGE FROM 500-599 OR FROM 900-999. PLEASE DO NOT ASSIGN NUMBERS OUTSIDE THAT RANGE FOR EKG CODES.
The Fundamentals of 12 Lead EKG. ECG Recording. J Point. Reviewing the Cardiac Conductive System. Dr. E. Joe Sasin, MD Rusty Powers, NRP
 The Fundamentals of 12 Lead EKG Dr. E. Joe Sasin, MD Rusty Powers, NRP SA Node Intranodal Pathways AV Junction AV Fibers Bundle of His Septum Bundle Branches Purkinje System Reviewing the Cardiac Conductive
ABCs of ECGs. Shelby L. Durler
 ABCs of ECGs Shelby L. Durler Objectives Review the A&P of the cardiac conduction system Placement and obtaining 4-lead and 12-lead ECGs Overview of the basics of ECG rhythm interpretation Intrinsic
December 2018 Tracings
 Tracings Tracing 1 Tracing 4 Tracing 1 Answer Tracing 4 Answer Tracing 2 Tracing 5 Tracing 2 Answer Tracing 5 Answer Tracing 3 Tracing 6 Tracing 3 Answer Tracing 6 Answer Questions? Contact Dr. Nelson
Determining Axis and Axis Deviation on an ECG
 Marquette University e-publications@marquette Physician Assistant Studies Faculty Research and Publications Health Sciences, College of 7-15-2010 Determining Axis and Axis Deviation on an ECG Patrick Loftis
What the ECG is about
 What to expect from the ECG 00 The electricity of the heart 00 The shape of the ECG 00 The ECG electrical pictures 00 The shape of the QRS complex 00 Making a recording practical points 00 How to report
BEDSIDE ECG INTERPRETATION
 BEDSIDE ECG INTERPRETATION Presented by: Ryan Dean, RN, MSN, CCRN, CCNS, CFRN Flight Nurse 2017 Based on presentations originally by Gennifer DePaoli, RN Objectives Hospital policies Electrical conduction
Chapter 2 Practical Approach
 Chapter 2 Practical Approach There are beginners in electrocardiogram (ECG) analysis who are fascinated by a special pattern (e.g., a bundle-branch block or a striking Q wave) and thereby overlook other
Atlantic Health System
 Atlantic Health System Morristown Medical Center Newton Medical Center Overlook Medical Center Basic Dysrhythmia Course Day 1 1 2 Chapter 1 Anatomy and Physiology Learning Objectives 1) Identify electrophysiology
CASE 10. What would the ST segment of this ECG look like? On which leads would you see this ST segment change? What does the T wave represent?
 CASE 10 A 57-year-old man presents to the emergency center with complaints of chest pain with radiation to the left arm and jaw. He reports feeling anxious, diaphoretic, and short of breath. His past history
Case 1. Case 2. Case 3
 Case 1 The correct answer is D. Occasionally, the Brugada syndrome can present similar morphologies to A and also change depending on the lead position but in the Brugada pattern the r is wider and ST
Dr. Schroeder has no financial relationships to disclose
 Valerie A Schroeder MD MS Assistant Professor University of Kansas Medical Center READING THE WAVES- THE HEART S ELECTRICAL MESSAGE FINANCIAL DISCLOSURE Dr. Schroeder has no financial relationships to
EKG Practice. Homan Wai
 EKG Practice Homan Wai Objectives Learn EKG by Examples Learn by repetition Learn by repetition Learn by repetition Learn by repetition Learn by repetition Learn by repetition Learn by repetition Details
Step by step approach to EKG rhythm interpretation:
 Sinus Rhythms Normal sinus arrhythmia Small, slow variation of the R-R interval i.e. variation of the normal sinus heart rate with respiration, etc. Sinus Tachycardia Defined as sinus rhythm with a rate
Matters of the Heart: Comprehensive Cardiology SARAH BEANLANDS RN BSCN MSC
 Matters of the Heart: Comprehensive Cardiology SARAH BEANLANDS RN BSCN MSC Who am I? Class Outline Gross anatomy of the heart Trip around the heart Micro anatomy: cellular and tissue level Introduction
10 ECGs No Practitioner Can Afford to Miss. Objectives
 10 ECGs No Practitioner Can Afford to Miss Mary L. Dohrmann, MD Professor of Clinical Medicine Division of Cardiovascular Medicine University of Missouri School of Medicine No disclosures Objectives 1.
A few new tools for better detection and understanding of STEMIs in the field.
 A few new tools for better detection and understanding of STEMIs in the field. Let s talk, prep and placement. Try to shoot for quality, consistency and no artifact! (looking sometimes for 1 or 2 mm changes)
Study methodology for screening candidates to athletes risk
 1. Periodical Evaluations: each 2 years. Study methodology for screening candidates to athletes risk 2. Personal history: Personal history of murmur in childhood; dizziness, syncope, palpitations, intolerance
CARDIOVASCULAR PHYSIOLOGY ECG. Dr. Ana-Maria Zagrean
 CARDIOVASCULAR PHYSIOLOGY ECG Dr. Ana-Maria Zagrean Electrocardiogram (ECG) ECG is a non-invasive method to record at the body surface the electrical activity of the heart. - the rate and regularity of
Pathologic ECG. Adelina Vlad, MD PhD
 Pathologic ECG Adelina Vlad, MD PhD Basic Interpretation of the ECG 1) Evaluate calibration 2) Calculate rate 3) Determine rhythm 4) Determine QRS axis 5) Measure intervals 6) Analyze the morphology and
12 LEAD EKG & CXR INTERPRETATION.
 12 LEAD EKG & CXR INTERPRETATION www.cherylherrmann.com cherrmann@frontier.com Audio Product Recording discount for participants $60 Nonparticipants = $190 o Get CEs and manual https://catalog.vyne.com
Appendix. Table 1: Causes for abnormal axis deviation Left axis deviation
 Appendix Table 1: Causes for abnormal axis deviation Left axis deviation Normal variant (2 5%) Left anterior fascicular block Left ventricular hypertrophy Inferior wall myocardial infarction Primum atrial