5 -GGTAAAGCAGGTCTAGGTGGCTGACAGTCT-3. Cre-transgene allele was detected. by PCR using the primers; 5 -ACATGTTCAGGGATCGCCAG-3 and
|
|
|
- Benedict Ellis
- 6 years ago
- Views:
Transcription
1 Supplemental Information Methods PCR primers for mice genotyping The Gab1 flox allele can be distinguished from the wild type Gab1 allele by PCR on genomic DNAs extracted from tails, using the primer pair 5 -GCGCCTTCTTTGCATCACCTCATCT-3 and 5 -GGTAAAGCAGGTCTAGGTGGCTGACAGTCT-3. Cre-transgene allele was detected by PCR using the primers; 5 -ACATGTTCAGGGATCGCCAG-3 and 5 -TAACCAGTGAAACAGCATTGC-3. Gab2 allele was determined by PCR using the following primers: 5 -AATGTAGACAGTCAGTGCCTAGAGGGTCCA-3 and 5 - CATGTATCATGACATTTGTGCTCCACCA-3 for wild type allele detection; 5 -AATGTAGACAGTCAGTGCCTAGAGGGTCCA-3 and 5 -CAGCAGCCTCTGTTCCACATACACTTCAT-3 for deleted allele detection. Materials. Anti-caspase-3, and anti-cleaved caspase-3 (Asp175) Ab were purchased from Cell Signaling Technology. Anti-ErbB1, ErbB2 (Neu), ErbB3, and ErbB4 Ab were from Santa Cruz Biotechnology. Hoechst33342 and staurosporine were from Sigma. VEGF was from R&D. RT-PCR analyses. Total RNAs extracted from heart tissues were subjected to RT-PCR using Superscript II, a reverse transcriptase, and random hexamers (Invitrogen). The first strand cdnas were PCR-amplified, using the following primer pairs: Gab1 1
2 5 -ATGAGCGGCGGCGAAGTGGTTTGCT-3 and 5 -CGCGACTGAAGAAGCTTCCATCTGA-3 ; Gab2 5 -GAGAAGAAGTTGAGGCGCTA-3 and 5 -TGGACCCACTTATTCATGTC -3 ; Gab3 5 -GAGAGTCTCTCTCACATGC-3 and 5 -GGGTGAAGCTGTGGGATA-3 ; GAPDH 5 -TGAAGGTCGGAGTCAACGGATTTGG-3 and 5 -CATGTGGGCCATGAGGTCCACCAC-3 (Wolf et al., 2002). Mouse strains. The transgenic mice expressing the Cre recombinase under the control of α-mhc promoter in C57BL/6J background (α-mhc-cre mice ) were generated as previously reported (Yamaguchi et al., 2004). To examine the spatio-temporal recombination mediated by α -MHC promoter-driven Cre, α-mhc-cre mice were crossed with enhanced green fluorescent protein (EGFP) reporter mice (CAG-CAT EGFP) obtained from J. Miyazaki, Osaka University).(Kawamoto et al., 2001) Histological analyses. Hearts from mice at indicated age were fixed with 10% neutralized formalin, embedded in paraffin, and sectioned at 4 μm thickness. H&E, Masson s trichrome and Elastica van Gieson stainings were performed on serial sections. For electron microscopy, LV from mice at 12 wk of age were fixed with 2.5% glutaraldehyde in 0.1 M phosphate buffer (ph 7.4), sectioned and stained by the conventional osmium-uranium-lead method. For the terminal deoxyribonucleotidyl transferase-mediated dutp-biotin nick end labeling (TUNEL) assay, the hearts were resected, embedded in OCT compound (SAKURA), frozen, and cryosectioned perpendicular to the long axis. We performed 2
3 TUNEL assay using in situ cell death detection kit (Roche) according to the manufacturer s instructions. Sections were co-stained with Hoechst The number of TUNEL-positive nuclei was counted by examining the entire section with a 40 objective. Molecular mass spectrometric analyses. Heart lysates from control (flox/flox) and Gab1CKO mice at 10 wk of age were immunoprecipitated using anti-gab1 serum, followed by silver staining and immunoblotting with anti-gab1 Ab. The bands, which were detected in the immunoprecipitates of control mice but not in those of Gab1CKO mice heart lysates, were excised from the silver-stained gel and subjected to mass spectrometry. Mass spectrometric identification of proteins was performed as previously described (Jensen et al., 1996). Briefly, after SDS-PAGE, the proteins visualized by silver staining were excised separately from gels, followed by the in-gel digestions with trypsin (Promega) in a buffer containing 50 mm ammonium bicarbonate (ph 8.0) and 2% acetonitrile overnight at 37 C. Molecular mass analyses of tryptic peptides were performed by matrix-assisted laser desorption/ionization time-of-flight mass spectrometory (MALDI-TOF/MS) using an ultraflex TOF/TOF (Bruker Daltonics). Proteins were identified by comparison between the MW determined by MALDI-TOF/MS and theoretical peptides masses from Gab1. Isolation of cardiomyocytes and non-cardiomyocytes. After Percoll-gradient isolation of cardiomyocytes and non-cardiomyocytes from neonatal rat hearts, we characterized non-cardiomyocytes by immunostaining these cells using following antibodies; anti-α-sma monoclonal antibody (for smooth muscle staining, DAKO), anti-vwf 3
4 polyclonal antibody (for endothelia cell staining, DAKO). The population of non-cardiomyocytes were as follows; α-sma-positive smooth muscle cells (5.2%), vwf-positive endothelial cells (8.7%), α-actinin-positive cardiomyocytes (1.0%). The residual cells in this fraction (approximately 85%) might be ascribed to cardiac fibroblasts. Statistical analysis. All data were expressed as mean±sem. Differences among multiple groups were compared by one-way ANOVA followed by a post hoc comparison tested with Scheffe s method. Student s t-test was used to analyze differences between two groups. A value of P < 0.05 was considered as statistically significant. 4
5 References Jensen,O.N., Podtelejnikov,A., and Mann,M. (1996). Delayed extraction improves specificity in database searches by matrix-assisted laser desorption/ionization peptide maps. Rapid Commun. Mass Spectrom. 10, Kawamoto,S., Nitta,Y., Tashiro,F., Nakano,A., Yamato,E., Tahara,H., Tabayashi,K., and Miyazaki,J. (2001). Suppression of T(h)1 cell activation and prevention of autoimmune diabetes in NOD mice by local expression of viral IL-10. Int. Immunol. 13, Wolf,I., Jenkins,B.J., Liu,Y., Seiffert,M., Custodio,J.M., Young,P., and Rohrschneider,L.R. (2002). Gab3, a new DOS/Gab family member, facilitates macrophage differentiation. Mol. Cell Biol. 22, Yamaguchi,O., Watanabe,T., Nishida,K., Kashiwase,K., Higuchi,Y., Takeda,T., Hikoso,S., Hirotani,S., Asahi,M., Taniike,M., Nakai,A., Tsujimoto,I., Matsumura,Y., Miyazaki,J., Chien,K.R., Matsuzawa,A., Sadamitsu,C., Ichijo,H., Baccarini,M., Hori,M., and Otsu,K. (2004). Cardiac-specific disruption of the c-raf-1 gene induces cardiac dysfunction and apoptosis. J. Clin. Invest 114,
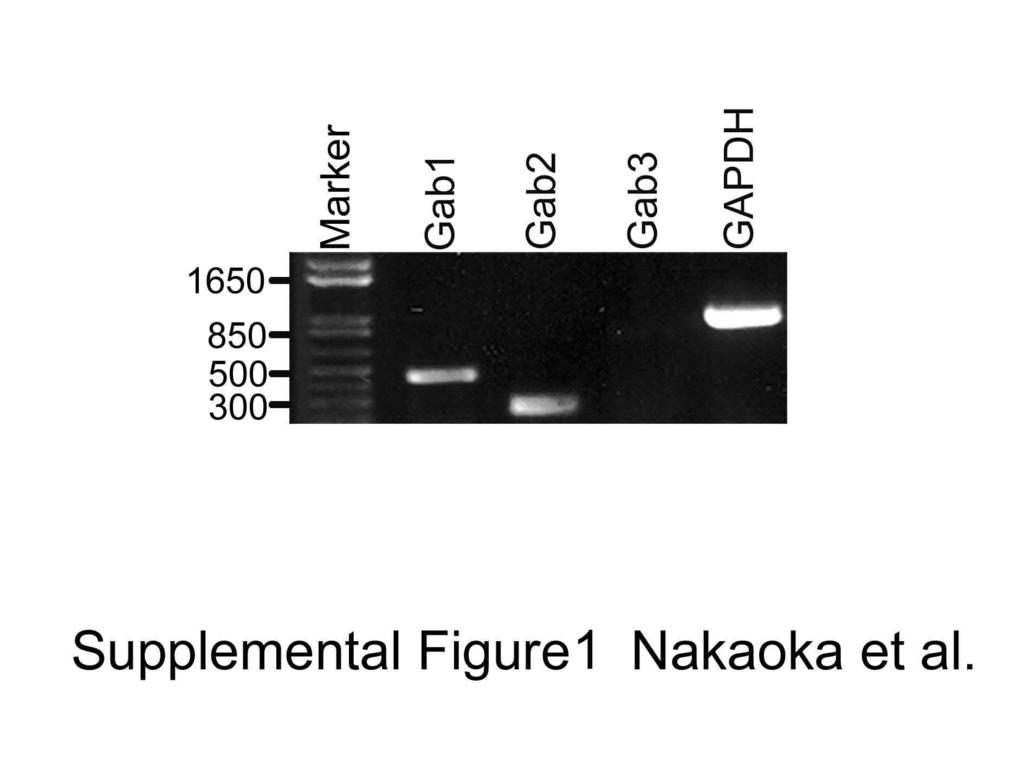
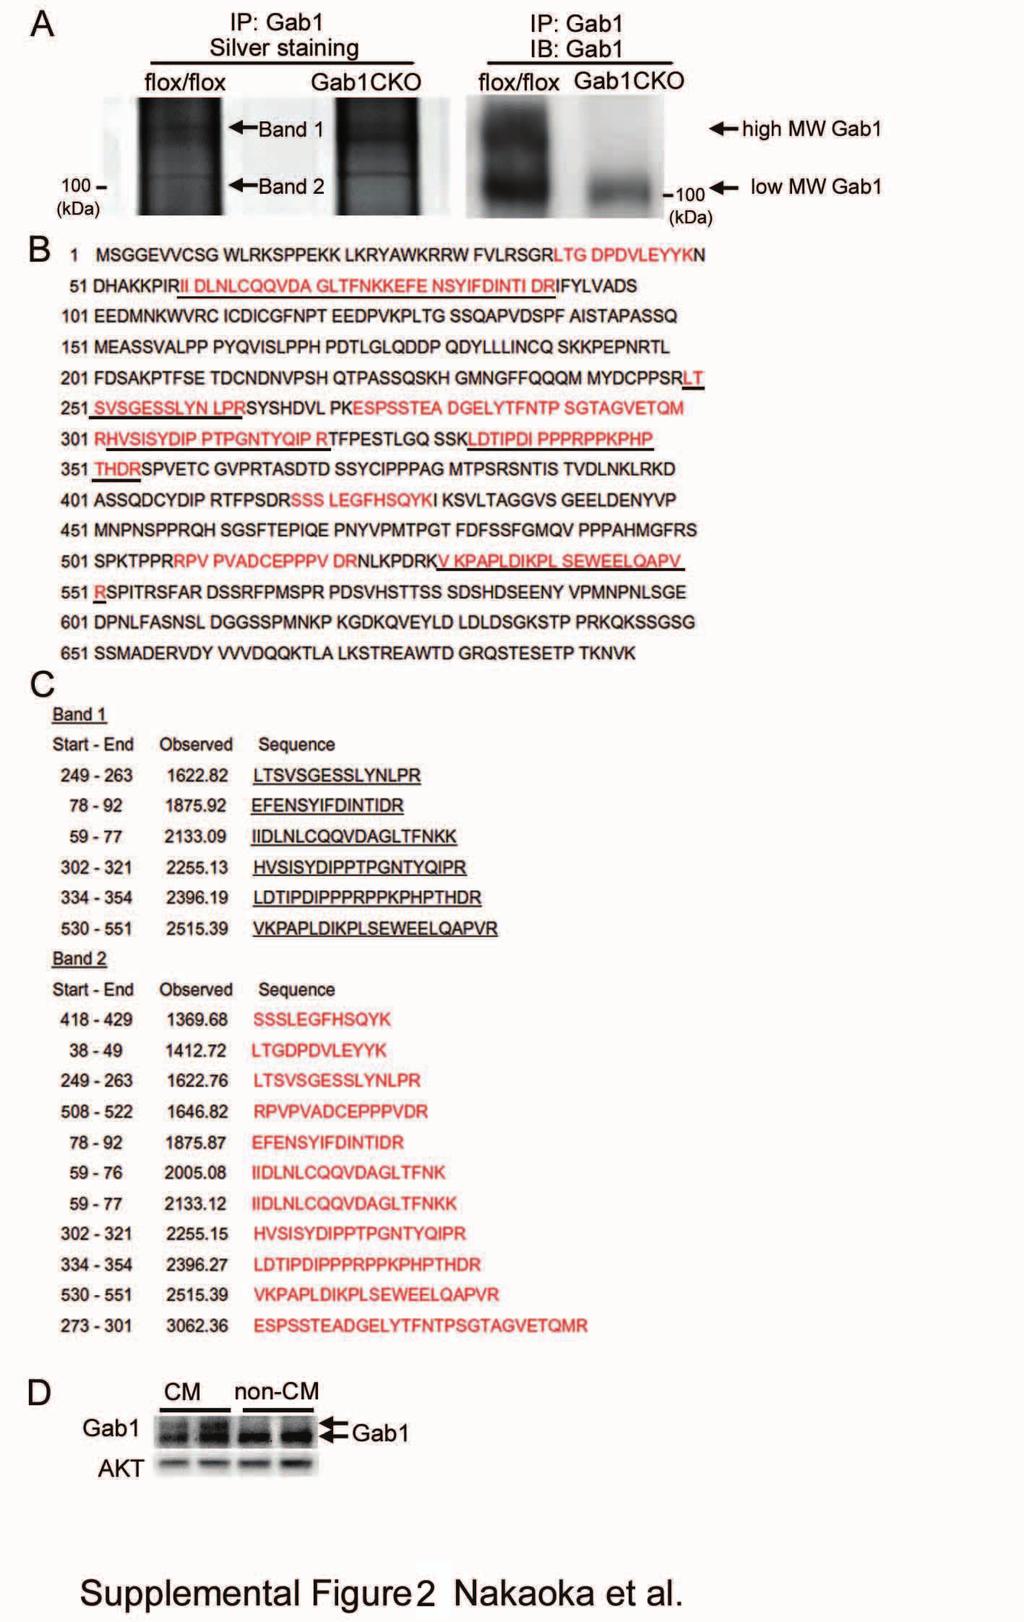
6 Supplemental Figure Legends Supplemental Figure 1 RT-PCR shows the expression of Gab1 and Gab2 mrnas, but not Gab3 mrna in the murine heart. Supplemental Figure 2 Molecular characterization of high MW Gab1 isoform in the heart. (A) Heart lysates from control (flox/flox) and Gab1CKO mice were subjected to immunoprecipitation with anti-gab1 serum, followed by silver staining and immunoblotting with anti-gab1 Ab. The bands, which were detected in the immunoprecipitates of control mice but not in those of Gab1CKO mice heart lysates were excised from silver-stained gel and subjected to mass spectrometry. The Band 1 in the left panel corresponded to the high MW Gab1 and the Band 2 in the left panel corresponded to the low MW Gab1 which was reduced to approximately 20% in Gab1CKO mice heart. (B) The result of TOF-MS using the fragments obtained by A. The amino acid sequence of murine Gab1 (gi ) is written in black characters. The underlined peptides were identified by a mass spectrometry analysis of Band 1. The peptides marked by red characters were identified by a mass spectrometry analysis of Band 2. (C) Band 1 corresponding to the high MW Gab1 was confirmed to possess the partial amino acid sequence of Gab1. Top panel and bottom panel show the peptide fragments and their molecular weights obtained from the mass analysis of Band 1 and Ban2, respectively. (D) Cardiac-specific high MW Gab1 was detected in neonatal rat cardiomyocytes (CM), but not in neonatal rat non-cardiomyocytes (non-cm). Cell lysates from two independent experiments were analyzed. AKT was checked as a loading control. Arrows indicate two 6
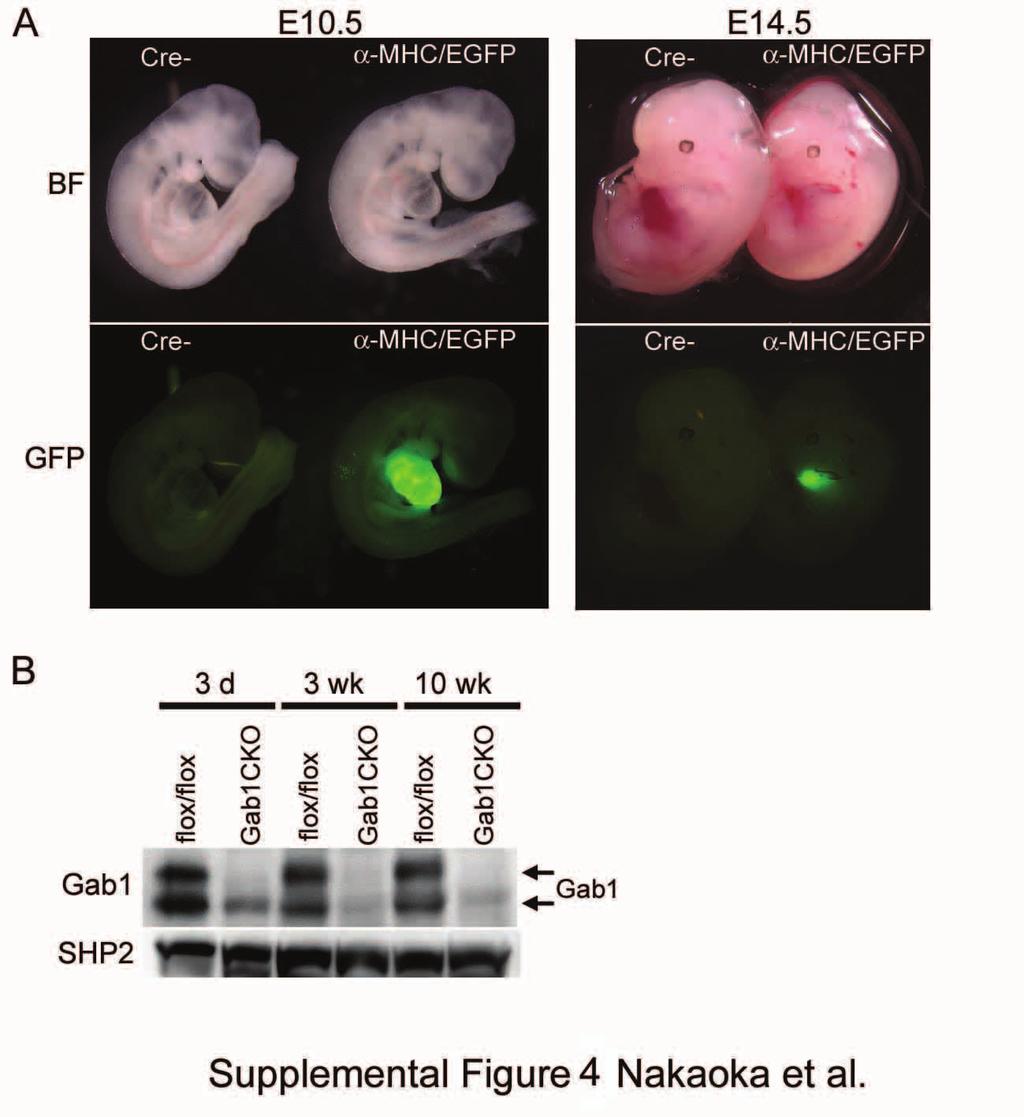
7 isoforms of Gab1 in CM. Supplemental Figure 3 Tyrosine-phosphorylation of ErbB receptors in the murine hearts upon stimulation with NRG-1β. Receptor tyrosine-phosphorylation was examined by IB using PY99 Ab after IP with anti-erbb1 Ab (A), anti-erbb2 Ab (B), anti-erbb3 Ab (C), or anti-erbb4 Ab (D). Note that ErbB2 and ErbB4 were strongly tyrosine-phosphorylated after injection with NRG-1β. (E) Co-IP of Gab1 with ErbB4 after stimulation with NRG-1β was observed in the heart lysate of mice stimulated with NRG-1β for 5 min. Representative blots of three experiments are shown. Supplemental Figure 4 Spatio-temporal Cre-mediated recombination in the embryos of α-mhc-cre transgenic mice and ablation of Gab1 protein during the various postnatal stages of Gab1CKO mice. (A) α-mhc-cre mice were bred with enhanced green fluorescent protein (EGFP) reporter mice (CAG-CAT-EGFP mice). We observed strong expression of EGFP in the hearts of offsprings which possessed both α-mhc-cre and CAG-CAT-EGFP allele (denoted as α-mhc/egfp) at embryonic day 10.5 (E10.5) and 14.5 (E14.5). (B) To examine whether Gab1 protein is efficiently ablated during postnatal development in Gab1CKO mice, we investigated Gab1 expression by performing western blot analyses using heart lysates from control (flox/flox) and Gab1CKO mice at the indicated age. We observed the ablation of Gab1 protein even in the hearts of 3 d-old Gab1CKO mice as well as 3 wk- and 10 wk-old Gab1CKO. SHP2 was checked as a loading control. Arrows indicate two isoforms of Gab1 in the hearts. 7
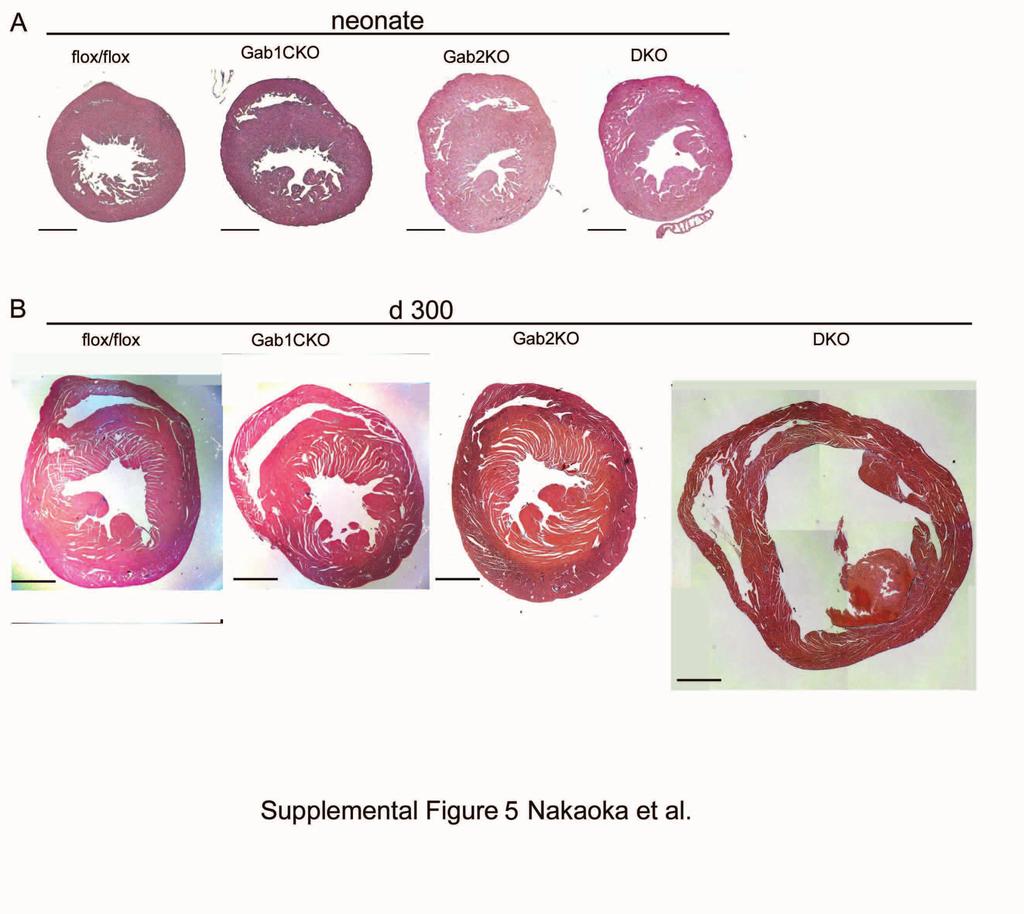
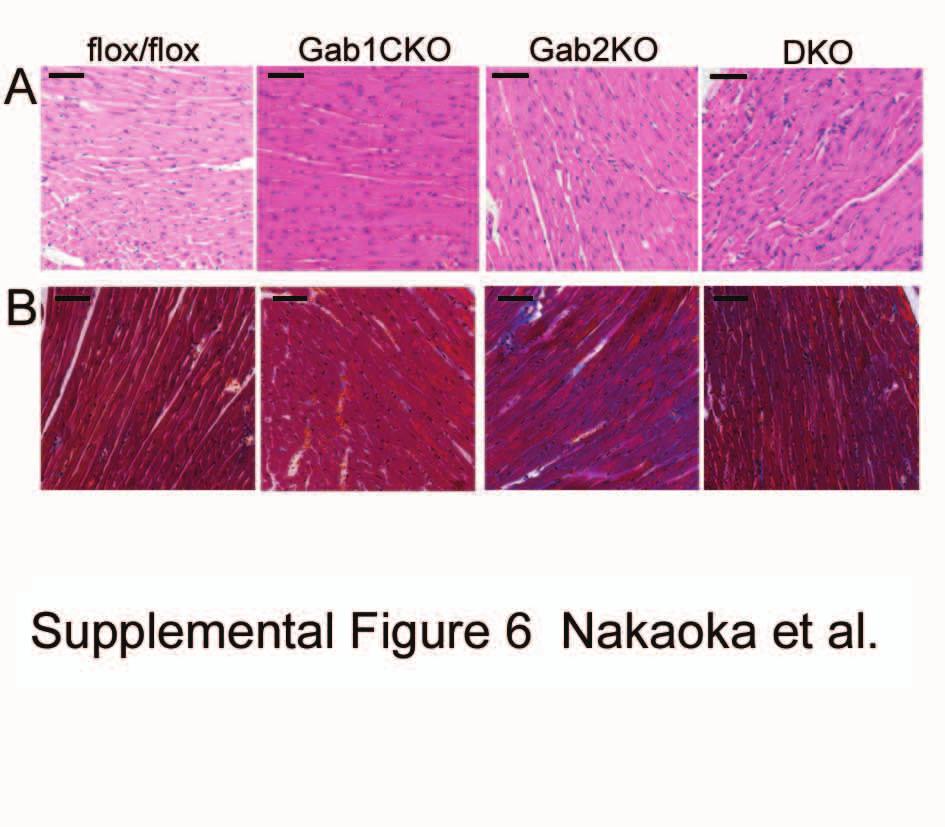
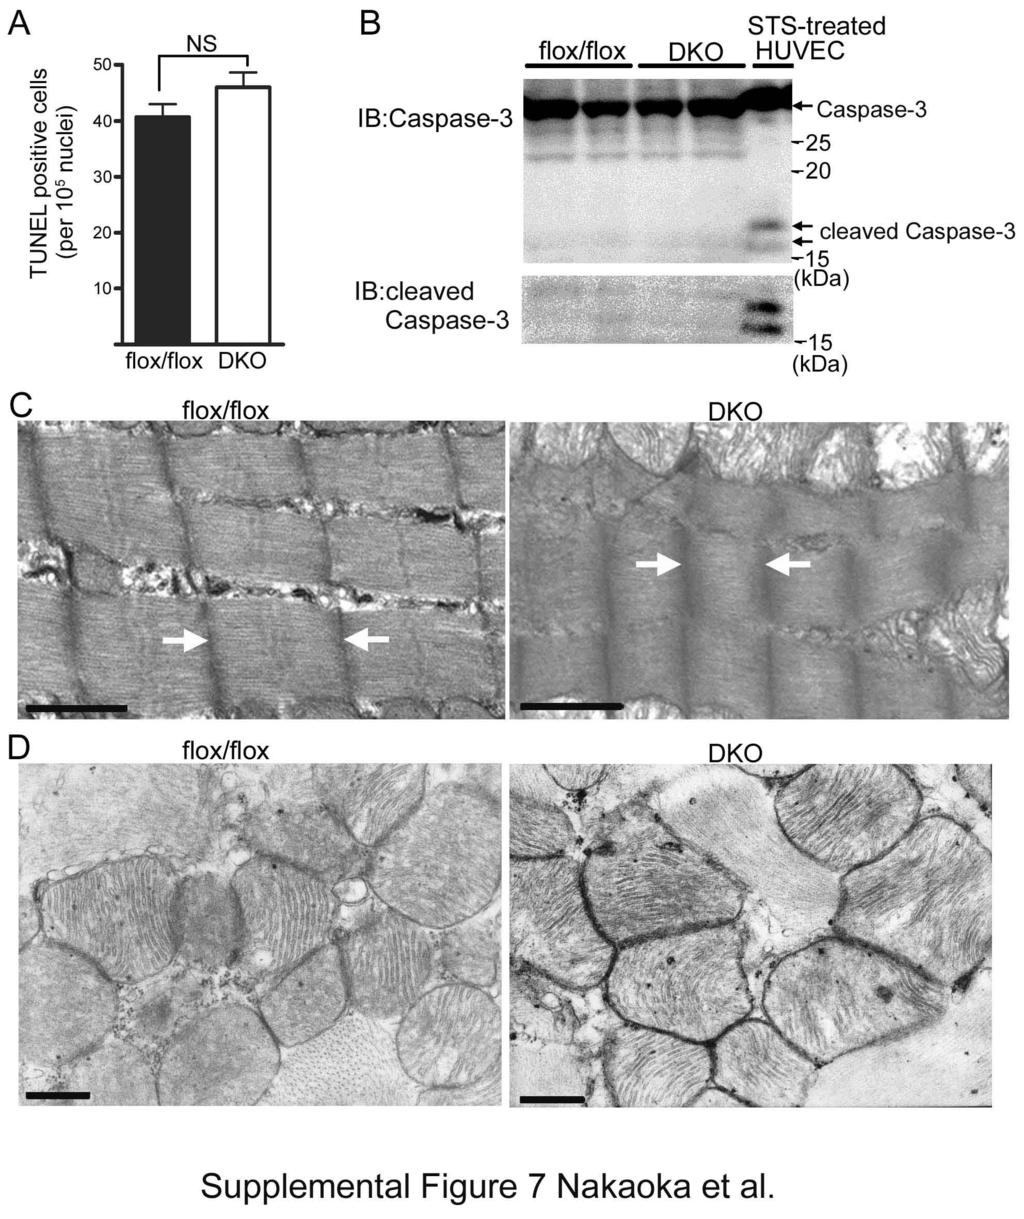
8 Supplemental Figure 5 DKO mice displayed progressive ventricular dilatation during postnatal development. (A) Elastica van Gieson staining of heart sections from flox/flox, Gab1CKO, Gab2KO and DKO mice at birth showed neither difference in heart size nor accumulation of elastic fibers. Scale bars, 500 μm. (B) Representative images of Elastica van Gieson staining of heart sections from four groups of mice at approximately d 300 of age. The right panel shows the remarkably dilated heart section from DKO mice which died at d 304 presumably of heart failure. We could not observe any difference of heart size and histology among other three groups of mice including flox/flox, Gab1CKO and Gab2KO. Scale bar, 1 mm. Supplemental Figure 6 DKO mice did not show any obvious interstitial fibrosis in the left ventricles. (A) H&E-stained sections of myocardium beneath the epicardium from each group of mice. (B) Masson s trichrome-stained sections of myocardium beneath the epicardium from each group of mice. DKO mice did not show interstitial fibrosis in the left ventricles. Scale bars 20 μm (A and B). Supplemental Figure 7 Apoptotic analyses and electron microscopic analyses of DKO mice hearts. (A) TUNEL assays in the hearts of control (flox/flox) and DKO mice (n=4, each group). No significant change in the number of TUNEL-positive nuclei was observed. (B) Caspase-3 was not activated in the hearts of DKO mice as well as in those of control mice. Heart lysates from control (flox/flox) and DKO mice were subjected to 8
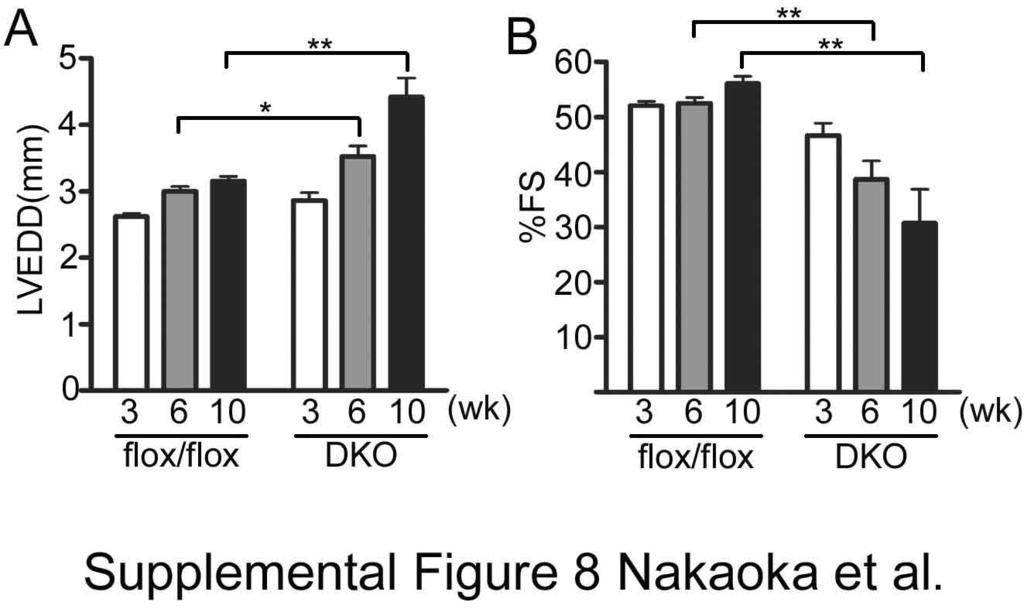
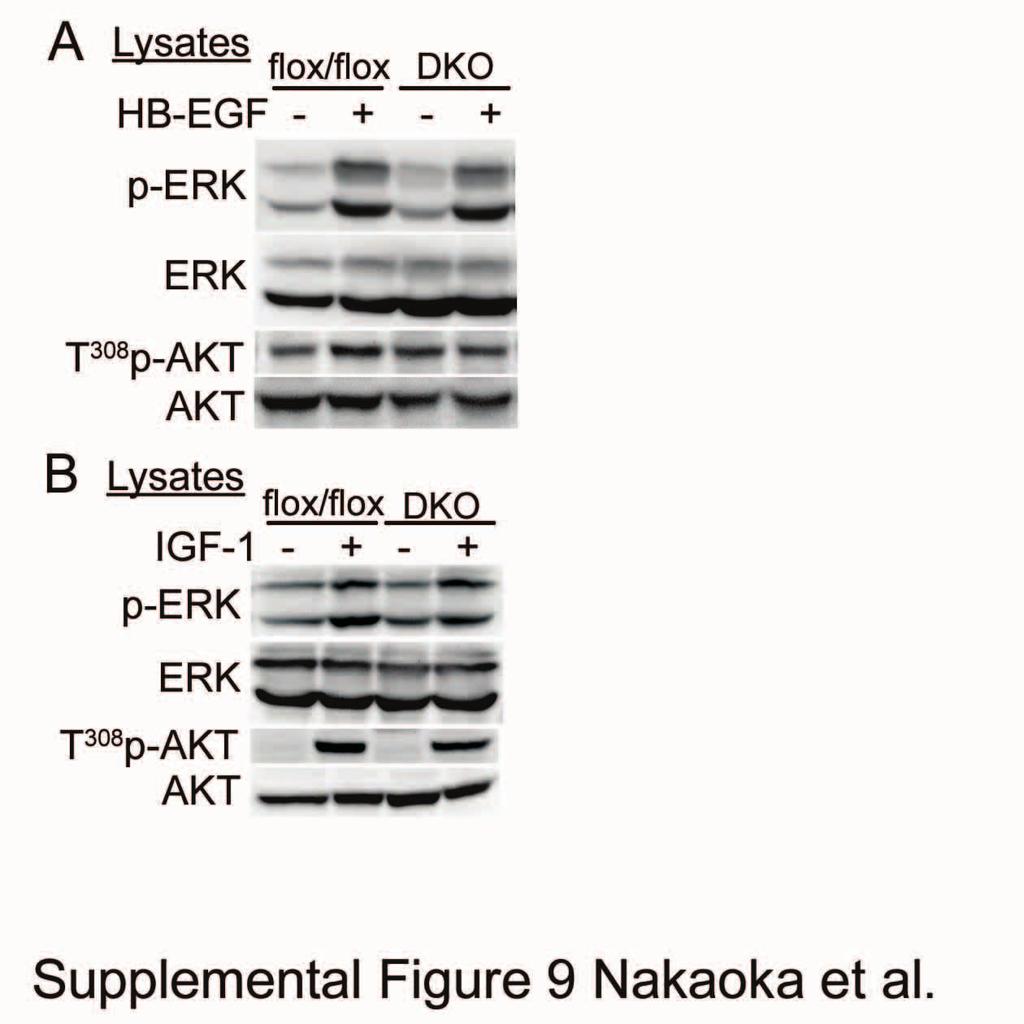
9 immunoblotting with anti-caspase-3 and anti-cleaved caspase-3 Ab. Arrows denotes the position of caspase-3 and cleaved-caspase-3. As a positive control, we used the cell lysate of HUVECs which were treated with 1 μm staurosporine (STS) for 3 h. (C) Electron microscopic analysis of myofibrillar architecture in the ventricles of control (flox/flox) and DKO mice at 12 wk of age. Marked reduction of sarcomere length was observed in DKO myofibrils, suggesting the hypercontraction of the myocardium. Arrows indicate adjacent Z-lines. Scale bars, 1 μm. (D) Electron microscopic analysis of mitochondria in the ventricles of control (flox/flox) and DKO mice at 12 wk of age. Slightly swelled mitochondria with a little coarse structural changes of crista were observed in the LV of DKO mice. Scale bars, 0.5 μm. Supplemental Figure 8 DKO mice displayed progressive ventricular dilatation and contractile deterioration during postnatal development. (A) Left ventricular end diastolic diameter (LVEDD) of control (flox/flox) mice (n=5) and DKO mice (n=5) at indicated weeks was assessed by echocardiography. (B) Similar to A, fractional shortening (%FS) was examined by echocardiography. Note that DKO mice displayed progressive ventricular dilatation in parallel with reduction of contractility. There was no significant change between two groups at 3 wk. *P<0.05 and **P <0.01 between the indicated groups, by one-way ANOVA. Supplemental Figure 9 HB-EGF or IGF-1-induced activation of ERK and AKT was preserved in DKO mice. (A) HB-EGF-induced phosphorylation of both ERK and AKT was 9
10 assessed using phospho-specific antibodies. Control (flox/flox) or DKO mice were injected with 5 μg of HB-EGF via inferior vena cava. The hearts were isolated at 5 min after injection. Activation of ERK and AKT was not attenuated in DKO heart compared to control heart. Representative blots of three independent experiments are shown. (B) IGF-1-stimulated activation of ERK and AKT was assessed using phospho-specific antibodies similarly to A. Heart lysates were prepared from control (flox/flox) or DKO mice injected with 5 μg of IGF-1 via inferior vena cava. Phosphorylation of ERK and AKT was not attenuated in DKO heart compared to control heart. Representative blots of three independent experiments are shown. 10
11
12
13
14
15
16
17
18
19
Supplemental Figure 1. (A) The localization of Cre DNA recombinase in the testis of Cyp19a1-Cre mice was detected by immunohistchemical analyses
 The localization of Cre DNA recombinase in the testis of Cyp19a1-Cre mice was detected by immunohistchemical analyses") Supplemental Figure 1. (A) The localization of Cre DNA recombinase in the testis of Cyp19a1-Cre mice was detected by immunohistchemical analyses using an anti-cre antibody; testes at 1 week (left panel),
Supplemental Figure 1. (A) The localization of Cre DNA recombinase in the testis of Cyp19a1-Cre mice was detected by immunohistchemical analyses using an anti-cre antibody; testes at 1 week (left panel),
(Stratagene, La Jolla, CA) (Supplemental Fig. 1A). A 5.4-kb EcoRI fragment
 (Supplemental Fig. 1A). A 5.4-kb EcoRI fragment") SUPPLEMENTAL INFORMATION Supplemental Methods Generation of RyR2-S2808D Mice Murine genomic RyR2 clones were isolated from a 129/SvEvTacfBR λ-phage library (Stratagene, La Jolla, CA) (Supplemental Fig.
SUPPLEMENTAL INFORMATION Supplemental Methods Generation of RyR2-S2808D Mice Murine genomic RyR2 clones were isolated from a 129/SvEvTacfBR λ-phage library (Stratagene, La Jolla, CA) (Supplemental Fig.
Postn MCM Smad2 fl/fl Postn MCM Smad3 fl/fl Postn MCM Smad2/3 fl/fl. Postn MCM. Tgfbr1/2 fl/fl TAC
 A Smad2 fl/fl Smad3 fl/fl Smad2/3 fl/fl Tgfbr1/2 fl/fl 1. mm B Tcf21 MCM Tcf21 MCM Smad3 fl/fl Tcf21 MCM Smad2/3 fl/fl Tcf21 MCM Tgfbr1/2 fl/fl αmhc MCM C 1. mm 1. mm D Smad2 fl/fl Smad3 fl/fl Smad2/3
(A) PCR primers (arrows) designed to distinguish wild type (P1+P2), targeted (P1+P2) and excised (P1+P3)14-
 PCR primers (arrows) designed to distinguish wild type (P1+P2), targeted (P1+P2) and excised (P1+P3)14-") 1 Supplemental Figure Legends Figure S1. Mammary tumors of ErbB2 KI mice with 14-3-3σ ablation have elevated ErbB2 transcript levels and cell proliferation (A) PCR primers (arrows) designed to distinguish
1 Supplemental Figure Legends Figure S1. Mammary tumors of ErbB2 KI mice with 14-3-3σ ablation have elevated ErbB2 transcript levels and cell proliferation (A) PCR primers (arrows) designed to distinguish
Probe. Hind III Q,!?R'!! /0!!!!D1"?R'! vector. Homologous recombination
 Supple-Zhang Page 1 Wild-type locus Targeting construct Targeted allele Exon Exon3 Exon Probe P1 P P3 FRT FRT loxp loxp neo vector amh I Homologous recombination neo P1 P P3 FLPe recombination Q,!?R'!!
c Ischemia (30 min) Reperfusion (8 w) Supplementary Figure bp 300 bp Ischemia (30 min) Reperfusion (4 h) Dox 20 mg/kg i.p.
 Reperfusion (8 w) Supplementary Figure bp 300 bp Ischemia (30 min) Reperfusion (4 h) Dox 20 mg/kg i.p.") a Marker Ripk3 +/ 5 bp 3 bp b Ischemia (3 min) Reperfusion (4 h) d 2 mg/kg i.p. 1 w 5 w Sacrifice for IF size A subset for echocardiography and morphological analysis c Ischemia (3 min) Reperfusion (8
a Marker Ripk3 +/ 5 bp 3 bp b Ischemia (3 min) Reperfusion (4 h) d 2 mg/kg i.p. 1 w 5 w Sacrifice for IF size A subset for echocardiography and morphological analysis c Ischemia (3 min) Reperfusion (8
hemodynamic stress. A. Echocardiographic quantification of cardiac dimensions and function in
 SUPPLEMENTAL FIGURE LEGENDS Supplemental Figure 1. Fbn1 C1039G/+ hearts display normal cardiac function in the absence of hemodynamic stress. A. Echocardiographic quantification of cardiac dimensions and
Protection against doxorubicin-induced myocardial dysfunction in mice by cardiac-specific expression of carboxyl terminus of hsp70-interacting protein
 Protection against doxorubicin-induced myocardial dysfunction in mice by cardiac-specific expression of carboxyl terminus of hsp70-interacting protein Lei Wang 1, Tian-Peng Zhang 1, Yuan Zhang 2, Hai-Lian
Supplemental Figure 1. Western blot analysis indicated that MIF was detected in the fractions of
 Supplemental Figure Legends Supplemental Figure 1. Western blot analysis indicated that was detected in the fractions of plasma membrane and cytosol but not in nuclear fraction isolated from Pkd1 null
Supplemental Figure 1
 Supplemental Figure 1 A S100A4: SFLGKRTDEAAFQKLMSNLDSNRDNEVDFQEYCVFLSCIAMMCNEFFEGFPDK Overlap: SF G DE KLM LD N D VDFQEY VFL I M N FF G PD S100A2: SFVGEKVDEEGLKKLMGSLDENSDQQVDFQEYAVFLALITVMCNDFFQGCPDR
Supplementary Figure 1. Confocal immunofluorescence showing mitochondrial translocation of Drp1. Cardiomyocytes treated with H 2 O 2 were prestained
 Supplementary Figure 1. Confocal immunofluorescence showing mitochondrial translocation of Drp1. Cardiomyocytes treated with H 2 O 2 were prestained with MitoTracker (red), then were immunostained with
Supplementary Figure 1: Hsp60 / IEC mice are embryonically lethal (A) Light microscopic pictures show mouse embryos at developmental stage E12.
 Light microscopic pictures show mouse embryos at developmental stage E12.") Supplementary Figure 1: Hsp60 / IEC mice are embryonically lethal (A) Light microscopic pictures show mouse embryos at developmental stage E12.5 and E13.5 prepared from uteri of dams and subsequently genotyped.
Supplementary Figure 1: Hsp60 / IEC mice are embryonically lethal (A) Light microscopic pictures show mouse embryos at developmental stage E12.5 and E13.5 prepared from uteri of dams and subsequently genotyped.
SOPten flox/flox (KO) Pten flox/flox (WT) flox allele 6.0 kb. Pten. Actin. ! allele 2.3 kb. Supplementary Figure S1. Yanagi, et al.
 Pten flox/flox (WT) flox allele 6.0 kb. Pten. Actin. ! allele 2.3 kb. Supplementary Figure S1. Yanagi, et al.") s1 A Pten flox/flox () SOPten flox/flox () flox allele 6. kb B Pten flox/flox () SOPten flox/flox () Pten Actin! allele 2.3 kb Supplementary Figure S1. Yanagi, et al. A B BrdU BrdU positive cells ( ) 3
s1 A Pten flox/flox () SOPten flox/flox () flox allele 6. kb B Pten flox/flox () SOPten flox/flox () Pten Actin! allele 2.3 kb Supplementary Figure S1. Yanagi, et al. A B BrdU BrdU positive cells ( ) 3
Supporting Information
 Supporting Information Franco et al. 10.1073/pnas.1015557108 SI Materials and Methods Drug Administration. PD352901 was dissolved in 0.5% (wt/vol) hydroxyl-propyl-methylcellulose, 0.2% (vol/vol) Tween
SUPPLEMENTARY INFORMATION
 Figure S1 Treatment with both Sema6D and Plexin-A1 sirnas induces the phenotype essentially identical to that induced by treatment with Sema6D sirna alone or Plexin-A1 sirna alone. (a,b) The cardiac tube
Gallic acid prevents isoproterenol-induced cardiac hypertrophy and fibrosis through regulation of JNK2 signaling and Smad3 binding activity
 Gallic acid prevents isoproterenol-induced cardiac hypertrophy and fibrosis through regulation of JNK2 signaling and Smad3 binding activity Yuhee Ryu 1,+, Li Jin 1,2+, Hae Jin Kee 1,, Zhe Hao Piao 3, Jae
SUPPLEMENTARY INFORMATION
 a c e doi:10.1038/nature10407 b d f Supplementary Figure 1. SERCA2a complex analysis. (a) Two-dimensional SDS-PAGE gels of SERCA2a complexes. A silver-stained SDSPAGE gel is shown, which reveals a 12 kda
Supplemental Figure 1. Intracranial transduction of a modified ptomo lentiviral vector in the mouse
 Supplemental figure legends Supplemental Figure 1. Intracranial transduction of a modified ptomo lentiviral vector in the mouse hippocampus targets GFAP-positive but not NeuN-positive cells. (A) Stereotaxic
Supplementary Figure 1. Baf60c and baf180 are induced during cardiac regeneration in zebrafish. RNA in situ hybridization was performed on paraffin
 Supplementary Figure 1. Baf60c and baf180 are induced during cardiac regeneration in zebrafish. RNA in situ hybridization was performed on paraffin sections from sham-operated adult hearts (a and i) and
SUPPLEMENTARY INFORMATION. Supplementary Figures S1-S9. Supplementary Methods
 SUPPLEMENTARY INFORMATION SUMO1 modification of PTEN regulates tumorigenesis by controlling its association with the plasma membrane Jian Huang 1,2#, Jie Yan 1,2#, Jian Zhang 3#, Shiguo Zhu 1, Yanli Wang
Atg5 flox/flox ; CAG-Cre, 19M brain heart lung. spleen stomach colon. Takamura_Fig. S1
 Takamura_Fig. S1 brain heart lung spleen stomach colon kidney SM Supplemental Figure 1 Histological findings of tg5 flox/flox ;CG-Cre mouse tissues. H&E staining of the brain, heart, lung, spleen, stomach,
Supplemental Information
 Supplemental Information Tobacco-specific Carcinogen Induces DNA Methyltransferases 1 Accumulation through AKT/GSK3β/βTrCP/hnRNP-U in Mice and Lung Cancer patients Ruo-Kai Lin, 1 Yi-Shuan Hsieh, 2 Pinpin
Supplementary Figure 1: si-craf but not si-braf sensitizes tumor cells to radiation.
 Supplementary Figure 1: si-craf but not si-braf sensitizes tumor cells to radiation. (a) Embryonic fibroblasts isolated from wildtype (WT), BRAF -/-, or CRAF -/- mice were irradiated (6 Gy) and DNA damage
BNP mrna expression in DR and DS rat left ventricles (n = 5). (C) Plasma norepinephrine
. (C) Plasma norepinephrine") Kanazawa, et al. Supplementary figure legends Supplementary Figure 1 DS rats had congestive heart failure. (A) DR and DS rat hearts. (B) QRT-PCR analysis of BNP mrna expression in DR and DS rat left ventricles
Kanazawa, et al. Supplementary figure legends Supplementary Figure 1 DS rats had congestive heart failure. (A) DR and DS rat hearts. (B) QRT-PCR analysis of BNP mrna expression in DR and DS rat left ventricles
Plasma exposure levels from individual mice 4 hours post IP administration at the
 Supplemental Figure Legends Figure S1. Plasma exposure levels of MKC-3946 in mice. Plasma exposure levels from individual mice 4 hours post IP administration at the indicated dose mg/kg. Data represent
Supplemental Table 1. Primers used for RT-PCR analysis of inflammatory cytokines Gene Primer Sequence
 Supplemental Table 1. Primers used for RT-PCR analysis of inflammatory cytokines Gene Primer Sequence IL-1α Forward primer 5 -CAAGATGGCCAAAGTTCGTGAC-3' Reverse primer 5 -GTCTCATGAAGTGAGCCATAGC-3 IL-1β
Supplemental Table 1. Echocardiography Control (n=4)
") Supplemental Table 1. Echocardiography (n=4) Mlc2v cre/+ ; DNMAML (n=4) LVIDd, mm 3.9±0.3 4.3±0.3 LVIDs, mm 2.6±0.4 2.9±0.2 d, mm 0.72±0.06 0.75±0.1 LVPWd, mm 0.72±0.06 0.77±0.11 FS, % 33±6 33±1 EF, %
Supplemental Table 1. Echocardiography (n=4) Mlc2v cre/+ ; DNMAML (n=4) LVIDd, mm 3.9±0.3 4.3±0.3 LVIDs, mm 2.6±0.4 2.9±0.2 d, mm 0.72±0.06 0.75±0.1 LVPWd, mm 0.72±0.06 0.77±0.11 FS, % 33±6 33±1 EF, %
Figure S1 Generation of γ-gt DTR transgenic mice. (A) Schematic construct of the transgene. (B)
 Schematic construct of the transgene. (B)") Figure S1 Generation of γ-gt DTR transgenic mice. (A) Schematic construct of the transgene. (B) PCR identified expected hhb-egf band (left panel) and HA tag band (right) in kidneys of transgenic (TG) mice
Figure S1 Generation of γ-gt DTR transgenic mice. (A) Schematic construct of the transgene. (B) PCR identified expected hhb-egf band (left panel) and HA tag band (right) in kidneys of transgenic (TG) mice
Title: Smooth muscle cell-specific Tgfbr1 deficiency promotes aortic aneurysm formation by stimulating multiple signaling events
 Title: Smooth muscle cell-specific Tgfbr1 deficiency promotes aortic aneurysm formation by stimulating multiple signaling events Pu Yang 1, 3, radley M. Schmit 1, Chunhua Fu 1, Kenneth DeSart 1, S. Paul
Tcf21 MCM ; R26 mtmg Sham GFP Col 1/3 TAC 8W TAC 2W. Postn MCM ; R26 mtmg Sham GFP Col 1/3 TAC 8W TAC 2W
 A Tcf21 MCM ; R26 mtmg Sham GFP Col 1/3 Tcf21 MCM ; R26 mtmg TAC 2W Tcf21 MCM ; R26 mtmg TAC 8W B Postn MCM ; R26 mtmg Sham GFP Col 1/3 Postn MCM ; R26 mtmg TAC 2W Postn MCM ; R26 mtmg TAC 8W Supplementary
A Hepatocyte Growth Factor Receptor (Met) Insulin Receptor hybrid governs hepatic glucose metabolism SUPPLEMENTARY FIGURES, LEGENDS AND METHODS
 Insulin Receptor hybrid governs hepatic glucose metabolism SUPPLEMENTARY FIGURES, LEGENDS AND METHODS") A Hepatocyte Growth Factor Receptor (Met) Insulin Receptor hybrid governs hepatic glucose metabolism Arlee Fafalios, Jihong Ma, Xinping Tan, John Stoops, Jianhua Luo, Marie C. DeFrances and Reza Zarnegar
A Hepatocyte Growth Factor Receptor (Met) Insulin Receptor hybrid governs hepatic glucose metabolism Arlee Fafalios, Jihong Ma, Xinping Tan, John Stoops, Jianhua Luo, Marie C. DeFrances and Reza Zarnegar
In vivo bromodeoxyuridine (BrdU) incorporation was performed to analyze cell
 incorporation was performed to analyze cell") Supplementary Methods BrdU incorporation in vivo In vivo bromodeoxyuridine (BrdU) incorporation was performed to analyze cell proliferation in the heart. Mice were subjected to LI-TAC, and 5 days later
Supplementary Methods BrdU incorporation in vivo In vivo bromodeoxyuridine (BrdU) incorporation was performed to analyze cell proliferation in the heart. Mice were subjected to LI-TAC, and 5 days later
SUPPLEMENTAL MATERIAL. Supplementary Methods
 SUPPLEMENTAL MATERIAL Supplementary Methods Culture of cardiomyocytes, fibroblasts and cardiac microvascular endothelial cells The isolation and culturing of neonatal rat ventricular cardiomyocytes was
Supplemental Information. Otic Mesenchyme Cells Regulate. Spiral Ganglion Axon Fasciculation. through a Pou3f4/EphA4 Signaling Pathway
 Neuron, Volume 73 Supplemental Information Otic Mesenchyme Cells Regulate Spiral Ganglion Axon Fasciculation through a Pou3f4/EphA4 Signaling Pathway Thomas M. Coate, Steven Raft, Xiumei Zhao, Aimee K.
E10.5 E18.5 P2 10w 83w NF1 HF1. Sham ISO. Bmi1. H3K9me3. Lung weight (g)
") Myociyte cross-sectional Relative mrna levels Relative levels Relative mrna levels Supplementary Figures and Legends a 8 6 4 2 Ezh2 E1.5 E18.5 P2 1w 83w b Ezh2 p16 amhc b-actin P2 43w kd 37 86 16 wt mouse
Myociyte cross-sectional Relative mrna levels Relative levels Relative mrna levels Supplementary Figures and Legends a 8 6 4 2 Ezh2 E1.5 E18.5 P2 1w 83w b Ezh2 p16 amhc b-actin P2 43w kd 37 86 16 wt mouse
Supplementary Figure 1. EC-specific Deletion of Snail1 Does Not Affect EC Apoptosis. (a,b) Cryo-sections of WT (a) and Snail1 LOF (b) embryos at
 Cryo-sections of WT (a) and Snail1 LOF (b) embryos at") Supplementary Figure 1. EC-specific Deletion of Snail1 Does Not Affect EC Apoptosis. (a,b) Cryo-sections of WT (a) and Snail1 LOF (b) embryos at E10.5 were double-stained for TUNEL (red) and PECAM-1 (green).
Supplementary Figure 1. EC-specific Deletion of Snail1 Does Not Affect EC Apoptosis. (a,b) Cryo-sections of WT (a) and Snail1 LOF (b) embryos at E10.5 were double-stained for TUNEL (red) and PECAM-1 (green).
Genome-editing via Oviductal Nucleic Acids Delivery (GONAD) system: a novel microinjection-independent genome engineering method in mice
 system: a novel microinjection-independent genome engineering method in mice") Supplementary Information Genome-editing via Oviductal Nucleic Acids Delivery (GONAD) system: a novel microinjection-independent genome engineering method in mice Gou Takahashi, Channabasavaiah B Gurumurthy,
Supplementary Information Genome-editing via Oviductal Nucleic Acids Delivery (GONAD) system: a novel microinjection-independent genome engineering method in mice Gou Takahashi, Channabasavaiah B Gurumurthy,
Nature Genetics: doi: /ng Supplementary Figure 1. Parameters and consequences of mononuclear cardiomyocyte frequency.
 Supplementary Figure 1 Parameters and consequences of mononuclear cardiomyocyte frequency. (a) Correlation of the frequency of mononuclear cardiomyocytes to the frequency of cardiomyocytes with three or
Expression of acid base transporters in the kidney collecting duct in Slc2a7 -/-
 Supplemental Material Results. Expression of acid base transporters in the kidney collecting duct in Slc2a7 -/- and Slc2a7 -/- mice. The expression of AE1 in the kidney was examined in Slc26a7 KO mice.
Supplementary Materials for
 www.sciencesignaling.org/cgi/content/full/8/389/ra79/dc1 Supplementary Materials for HDL-bound sphingosine 1-phosphate acts as a biased agonist for the endothelial cell receptor S1P 1 to limit vascular
Supplementary Figure 1 CD4 + T cells from PKC-θ null mice are defective in NF-κB activation during T cell receptor signaling. CD4 + T cells were
 Supplementary Figure 1 CD4 + T cells from PKC-θ null mice are defective in NF-κB activation during T cell receptor signaling. CD4 + T cells were isolated from wild type (PKC-θ- WT) or PKC-θ null (PKC-θ-KO)
Supplementary Figure 1 Role of Raf-1 in TLR2-Dectin-1-mediated cytokine expression
 Supplementary Figure 1 Supplementary Figure 1 Role of Raf-1 in TLR2-Dectin-1-mediated cytokine expression. Quantitative real-time PCR of indicated mrnas in DCs stimulated with TLR2-Dectin-1 agonist zymosan
SUPPLEMENTARY FIGURE LEGENDS
 SUPPLEMENTARY FIGURE LEGENDS Supplementary Figure 1. Hippocampal sections from new-born Pten+/+ and PtenFV/FV pups were stained with haematoxylin and eosin (H&E) and were imaged at (a) low and (b) high
SUPPLEMENTARY INFORMATION
 doi:10.1038/nature12652 Supplementary Figure 1. PRDM16 interacts with endogenous EHMT1 in brown adipocytes. Immunoprecipitation of PRDM16 complex by flag antibody (M2) followed by Western blot analysis
hexahistidine tagged GRP78 devoid of the KDEL motif (GRP78-His) on SDS-PAGE. This
 on SDS-PAGE. This") SUPPLEMENTAL FIGURE LEGEND Fig. S1. Generation and characterization of. (A) Coomassie staining of soluble hexahistidine tagged GRP78 devoid of the KDEL motif (GRP78-His) on SDS-PAGE. This protein was expressed
SUPPLEMENTAL FIGURE LEGEND Fig. S1. Generation and characterization of. (A) Coomassie staining of soluble hexahistidine tagged GRP78 devoid of the KDEL motif (GRP78-His) on SDS-PAGE. This protein was expressed
marker. DAPI labels nuclei. Flies were 20 days old. Scale bar is 5 µm. Ctrl is
 Supplementary Figure 1. (a) Nos is detected in glial cells in both control and GFAP R79H transgenic flies (arrows), but not in deletion mutant Nos Δ15 animals. Repo is a glial cell marker. DAPI labels
Supporting Information
 Supporting Information Kuroda et al. 10.1073/pnas.1002178107 SI Methods Monoclonal Antibodies Against Nox4. Generation of the anti-nox4 mouse monoclonal antibody (3D2), which detects Nox4 and does not
Supplementary Figure 1: Neuregulin 1 increases the growth of mammary organoids compared to EGF. (a) Mammary epithelial cells were freshly isolated,
 Mammary epithelial cells were freshly isolated,") 1 2 3 4 5 6 7 8 9 10 Supplementary Figure 1: Neuregulin 1 increases the growth of mammary organoids compared to EGF. (a) Mammary epithelial cells were freshly isolated, embedded in matrigel and exposed
1 2 3 4 5 6 7 8 9 10 Supplementary Figure 1: Neuregulin 1 increases the growth of mammary organoids compared to EGF. (a) Mammary epithelial cells were freshly isolated, embedded in matrigel and exposed
Supporting Information
 Supporting Information Muraski et al. 10.1073/pnas.0709135105 SI Text Generation of Transgenic Animals. Pim-WT and Pim-DN cdnas were subcloned NheI/SmaI from pegfp-c1 Pim-1 and pegfp-c1 Pim-DN plasmids
The subcortical maternal complex controls symmetric division of mouse zygotes by
 The subcortical maternal complex controls symmetric division of mouse zygotes by regulating F-actin dynamics Xing-Jiang Yu 1,2, Zhaohong Yi 1, Zheng Gao 1,2, Dan-dan Qin 1,2, Yanhua Zhai 1, Xue Chen 1,
Supplementary Table 1. List of primers used in this study
 Supplementary Table 1. List of primers used in this study Gene Forward primer Reverse primer Rat Met 5 -aggtcgcttcatgcaggt-3 5 -tccggagacacaggatgg-3 Rat Runx1 5 -cctccttgaaccactccact-3 5 -ctggatctgcctggcatc-3
Supplementary Figure 1. Spatial distribution of LRP5 and β-catenin in intact cardiomyocytes. (a) and (b) Immunofluorescence staining of endogenous
 and (b) Immunofluorescence staining of endogenous") Supplementary Figure 1. Spatial distribution of LRP5 and β-catenin in intact cardiomyocytes. (a) and (b) Immunofluorescence staining of endogenous LRP5 in intact adult mouse ventricular myocytes (AMVMs)
Supplementary Figure 1. Spatial distribution of LRP5 and β-catenin in intact cardiomyocytes. (a) and (b) Immunofluorescence staining of endogenous LRP5 in intact adult mouse ventricular myocytes (AMVMs)
Problem Set 8 Key 1 of 8
 7.06 2003 Problem Set 8 Key 1 of 8 7.06 2003 Problem Set 8 Key 1. As a bright MD/PhD, you are interested in questions about the control of cell number in the body. Recently, you've seen three patients
Nature Immunology: doi: /ni.3866
 Nature Immunology: doi:10.1038/ni.3866 Supplementary Figure 1 The effect of TIPE2 on chemotaxis. a, The expression of TIPE2 in dhl-60c, dhl-60t, TIPE2-expressing and 15/16Q-expressing dhl-60t neutrophils
(a) Significant biological processes (upper panel) and disease biomarkers (lower panel)
 Significant biological processes (upper panel) and disease biomarkers (lower panel)") Supplementary Figure 1. Functional enrichment analyses of secretomic proteins. (a) Significant biological processes (upper panel) and disease biomarkers (lower panel) 2 involved by hrab37-mediated secretory
Supplementary Figure 1. Functional enrichment analyses of secretomic proteins. (a) Significant biological processes (upper panel) and disease biomarkers (lower panel) 2 involved by hrab37-mediated secretory
SUPPLEMENTARY INFORMATION
 1. Supplementary Figures and Legends Supplementary Fig. 1. S1P-mediated transcriptional regulation of integrins expressed in OP/monocytoid cells. Real-time quantitative PCR analyses of mrna for two integrins,
Supplementary Fig. 1. GPRC5A post-transcriptionally down-regulates EGFR expression. (a) Plot of the changes in steady state mrna levels versus
 Plot of the changes in steady state mrna levels versus") Supplementary Fig. 1. GPRC5A post-transcriptionally down-regulates EGFR expression. (a) Plot of the changes in steady state mrna levels versus changes in corresponding proteins between wild type and Gprc5a-/-
Supplementary Fig. 1. GPRC5A post-transcriptionally down-regulates EGFR expression. (a) Plot of the changes in steady state mrna levels versus changes in corresponding proteins between wild type and Gprc5a-/-
Supplementary data Supplementary Figure 1 Supplementary Figure 2
 Supplementary data Supplementary Figure 1 SPHK1 sirna increases RANKL-induced osteoclastogenesis in RAW264.7 cell culture. (A) RAW264.7 cells were transfected with oligocassettes containing SPHK1 sirna
Supplementary Figure 1. Expression of phospho-sik3 in normal and osteoarthritic articular cartilage in the knee. (a) Semiserial histological sections
 Semiserial histological sections") Supplementary Figure 1. Expression of phospho-sik3 in normal and osteoarthritic articular cartilage in the knee. (a) Semiserial histological sections of normal cartilage were stained with safranin O-fast
Supplementary Figure 1. Expression of phospho-sik3 in normal and osteoarthritic articular cartilage in the knee. (a) Semiserial histological sections of normal cartilage were stained with safranin O-fast
Supplemental Information. Myocardial Polyploidization Creates a Barrier. to Heart Regeneration in Zebrafish
 Developmental Cell, Volume 44 Supplemental Information Myocardial Polyploidization Creates a Barrier to Heart Regeneration in Zebrafish Juan Manuel González-Rosa, Michka Sharpe, Dorothy Field, Mark H.
SUPPLEMENTARY INFORMATION
 doi:10.1038/nature10188 Supplementary Figure 1. Embryonic epicardial genes are down-regulated from midgestation stages and barely detectable post-natally. Real time qrt-pcr revealed a significant down-regulation
Figure S1. Generation of inducible PTEN deficient mice and the BMMCs (A) B6.129 Pten loxp/loxp mice were mated with B6.
 B6.129 Pten loxp/loxp mice were mated with B6.") Figure S1. Generation of inducible PTEN deficient mice and the BMMCs (A) B6.129 Pten loxp/loxp mice were mated with B6.129-Gt(ROSA)26Sor tm1(cre/ert2)tyj /J mice. To induce deletion of the Pten locus,
Figure S1. Generation of inducible PTEN deficient mice and the BMMCs (A) B6.129 Pten loxp/loxp mice were mated with B6.129-Gt(ROSA)26Sor tm1(cre/ert2)tyj /J mice. To induce deletion of the Pten locus,
General Laboratory methods Plasma analysis: Gene Expression Analysis: Immunoblot analysis: Immunohistochemistry:
 General Laboratory methods Plasma analysis: Plasma insulin (Mercodia, Sweden), leptin (duoset, R&D Systems Europe, Abingdon, United Kingdom), IL-6, TNFα and adiponectin levels (Quantikine kits, R&D Systems
Supplementary Figures
 Supplementary Figures Supplementary Figure 1 Characterization of stable expression of GlucB and sshbira in the CT26 cell line (a) Live cell imaging of stable CT26 cells expressing green fluorescent protein
SUPPLEMENTARY INFORMATION
 SUPPLEMENTARY INFORMATION doi:10.1038/nature11429 S1a 6 7 8 9 Nlrc4 allele S1b Nlrc4 +/+ Nlrc4 +/F Nlrc4 F/F 9 Targeting construct 422 bp 273 bp FRT-neo-gb-PGK-FRT 3x.STOP S1c Nlrc4 +/+ Nlrc4 F/F casp1
Cells and reagents. Synaptopodin knockdown (1) and dynamin knockdown (2)
 and dynamin knockdown (2)") Supplemental Methods Cells and reagents. Synaptopodin knockdown (1) and dynamin knockdown (2) podocytes were cultured as described previously. Staurosporine, angiotensin II and actinomycin D were all obtained
Supplemental Methods Cells and reagents. Synaptopodin knockdown (1) and dynamin knockdown (2) podocytes were cultured as described previously. Staurosporine, angiotensin II and actinomycin D were all obtained
Supplementary Figures
 Supplementary Figures Supplementary Figure 1. Confirmation of Dnmt1 conditional knockout out mice. a, Representative images of sorted stem (Lin - CD49f high CD24 + ), luminal (Lin - CD49f low CD24 + )
Supplementary Figure 1. Normal T lymphocyte populations in Dapk -/- mice. (a) Normal thymic development in Dapk -/- mice. Thymocytes from WT and Dapk
 Normal thymic development in Dapk -/- mice. Thymocytes from WT and Dapk") Supplementary Figure 1. Normal T lymphocyte populations in Dapk -/- mice. (a) Normal thymic development in Dapk -/- mice. Thymocytes from WT and Dapk -/- mice were stained for expression of CD4 and CD8.
Supplementary Figure 1. Normal T lymphocyte populations in Dapk -/- mice. (a) Normal thymic development in Dapk -/- mice. Thymocytes from WT and Dapk -/- mice were stained for expression of CD4 and CD8.
SUPPLEMENTARY METHODS
 SUPPLEMENTARY METHODS Histological analysis. Colonic tissues were collected from 5 parts of the middle colon on day 7 after the start of DSS treatment, and then were cut into segments, fixed with 4% paraformaldehyde,
Fetal gene upregulation by 1-wk TAC is significantly increased in mice lacking RGS2.
 3562-RG-1 Supplementary Figure 1 Fetal gene upregulation by 1-wk is significantly increased in mice lacking RGS2. ANP(Nppa) /BNP(Nppb) A-type and B-type natriuretic peptide; β-mhc (Myh7) beta myosin heavy
Supplementary methods:
 Supplementary methods: Primers sequences used in real-time PCR analyses: β-actin F: GACCTCTATGCCAACACAGT β-actin [11] R: AGTACTTGCGCTCAGGAGGA MMP13 F: TTCTGGTCTTCTGGCACACGCTTT MMP13 R: CCAAGCTCATGGGCAGCAACAATA
Supplementary Materials and Methods
 Supplementary Materials and Methods Whole Mount X-Gal Staining Whole tissues were collected, rinsed with PBS and fixed with 4% PFA. Tissues were then rinsed in rinse buffer (100 mm Sodium Phosphate ph
Figure S1: Effects on haptotaxis are independent of effects on cell velocity A)
") Supplemental Figures Figure S1: Effects on haptotaxis are independent of effects on cell velocity A) Velocity of MV D7 fibroblasts expressing different GFP-tagged Ena/VASP family proteins in the haptotaxis
Supplemental Figures Figure S1: Effects on haptotaxis are independent of effects on cell velocity A) Velocity of MV D7 fibroblasts expressing different GFP-tagged Ena/VASP family proteins in the haptotaxis
Supplementary Figure 1. Successful excision of genes from WBM lysates and
 Supplementary Information: Supplementary Figure 1. Successful excision of genes from WBM lysates and survival of mice with different genotypes. (a) The proper excision of Pten, p110α, p110α and p110δ was
Soft Agar Assay. For each cell pool, 100,000 cells were resuspended in 0.35% (w/v)
") SUPPLEMENTARY MATERIAL AND METHODS Soft Agar Assay. For each cell pool, 100,000 cells were resuspended in 0.35% (w/v) top agar (LONZA, SeaKem LE Agarose cat.5004) and plated onto 0.5% (w/v) basal agar.
SUPPLEMENTARY MATERIAL AND METHODS Soft Agar Assay. For each cell pool, 100,000 cells were resuspended in 0.35% (w/v) top agar (LONZA, SeaKem LE Agarose cat.5004) and plated onto 0.5% (w/v) basal agar.
Soluble ADAM33 initiates airway remodeling to promote susceptibility for. Elizabeth R. Davies, Joanne F.C. Kelly, Peter H. Howarth, David I Wilson,
 Revised Suppl. Data: Soluble ADAM33 1 Soluble ADAM33 initiates airway remodeling to promote susceptibility for allergic asthma in early life Elizabeth R. Davies, Joanne F.C. Kelly, Peter H. Howarth, David
(A) RT-PCR for components of the Shh/Gli pathway in normal fetus cell (MRC-5) and a
 RT-PCR for components of the Shh/Gli pathway in normal fetus cell (MRC-5) and a") Supplementary figure legends Supplementary Figure 1. Expression of Shh signaling components in a panel of gastric cancer. (A) RT-PCR for components of the Shh/Gli pathway in normal fetus cell (MRC-5) and
Supplementary figure legends Supplementary Figure 1. Expression of Shh signaling components in a panel of gastric cancer. (A) RT-PCR for components of the Shh/Gli pathway in normal fetus cell (MRC-5) and
p = formed with HCI-001 p = Relative # of blood vessels that formed with HCI-002 Control Bevacizumab + 17AAG Bevacizumab 17AAG
 A.. Relative # of ECs associated with HCI-001 1.4 1.2 1.0 0.8 0.6 0.4 0.2 0.0 ol b p < 0.001 Relative # of blood vessels that formed with HCI-001 1.4 1.2 1.0 0.8 0.6 0.4 0.2 0.0 l b p = 0.002 Control IHC:
International Graduate Research Programme in Cardiovascular Science
 1 International Graduate Research Programme in Cardiovascular Science This work has been supported by the European Community s Sixth Framework Programme under grant agreement n LSHM-CT-2005-01883 EUGeneHeart.
Supplemental Figures:
 Supplemental Figures: Figure 1: Intracellular distribution of VWF by electron microscopy in human endothelial cells. a) Immunogold labeling of LC3 demonstrating an LC3-positive autophagosome (white arrow)
Supplementary Figure 1
 VO (ml kg - min - ) VCO (ml kg - min - ) Respiratory exchange ratio Energy expenditure (cal kg - min - ) Locomotor activity (x count) Body temperature ( C) Relative mrna expression TA Sol EDL PT Heart
Suppl. Figure 1. NF-κB. gastrocnemius. WT mdx dko. mdx. pelk1. pets2. Ras. Ets2. praf. pp38. pmek-1. p38 SOS. p90 Rsk
 Suppl. Figure 1 NF-κ p65 gastrocnemius phase merge D pets2 dko E pelk1 dko Ets2 Ras pp38 p38 praf pmek-1 SOS p90 Rsk Suppl. Figure 2 pair 1 pair 2 NF-# pair1 pair 2 p65 p50 Oct-1 ;p50+ / - D dys.!-sg "-DG
Supplementary Figure 1. c Human
 Supplementary Figure 1 a b c Human Mouse d Gapdh Amino acid sequence and baseline expression of MYDGF N-terminal signal peptides (S-scores) and signal peptide cleavage sites (C-scores) of (a) human MYDGF
Determination of the temporal pattern and importance of BALF1 expression in Epstein-Barr viral infection
 Determination of the temporal pattern and importance of BALF1 expression in Epstein-Barr viral infection Melissa Mihelidakis May 6, 2004 7.340 Research Proposal Introduction Apoptosis, or programmed cell
Supplementary Fig. 1. Identification of acetylation of K68 of SOD2
 Supplementary Fig. 1. Identification of acetylation of K68 of SOD2 A B H. sapiens 54 KHHAAYVNNLNVTEEKYQEALAK 75 M. musculus 54 KHHAAYVNNLNATEEKYHEALAK 75 X. laevis 55 KHHATYVNNLNITEEKYAEALAK 77 D. rerio
Supplementary Information
 Supplementary Information Supplementary Figure 1. CD4 + T cell activation and lack of apoptosis after crosslinking with anti-cd3 + anti-cd28 + anti-cd160. (a) Flow cytometry of anti-cd160 (5D.10A11) binding
HEK293FT cells were transiently transfected with reporters, N3-ICD construct and
 Supplementary Information Luciferase reporter assay HEK293FT cells were transiently transfected with reporters, N3-ICD construct and increased amounts of wild type or kinase inactive EGFR. Transfections
Boucher et al NCOMMS B
 1 Supplementary Figure 1 (linked to Figure 1). mvegfr1 constitutively internalizes in endothelial cells. (a) Immunoblot of mflt1 from undifferentiated mouse embryonic stem (ES) cells with indicated genotypes;
Supplementary Figure 1
 Supplementary Figure 1 YAP negatively regulates IFN- signaling. (a) Immunoblot analysis of Yap knockdown efficiency with sh-yap (#1 to #4 independent constructs) in Raw264.7 cells. (b) IFN- -Luc and PRDs
Figure S1. Reduction in glomerular mir-146a levels correlate with progression to higher albuminuria in diabetic patients.
 Supplementary Materials Supplementary Figures Figure S1. Reduction in glomerular mir-146a levels correlate with progression to higher albuminuria in diabetic patients. Figure S2. Expression level of podocyte
Supplementary Figure 1: STAT3 suppresses Kras-induced lung tumorigenesis
 Supplementary Figure 1: STAT3 suppresses Kras-induced lung tumorigenesis (a) Immunohistochemical (IHC) analysis of tyrosine 705 phosphorylation status of STAT3 (P- STAT3) in tumors and stroma (all-time
Supplementary Table 1. The primers used for quantitative RT-PCR. Gene name Forward (5 > 3 ) Reverse (5 > 3 )
 Reverse (5 > 3 )") 770 771 Supplementary Table 1. The primers used for quantitative RT-PCR. Gene name Forward (5 > 3 ) Reverse (5 > 3 ) Human CXCL1 GCGCCCAAACCGAAGTCATA ATGGGGGATGCAGGATTGAG PF4 CCCCACTGCCCAACTGATAG TTCTTGTACAGCGGGGCTTG
770 771 Supplementary Table 1. The primers used for quantitative RT-PCR. Gene name Forward (5 > 3 ) Reverse (5 > 3 ) Human CXCL1 GCGCCCAAACCGAAGTCATA ATGGGGGATGCAGGATTGAG PF4 CCCCACTGCCCAACTGATAG TTCTTGTACAGCGGGGCTTG
Supplemental Information. Tissue Myeloid Progenitors Differentiate. into Pericytes through TGF-b Signaling. in Developing Skin Vasculature
 Cell Reports, Volume 18 Supplemental Information Tissue Myeloid Progenitors Differentiate into Pericytes through TGF-b Signaling in Developing Skin Vasculature Tomoko Yamazaki, Ani Nalbandian, Yutaka Uchida,
doi: /nature14508 Rappsilber et al.
 SUPPLEMENTARY INFORMATION doi:1.138/nature1458 Grosso et al. Barbosa et al. 74 72 45 33 47 7 51 Rappsilber et al. Supplementary Figure 1 a, Venn-Diagram of identified splice factors in the work of Barbossa
Supplemental Figure I
 Supplemental Figure I Kl ( mmol/l)-induced Force orta M (mn) 1 (mn) 1 Supplemental Figure I. Kl-induced contractions. and, Kl ( mmol/l)-induced contractions of the aorta () and those of mesenteric arteries
Santulli G. et al. A microrna-based strategy to suppress restenosis while preserving endothelial function
 ONLINE DATA SUPPLEMENTS Santulli G. et al. A microrna-based strategy to suppress restenosis while preserving endothelial function Supplementary Figures Figure S1 Effect of Ad-p27-126TS on the expression
SUPPLEMENTARY INFORMATION
 Supplementary Figures Supplementary Figure S1. Binding of full-length OGT and deletion mutants to PIP strips (Echelon Biosciences). Supplementary Figure S2. Binding of the OGT (919-1036) fragments with
Supplementary Figure S1 Enlarged coronary artery branches in Edn1-knockout mice. a-d, Coronary angiography by ink injection in wild-type (a, b) and
 and") Supplementary Figure S1 Enlarged coronary artery branches in Edn1-knockout mice. a-d, Coronary angiography by ink injection in wild-type (a, b) and Edn1-knockout (Edn1-KO) (c, d) hearts. The boxed areas
Supplementary Figure S1 Enlarged coronary artery branches in Edn1-knockout mice. a-d, Coronary angiography by ink injection in wild-type (a, b) and Edn1-knockout (Edn1-KO) (c, d) hearts. The boxed areas
Supplementary Figure 1 IMQ-Induced Mouse Model of Psoriasis. IMQ cream was
 Supplementary Figure 1 IMQ-Induced Mouse Model of Psoriasis. IMQ cream was painted on the shaved back skin of CBL/J and BALB/c mice for consecutive days. (a, b) Phenotypic presentation of mouse back skin
A. Generation and characterization of Ras-expressing autophagycompetent
 Supplemental Material Supplemental Figure Legends Fig. S1 A. Generation and characterization of Ras-expressing autophagycompetent and -deficient cell lines. HA-tagged H-ras V12 was stably expressed in