Pathologic ECG. Adelina Vlad, MD PhD
|
|
|
- Janice Stephens
- 6 years ago
- Views:
Transcription
1 Pathologic ECG Adelina Vlad, MD PhD
2 Basic Interpretation of the ECG 1) Evaluate calibration 2) Calculate rate 3) Determine rhythm 4) Determine QRS axis 5) Measure intervals 6) Analyze the morphology and interrelation of ECG elements (P, P-Q, Q, QRS, ST, T, QT) in frontal and in precordial leads 6) Asses for Hypertrophy OR 7) Look for evidence of Infarction
3 NSR Parameters Rate Regularity P waves PR interval QRS duration bpm regular normal s s Any deviation from above is sinus tachycardia, sinus bradycardia or an arrhythmia
4 Arrhythmia Formation Arrhythmias can arise from electrophysiological abnormalities in the: Sinus node Atrial cells AV junction Ventricular cells His Purkinje network
5 Mechanisms Underlying Arrhythmias Disorders of impulse formation Automatism Triggered activity Disorders of impulse conduction Partial and complete conduction block Unidirectional block with reentry Aberrant (accessory) conduction pathways
6 SA Node Problems The SA Node can: fire too slow (< 60 bpm) fire too fast (>100 bpm) Sinus Bradycardia Sinus Tachycardia The impulse is conducted normally Sinus Tachycardia may be an appropriate response to stress Both are abnormal Sinus Rhythms
7 Rate? Regularity? P waves? PR interval? QRS duration? 30 bpm regular normal 0.12 s 0.10 s Interpretation? Sinus Bradycardia
8 Rate? Regularity? P waves? PR interval? QRS duration? 130 bpm regular normal 0.16 s 0.08 s Interpretation? Sinus Tachycardia

9 Rare Sinoatrial Block The impulse from the sinus node is blocked before it enters the atrial muscle sudden cessation of P wave the impulse usually originates spontaneously in the atrioventricular node
10 Atrial cells can: Atrial Cell Problems fire occasionally from a focus Premature Atrial Contractions (PACs) fire continuously due to a looping re-entrant circuit Atrial Flutter
11 Rate? Regularity? P waves? 70 bpm occasionally irreg. 2/7 different contour PR interval? 0.14 s (except 2/7) QRS duration? 0.08 s Interpretation? NSR with Premature Atrial Contractions
12 Premature Atrial Contractions Deviation from NSR These ectopic beats originate in the atria (but not in the SA node), therefore the contour of the P wave, the PR interval, and the timing are different than a normally generated pulse from the SA node Compensatory pause Pulse deficit due to a poor ventricular filling during the extrasystolic cycle
13 Premature Atrial Contractions PAC: Excitation of an atrial cell fires a premature impulse that is conducted normally through the AV node and ventricles When an impulse originating anywhere above the ventricles (SA node, atrial cells, AV node, Bundle of His) is conducted normally through the ventricles, the QRS will be narrow ( s)
14 Mechanisms Underlying Arrhythmias Disorders of impulse formation Automatism Triggered activity Disorders of impulse conduction Partial and complete conduction block Unidirectional block with reentry Aberrant (accessory) conduction pathways
15 Enhanced Automaticity Enhancement of normal automacity Development of automaticity in plain atrial or ventricular cells Can arise when the maximum diastolic potential becomes reduced to -50 mv and ICa may be operative at membrane potentials more negative than -70 mv, due to If Pathophysiologic states: increased catecholamines, electrolyte disturbances (e.g. hypokalemia), hypoxia or ischemia, mechanical stretch, drugs (e.g. digitalis)
16 Triggered Activity Requires the presence of an action potential Initiated by afterdepolarizations = depolarizing oscillations in membrane voltage induced by preceding AP Early afterdepolarizations (EAD) arise during phases 2 and 3 of AP Delayed afterdepolarizations (DAD) arise during phase 4 of AP When the after-depolarization reaches threshold, triggers a sequence of pacemaker-like action potentials that generate extrasystoles
 Ca++ channels recover from inactivation and can lead to a spontaneous")
17 EAD During a prolonged AP (bradicardia, hypokalemia, drugs that block outward K currents etc.) Ca++ channels recover from inactivation and can lead to a spontaneous depolarization
18 DAD Spontaneous release of Ca++ from SR during Ca++ overload (digitalis intoxication, injury-related cellular depolarization etc.) produces a transient inward current, Iti Iti is a composite current, resulting from - Na+/Ca++ exchange current - non-specific cation current that are activated by increased intracellular Ca++ concentration When large enough, Iti can produce a spontaneous AP DAD
19 Rate? Regularity? P waves? PR interval? QRS duration? Interpretation? 70 bpm regular flutter waves none 0.06 s Atrial Flutter
20 Atrial Flutter Deviation from NSR No P waves; instead, flutter waves (note sawtooth pattern) are formed at a rate of bpm Only some impulses conduct through the AV node (usually every other impulse, resulting in an aprox. 150 ventricular bpm) Mechanism: Re-entrant pathway in the atria with every 2nd, 3rd or 4th impulse generating a QRS the others are blocked in the AV node
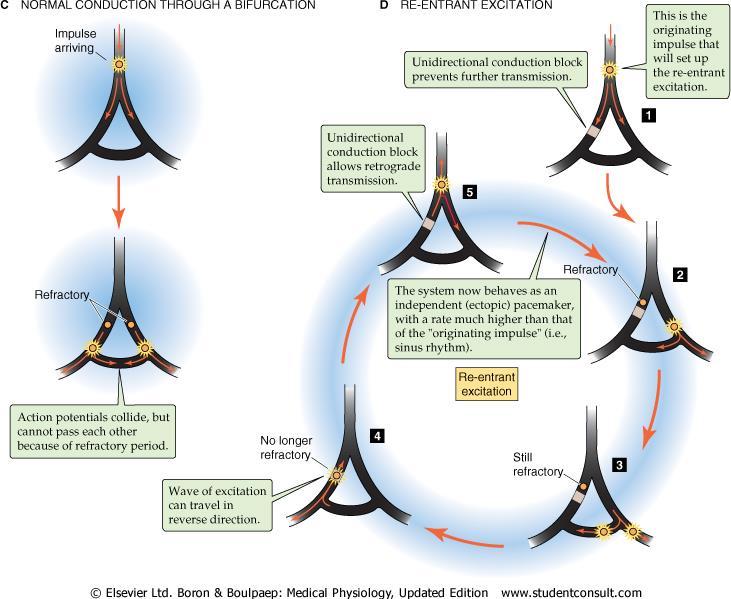
21 A re-entrant pathway (re-entrant excitation or circus movement) Is a wave of depolarization that travels in an endless circle Occurs when an action potential loops and results in self-perpetuating impulse formation Re-entry
 a sufficiently slow conduction of action potentials around the loop (relative to the path length and the action potential")
22 Re entrant Excitation Re-entry has three requirements: (1) a closed conduction loop, (2) with unidirectional conduction, provided by a region of unidirectional block, (3) a sufficiently slow conduction of action potentials around the loop (relative to the path length and the action potential duration)


23 Unidirectional block Partial conduction block in which impulses travel in one direction, but not in the opposite one May arise as a result of a local depolarization or may be due to pathologic changes in functional anatomy
24

25 When the pathway isn t long enough, the head of the reentrant impulse bites its own refractory tail, resulting in extinction of the excitation Pathway Length APD x Conduction Velocity APD action potential duration SHORT PATHWAY

26 The impulse can continue to travel around a closed loop, causing re-entrant excitation if: the pathway around the circle is long (dilated hearts) the velocity of conduction decreases (blockage of the Purkinje system, ischemia, hiperpotasemia etc.) the refractory period of the muscle is shortened (short APD) (drugs, such as epinephrine, or after repetitive electrical stimulation) Pathway Length > APD x Conduction Velocity APD action potential duration
27 Atrial Cell Problems Atrial cells can also: fire continuously from multiple foci or Atrial Fibrillation fire continuously due to multiple micro re-entrant wavelets
28 Rate? Regularity? P waves? PR interval? QRS duration? Interpretation? 100 bpm irregularly irregular none none 0.06 s Atrial Fibrillation
29 Atrial Fibrillation Deviation from NSR No organized atrial depolarization, therefore no normal P waves; the P waves are replaced by f (fibrillatory) waves at a rate of bpm Atrial activity is chaotic (resulting in an irregularly irregular rate)
30 Atrial Fibrillation Mechanism: Multiple re-entrant wavelets conducted between the right and left atria Impulses are formed in a totally unpredictable fashion; the AV node allows some of the impulses to pass through at variable intervals (ventricular rhythm is irregularly irregular, and the rate about bpm)

31 Multiple micro re-entrant wavelets refers to wandering small areas of activation which generate fine chaotic impulses Atrial tissue They are generated by transmission of some of the depolarization waves around the heart in only some directions but not other directions This irregular pattern of impulse travel causes many circuitous routes for the impulses to travel results in an irregular pattern of patchy refractory areas in the heart many impulses traveling in all directions, some dividing and increasing the number of impulses, whereas others are blocked by refractory areas
32 The AV junction can: AV Junctional Problems fire continuously due to a looping re-entrant circuit fire occasionally from a focus block impulses coming from the SA node Paroxysmal Supraventricular Tachycardia (PSVT) Premature Junctional Contractions AV Junctional Blocks
33 Rate? Regularity? P waves? PR interval? QRS duration? Interpretation? bpm Regular regular Normal none 0.16 s none 0.08 s A-V Nodal Paroxysmal Tachycardia
34 PSVT Deviation from NSR The heart rate suddenly speeds up ventricular rate bpm; the P waves are lost or abnormal The paroxysm usually ends as suddenly as it began, with the pacemaker of the heart instantly shifting back to the sinus node PSVT: There are several types of PSVT but all originate above the bifurcation of the His bundle (therefore the QRS is usually narrow) Most common: abnormal conduction in the AV node (reentrant circuit looping in the AV node); P wave absent, covered by the QRS complex
35 Atrial Paroxysmal Tachycardia A PSVT with the abnormal impulse originating in the atria; the P wave is present, but modified
 because the A-V impulse traveled at the same time towards atria and")
36 AV Premature Contractions Premature contractions fired from the A-V node or the A-V bundle The P wave is superimposed onto the QRS-T complex (no P wave on ECG) because the A-V impulse traveled at the same time towards atria and ventricles
37 1st Degree AV Block AV Nodal Blocks 2nd Degree AV Block, Type I 2nd Degree AV Block, Type II 3rd Degree AV Block
38 Rate? Regularity? P waves? PR interval? QRS duration? Interpretation? 60 bpm regular normal 0.36 s 0.08 s 1st Degree AV Block
39 1st Degree AV Block Deviation from NSR PR Interval > 0.20 s Each P is followed by a QRS Etiology: Prolonged conduction delay in the AV node or bundle of His due to idiopathic fibrosis and sclerosis of the conduction system, ischemia, drugs (b-blockers, Ca channel blockers etc), increased vagal tone etc.
40 Rate? Regularity? P waves? PR interval? QRS duration? 50 bpm regularly irregular nl, but 4th no QRS lengthens 0.08 s Interpretation? 2nd Degree AV Block, Type I
41 2nd Degree AV Block, Mobitz Type I Deviation from NSR PR interval progressively lengthens with each beat until the atrial impulse is completely blocked (P wave not followed by QRS) Wenckebach phenomenon R-R intervals > P-P intervals Each successive atrial impulse encounters a longer and longer delay in the AV node until one impulse (usually the 3rd or 4th) fails to be conducted through the AV node
42 Rate? Regularity? P waves? PR interval? QRS duration? 75 bpm regularly irregular nl, 1 of 5 no QRS 0.14 s 0.08 s Interpretation? 2nd Degree AV Block, Type II
 or 4 th (4:1 block) P wave Conduction is all or nothing (the PR interval remains")
43 2nd Degree AV Block, Mobitz Type II Deviation from NSR Occasional P waves are completely blocked (P wave not followed by QRS), usually in a repeating cycle of every 3 rd (3:1 block) or 4 th (4:1 block) P wave Conduction is all or nothing (the PR interval remains constant)
44 High-Grade 2 nd Degree AV Block Every 2 nd or more P wave is blocked 2 P waves are never conducted in a row, therefore the distinction between Mobitz type I and Mobitz type II block is difficult to make
45 Rate? Regularity? P waves? PR interval? QRS duration? Interpretation? 40 bpm regular no relation to QRS none wide (> 0.12 s) 3rd Degree AV Block
46 3rd Degree AV Block Deviation from NSR The P waves are completely blocked in the AV junction; QRS complexes originate independently from below the junction no relationship between P and QRS The atria and ventricles form impulses independently of each other (AV dissociation) Escape rhythms originating above the bifurcation of the His bundle produce narrow QRS and a heart rate > 40 bpm below the bifurcation wide and bizarre QRS, heart rate < 40 bpm
47 Ventricular cells can: Ventricular Cell Problems fire occasionally from 1 or more foci Premature Ventricular Contractions (PVCs) fire continuously due to a looping re-entrant circuit Ventricular Tachycardia fire continuously from multiple foci Ventricular Fibrillation
48 Rate? Regularity? P waves? PR interval? QRS duration? 60 bpm occasionally irreg. none for 7th QRS 0.14 s 0.08 s (7th wide) Interpretation? Sinus Rhythm with 1 PVC

49 PVCs Deviation from NSR Ectopic beats originate in the ventricles resulting in wide and bizarre QRS complexes One or more ventricular cells are depolarizing and the impulses are abnormally conducting through the ventricles
50 Ventricular Conduction Normal Signal moves rapidly through the ventricles Abnormal Signal moves slowly through the ventricles
; T waves have an")

51 A When an impulse originates in a ventricle, conduction is inefficient and the QRS is going to be wide and bizarre (A); T waves have an opposite polarity to the net polarity of the preceding QRS B The origin of the extrasystolic QRS axis points towards the site of the abnormal excitation (B)
52 Rate? Regularity? P waves? PR interval? QRS duration? 160 bpm regular none none wide (> 0.12 sec) Interpretation? Ventricular Tachycardia
53 Ventricular Tachycardia Deviation from NSR Impulse is originating in the ventricles (no P waves, wide QRS) > 3 consecutive ventricular beats at a rate > 120 bpm Can be regular, monomorphic or irregular, polymorphic Results from a re-entrant pathway looping in a ventricle (most common cause) or from abnormal foci or pathways Ventricular tachycardia can sometimes generate enough cardiac output to produce a pulse; at other times no pulse can be felt
54 Rate? Regularity? P waves? PR interval? QRS duration? Interpretation? none irregularly irreg. none none wide, if recognizable Ventricular Fibrillation

55 Ventricular Fibrillation Deviation from NSR Completely abnormal, with ultrarapid baseline undulations, irregular in timing and morphology Multiple wavelet reentrant electrical activity Rapid drop in cardiac output and death occurs if not quickly reversed
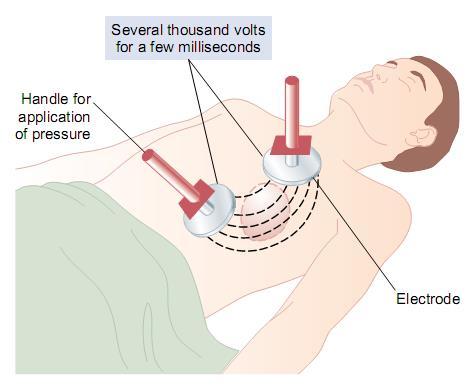
56 Electroshock Defibrillation
57 Basic Interpretation of the ECG 1) Evaluate calibration 2) Calculate rate 3) Determine rhythm 4) Determine QRS axis 5) Measure intervals 6) Analyze the ECG elements (P, P-Q, Q, QRS, ST, T, QT) and their interrelation in frontal and in precordial leads 6) Asses for Hypertrophy OR 7) Look for evidence of Infarction

58 4) Determine QRS Axis (The Electrical Axis of the Heart) Is the axis of the mean force during activation, measured in the frontal plane = mean QRS vector in the frontal plane Equals the sum of instantaneous activation vectors (corresponding to septum, apex, free walls and base activation)
59 Normal and Abnormal QRS Axis The normal QRS axis lies between -30 o and +90 o. A QRS axis that falls between -30 o and -90 o is abnormal and called left axis deviation o -120 o o -90 o -60 o -30 o A QRS axis that falls between +90 o and +150 o is abnormal and called right axis deviation. 180 o 150 o 120 o A QRS axis that falls between +150 o and -90 o is abnormal and called superior right axis deviation. o 90 o 60 o 0 o 30 o
.")

60 Left Axis Deviation Left axis deviation in a hypertensive heart (hypertrophic left ventricle). Note the slightly prolonged QRS complex as well. Left axis deviation caused by left bundle branch block. Note also the greatly prolonged QRS complex.


61 Right Axis Deviation High-voltage electrocardiogram in congenital pulmonary valve stenosis with right ventricular hypertrophy. Superior right axis deviation and a slightly prolonged QRS complex also are seen. Right axis deviation caused by right bundle branch block. Note also the greatly prolonged QRS complex.
62 Intervals refers to the length of the PR and QT intervals and the width of the QRS complexes PR interval 5) Calculate Intervals < 0.12 s s > 0.20 s High catecholamine states Wolff-Parkinson-White Normal AV nodal blocks Wolff-Parkinson-White 1st Degree AV Block

63 Accessory Conduction Pathways Wolf-Parkinson-White (preexcitation) syndrome An accessory (aberrant) pathway conducts potential directly from A to V, providing a short circuit around the delay in the AV node Antegrade conduction occurs over both the accessory pathway and the normal conducting system The accessory pathway, being faster, depolarizes some of the V early short PR interval and a delta wave that prolongs QRS to > 0.1 s

64 Accessory conduction pathways in cases with Wolff Parkinson White syndrome. K, bundle of Kent; J, bundle of James; M, Mahaim fibres; the hatched area represents the atrioventricular border.

65 When the accessory pathway conducts in a retrograde direction can participate in reentrant tachycardia (PSVT)
66

67 QTc interval < 0.44 s > 0.44 s Long QT Normal Long QT Torsades de Pointes A prolonged QT can be very dangerous. It may predispose an individual to a type of ventricular tachycardia called Torsades de Pointes. Causes include drugs, electrolyte abnormalities, CNS disease, post-mi, and congenital heart disease.

68 QT = 0.40 s RR = 0.68 s Square root of RR = 0.82 QTc = 0.40/0.82 = 0.49 s PR interval? QRS width? QTc interval? 0.16 seconds 0.08 seconds 0.49 seconds Interpretation of intervals? Normal PR and QRS, long QT


69 RR 23 boxes 17 boxes 10 boxes QT 13 boxes Normal QT Long QT QTc = QT/ RR Tip: Instead of calculating the QTc, a quick way to estimate if the QT interval is long is to use the following rule: A QT > half of the RR interval is probably long
70 QRS complex < 0.10 s s > 0.12 s Normal Incomplete bundle branch block Bundle branch block PVC Ventricular rhythm Incomplete bundle branch block 3 rd degree AV block with ventricular escape rhythm

 4. Intrinsecoid deflection > 0.06 for RBBB and > 0.")
71 Bundle Branch Blocks 1. QRS complex widens (> 0.12 sec) 2. QRS vector is oriented towards the area with delayed depolarization 3. QRS morphology changes (varies depending on ECG lead, and if it is a right vs. left bundle branch block) 4. Intrinsecoid deflection > 0.06 for RBBB and > 0.08 for LBBB 5. T wave inversion appears
72 QRS duration: < 0.12 s measured in the lead with the widest complex Intrinsecoid deflection: - measures the duration of transmural activation under the recording electrode of a precordial lead (V1, V2, V5, V6) - measured from the peak of the last R of the complex until the onset of the QRS complex - Normal values: < s in V1, V2 and < s in V5, V6 QRS ID ID

73 Right Bundle Branch Block What QRS morphology is characteristic? For RBBB the wide QRS complex assumes a unique, virtually diagnostic shape in those leads overlying the right ventricle (V 1 and V 2 ). V 1 Rabbit Ears
")
74 The terminal vector of ventricular depolarization, corresponding to delayed RV depolarization, is oriented anteriorly and to the right: rsr in V1 and qrs in V6 T wave in V1 is negative due to the delayed repolarization of the right ventricular wall (the vector is oriented posteriorly and to the left) qrs
75
 complexes in V1 and entirely positive complexes (wide, notched R) in V6 T wave has opposite polarity to the net QRS due to a repolarization vector oriented anteriorly and")
76 Left Bundle Branch Block Both early and later phases of ventricular depolarization are altered: both septal and left wall depolarization vectors are oriented posteriorly and to the left wide predominantly negative (QS) complexes in V1 and entirely positive complexes (wide, notched R) in V6 T wave has opposite polarity to the net QRS due to a repolarization vector oriented anteriorly and to the right QS
77
78 6) Hypertrophy The ECG can reveal enlargement or hypertrophy of the four chambers of the heart: Right atrial enlargement (RAE) Left atrial enlargement (LAE) Right ventricular hypertrophy (RVH) Left ventricular hypertrophy (LVH)
79 Atrial Enlargement P wave changes (morphology, axis, amplitude) Due to Inlet ventricular valve stenosis (mitral - often, tricuspid - rare) or insufficiency Pulmonary hypertension Congenital heart diseases Heart failure
 > 2 ½ boxes (in height) A cause of RAE is RVH from pulmonary hypertension (P pulmonale)")
80 Right atrial enlargement P wave morphology: sharp, tall, symmetric in V1, V2, avf, II, III; if biphasic in V1, the positive initial deflection predominates P wave axis: P wave amplitude: II P > 2.5 mm, or V1 or V2 P > 1.5 mm > 1 ½ boxes (in height) > 2 ½ boxes (in height) A cause of RAE is RVH from pulmonary hypertension (P pulmonale)
 between notched peaks, or In V1, neg.")
81 Left atrial enlargement The P waves are broad (> 0.12 s) and often notched in lead I, avl, V5, V6 ; in lead V1 they have a deep and wide negative component In lead II, > 0.04 s (1 box) between notched peaks, or In V1, neg. deflection > 1 box wide x 1 box deep P wave axis: left deviation Normal Notched Negative deflection A common cause of LAE is Mi stenosis
82 Ventricular Hypertrophy Due to a pressure or volume load ECG abnormalities High voltage R, S waves QRS axis deviation Increased intrinsecoid deflection T-wave inversions

83 Left Ventricular Hypertrophy Normal Left Ventricular Hypertrophy The QRS complexes are very tall in the right panel (increased voltage)


84 Left Ventricular Hypertrophy Why is left ventricular hypertrophy characterized by tall QRS complexes? As the heart muscle wall thickens there is an increase in electrical forces moving through the myocardium resulting in increased QRS voltage. LVH Increased QRS voltage ECHOcardiogram
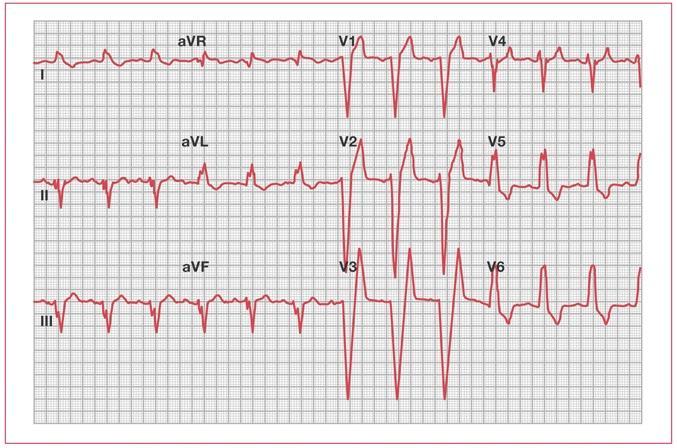
85 Left ventricular hypertrophy Take a look at this ECG. What do you notice about the axis and QRS complexes in leads V5, V6 and V1, V2? The deep S waves seen in the leads over the right ventricle and the tall R waves in the left leads are created because the heart is depolarizing left, superior and posterior (away from leads V1, V2, toward leads V5, V6) There is left axis deviation and there are tall R waves in V5, V6 and deep S waves in V1, V2
86 QRS amplitude = algebraic sum of the amplitudes of the component waves > 1 mv in one precordial lead, > 0.5 mv in a standard lead The amplitude of R and S waves it is used for the diagnosis of left ventricular hypertrophy: Sokolow-Lyon index: Sv1+ (Rv5 or Rv6) > 3.5 mv Cornell voltage criteria: Sv3 + SaVL 2.8 mv for men, 2.0 for women or of right ventricular hypertrophy: Rv1 > 0.7 mv, SV5 or V6 > 0.7 mv etc.
 Sokolow-Lyon index: SV1 + (RV5 or RV6) > 3.5 mv, RaVL > 1.1 mv Cornell voltage criteria: SV3 + SaVL > 2.8 mv and > 2.0 mv QRS duration > 0.11 s, ID > 0.")
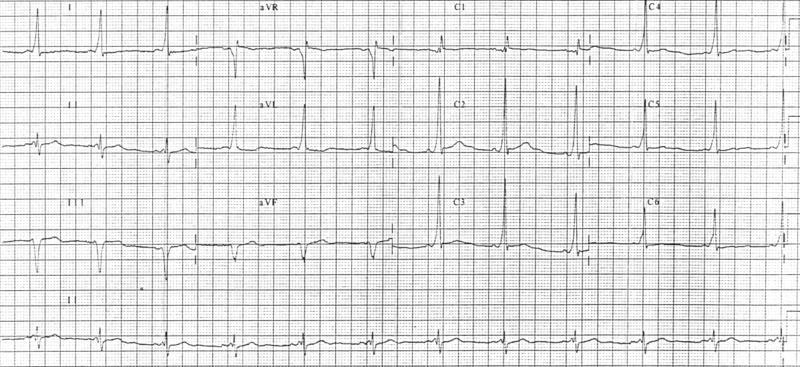
87 Left ventricular hypertrophy, diagnostic criteria: Most characteristic: increased QRS amplitude - R waves in left leads (I, avl, V5, V6) and S waves in the right leads (V1, V2) are oversized (and sometimes notched) Sokolow-Lyon index: SV1 + (RV5 or RV6) > 3.5 mv, RaVL > 1.1 mv Cornell voltage criteria: SV3 + SaVL > 2.8 mv and > 2.0 mv QRS duration > 0.11 s, ID > 0.05 s in V5, V6 QRS axis horizontal or with a left deviation ST depression and T inversion in leads with a tall R S = 13 mm R = 25 mm A common cause of LVH is systemic hypertension.
, left atrial enlargement (> 1 x 1 boxes in V1) and LVH (R in V5 = 27 + S")
88 A 63 years old man has longstanding, uncontrolled hypertension. Is there evidence of heart disease from his hypertension? Yes, there is left axis deviation (positive in I, negative in II), left atrial enlargement (> 1 x 1 boxes in V1) and LVH (R in V5 = 27 + S in V2 = 10 > 35 mm).

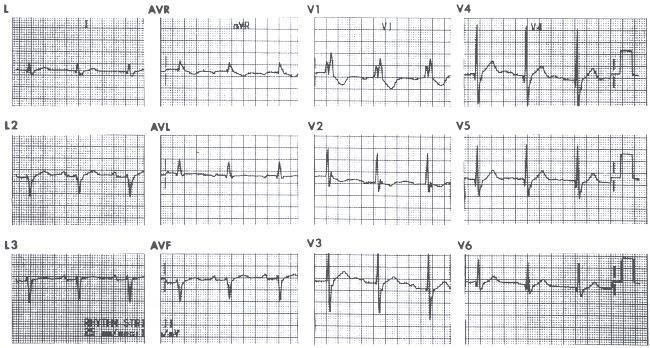
89 Right Ventricular Hypertrophy Right axis deviation, tall R waves in V1, V2, T-wave inversions; P pulmonale can be observed as well
 and deep S in I, avl, V5 (V6): R")


90 Right ventricular hypertrophy Tall R in avr, V1, V2 (R/S>1) and deep S in I, avl, V5 (V6): R in V1 > 0.7 mv, S in V5, V6 > 0.7 mv RV1 + SV5 > 1,05 mv ID > 0.03 s in V1,2 Right QRS axis deviation T-wave inversions Normal R waves in V1, V2 from a normal ECG and from a person with RVH RVH
91 7) Look for Evidence of Infarction ECG findings depend on The nature of the process Reversible ischemia Irreversible - infarction The duration: acute/ chronic The extent: Transmural Subendocardial Localization: anterior, inferoposterior ECG can identify other underlying abnormalities: ventricular hypertropy, conduction defects etc.
92 7) Look for Evidence of Infarction When analyzing a 12-lead ECG for evidence of an infarction one looks for the following: Abnormal Q waves ST elevation or depression Peaked, flat or inverted T waves ST elevation (or depression) in at least two leads is the earliest and most consistent ECG finding during AMI There are ST elevation (Q-wave) and non-st elevation (non-q wave) MIs

93 ST Elevation Elevation of the ST segment in at least 2 leads is consistent with a myocardial infarction Because blood flow is regional, the area of infarction are also regional specific ECG leads can provide the best view of the infarcted area

94 Views of the Heart Some leads get a good view of the: Anterior portion of the heart Leads V1 V4 Lateral portion of the heart Leads I, avl, V5, V6 Inferior portion of the heart Leads II, III, avf

95 Anterior Wall MI Can be recognized if there are changes in leads V 1 - V 4 that are consistent with a myocardial infarction

96 Inferior Wall MI ST segment is elevated in leads II, III and avf
 and the lateral wall (V 5 -V 6, I, and avl)!")
97 Anterolateral MI This person s MI involves both the anterior wall (V 2 -V 4 ) and the lateral wall (V 5 -V 6, I, and avl)!
98 ST Elevation and non-st Elevation MIs When myocardial blood supply is abruptly reduced or cut off to a region of the heart, a sequence of injurious events occur beginning with ischemia (inadequate tissue perfusion), followed by necrosis (infarction), and eventual fibrosis (scarring) if the blood supply is not restored in an appropriate period of time. The ECG changes over time with each of these events
99 Mild ischemia increases K+ outflow shortens APD affected areas are repolarized before the rest of the myocardium changes of repolarization vector leading to T wave abnormalities

100 Severe, acute ischemia can reduce the resting membrane potential, shorten APD and decrease the slope and amplitude of phase 0 voltage gradient between normal and ischemic area current flows = diastolic and systolic injury currents


101 Transmural ischemia: overall ST vector shifts toward epicardial layers ST elevation, tall T waves in the overlying leads Subendocardial ischemia: overall ST vector shifts toward the inner layer and the ventricular cavity ST segment depression in the overlying leads
102 Necrosis decreased R amplitude or pathologic Q waves genesis due to loss of electric activity in the infarcted area
103 ECG Changes Ways the ECG can change include: ST elevation & depression T-waves Appearance of pathologic Q-waves peaked flattened inverted
 Non-ST Elevation (Subendocardial or")
104 ECG Changes and the Evolving MI There are two distinct patterns of ECG change depending if the infarction is: Non-ST Elevation ST Elevation ST Elevation (Transmural or Epicardial MI) Non-ST Elevation (Subendocardial or non-q-wave)
105 ST Elevation Infarction Diagram depicting an evolving infarction: A. Normal ECG prior to MI B. Ischemia from coronary artery occlusion results in ST elevation and peaked T-waves normal hours C. Infarction from ongoing ischemia results in marked ST elevation hours days D/E. Ongoing infarction with appearance of pathologic Q-waves; T-wave inversion may occur weeks months F. Fibrosis (months later) with persistent Q- waves, but normal ST segment and T- waves of the clinical onset of an MI
!")
106 ST Elevation Infarction ECG of an inferior MI: Look at the inferior leads (II, III, avf) What ECG changes do you see? ST elevation and Q-waves Extra credit: What is the rhythm? Atrial fibrillation (irregularly irregular with narrow QRS)!
107 Non-ST Elevation Infarction The ECG changes seen with a non-st elevation infarction are: Before injury Normal ECG Ischemia ST depression & T-wave inversion Infarction Fibrosis ST depression & T-wave inversion ST returns to baseline, but T-wave inversion persists

108 Non-ST Elevation Infarction Here s an ECG of an evolving non-st elevation MI: Note the ST depression and T-wave inversion in leads V 2 -V 6. Question: What area of the heart is infarcting? Anterolateral
The Electrocardiogram part II. Dr. Adelina Vlad, MD PhD
 The Electrocardiogram part II Dr. Adelina Vlad, MD PhD Basic Interpretation of the ECG 1) Evaluate calibration 2) Calculate rate 3) Determine rhythm 4) Determine QRS axis 5) Measure intervals 6) Analyze
ECG Interpretation Made Easy
 ECG Interpretation Made Easy Dr. A Tageldien Abdellah, MSc MD EBSC Lecturer of Cardiology- Hull University Hull York Medical School 2007-2008 ECG Interpretation Made Easy Synopsis Benefits Objectives Process
ECG ABNORMALITIES D R. T AM A R A AL Q U D AH
 ECG ABNORMALITIES D R. T AM A R A AL Q U D AH When we interpret an ECG we compare it instantaneously with the normal ECG and normal variants stored in our memory; these memories are stored visually in
UNDERSTANDING YOUR ECG: A REVIEW
 UNDERSTANDING YOUR ECG: A REVIEW Health professionals use the electrocardiograph (ECG) rhythm strip to systematically analyse the cardiac rhythm. Before the systematic process of ECG analysis is described
Cardiology Flash Cards
 Cardiology Flash Cards EKG in a nut shell www.brain101.info Conduction System www.brain101.info 2 Analyzing EKG Step by step Steps in Analyzing ECG'S 1. Rhythm: - Regular _ Sinus, Junctional or Ventricular.
REtrive. REpeat. RElearn Design by. Test-Enhanced Learning based ECG practice E-book
 Test-Enhanced Learning Test-Enhanced Learning Test-Enhanced Learning Test-Enhanced Learning based ECG practice E-book REtrive REpeat RElearn Design by S I T T I N U N T H A N G J U I P E E R I Y A W A
ECG Interpretation Cat Williams, DVM DACVIM (Cardiology)
") ECG Interpretation Cat Williams, DVM DACVIM (Cardiology) Providing the best quality care and service for the patient, the client, and the referring veterinarian. GOAL: Reduce Anxiety about ECGs Back to
ECG Interpretation Cat Williams, DVM DACVIM (Cardiology) Providing the best quality care and service for the patient, the client, and the referring veterinarian. GOAL: Reduce Anxiety about ECGs Back to
ELECTROCARDIOGRAPHY KEVIN REBECK PA-C. For more presentations
 ELECTROCARDIOGRAPHY KEVIN REBECK PA-C For more presentations www.medicalppt.blogspot.com Objectives ECG History Pathophysiology Basics Case Historys Electrical activation of the heart In the heart
If the P wave > 0.12 sec( 3 mm) usually in any lead. Notched P wave usually in lead I,aVl may be lead II Negative terminal portion of P wave in V1, 1
 usually in any lead. Notched P wave usually in lead I,aVl may be lead II Negative terminal portion of P wave in V1, 1") If the P wave > 0.12 sec( 3 mm) usually in any lead. Notched P wave usually in lead I,aVl may be lead II Negative terminal portion of P wave in V1, 1 mm depth and 3 mm width( most specific) Since Mitral
If the P wave > 0.12 sec( 3 mm) usually in any lead. Notched P wave usually in lead I,aVl may be lead II Negative terminal portion of P wave in V1, 1 mm depth and 3 mm width( most specific) Since Mitral
Pennsylvania Academy of Family Physicians Foundation & UPMC 43rd Refresher Course in Family Medicine CME Conference March 10-13, 2016
 Pennsylvania Academy of Family Physicians Foundation & UPMC 43rd Refresher Course in Family Medicine CME Conference March 10-13, 2016 Disclosures: EKG Workshop Louis Mancano, MD Speaker has no disclosures
Please check your answers with correct statements in answer pages after the ECG cases.
 ECG Cases ECG Case 1 Springer International Publishing AG, part of Springer Nature 2018 S. Okutucu, A. Oto, Interpreting ECGs in Clinical Practice, In Clinical Practice, https://doi.org/10.1007/978-3-319-90557-0
Step by step approach to EKG rhythm interpretation:
 Sinus Rhythms Normal sinus arrhythmia Small, slow variation of the R-R interval i.e. variation of the normal sinus heart rate with respiration, etc. Sinus Tachycardia Defined as sinus rhythm with a rate
12-Lead ECG Interpretation. Kathy Kuznar, RN, ANP
 12-Lead ECG Interpretation Kathy Kuznar, RN, ANP The 12-Lead ECG Objectives Identify the normal morphology and features of the 12- lead ECG. Perform systematic analysis of the 12-lead ECG. Recognize abnormalities
2) Heart Arrhythmias 2 - Dr. Abdullah Sharif
 Heart Arrhythmias 2 - Dr. Abdullah Sharif") 2) Heart Arrhythmias 2 - Dr. Abdullah Sharif Rhythms from the Sinus Node Sinus Tachycardia: HR > 100 b/m Causes: o Withdrawal of vagal tone & Sympathetic stimulation (exercise, fight or flight) o Fever
2) Heart Arrhythmias 2 - Dr. Abdullah Sharif Rhythms from the Sinus Node Sinus Tachycardia: HR > 100 b/m Causes: o Withdrawal of vagal tone & Sympathetic stimulation (exercise, fight or flight) o Fever
Electrocardiography Abnormalities (Arrhythmias) 7. Faisal I. Mohammed, MD, PhD
 7. Faisal I. Mohammed, MD, PhD") Electrocardiography Abnormalities (Arrhythmias) 7 Faisal I. Mohammed, MD, PhD 1 Causes of Cardiac Arrythmias Abnormal rhythmicity of the pacemaker Shift of pacemaker from sinus node Blocks at different
Electrocardiography Abnormalities (Arrhythmias) 7 Faisal I. Mohammed, MD, PhD 1 Causes of Cardiac Arrythmias Abnormal rhythmicity of the pacemaker Shift of pacemaker from sinus node Blocks at different
ELECTROCARDIOGRAPHY (III) THE ANALYSIS OF THE ELECTROCARDIOGRAM
 THE ANALYSIS OF THE ELECTROCARDIOGRAM") ELECTROCARDIOGRAPHY (III) THE ANALYSIS OF THE ELECTROCARDIOGRAM Scridon Alina, Șerban Răzvan Constantin Recording and analysis of the 12-lead ECG is part of the basic medical assessment performed for every
ELECTROCARDIOGRAPHY (III) THE ANALYSIS OF THE ELECTROCARDIOGRAM Scridon Alina, Șerban Răzvan Constantin Recording and analysis of the 12-lead ECG is part of the basic medical assessment performed for every
ECG CONVENTIONS AND INTERVALS
 1 ECG Waveforms and Intervals ECG waveforms labeled alphabetically P wave== represents atrial depolarization QRS complex=ventricular depolarization ST-T-U complex (ST segment, T wave, and U wave)== V repolarization.
ECGs and Arrhythmias: Family Medicine Board Review 2009
 Rate Rhythm Intervals Hypertrophy ECGs and Arrhythmias: Family Medicine Board Review 2009 Axis Jess (Fogler) Waldura, MD University of California, San Francisco walduraj@nccc.ucsf.edu Ischemia Overview
Basic electrocardiography reading. R3 lee wei-chieh
 Basic electrocardiography reading R3 lee wei-chieh The Normal Conduction System Lead Placement avf Limb Leads Precordial Leads Interpretation Rate Rhythm Interval Axis Chamber abnormality QRST change What
ECG Practice Strips Discussion part 1:
 ECG Practice Strips Discussion part 1: The first 20 strips are for teaching various abnormalities of the morphology of the waves of the ECG. Strips 21 and following are for teaching some abnormalities
Study methodology for screening candidates to athletes risk
 1. Periodical Evaluations: each 2 years. Study methodology for screening candidates to athletes risk 2. Personal history: Personal history of murmur in childhood; dizziness, syncope, palpitations, intolerance
1 st Degree Block Prolonged P-R interval caused by first degree heart block (lead II)
") AV Heart Blocks 1 st degree A condition of a rhythm, not a true rhythm Need to always state underlying rhythm 2 nd degree Type I - Wenckebach Type II Classic dangerous to the patient Can be variable (periodic)
AV Heart Blocks 1 st degree A condition of a rhythm, not a true rhythm Need to always state underlying rhythm 2 nd degree Type I - Wenckebach Type II Classic dangerous to the patient Can be variable (periodic)
Introduction to Electrocardiography
 Introduction to Electrocardiography Class Objectives: Introduction to ECG monitoring Discuss principles of interpretation Identify the components and measurements of the ECG ECG analysis ECG Monitoring
SIMPLY ECGs. Dr William Dooley
 SIMPLY ECGs Dr William Dooley Content Basic ECG interpretation pattern Some common (examined) abnormalities Presenting ECGs in context Setting up an ECG Setting up an ECG 1 V1-4 th Right intercostal space
Appendix D Output Code and Interpretation of Analysis
 Appendix D Output Code and Interpretation of Analysis 8 Arrhythmia Code No. Description 8002 Marked rhythm irregularity 8110 Sinus rhythm 8102 Sinus arrhythmia 8108 Marked sinus arrhythmia 8120 Sinus tachycardia
ELECTROCARDIOGRAPH. General. Heart Rate. Starship Children s Health Clinical Guideline
 General Heart Rate QRS Axis T Wave Axis PR Interval according to Heart Rate & Age P Wave Duration and Amplitude QRS Duration according to Age QT Interval R & S voltages according to Lead & Age R/S ratio
General Introduction to ECG. Reading Assignment (p2-16 in PDF Outline )
") General Introduction to ECG Reading Assignment (p2-16 in PDF Outline ) Objectives 1. Practice the 5-step Method 2. Differential Diagnosis: R & L axis deviation 3. Differential Diagnosis: Poor R-wave progression
General Introduction to ECG Reading Assignment (p2-16 in PDF Outline ) Objectives 1. Practice the 5-step Method 2. Differential Diagnosis: R & L axis deviation 3. Differential Diagnosis: Poor R-wave progression
Electrocardiogram ECG. Hilal Al Saffar FRCP FACC College of medicine,baghdad University
 Electrocardiogram ECG Hilal Al Saffar FRCP FACC College of medicine,baghdad University Tuesday 29 October 2013 ECG introduction Wednesday 30 October 2013 Abnormal ECG ( ischemia, chamber hypertrophy, heart
CRC 431 ECG Basics. Bill Pruitt, MBA, RRT, CPFT, AE-C
 CRC 431 ECG Basics Bill Pruitt, MBA, RRT, CPFT, AE-C Resources White s 5 th ed. Ch 6 Electrocardiography Einthoven s Triangle Chest leads and limb leads Egan s 10 th ed. Ch 17 Interpreting the Electrocardiogram
This presentation will deal with the basics of ECG description as well as the physiological basics of
 Snímka 1 Electrocardiography basics This presentation will deal with the basics of ECG description as well as the physiological basics of Snímka 2 Lecture overview 1. Cardiac conduction system functional
2017 EKG Workshop Advanced. Family Medicine Review Course Lou Mancano, MD, FAAFP Reading Health System Family and Community Medicine Reading, PA
 2017 EKG Workshop Advanced Family Medicine Review Course Lou Mancano, MD, FAAFP Reading Health System Family and Community Medicine Reading, PA Part II - Objective Describe a useful approach to interpreting
Understanding the 12-lead ECG, part II
 Bundle-branch blocks Understanding the 12-lead ECG, part II Most common electrocardiogram (ECG) abnormality Appears as a wider than normal S complex Occurs when one of the two bundle branches can t conduct
Conduction Problems / Arrhythmias. Conduction
 Conduction Problems / Arrhythmias Conduction Wolf-Parkinson White Syndrome (WPW) and Lown-Ganong-Levine (LGL): Atrial impulses bypass the AV node through an accessory pathway or bypass tract (bundle of
Ekg pra pr c a tice D.HAMMOUDI.MD
 Ekg practice D.HAMMOUDI.MD Anatomy Revisited RCA (Right Coronary Artery) Right ventricle Inferior wall of LV Posterior wall of LV (75%) SA Node (60%) AV Node (>80%) LCA (Left Coronary Artery) Septal wall
CASE 10. What would the ST segment of this ECG look like? On which leads would you see this ST segment change? What does the T wave represent?
 CASE 10 A 57-year-old man presents to the emergency center with complaints of chest pain with radiation to the left arm and jaw. He reports feeling anxious, diaphoretic, and short of breath. His past history
Paediatric ECG Interpretation
 Paediatric ECG Interpretation Dr Sanj Fernando (thanks to http://lifeinthefastlane.com/ecg-library/paediatric-ecginterpretation/) 3 yo boy complaining of abdominal pain and chest pain Child ECG vs Adult
Electrical System Overview Electrocardiograms Action Potentials 12-Lead Positioning Values To Memorize Calculating Rates
 Electrocardiograms Electrical System Overview James Lamberg 2/ 74 Action Potentials 12-Lead Positioning 3/ 74 4/ 74 Values To Memorize Inherent Rates SA: 60 to 100 AV: 40 to 60 Ventricles: 20 to 40 Normal
402 Index. B β-blockers, 4, 5 Bradyarrhythmias, 76 77
 Index A Acquired immunodeficiency syndrome (AIDS), 126, 163 Action potentials, 1, 5, 27 Acute coronary syndromes, 123t, 129 Adenosine, intravenous, 277 Alcohol abuse, as T wave inversion cause, 199 Aneurysm,
EKG Competency for Agency
 EKG Competency for Agency Name: Date: Agency: 1. The upper chambers of the heart are known as the: a. Atria b. Ventricles c. Mitral Valve d. Aortic Valve 2. The lower chambers of the heart are known as
ECG. Prepared by: Dr.Fatima Daoud Reference: Guyton and Hall Textbook of Medical Physiology,12 th edition Chapters: 11,12,13
 ECG Prepared by: Dr.Fatima Daoud Reference: Guyton and Hall Textbook of Medical Physiology,12 th edition Chapters: 11,12,13 The Concept When the cardiac impulse passes through the heart, electrical current
Cardiac arrhythmias. Janusz Witowski. Department of Pathophysiology Poznan University of Medical Sciences. J. Witowski
 Cardiac arrhythmias Janusz Witowski Department of Pathophysiology Poznan University of Medical Sciences A 68-year old man presents to the emergency department late one evening complaining of increasing
Chapter 16: Arrhythmias and Conduction Disturbances
 Complete the following. Chapter 16: Arrhythmias and Conduction Disturbances 1. Cardiac arrhythmias result from abnormal impulse, abnormal impulse, or both mechanisms together. 2. is the ability of certain
SIMPLY ECGs. Dr William Dooley
 SIMPLY ECGs Dr William Dooley 1 No anatomy just interpretation 2 Setting up an ECG 3 Setting up an ECG 1 V1-4 th Right intercostal space at sternal border 2 V2-4 th Left intercostal space at sternal border
ECG (MCQs) In the fundamental rules of the ECG all the following are right EXCEP:
 In the fundamental rules of the ECG all the following are right EXCEP:") ECG (MCQs) 2010 1- In the fundamental rules of the ECG all the following are right EXCEP: a- It is a biphasic record of myocardial action potential fluctuations. b- Deflection record occurs only during
ECG (MCQs) 2010 1- In the fundamental rules of the ECG all the following are right EXCEP: a- It is a biphasic record of myocardial action potential fluctuations. b- Deflection record occurs only during
Section V. Objectives
 Section V Landscape of an MI Objectives At the conclusion of this presentation the participant will be able to Outline a systematic approach to 12 lead ECG interpretation Demonstrate the process for determining
ABCs of ECGs. Shelby L. Durler
 ABCs of ECGs Shelby L. Durler Objectives Review the A&P of the cardiac conduction system Placement and obtaining 4-lead and 12-lead ECGs Overview of the basics of ECG rhythm interpretation Intrinsic
DR QAZI IMTIAZ RASOOL OBJECTIVES
 PRACTICAL ELECTROCARDIOGRAPHY DR QAZI IMTIAZ RASOOL OBJECTIVES Recording of electrical events in heart Established electrode pattern results in specific tracing pattern Health of heart i. e. Anatomical
Lab Activity 24 EKG. Portland Community College BI 232
 Lab Activity 24 EKG Reference: Dubin, Dale. Rapid Interpretation of EKG s. 6 th edition. Tampa: Cover Publishing Company, 2000. Portland Community College BI 232 Graph Paper 1 second equals 25 little boxes
ECGs and Arrhythmias: Family Medicine Board Review 2012
 Overview ECGs and Arrhythmias: Family Medicine Board Review 2012 Jess Waldura, MD University of California, San Francisco walduraj@nccc.ucsf.edu Bundle branch blocks Quick review of ischemia Arrhythmias
2017 EKG Workshop Basic. Family Medicine Review Course Lou Mancano, MD, FAAFP Reading Health System Family and Community Medicine Reading, PA
 2017 EKG Workshop Basic Family Medicine Review Course Lou Mancano, MD, FAAFP Reading Health System Family and Community Medicine Reading, PA Part I - Objectives Discuss a systematic approach to EKG interpretation
Introduction to ECG Gary Martin, M.D.
 Brief review of basic concepts Introduction to ECG Gary Martin, M.D. The electrical activity of the heart is caused by a sequence of rapid ionic movements across cell membranes resulting first in depolarization
ECG Basics Sonia Samtani 7/2017 UCI Resident Lecture Series
 ECG Basics Sonia Samtani 7/2017 UCI Resident Lecture Series Agenda I. Introduction II.The Conduction System III.ECG Basics IV.Cardiac Emergencies V.Summary The Conduction System Lead Placement avf Precordial
Huseng Vefali MD St. Luke s University Health Network Department of Cardiology
 Huseng Vefali MD St. Luke s University Health Network Department of Cardiology Learning Objectives Establish Consistent Approach to Interpreting ECGs Review Essential Cases for Paramedics and first responders
ECGs: Everything a finalist needs to know. Dr Amy Coulden As part of the Simply Finals series
 ECGs: Everything a finalist needs to know Dr Amy Coulden As part of the Simply Finals series Aims and objectives To be able to interpret basic ECG abnormalities To be able to recognise commonly tested
HR: 50 bpm (Sinus) PR: 280 ms QRS: 120 ms QT: 490 ms Axis: -70. Sinus bradycardia with one ventricular escape (*)
 PR: 280 ms QRS: 120 ms QT: 490 ms Axis: -70. Sinus bradycardia with one ventricular escape (*)") 1? HR: 50 bpm (Sinus) PR: 280 ms QRS: 120 ms QT: 490 ms Axis: -70 1 Sinus P waves? 2 sinus cycles The pause (2 sinus cycles) suggests that the sinus fired (?) but did not conduct to the atria (i.e., missing
1? HR: 50 bpm (Sinus) PR: 280 ms QRS: 120 ms QT: 490 ms Axis: -70 1 Sinus P waves? 2 sinus cycles The pause (2 sinus cycles) suggests that the sinus fired (?) but did not conduct to the atria (i.e., missing
EKG Abnormalities. Adapted from:
 EKG Abnormalities Adapted from: http://www.bem.fi/book/19/19.htm Some key terms: Arrhythmia-an abnormal rhythm or sequence of events in the EKG Flutter-rapid depolarizations (and therefore contractions)
Course Objectives. Proper Lead Placements. Review the ECG print paper. Review the mechanics of the Myocardium. Review basics of ECG Rhythms
 ECG Interpretations Course Objectives Proper Lead Placements Review the ECG print paper Review the mechanics of the Myocardium Review basics of ECG Rhythms How Leads Work The ECG Leads we use are Bipolar
-RHYTHM PRACTICE- By Dr.moanes Msc.cardiology Assistant Lecturer of Cardiology Al Azhar University. OBHG Education Subcommittee
 -RHYTHM PRACTICE- By Dr.moanes Msc.cardiology Assistant Lecturer of Cardiology Al Azhar University The Normal Conduction System Sinus Node Normal Sinus Rhythm (NSR) Sinus Bradycardia Sinus Tachycardia
Supraventricular Arrhythmias. Reading Assignment. Chapter 5 (p17-30)
") Supraventricular Arrhythmias Reading Assignment Chapter 5 (p17-30) The Supraventricular Rhythms In Our Lives Site of Origin Single Events Slow Rates Intermediate Rates Fast Rates (>100 bpm) Sinus Sinus
Supraventricular Arrhythmias Reading Assignment Chapter 5 (p17-30) The Supraventricular Rhythms In Our Lives Site of Origin Single Events Slow Rates Intermediate Rates Fast Rates (>100 bpm) Sinus Sinus
V. TACHYCARDIAS Rapid rhythm abnormalities
 V. TACHYCARDIAS Rapid rhythm abnormalities Tachyarrhythmias currently account for up to 350,000 deaths annually in the US. In addition to these clearly dangerous rhythm disturbances, other forms of more
PATIENT S NAME, DATE/TIME,
 ECG and Arrhythmias Dec, 1 st 2014 Doctor Mohammad Jarrah References: - Lecture and Slides - ECG Made Easy - Davidson Principles of Medicine - First Aid Cases for the USMLE Step 1 - Mini-OSCE Archive ECG
Chapter 2 Practical Approach
 Chapter 2 Practical Approach There are beginners in electrocardiogram (ECG) analysis who are fascinated by a special pattern (e.g., a bundle-branch block or a striking Q wave) and thereby overlook other
ECG Interpretation. Introduction to Cardiac Telemetry. Michael Peters, RN, CCRN, CFRN CALSTAR Air Medical Services
 ECG Interpretation Introduction to Cardiac Telemetry Michael Peters, RN, CCRN, CFRN CALSTAR Air Medical Services Disclosures Nothing to disclose Objectives Describe the electrical conduction pathway in
Blocks & Dissociations. Reading Assignment (p47-52 in Outline )
") Blocks & Dissociations Reading Assignment (p47-52 in Outline ) Objectives Who are Wenckebach and Mobitz? Review SA and AV Blocks AV Dissociations: learning who s the boss and why 2 nd degree SA Block:
Blocks & Dissociations Reading Assignment (p47-52 in Outline ) Objectives Who are Wenckebach and Mobitz? Review SA and AV Blocks AV Dissociations: learning who s the boss and why 2 nd degree SA Block:
Dr.Binoy Skaria 13/07/15
 Dr.Binoy Skaria binoyskaria@hotmail.com binoy.skaria@heartofengland.nhs.uk 13/07/15 Acknowledgement Medtronic, Google images & Elsevier for slides Natalie Ryan, Events Manager, HEFT- for organising the
CORONARY ARTERIES. LAD Anterior wall of the left vent Lateral wall of left vent Anterior 2/3 of interventricluar septum R & L bundle branches
 CORONARY ARTERIES RCA Right atrium Right ventricle SA node 55% AV node 90% Posterior wall of left ventricle in 90% Posterior third of interventricular septum 90% LAD Anterior wall of the left vent Lateral
Arrhythmic Complications of MI. Teferi Mitiku, MD Assistant Clinical Professor of Medicine University of California Irvine
 Arrhythmic Complications of MI Teferi Mitiku, MD Assistant Clinical Professor of Medicine University of California Irvine Objectives Brief overview -Pathophysiology of Arrhythmia ECG review of typical
Case 1. Case 2. Case 3
 Case 1 The correct answer is D. Occasionally, the Brugada syndrome can present similar morphologies to A and also change depending on the lead position but in the Brugada pattern the r is wider and ST
Pathological Arrhythmias/ Tachyarrhythmias
 Pathological Arrhythmias/ Tachyarrhythmias caused by: 1.Ectopic focus: Extrasystole or premature beat. If discharge is occasional. Can be: Atrial Extrasystole Vevtricular Extrasystole 2.Cardiac Arrhythmia
Paroxysmal Supraventricular Tachycardia PSVT.
 Atrial Tachycardia; is the name for an arrhythmia caused by a disorder of the impulse generation in the atrium or the AV node. An area in the atrium sends out rapid signals, which are faster than those
Family Medicine for English language students of Medical University of Lodz ECG. Jakub Dorożyński
 Family Medicine for English language students of Medical University of Lodz ECG Jakub Dorożyński Parts of an ECG The standard ECG has 12 leads: six of them are considered limb leads because they are placed
Rhythm ECG Characteristics Example. Normal Sinus Rhythm (NSR)
") Normal Sinus Rhythm (NSR) Rate: 60-100 per minute Rhythm: R- R = P waves: Upright, similar P-R: 0.12-0.20 second & consistent P:qRs: 1P:1qRs Sinus Tachycardia Exercise Hypovolemia Medications Fever Substances
Normal Sinus Rhythm (NSR) Rate: 60-100 per minute Rhythm: R- R = P waves: Upright, similar P-R: 0.12-0.20 second & consistent P:qRs: 1P:1qRs Sinus Tachycardia Exercise Hypovolemia Medications Fever Substances
12 LEAD EKG BASICS. By: Steven Jones, NREMT P CLEMC
 12 LEAD EKG BASICS By: Steven Jones, NREMT P CLEMC ECG Review Waves and Intervals P wave: the sequential activation (depolarization) of the right and left atria QRS complex: right and left ventricular
Blocks classification by their constancy or steadiness
 Blocks classification by their constancy or steadiness By their constance the blocks can be: 1. Permanent 2. Temporary, transient or transitory 3. Intermittent (Okajima 1980): 3a) Dependent on heart rate:
FLB s What Are Those Funny-Looking Beats?
 FLB s What Are Those Funny-Looking Beats? Reading Assignment (pages 27-45 in Outline ) The 5-Step Method ECG #: Mearurements: Rhythm (s): Conduction: Waveform: Interpretation: A= V= PR= QRS= QT= Axis=
PAEDIATRIC ECG Dimosthenis Avramidis, MD.
 PAEDIATRIC ECG Dimosthenis Avramidis, MD. Consultant Mitera Children s Hospital Athens Greece S. Associate 1st Cardiology Dpt Evangelismos Hospital Athens Greece 5 y/o with sinus tach Background ECG changes
12 Lead ECG. Presented by Rebecca Sevigny BSN, RN Professional Practice & Development Dept.
 12 Lead ECG Presented by Rebecca Sevigny BSN, RN Professional Practice & Development Dept. Two Main Coronary Arteries RCA LCA which branches into Left Anterior Descending Circumflex Artery Two Main Coronary
Dr. Schroeder has no financial relationships to disclose
 Valerie A Schroeder MD MS Assistant Professor University of Kansas Medical Center READING THE WAVES- THE HEART S ELECTRICAL MESSAGE FINANCIAL DISCLOSURE Dr. Schroeder has no financial relationships to
Understanding basics of EKG
 Understanding basics of EKG By Alula A.(R III) www.le.ac.uk Topic for discussion Understanding of cellular electrophysiology Basics Rate Rhythm Axis Intervals P wave QRS ST/T wave Abnormal EKGs Understanding
12 Lead ECG Skills: Building Confidence for Clinical Practice. Presented By: Cynthia Webner, BSN, RN, CCRN-CMC. Karen Marzlin, BSN, RN,CCRN-CMC
 12 Lead ECG Skills: Building Confidence for Clinical Practice NTI 2009 Preconference Session 803 Presented By: Karen Marzlin, BSN, RN,CCRN-CMC 1 12 Lead ECG Fundamentals: The Starting Place for Linking
A Review of Cardiac Pathophysiology and EKG. Jamie Dyson PT, DPT Kathy Swanick PT, DPT, OCS
 A Review of Cardiac Pathophysiology and EKG Jamie Dyson PT, DPT Kathy Swanick PT, DPT, OCS Cardiac Pathophysiology Coronary Artery Disease Congestive Heart Failure Valvular Heart Disease Athletic Heart
6/19/2018. Background Athlete s heart. Ultimate question. Applying the International Criteria for ECG
 Applying the International Criteria for ECG Interpretation in Athletes to a preparticipation screening program DAVE SIEBERT, MD, CAQSM ASSISTANT PROFESSOR DEPARTMENT OF FAMILY MEDICINE UNIVERSITY OF WASHINGTON
ECG interpretation basics
 ECG interpretation basics Michał Walczewski, MD Krzysztof Ozierański, MD 21.03.18 Electrical conduction system of the heart Limb leads Precordial leads 21.03.18 Precordial leads Precordial leads 21.03.18
ECG Interpretation. Best to have a system to methodically evaluate ECG (from Dubin) * Rate * Rhythm * Axis * Intervals * Hypertrophy * Infarction
 * Rate * Rhythm * Axis * Intervals * Hypertrophy * Infarction") ECG to save Babies ECG Interpretation Best to have a system to methodically evaluate ECG (from Dubin) * Rate * Rhythm * Axis * Intervals * Hypertrophy * Infarction Electrical Activity in the heart 5 events
ECG to save Babies ECG Interpretation Best to have a system to methodically evaluate ECG (from Dubin) * Rate * Rhythm * Axis * Intervals * Hypertrophy * Infarction Electrical Activity in the heart 5 events
Reading Assignment (p1-91 in Outline ) Objectives What s in an ECG?
 Objectives What s in an ECG?") Reading Assignment (p1-91 in Outline ) Objectives What s in an ECG? The 5-Step Method ECG #: Mearurements: Rhythm (s): Conduction: Waveform: Interpretation: A= V= PR= QRS= QT= Axis= 1. Compute the 5 basic
Reading Assignment (p1-91 in Outline ) Objectives What s in an ECG? The 5-Step Method ECG #: Mearurements: Rhythm (s): Conduction: Waveform: Interpretation: A= V= PR= QRS= QT= Axis= 1. Compute the 5 basic
Myocardial Infarction. Reading Assignment (p66-78 in Outline )
") Myocardial Infarction Reading Assignment (p66-78 in Outline ) Objectives 1. Why do ST segments go up or down in ischemia? 2. STEMI locations and culprit vessels 3. Why 15-lead ECGs? 4. What s up with avr?
Myocardial Infarction Reading Assignment (p66-78 in Outline ) Objectives 1. Why do ST segments go up or down in ischemia? 2. STEMI locations and culprit vessels 3. Why 15-lead ECGs? 4. What s up with avr?
Cardiac Arrhythmia How to approach นพ.พ น จ แกวส วรรณะ หน วยโรคห วใจและหลอดเล อด
 Cardiac Arrhythmia How to approach นพ.พ น จ แกวส วรรณะ หน วยโรคห วใจและหลอดเล อด EKG paper is a grid where time is measured along the horizontal axis. Each small square is 1 mm in length and represents
Proceedings of the World Small Animal Veterinary Association Sydney, Australia 2007
 Proceedings of the World Small Animal Sydney, Australia 2007 Hosted by: Next WSAVA Congress ECG INTERPRETATION Adrian Boswood MA VetMB DVC DECVIM-CA(Cardiology) MRCVS The Royal Veterinary College, Hawkshead
Relax and Learn At the Farm 2012
 Relax and Learn At the Farm 2012 Session 2: 12 Lead ECG Fundamentals 101 Cynthia Webner DNP, RN, CCNS, CCRN-CMC, CHFN Though for Today Mastery is not something that strikes in an instant, like a thunderbolt,
a lecture series by SWESEMJR
 Arrhythmias Automaticity- the ability to depolarize spontaneously. Pacemakers: Sinoatrial node: 70 bpm AV-nodal area: 40 bpm His-Purkinje: 20-40 bpm it Mechanisms of arrhythmias 1. Increased automaticity
ECG Cases and Questions. Ashish Sadhu, MD, FHRS, FACC Electrophysiology/Cardiology
 ECG Cases and Questions Ashish Sadhu, MD, FHRS, FACC Electrophysiology/Cardiology 32 yo female Life Insurance Physical 56 yo male with chest pain Terminology Injury ST elevation Ischemia T wave inversion
ELECTROCARDIOGRAPHY (ECG)
") ELECTROCARDIOGRAPHY (ECG) The heart is a muscular organ, which pumps blood through the blood vessels of the circulatory system. Blood provides the body with oxygen and nutrients, as well as assists in
ELECTROCARDIOGRAPHY (ECG) The heart is a muscular organ, which pumps blood through the blood vessels of the circulatory system. Blood provides the body with oxygen and nutrients, as well as assists in
Left posterior hemiblock (LPH)/
/") ECG OF THE MONTH Left Postero-inferior Depolarization Delay Keywords Electrocardiography Intraventricular conduction delay, Inferoposterior hemiblock, Left posterior fascicular block, Left posterior hemiblock
ECG OF THE MONTH Left Postero-inferior Depolarization Delay Keywords Electrocardiography Intraventricular conduction delay, Inferoposterior hemiblock, Left posterior fascicular block, Left posterior hemiblock
also aid the clinician in recognizing both the obvious and subtle abnormalities that may help guide therapy.
 Karen Lieberman, MS, CRNP f the many diagnostic tools used to screen for and evaluate cardiac abnormalities, the 12-lead electrocardiogram (ECG) is among the most basic. This inexpensive and noninvasive
Lecture outline. Electrical properties of the heart. Automaticity. Excitability. Refractoriness. The ABCs of ECGs Back to Basics Part I
 Lecture outline The ABCs of ECGs Back to Basics Part I Meg Sleeper VMD, DACVIM (cardiology) University of Florida Veterinary School Electrical properties of the heart Action potentials Normal intracardiac
Module 1: Introduction to ECG & Normal ECG
 Module 1: Introduction to ECG & Normal ECG Importance of Correct anatomical positions Measurements & Morphologies ONLY accurate if Precise anatomical positions adhered to Standardised techniques are used
December 2018 Tracings
 Tracings Tracing 1 Tracing 4 Tracing 1 Answer Tracing 4 Answer Tracing 2 Tracing 5 Tracing 2 Answer Tracing 5 Answer Tracing 3 Tracing 6 Tracing 3 Answer Tracing 6 Answer Questions? Contact Dr. Nelson
Ronald J. Kanter, MD Director, Electrophysiology Miami Children s Hospital Professor Emeritus, Duke University Miami, Florida
 S306- Pediatric Electrocardiography: A Potpourri Ronald J. Kanter, MD Director, Electrophysiology Miami Children s Hospital Professor Emeritus, Duke University Miami, Florida Disclosure of Relevant Relationship
Skin supplied by T1-4 (medial upper arm and neck) T5-9- epigastrium Visceral afferents from skin and heart are the same dorsal root ganglio
 T5-9- epigastrium Visceral afferents from skin and heart are the same dorsal root ganglio") Cardio 2 ECG... 3 Cardiac Remodelling... 11 Valvular Diseases... 13 Hypertension... 18 Aortic Coarctation... 24 Erythropoiesis... 27 Haemostasis... 30 Anaemia... 36 Atherosclerosis... 44 Angina... 48 Myocardial
Cardio 2 ECG... 3 Cardiac Remodelling... 11 Valvular Diseases... 13 Hypertension... 18 Aortic Coarctation... 24 Erythropoiesis... 27 Haemostasis... 30 Anaemia... 36 Atherosclerosis... 44 Angina... 48 Myocardial
at least 4 8 hours per week
 ECG IN ATHLETS An athlete is defined as an individual who engages in regular exercise or training for sport or general fitness, typically with a premium on performance, and often engaged in individual