Introduction to Electrocardiography
|
|
|
- Anissa Nicholson
- 6 years ago
- Views:
Transcription
1 Introduction to Electrocardiography
2 Class Objectives: Introduction to ECG monitoring Discuss principles of interpretation Identify the components and measurements of the ECG ECG analysis
3 ECG Monitoring Recording of Electrical Activity Uses Bipolar or Unipolar leads The ECG DOES NOT provide a recording or evaluation of Mechanical Activity!!!
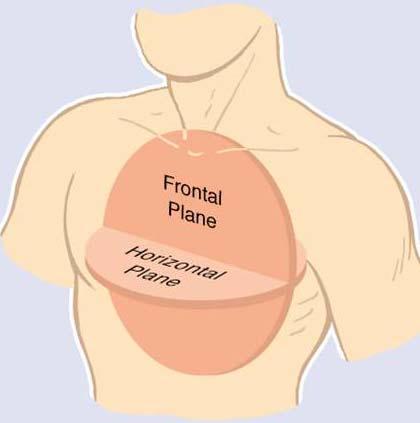
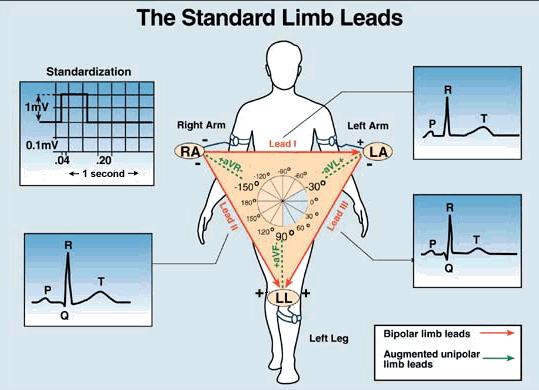
4 ECG Monitoring Bipolar Leads 1 positive and 1 negative electrode RA always negative LL always positive Traditional limb leads are examples of these Lead I Lead II Lead III Provide a view from a vertical plane
5 ECG Monitoring Unipolar Leads 1 positive electrode 1 negative reference point calculated by using summation of 2 negative leads Augmented Limb Leads avr, avf, avl vertical plane Precordial or Chest Leads V1-V6 V6 horizontal plane
6
7 ECG Monitoring Einthoven s Triangle Each lead looks from a different perspective Can determine the direction of electrical impulses Upright electrical recording indicates electricity flowing towards the positive (+) electrode positive deflection
8
9
10 Standardized Methods ECG Paper Device Paper Speed Most run at 25 mm/sec Device Calibration and Devices 10 mm (10 small boxes) = 1 millivolt Electrode Placement 3, 4, 12, 15, or 18 lead placement Remember, variations do exist! Check calibration and paper speed.

11 Standardized Methods & Devices ECG Graph Paper Vertical axis - voltage 1 small box = 1 mm = 0.1 mv Horizontal axis - time 1 small box = 1 mm = 0.04 sec. Every 5 lines (boxes) are bolded Horizontal axis - 1 and 3 sec marks
12 Horizontal boxes measure time in seconds. 1 small box=0.4 seconds, large box=5 small boxes=0.20 seconds Vertical boxes measure amplitude in milliamps. 1 small box=0.1 mv, large box=5 small boxes=0.5 mv.


13 1 mm = 0.1mv.04 sec..2 sec.
14 Standardized Methods ECG Paper Examples Vertical Axis No. of mm in 10 small boxes? No. of small boxes in 2 mm? Horizontal Axis and Devices No. of seconds in 5 small boxes? No. of small boxes in 0.2 second? No. of small boxes in 1 second?
15 Standardized Methods and Devices Electrode Placement Standardization improves accuracy of comparison ECGs 3 or 4 Lead and 12 Lead placement are most common Assure good conduction gel Prep the area, shave hair and remove oil from skin Avoid Bone Large muscle mass or hairy areas Limb vs. Chest placement

16 Electrode Placement RA and LA. Traditionally placed anywhere on the arm. Alternate placement to reduce muscle artifact is at the wrist or between the elbow and shoulder. RL and LL. Traditionally placed a few inches above the ankle. Alternate placement to reduce muscle artifact is on the upper leg, but below the umbilicus.
17 Electrode Placement V 1 4 th intercostal space at the right sternal border V 2 4 th intercostal space at the left sternal border V 3 Midway between V2 and V4 V 4 At the left mid-clavicular line in the 5 th intercostal space V 5 At the left anterior axillary line on the same horizontal level as V4 V 6 At the left mid-axillary line on the same horizontal level as V4 and V5.

18 Supplemental 15 and 18 Lead Electrode Placement

19 Calculating the Rate The 6 Second Method 6 sec seconds X 30 = 6 seconds Rate can be calculated by counting the number of QRS complexes in a 6 second strip and multiplying by 10.
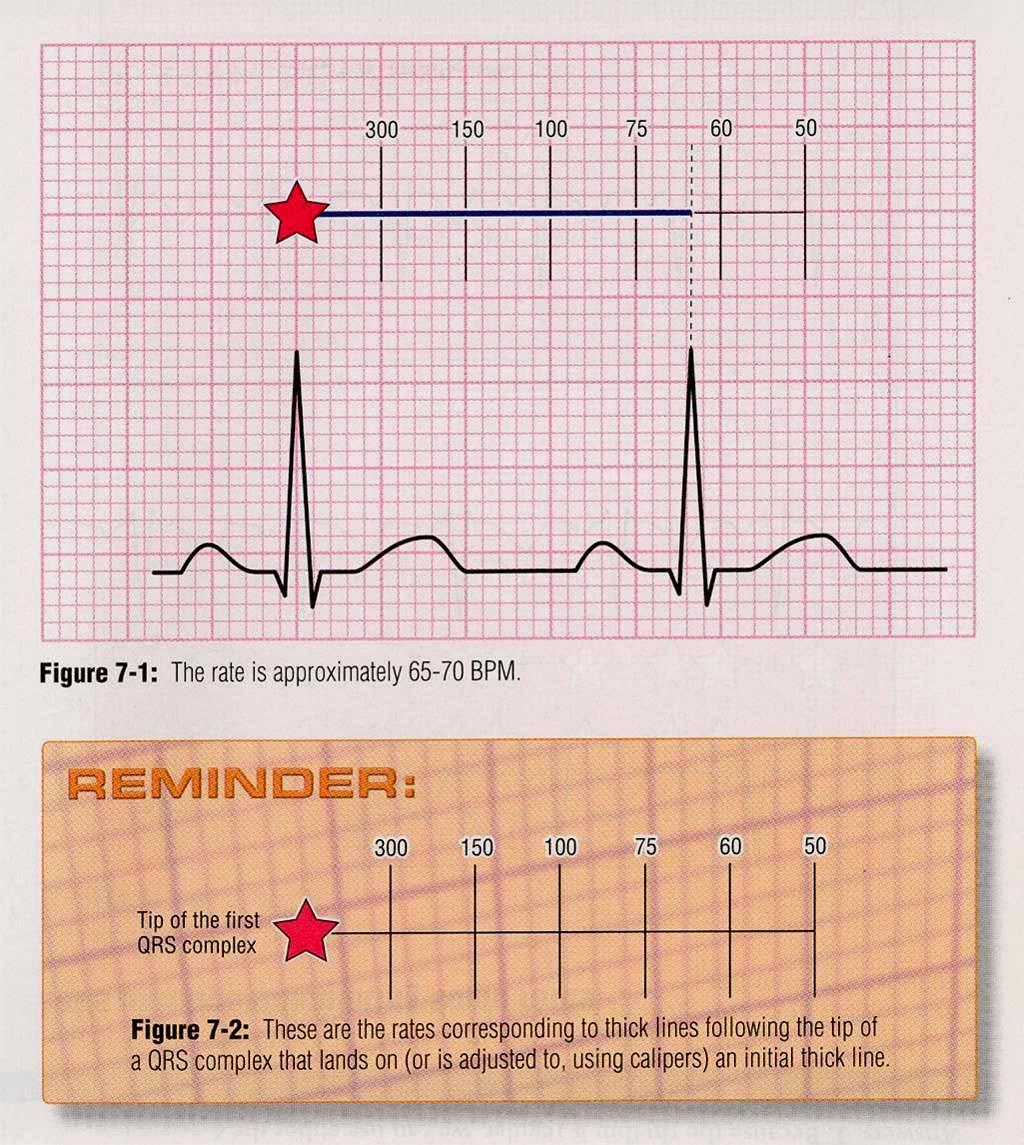
20 Another way to calculate rate is measuring the R R interval: 300 divided by number of big blocks between R R interval (must be a regular rhythm) i.e. 300/4 = 75
21 The triplicate method assigns a value to each large box and counts backward: 300, 150, 100, 75, 60, 50, etc. between R waves. To work, the rhythm must be regular.
22
23 ECG Components Components and Their Representation P, Q, R, S, T, U, and J Waves PR Interval QRS Interval ST Segment QT Segment
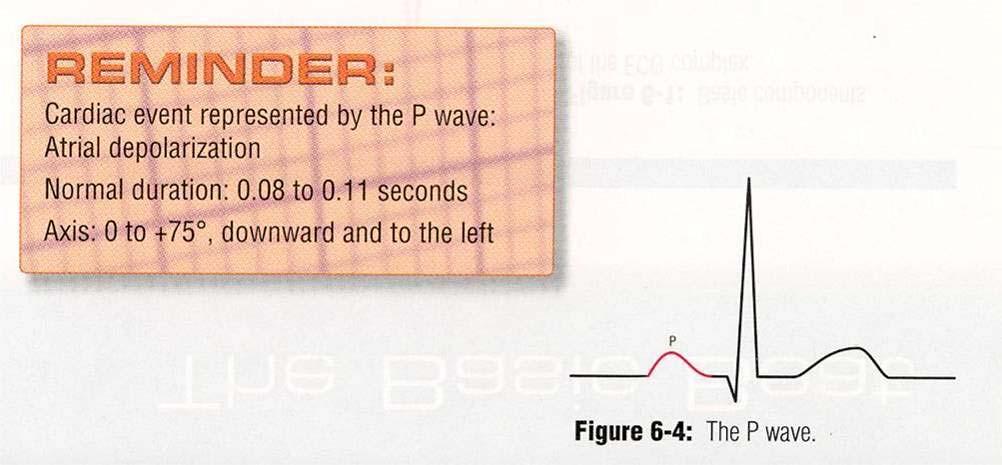
24 P Wave First upward deflection Represents atrial depolarization Usually 0.10 seconds or less Less than 2.5 mm in height Smooth, rounded, upright in Leads I, II, avf with normal axis Do they look the same? Usually followed by QRS complex
25

26 P Wave The normal P wave represents the sum of the depolarizations of the right and left atria. Because the sinoatrial node is located in the right atrium, right atrial depolarization begins slightly before left atrial depolarization. Therefore, the initial portion of the P wave primarily reflects right atrial depolarization, and the terminal portion of the P wave reflects left atrial depolarization. You would think that this should produce a notched P wave, but depolarization in both atria occurs so closely in time that the P wave usually has a smooth or blunted apex. Notched P waves can be seen with Sick Sinus Syndrome or conduction problems in the atria.
27 P Wave Abnormal P Waves changes from the normal P wave morphology may be due to hypertrophy, dilation, or altered electrical activation.
 with a vertical axis seen in II, III, AVF - associated with lung disease, pulmonary embolus, or other")
28 P Wave P Wave in Right Atrial Enlargement Tall, peaked P waves (> 2.5 millimeters high or 0.25 millivolts amplitude) with a vertical axis seen in II, III, AVF - associated with lung disease, pulmonary embolus, or other causes of pulmonary hypertension. P-pulmonale
 with a negative component in V1 or V2 (that exceeds one millimeter by one millimeter, - associated with mitral regurgitation, congestive heart failure")
29 P Wave P Wave in Left Atrial Enlargement P-mitrale: : broad, notched P waves in II and AVF (>( 2.5 millimeters wide or 100 milliseconds duration) with a negative component in V1 or V2 (that exceeds one millimeter by one millimeter, - associated with mitral regurgitation, congestive heart failure or any clinical condition that elevates LV filling pressure. It can even be transient with the occurrence of CHF.
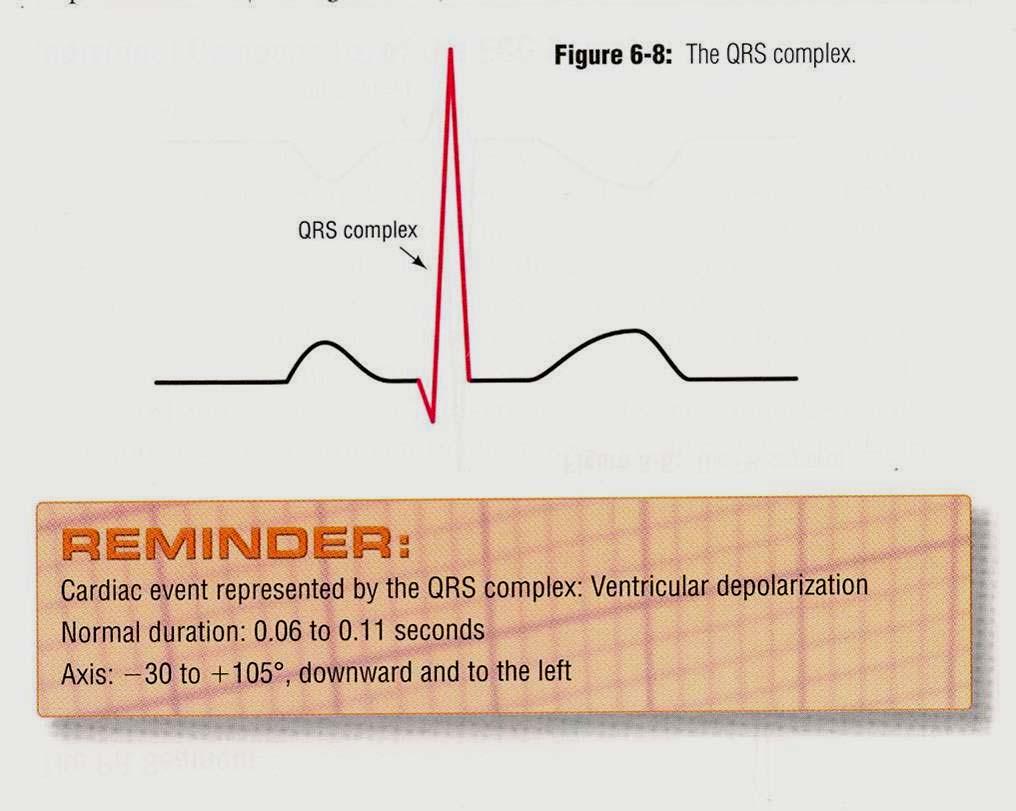
30 QRS Complex Composition of 2 or more waves Q, R, and S represents ventricular depolarization much variability Duration usually < 0.12 sec sec is considered normal for a supraventricular rhythm sec with hemiblock (look at leads Ifor axis deviation) >0.12 sec with bundle branch block or a ventricular rhythm
31
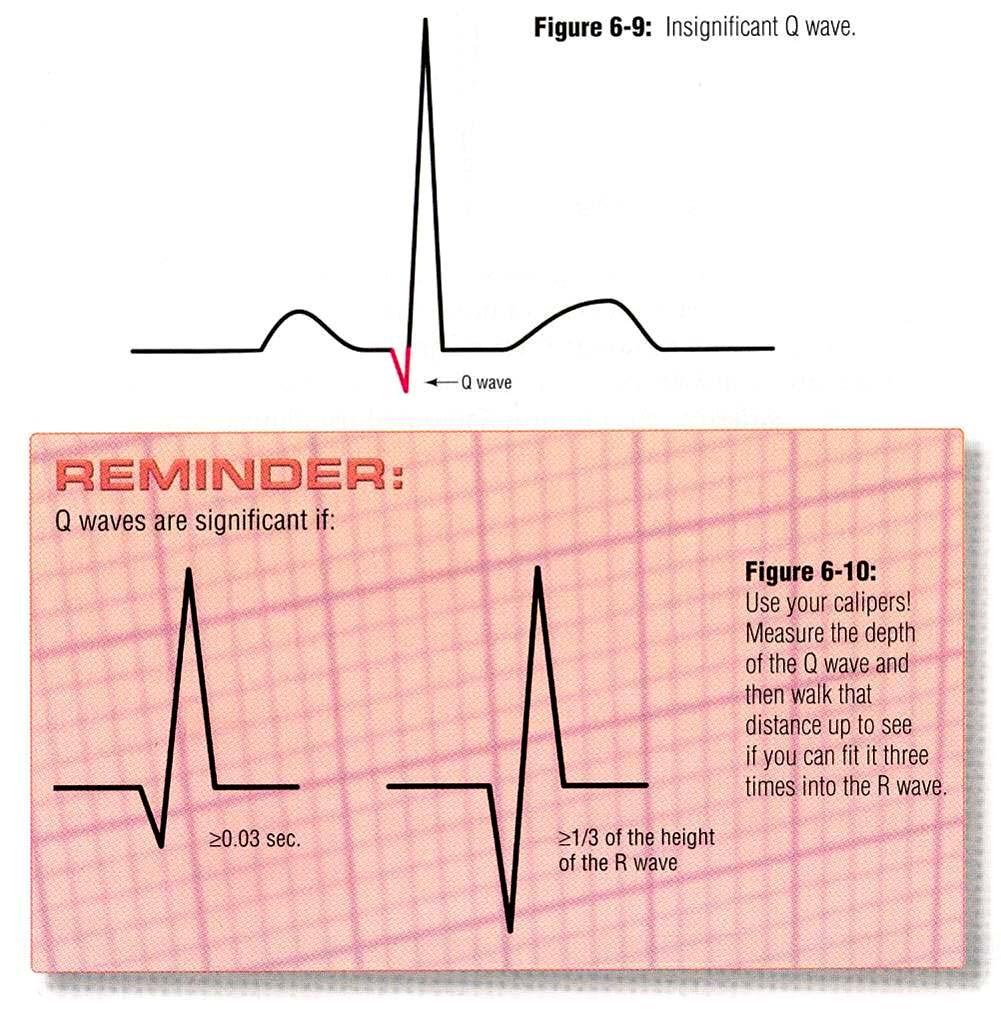
32 Q Wave First negative deflection after P wave Depolarization of septum May by physiologic or pathologic Not always seen May be seen with idiopathic hypertrophic subaortic stenosis (IHSS) If seen, will be in conjunction with LVH
33 Q Wave Pathologic or Physiologic Q Wave Considered pathologic if: Greater than 0.04 sec or 1 small box Greater in depth than 1/3 the height of the QRS Form in leads where septal depolarization should be positive Develop where there is permanent, complete occlusion of a coronary artery with resultant transmural infarct of the myocardium
34
35 Q Wave
36 R Wave First positive deflection following P or Q waves Subsequent positive deflections are R, R, R etc
37
38 S Wave Negative deflection following R wave Subsequent negative deflections are S, S, S etc May be part of QS complex absent R wave in aberrant conduction
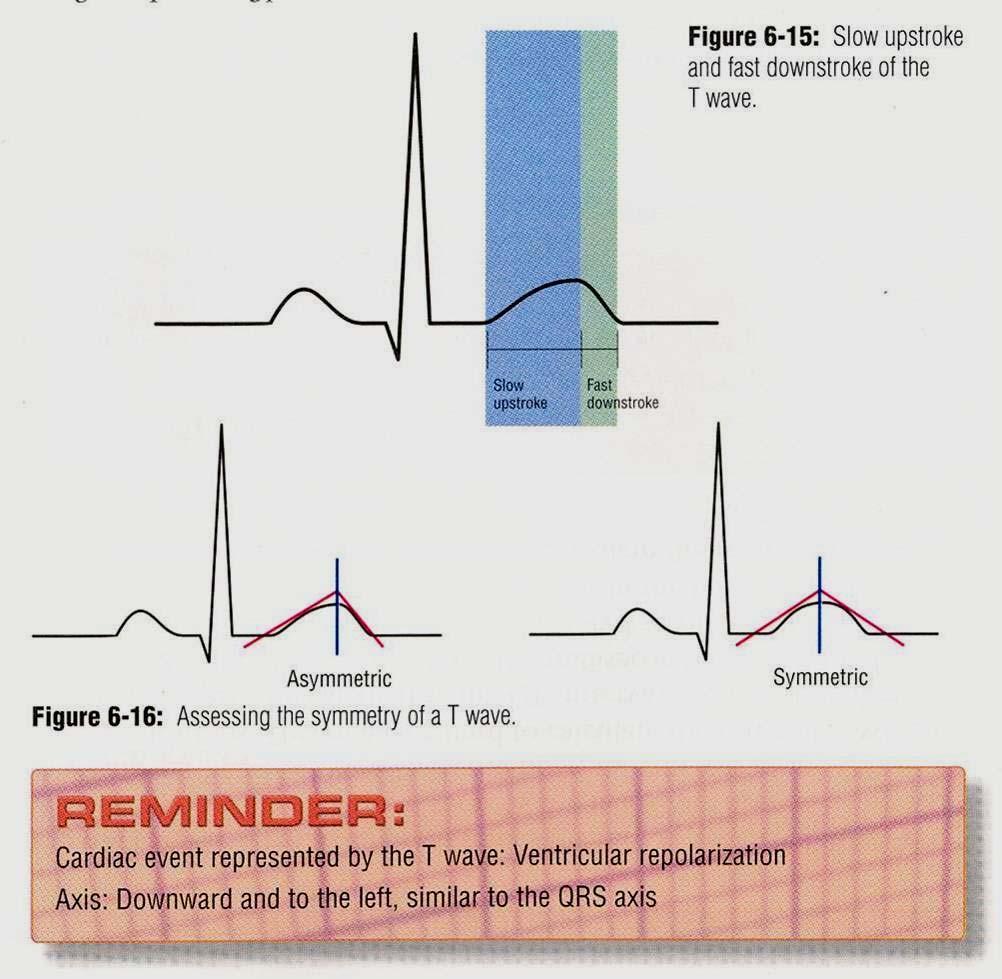
39 ECG Components T Wave repolarization of ventricles concurrent with end of ventricular systole Should be upright in most leads Upslope is normally longer than downslope (ratio is 2/3 1/3). Inverted T waves with equal downslope considered abnormal. Called arrowhead Ts, usually indicates ischemia Tall, peaked, narrow T waves can indicate hyperkalemia or early ischemia
40
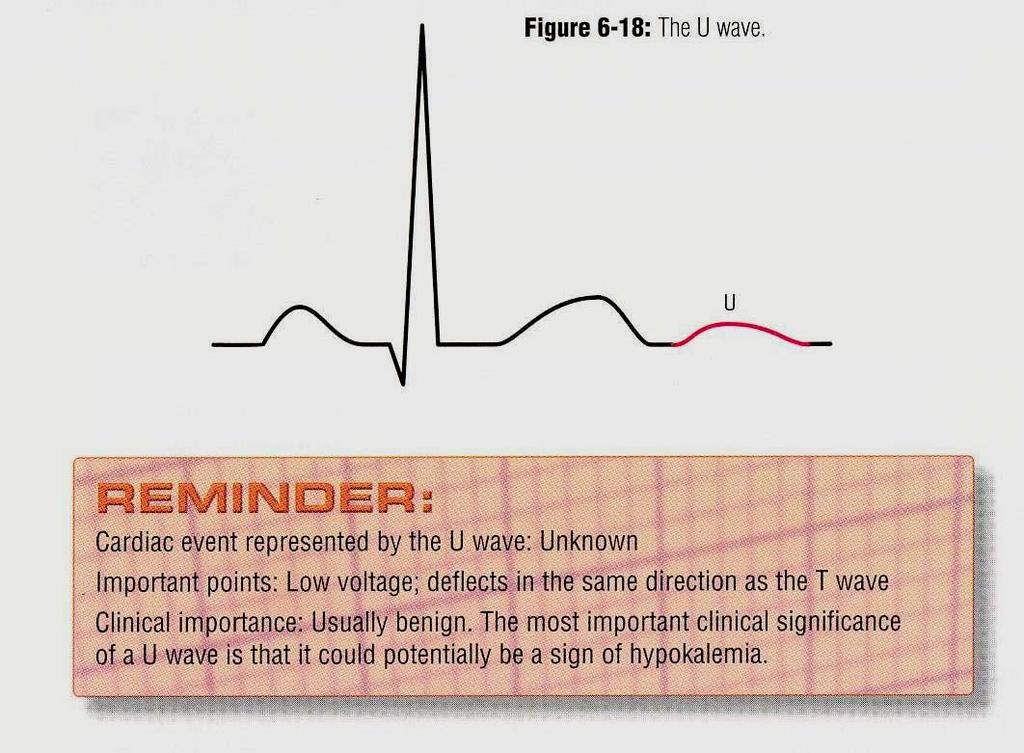
41 ECG Components U Wave Etiology is uncertain Believed to be associated with electrolyte imbalances and the over repolarization of the ventricle due to the sudden burst of K + into the cell by the Na + /K + pump. Normal and expected finding in children May form with hypokalemia May form as part of the digitalis effect May be seen with myocardial injury or infarction
42
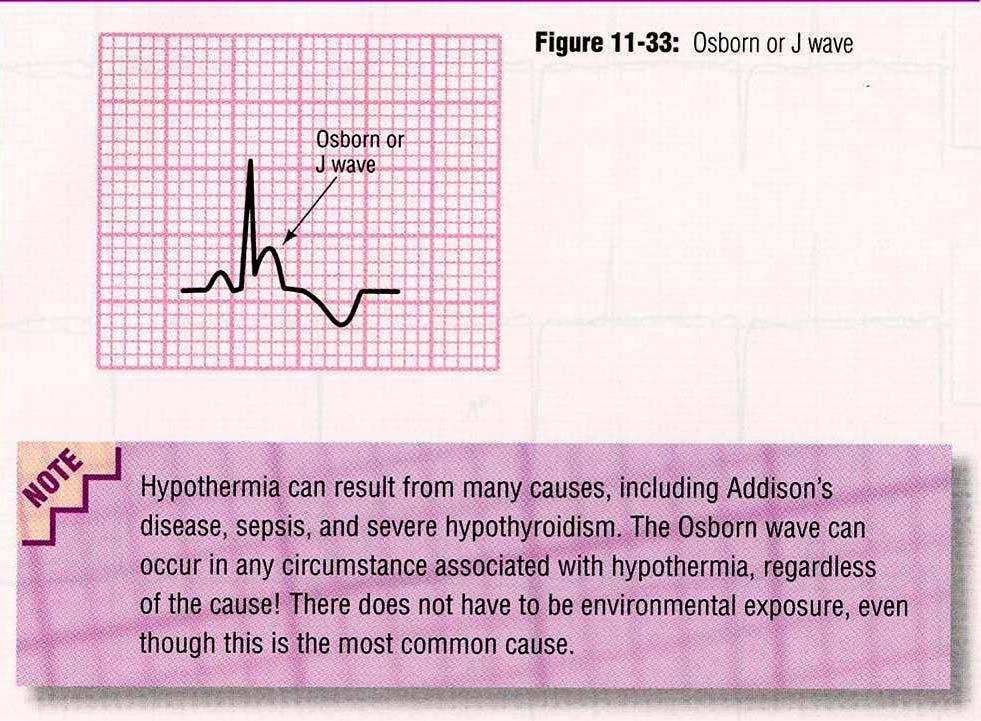
43 Osborn (J) wave ECG Components Occurs in cases of severe hypothermia due to: Environmental exposure Addison s s disease Sepsis Hypothyroidism
44

45 ECG Segments QT Segment ST Seg. Q PRI s R S <.12 s
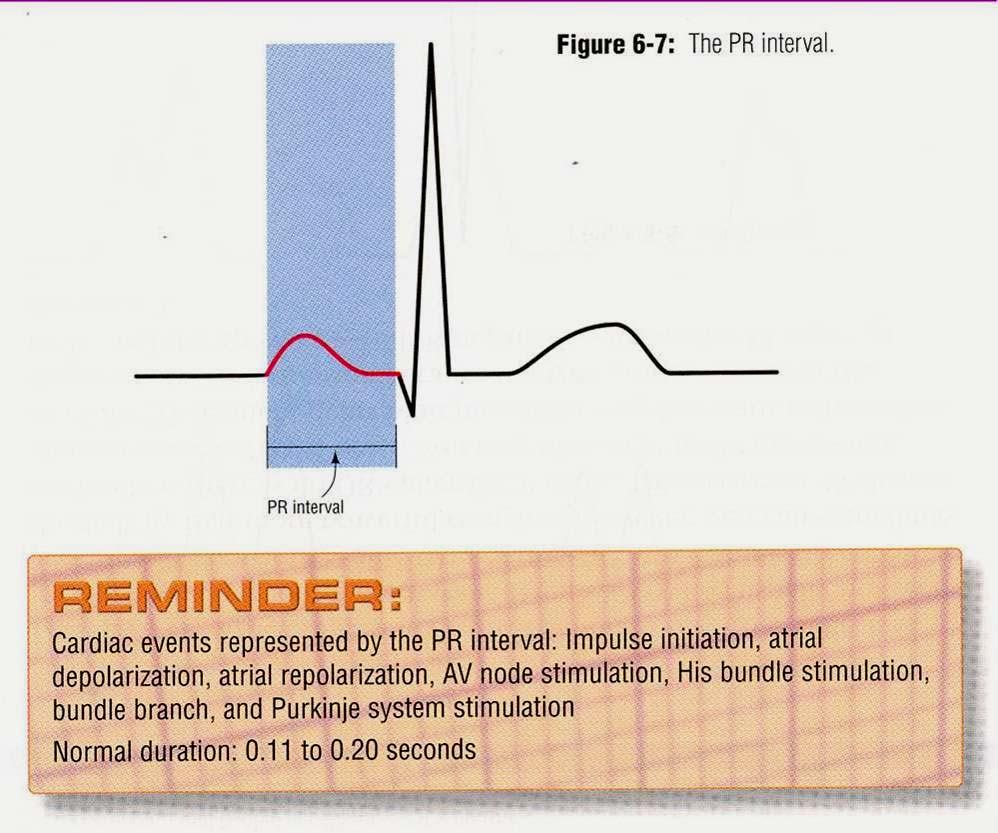
46 PR Interval Time impulse takes to move through atria and AV node From beginning of P wave to next deflection on baseline (beginning of QRS complex) Normally sec May be shorter with faster rates
47
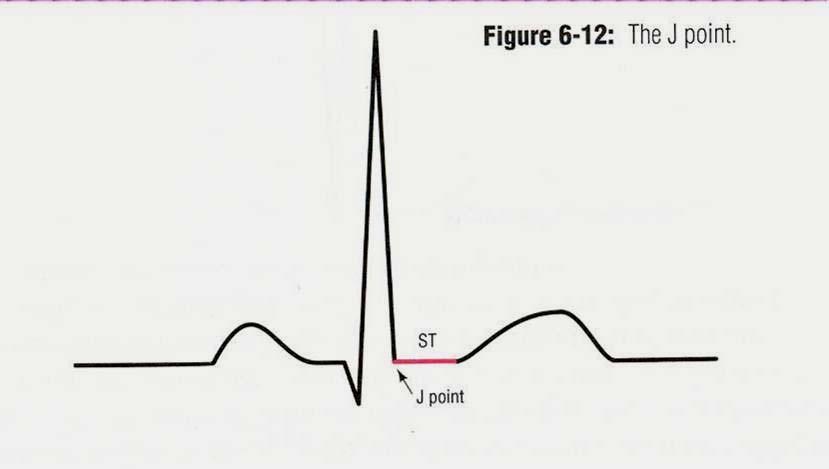
48 J Point Point where QRS complex returns to isoelectric line Beginning of ST segment Critical in measuring ST segment elevation
49
50 S-T T Segment Early repolarization of ventricles Measured from J point to onset of T wave Elevation or depression may indicate abnormality Elevation indicates an injury pattern Depression indicates ischemia Sagging or cupping may be due to medications like digitalis

51 S-T T Segment Locate the J point, then look for S-T segment elevation or depression
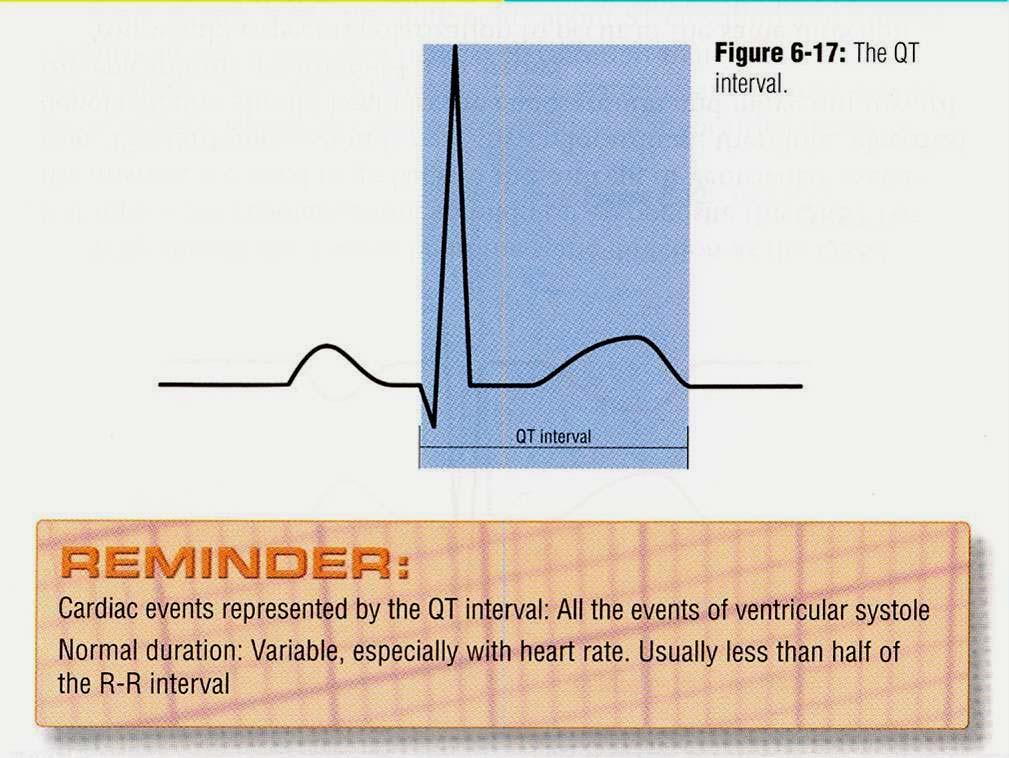
52 Q-T T Interval (QTc( QTc) Represents all events of ventricular systole Prolonged QT intervals may lead to arrythmias including Torsades de Pointes Should be shorter than ½ of the preceding R-R R interval Normal values are between 0.30 and 0.44 seconds c stands for corrected for heart rate.
53
54 Q-T T Interval (QTc( QTc) Causes of a prolonged Q-T Q T interval: Genetics. Some people are predisposed. Hypothyroidism Phenothiazines Tricyclic Antidepressants Class 1A Antiarrhythmics like Amiodarone Electrolyte imbalance; hypokalemia, hypocalcemia,, or hypomagnesemia Stroke, seizures, intracerebral or brainstem bleeds
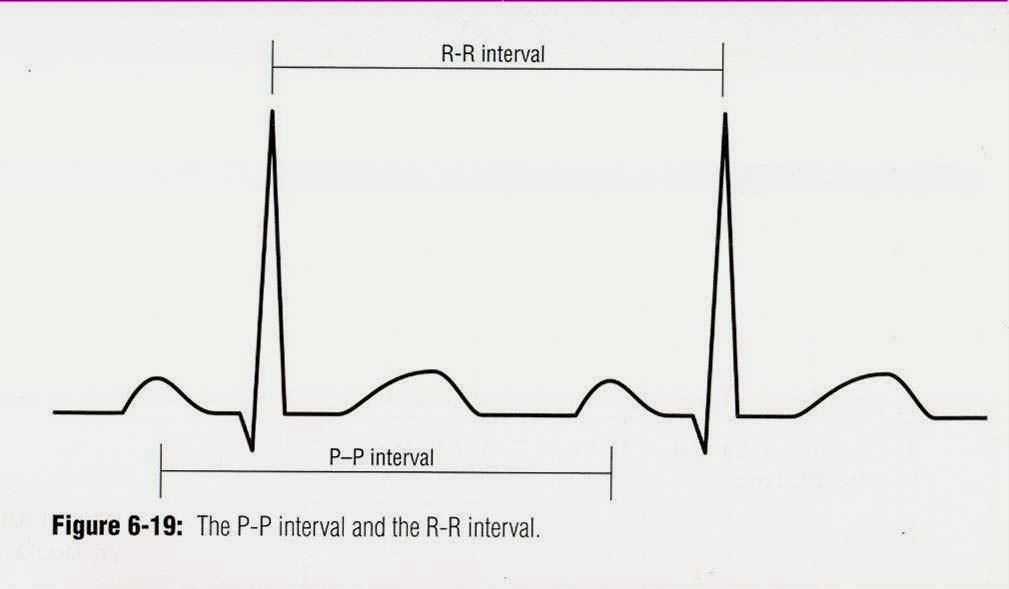
55 R-R R Interval Used to measure the distance between identical points Regular rhythms are those with consistent R-R R intervals
56
57 ECG Interpretation
58 Rate Rhythm/Regularity ECG Interpretation Regular Regularly irregular Irregularly irregular QRS Complex, look at duration, configuration, and relationship to P waves P Waves, presence or absense,, configuration, relationship to QRS. (Is there a P wave for every QRS and a QRS for every P wave?) Relationships, intervals, and measurements
59 ECG Interpretation Ventricular Rate Triplicate method R-R R method divide 300 by # of large squares between consecutive R waves 6 Second method multiply # of R waves in a 6 second strip by 10 Rate meter may be unreliable!!!
60 Rhythm Measure R-R R R intervals across strip Should find regular distance between R waves Classification Regular Irregular ECG Interpretation Regularly irregular Irregularly irregular
61 QRS Complex Narrow < 0.12 seconds (3 small boxes) is normal indicates supraventricular origin (AV node or above) as location of the pacemaker with normal conduction of the impulse seconds, look for axis deviation and the possibility of a hemiblock. Wide ECG Interpretation > 0.12 seconds is wide indicates ventricular, paced ventricular, or supraventricular with aberrant conduction or a conduction defect, i.e. Bundle Branch Block.
62 P Waves ECG Interpretation Present? Do they all look alike? Regular interval Upright or inverted in Lead II? Upright = atria depolarized from top to bottom Inverted = atria depolarized from bottom to top
63 ECG Interpretation Relationships/Measurements PR Interval Is it constant? Less than 0.20 seconds P to QRS Relationship P wave before, during or after QRS? 1 P wave for each 1 QRS? Regular relationship?
64 ECG Interpretation A monitoring lead can tell you: How often the myocardium is depolarizing How regular the depolarization is How long conduction takes in various areas of the heart The origin of the impulses that are depolarizing the myocardium
65 ECG Interpretation A monitoring lead cannot tell you: Presence or absence of a myocardial infarction Axis deviation Chamber enlargement Right vs. Left bundle branch blocks Quality of pumping action If the heart is contracting!!!
66 ECG Interpretation An ECG is a diagnostic tool, NOT a treatment No one was ever cured by an ECG! Treat the PATIENT not the Monitor!!!
67 ECG Interpretation In the following sections we will look at Sinus Rhythms Atrial, Junctional,, and Supraventricular Rhythms Ventricular Rhythms AV Blocks and Paced Rhythms The 12-Lead ECG

68 Questions?
INTRODUCTION TO ECG. Dr. Tamara Alqudah
 INTRODUCTION TO ECG Dr. Tamara Alqudah Excitatory & conductive system of the heart + - The ECG The electrocardiogram, or ECG, is a simple & noninvasive diagnostic test which records the electrical
5- The normal electrocardiogram (ECG)
") 5- The (ECG) Introduction Electrocardiography is a process of recording electrical activities of heart muscle at skin surface. The electrical current spreads into the tissues surrounding the heart, a small
5- The (ECG) Introduction Electrocardiography is a process of recording electrical activities of heart muscle at skin surface. The electrical current spreads into the tissues surrounding the heart, a small
Electrocardiogram ECG. Hilal Al Saffar FRCP FACC College of medicine,baghdad University
 Electrocardiogram ECG Hilal Al Saffar FRCP FACC College of medicine,baghdad University Tuesday 29 October 2013 ECG introduction Wednesday 30 October 2013 Abnormal ECG ( ischemia, chamber hypertrophy, heart
ECG. Prepared by: Dr.Fatima Daoud Reference: Guyton and Hall Textbook of Medical Physiology,12 th edition Chapters: 11,12,13
 ECG Prepared by: Dr.Fatima Daoud Reference: Guyton and Hall Textbook of Medical Physiology,12 th edition Chapters: 11,12,13 The Concept When the cardiac impulse passes through the heart, electrical current
12 Lead ECG Skills: Building Confidence for Clinical Practice. Presented By: Cynthia Webner, BSN, RN, CCRN-CMC. Karen Marzlin, BSN, RN,CCRN-CMC
 12 Lead ECG Skills: Building Confidence for Clinical Practice NTI 2009 Preconference Session 803 Presented By: Karen Marzlin, BSN, RN,CCRN-CMC 1 12 Lead ECG Fundamentals: The Starting Place for Linking
Relax and Learn At the Farm 2012
 Relax and Learn At the Farm 2012 Session 2: 12 Lead ECG Fundamentals 101 Cynthia Webner DNP, RN, CCNS, CCRN-CMC, CHFN Though for Today Mastery is not something that strikes in an instant, like a thunderbolt,
Ekg pra pr c a tice D.HAMMOUDI.MD
 Ekg practice D.HAMMOUDI.MD Anatomy Revisited RCA (Right Coronary Artery) Right ventricle Inferior wall of LV Posterior wall of LV (75%) SA Node (60%) AV Node (>80%) LCA (Left Coronary Artery) Septal wall
Electrocardiography Abnormalities (Arrhythmias) 7. Faisal I. Mohammed, MD, PhD
 7. Faisal I. Mohammed, MD, PhD") Electrocardiography Abnormalities (Arrhythmias) 7 Faisal I. Mohammed, MD, PhD 1 Causes of Cardiac Arrythmias Abnormal rhythmicity of the pacemaker Shift of pacemaker from sinus node Blocks at different
Electrocardiography Abnormalities (Arrhythmias) 7 Faisal I. Mohammed, MD, PhD 1 Causes of Cardiac Arrythmias Abnormal rhythmicity of the pacemaker Shift of pacemaker from sinus node Blocks at different
ECG INTERPRETATION MANUAL
 Lancashire & South Cumbria Cardiac Network ECG INTERPRETATION MANUAL THE NORMAL ECG Lancashire And South Cumbria Cardiac Physiologist Training Manual THE NORMAL ECG E.C.G CHECKLIST 1) Name, Paper Speed,
CORONARY ARTERIES HEART
 CARDIAC/ECG MODULE THE HEART CORONARY ARTERIES FIBRILLATING HEART CORONARY ARTERIES HEART PRACTICE RHYTHMS PRACTICE RHYTHMS ELECTRICAL CONDUCTION SA Node (60 100) Primary pacemaker AV Node (40 60) ***Creates
ECG (MCQs) In the fundamental rules of the ECG all the following are right EXCEP:
 In the fundamental rules of the ECG all the following are right EXCEP:") ECG (MCQs) 2010 1- In the fundamental rules of the ECG all the following are right EXCEP: a- It is a biphasic record of myocardial action potential fluctuations. b- Deflection record occurs only during
ECG (MCQs) 2010 1- In the fundamental rules of the ECG all the following are right EXCEP: a- It is a biphasic record of myocardial action potential fluctuations. b- Deflection record occurs only during
By the end of this lecture, you will be able to: Understand the 12 lead ECG in relation to the coronary circulation and myocardium Perform an ECG
 By the end of this lecture, you will be able to: Understand the 12 lead ECG in relation to the coronary circulation and myocardium Perform an ECG recording Identify the ECG changes that occur in the presence
ECG CONVENTIONS AND INTERVALS
 1 ECG Waveforms and Intervals ECG waveforms labeled alphabetically P wave== represents atrial depolarization QRS complex=ventricular depolarization ST-T-U complex (ST segment, T wave, and U wave)== V repolarization.
The Electrocardiogram part II. Dr. Adelina Vlad, MD PhD
 The Electrocardiogram part II Dr. Adelina Vlad, MD PhD Basic Interpretation of the ECG 1) Evaluate calibration 2) Calculate rate 3) Determine rhythm 4) Determine QRS axis 5) Measure intervals 6) Analyze
ECG ABNORMALITIES D R. T AM A R A AL Q U D AH
 ECG ABNORMALITIES D R. T AM A R A AL Q U D AH When we interpret an ECG we compare it instantaneously with the normal ECG and normal variants stored in our memory; these memories are stored visually in
EKG. Danil Hammoudi.MD
 EKG Danil Hammoudi.MD What is an EKG? The electrocardiogram (EKG) is a representation of the electrical events of the cardiac cycle. Each event has a distinctive waveform, the study of which can lead to
This presentation will deal with the basics of ECG description as well as the physiological basics of
 Snímka 1 Electrocardiography basics This presentation will deal with the basics of ECG description as well as the physiological basics of Snímka 2 Lecture overview 1. Cardiac conduction system functional
3/26/15 HTEC 91. EKG Sign-in Book. The Cardiac Cycle. Parts of the ECG. Waves. Waves. Review of protocol Review of placement of chest leads (V1, V2)
") EKG Sign-in Book HTEC 91 Review of protocol Review of placement of chest leads (V1, V2) Medical Office Diagnostic Tests Week 2 http://www.cvphysiology.com/arrhythmias/a013c.htm The Cardiac Cycle Represents
EKG Sign-in Book HTEC 91 Review of protocol Review of placement of chest leads (V1, V2) Medical Office Diagnostic Tests Week 2 http://www.cvphysiology.com/arrhythmias/a013c.htm The Cardiac Cycle Represents
ECG Interpretation Cat Williams, DVM DACVIM (Cardiology)
") ECG Interpretation Cat Williams, DVM DACVIM (Cardiology) Providing the best quality care and service for the patient, the client, and the referring veterinarian. GOAL: Reduce Anxiety about ECGs Back to
ECG Interpretation Cat Williams, DVM DACVIM (Cardiology) Providing the best quality care and service for the patient, the client, and the referring veterinarian. GOAL: Reduce Anxiety about ECGs Back to
Introduction to ECG Gary Martin, M.D.
 Brief review of basic concepts Introduction to ECG Gary Martin, M.D. The electrical activity of the heart is caused by a sequence of rapid ionic movements across cell membranes resulting first in depolarization
Electrocardiography Normal 5. Faisal I. Mohammed, MD, PhD
 Electrocardiography Normal 5 Faisal I. Mohammed, MD, PhD 1 Objectives 2 1. Describe the different waves in a normal electrocardiogram. 2. Recall the normal P-R and Q-T interval time of the QRS wave. 3.
Family Medicine for English language students of Medical University of Lodz ECG. Jakub Dorożyński
 Family Medicine for English language students of Medical University of Lodz ECG Jakub Dorożyński Parts of an ECG The standard ECG has 12 leads: six of them are considered limb leads because they are placed
12-Lead ECG Interpretation. Kathy Kuznar, RN, ANP
 12-Lead ECG Interpretation Kathy Kuznar, RN, ANP The 12-Lead ECG Objectives Identify the normal morphology and features of the 12- lead ECG. Perform systematic analysis of the 12-lead ECG. Recognize abnormalities
UNDERSTANDING YOUR ECG: A REVIEW
 UNDERSTANDING YOUR ECG: A REVIEW Health professionals use the electrocardiograph (ECG) rhythm strip to systematically analyse the cardiac rhythm. Before the systematic process of ECG analysis is described
DR QAZI IMTIAZ RASOOL OBJECTIVES
 PRACTICAL ELECTROCARDIOGRAPHY DR QAZI IMTIAZ RASOOL OBJECTIVES Recording of electrical events in heart Established electrode pattern results in specific tracing pattern Health of heart i. e. Anatomical
Please check your answers with correct statements in answer pages after the ECG cases.
 ECG Cases ECG Case 1 Springer International Publishing AG, part of Springer Nature 2018 S. Okutucu, A. Oto, Interpreting ECGs in Clinical Practice, In Clinical Practice, https://doi.org/10.1007/978-3-319-90557-0
12 LEAD EKG BASICS. By: Steven Jones, NREMT P CLEMC
 12 LEAD EKG BASICS By: Steven Jones, NREMT P CLEMC ECG Review Waves and Intervals P wave: the sequential activation (depolarization) of the right and left atria QRS complex: right and left ventricular
ELECTROCARDIOGRAPHY (ECG)
") ELECTROCARDIOGRAPHY (ECG) The heart is a muscular organ, which pumps blood through the blood vessels of the circulatory system. Blood provides the body with oxygen and nutrients, as well as assists in
ELECTROCARDIOGRAPHY (ECG) The heart is a muscular organ, which pumps blood through the blood vessels of the circulatory system. Blood provides the body with oxygen and nutrients, as well as assists in
also aid the clinician in recognizing both the obvious and subtle abnormalities that may help guide therapy.
 Karen Lieberman, MS, CRNP f the many diagnostic tools used to screen for and evaluate cardiac abnormalities, the 12-lead electrocardiogram (ECG) is among the most basic. This inexpensive and noninvasive
Understanding basics of EKG
 Understanding basics of EKG By Alula A.(R III) www.le.ac.uk Topic for discussion Understanding of cellular electrophysiology Basics Rate Rhythm Axis Intervals P wave QRS ST/T wave Abnormal EKGs Understanding
BASIC CONCEPT OF ECG
 BASIC CONCEPT OF ECG Electrocardiogram The electrocardiogram (ECG) is a recording of cardiac electrical activity. The electrical activity is readily detected by electrodes attached to the skin. After the
Atlantic Health System
 Atlantic Health System Morristown Medical Center Newton Medical Center Overlook Medical Center Basic Dysrhythmia Course Day 1 1 2 Chapter 1 Anatomy and Physiology Learning Objectives 1) Identify electrophysiology
12 Lead ECG. Presented by Rebecca Sevigny BSN, RN Professional Practice & Development Dept.
 12 Lead ECG Presented by Rebecca Sevigny BSN, RN Professional Practice & Development Dept. Two Main Coronary Arteries RCA LCA which branches into Left Anterior Descending Circumflex Artery Two Main Coronary
- why the T wave is deflected upwards although it's a repolarization wave?
 Cardiac Electrograph: - why the T wave is deflected upwards although it's a repolarization wave? After depolarization the ventricle contracts but since the heart is a volume conductor (3D not 2D), when
Electrocardiography for Healthcare Professionals. Chapter 14 Basic 12-Lead ECG Interpretation
 Electrocardiography for Healthcare Professionals Chapter 14 Basic 12-Lead ECG Interpretation 2012 The Companies, Inc. All rights reserved. Learning Outcomes 14.1 Discuss the anatomic views seen on a 12-lead
ECG WORKBOOK. Rohan Jayasinghe
 ECG WORKBOOK Rohan Jayasinghe Contents Preface vii Foreword viii Acknowledgements ix The author x Reviewers xi Section 1 Basics of the ECG 1 Section 2 ECG-based diagnosis: pathology by ECG 21 Section 3
Basic electrocardiography reading. R3 lee wei-chieh
 Basic electrocardiography reading R3 lee wei-chieh The Normal Conduction System Lead Placement avf Limb Leads Precordial Leads Interpretation Rate Rhythm Interval Axis Chamber abnormality QRST change What
If the P wave > 0.12 sec( 3 mm) usually in any lead. Notched P wave usually in lead I,aVl may be lead II Negative terminal portion of P wave in V1, 1
 usually in any lead. Notched P wave usually in lead I,aVl may be lead II Negative terminal portion of P wave in V1, 1") If the P wave > 0.12 sec( 3 mm) usually in any lead. Notched P wave usually in lead I,aVl may be lead II Negative terminal portion of P wave in V1, 1 mm depth and 3 mm width( most specific) Since Mitral
If the P wave > 0.12 sec( 3 mm) usually in any lead. Notched P wave usually in lead I,aVl may be lead II Negative terminal portion of P wave in V1, 1 mm depth and 3 mm width( most specific) Since Mitral
BASIC PRINCIPLES OF ECG INTERPRETATION
 Chapter 1 BASIC PRINCIPLES OF ECG INTERPRETATION Cardiac rhythm analysis may be accomplished informally via cardiac monitoring and more diagnostically via a 12-lead electrocardiogram (ECG). An electrocardiogram
ECGs: Everything a finalist needs to know. Dr Amy Coulden As part of the Simply Finals series
 ECGs: Everything a finalist needs to know Dr Amy Coulden As part of the Simply Finals series Aims and objectives To be able to interpret basic ECG abnormalities To be able to recognise commonly tested
ECG Basics Sonia Samtani 7/2017 UCI Resident Lecture Series
 ECG Basics Sonia Samtani 7/2017 UCI Resident Lecture Series Agenda I. Introduction II.The Conduction System III.ECG Basics IV.Cardiac Emergencies V.Summary The Conduction System Lead Placement avf Precordial
ECG Interpretation Made Easy
 ECG Interpretation Made Easy Dr. A Tageldien Abdellah, MSc MD EBSC Lecturer of Cardiology- Hull University Hull York Medical School 2007-2008 ECG Interpretation Made Easy Synopsis Benefits Objectives Process
12 Lead EKG. The Basics
 12 Lead EKG The Basics Objectives Demonstrate proper 12 EKG lead placement Determine electrical axis Identify ST and T wave changes as they relate to myocardial ischemia Describe possible complications
ECG SIGNS OF HYPERTROPHY OF HEART ATRIUMS AND VENTRICLES
 Ministry of Health of Ukraine Kharkiv National Medical University ECG SIGNS OF HYPERTROPHY OF HEART ATRIUMS AND VENTRICLES Methodical instructions for students Рекомендовано Ученым советом ХНМУ Протокол
Lab Activity 24 EKG. Portland Community College BI 232
 Lab Activity 24 EKG Reference: Dubin, Dale. Rapid Interpretation of EKG s. 6 th edition. Tampa: Cover Publishing Company, 2000. Portland Community College BI 232 Graph Paper 1 second equals 25 little boxes
Birmingham Regional Emergency Medical Services System
 Birmingham Regional Emergency Medical Services System 2018 ALCTE Summer Conference EKG Basics Brian Gober, MAT, ATC, NRP, CSCS Education Services Manager ECC Training Center Coordinator Birmingham Regional
Electrical System Overview Electrocardiograms Action Potentials 12-Lead Positioning Values To Memorize Calculating Rates
 Electrocardiograms Electrical System Overview James Lamberg 2/ 74 Action Potentials 12-Lead Positioning 3/ 74 4/ 74 Values To Memorize Inherent Rates SA: 60 to 100 AV: 40 to 60 Ventricles: 20 to 40 Normal
12 LEAD EKG & CXR INTERPRETATION.
 12 LEAD EKG & CXR INTERPRETATION www.cherylherrmann.com cherrmann@frontier.com Audio Product Recording discount for participants $60 Nonparticipants = $190 o Get CEs and manual https://catalog.vyne.com
CARDIOVASCULAR PHYSIOLOGY ECG. Dr. Ana-Maria Zagrean
 CARDIOVASCULAR PHYSIOLOGY ECG Dr. Ana-Maria Zagrean Electrocardiogram (ECG) ECG is a non-invasive method to record at the body surface the electrical activity of the heart. - the rate and regularity of
Pennsylvania Academy of Family Physicians Foundation & UPMC 43rd Refresher Course in Family Medicine CME Conference March 10-13, 2016
 Pennsylvania Academy of Family Physicians Foundation & UPMC 43rd Refresher Course in Family Medicine CME Conference March 10-13, 2016 Disclosures: EKG Workshop Louis Mancano, MD Speaker has no disclosures
Electrocardiography negative zero LA/VL RA/VR LL/VF recording electrode exploring electrode Wilson right arm right arm, left arm left arm
 Electrocardiography In the previous lecture, we were talking about the unipolar limb leads. We said that to make the unipolar lead, you have to make the negative electrode as zero electrode, this is done
A Review of Cardiac Pathophysiology and EKG. Jamie Dyson PT, DPT Kathy Swanick PT, DPT, OCS
 A Review of Cardiac Pathophysiology and EKG Jamie Dyson PT, DPT Kathy Swanick PT, DPT, OCS Cardiac Pathophysiology Coronary Artery Disease Congestive Heart Failure Valvular Heart Disease Athletic Heart
ECG interpretation basics
 ECG interpretation basics Michał Walczewski, MD Krzysztof Ozierański, MD 21.03.18 Electrical conduction system of the heart Limb leads Precordial leads 21.03.18 Precordial leads Precordial leads 21.03.18
REtrive. REpeat. RElearn Design by. Test-Enhanced Learning based ECG practice E-book
 Test-Enhanced Learning Test-Enhanced Learning Test-Enhanced Learning Test-Enhanced Learning based ECG practice E-book REtrive REpeat RElearn Design by S I T T I N U N T H A N G J U I P E E R I Y A W A
CRC 431 ECG Basics. Bill Pruitt, MBA, RRT, CPFT, AE-C
 CRC 431 ECG Basics Bill Pruitt, MBA, RRT, CPFT, AE-C Resources White s 5 th ed. Ch 6 Electrocardiography Einthoven s Triangle Chest leads and limb leads Egan s 10 th ed. Ch 17 Interpreting the Electrocardiogram
ABCs of ECGs. Shelby L. Durler
 ABCs of ECGs Shelby L. Durler Objectives Review the A&P of the cardiac conduction system Placement and obtaining 4-lead and 12-lead ECGs Overview of the basics of ECG rhythm interpretation Intrinsic
12 Lead ECG Interpretation: Color Coding for MI s
 12 Lead ECG Interpretation: Color Coding for MI s Anna E. Story, RN, MS Director, Continuing Professional Education Critical Care Nurse Online Instructional Designer 2004 Anna Story 1 Objectives review
Determining Axis and Axis Deviation on an ECG
 Marquette University e-publications@marquette Physician Assistant Studies Faculty Research and Publications Health Sciences, College of 7-15-2010 Determining Axis and Axis Deviation on an ECG Patrick Loftis
Proceedings of the World Small Animal Veterinary Association Sydney, Australia 2007
 Proceedings of the World Small Animal Sydney, Australia 2007 Hosted by: Next WSAVA Congress ECG INTERPRETATION Adrian Boswood MA VetMB DVC DECVIM-CA(Cardiology) MRCVS The Royal Veterinary College, Hawkshead
ECG Practice Strips Discussion part 1:
 ECG Practice Strips Discussion part 1: The first 20 strips are for teaching various abnormalities of the morphology of the waves of the ECG. Strips 21 and following are for teaching some abnormalities
ELECTROCARDIOGRAPH. General. Heart Rate. Starship Children s Health Clinical Guideline
 General Heart Rate QRS Axis T Wave Axis PR Interval according to Heart Rate & Age P Wave Duration and Amplitude QRS Duration according to Age QT Interval R & S voltages according to Lead & Age R/S ratio
What the ECG is about
 What to expect from the ECG 00 The electricity of the heart 00 The shape of the ECG 00 The ECG electrical pictures 00 The shape of the QRS complex 00 Making a recording practical points 00 How to report
ECG Interpretation. Best to have a system to methodically evaluate ECG (from Dubin) * Rate * Rhythm * Axis * Intervals * Hypertrophy * Infarction
 * Rate * Rhythm * Axis * Intervals * Hypertrophy * Infarction") ECG to save Babies ECG Interpretation Best to have a system to methodically evaluate ECG (from Dubin) * Rate * Rhythm * Axis * Intervals * Hypertrophy * Infarction Electrical Activity in the heart 5 events
ECG to save Babies ECG Interpretation Best to have a system to methodically evaluate ECG (from Dubin) * Rate * Rhythm * Axis * Intervals * Hypertrophy * Infarction Electrical Activity in the heart 5 events
CASE 10. What would the ST segment of this ECG look like? On which leads would you see this ST segment change? What does the T wave represent?
 CASE 10 A 57-year-old man presents to the emergency center with complaints of chest pain with radiation to the left arm and jaw. He reports feeling anxious, diaphoretic, and short of breath. His past history
The Fundamentals of 12 Lead EKG. ECG Recording. J Point. Reviewing the Cardiac Conductive System. Dr. E. Joe Sasin, MD Rusty Powers, NRP
 The Fundamentals of 12 Lead EKG Dr. E. Joe Sasin, MD Rusty Powers, NRP SA Node Intranodal Pathways AV Junction AV Fibers Bundle of His Septum Bundle Branches Purkinje System Reviewing the Cardiac Conductive
Northwest Community Healthcare Paramedic Program Introduction to ECG INTERPRETATION
 Northwest Community Healthcare Paramedic Program Introduction to ECG INTERPRETATION Reading assignments: Aehlert Vol.1; pp. 752-765 OBJECTIVES: Upon completion of the assigned readings, class and homework
Skin supplied by T1-4 (medial upper arm and neck) T5-9- epigastrium Visceral afferents from skin and heart are the same dorsal root ganglio
 T5-9- epigastrium Visceral afferents from skin and heart are the same dorsal root ganglio") Cardio 2 ECG... 3 Cardiac Remodelling... 11 Valvular Diseases... 13 Hypertension... 18 Aortic Coarctation... 24 Erythropoiesis... 27 Haemostasis... 30 Anaemia... 36 Atherosclerosis... 44 Angina... 48 Myocardial
Cardio 2 ECG... 3 Cardiac Remodelling... 11 Valvular Diseases... 13 Hypertension... 18 Aortic Coarctation... 24 Erythropoiesis... 27 Haemostasis... 30 Anaemia... 36 Atherosclerosis... 44 Angina... 48 Myocardial
BEDSIDE ECG INTERPRETATION
 BEDSIDE ECG INTERPRETATION Presented by: Ryan Dean, RN, MSN, CCRN, CCNS, CFRN Flight Nurse 2017 Based on presentations originally by Gennifer DePaoli, RN Objectives Hospital policies Electrical conduction
An ECG Primer. I saw it, but I did not realize it.
 5 An ECG Primer Quick Look Cardiac Monitoring System - p. 72 ECG Paper - p. 81 Lead Polarity and Vectors - p. 85 Basic ECG Components - p. 87 Heart Rate and Pulse Rate - p. 99 Summary - p. 102 Chapter
The Normal Electrocardiogram
 C H A P T E R 1 1 The Normal Electrocardiogram When the cardiac impulse passes through the heart, electrical current also spreads from the heart into the adjacent tissues surrounding the heart. A small
Each student should record the ECG of one of the members of the lab group and have their own ECG recorded.
 EXPERIMENT 1 ELECTROCARDIOGRAPHY The purpose of this experiment is to introduce you to the techniques of electrocardiography and the interpretation of electrocardiograms. In Part A of the experiment, you
402 Index. B β-blockers, 4, 5 Bradyarrhythmias, 76 77
 Index A Acquired immunodeficiency syndrome (AIDS), 126, 163 Action potentials, 1, 5, 27 Acute coronary syndromes, 123t, 129 Adenosine, intravenous, 277 Alcohol abuse, as T wave inversion cause, 199 Aneurysm,
12 Lead ECG Interpretation: The Basics and Beyond
 12 Lead ECG Interpretation: The Basics and Beyond Cindy Weston, DNP, RN, CCRN, CNS-CC, FNP-BC Assistant Professor Texas A&M University College of Nursing cweston@tamhsc.edu Objectives Review the basics
Northwest Community EMS System October 2018 CE: ECG Review Credit Questions
 Northwest Community EMS System October 2018 CE: ECG Review Credit Questions Name: EMS Agency/hospital: EMSC/Educator reviewer: Date submitted: Credit awarded (date): Returned for revisions: Revisions received:
Interpreting Electrocardiograms (ECG) Physiology Name: Per:
 Physiology Name: Per:") Interpreting Electrocardiograms (ECG) Physiology Name: Per: Introduction The heart has its own system in place to create nerve impulses and does not actually require the brain to make it beat. This electrical
Interpreting Electrocardiograms (ECG) Physiology Name: Per: Introduction The heart has its own system in place to create nerve impulses and does not actually require the brain to make it beat. This electrical
Module 1: Introduction to ECG & Normal ECG
 Module 1: Introduction to ECG & Normal ECG Importance of Correct anatomical positions Measurements & Morphologies ONLY accurate if Precise anatomical positions adhered to Standardised techniques are used
SIMPLY ECGs. Dr William Dooley
 SIMPLY ECGs Dr William Dooley 1 No anatomy just interpretation 2 Setting up an ECG 3 Setting up an ECG 1 V1-4 th Right intercostal space at sternal border 2 V2-4 th Left intercostal space at sternal border
Chapter 4. Basic ECG Concepts and the Normal ECG. Brian Coyne, MEd, RCEP / Shel Levine, MS, CES
 Chapter 4 Basic ECG Concepts and the Normal ECG Brian Coyne, MEd, RCEP / Shel Levine, MS, CES Learning Objectives Upon completion of this chapter, the reader will be able to: 1. Identify standardized components
ELECTROCARDIOGRAPHY (III) THE ANALYSIS OF THE ELECTROCARDIOGRAM
 THE ANALYSIS OF THE ELECTROCARDIOGRAM") ELECTROCARDIOGRAPHY (III) THE ANALYSIS OF THE ELECTROCARDIOGRAM Scridon Alina, Șerban Răzvan Constantin Recording and analysis of the 12-lead ECG is part of the basic medical assessment performed for every
ELECTROCARDIOGRAPHY (III) THE ANALYSIS OF THE ELECTROCARDIOGRAM Scridon Alina, Șerban Răzvan Constantin Recording and analysis of the 12-lead ECG is part of the basic medical assessment performed for every
General Introduction to ECG. Reading Assignment (p2-16 in PDF Outline )
") General Introduction to ECG Reading Assignment (p2-16 in PDF Outline ) Objectives 1. Practice the 5-step Method 2. Differential Diagnosis: R & L axis deviation 3. Differential Diagnosis: Poor R-wave progression
General Introduction to ECG Reading Assignment (p2-16 in PDF Outline ) Objectives 1. Practice the 5-step Method 2. Differential Diagnosis: R & L axis deviation 3. Differential Diagnosis: Poor R-wave progression
Understanding the 12-lead ECG, part II
 Bundle-branch blocks Understanding the 12-lead ECG, part II Most common electrocardiogram (ECG) abnormality Appears as a wider than normal S complex Occurs when one of the two bundle branches can t conduct
Ask Mish. EKG INTERPRETATION part i
 EKG INTERPRETATION part i What is EKG? EKG or ECG= electrocardiogram(~graphy) means the recording of the heart electrical activity from Greek kardio= heart, graphein= to write cardiac cell physiology Cardiac
Chapter 2 Practical Approach
 Chapter 2 Practical Approach There are beginners in electrocardiogram (ECG) analysis who are fascinated by a special pattern (e.g., a bundle-branch block or a striking Q wave) and thereby overlook other
Appendix D Output Code and Interpretation of Analysis
 Appendix D Output Code and Interpretation of Analysis 8 Arrhythmia Code No. Description 8002 Marked rhythm irregularity 8110 Sinus rhythm 8102 Sinus arrhythmia 8108 Marked sinus arrhythmia 8120 Sinus tachycardia
SIMPLY ECGs. Dr William Dooley
 SIMPLY ECGs Dr William Dooley Content Basic ECG interpretation pattern Some common (examined) abnormalities Presenting ECGs in context Setting up an ECG Setting up an ECG 1 V1-4 th Right intercostal space
1 st Degree Block Prolonged P-R interval caused by first degree heart block (lead II)
") AV Heart Blocks 1 st degree A condition of a rhythm, not a true rhythm Need to always state underlying rhythm 2 nd degree Type I - Wenckebach Type II Classic dangerous to the patient Can be variable (periodic)
AV Heart Blocks 1 st degree A condition of a rhythm, not a true rhythm Need to always state underlying rhythm 2 nd degree Type I - Wenckebach Type II Classic dangerous to the patient Can be variable (periodic)
Diploma in Electrocardiography
 The Society for Cardiological Science and Technology Diploma in Electrocardiography The Society makes this award to candidates who can demonstrate the ability to accurately record a resting 12-lead electrocardiogram
Electrocardiography I Laboratory
 Introduction The body relies on the heart to circulate blood throughout the body. The heart is responsible for pumping oxygenated blood from the lungs out to the body through the arteries and also circulating
ELECTROCARDIOGRAPHY KEVIN REBECK PA-C. For more presentations
 ELECTROCARDIOGRAPHY KEVIN REBECK PA-C For more presentations www.medicalppt.blogspot.com Objectives ECG History Pathophysiology Basics Case Historys Electrical activation of the heart In the heart
Paediatric ECG Interpretation
 Paediatric ECG Interpretation Dr Sanj Fernando (thanks to http://lifeinthefastlane.com/ecg-library/paediatric-ecginterpretation/) 3 yo boy complaining of abdominal pain and chest pain Child ECG vs Adult
Section V. Objectives
 Section V Landscape of an MI Objectives At the conclusion of this presentation the participant will be able to Outline a systematic approach to 12 lead ECG interpretation Demonstrate the process for determining
12 Lead ECG Interpretation
 12 Lead ECG Interpretation Julie Zimmerman, MSN, RN, CNS, CCRN Significant increase in mortality for every 15 minutes of delay! N Engl J Med 2007;357:1631-1638 Who should get a 12-lead ECG? Also include
ECG Cases and Questions. Ashish Sadhu, MD, FHRS, FACC Electrophysiology/Cardiology
 ECG Cases and Questions Ashish Sadhu, MD, FHRS, FACC Electrophysiology/Cardiology 32 yo female Life Insurance Physical 56 yo male with chest pain Terminology Injury ST elevation Ischemia T wave inversion
ECG and Cardiac Electrophysiology
 ECG and Cardiac Electrophysiology Simon Some very basic electrophysiology Intracellular fluid: 10 mm Na, 140 mm K, etc. K Na-K ATPase Extracellular fluid: 140mM Na, 4mM K, etc. Na Ion gradient plus selective
2017 EKG Workshop Basic. Family Medicine Review Course Lou Mancano, MD, FAAFP Reading Health System Family and Community Medicine Reading, PA
 2017 EKG Workshop Basic Family Medicine Review Course Lou Mancano, MD, FAAFP Reading Health System Family and Community Medicine Reading, PA Part I - Objectives Discuss a systematic approach to EKG interpretation
BME 365 Website. Project Directions
 Lecture 17 EKG BME 365 Website Project Directions Heart rate Factors Affecting CO Parasympathetic activity decreases HR Sympathetic activity increases HR Stroke volume Depends on force generated by cardiac
ECG Interpretation. Introduction to Cardiac Telemetry. Michael Peters, RN, CCRN, CFRN CALSTAR Air Medical Services
 ECG Interpretation Introduction to Cardiac Telemetry Michael Peters, RN, CCRN, CFRN CALSTAR Air Medical Services Disclosures Nothing to disclose Objectives Describe the electrical conduction pathway in
Cardiac Telemetry Self Study: Part One Cardiovascular Review 2017 THINGS TO REMEMBER
 Please review the above anatomy of the heart. THINGS TO REMEMBER There are 3 electrolytes that affect cardiac function o Sodium, Potassium, and Calcium When any of these electrolytes are out of the normal
15 16 September Seminar W10O. ECG for General Practice
 15 16 September 2012 Seminar W10O ECG for General Practice Speaker: Ms Natasha Eaton ECG for General Practice Speaker: Natasha Eaton Cardiac CNC Executive Representative Electrocardiography The graphic
Chad Morsch B.S., ACSM CEP
 What Is Cardiac Stress Testing? Chad Morsch B.S., ACSM CEP A Cardiac Stress Test is a test used to measure the heart's ability to respond to external stress in a controlled clinical environment. Cardiac