12 Lead ECG Skills: Building Confidence for Clinical Practice. Presented By: Cynthia Webner, BSN, RN, CCRN-CMC. Karen Marzlin, BSN, RN,CCRN-CMC
|
|
|
- Claribel Bryan
- 5 years ago
- Views:
Transcription
1 12 Lead ECG Skills: Building Confidence for Clinical Practice NTI 2009 Preconference Session 803 Presented By: Karen Marzlin, BSN, RN,CCRN-CMC 1 12 Lead ECG Fundamentals: The Starting Place for Linking Knowledge to Practice 2
2 The journey of a thousand miles begins with one step. - Lao Tsu Framework for the Day Understand don t memorize Physiological basis Building blocks Start slow fly wheel effect 4

3 Electrical Conduction Pathway SA Node Right and left Atrial Conduction AV Node Bundle of His Right and Left Bundle Branches Fascicles Purkinge Fibers 5 Normal 12 Lead ECG STANDARD LIMB LEADS AUGMENTED LIMB LEADS CHEST OR PRECORDIAL LEADS 2 Chest Electrodes One Chest Electrode 6
4 Lead 1 avr V1 V4 Lead 2 avl V2 V5 Lead 3 avf V3 V6 7 Two Sets of Leads Limb Leads Standard Limb Leads (I, II, and III) Augmented Limb Leads (avr, avl, avf) Chest Leads Also called precordial leads V1 V6
5 Leads Two Electrodes on Patient One positive electrode One negative electrode Records difference in electrical potential between selected electrodes + - Leads I, II, and III One Electrode on Patient One positive electrode One reference point Zero electrical potential Center of heart Leads avr, avl, avf V1- V6 9 Importance of the Positive Electrode Reason 1 Consider the positive electrode the eye or the camera LA + RA RV LV


6 The Camera Looks at Different Parts of the Myocardium 11 Electrode Placement Limb Leads 12

7 The Ground Note: Nothing travels toward the right leg as a positive electrode. The right leg is the ground used to absorb any excess electrical activity. Standard Limb Leads Leads I, II, III 14
8 Standard Limb Leads Lead I - LEAD I + HIGH LATERAL WALL 15 Standard Limb Leads Lead II - LEAD II INFERIOR WALL + 16
9 Standard Limb Leads Lead III - LEAD III INFERIOR WALL + 17 Standard Limb Lead Leads I, II, III - LEAD I +/- LEAD II LEAD III + 18

10 Augmented Limb Leads Leads avr, avl, avf UNIPOLAR 19 Augmented Limb Leads avr avr + View of NOTHING related to LV 20
11 Augmented Limb Leads avl avl + High Lateral Wall 21 Augmented Limb Leads avf Inferior Wall avf + 22
12 Augmented Limb Leads Lead Placement: Leads avr, avl, avf avr + avl + + avf 23 Einthoven s Triangle Label Leads I, II, III Then add avr, avl, avf 24
 Leads")
13 AVR AVL AVF 25 Chest (Precordial) Leads 26
. ECG s27 made easy (2nd ed.). St. Louis, MO: Mosby, Inc. Pg. 197. Frontal vs.")
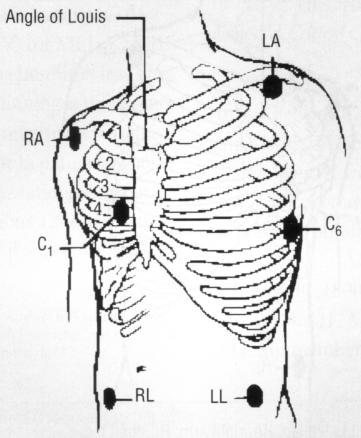
14 Electrode Placement Chest (Precordial) Leads Lead V 1 4 th ICS, RSB Lead V 2 4 th ICS, LSB Lead V 3 Midway Between V 2 & V 4 Lead V 4 L midclavicular line, 5 th ICS Lead V 5 L anterior axillary line, same level as V 4 Lead V 6 L midaxillary line, same level as V 4 Used with permission from: Aehlert. B (2002). ECG s27 made easy (2nd ed.). St. Louis, MO: Mosby, Inc. Pg Frontal vs. Horizontal Planes 28

15 A Closer Look at Chest Leads The Point of View of the Positive Electrode V1 Septum (RV) V2 Septum 29 A Closer Look at Chest Leads The Point of View of the Positive Electrode V3 Anterior V4 Anterior 30
16 A Closer Look at Chest Leads The Point of View of the Positive Electrode V5 Low Lateral V6 Low Lateral 31 Lead 1 Left Arm High Lateral Wall avr Right Arm V1 4 th ICS, RSB Septal Wall V4 L MCL, 5 th ICS Anterior Wall Lead 2 Left Leg Inferior Wall avl Left Arm High Lateral Wall V2 4 th ICS, LSB Septal Wall V5 L anterior axillary, same level as V 4 Low Lateral Wall Lead 3 Left Leg Inferior Wall avf Left Leg Inferior Wall V3 Midway Between V 2 & V 4 Anterior Wall V6 L midaxillary line, same level as V 4 Low Lateral Wall 32

17 Identifying Normal Complexes 33 ECG Paper Horizontal Axis Normal speed 25 mm/ sec Smallest box 1mm x 1mm 1 small box 0.04 sec 1 large box 0.20 sec 5 large boxes 1.0 sec


18 ECG Paper Vertical Axis Voltage or amplitude Measured in millivolts(mv) or millimeters (mm) EKG machine calibrated so that 1 mv produces a deflection measuring exactly 10 mm tall 1 small box = 1 mm high 1 large box = 5 mm high Measuring Rate on Irregular Rhythms Irregular rhythms Count number of R-R intervals in a 6 second strip and multiply by X 10 = 60 36

19 Measuring Rate on Regular Rhythms Regular rhythms Count number of large boxes between R waves and divide into 300: 1 = = 50 2 = = 43 3 = = 37 4 = 75 9 = 33 5 = = = Calculating Rate


20 Rate Ruler 4 big + 2 tiny = rate big boxes + 2 tiny boxes 39 ECG Waves and Intervals 40

21 P Waves P waves represent atrial depolarization and spread of electrical impulse through the atria First half of P represents depolarization from the SA node though the RA to the AV node Down slope of P wave represents stimulation of the LA 41 Normal P Wave Criteria Smooth and rounded No more than 2.5 mm in height No more than.11 seconds in duration 42
22 QRS Complex Not every QRS complex contains a Q wave, R wave and S wave!! Q always negative (below baseline) R first positive above the baseline R second positive above the baseline S negative deflection following R wave or second component to entirely complex S second negative deflection 43 Let s Practice QS qr QR Qr qrs R RS rs rsr Rs 44

23 In limb leads the ST segment is normally isoelectric but may be slightly elevated or depressed by less than 1mm ST Segment In precordial leads ST segment is elevation is normally not more than 1 to 2 mm ST Segment The J Point Junction where the QRS complex and the ST segment meet.
 to 10 mm (precordial) high 48")
24 T Waves Represents ventricular repolarization Slightly asymmetrical Usually oriented in the same direction as the previous QRS Not normally > than 5mm (limb leads) to 10 mm (precordial) high 48


25 The Importance of the Positive Electrode Reason 2 If a wave of depolarization moves TOWARD the + electrode, the waveform on the ECG graph will be upright or + 49 The Importance of the Positive Electrode Reason 2 If a wave of depolarization moves TOWARD the electrode, the waveform on the ECG graph will be downward or 50
26 The Importance of the Positive Electrode Reason 2 A biphasic wave form occurs when the direction of depolarization is PERPENDICULAR to the + electrode - + Heart avl 51 A Closer Look at Lead I Lead 1 Normals P waves: Upright and gently rounded QRS Complex: Upright T Waves: Upright and smaller than QRS 52
27 A Closer Look at Lead II Lead II normals P wave: upright and gently rounded QRS: upright T wave: upright and smaller than QRS 53 A Closer Look at Lead III Lead III normals P wave: upright and gently rounded QRS Complex: Upright T wave: Upright and smaller than QRS 54
28 A Closer Look at avr avr Normals P wave: inverted QRS: inverted (rsr or rs) T wave: inverted 55 A Closer Look at avl avl Normals P waves: Upright or inverted QRS: Upright or inverted T wave: Upright or inverted (but no down sloping of ST) 56
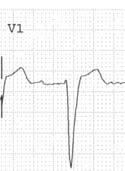
29 A Closer Look at avf avf Normals P waves: upright and gently rounded QRS: Upright T wave: Upright and smaller than QRS 57 Normal V1 A Closer Look at V1 P wave: inverted, upright or biphasic QRS: inverted with rs pattern T waves: inverted or upright 58

30 A Closer Look at V2 V2 Normals P waves: upright QRS: inverted; rs pattern T waves: upright, inverted 59 V3 Normals A Closer Look at V3 P wave: upright QRS: equiphasic; RS pattern T waves: Upright 60

31 V4 Normals A Closer Look at V4 P Wave: Upright QRS: Upright; qrs T wave: Upright 61 V5 Normals A Closer Look at V5 P wave: Upright QRS: upright; qrs pattern T wave: Upright 62

32 V6 Normals A Closer Look at V6 P wave: upright QRS: upright; qrs pattern T wave: upright 63 Normal V1-6: R Wave Progression The R wave becomes taller and the S wave becomes smaller as the electrode is moved from right to left This pattern is called R wave progression 64
33 Lead 1 Left Arm High Lateral Wall avr Right Arm V1 4 th ICS, RSB Septal Wall V4 L MCL, 5 th ICS Anterior Wall Lead 2 Left Leg Inferior Wall avl Left Arm High Lateral Wall V2 4 th ICS, LSB Septal Wall V5 L anterior axillary, same level as V 4 Low Lateral Wall Lead 3 Left Leg Inferior Wall avf Left Leg Inferior Wall V3 Midway Between V 2 & V 4 Anterior Wall V6 L midaxillary line, same level as V 4 Low Lateral Wall Lead ECG Evaluation 1. Atrial rate 2. Ventricular rate 3. Regular / Irregular 4. P wave for each QRS 5. Underlying rhythm 6. Are P waves abnormal in any lead? 7. Calculate P-R Interval is it constant or changing. 8. Is QRS width and shape normal in each lead? 9. If > 0.12 sec differentiate between RBBB and LBBB and ventricular ectopic focus by shape in V1 and V Are ST segments normal in all leads? If abnormal, is the pattern repeated in a contiguous lead. 11. Are T Waves normal in all leads? If abnormal, is the pattern repeated in a contiguous lead? 12. What is the length of the QT interval? 13. What is the Axis? 14. If there is a pacemaker is it pacing, capturing and sensing in the appropriate chambers?
34 67 68
35 Utilizing the Bedside Monitor to Provide 12 Lead ECG Information 69 Three Reasons for Bedside Cardiac Monitoring Arrhythmia Detection Ischemia Monitoring QT Interval Monitoring 70
36 Arrhythmia Monitoring Candidates Primary purpose for all patients on cardiac monitor Purpose Detection of and prompt intervention for life threatening arrhythmias Leads of Choice V1 V6 (or MCL6) 71 Ischemia (ST) Monitoring Candidates Patients admitted with Acute Coronary Syndrome Patients post PCI Patients admitted to Chest Pain Center or Chest Pain Center protocol Purpose To monitor changes in ST segments (compared to baseline) in select leads Leads of Choice Based on area of known or potential ischemia 72
37 QT Interval Monitoring Candidates Initiation of antiarrhythmic therapy with medications that prolong QT Other medications that prolong QT Other conditions that prolong QT Purpose To monitor for increase in QT interval to identify and intervene in patients at high risk for Torsades de Pointes Leads of Choice Lead where an accurate QT Interval can be measured Patient can be changed to another lead to run a strip to measure QT or 12 lead can be done if QT not easily measured in V1 or V6 73 Comparing Bedside Monitoring to the 12 Lead ECG Bedside Monitoring 12 Lead ECG Remember View of Positive Electrode (Camera) Importance of Lead Placement Identify Correct Lead on Rhythm Strip 74
38 Arrhythmia Monitoring When a patient has a wide complex tachycardia it is important to determine if the tachycardia is: Ventricular tachycardia Or SVT (including atrial arrhythmias) with a coexisting bundle branch block Since both rhythms are wide and fast it is often difficult to differentiate 75 Why V1 and V6 (MCL6) for Arrhythmia Monitoring V1 Looks different for ventricular tachycardia and bundle branch block Helps to determine if rhythm is ventricular tachycardia (VT) or SVT with a bundle branch block Position of V1 electrode 76

39 Bedside Cardiac Monitoring Limitations of Lead II V1 LBBB RBBB LVT RVT Five Lead - Lead Placement Standard 5 Lead Placement Modified 5 lead Placement- MCL6 78
40 3 Lead Placement for MCL1 79 ECG Fundamentals Calculating Cardiac Axis 80

41 Calculating the Electrical Axis of the Heart Determining the direction (depolarization) of the mean electrical impulse of the heart Down and to the left 81 More About Axis Axis is determined by the sum of all electrical activity As depolarization moves through the conduction pathway the direction is constantly changing; however the overall thrust of activity is in one direction Most of the electrical activity is directed towards the left ventricle due to the size of the myocardium required to eject blood The ventricle that requires the most of the depolarization activity is the ventricle which determines the direction of axis 82
42 Axis Wheel 83 Bipolar Frontal Plane Leads Lead I Left arm positive Right arm negative Lead II Left leg positive Right arm negative Lead III Left leg positive Left arm negative II I III 84
 positive AVR AVF AVL 85 AVR AVL I III II AVF")
43 Unipolar Frontal Plane Leads Reference point in center of chest telephoto lens avr Right arm positive avl Left arm positive avf Foot (left leg) positive AVR AVF AVL 85 AVR AVL I III II AVF 86
44 87 Understanding the Axis Wheel Remember: The positive and negative poles of the limb leads make up the axis wheel Negative Pole Positive Pole 88
45 A Closer Look at Your Axis Wheel Finding positive and negative poles of each lead VERSUS Reading degrees of axis 89 Axis Quadrants: Normal Axis 90
46 Causes: LV Hypertrophy Systemic Hypertension Hypertrophic Cardiomyopathy Aortic Valve Stenosis / Insufficiency Axis Quadrants: Left Axis Deviation 91 Causes: Ventricular Tachycardia Axis Quadrants: Extreme Axis Deviation 92
47 Causes: RV Hypertrophy Pulmonary Hypertension Pulmonic Valve Stenosis Chronic Lung Disease Axis Quadrants: Right Axis Deviation 93 94
48 95 96
49 97 Let Your Hands Determine Axis Use Lead I and avf Left hand represents QRS in Lead I Right hand represents QRS in avf Fingertips will point in the same direction as the QRS complex Handy Method of Axis Calculation developed by J. Cooper, PhD., American College of CV Nursing 98
50 Normal Axis: +0 to +90 Degrees Lead I: Upright QRS avf: Upright QRS It s always normal to be on the up and up 99 Right Axis Deviation: +90 to +180 Degrees Lead I: Downward QRS avf: Upward QRS Fingertips are facing each other, therefore, they are right together 100
51 Left Axis Deviation: 0 to 90 degrees Lead I: Upright QRS avf: Downward QRS Fingertips are facing opposite directions, therefore they are left apart 101 Extreme Axis: -90 to 180 Degrees Lead I: Downward QRS avf: Downward QRS Fingertips are both facing downward therefore the axis is down and out and your fingers need to run for help 102
52 Hands on Learning Axis Review 103 Axis Practice 104

53 Axis Practice 105 Axis Practice 106
54 Axis Practice 107 Calculating the Degree of Axis 108
55 Calculating Degree of Axis ESPN Method Step 1 E=Equiphasic (First determine quadrant) Find the QRS complex in the limb leads which is the most equiphasic OR Find the smallest QRS complex (height of R wave minus depth of S wave) 109 ESPN Method Step 2 S=Sister Lead Utilizing the Criss-Cross method Find the Sister lead to the lead with the most equiphasic QRS complex 110
56 ESPN Method Step 4 If positive locate the positive pole of that lead on the axis wheel to determine degrees. If negative locate the negative pole of that lead on the axis wheel to determine degrees. 111 Axis Practice Calculating Degrees 112
57 Calculate Degree of Axis 113 Calculate Degree of Axis I II III 114

58 Calculate Degree of Axis 115 Calculate Degree of Axis 116
59 Lead 1 avr V1 V4 Left Arm High Lateral Wall Axis Quadrant Right Arm 4 th ICS, RSB Septal Wall L MCL, 5 th ICS Anterior Wall Lead 2 avl V2 V5 Left Leg Inferior Wall Left Arm High Lateral Wall 4 th ICS, LSB Septal Wall L anterior axillary, same level as V 4 Low Lateral Wall Lead 3 avf V3 V6 Left Leg Inferior Wall Left Leg Inferior Wall Axis Quadrant Midway Between V 2 & V 4 Anterior Wall L midaxillary line, same level as V 4 Low Lateral Wall 117 ECG Fundamentals Bundle Branch Blocks 118

60 Conduction System Review Left Bundle Branch Left anterior fascicle Left posterior fascicle Right Bundle Branch Purkinje Network Purkinje Fibers 119 Normal Depolarization 2 V 6 1 QRS sec V 1 120


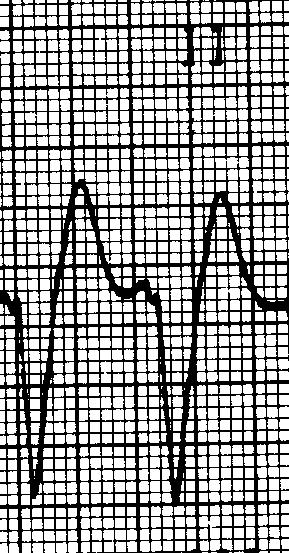
61 Bundle Branch Block QRS complex is 0.12 sec or greater Incomplete BBB measures from 0.10 to Right Bundle Branch Block Causes CAD Disease of right side of the heart Cor pulmonale Cardiomyopathy Congenital lesions A-S Defects Pulmonic Stenosis Pulmonary Embolism 122
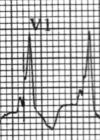
62 Normal Depolarization 2 V 6 1 QRS sec V V1 Right Bundle Branch Block Triphasic complex rsr pattern - positive Or an M shaped R wave with right peak taller Or a qr pattern V1 V1 V6 Triphasic complex qrs with wide S waves Positive V6 rsr R qr qrs 124
63 Right Bundle Branch Block Secondary T wave changes: T wave should go in the opposite direction to the last part of the QRS complex represents altered repolarization Primary T wave changes: T Waves that go in the same direction as the last part of the QRS complex indicate probable ischemia 125 Left Bundle Branch Block Causes Left Ventricular Hypertrophy MI CAD Aortic Stenosis Cardiomyopathy Hypertensive cardiomyopathy 126
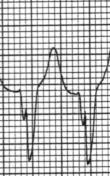
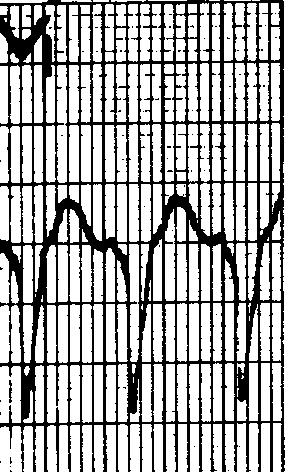
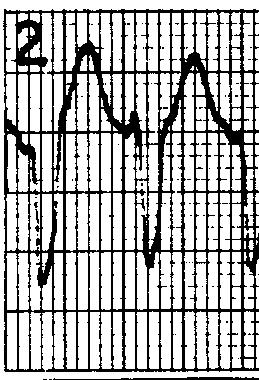
64 Left Bundle Branch Block V 6 = wide R V 1 = QS QRS =.12 sec or more V1 = rs 127 Left Bundle Branch Block V1 Wide QS or rs complex - negative Slick downstroke Nadir <0.06 sec V6 Wide R wave with no initial septal q wave - - positive V6 128
65 Left Bundle Branch Block Nadir Measure from the beginning of the QRS complex to the bottom valley of the QRS < 0.06 sec 129 Left Bundle Branch Block Ischemia Secondary T wave changes: T waves should be in the opposite direction from the last part of the QRS complex represent altered repolarization Primary T wave Changes: T waves that go in the same direction as the last part of the QRS complex represent probable ischemia 130


66 Left Bundle Branch Block Injury An elevated J point is normal in the presence of a deep S wave as long as ST remains concave smile If ST becomes rounded then you may have injury - frown 131 Left Bundle Branch Block Often have left axis deviation From normal to 60 Most often not more than 30 High mortality rate if left axis is present 132
67 Left Anterior Hemiblock Causes Ischemia Valvular disease Cardiomyopathy Congenital heart disease Rarely normal Blood supply received from septal branch of LAD (or AV nodal artery of RCA) 133 Left Anterior Hemiblock Block of anterior superior fascicle of the LBB Left axis deviation - 30 to 75 Become suspicious at - 30 Definitive at 40 to 45 Common at -60 Key for recognizing -60 Axis - avr most equiphasic limb lead Commonly seen in anterior wall MI Low mortality if isolated Left anterior hemiblock in association with RBBB during AMI Associated with left main occlusion and high mortality 134

68 Left Anterior Hemiblock Lead 2, Lead 3 and avf rs pattern Small r waves Slightly wide / deep S waves Increased limb lead voltage Lead 1 and avl qr pattern Normal QRS duration 135 Lead 1 Left Arm High Lateral Wall Axis Lead 2 Left Leg Inferior Wall avr Right Arm avl Left Arm High Lateral Wall V1 4 th ICS, RSB Septal Wall Right / Left BBB V2 4 th ICS, LSB Septal Wall V4 L MCL, 5 th ICS Anterior Wall V5 L anterior axillary, same level as V 4 Low Lateral Wall Lead 3 Left Leg Inferior Wall avf Left Leg Inferior Wall Axis V3 Midway Between V 2 & V 4 Anterior Wall V6 Low Lateral Wall Right / Left BBB 136
69
70
71
72
73
Relax and Learn At the Farm 2012
 Relax and Learn At the Farm 2012 Session 2: 12 Lead ECG Fundamentals 101 Cynthia Webner DNP, RN, CCNS, CCRN-CMC, CHFN Though for Today Mastery is not something that strikes in an instant, like a thunderbolt,
12 Lead ECG. Presented by Rebecca Sevigny BSN, RN Professional Practice & Development Dept.
 12 Lead ECG Presented by Rebecca Sevigny BSN, RN Professional Practice & Development Dept. Two Main Coronary Arteries RCA LCA which branches into Left Anterior Descending Circumflex Artery Two Main Coronary
12-Lead ECG Interpretation. Kathy Kuznar, RN, ANP
 12-Lead ECG Interpretation Kathy Kuznar, RN, ANP The 12-Lead ECG Objectives Identify the normal morphology and features of the 12- lead ECG. Perform systematic analysis of the 12-lead ECG. Recognize abnormalities
Electrocardiogram ECG. Hilal Al Saffar FRCP FACC College of medicine,baghdad University
 Electrocardiogram ECG Hilal Al Saffar FRCP FACC College of medicine,baghdad University Tuesday 29 October 2013 ECG introduction Wednesday 30 October 2013 Abnormal ECG ( ischemia, chamber hypertrophy, heart
Introduction to Electrocardiography
 Introduction to Electrocardiography Class Objectives: Introduction to ECG monitoring Discuss principles of interpretation Identify the components and measurements of the ECG ECG analysis ECG Monitoring
12 LEAD EKG & CXR INTERPRETATION.
 12 LEAD EKG & CXR INTERPRETATION www.cherylherrmann.com cherrmann@frontier.com Audio Product Recording discount for participants $60 Nonparticipants = $190 o Get CEs and manual https://catalog.vyne.com
By the end of this lecture, you will be able to: Understand the 12 lead ECG in relation to the coronary circulation and myocardium Perform an ECG
 By the end of this lecture, you will be able to: Understand the 12 lead ECG in relation to the coronary circulation and myocardium Perform an ECG recording Identify the ECG changes that occur in the presence
12 Lead ECG Interpretation: Color Coding for MI s
 12 Lead ECG Interpretation: Color Coding for MI s Anna E. Story, RN, MS Director, Continuing Professional Education Critical Care Nurse Online Instructional Designer 2004 Anna Story 1 Objectives review
12 LEAD EKG BASICS. By: Steven Jones, NREMT P CLEMC
 12 LEAD EKG BASICS By: Steven Jones, NREMT P CLEMC ECG Review Waves and Intervals P wave: the sequential activation (depolarization) of the right and left atria QRS complex: right and left ventricular
INTRODUCTION TO ECG. Dr. Tamara Alqudah
 INTRODUCTION TO ECG Dr. Tamara Alqudah Excitatory & conductive system of the heart + - The ECG The electrocardiogram, or ECG, is a simple & noninvasive diagnostic test which records the electrical
BASIC CONCEPT OF ECG
 BASIC CONCEPT OF ECG Electrocardiogram The electrocardiogram (ECG) is a recording of cardiac electrical activity. The electrical activity is readily detected by electrodes attached to the skin. After the
The Fundamentals of 12 Lead EKG. ECG Recording. J Point. Reviewing the Cardiac Conductive System. Dr. E. Joe Sasin, MD Rusty Powers, NRP
 The Fundamentals of 12 Lead EKG Dr. E. Joe Sasin, MD Rusty Powers, NRP SA Node Intranodal Pathways AV Junction AV Fibers Bundle of His Septum Bundle Branches Purkinje System Reviewing the Cardiac Conductive
5- The normal electrocardiogram (ECG)
") 5- The (ECG) Introduction Electrocardiography is a process of recording electrical activities of heart muscle at skin surface. The electrical current spreads into the tissues surrounding the heart, a small
5- The (ECG) Introduction Electrocardiography is a process of recording electrical activities of heart muscle at skin surface. The electrical current spreads into the tissues surrounding the heart, a small
ECG INTERPRETATION MANUAL
 Lancashire & South Cumbria Cardiac Network ECG INTERPRETATION MANUAL THE NORMAL ECG Lancashire And South Cumbria Cardiac Physiologist Training Manual THE NORMAL ECG E.C.G CHECKLIST 1) Name, Paper Speed,
Introduction to ECG Gary Martin, M.D.
 Brief review of basic concepts Introduction to ECG Gary Martin, M.D. The electrical activity of the heart is caused by a sequence of rapid ionic movements across cell membranes resulting first in depolarization
also aid the clinician in recognizing both the obvious and subtle abnormalities that may help guide therapy.
 Karen Lieberman, MS, CRNP f the many diagnostic tools used to screen for and evaluate cardiac abnormalities, the 12-lead electrocardiogram (ECG) is among the most basic. This inexpensive and noninvasive
ECG CONVENTIONS AND INTERVALS
 1 ECG Waveforms and Intervals ECG waveforms labeled alphabetically P wave== represents atrial depolarization QRS complex=ventricular depolarization ST-T-U complex (ST segment, T wave, and U wave)== V repolarization.
ECG. Prepared by: Dr.Fatima Daoud Reference: Guyton and Hall Textbook of Medical Physiology,12 th edition Chapters: 11,12,13
 ECG Prepared by: Dr.Fatima Daoud Reference: Guyton and Hall Textbook of Medical Physiology,12 th edition Chapters: 11,12,13 The Concept When the cardiac impulse passes through the heart, electrical current
12 Lead EKG. The Basics
 12 Lead EKG The Basics Objectives Demonstrate proper 12 EKG lead placement Determine electrical axis Identify ST and T wave changes as they relate to myocardial ischemia Describe possible complications
This presentation will deal with the basics of ECG description as well as the physiological basics of
 Snímka 1 Electrocardiography basics This presentation will deal with the basics of ECG description as well as the physiological basics of Snímka 2 Lecture overview 1. Cardiac conduction system functional
Ekg pra pr c a tice D.HAMMOUDI.MD
 Ekg practice D.HAMMOUDI.MD Anatomy Revisited RCA (Right Coronary Artery) Right ventricle Inferior wall of LV Posterior wall of LV (75%) SA Node (60%) AV Node (>80%) LCA (Left Coronary Artery) Septal wall
DR QAZI IMTIAZ RASOOL OBJECTIVES
 PRACTICAL ELECTROCARDIOGRAPHY DR QAZI IMTIAZ RASOOL OBJECTIVES Recording of electrical events in heart Established electrode pattern results in specific tracing pattern Health of heart i. e. Anatomical
EKG. Danil Hammoudi.MD
 EKG Danil Hammoudi.MD What is an EKG? The electrocardiogram (EKG) is a representation of the electrical events of the cardiac cycle. Each event has a distinctive waveform, the study of which can lead to
Conduction Problems / Arrhythmias. Conduction
 Conduction Problems / Arrhythmias Conduction Wolf-Parkinson White Syndrome (WPW) and Lown-Ganong-Levine (LGL): Atrial impulses bypass the AV node through an accessory pathway or bypass tract (bundle of
Understanding basics of EKG
 Understanding basics of EKG By Alula A.(R III) www.le.ac.uk Topic for discussion Understanding of cellular electrophysiology Basics Rate Rhythm Axis Intervals P wave QRS ST/T wave Abnormal EKGs Understanding
The Electrocardiogram part II. Dr. Adelina Vlad, MD PhD
 The Electrocardiogram part II Dr. Adelina Vlad, MD PhD Basic Interpretation of the ECG 1) Evaluate calibration 2) Calculate rate 3) Determine rhythm 4) Determine QRS axis 5) Measure intervals 6) Analyze
Electrocardiography Abnormalities (Arrhythmias) 7. Faisal I. Mohammed, MD, PhD
 7. Faisal I. Mohammed, MD, PhD") Electrocardiography Abnormalities (Arrhythmias) 7 Faisal I. Mohammed, MD, PhD 1 Causes of Cardiac Arrythmias Abnormal rhythmicity of the pacemaker Shift of pacemaker from sinus node Blocks at different
Electrocardiography Abnormalities (Arrhythmias) 7 Faisal I. Mohammed, MD, PhD 1 Causes of Cardiac Arrythmias Abnormal rhythmicity of the pacemaker Shift of pacemaker from sinus node Blocks at different
Electrocardiography for Healthcare Professionals. Chapter 14 Basic 12-Lead ECG Interpretation
 Electrocardiography for Healthcare Professionals Chapter 14 Basic 12-Lead ECG Interpretation 2012 The Companies, Inc. All rights reserved. Learning Outcomes 14.1 Discuss the anatomic views seen on a 12-lead
All About STEMIs. Presented By: Brittney Urvand, RN, BSN, CCCC. Essentia Health Fargo Cardiovascular Program Manager.
 All About STEMIs Presented By: Brittney Urvand, RN, BSN, CCCC Essentia Health Fargo Cardiovascular Program Manager Updated 10/2/2018 None Disclosures Objectives Identify signs and symptoms of a heart attack
CORONARY ARTERIES HEART
 CARDIAC/ECG MODULE THE HEART CORONARY ARTERIES FIBRILLATING HEART CORONARY ARTERIES HEART PRACTICE RHYTHMS PRACTICE RHYTHMS ELECTRICAL CONDUCTION SA Node (60 100) Primary pacemaker AV Node (40 60) ***Creates
- why the T wave is deflected upwards although it's a repolarization wave?
 Cardiac Electrograph: - why the T wave is deflected upwards although it's a repolarization wave? After depolarization the ventricle contracts but since the heart is a volume conductor (3D not 2D), when
Family Medicine for English language students of Medical University of Lodz ECG. Jakub Dorożyński
 Family Medicine for English language students of Medical University of Lodz ECG Jakub Dorożyński Parts of an ECG The standard ECG has 12 leads: six of them are considered limb leads because they are placed
Section V. Objectives
 Section V Landscape of an MI Objectives At the conclusion of this presentation the participant will be able to Outline a systematic approach to 12 lead ECG interpretation Demonstrate the process for determining
Acute Coronary Syndromes. Disclosures
 Acute Coronary Syndromes Disclosures I work for Virginia Garcia Memorial Health Center, Beaverton, OR. Jon Tardiff, BS, PA-C OHSU Clinical Assistant Professor And I am a medical editor for Jones & Bartlett
REtrive. REpeat. RElearn Design by. Test-Enhanced Learning based ECG practice E-book
 Test-Enhanced Learning Test-Enhanced Learning Test-Enhanced Learning Test-Enhanced Learning based ECG practice E-book REtrive REpeat RElearn Design by S I T T I N U N T H A N G J U I P E E R I Y A W A
ECG WORKBOOK. Rohan Jayasinghe
 ECG WORKBOOK Rohan Jayasinghe Contents Preface vii Foreword viii Acknowledgements ix The author x Reviewers xi Section 1 Basics of the ECG 1 Section 2 ECG-based diagnosis: pathology by ECG 21 Section 3
Pennsylvania Academy of Family Physicians Foundation & UPMC 43rd Refresher Course in Family Medicine CME Conference March 10-13, 2016
 Pennsylvania Academy of Family Physicians Foundation & UPMC 43rd Refresher Course in Family Medicine CME Conference March 10-13, 2016 Disclosures: EKG Workshop Louis Mancano, MD Speaker has no disclosures
3/26/15 HTEC 91. EKG Sign-in Book. The Cardiac Cycle. Parts of the ECG. Waves. Waves. Review of protocol Review of placement of chest leads (V1, V2)
") EKG Sign-in Book HTEC 91 Review of protocol Review of placement of chest leads (V1, V2) Medical Office Diagnostic Tests Week 2 http://www.cvphysiology.com/arrhythmias/a013c.htm The Cardiac Cycle Represents
EKG Sign-in Book HTEC 91 Review of protocol Review of placement of chest leads (V1, V2) Medical Office Diagnostic Tests Week 2 http://www.cvphysiology.com/arrhythmias/a013c.htm The Cardiac Cycle Represents
ECG Interpretation. Best to have a system to methodically evaluate ECG (from Dubin) * Rate * Rhythm * Axis * Intervals * Hypertrophy * Infarction
 * Rate * Rhythm * Axis * Intervals * Hypertrophy * Infarction") ECG to save Babies ECG Interpretation Best to have a system to methodically evaluate ECG (from Dubin) * Rate * Rhythm * Axis * Intervals * Hypertrophy * Infarction Electrical Activity in the heart 5 events
ECG to save Babies ECG Interpretation Best to have a system to methodically evaluate ECG (from Dubin) * Rate * Rhythm * Axis * Intervals * Hypertrophy * Infarction Electrical Activity in the heart 5 events
Axis. B.G. Petty, Basic Electrocardiography, DOI / _2, Springer Science+Business Media New York 2016
 Axis 2 The electrical axis of any electrocardiogram (EKG) waveform is the average direction of electrical activity. It is not a vector, because by definition a vector has both direction and amplitude,
ECG (MCQs) In the fundamental rules of the ECG all the following are right EXCEP:
 In the fundamental rules of the ECG all the following are right EXCEP:") ECG (MCQs) 2010 1- In the fundamental rules of the ECG all the following are right EXCEP: a- It is a biphasic record of myocardial action potential fluctuations. b- Deflection record occurs only during
ECG (MCQs) 2010 1- In the fundamental rules of the ECG all the following are right EXCEP: a- It is a biphasic record of myocardial action potential fluctuations. b- Deflection record occurs only during
ECG Interpretation Cat Williams, DVM DACVIM (Cardiology)
") ECG Interpretation Cat Williams, DVM DACVIM (Cardiology) Providing the best quality care and service for the patient, the client, and the referring veterinarian. GOAL: Reduce Anxiety about ECGs Back to
ECG Interpretation Cat Williams, DVM DACVIM (Cardiology) Providing the best quality care and service for the patient, the client, and the referring veterinarian. GOAL: Reduce Anxiety about ECGs Back to
UNDERSTANDING YOUR ECG: A REVIEW
 UNDERSTANDING YOUR ECG: A REVIEW Health professionals use the electrocardiograph (ECG) rhythm strip to systematically analyse the cardiac rhythm. Before the systematic process of ECG analysis is described
ECG Basics Sonia Samtani 7/2017 UCI Resident Lecture Series
 ECG Basics Sonia Samtani 7/2017 UCI Resident Lecture Series Agenda I. Introduction II.The Conduction System III.ECG Basics IV.Cardiac Emergencies V.Summary The Conduction System Lead Placement avf Precordial
Electrocardiography negative zero LA/VL RA/VR LL/VF recording electrode exploring electrode Wilson right arm right arm, left arm left arm
 Electrocardiography In the previous lecture, we were talking about the unipolar limb leads. We said that to make the unipolar lead, you have to make the negative electrode as zero electrode, this is done
Lab Activity 24 EKG. Portland Community College BI 232
 Lab Activity 24 EKG Reference: Dubin, Dale. Rapid Interpretation of EKG s. 6 th edition. Tampa: Cover Publishing Company, 2000. Portland Community College BI 232 Graph Paper 1 second equals 25 little boxes
ECG ABNORMALITIES D R. T AM A R A AL Q U D AH
 ECG ABNORMALITIES D R. T AM A R A AL Q U D AH When we interpret an ECG we compare it instantaneously with the normal ECG and normal variants stored in our memory; these memories are stored visually in
CARDIOVASCULAR PHYSIOLOGY ECG. Dr. Ana-Maria Zagrean
 CARDIOVASCULAR PHYSIOLOGY ECG Dr. Ana-Maria Zagrean Electrocardiogram (ECG) ECG is a non-invasive method to record at the body surface the electrical activity of the heart. - the rate and regularity of
ELECTROCARDIOGRAPHY (ECG)
") ELECTROCARDIOGRAPHY (ECG) The heart is a muscular organ, which pumps blood through the blood vessels of the circulatory system. Blood provides the body with oxygen and nutrients, as well as assists in
ELECTROCARDIOGRAPHY (ECG) The heart is a muscular organ, which pumps blood through the blood vessels of the circulatory system. Blood provides the body with oxygen and nutrients, as well as assists in
General Introduction to ECG. Reading Assignment (p2-16 in PDF Outline )
") General Introduction to ECG Reading Assignment (p2-16 in PDF Outline ) Objectives 1. Practice the 5-step Method 2. Differential Diagnosis: R & L axis deviation 3. Differential Diagnosis: Poor R-wave progression
General Introduction to ECG Reading Assignment (p2-16 in PDF Outline ) Objectives 1. Practice the 5-step Method 2. Differential Diagnosis: R & L axis deviation 3. Differential Diagnosis: Poor R-wave progression
12 Lead ECG Interpretation
 12 Lead ECG Interpretation Julie Zimmerman, MSN, RN, CNS, CCRN Significant increase in mortality for every 15 minutes of delay! N Engl J Med 2007;357:1631-1638 Who should get a 12-lead ECG? Also include
A few new tools for better detection and understanding of STEMIs in the field.
 A few new tools for better detection and understanding of STEMIs in the field. Let s talk, prep and placement. Try to shoot for quality, consistency and no artifact! (looking sometimes for 1 or 2 mm changes)
Myocardial Infarction. Reading Assignment (p66-78 in Outline )
") Myocardial Infarction Reading Assignment (p66-78 in Outline ) Objectives 1. Why do ST segments go up or down in ischemia? 2. STEMI locations and culprit vessels 3. Why 15-lead ECGs? 4. What s up with avr?
Myocardial Infarction Reading Assignment (p66-78 in Outline ) Objectives 1. Why do ST segments go up or down in ischemia? 2. STEMI locations and culprit vessels 3. Why 15-lead ECGs? 4. What s up with avr?
Ask Mish. EKG INTERPRETATION part i
 EKG INTERPRETATION part i What is EKG? EKG or ECG= electrocardiogram(~graphy) means the recording of the heart electrical activity from Greek kardio= heart, graphein= to write cardiac cell physiology Cardiac
Chapter 4. Basic ECG Concepts and the Normal ECG. Brian Coyne, MEd, RCEP / Shel Levine, MS, CES
 Chapter 4 Basic ECG Concepts and the Normal ECG Brian Coyne, MEd, RCEP / Shel Levine, MS, CES Learning Objectives Upon completion of this chapter, the reader will be able to: 1. Identify standardized components
Determining Axis and Axis Deviation on an ECG
 Marquette University e-publications@marquette Physician Assistant Studies Faculty Research and Publications Health Sciences, College of 7-15-2010 Determining Axis and Axis Deviation on an ECG Patrick Loftis
Atlantic Health System
 Atlantic Health System Morristown Medical Center Newton Medical Center Overlook Medical Center Basic Dysrhythmia Course Day 1 1 2 Chapter 1 Anatomy and Physiology Learning Objectives 1) Identify electrophysiology
Electrocardiography Normal 5. Faisal I. Mohammed, MD, PhD
 Electrocardiography Normal 5 Faisal I. Mohammed, MD, PhD 1 Objectives 2 1. Describe the different waves in a normal electrocardiogram. 2. Recall the normal P-R and Q-T interval time of the QRS wave. 3.
Acute Coronary Syndromes Unstable Angina Non ST segment Elevation MI (NSTEMI) ST segment Elevation MI (STEMI)
 ST segment Elevation MI (STEMI)") Leanna R. Miller, RN, MN, CCRN-CSC, PCCN-CMC, CEN, CNRN, CMSRN, NP Education Specialist LRM Consulting Nashville, TN Objectives Evaluate common abnormalities that mimic myocardial infarction. Identify
Leanna R. Miller, RN, MN, CCRN-CSC, PCCN-CMC, CEN, CNRN, CMSRN, NP Education Specialist LRM Consulting Nashville, TN Objectives Evaluate common abnormalities that mimic myocardial infarction. Identify
Birmingham Regional Emergency Medical Services System
 Birmingham Regional Emergency Medical Services System 2018 ALCTE Summer Conference EKG Basics Brian Gober, MAT, ATC, NRP, CSCS Education Services Manager ECC Training Center Coordinator Birmingham Regional
15 16 September Seminar W10O. ECG for General Practice
 15 16 September 2012 Seminar W10O ECG for General Practice Speaker: Ms Natasha Eaton ECG for General Practice Speaker: Natasha Eaton Cardiac CNC Executive Representative Electrocardiography The graphic
1 st Degree Block Prolonged P-R interval caused by first degree heart block (lead II)
") AV Heart Blocks 1 st degree A condition of a rhythm, not a true rhythm Need to always state underlying rhythm 2 nd degree Type I - Wenckebach Type II Classic dangerous to the patient Can be variable (periodic)
AV Heart Blocks 1 st degree A condition of a rhythm, not a true rhythm Need to always state underlying rhythm 2 nd degree Type I - Wenckebach Type II Classic dangerous to the patient Can be variable (periodic)
ECG Interpretation Made Easy
 ECG Interpretation Made Easy Dr. A Tageldien Abdellah, MSc MD EBSC Lecturer of Cardiology- Hull University Hull York Medical School 2007-2008 ECG Interpretation Made Easy Synopsis Benefits Objectives Process
2017 EKG Workshop Advanced. Family Medicine Review Course Lou Mancano, MD, FAAFP Reading Health System Family and Community Medicine Reading, PA
 2017 EKG Workshop Advanced Family Medicine Review Course Lou Mancano, MD, FAAFP Reading Health System Family and Community Medicine Reading, PA Part II - Objective Describe a useful approach to interpreting
Understanding the 12-lead ECG, part II
 Bundle-branch blocks Understanding the 12-lead ECG, part II Most common electrocardiogram (ECG) abnormality Appears as a wider than normal S complex Occurs when one of the two bundle branches can t conduct
ELECTROCARDIOGRAPH. General. Heart Rate. Starship Children s Health Clinical Guideline
 General Heart Rate QRS Axis T Wave Axis PR Interval according to Heart Rate & Age P Wave Duration and Amplitude QRS Duration according to Age QT Interval R & S voltages according to Lead & Age R/S ratio
Please check your answers with correct statements in answer pages after the ECG cases.
 ECG Cases ECG Case 1 Springer International Publishing AG, part of Springer Nature 2018 S. Okutucu, A. Oto, Interpreting ECGs in Clinical Practice, In Clinical Practice, https://doi.org/10.1007/978-3-319-90557-0
December 2018 Tracings
 Tracings Tracing 1 Tracing 4 Tracing 1 Answer Tracing 4 Answer Tracing 2 Tracing 5 Tracing 2 Answer Tracing 5 Answer Tracing 3 Tracing 6 Tracing 3 Answer Tracing 6 Answer Questions? Contact Dr. Nelson
ECG SIGNS OF HYPERTROPHY OF HEART ATRIUMS AND VENTRICLES
 Ministry of Health of Ukraine Kharkiv National Medical University ECG SIGNS OF HYPERTROPHY OF HEART ATRIUMS AND VENTRICLES Methodical instructions for students Рекомендовано Ученым советом ХНМУ Протокол
Cardiology Flash Cards
 Cardiology Flash Cards EKG in a nut shell www.brain101.info Conduction System www.brain101.info 2 Analyzing EKG Step by step Steps in Analyzing ECG'S 1. Rhythm: - Regular _ Sinus, Junctional or Ventricular.
BASIC PRINCIPLES OF ECG INTERPRETATION
 Chapter 1 BASIC PRINCIPLES OF ECG INTERPRETATION Cardiac rhythm analysis may be accomplished informally via cardiac monitoring and more diagnostically via a 12-lead electrocardiogram (ECG). An electrocardiogram
Basic electrocardiography reading. R3 lee wei-chieh
 Basic electrocardiography reading R3 lee wei-chieh The Normal Conduction System Lead Placement avf Limb Leads Precordial Leads Interpretation Rate Rhythm Interval Axis Chamber abnormality QRST change What
A Review of Cardiac Pathophysiology and EKG. Jamie Dyson PT, DPT Kathy Swanick PT, DPT, OCS
 A Review of Cardiac Pathophysiology and EKG Jamie Dyson PT, DPT Kathy Swanick PT, DPT, OCS Cardiac Pathophysiology Coronary Artery Disease Congestive Heart Failure Valvular Heart Disease Athletic Heart
ECGs: Everything a finalist needs to know. Dr Amy Coulden As part of the Simply Finals series
 ECGs: Everything a finalist needs to know Dr Amy Coulden As part of the Simply Finals series Aims and objectives To be able to interpret basic ECG abnormalities To be able to recognise commonly tested
12 Lead Electrocardiogram (ECG) PFN: SOMACL17. Terminal Learning Objective. References
 PFN: SOMACL17. Terminal Learning Objective. References") 12 Lead Electrocardiogram (ECG) PFN: SOMACL17 Slide 1 Terminal Learning Objective Action: Communicate knowledge of 12 Lead Electrocardiogram (ECG) Condition: Given a lecture in a classroom environment
12 Lead Electrocardiogram (ECG) PFN: SOMACL17 Slide 1 Terminal Learning Objective Action: Communicate knowledge of 12 Lead Electrocardiogram (ECG) Condition: Given a lecture in a classroom environment
ECG Practice Strips Discussion part 1:
 ECG Practice Strips Discussion part 1: The first 20 strips are for teaching various abnormalities of the morphology of the waves of the ECG. Strips 21 and following are for teaching some abnormalities
Abnormalities Caused by Left Bundle Branch Block
 Marquette University e-publications@marquette Physician Assistant Studies Faculty Research and Publications Physician Assistant Studies, Department 12-17-2010 Abnormalities Caused by Left Bundle Branch
Left posterior hemiblock (LPH)/
/") ECG OF THE MONTH Left Postero-inferior Depolarization Delay Keywords Electrocardiography Intraventricular conduction delay, Inferoposterior hemiblock, Left posterior fascicular block, Left posterior hemiblock
ECG OF THE MONTH Left Postero-inferior Depolarization Delay Keywords Electrocardiography Intraventricular conduction delay, Inferoposterior hemiblock, Left posterior fascicular block, Left posterior hemiblock
Preface: Wang s Viewpoints
 AHA/ACCF/HRS Recommendations for the Standardization and Interpretation of the Electrocardiogram: Part IV, Ischemia and Infarction Presented by: WANG, TZONG LUEN, MD, PhD, JM, FACC, FESC, FCAPSC Professor,
ECG interpretation basics
 ECG interpretation basics Michał Walczewski, MD Krzysztof Ozierański, MD 21.03.18 Electrical conduction system of the heart Limb leads Precordial leads 21.03.18 Precordial leads Precordial leads 21.03.18
Presented By: Cynthia Webner DNP, RN, CCNS, CCRN-CMC, CHFN Karen Marzlin DNP, RN, CCNS, CCRN-CMC, CHFN 1
 Presented By: Cynthia Webner DNP, RN, CCNS, CCRN-CMC, CHFN Karen Marzlin DNP, RN, CCNS, CCRN-CMC, CHFN 1 1 st CCU in the world opened in March 1962 was in Toronto, Canada In May of 1962 the 1 st CCU in
CASE 10. What would the ST segment of this ECG look like? On which leads would you see this ST segment change? What does the T wave represent?
 CASE 10 A 57-year-old man presents to the emergency center with complaints of chest pain with radiation to the left arm and jaw. He reports feeling anxious, diaphoretic, and short of breath. His past history
BEDSIDE ECG INTERPRETATION
 BEDSIDE ECG INTERPRETATION Presented by: Ryan Dean, RN, MSN, CCRN, CCNS, CFRN Flight Nurse 2017 Based on presentations originally by Gennifer DePaoli, RN Objectives Hospital policies Electrical conduction
Interpreting Electrocardiograms (ECG) Physiology Name: Per:
 Physiology Name: Per:") Interpreting Electrocardiograms (ECG) Physiology Name: Per: Introduction The heart has its own system in place to create nerve impulses and does not actually require the brain to make it beat. This electrical
Interpreting Electrocardiograms (ECG) Physiology Name: Per: Introduction The heart has its own system in place to create nerve impulses and does not actually require the brain to make it beat. This electrical
The Normal Electrocardiogram
 C H A P T E R 1 1 The Normal Electrocardiogram When the cardiac impulse passes through the heart, electrical current also spreads from the heart into the adjacent tissues surrounding the heart. A small
12 Lead ECG Interpretation: The Basics and Beyond
 12 Lead ECG Interpretation: The Basics and Beyond Cindy Weston, DNP, RN, CCRN, CNS-CC, FNP-BC Assistant Professor Texas A&M University College of Nursing cweston@tamhsc.edu Objectives Review the basics
If the P wave > 0.12 sec( 3 mm) usually in any lead. Notched P wave usually in lead I,aVl may be lead II Negative terminal portion of P wave in V1, 1
 usually in any lead. Notched P wave usually in lead I,aVl may be lead II Negative terminal portion of P wave in V1, 1") If the P wave > 0.12 sec( 3 mm) usually in any lead. Notched P wave usually in lead I,aVl may be lead II Negative terminal portion of P wave in V1, 1 mm depth and 3 mm width( most specific) Since Mitral
If the P wave > 0.12 sec( 3 mm) usually in any lead. Notched P wave usually in lead I,aVl may be lead II Negative terminal portion of P wave in V1, 1 mm depth and 3 mm width( most specific) Since Mitral
3/4/2018. March Martina Frost, PA C Desert Cardiology. Electricity moving towards/away from electrode create downward/upward directions of waves
 March 2018 Martina Frost, PA C Desert Cardiology Electricity moving towards/away from electrode create downward/upward directions of waves Frontal view Limb leads: I, II, III, avl, avf, (avr) Horizontal
Lect.6 Electrical axis and cardiac vector Cardiac vector: net result Vector that occurs during depolarization of the ventricles Figure:
 Lect.6 Electrical axis and cardiac vector Objectives: 1. State the relationship between the direction of cardiac vector with the direction (-ve, +ve) and amplitude of an ECG waves. 2. Draw diagram indicting
BME 365 Website. Project Directions
 Lecture 17 EKG BME 365 Website Project Directions Heart rate Factors Affecting CO Parasympathetic activity decreases HR Sympathetic activity increases HR Stroke volume Depends on force generated by cardiac
Ablative Therapy for Ventricular Tachycardia
 Ablative Therapy for Ventricular Tachycardia Nitish Badhwar, MD, FACC, FHRS 2 nd Annual UC Davis Heart and Vascular Center Cardiovascular Nurse / Technologist Symposium May 5, 2012 Disclosures Research
SIMPLY ECGs. Dr William Dooley
 SIMPLY ECGs Dr William Dooley 1 No anatomy just interpretation 2 Setting up an ECG 3 Setting up an ECG 1 V1-4 th Right intercostal space at sternal border 2 V2-4 th Left intercostal space at sternal border
Electrocardiography. Hilal Al Saffar College of Medicine,Baghdad University
 Electrocardiography Hilal Al Saffar College of Medicine,Baghdad University Which of the following is True 1. PR interval, represent the time taken for the impulse to travel from SA node to AV nose. 2.
Cardiac Telemetry Self Study: Part One Cardiovascular Review 2017 THINGS TO REMEMBER
 Please review the above anatomy of the heart. THINGS TO REMEMBER There are 3 electrolytes that affect cardiac function o Sodium, Potassium, and Calcium When any of these electrolytes are out of the normal
FLB s What Are Those Funny-Looking Beats?
 FLB s What Are Those Funny-Looking Beats? Reading Assignment (pages 27-45 in Outline ) The 5-Step Method ECG #: Mearurements: Rhythm (s): Conduction: Waveform: Interpretation: A= V= PR= QRS= QT= Axis=
Case 1. Case 2. Case 3
 Case 1 The correct answer is D. Occasionally, the Brugada syndrome can present similar morphologies to A and also change depending on the lead position but in the Brugada pattern the r is wider and ST
ECG pre-reading manual. Created for the North West Regional EMET training program
 ECG pre-reading manual Created for the North West Regional EMET training program Author:- Dr Juan Carlos Ascencio-Lane juan.ascencio-lane@ths.tas.gov.au 1 Disclaimer This handbook has been created for
ELECTROCARDIOGRAPHY (III) THE ANALYSIS OF THE ELECTROCARDIOGRAM
 THE ANALYSIS OF THE ELECTROCARDIOGRAM") ELECTROCARDIOGRAPHY (III) THE ANALYSIS OF THE ELECTROCARDIOGRAM Scridon Alina, Șerban Răzvan Constantin Recording and analysis of the 12-lead ECG is part of the basic medical assessment performed for every
ELECTROCARDIOGRAPHY (III) THE ANALYSIS OF THE ELECTROCARDIOGRAM Scridon Alina, Șerban Răzvan Constantin Recording and analysis of the 12-lead ECG is part of the basic medical assessment performed for every
Study methodology for screening candidates to athletes risk
 1. Periodical Evaluations: each 2 years. Study methodology for screening candidates to athletes risk 2. Personal history: Personal history of murmur in childhood; dizziness, syncope, palpitations, intolerance