TABLE OF CONTENTS. Executive Summary Introduction Methodology Findings and Results.. 5. Conclusions and Recommendations...
|
|
|
- Eleanore Chase
- 5 years ago
- Views:
Transcription

1 Texas Homeless Network Balance of State Survey Of Homelessness 2009
2
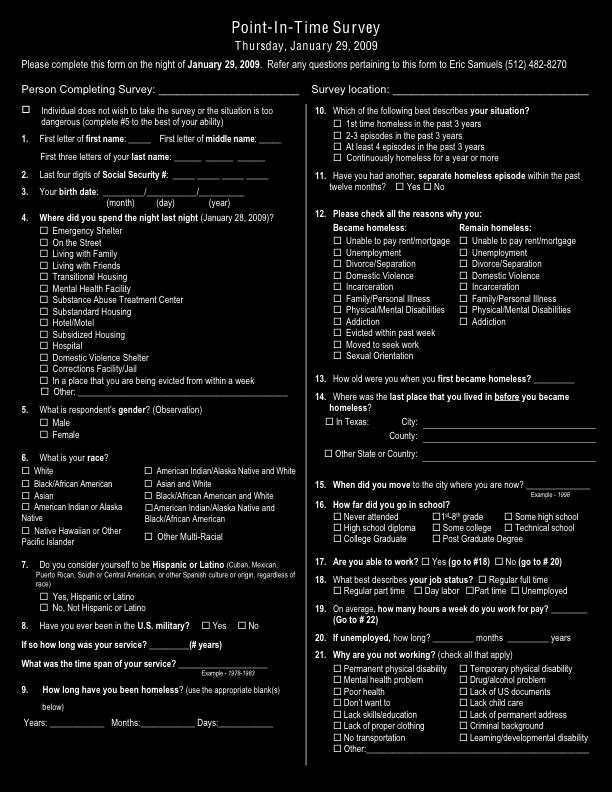
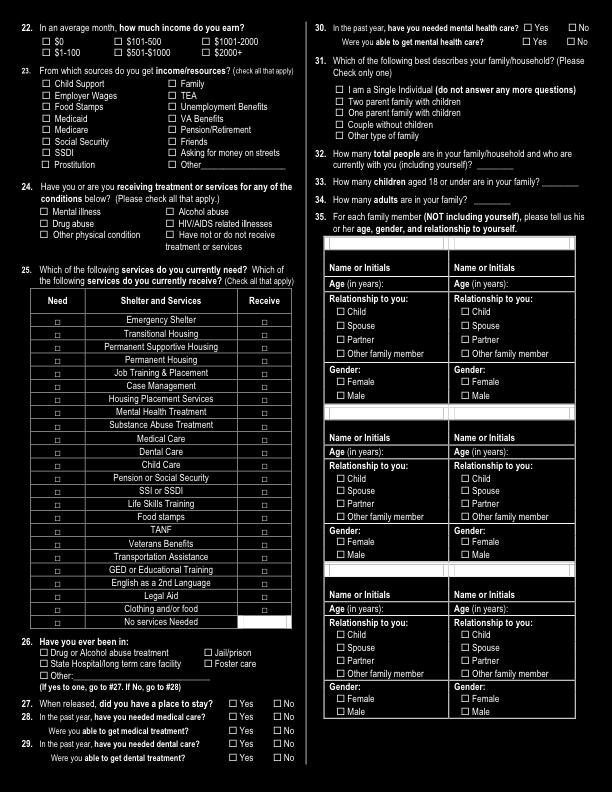
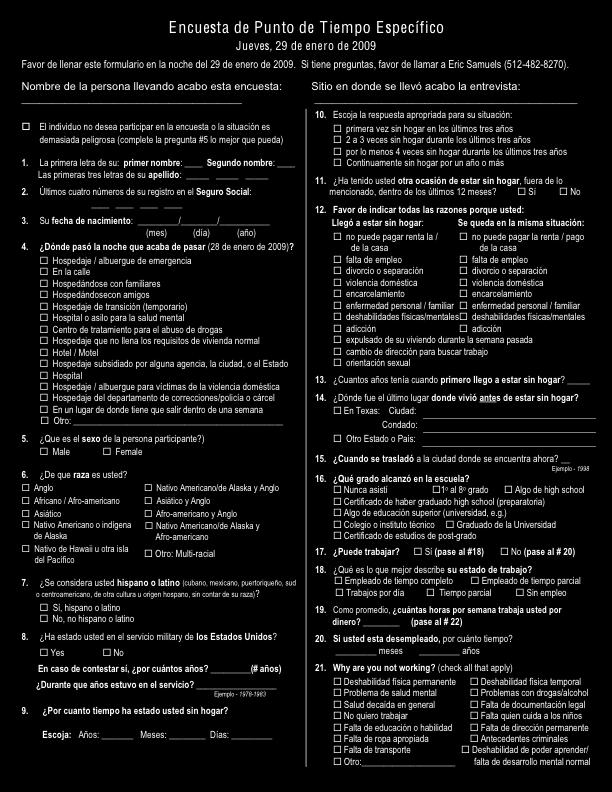
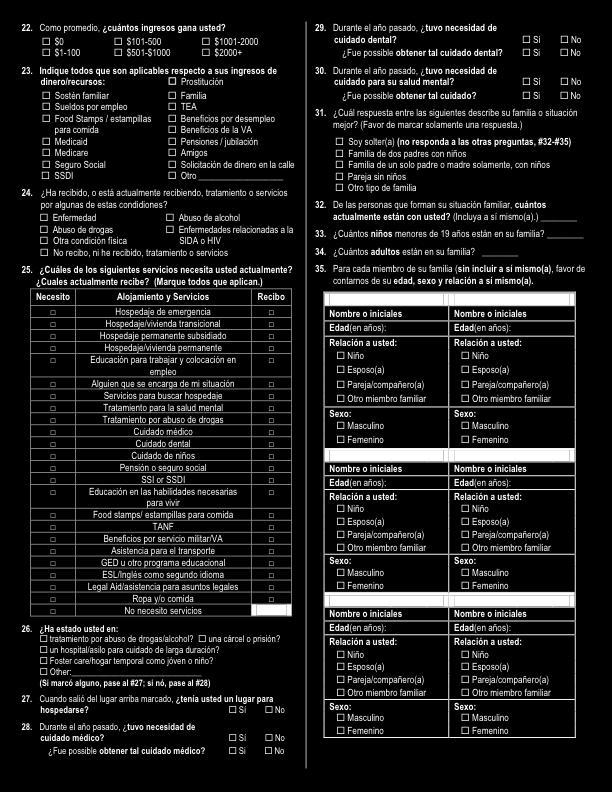
3 TABLE OF CONTENTS Executive Summary Introduction Methodology Findings and Results.. 5 Conclusions and Recommendations...22 APPENDICES APPENDIX A: 2009 THN POINT IN TIME HOMELESS SURVEY INSTRUMENT (ENGLISH).. 26 APPENDIX B: 2009 THN POINT IN TIME HOMELESS SURVEY INSTRUMENT (SPANISH).. 28 APPENDIX C: 2009 THN INSTRUCTIONS FOR HOMELESS COUNT SURVEY.. 30 APPENDIX D: THN SURVEY ADMINISTRATOR SCRIPT..36
4
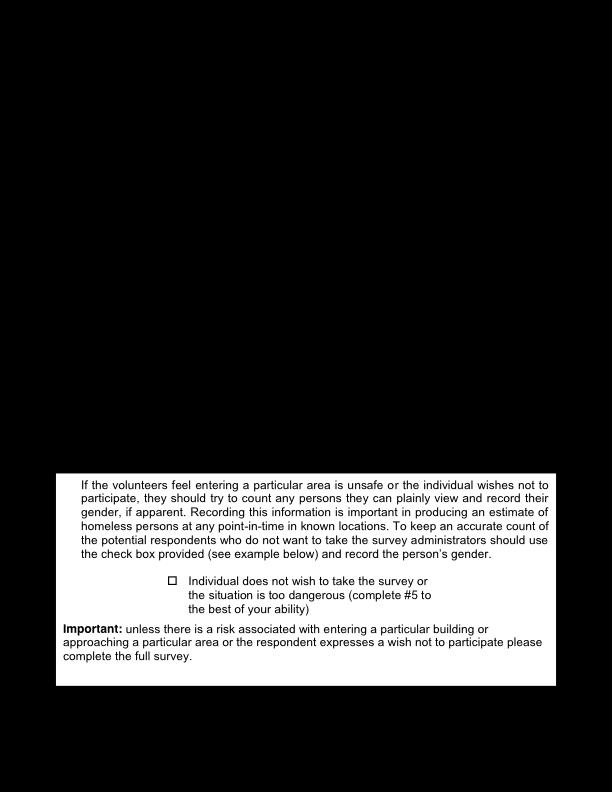
5 EXECUTIVE SUMMARY The Balance of State Survey on Homelessness was a point-in-time survey conducted on January 29, 2009, in 15 Texas regions that together make up The Texas Balance of State Continuum of Care (CoC). Most Texas metropolitan areas have their own CoC which works to develop comprehensive community plans to organize and deliver housing and services to homeless people. However, 190 of Texas 254 counties are not covered by a metropolitan CoC group and therefore comprise the 15 regions in the Balance of State CoC. Texas Homeless Network aided each of the 15 regions in developing project advisory committees to assist in identifying locations where people who are homeless are known to congregate, to recruit and train volunteers to administer the survey, and to provide other types of assistance and oversight. Throughout the one day established for the survey, more than 300 trained volunteers in the 15 regions administered the 35 question survey to people believed to be homeless. In total, 1,991 persons participated in the survey. Sixty-two percent of respondents were in situations that would be defined as homeless under the HUD definition of homelessness while thirty-eight percent of respondents met the McKinney-Vento definition of homelessness. Research questions included demographic characteristics of persons who are homeless, the circumstances surrounding their homelessness, and services needed and received by them. Based on data from the 2009 survey, the Texas Homeless Network produced the following estimates of the homeless population on any given day in the Balance of State regions: - More than 10,636 people who are experiencing homelessness can be found living in shelters, temporary housing, and on the streets families with dependent children are either unsheltered or are in emergency shelters or transitional housing programs. 3,780 individuals are in these families, for an average size of 4.3 persons per household. - 3,445 individuals are in emergency shelter or transitional housing, and 3,411 are unsheltered. 1
6 Other key findings include: - 27% of those surveyed indicated that dependent children made up part of their household; - 57% indicated that their current episode of homelessness was the first time they had been without permanent housing in the last three years if not the first time in their lives; - since the previous point-in-time survey in 2007, the number of respondents who identified themselves as African American increased 69%; - there is a critical shortage of transitional housing options for persons and families who are homeless; and - services most available to those surveyed addressed immediate needs but did not address the root causes of homelessness unemployment and the inability to pay for housing. INTRODUCTION How many people are homeless in Texas anyway? That seems like an obvious question but the answer is less so. Definitions of homelessness and strategies for getting information are complex, diverse and variable. For many, homelessness is a relatively temporary circumstance rather than a permanent condition. Texans may find themselves homeless as a result of a crisis an eviction, job loss, domestic violence, chronic disability, natural disaster or sudden illness. Researchers use different research methodologies to help us better understand the frequency and nature of homelessness. Prevalence strategies seek to find out how many people have been homeless at some point during a given period of time. Point-intime surveys provide snapshot views of homelessness on a specific day. Both methodologies have their advantages. Definitions of homelessness vary as well. Most would agree that a person with mental illness sleeping in an abandoned building is homeless but what about the battered woman and her child who are staying in a domestic violence shelter? Is the unemployed man recently evicted but staying on the sofa at a friend s house considered homeless? How about the family whose home was destroyed in a hurricane staying in a short-term hotel paid for by government assistance? The U.S. Department of Housing and Urban Development (HUD) defines homelessness as lacking fixed, regular, and adequate nighttime residence and reliance on residences that are intended to be temporary. 1 The McKinney-Vento definition includes these components but also counts those living temporarily with family or friends. 2 1 HUD, McKinney-Vento is the primary piece of federal legislation dealing with the education of children and youth experiencing homelessness in U.S. public schools. It was reauthorized as Title X, Part C, of the No Child Left Behind Act in January National Center for Homeless Education at the SERVE Center, 2
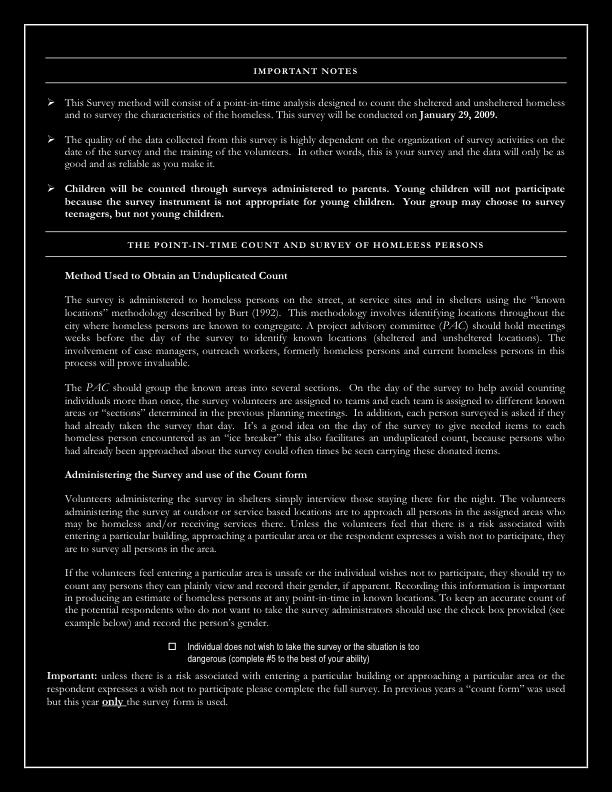
7 Simply finding those who fit the definition of homeless whatever definition is being used in order to participate in a survey or in some other way to be counted is challenging. Most research is conducted at locations known to be frequented by people who are homeless. Institutional locations include places such as shelters and soup kitchens and non-institutional locations include the streets, parks or abandoned buildings where homeless persons are known to congregate. More difficult to identify are those who are staying temporarily with family or friends or in hotels, those living in cars, those living in places not known to or accessible to researchers, and those who, for whatever reason, simply do not want to be located. For these reasons data on homelessness are usually considered to be underestimates. As the only statewide homeless advocacy organization in Texas, Texas Homeless Network (THN) has made several efforts to assess the size and characteristics of the homeless population in Texas to inform policy-makers and service providers. Questions posed by students, interested individuals, legislators, and advocacy groups have been inadequately addressed due to the lack of a coordinated, statewide data collection effort focused on homelessness in Texas. Over the past ten years, THN has worked to address this issue, refining its methodology and adding to what is known about the problem of homelessness in Texas. METHODOLOGY Most Texas metropolitan areas have their own Continuum of Care group which works to develop comprehensive community plans to organize and deliver housing and services to people experiencing homelessness. However, 190 of Texas 254 counties are not covered by metropolitan CoCs and therefore comprise the 15 region Balance of State CoC. Texas Homeless Network conducted this Balance of State Survey of Homelessness to gather detailed information on issues related to homelessness in this Continuum of Care region. Research questions included identifying the number of people who are homeless, their demographic characteristics, and services needed and received by them. Using point-in-time survey methodology, data were collected on January 29, 2009, in each of the 15 Texas regions that together make up the Balance of State CoC. Each of the 15 regions were aided in developing project advisory committees to assist in identifying locations where homeless persons are known to congregate, to identify volunteers to administer the survey, and to provide other types of assistance and oversight. 3

8 More than 300 trained volunteers in the 15 regions visited the identified service and outdoor areas known to be frequented by persons who are homeless (the known location methodology 3 ) to administer the 35 question instrument. Volunteers filled out the surveys based on oral answers given by participants. Children were counted through surveys administered to their parents but did not participate in the survey itself. In total, 1,991 persons participated in the survey, and were inclusive of the variety of persons who are homeless that service providers assist. Figure 1 illustrates the 15 regions that make-up the Balance of State CoC group, the number of surveys gathered from each region, and the percentage of data collected from each region. Figure 1: Survey Participants by Geographic Area in Balance of State CoC 3 The known location methodology, also referred to as the Burt system refers to a counting / data collection method developed by Martha R. Burt of The Urban Institute. As previously described, it involves identifying and visiting places where the homeless or known or believed to congregate. The method is described in Practical Methods for Counting the Homeless: A Manual for State and Local Jurisdictions, 2 nd Edition by Martha R. Burt. 4
9 FINDINGS AND RESULTS This section presents key findings from the 2009 survey in three parts: I. Close-up of Balance of State gives a broad picture of homelessness in the 15 region Continuum of Care group the reasons people become homeless, remain homeless, the number and makeup of households involved, and where homeless people are from; II. Face of the Homeless looks at individual characteristics such as age, race, income, barriers to employment and education; and III. Resources for the Homeless examines needs identified by respondents and the degree to which those needs are being met. As appropriate, trends, regional differences and changes from the 2007 survey are noted, along with policy and program implications. Note: Percentages were rounded for clarity and some questions permitted more than one answer. Not all data total 100%. I. Close-up of Balance of State On the night of January 28, 2009, San Marcos was experiencing patchy ice with temperatures in the teens. Sherman fared better with higher than normal temperatures nearly 70 earlier in the afternoon. Abilene had been hit with an ice storm the day before, severe enough to close schools and generate newspaper articles about driving carefully and defensively. For Fabian in Huntsville, temperature swings and icy roads had less to do with transportation and more to do with survival. Like an estimated 10,636 people in the Balance of State CoC, Fabian was homeless on January 29, when the 2009 point-in-time survey was conducted. Using population figures for the 190 counties that made up the 15 region Balance of State CoC, Table 1 shows the estimated number of people who are homeless, according to data gathered from the 2009 survey. Table 1. Estimated number of people who are homeless in Balance of State CoC Balance of State Area* Population Homeless Estimate Alamo 477, Deep East Texas 432, Heart of Texas 459, Northeast Texas (Texarkana) 640, Panhandle (Lubbock) 599, Rio Grande 1,977,464 4,474 (Laredo, Harlingen, Brownsville) Rural West Texas (Abilene, Midland, Odessa, 825, San Angelo) South Central Texas 674, Texoma 259, Totals 6,345,993 10,636 *For this analysis, the data from the 15 regions that comprise the Balance of State Continuum of Care is presented in nine geographic areas. 5


.")
, facilities that generally limit")


10 Where people who are homeless stay the night When asked Where did you spend the night last night? 62% of respondents were in situations that would be defined as homeless under the HUD definition of homelessness while 38% met the broader McKinney-Vento definition of homelessness. As shown below in Figure 2, more than half of the respondents interviewed were staying either in an emergency shelter (26%) or with family or friends (26%). Seventeen percent spent the night either in transitional housing (10%) or in a domestic violence shelter (7%), facilities that generally limit the length of time a person can stay. A troubling 15% spent the night on the street. Figure 2. Where People Spend the Night Other - did/did not meet HUD definition of homeless, 17 Emergency Shelter, 26 Domestic Violence Shelter, 7 Transitional Housing, 10 On the Street, 15 With Family or Friends, 26 Since some surveys were conducted in soup kitchens, not all respondents met the HUD definition of homeless. For example, of the 17% in the Other category, only 5% met the HUD definition. That fact explains why the most common location given by those whose response fell into the Other category was a home or casa. Other responses included missions and churches, as well as under a bridge, tents, trucks and U-haul trailers. Frequency and duration of homelessness Almost 30% of those surveyed reported being homeless for more than a year with 4% indicating that they had been homeless for more than a decade. Thirty percent indicated that they had been homeless for less than a month. The median number of 6
11 days respondents had been homeless was 150; on average a little more than two years. Many of those surveyed met the HUD definition of a chronically homeless person. 4 The median number of days parents with children were homeless was found to be 77 (2.5 months) and an average of 299 days (nearly 10 months). For most respondents (57%) their current situation was the first time they had been homeless in the previous three years. Eighteen percent reported that they had been continuously homeless for a year or more. The remaining 25% had experienced intermittent homelessness (two to four episodes) within the previous three years. Almost 31% of those surveyed indicated that they had experienced another separate homeless episode within the previous twelve months. Reasons for becoming and remaining homeless Figure 3 shows that for almost half of respondents, unemployment was the reason cited for their homelessness and for 60% unemployment was the reason they remain homeless. For almost one-third of respondents, becoming homeless was the result of more than one factor. Figure 3. Reasons for Homelessness Became homeless Remain homeless A chronically homeless person is defined by HUD as an unaccompanied homeless individual with a disabling condition who has either been continuously homeless for a year or more OR has had at least four (4) episodes of homelessness in the past three (3) years. In order to be considered chronically homeless, a person must have been sleeping in a place not meant for human habitation and/or in an emergency homeless shelter. A disabling condition is defined as a diagnosable substance use disorder, serious mental illness, developmental disability, or chronic physical illness or disability, including the co-occurrence of two or more of these conditions. An episode of homelessness is a separate, distinct, and sustained stay on the streets or in an emergency shelter. A chronically homeless person must be unaccompanied and disabled during each episode. 7

12 Mobility of people who are homeless When asked how recently they had moved to the city where they were currently living and being surveyed, 14% reported having moved in 2009, 33% had moved sometime in 2008 and 28% had moved sometime between 2000 and Another 8% had moved to the city in the 1990s and 16% prior to The majority of respondents were not homeless at the time they moved. Household Makeup While the majority of the homeless households are made up of individuals (61%), 27% of households have dependent children. Only 12% of respondents reported being part of a couple with no children or in some other kind of household situation. Most respondents became homeless in the city where they were surveyed. Less than 10% came from another Texas county after becoming homeless and less than 5% came from another state or country after becoming homeless. The data contradicts the notion that the homeless tend to gravitate to communities that offer more services or are located in more favorable climates. Households with children have either one (31%), two (34%) or three children (21%) aged 18 or under. Less than 10% of families have more than four children under the age of 18. When asked the question How many adults are in your family 48% responded one and 39% responded two. Less than 1% reported more than five adults in their family. As these figures appear to differ from household descriptions, it may be that respondents were unclear as to the definition of household versus family and that respondents were identifying adult family members who were not currently homeless with them. For example, a married woman living in a shelter for battered persons may have reported her husband as being a member of her family although he is not homeless. Household size and the number of children in homeless households remained stable between 2007 and Household size was 2.76 persons in 2009 versus 2.71 in The average number of children was 2.3 in 2009 and 2.2 in
13 Figure 4 shows how household demographics have changed in the two years since the 2007 point-in-time survey. Figure 4. Household Demographics 61% 63% % 24% 8% 5% 6% 4% 6% 4% Individual Two parents w/ children One parent w/ children Couple w/o children Other type of family Children Who are Homeless Limitations inherent in the survey methodology may not have fully captured the number of children who are homeless. There are three reasons for this: 1. The 2009 point-in-time survey primarily focused on respondents who meet the HUD definition of homelessness. Other research suggests that the majority of families with children experiencing homelessness meet the McKinney-Vento Education definition of homelessness rather than HUD. 2. By using the known locations methodology, data collection was limited to the survey of locations where advocates know people experiencing homelessness congregate. These locations do not include households where the majority of homeless families (according to the McKinney-Vento Education definition) reside, that is, in doubled up situations or in hotel/motels - the second most common residence of homeless families. 3. With the majority of communities covered in the Texas Balance of State CoC located in rural areas, there are fewer social service sites where homeless individuals and families could be administered this survey. 9
, manage the state s efforts to count students in homeless situations.")

14 To improve its data collection in the 2010 pointin-time survey, THN is already coordinating with the Texas Homeless Education Office (THEO) and Region 10 5, who together with the Texas Education Agency (TEA), manage the state s efforts to count students in homeless situations. The school year marked the first year that TEA required districts to submit data on the numbers of students in homeless situations by grade level and primary nighttime residence. Nearly 54,000 students were reported by public schools as experiencing homelessness at some point during the year. Officials believe this count is quite low, especially given that over 670 schools reported zero homeless students. Region 10 and THEO are focusing efforts on improving the identification and reporting process in the and school years. By collaborating with THEO, Region 10 and TEA, Texas Homeless Network hopes to collect better information on school children meeting the McKinney-Vento Education definition of homelessness and thus better serve this vulnerable sub-population. 5 Region 10 is the Education Service Center that provides funding for homeless advocacy initiatives. 10


")
15 II. Face of the Homeless Gender According to survey data, 55% of the respondents were male and 45% female. These figures remain consistent from the 2007 data but as compared to 1999 data which showed men as making up 65% of the homeless versus 35% women, it appears that men and women are becoming more equally likely to experience homelessness. Age As shown in Figure 5, half of all respondents directly surveyed were aged 36 to 55. The median age in 2009 is 43 as compared to 40 in Although almost 14% of respondents were homeless by the time they were 19, the mean and median age of first time homelessness was 36. Figure 5. Age of Respondents % 66+ 4% 18 and under 4% % % % % Race Sixty-seven percent of respondents identified themselves as White and 27% as Black/African American, as shown in Table 2. Table 2. Respondents by Race White (includes those with Hispanic ethnicity) 67% Black/African American 27% Asian <1% American Indian/Alaska Native 1% Native Hawaiian or other Pacific Islander <1% American Indian/Alaska Native and White 1% Black/African American and White 1% American Indian/Alaska Native and Black/African American <1% Other Multi-Racial 3% 11
16 As compared to 2007 data where 16% of persons who were homeless identified themselves as Black/African American, the 27% who identified their race in this way in 2009 represents a 69% increase. Persons identifying themselves as White decreased 8% with 73% identifying as White in the 2007 survey, and 67% identifying as White in Figure 6 shows a geographical distribution by race of people who are homeless in the Balance of State CoC group.* 350 Figure 6. Race by Geographic Area White Black Other Multi-racial 0 East Texas Rural West Texas Heart of Texas Panhandle Rio Grande Valley *For this analysis, data from the 15 regions that comprise the Balance of State Continuum of Care were collapsed into five broad geographic areas. Ethnicity Consistent with 2007 data, 34% of those who identified themselves as White consider themselves Hispanic or Latino with the greatest percentage in residing South Texas. Figure 7 shows the distribution geographically and by ethnicity of people who are homeless. 500 Figure 7. Ethnicity - Hispanic / Latino East Texas Rural West Texas Heart of Texas Panhandle Rio Grande Valley Total Respondents Portion identified as Hispanic / Latino 12


. 6 Figure 8.")


17 Education Nearly 20% of those surveyed had done some college work or obtained a college or even post-graduate degree, as shown in Figure 8. Another 33% had received their high school diploma. The remaining respondents had never attended school, only attended for a while or had attended a technical school. According to 2000 U.S. Census figures, as a whole, 51% of Texans have had at least some college (versus 20% of survey respondents) and 24% do not have a high school diploma (versus 44% of survey respondents). 6 Figure 8. Education College graduate 4% Post graduate degree 2% Never attended 2% Technical school 3% Some college 15% High school diploma 32% 1st-8th grade 18% Some high school 24% Employment Ability and Reality Exactly two-thirds of respondents described themselves as able to work, and one-third as unable. Of those able to work, 29% reported regular employment 22% full-time and 7% part-time. Another 6% described themselves as day laborers and 7% working part-time but not on a regular basis. The remaining 58% indicated that they were unemployed. 6 Educational Attainment 2000: Census 2000 Brief, Issued August, 2003, United States Census Bureau 13


.")


 almost 40% indicated that they worked on")

18 As might be expected, education correlated with employment, as shown in Figure 9. Generally, the more education attained, the greater the likelihood of employment; those with post graduate degrees or technical school experience were most often employed (68% and 58% respectively). Post graduate degree College graduate Technical school High school diploma Some high school Figure 9. Percentage Employed by Educational Attainment Some college 1st - 8th grade Never attended As Figure 10 shows, for those who were able to work (regardless of employment status) almost 40% indicated that they worked on average between 30 and 40 hours a week for pay. Only 15% indicated that they did not work for pay at all. Figure 10. Paid hours of work each week More than 40 hours 7% N/A 6% No hours 15% 31 to 40 hours 39% 1 to 10 hours 9% 21 to 30 hours 13% 11 to 20 hours 11% 14


19 Income Almost one-third of respondents indicated that they had no income, as shown in Figure 11. The second most frequent income category most often identified was $501 - $1,000 with 28% of respondents indicating they made that much money on the average. Figure 11. Average Monthly Income $1,001 - $2,000 9% $2,000+ 3% $0 32% $501 - $1,000 27% $101 - $500 18% $1 - $100 11% As noted in Table 3, respondents reported income from wages as well as other resources, such as veterans benefits and SSI. Food stamps were the most common with 29% reporting using this government-funded resource. Table 3. Sources of Income/Resources Employer wagers 30% Medicaid 29% Panhandling 18% Friends 14% Social Security 14% SSDI 13% Other 9% Child Support 7% Medicare 5% Family 5% VA Benefits 2% Unemployment 2% Pension/retirement 2% Prostitution 1% TEA <1% 15

20 Education and Employment Correlations Unlike the correlation found between education and employment, (the more education, the more likely employed), education was not a factor in income earned. Of the income range most often reported - $500 - $1000 a month the respondents most likely to report that income level never attended school. Those least likely to report that income level were college graduates. When respondents were asked to estimate their income it is not clear whether they included resources such as food stamps or were only considering monetery wages earned through employment. Future surveys will work to clarify this section. Length of unemployment Respondents who identified themselves as unable to work were asked how long they had been unemployed. On average, those surveyed indicated they had been out of work for about three and a half years. The median figure for unemployment was one year. Reasons for not working To futher understand unemployment among the homeless, information was sought as to why the respondent was unable to work. Respondents were not limited to one answer but rather were able to identify all obstacles relevant to their own situation. Table 4 shows the full range of responses, with a Permanent physical disability being the reason most often cited for not working. Table 4. Reasons for not Working Permanent physical disability 29% Lack of transportation 25% Other reason(s) 18% Poor health 16% Mental health problem 14% Lack of skills / education 13% Lack of permanent address 11% Drug / alcohol problem 8% Criminal background 8% Lack of US documents 8% Lack of child care 8% Lack of proper clothing 6% Temporary physical disability 5% Learning / developmental disability 3% Don t want to 2% 16
21 Military Service Only 13% of respondents (183) had some military service, with the average length of service being three-and-half-years. This is very similar to the 2007 survey where 15% of respondents had served their country, with a median length of service four years. When asked to cite sources of income, only 12% of the veterans listed VA benefits. However, when asked if they needed VA benefits, only half of those who responded in the affirmative indicated they were currently receiving the benefit. Institutionalization Thirty-one percent of those surveyed indicated they had been in drug or alcohol abuse treatment although it is not known what percentage were in a facility or in some way institutionalized as part of treatment versus being treated on an out-patient basis or involved in some type of program such as Alcoholics Anonymous. Over one-third of respondents (35%) indicated they had been in a 50% of those surveyed have been in jail or prison. 31% have been in drug or alcohol abuse treatment. state hospital or other long term care facility and 50% had been incarcerated. Only 5% had ever been in foster care. Overall, two-thirds (67%) of those who reported being institutionalized indicated they had a place to stay upon their release. That figure held true for those who had been incarcerated two-thirds had a place to stay upon their release. 17

22 III. Resources for the Homeless The survey posed a number of questions to ascertain what services participants needed or received. The questions ranged from what services they may have received at some point in the past, to true point in time queries, as in what are you needing/receiving now, to what have you needed or received in the past year. Treatment or services for disabling conditions The majority of homeless persons surveyed in 2009 reported they had not or were not receiving treatment for any of the disabling conditions highlighted in Figure 12. Figure 12. Point-in-Time Treatment Services 55% % 22% 21% 17% 12% 11% 13% 16% 16% 1% 1% Mental illness Drug abuse Alcohol abuse HIV / AIDS related illness Other physical condition Have not / do not receive treatment or services 18

23 Needed/Received these Services in Past Year Figure 13 provides a clear point in time picture of what participants needed and received in the area of healthcare in the past year. Of the three primary health services, medical care was the one most needed with 61% requiring this service. Of those needing medical care, 56% received it. Fifty-five percent of those surveyed indicated they d needed dental care within the previous year but only 18% were able to obtain those services. Those needing mental health services fared somewhat better. Of the 23% who needed mental health services in the previous year, 27% received services. Figure 13. Health Services Needed and Received Needs Service Receives Service 61% 56% 55% 18% 23% 27% Medical care Dental care Mental health This data suggest a gap in critical health-related services as significant numbers of people who are homeless report being unable to access basic health services. In addition to existing conditions going untreated, the data suggests that people who are homeless are unlikely to receive the preventative care that could reduce the likelihood of future problems. One limitation of the data is that it does not provide an evaluation of the quality of the care that was received making it difficult to draw any conclusions about the efficacy of services that were provided, especially mental health services. Other Services Needed and Received In addition to the medical, dental and mental health services queried above, respondents were also asked about a broad range of other services they needed and received, such as assistance with transportation, child care, veteran s benefits, and case management. Unlike the previous section in which survey participants were specifically asked if they d needed a service during a specific time frame and then asked if they received that specific service in that time frame, the same corollary relationships cannot be drawn on this data section. 19
24 Two factors make it difficult to draw conclusions: 1. It is not known if those conducting the survey obtained information about the receipt of services only when the respondent indicated that it was a need. Of the 669 people who indicated they needed clothing or food, it cannot be assumed that any of the 405 people receiving clothing / food assistance also said they needed it. 2. It is likely that respondents who were getting a particular need met, i.e., emergency shelter, would then not identify it as something they needed since at that moment it wasn t a need. While steps will be taken to be able to make such a correlation in the future, the data collected do provide a simple accounting of what the people who were surveyed identified as needs and what services they were receiving at the time of the survey. Services Needed by Most Respondents The five services identified by at least one-third of the respondents as a needed service were clothing and/or food, permanent housing, emergency shelter, dental care, and medical care. Table 5 shows the full range of services respondents noted as needed; it is instructive to note which of those were needed by a small percentage of respondents. Note: respondents were able to check all services needed; a case was recorded as an individual respondent. Table 5. Services Needed SHELTER AND SERVICES NEED (Respondents checked all that applied) N % of responses % of cases Clothing and/or food Permanent Housing Emergency Shelter Dental Care Medical Care Case Management Food Stamps Job Training & Placement Transportation Assistance Housing Placement Services Transitional Housing Permanent Supportive Housing GED or Educational Training Life Skills Training Mental Health Treatment Legal Aid SSI or SSDI Child Care Substance Abuse Treatment Pension or Social Security TANF English as a Second Language Veterans Benefits No Services Needed TOTAL RESPONSES
25 Services Received by Most Respondents Table 6 illustrates the services respondents reported receiving. The five services identified by at least 17% of the respondents as received emergency shelter, case management, clothing and/or food, food stamps and transitional housing meet the immediate needs of people who are homeless. However, these services do not move them closer to ending their homeless state by addressing the two reasons most often given for becoming homeless in the first place unemployment and an inability to pay rent. Table 6: Services Received SHELTER AND SERVICES (Respondents checked all that applied) RECEIVED N % of responses % of cases Emergency Shelter Case Management Clothing and/or food Food Stamps Transitional Housing Medical Care SSI or SSDI Life Skills Training Transportation Assistance Mental Health Treatment Pension or Social Security Substance Abuse Treatment Dental Care GED or Educational Training Legal Aid Child Care Job Training & Placement TANF Permanent Housing Veterans Benefits Housing Placement Services English as a Second Language Permanent Supportive Housing 12 <1 1 Received Nothing 4 <1 <1 TOTAL RESPONSES
26 CONCLUSIONS AND RECOMMENDATIONS Despite the work of many programs and agencies in the regions that comprise the Balance of State CoC group, the gaps that remain are in the critical areas that would help end homelessness. While respondents appeared to have received emergency shelter or transitional housing services, longer term housing solutions are woefully inadequate. Further research is needed to better establish the correlation between needs and resources to meet those needs. Many of the services that are being provided appear to meet immediate needs of people who are homeless, clothing, food, etc., but do not provide the tools the person needs to end his or her homeless state. THN will rely on the enhanced data collection anticipated through implementation of the Homeless Management Information System HMIS to provide a clearer picture of people who are homeless in the Balance of the State regions in Texas. THN has already refined the 2010 survey instrument to address limitations. 22
27 23
28 24
29 APPENDICES 25
30 26
31 27
32 28
33 29
34 30
35 31
36 32
37 33
38 34
39 35
40 36
The Homeless Census & Homeless Point-in-time Survey Summary report Metro Louisville, 2009
 The Homeless Census & Homeless Point-in-time Survey Summary report Metro Louisville, 2009 Prepared by the Coalition for the Homeless 1 Each year, the Coalition for the Homeless prepares two annual counts.
North Dakota Coalition for Homeless People Statewide Point-in-Time Survey and Study of Homelessness January 25, 2007
 Report on Homelessness in North Dakota 2007 North Dakota Coalition for Homeless People Statewide Point-in-Time Survey and Study of Homelessness January 25, 2007 Acknowledgements The North Dakota Coalition
2008 Homeless Count Shows Need for Programs in Indianapolis
 I N D I A N A CENTER FOR HEALTH POLICY RESEARCH FOR A HEALTHIER INDIANA JUNE 2008 2008 Homeless Count Shows Need for Programs in Indianapolis In January 2008, a team coordinated by Indiana University s
St. Louis County Project Homeless Connect. Summary of guests served on November 5, 2008
 St. Louis County Project Homeless Connect Summary of guests served on November 5, 2008 D E C E M B E R 2 0 0 8 St. Louis County Project Homeless Connect Summary of guests served on November 5, 2008 December
Homeless veterans in Minnesota 2006
 Homeless veterans in Minnesota 2006 Statewide survey of veterans without permanent shelter summary November 2007 Wilder Research Center 1295 Bandana Boulevard North, Suite 210 Saint Paul, Minnesota 55108
Albany County Coordinated Entry Assessment version 12, 11/29/16
 Referral Completed by: PRE-SCREENING INFORMATION FOR SHELTER REFERRAL 1. First Name Last Name Date/Time: Other names (including nicknames): 2. Has client previously completed an application for assistance
Hennepin County Project Homeless Connect. Summary of guests served on May 11, 2009
 Hennepin County Project Homeless Connect Summary of guests served on May 11, 2009 A U G U S T 2 0 0 9 Hennepin County Project Homeless Connect Summary of guests served on May 11, 2009 August 2009 Prepared
2015 POINT-IN-TIME COUNT Results. April 2015
 POINT-IN-TIME COUNT Results April SURVEY WEEK OVERIVEW Survey Week was a joint project between the New Mexico Coalition to End Homelessness (NMCEH) and Heading Home. The goals of Survey Week were to conduct
Homelessness in Fargo, North Dakota and Moorhead, Minnesota. Key findings from the 2015 survey of people experiencing homelessness
 Homelessness in Fargo, North Dakota Key findings from the 2015 survey of people experiencing homelessness S E P T E M B E R 2 0 1 6 Contents Background... 1 Counts on the night of the study... 2 Key findings...
The Challenge to End Homelessness
 The Challenge to End Homelessness While Pinellas County is generally considered to be a prosperous community, with a strong economy, diverse communities, low unemployment, and quality educational and cultural
New Hampshire Continua of Care. PATH Street Outreach Program Entry Form for HMIS
 Please refer to the 2014 HUD HMIS Data Standards Version 5.1, available on the NH-HMIS website: www.nh-hmis.org for an explanation of the data elements in this form. Date form completed: Outreach worker
Nashville HMIS Intake Template Use COC Funded Projects: HMIS Intake at Entry Template
 HMIS Data Collection Template for Project ENTRY CoC Program This form can be used by all CoC-funded project types: Prevention, Street Outreach, Safe Haven, Transitional Housing, Rapid Re-housing, Permanent
Respond to the following questions for all household members each adult and child. A separate form should be included for each household member.
 HMIS Data Collection Template for Project ENTRY CoC Program This form can be used by all CoC-funded project types: Prevention, Street Outreach, Safe Haven, Transitional Housing, Rapid Re-housing, Permanent
2013 HOUSING STATUS SURVEY RESULTS. A Report on the Sheltered and Unsheltered Homeless in Billings
 2013 HOUSING STATUS SURVEY RESULTS A Report on the Sheltered and Unsheltered Homeless in Billings HUD Defined Homeless To be counted as homeless under HUD s definition, respondents had to indicate that
Texas Homeless Network 2013 Point-In-Time Results. Lubbock
 Texas Homeless Network 2013 Point-In-Time Results Lubbock Contents Respondent History 2 Causes of Homelessness 3 Employment & Education 4 Health Care 5 Treatment Services & Institutional Stays Veteran
April Prepared for the El Dorado County Human Services Department, Community Services Division By HomeBase / The Center for Common Concerns
 El Dorado County Homeless Count & Survey Results April 2008 Prepared for the El Dorado County Human Services Department, Community Services Division By HomeBase / The Center for Common Concerns HomeBase
Transitional, Intergenerational Group Residence Application. Texas ID# Primary Language: Address: City, State, Zip Code: Phone-home ( ) Phone-work ( )
 Phone-work ( )") PERSONAL/FAMILY INFORMATION Name Date Date of Birth / / SS # Gender Texas ID# Primary Language: Marital Status: Single Divorced Common Law Living Together Married & living with Spouse not living with Spouse
PERSONAL/FAMILY INFORMATION Name Date Date of Birth / / SS # Gender Texas ID# Primary Language: Marital Status: Single Divorced Common Law Living Together Married & living with Spouse not living with Spouse
Transitional Housing Application
 Transitional Housing Application Applicant Information Name: Date of birth: SSN: ID Number: Current address: City: State: ZIP Code: Phone: Email: Name of Last Social Worker or Probation Officer:: Original
First Name Middle Name Last Name Name You Prefer Date
 Supportive Housing for Homeless Women & Families Application for Residency First Fruit Ministries 2750 Vance Street Wilmington, NC 28412 Phone 910.794.9656 Fax 910.794.9657 First Name Middle Name Last
Denton BASIC DEMOGRAPHICS QUICK REFERENCE OF 318 PEOPLE COUNTED
 Texas Homeless Network 2014 Point-In-Time Results Denton Contents Respondent History 2 Risk Factors 3 Employment & Education 4 Health Care 5 Children 6 Veteran Statistics 7 Community Needs and Estimates
Texas Homeless Network 2013 Point-In-Time Results. Abilene
 Texas Homeless Network 2013 Point-In-Time Results Abilene Contents Respondent History 2 Causes of Homelessness 3 Employment & Education 4 Health Care 5 Treatment Services & Institutional Stays Veteran
2018 POINT IN TIME SURVEY AND TEN YEAR POINT IN TIME ( )
") Capital Area Coalition on Homelessness...to educate and mobilize our community and coordinate services to prevent and reduce homelessness in the Capital Region. 218 POINT IN TIME SURVEY AND TEN YEAR POINT
Capital Area Coalition on Homelessness...to educate and mobilize our community and coordinate services to prevent and reduce homelessness in the Capital Region. 218 POINT IN TIME SURVEY AND TEN YEAR POINT
Respond to the following questions for all household members each adult and child. A separate form should be included for each household member.
 HMIS Data Collection Template for Project EXIT CoC Program This form can be used by all CoC-funded project types: Street Outreach, Safe Haven, Transitional Housing, Rapid Rehousing, and Permanent Supportive
Wilder Research. Homelessness in Fargo, North Dakota and Moorhead, Minnesota Highlights from the October 2006 survey. Key findings
 Wilder Research Homelessness in Fargo, North Dakota and Moorhead, Minnesota Highlights from the October 2006 survey The purpose of this summary is to provide a current snapshot of people experiencing homelessness
Texas Homeless Network 2013 Point-In-Time Results. Galveston
 Texas Homeless Network 2013 Point-In-Time Results Galveston Contents Respondent History 2 Causes of Homelessness 3 Employment & Education 4 Health Care 5 Treatment Services & Institutional Stays Veteran
Service Providers Working Collaboratively to Document the Plight of the Rural Homeless
 Service Providers Working Collaboratively to Document the Plight of the Rural Homeless Heather S. Feldhaus, Director, Center for Community Research and Consulting, Bloomsburg University Rich Kisner, Executive
Kitsap County Annual Point-in-Time Count
 Kitsap County Annual Point-in-Time Count 2018 JANUARY 25TH WELCOME! Thank you for joining us, we are excited that you are willing to help us with the Annual Kitsap County Point-in-Time Count. The Point-in-Time
An Introduction to Southern Nevada's Homeless Continuum of Care and Regional Plan to end homelessness
 An Introduction to Southern Nevada's Homeless Continuum of Care and Regional Plan to end homelessness Today you will leave with An understanding of homelessness in Southern NV An understanding of Help
Strategic Plan to End Homelessness
 Strategic Plan to End Homelessness Approved 2013, Updated October 2016 Ohio Balance of State Continuum of Care 1 Homelessness in the Ohio BoSCoC When most people imagine what homelessness looks like, they
Greater Lansing Area 2015 Annual Homeless Report
 Greater Lansing Area 2015 Annual Homeless Report Virg Bernero, Mayor The state of homelessness in Ingham County Our mission is to serve the most vulnerable in our community with dignity and respect, valuing
Homeless Leadership Coalition
 Homeless Leadership Coalition Point in Time 2018 Tri-County Results Working Together to Prevent and End Homelessness in Central Oregon June 19.2018 1 We are stronger, healthier, safer communities where
How Many People Experience Homelessness?
 National Coalition for the Homeless 2201 P. St. NW Washington, DC 20037 Phone: (202) 462-4822 Fax: (202) 462-4823 Email: info@nationalhomeless.org Website: http://www.nationalhomeless.org How Many People
Women + Girls Research Alliance. Homelessness and Rapid Re-Housing in Mecklenburg County
 Women + Girls Research Alliance Homelessness and Rapid Re-Housing in Mecklenburg County Homelessness and Rapid Re-Housing in Mecklenburg County The UNC Charlotte Urban Institute prepared this report in
COLORADO STATEWIDE HOMELESS COUNT Summer, 2006 EXECUTIVE SUMMARY
 COLORADO STATEWIDE HOMELESS COUNT Summer, 2006 EXECUTIVE SUMMARY February 2007 Research Conducted by: CENTER FOR EDUCATION POLICY ANALYSIS and CENTER FOR PUBLIC-PRIVATE SECTOR COOPERATION, GRADUATE SCHOOL
Housing Needs Assessment Survey Tool
 Appendix II -Year Chicago Area HIV/AIDS Housing Plan A-9 Housing Needs Assessment Survey Tool Appendix II consists of the English Housing Needs Assessment Survey tool (the Spanish-language survey is not
Community Homelessness Assessment, Local Education and Networking Groups (CHALENG)
") June 2016 Community Homelessness Assessment, Local Education and Networking Groups (CHALENG) Community Homelessness Assessment, Local Education and Networking Groups for, commonly referred to as Project
June 2016 Community Homelessness Assessment, Local Education and Networking Groups (CHALENG) Community Homelessness Assessment, Local Education and Networking Groups for, commonly referred to as Project
2017 PIT Summary: Arapahoe County
 A Point-in-Time (PIT) count provides a snapshot of homelessness by interviewing those who are homeless at a particular time. The Metropolitan Denver Homeless Initiative (MDHI) conducted a PIT study of
PARTICIPATION APPLICATION and AGREEMENT for CULINARY SCHOOL PROGRAM
 Page 1 PARTICIPATION APPLICATION and AGREEMENT for CULINARY SCHOOL PROGRAM PERSONAL INFORMATION First Name Middle Initial Last Name Current Street Address City State Zip code ( ) CELL _( )_HOME @ Email
Demographics. Households with children: 2,036 respondent households (2,095 total homeless)
") Denver County Summary A Point-in-Time (PIT) count provides a snapshot of homelessness by interviewing those who are homeless at a particular time. The Metropolitan Denver Homeless Initiative (MDHI) conducted
Denver County Summary A Point-in-Time (PIT) count provides a snapshot of homelessness by interviewing those who are homeless at a particular time. The Metropolitan Denver Homeless Initiative (MDHI) conducted
Arapahoe County Summary
 Arapahoe County Summary A Point-in-Time (PIT) count provides a snapshot of homelessness by interviewing those who are homeless at a particular time. The Metropolitan Denver Homeless Initiative (MDHI) conducted
Memorandum. San Jose AND EDUCATION COMMITTEE RECOMMENDATION
 NSE AGENDA: 08/10/17 ITEM: d(2) CITY OF CT 'S San Jose CAPITAL OF SILICON VALLEY TO: NEIGHBORHOOD SERVICES AND EDUCATION COMMITTEE Memorandum FROM: Jacky Morales-Ferrand RECOMMENDATION It is recommended
A HOME FOR EVERYONE. Whatcom County Coalition to End Homelessness Annual Report. Part A: Point in time census of homeless residents
 A HOME FOR EVERYONE Whatcom County Coalition to End Homelessness Annual Report Part A: Point in time census of homeless residents Part B: Public school students and their families Part C: Description of
2017 Point-in-Time Training. Welcome & Introductions
 2017 Point-in-Time Training Welcome & Introductions What is Point-in-Time? A collaborative effort to survey people who are experiencing homelessness in our community Photo: seattleu.edu A snapshot of the
SOLANO COUNTY. comprehensive report HOMELESS CENSUS & SURVEY REPORT PRODUCED BY ASR
 SOLANO COUNTY 2017 HOMELESS CENSUS & SURVEY comprehensive report REPORT PRODUCED BY ASR ABOUT THE RESEARCHER Applied Survey Research (ASR) is a social research firm dedicated to helping people build better
2009 Report of Duval, Clay, and Nassau Counties Homeless Population
 2009 Report of Duval, Clay, and Nassau Counties Homeless Population Prepared for the Emergency Services and Homeless Coalition of Jacksonville, Inc. Northeast Florida Center for Community Initiatives Department
REGION 1. Coalition for the HOMELESS Report
 2008 Report On any given night, approximately 500 people face homelessness in our area. Homeless people can be adults, young people, couples, or families with children. They are living without shelter,
Homelessness is a complex issue but it is not an unsolvable problem. It can be ended and philanthropy has a vital role to play.
 Homelessness is a complex issue but it is not an unsolvable problem. It can be ended and philanthropy has a vital role to play. People become homeless when they can t find housing they can afford. There
CoC Plan: Ending Homelessness Together Approved 4/19/2018 by the members of River Valleys Continuum of Care.
 CoC Plan: Ending Homelessness Together 2018-2028 Approved 4/19/2018 by the members of River Valleys Continuum of Care. 1 Homelessness in the River Valleys CoC When most people imagine what homelessness
DESCRIPTION OF FOLLOW-UP SAMPLE AT INTAKE SECTION TWO
 SECTION TWO DESCRIPTION OF FOLLOW-UP SAMPLE AT INTAKE 7 2.1 DEMOGRAPHIC CHARACTERISTICS Table 2.1 presents demographic descriptive data at intake for those who were included in the follow-up study. Data
A HOME FOR EVERYONE. Whatcom County Coalition to End Homelessness 2016 Annual Report. Part A: Point-in-Time Census of Homeless Residents
 A HOME FOR EVERYONE Whatcom County Coalition to End Homelessness 2016 Annual Report Part A: Point-in-Time Census of Homeless Residents Part B: Youth Homeless Count Part C: Public School Students and their
History and Program Information
 History and Program Information Rita da Cascia/ / Project Positive Match, San Francisco, CA Housing Opportunities for People with AIDS (HOPWA) Special Projects of National Significance (SPNS) Multiple
THE STATE OF HOMELESSNESS IN ALASKA. August Homeless Management Information System (HMIS) Report. Institute for Community Alliances
 Report. Institute for Community Alliances") 2016 THE STATE OF HOMELESSNESS IN ALASKA Homeless Management Information System (HMIS) Report Institute for Community Alliances August 2017 Photo Credit: Forget-me-Nots by A. Gonzalez TABLE OF CONTENTS
2016 THE STATE OF HOMELESSNESS IN ALASKA Homeless Management Information System (HMIS) Report Institute for Community Alliances August 2017 Photo Credit: Forget-me-Nots by A. Gonzalez TABLE OF CONTENTS
ABOUT THE RESEARCHER HOUSING INSTABILITY RESEARCH DEPARTMENT (HIRD) LOCATIONS
 LOCATIONS") SONOMA COUNTY 2017 HOMELESS CENSUS & SURVEY comprehensive report (n=197) REPORT PRODUCED BY ASR ABOUT THE RESEARCHER Applied Survey Research (ASR) is a social research firm dedicated to helping people
SONOMA COUNTY 2017 HOMELESS CENSUS & SURVEY comprehensive report (n=197) REPORT PRODUCED BY ASR ABOUT THE RESEARCHER Applied Survey Research (ASR) is a social research firm dedicated to helping people
2015 HUD Continuum of Care Program Competition Quick Facts
 Three Overarching Things to know for the 2015 CoC NOFA 1. This is the most competitive NOFA ever. HUD is using this NOFA to implement a strong preference for performance and effective practices that Congress
Glossary of Terms. Commercial Sex Worker: Self-reported as having received money, drugs or favors in exchange for sex.
 ADAP: AIDS Drug Assistance Program funded through Part B. Congress earmarks funds that must be used for ADAP, an important distinction since other Part B spending decisions are made locally. AIDS: Acquired
County of Ventura Homeless Survey
 2011 County of Ventura Homeless Survey May 2011 Acknowledgements This report was made possible by the efforts of community volunteers and staff of organizations that provide services for persons who are
State of the Streets: Evidence on Reducing Homelessness. Bill Evans Wilson Sheehan Lab for Economic Opportunities University of Notre Dame
 State of the Streets: Evidence on Reducing Homelessness Bill Evans Wilson Sheehan Lab for Economic Opportunities University of Notre Dame 1 Goals of the presentation How is homelessness defined? What groups
State of Iowa Outcomes Monitoring System
 State of Iowa Outcomes Monitoring System THE IOWA CONSORTIUM FOR SUBSTANCE ABUSE RESEARCH AND EVALUATION Year 17 Annual Outcome Evaluation Trend Report November 2015 With Funds Provided By: Iowa Department
About Homelessness By ReadWorks
 About Homelessness About Homelessness By ReadWorks Homelessness is an issue that affects people of every age and from every country. If you walk down the street in many big cities in the United States,
2014 Butte County BUTTE COUNTY COMMUNITY HEALTH ASSESSMENT
 2014 Butte County BUTTE COUNTY COMMUNITY HEALTH ASSESSMENT EXECUTIVE SUMMARY 2015 2017 EXECUTIVE SUMMARY TOGETHER WE CAN! HEALTHY LIVING IN BUTTE COUNTY Hundreds of local agencies and community members
2004 TARRANT COUNTY HOMELESS SURVEY
 2004 TARRANT COUNTY HOMELESS SURVEY Prepared by the Tarrant County Community Development Division in cooperation with the Tarrant County Homeless Coalition May 1, 2005 ACKNOWLEDGEMENTS Tarrant County Community
WHO IS HOMELESS IN WISCONSIN?
 WHO IS HOMELESS IN WISCONSIN? A LOOK AT STATEWIDE DATA ADAM SMITH, DIRECTOR INSTITUTE FOR COMMUNITY ALLIANCES About the Data Sources Data are reported from two origins: Longitudinal: count over time, typically
FROM THE HEART: Collaborative Supportive Housing Model for Child Welfare
 FROM THE HEART: Collaborative Supportive Housing Model for Child Welfare HEART Presenters Lisa Bayne, LCSW, KID Vice President of Programs Andria Dewson, MSW RCSWI, HEART Director Stacey Charles, MSW RCSWI,
NJ s Transitional Housing Initiative
 NJ s Transitional Housing Initiative SARA WALLACH, DOH DHSTS PROGRAM MANAGEMENT OFFICER ANNIE CHEN, ARFC CHIEF OPERATING OFFICER Definition of Homeless person According to the Department of Housing and
One in Four Convening October 23-24, 2014 Harvard University. Sofia Herrera, PhD, Office for Urban Initiatives Fuller Theological Seminary
 One in Four Convening October 23-24, 2014 Harvard University Sofia Herrera, PhD, Office for Urban Initiatives Fuller Theological Seminary 2013 Homeless Count and Subpopulation Survey Responses obtained
Part A: Point-in-Time Census of Homeless Residents. Part B: Youth Homeless Count. Part C: Public School Students and their Families.
 A HOME FOR EVERYONE Whatcom County Coalition to End Homelessness 2018 Annual Report Part A: Point-in-Time Census of Homeless Residents Part B: Youth Homeless Count Part C: Public School Students and their
The City of Long Beach 2004 Homeless Assessment
 The City of Long Beach 24 Homeless Assessment Table of Contents A. Executive Summary... 1 B. Introduction... 1 C. The City of Long Beach 23 Homeless Count... 11 1. Summary... 11 a. Total Number of Homeless
PERSONAL HISTORY. Name: First Middle Last Mailing Address: Phone # ( ) - Can we leave you a detailed message at this number?
 - Can we leave you a detailed message at this number?") Please fax application to: If you have any questions: Katherine s House 253.856.7948 Gretchen Marshall 253.508.2755 Rita s House 253.833.1044 Jo Cherland 253.797.7189 PERSONAL HISTORY Name: First Middle
Please fax application to: If you have any questions: Katherine s House 253.856.7948 Gretchen Marshall 253.508.2755 Rita s House 253.833.1044 Jo Cherland 253.797.7189 PERSONAL HISTORY Name: First Middle
About Homelessness By ReadWorks
 About Homelessness About Homelessness By ReadWorks Homelessness is an issue that affects people of every age and from every country. If you walk down the street in many big cities in the United States,
2006 Homeless adults and children in Minnesota statewide survey Physical and sexual abuse
 BACKGROUND AND NOTES ON THE 2006 TABLES FOR ADULTS WITH OR WITHOUT CHILDREN These tables provide detailed survey results from the October 2006 Statewide survey of people without permanent shelter. The
SONOMA COUNTY HOMELESS. POINT-IN-TIME CENSUS & SURVEY comprehensive report REPORT PRODUCED BY ASR
 SONOMA COUNTY HOMELESS POINT-IN-TIME CENSUS & SURVEY comprehensive report 2015 REPORT PRODUCED BY ASR ABOUT THE RESEARCHER Applied Survey Research (ASR) is a nonprofit, social research firm dedicated to
State of Iowa Outcomes Monitoring System
 State of Iowa Outcomes Monitoring System THE IOWA CONSORTIUM FOR SUBSTANCE ABUSE RESEARCH AND EVALUATION Year 16 Annual Outcome Evaluation Trend Report November 2014 With Funds Provided By: Iowa Department
2017 Point-In-Time Report
 Seven-County Metro Denver Region Copyright 2017 All Rights Reserved. Permission to use, copy, and distribute this document without fee is herby granted for any educational or non-profit purpose provided
County Department of Social Services. Wilson. Submitted By. Candice Rountree. Program Manager. Address. 100 NE Gold St Wilson, NC United States
 County Department of Social Services Submitted By Title Address Phone Number Email Project Title Category (Please select one) Wilson Candice Rountree Program Manager 100 NE Gold St Wilson, NC 27894 United
2017 Social Service Funding Application Non-Alcohol Funds
 2017 Social Service Funding Application Non-Alcohol Funds Applications for 2017 funding must be complete and submitted electronically to the City Manager s Office at ctoomay@lawrenceks.org by 5:00 pm on
Housing First: Brevard Strategic Plan
 Framework of Services to prevent and Eliminate Homelessness in Brevard Housing First: Brevard 2015-2018 Strategic Plan The Brevard Homeless Coalition s strategic planning statement was modeled on the 2010
Continuum of Care. Public Forum on Homeless Needs February 2, 2012
 Continuum of Care Public Forum on Homeless Needs February 2, 2012 Our Mission The Tarrant County Homeless Coalition provides leadership to prevent and end homelessness leadership Prevent and End Homelessness
COUNTY LEVEL DATA FROM PWB POLLING JEFFERSON COUNTY
 How serious are these issues to Jefferson County residents? Extremely serious Very serious Somewhat serious Not a problem DK/NA High health care costs Too much government spending Lack of affordable housing
2016 Point in Time Count
 2016 Point in Time Count SUMMARY Each January, Contra Costa's Homeless Continuum of Care (CoC) conducts a comprehensive point-intime count of families and individuals experiencing homelessness. The Point
COUNTY LEVEL DATA FROM PWB POLLING BROOMFIELD COUNTY
 How serious are these issues to Broomfield County residents? Extremely serious Very serious Somewhat serious Not a problem DK/NA Too much government spending 24% 1 45% The quality of public schools 7%
Community Profile: Homeless Families in Washtenaw County Krista Dornbusch, Elsa Larson, Jennifer Montgomery, and Georgia Stamatopoulos
 Home less [hohm-lis] noun 1. The homeless, persons who lack permanent housing Community Profile: Homeless Families in Washtenaw County Krista Dornbusch, Elsa Larson, Jennifer Montgomery, and Georgia Stamatopoulos
Table of Contents. 2 P age. Susan G. Komen
 RHODE ISLAND Table of Contents Table of Contents... 2 Introduction... 3 About... 3 Susan G. Komen Affiliate Network... 3 Purpose of the State Community Profile Report... 4 Quantitative Data: Measuring
Introduction. League of California Cities and California State Association of Counties Joint Homelessness Task Force
 Introduction California s 134,278 Homeless by Region 1 The January 2017 point-in-time count 1 found that homelessness in California increased 13.7 percent from 2016 17, making it one of 22 states to see
Dear Haven Applicant: Enclosed you will find The Lake County Haven application. You may mail or fax your completed application to:
 Dear Haven Applicant: Enclosed you will find The Lake County Haven application. You may mail or fax your completed application to: The Lake County Haven P.O. Box 127 Libertyville, IL 60048 Fax: 847-680-4360
Administration: Assessor Information First Name: Last Name: Survey Date:
 Administration: Assessor Information First Name: Last Name: Survey Date: Agency: Email: Survey Time: Survey Location: Opening Script Hello, my name is [interviewer name] and I work for [organization name].
An APA Report: Executive Summary of The Behavioral Health Care Needs of Rural Women
 1 Executive Summary Of The Behavioral Health Care Needs of Rural Women The Report Of The Rural Women s Work Group and the Committee on Rural Health Of the American Psychological Association Full Report
(Weighted sample of 98 respondents) How serious are these issues to Boulder residents? Extremely serious Very serious Somewhat serious 38% 44% 31%
 How serious are these issues to Boulder residents? Extremely serious Very serious Somewhat serious 38% 44% 31%") Perspectives on Homelessness in the Denver Metro Area Public opinion survey conducted for The Denver Foundation by Fairbank, Maslin, Maullin, Metz & Associates and Public Opinion Strategies January 14-22,
Perspectives on Homelessness in the Denver Metro Area Public opinion survey conducted for The Denver Foundation by Fairbank, Maslin, Maullin, Metz & Associates and Public Opinion Strategies January 14-22,
2010 Community Health Needs Assessment Final Report
 2010 Community Health Needs Assessment Final Report April 2011 TABLE OF CONTENTS A. BACKGROUND 3 B. DEMOGRAPHICS 4 C. GENERAL HEALTH STATUS 10 D. ACCESS TO CARE 11 E. DIABETES 12 F. HYPERTENSION AWARENESS
Chapter 4: RENTAL HOUSING PROGRAMS FOR THE LOWEST INCOME HOUSEHOLDS
 Chapter 4: RENTAL HOUSING PROGRAMS FOR THE LOWEST INCOME HOUSEHOLDS Homeless Assistance: McKinney-Vento Homeless Assistance Programs By Mindy Mitchell, Program and Policy Analyst, National Alliance to
A Conversation About Homelessness was held at Washington State University
 Conversation about Homelessness Washington State University Vancouver April 11, 2017 A Conversation About Homelessness was held at Washington State University Vancouver, in Vancouver, WA, on April 11th,
2017 SOUTHERN NEVADA HOMELESS CENSUS & SURVEY COMPREHENSIVE REPORT
 ACKNOWLEDGEMENTS The success of this endeavor is the result of a convergence of considerable talents and efforts of a dedicated team of individuals. Clark County Social Service (CCSS) and Bitfocus, Inc.,
Home and Community Based Services (HCBS)
") To Whom It May Concern: To be considered for membership, the following must be submitted: 1. A Fountain House Membership Application and supplementary substance abuse questionnaire (included at the end
To Whom It May Concern: To be considered for membership, the following must be submitted: 1. A Fountain House Membership Application and supplementary substance abuse questionnaire (included at the end
2012 HOMELESS Point in Time COUNT Red Deer. Red Deer Point In Time [PIT] Homeless Count 2012
![2012 HOMELESS Point in Time COUNT Red Deer. Red Deer Point In Time [PIT] Homeless Count 2012](/thumbs/90/103257452.jpg "2012 HOMELESS Point in Time COUNT Red Deer. Red Deer Point In Time [PIT] Homeless Count 2012") 2012 HOMELESS Point in Time COUNT Red Deer Red Deer Point In Time [PIT] Homeless Count 2012 FINAL REPORT NOVEMBER 30, 2012 CONTENTS 1 Overview...2 1.1 Key Findings...3 2 PIT Count Background...4 2.1 The
2012 HOMELESS Point in Time COUNT Red Deer Red Deer Point In Time [PIT] Homeless Count 2012 FINAL REPORT NOVEMBER 30, 2012 CONTENTS 1 Overview...2 1.1 Key Findings...3 2 PIT Count Background...4 2.1 The
EXECUTIVE SUMMARY. Findings:
 Samaritan Center and Rescue Mission Participant Satisfaction Survey Housing and Homeless Coalition of Syracuse & Onondaga County By Patrick Whelan April 2016 EXECUTIVE SUMMARY Introduction: This study
Community Health Status Assessment
 Community Health Status Assessment EXECUTIVE SUMMARY The Community Health Status Assessment (CHSA) is one of four assessments completed as part of the 2015-2016 Lane County Community Health Needs Assessment
HOMELESSNESS IN TULARE COUNTY
 HOMELESSNESS IN TULARE COUNTY WHAT DO WE DO? Streets or place not meant for human habitation UNSHELTERED Sleeping in an emergency shelter or transitional housing program (HUD's Definition) SHELTERED Couch
Unaccompanied Homeless Youth. Presenter: Andrew Hammontree OASFAA Conference April 13, 2016
 Unaccompanied Homeless Youth Presenter: Andrew Hammontree ahammontree@francistuttle.edu OASFAA Conference April 13, 2016 Resources 2015 FSA Conference Session 23 Session 38 Application and Verification
Table of Contents. 2 P a g e. Susan G. Komen
 NEW HAMPSHIRE Table of Contents Table of Contents... 2 Introduction... 3 About... 3 Susan G. Komen Affiliate Network... 3 Purpose of the State Community Profile Report... 4 Quantitative Data: Measuring
C A LIFORNIA HEALTHCARE FOUNDATION. Drilling Down: Access, Affordability, and Consumer Perceptions in Adult Dental Health
 C A LIFORNIA HEALTHCARE FOUNDATION s n a p s h o t Drilling Down: Access, Affordability, and Consumer Perceptions in 2008 Introduction Although many Californians have dental insurance, even those with
The Impact of Homelessness on Students. Jon Bridges. Northwest Christian University
 THE IMPACT OF HOMELESSNESS ON STUDENTS 1 The Impact of Homelessness on Students Jon Bridges Northwest Christian University THE IMPACT OF HOMELESSNESS ON STUDENTS 2 The Impact of Homelessness on Students