Part A: Point-in-Time Census of Homeless Residents. Part B: Youth Homeless Count. Part C: Public School Students and their Families.
|
|
|
- Diane Jefferson
- 5 years ago
- Views:
Transcription
1 A HOME FOR EVERYONE Whatcom County Coalition to End Homelessness 2018 Annual Report Part A: Point-in-Time Census of Homeless Residents Part B: Youth Homeless Count Part C: Public School Students and their Families June 2018 Sponsored by: Whatcom County Health Department City of Bellingham Whatcom County Coalition to End Homelessness Whatcom Homeless Service Center at Opportunity Council
2 For more information about Whatcom County s Homeless Point-in-Time Count, this annual report, or our community s 10-Year Plan to End Homelessness, please contact: Barbara Johnson-Vinna, Housing Specialist, Whatcom County Health Department (360) BJJohnso@co.whatcom.wa.us Or Michael Parker, Director, Whatcom Homeless Service Center (360) michael_parker@whatcomhsc.org

3 1 Table of Contents Executive Summary... 2 Acknowledgments... 6 Part A: Point-in-Time Census of Homeless Residents... 7 Introduction... 8 Number of homeless individuals and families in Whatcom County Characteristics of homeless persons and families Sheltered and unsheltered...12 Household size and family status Age and gender Disabling conditions Race.21 Characteristics of homelessness in Whatcom County Geographic distribution: location of previous residence Sources of shelter Reasons for Homelessness Sources of income Community re-entry Chronic homelessness Persistance of Homelessness Homeless Veterans Part B: Youth Count! Part C: Homelessness of Public School Students Appendix A: Homeless count methodology... 42
4 Executive Summary Introduction On January 25 th, 2018, volunteers and homeless housing providers counted 815 people as experiencing homelessness in Whatcom County during the annual Point in Time Count. Additionally, hundreds more are known to be at risk of losing their homes and becoming homeless throughout the year in Whatcom County, due to lack of economic opportunity, family break up, mental illness, addiction, and domestic violence. People released from in-patient settings, including psychiatric hospitalization, treatment, and incarceration, face extremely challenging community re-entry issues. The supply of affordable housing has not kept pace with our population growth, and we continue to experience record low vacancy rates near the 1% range in Whatcom County, creating additional barriers. This annual report provides historical and recent data from the PIT Count, along with other relevant data, which helps guide our work in reducing and ending homelessness, informs our community about the current face of homelessness locally, and provides a year by year comparison on local trends of homelessness. The 2018 Homeless Count This year, 58 volunteers participated in the Whatcom County Point in Time Count, which occurred on January 25 th throughout the nation. Key observations from this years Count include: fantastic support from the Lummi Nation, and the critical support provided once again by the Homeless Outreach Team with surveying unsheltered households and those in camps. These efforts, combined with those of so many other volunteers, tend to improve our reach year after year. However, as you read this report, please keep in mind that Point in Time Counts generally underestimate the number of those who are homeless because: A point-in-time is just a snapshot and may not capture all those who are cycling in and out of homelessness over the course of a year. It is difficult to find where all of the unsheltered people reside. It is impossible to know all the places that might provide unconventional shelter (i.e. tents, abandoned cars) for one night. Participation in the PIT count is voluntary and a small number of households decline to complete the survey How many are homeless? This year we counted: 815 homeless persons (a person may be part of a family household, or an unaccompanied individual) 572 homeless households (a household may include one or more persons) 384 persons reported being unsheltered Who are the people experiencing homelessness? The 2018 homeless population is as diverse as the larger community population with complex barriers and incredible resiliency: They are old and young, diverse in gender identification, unaccompanied individuals, and families with children. Some are residing in sheltered settings, while others are, literally, without a roof over their heads. Of those counted this year: 76% of homeless households included only one person 2
5 There were 68 families with children that included 241 persons; the median 1 family size was 4 persons 15.3% of homeless households identify as Native American which is in disparate proportion to comprising 2.8% of Whatcom County residents in the last census In terms of age and identified gender: 44% of all homeless persons identified as female Ages ranged from less than one year old to 77 years old Median age of all homeless persons was 37 years Median age of unaccompanied homeless persons was 47 years Homeless Youth Homelessness among youth may result from family problems, economic problems, and residential instability. Some youth become homeless with their families; others leave home after years of physical and sexual abuse, strained relationships, parental neglect, addiction of a family member, or their own substance use disorder. The following statistics are for youth we encountered in 2018 who are literally homeless. 150 persons under 18 years old were counted, or 18% of all homeless persons 12% of all homeless persons were less than 10 years old 42 persons counted were 16 to 21 years old 69 persons were 16 to 24 years old 4 homeless minors (age 13-17) were unaccompanied This year, we also conducted a special count of homeless youth that included minors and young adults ages 18 to 24 who were either literally homeless or unstably housed (e.g. couch surfing with friends or relatives to prevent becoming literally homeless). This special youth count was conducted at the same time as the larger count. In this special count we encountered: 46 youth households 4 unaccompanied minors (all who were homeless staying in emergency shelter) 6 young adult families with children 24% of young adult households were unsheltered 13% of youth had a self-reported mental health disability 35% of youth identify as lesbian, gay, bisexual, transgender, or queer Community Re-Entry from Institutions Homeless Count survey respondents were asked if they had been discharged from an institution within the last six months. Altogether, 142 (25%) household respondents said they had been released from jail or prison, inpatient substance use disorder treatment, mental health treatment, or juvenile detention in the last six months. 19% of household respondents had been released from jail or prison (n=106) 5% had been released from inpatient substance use disorder treatment (n=31) 7% had been released from a psychiatric hospital (n=39) Less than 1% had been released from juvenile detention (N=2) 1 The median value is, essentially, the midpoint. Specifically, in a group of measurements (e.g. family size, age) arranged from lowest to highest, the median is the middle value if the number of measurements is odd. If the number of measurements is even, the median is the average of the two middle values. 3
6 Shelter Homeless survey respondent households told us where they had slept the previous night: 24% in transitional housing (n=138) 27% in emergency shelter 2 (n=156) 29% out of doors (n=164) 3% in a vehicle (n=16) 3% in a RV/boat lacking basic amenities (n=16) 1% in an abandoned building (n=4) Chronic Homelessness Based on HUD s definition of chronic homelessness, 174 unaccompanied persons reported information indicating they were experiencing chronic homelessness. Our Homeless Outreach Team was again invaluable in obtaining this information; however, many survey respondents did not supply enough information to determine whether or not they met all of the HUD chronic homelessness characteristics. Nevertheless, it is a slight increase from 2008 when 158 people experiencing chronic homelessness were counted. 3 To be considered chronically homeless based on HUD s definition, a person must be an unaccompanied individual who has been homeless for 12 months or more OR has had four or more episodes of homelessness in the last three years AND those episodes must total 12 months, AND has been sleeping in a place not meant for human habitation OR in emergency shelter, AND has one of the following disabling conditions (mental disorder, substance use disorder, permanent physical or developmental disability). The number (and percent) of 572 counted households with any of the HUD characteristics of chronic homelessness include: 436 (76%) unaccompanied, single individuals 251 (44%) who had been homeless for 12 months or more 165 (29%) who have had four or more episodes of homelessness in the last three years AND those episodes total at least 12 months 398 (70%) households including a person with a disabling condition 434 (76%) who slept in a place not meant for human habitation or in emergency shelter Homeless Housing System While it is beyond the scope of a Point in Time Count report to comprehensively cover the robust and coordinated homeless housing system in Whatcom County, the following are important statistics for families who received a housing intervention in 2017 and who would have been otherwise homeless. The following families would have been homeless but for the rental assistance and supportive services our community undertakes with our housing system: 1808 households received housing assistance through the Whatcom Homeless Service Center and its partners 451 households received assistance to prevent an eviction, thus avoiding homelessness 538 households were sheltered with emergency assistance (e.g. family receiving a motel voucher), frequently as a bridge to a more permanent housing situation. (this does not include those households staying at the Lighthouse Mission emergency shelter) 2799 individuals were assisted in 2017 with shelter and/or housing Without the efforts of the staff at partner agencies and the resources from our local, state, and federal funders, these households would also face homelessness. Partners include: Bellingham Housing 2 Emergency shelter includes 6 households who stayed in a motel using an emergency assistance voucher. 3 Due to a counting error in 2008, the published report that year reported that only 113 persons were considered to be chronically homeless by HUD s definition; however, only unsheltered persons were included in that calculation. Instead, we should have also included persons in emergency shelter who also meet the other criteria. The correct number of chronically homeless persons in 2008 is actually
7 Authority, Catholic Community Services, DVSAS, Interfaith Coalition, Lighthouse Mission, Lydia Place, Northwest Youth Services, Opportunity Council, Pioneer Human Services, Sun Community Services, and the YWCA. Trends Compared to the baseline year of 2008 when our community began implementing the 10 Year Plan to End Homelessness, the number of people counted in 2018 that were literally homeless decreased by 4%. One area of particular improvement is the 33% decrease in homeless families with children since our baseline year. Our community has made significant investments in housing for families with children, helping drive this number down. Additionally, the number of homeless veterans decreased by 36% reflecting another group with whom our system has made progress. Unfortunately, our community saw a spike in the number of Chronically Homeless individuals, which has increased by 9% since 2008, despite added resources during that time period. The number of persons who were homeless and re-entering the community from jail, prison, psychiatric hospitals, inpatient substance use disorder treatment, and juvenile detention again increased this year to 25% compared to last year s 14%. Despite the modest improvement in the number of people from certain subpopulations we encountered in 2018 compared to our baseline year of 2008, notably families and veterans, this year s count showed an increase in the percent of people encountered who are unsheltered. Seniors continue to increase with 25% of individuals 55 or older highlighting the disparate impact of rising rents on seniors in our community. This is the sixth year we can report the proportion of people we encountered who were also encountered in previous homeless counts. Altogether, 19% of the homeless households we encountered in 2018 were also encountered in 2017; 10% were also encountered in 2016, 7% were also encountered in 2015, 4% were also encountered in 2014; 4% were also encountered in 2013; and 2% were also encountered in In other words, 7% of the homeless households we encountered in 2015 have been continuously homeless for at least three years, OR, they have been housed and become homeless again during that time interval. 5
8 Acknowledgments Counting people who are experiencing homelessness for the annual Point-in-Time Count is not an easy task. Successful PIT Counts in Whatcom County are made possible because of the commitment from the service organizations, community volunteers, and members of the Whatcom County Coalition to End Homelessness. This year was no exception; an overwhelming number of individuals and organizations assisted with the 2018 PIT count. Thank you to all of you who gave your time and effort. Finally, we would like to extend a special thank you to the individuals and families who responded to this year's PIT Count survey. We understand that we are asking you some difficult questions and to share a part of your very personal story. Without this information, we would know very little about the complexities of homelessness, or how we, as a community, should respond. Your assistance can help us perform better at our work in ending homelessness in Whatcom County. 6
9 Part A: Point-in-Time Census of Homeless Residents 7
10 Introduction At any point in time, at least 815 people in Whatcom County are homeless. Throughout the year, hundreds more face the prospect of losing their homes due to economic reasons, domestic violence, family break up, loss of employment, and mental illness. Hundreds of students in our schools have unstable housing; as a result, their academic performance may suffer and they are likely to have lasting impacts from this adverse childhood experience. People released from psychiatric hospitalization and incarceration face challenging community re-entry issues. Furthermore, slow economic recovery, stagnant wage growth, extremely slow pace of affordable rental housing development, low rental vacancies, source of income discrimination, and rapidly increasing rent prices are all factors that increase the risk of people losing their housing, and make it increasingly difficult for people who become homeless to return to a stable, permanent housing situation. Report format. This marks the tenth year of our community s efforts to implement its 10- Year Plan to End Homelessness. This year we are using this reporting opportunity for three purposes, each embodied in a separate section of the report: Part A: Point-in-Time Count Homeless Census contains the results of our annual census of individuals and families who are, literally, homeless. In the past, these estimates attempted to combine data from single, point-in-time estimates of people who are by definition homeless, with data from the public schools. Public school data uses a very different definition of homelessness, and cumulative, rather than point-in-time estimates. Part A of this report is consistent and comparable with past years methods to measure people who are literally homeless at a single point in time. Part C of this report provides a separate description of homelessness in the schools using the public school system s definition of homelessness and their cumulative, quantitative estimates of the number of homeless students in Whatcom County schools. Part B: Youth Homeless Count describes the results of a focused effort during our regular point-in-time count to locate youth and young adults under 25 years old who are either literally homeless or who have unstable housing and are at risk of becoming literally homeless. Part C: Homelessness of Public School Students contains cumulative estimates of public school students who are unaccompanied, or part of families who are either experiencing a housing crisis or are literally homeless, over the course of a complete school year. The data comes from school district homeless liaison staff that help students and their families experiencing a housing crisis. Homeless liaisons report data to the Office of the Superintendent of Public Instruction (OSPI). The Point-in-Time Homeless Count The Point-in-Time Count is a census of homeless persons. It is conducted over a very short period of time to reduce the chance of counting people twice. The Count is sponsored by the Whatcom County Homeless Coalition, Whatcom County Health Department, and the Whatcom Homeless Service Center and the Opportunity Council. This year more than 40 agencies participated in the count, which occurred on January 25. Homeless census data derived from this count is useful for characterizing the homeless population in our community. Knowing approximately how many families with children, unaccompanied youth, and unsheltered veterans to use just a few subgroup examples 8
11 helps Homeless Coalition members plan for homeless services and measure progress toward goals. The Count is also required by Washington State and federal laws as a condition of receiving financial assistance to fund homeless services. Point-in-time count limitations National research indicates that Point-in-Time Counts generally underestimate the number of those who are homeless because: Participation is, with good reason, voluntary, and people can choose not to be counted. Additionally, immigrants, even those with legal status, may consciously avoid participating out of concerns of reprisal. A point-in-time is just a snapshot and may not capture all those who are cycling in and out of homelessness over the course of a specific period of time (e.g. annually). Furthermore, an annual snapshot may miss any seasonal fluctuations that may occur in our communities. It is difficult to find where all the unsheltered people reside. It is impossible to know all the places that might provide unconventional shelter (i.e. tents, abandoned cars) for one night. 9
12 Number of Homeless Individuals and Families in Whatcom County At a single point in time in late January 2018, a total of 815 persons were homeless in Whatcom County. They were members of 572 households. For the purpose of this homeless count, households were divided into two categories: sheltered and unsheltered individuals and families. Sheltered homeless persons stayed in emergency shelter or in transitional housing on the night before the Count. Unsheltered persons stayed outdoors, in cars, or other places not meant for habitation on the night before the Count. Overall, there has been a 4% decrease in the number of homeless persons since 2008 and a 13% increase in homeless households. However, the year-over-year change between 2017 and 2018 was a 10% increase in homeless persons encountered (from 742 homeless persons in 2017 to 815 homeless persons in 2018). The year-over-year change in number of homeless households was an increase of 10% (from 520 homeless households in 2017 to 572 in 2018). 10
13 Overall, there has been a 33% decrease in the number of homeless families with children since The year-over-year change between 2017 and 2018 was a decrease of 28%, from 94 families in 2017 to 68 families in As stated in this report, this number is based on self-report, and custody status of children is not verified. For comparison, there were approximately 15 families in the Coordinated Entry system waiting for housing with 17 families engaged in diversion case management at the Opportunity Council. 11

14 Characteristics of Homeless Persons and Families Un-sheltered and Sheltered Homeless Persons and Families A key measure in the PIT count is the number of unsheltered individuals. Of the 815 persons counted this year, 384 were unsheltered, which includes those in camps, cars, and places not meant for human habitation. The table below shows this breakdown since the beginning of Whatcom PIT counts, and this year represents the highest number (384) and percent (47%) of unsheltered persons compared to the total. This troubling statistic highlights need for immediate shelter and greater investments in permanent housing. 12
15 Household Size and Family Status Of the 572 homeless households counted, 436 (76%) were unaccompanied persons. There were 68 (12%) family households with no children. A total of 68 (12%) families with children were counted, most of whom (44) were single-parent families; 24 (4%) families had both parents present. Four unaccompanied minors were encountered this year. 13

16 Compared to last year, similar proportions of households without children were unsheltered this year. For example, 47% of unaccompanied adult households were unsheltered which is similar to the 51% in For families with children, the proportion of unsheltered was slightly higher this year compared to last year for two parent and single parent households, (18% this year for single parents, compared to 12% in 2017 and 33% of two parent households compared to 24% in 2017). The tables following show this breakdown in previous years. 14

17 *the graphs above do not include the seven unaccompanied homeless minors. 15
18 Homeless Households by Family Type and Housing Status (2014) Emergency Shelter Transitional Housing Unsheltered 70% 53% 50% 48% 31% 17% 30% 20% 30% 21% 26% 4% Single Parent Two Parents Unaccompanied adults Adults No Children Homeless Households by Family Type and Housing Status (2013) Emergency Shelter Transitional Housing Unsheltered 59% 57% 56% 43% 30% 29% 36% 29% 21% 11% 14% 15% Single Parent Two Parents Unaccompanied adults Adults No Children 16
19 Homeless Households by Family Type and Housing Status (2012) 94% 61% Emergency Shelter Transitional Housing Unsheltered 50% 44% 36% 31% 17% 22% 14% 25% 6% 0% Single Parent Two Parents Unaccompanied adults Adults No Children 17
20 Age and Gender Homeless persons were almost evenly divided between persons who identified as males (54%) and identified as females (44%). Ages ranged from less than one year old to 77 years old. The median age of all homeless persons was 37 years. 12% of all homeless persons this year were children under 10 years old, and 18% were under 18 years old. The median age of unaccompanied homeless persons was 47 years, two years older than Four unaccompanied minors were encountered during this year s Count. Almost half (46%) of unaccompanied homeless persons were in the years age range. 18
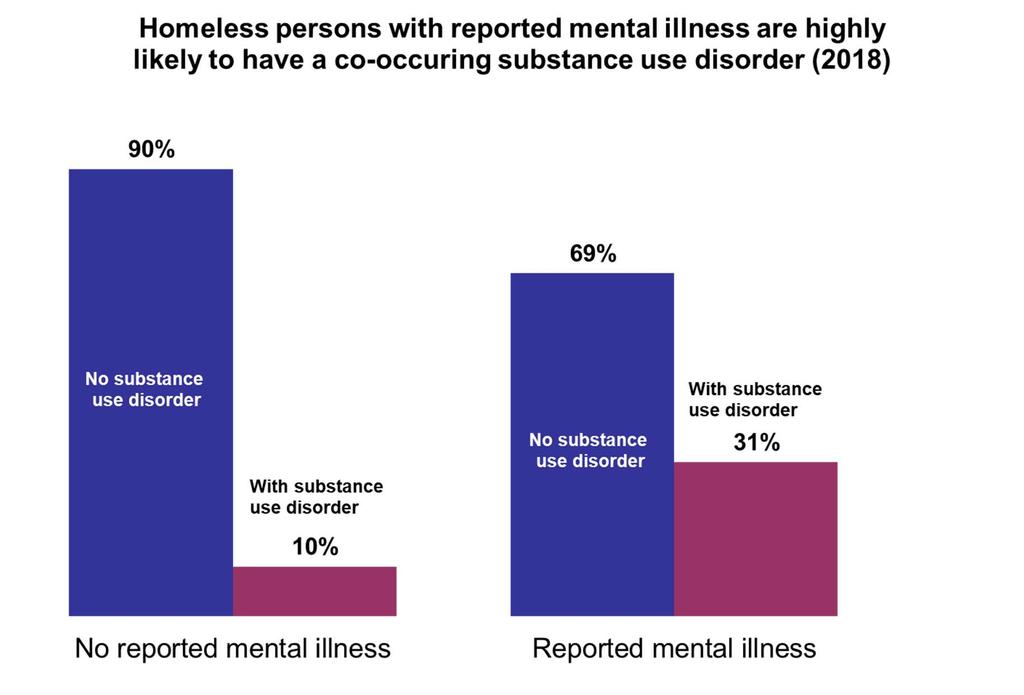
, permanent physical disabilities (22%), chronic illness (17%), substance use disorders (15%), and developmental disability (6%).")
21 Disabling Conditions Homeless count survey respondents were asked to list which of five disabilities applied to each member of their household. The most prevalent disabling conditions were mental illness (33%), permanent physical disabilities (22%), chronic illness (17%), substance use disorders (15%), and developmental disability (6%). It should be emphasized that the data below on prevalence of disabling conditions is based on self-reporting. Due to the stigma of mental illness and substance abuse, these conditions are almost certainly under-reported. Additional analyses showed that a substantial number of homeless persons face the challenges of co-occurring disorders. About 1 in 4 (31%) persons who reported having a mental illness also reported having a substance use disorder. 19
22 20
23 Race and Ethnicity Homeless count survey respondents were asked to list which race or races they identified with. People can select multiple races, and they are shown on the below graph as multiracial. Homelessness is not experienced at a uniform rate and persons of color experience rates of homelessness in greater numbers than their white neighbors. This is consistent with other Census data in the American Survey which shows households of color in higher rates of poverty than white-identified households. 21
24 Characteristics of Homelessness in Whatcom County 67% of the counted homeless persons had their last episode of stable housing in Whatcom County. Geographic Distribution: Location of Previous Residence About two-thirds of homeless households had their last stable housing in Whatcom County. That statistic has been fairly stable since before our community began major new investments toward ending homelessness. Some people think that adding more housing services will attract homeless people from other locales, but the data does not support that assumption. About three quarters of households (72%) who reported that their last stable housing was in Whatcom County said they had previously lived in Bellingham. The next most frequent locations were Ferndale, Lynden, Maple Falls, Blaine, and Everson. 22
 of homeless households were unsheltered.")
25 Sources of Shelter In 2018, just over half (51%) of all homeless households were sheltered; 27% stayed in emergency shelter, which might have been a motel if they were receiving a voucher or financial assistance to stay there, and 24% were living in transitional housing. Just less than half (49%) of homeless households were unsheltered. They stayed the night before the Count out of doors (29%), in a vehicle (16%), in a RV or boat lacking access amenities such as water or power (3%), or in an abandoned building (<1%). Compared to 2008, this year s count of unsheltered households was up 96%. Compared to 2017, the number of unsheltered households encountered increased by 16% in this 2018 Count. 23
26 Reasons for Homelessness Homelessness results from a complex set of circumstances that require people to choose between food, shelter and other needs. In fact 28% of respondents to this year s homeless count reported three or more reasons for their homelessness. The top factors people reported this year were eviction or loss of housing (44%), job loss or unemployment (36%), physical health or disability (27%), alcohol or drug use (23%). Domestic violence, family rejection, and lack of job training/unable to work remain leading causes (18%). While there is no single cause of homelessness, poverty, lack of decent and affordable housing, mental illness, substance abuse, physical disability and other life challenges all contribute to the risk for homelessness. Evidence suggests that poverty, coupled with one or more disabilities, creates the highest risk for homelessness. Mental illness, alcoholism, and substance abuse generally do not lead to homelessness for middle- or higher-income persons, as they tend to have access to financial resources and familial support. For impoverished individuals struggling with disabilities, however, the risk of homelessness is significant. 4 4 From Dutchess County Ten-Year Plan to End Homelessness,. Dutchess County, New York
27 Sources of Income One in four (23%) of homeless households reported having no income at all. The most common income sources reported by homeless households in 2018 were SSI (39%) and Medicare/Medicaid (28%). Only 14% of households reported income from any type of employment. Medicare/Medicaid do not provide cash payments for families, but represent a valuable benefit nonetheless. 25
28 Community Re-entry Homeless count survey respondents were asked if they had recently re-entered the community after being discharged from a residential institution within the last six months. Altogether, 142 (or 25% of all homeless households) said someone in their household had recently re-entered the community after release from jail or prison, inpatient substance abuse, psychiatric hospital, or from juvenile detention. Compared to our base year of 2008, this is a 42% increase in the number of homeless re-entry cases. Compared to last year, there were increases in homeless re-entry from jail or prison, inpatient substance abuse treatment, psychiatric hospital, and juvenile detention. NOTE: A few respondents had been released recently from multiple types of institutions, so simply adding up the number of releases for any given year will not accurately count the number of persons represented. For example, in 2018, 142 persons had a total of 123 releases ( = 178) 26
29 Chronic Homelessness Based on HUD s definition as noted below, 174 unaccompanied households, or 30% of all 572 homeless households, were chronically homeless. This is a 9% increase from our baseline year of 2008 underscoring the great need for additional resources to make progress for this highly vulnerable group. Over the years, we have improved our ability to gather information on disability status; however it is not possible to definitively determine chronic homelessness status from the survey. Skyrocketing rental prices have created an extremely tight rental market which forces many of our community members to wait longer for housing, in part creating this increase. To be considered chronically homeless based on HUD s definition, a person must be an unaccompanied individual who has been homeless for 12 months or more OR has had more than four episodes of homelessness in the last three years AND those episodes must total 12 months AND has been sleeping in a place not meant for human habitation or in emergency shelter, AND has one of the following disabling conditions (mental disorder, substance use disorder, permanent physical, or developmental disability). 27
30 Persistence of Homelessness Altogether, 19% of the homeless households we encountered in 2018 were also encountered in 2017; 10% were also encountered in 2016; 7% were also encountered in 2015; 4% were also encountered in 2014, 4% were also encountered in 2013 and 2% were also encountered in In other words, 7% of homeless households encountered in 2015 have been continuously homeless for at least three years, OR, they have been housed and become homeless again during that time interval. Unfortunately, as people wait longer for housing, their vulnerability increases and their physical and mental health tend to decline, as evidenced by worsening scores in vulnerability assessments by our Coordinated Entry System. 28
31 Homeless Veterans Over the past six years, nonprofit service providers, the Veteran s Administration, and Whatcom County government have devoted an unprecedented effort toward ending homelessness among local Veterans. Yet we still face an uphill battle. Since 2008, the number of chronically homeless Veterans encountered during the annual homeless census has decreased by 36%. This year we encountered 53 homeless Veterans in 52 households (one household included two Veterans); 27 of these Veterans were unsheltered, and 27 were chronically homeless. Additional resources are necessary to provide housing and wrap-around services for our community members who served our country yet cannot afford housing. 29
32 Part B: Youth Count!

33 2018 Whatcom County Annual Homelessness Report Point-in-Time Homeless Count A Special Focus to Develop a Better Understanding of Youth Homelessness The U.S. Interagency Council on Homelessness (USICH) and the Departments of Housing and Urban Development (HUD), Health and Human Services (HHS), and Education (ED), launched Youth Count!, an interagency initiative to develop promising strategies for counting unaccompanied homeless youth, up to 24-years-old, through innovative implementations of HUD s 2013 Point-in-Time (PIT) count. The Youth Count! Initiative was developed per a recommendation from the national framework for ending youth homelessness. We chose to continue this effort in Whatcom County in 2018 as we continue to learn more about the phenomenon of youth homelessness. The Youth Count for Whatcom County was similar to the regular Point in Time count in the way volunteers were recruited and how the count training was structured. However, the Youth Count differed in other ways: a specialized youth-focused interview form was used; focused training on LGTBQ and youth homeless was delivered; and outreach was targeted to locations where youth were likely to be camping. Unlike our regular Point-in-Time Count, for the Youth Count we included youth who are in unstable, doubled-up situations to prevent becoming literally homeless. Sources of Shelter for Youth Households Types of Youth Count Households All young people aged who were not dependents or otherwise associated with another family household were included in the Youth Count. Altogether, we encountered 46 youth households; 4 of them consisted of minors (under 18 years old) with no adults in the household, and 42 had a young adult (aged 18-24) as head of household.
34 Most of these households (38 of 46) were single, unaccompanied individuals; 6 households were families with children, and two youth households consisted of families without children (e.g. couples). Within these 46 households were 57 persons, over half of whom (38) were single, unaccompanied individuals. There were 7 young adults (ages 18-24) in families with children; and 8 children who were part of those families. Total Youth Count of unaccompanied youth households age Minor heads of household 4 Young adult heads of household 42 Total Household type 46 Families with children 6 Families without children 2 Single, unaccompanied households 38 Total Youth Count number of persons 57 Young adults in families with children 7 Children in families with children 8 Persons in families without children 42 Singles 38 Characteristics of Minors and Young Adults Who are not Children of Youth Count Households There were 49 persons counted in Youth Count households who were not children of parenting households. This section describes the characteristics of those persons. Most (45) of the 49 persons were young adults ages 18-24; the rest (4) were minors, under 18 years old. There were more self-identified females (49%) counted than selfidentified males among young adults; 50% of the minors self-identified as male, and 50% refused to identify a gender. 32
 compared to the minors we encountered (0%).")
35 None of the minors were unsheltered (0%), compared to 17% of young adults. Young adults were more likely to be working for income (8%) compared to the minors we encountered (0%). Fourteen percent of young adults had completed high school or a GED. 33

36 Lesbian, gay, bisexual, transgender and queer (LGBTQ) homeless youth make up a disproportionate number of the overall homeless youth population across the nation and that continues to be the case in Whatcom County. Several population-based studies have estimated that three to five percent of youth in the United States are LGBTQ. On the other hand, research suggests that between 20 percent and 40 percent of all homeless youth identify as LGBTQ. The 2018 Whatcom County Youth Count found that 35% of youth who answered the sexual orientation and/or the transgender question identified as LGBTQ. 34
37 2018 Whatcom County Annual Report on Homelessness Homeless Public School Students Part C: Homelessness of Public School Students 35

38 2018 Whatcom County Annual Report on Homelessness Homeless Public School Students Number of Homeless Students in Washington State and Whatcom County Public Schools Beginning in 2004, the U.S. Department of Education required states to report data on homeless children and youth enrolled in all local school districts within their state as part of their Consolidated State Performance Report (CSPR). The following figure shows the increase in the number of homeless students enrolled in Washington State public schools between school years and There was an astounding 97% increase over this period and a year-over-year 3% increase between the last two school years (Note that these figures reflect the definition of homeless children included in Subtitle VII-B of the McKinney-Vento Act 5, a definition that is different than the one used by the homeless Point-in-Time Count). Differences between Homeless Point-in-Time Count and Homeless Students in School data. School districts and the Washington State Office of the Superintendent of Public Instruction (OSPI) report data on homelessness that is different than the countywide annual Point-in-Time (PIT) homeless count in two important respects. First, the Point-in- Time homeless count is a snapshot of homelessness on a single day in the community, whereas the data reported by schools are cumulative over the course of a school year. Second, the PIT Count data include only people who are literally homeless, meaning those people who are unsheltered, in emergency shelter, or in homeless transitional housing. In addition to those three categories, school districts also report as homeless those children who are doubled-up with another family to prevent becoming literally homeless, and youth in temporary foster placements. 5 Individuals who lack a fixed, regular, and adequate nighttime residence including, children and youths who are sharing the housing of other persons due to loss of housing, economic hardship, or a similar reason; are living in motels, hotels, trailer parks, or camping grounds due to the lack of alternative adequate accommodations; are living in emergency or transitional shelters; are abandoned in hospitals; or are awaiting foster care placement; children and youths who have a primary nighttime residence that is a public or private place not designed for or ordinarily used as a regular sleeping accommodation for human beings; children and youths who are living in cars, parks, public spaces, abandoned buildings, substandard housing, bus or train stations, or similar settings; and migratory children who qualify as homeless. 36
39 2018 Whatcom County Annual Report on Homelessness Homeless Public School Students 37
40 2018 Whatcom County Annual Report on Homelessness Homeless Public School Students Whatcom County public school homeless students. The emerging trend in Whatcom County is quite different than that depicted for the state as a whole on the previous page. Here, we observed a significant increase in homelessness among public school students after the school year. Then, during school year the data suggests a return to pre-recession levels. However, a surge in homelessness is evident between school years and , and that surge continued into the school year (the most recent data available at the time of this report). In fact, the total number of homeless students in (981) is greater than the highest level recorded previously in the school year (854). Compared to the previous year ( ), homelessness increased by more than 12% in the schools in Whatcom County. As a percentage of school enrollments, 3.6% of students experienced homelessness during the school year, representing a slight reduction from the high of 3.7% last year. 38
41 2018 Whatcom County Annual Report on Homelessness Homeless Public School Students Public school homeless statistics by district. The charts below show the number of homeless students counted in each school district from to school years. Blaine and Nooksack saw sharp increases in homelessness between and , but then leveled off or declined in subsequent years. However, Nooksack s number of homeless students has been increasing from and again in Blaine reported a big increase last year to 81, very close to the record year of (82). Bellingham followed that same pattern until the most recently reported period between and when homelessness increased 33% from 421 to 559 students. During the school year the number of homeless students was similar to the prior year. Ferndale reported a dramatic increase in homelessness that was not observed in the other districts between the and school years, followed by a significant drop between and This was in turn followed by another sharp increase in The amount of students who experienced homelessness in increased slightly to 150 and sharply declined in to 92. Mount Baker also saw a sharp increase between and , counting 52 students as homeless. Mount Baker s number of homeless students in increased to 81 compared to last year ( ; 68) and set a new district record high count of homeless students. After measuring a steady decline in homeless students from through , Meridian School District exceeded its highest measured homeless student population count with 55 students during the school year. In , 38 students experienced homelessness marking a substantial decrease. This decrease continued in the school year with 27 homeless students. 39
42 2018 Whatcom County Annual Report on Homelessness Homeless Public School Students 40
43 2018 Whatcom County Annual Report on Homelessness Homeless Public School Students Homelessness and academic achievement 6 Basic tenets of the McKinney-Vento Act require school districts to be proactive in identifying homeless students and ensuring their immediate enrollment, even if they lack documents normally required for enrollment. The definition of homeless includes children and youth who lack a fixed, regular, and adequate nighttime residence. Eligible students have the option of continuing to attend their school of origin (if feasible) with transportation provided by the school district upon request, even if they move outside their school of origin s residential zone; or students may transfer to the local attendance area school. These same rights, including the right to immediate enrollment, extend to unaccompanied homeless youth, even if they are unable to provide proof of guardianship. Under the McKinney-Vento Act, states are required to distribute a certain portion of their state s homeless education allocation to school districts through a competitive subgrant process. Subgrant funds are awarded to facilitate the school enrollment, attendance, and success of homeless children and youth. The level of funding for subgrants is based on the needs of the LEAs [Lead Educational Agency] requesting assistance, as well as the quality of their applications. School districts that apply for and receive McKinney-Vento subgrants may use the funds to provide tutoring and supplemental instruction, early childhood education, transportation, school supplies, professional development on homeless education issues for school and district staff, and other services that otherwise may not be provided by the public school program. Homeless children not only have the adversity of poverty, they also must cope with the additional burden of homelessness. They are exposed to a plethora of risk factors which, in turn, can make them vulnerable to academic difficulties. Many research studies have found that homeless students routinely underperform when compared to the general student population. While homelessness is certainly a risk factor for students, there is a broader constellation of risk factors experienced by homeless students and other students living in poverty that some researchers suggest may have a greater effect on student performance. These risk factors include: economic stressors, parental job loss, and parental financial distress; residential mobility; school mobility; crowding; and hunger and poor nutrition. Researchers also underscore the significance of cumulative risk, pointing out that many of the risk factors listed above often co-occur in the lives of homeless children, making it difficult to isolate the effects of each individual risk factor. Despite the difficulty in separating the effects of poverty from those of homelessness, and the mixed results of studies comparing homeless and low-income children, it is clear that homeless children are a particularly vulnerable, heterogeneous subgroup of disadvantaged children who face numerous challenges in achieving academic success. 6 This section is excerpted from: Bowman, Dukes, and Moore Summary of the State of Research on the Relationship Between Homelessness and Academic Achievement Among School-Aged Children and Youth. National Center for Homeless Education, Greensboro, NC. 41
44 2018 Whatcom County Annual Report on Homelessness Appendix A Appendix A: Homeless count methodology 42
45 Methods Overview The Point-in-Time Count relies on numerous volunteers and voluntary participation by many agencies countywide. Essentially, the methodology of the count includes three components: (1) coordination and training, (2) data collection, and (3) data processing. Coordination and training require that all agencies identified as having a role in the County s Continuum of Care be recruited to participate in the count. Participating agencies then receive instructions for that year s count and are given data collection tools most appropriate for their situation (e.g. paper survey forms or online database access for direct data entry). Data collection activities include (1) having clients fill out the survey questionnaires, (2) having volunteer interviewers assist clients with completion of the survey questionnaires, or (3) having agency staff enter client information directly into the online Point-in-Time Count database. In some cases, agency staff will complete paper questionnaires for their clients. This is the sixth year during which we used the statewide Homeless Management Information System (HMIS) to collect data for many homeless individuals who were staying in transitional housing or emergency shelter. Data processing begins when the paper survey questionnaires are delivered to the County s designated data analyst at the Homeless Service Center at the Opportunity Council, or when the data is entered by participating agency staff into the online database. Data from paper forms is added to the online database and then the data is cleaned. Cleaning includes several processes designed to detect data entry errors and identify and remove duplicated survey respondents 7. The cleaned data is then imported into special software to facilitate statistical analysis. Data Assumptions and Limitations National research indicates that Point-in-Time Counts generally underestimate the number of those who are homeless because: A point-in-time is just a snapshot and may not capture all those who are cycling in and out of homelessness over the course of a specific period of time (e.g. annually). Furthermore, an annual snapshot may miss any seasonal fluctuations that may occur in our communities. It is difficult to find where all the unsheltered people reside. It is impossible to know all the places that might provide unconventional shelter (i.e. tents, abandoned cars) for one night. Furthermore, due to survey item nonresponse (when a respondent skips one or more of the Point-in-Time Count survey questions), some of the analyses are based on only a subset of all homeless households counted. 7 Duplicated survey respondents are identified using automated and non-automated processes that rely on unique identifying data derived by combining fields of data such as gender, date of birth and initials. 43
A HOME FOR EVERYONE. Whatcom County Coalition to End Homelessness 2016 Annual Report. Part A: Point-in-Time Census of Homeless Residents
 A HOME FOR EVERYONE Whatcom County Coalition to End Homelessness 2016 Annual Report Part A: Point-in-Time Census of Homeless Residents Part B: Youth Homeless Count Part C: Public School Students and their
A HOME FOR EVERYONE. Whatcom County Coalition to End Homelessness Annual Report. Part A: Point in time census of homeless residents
 A HOME FOR EVERYONE Whatcom County Coalition to End Homelessness Annual Report Part A: Point in time census of homeless residents Part B: Public school students and their families Part C: Description of
Unaccompanied Homeless Youth. Presenter: Andrew Hammontree OASFAA Conference April 13, 2016
 Unaccompanied Homeless Youth Presenter: Andrew Hammontree ahammontree@francistuttle.edu OASFAA Conference April 13, 2016 Resources 2015 FSA Conference Session 23 Session 38 Application and Verification
2015 POINT-IN-TIME COUNT Results. April 2015
 POINT-IN-TIME COUNT Results April SURVEY WEEK OVERIVEW Survey Week was a joint project between the New Mexico Coalition to End Homelessness (NMCEH) and Heading Home. The goals of Survey Week were to conduct
Women + Girls Research Alliance. Homelessness and Rapid Re-Housing in Mecklenburg County
 Women + Girls Research Alliance Homelessness and Rapid Re-Housing in Mecklenburg County Homelessness and Rapid Re-Housing in Mecklenburg County The UNC Charlotte Urban Institute prepared this report in
The Homeless Census & Homeless Point-in-time Survey Summary report Metro Louisville, 2009
 The Homeless Census & Homeless Point-in-time Survey Summary report Metro Louisville, 2009 Prepared by the Coalition for the Homeless 1 Each year, the Coalition for the Homeless prepares two annual counts.
Homeless veterans in Minnesota 2006
 Homeless veterans in Minnesota 2006 Statewide survey of veterans without permanent shelter summary November 2007 Wilder Research Center 1295 Bandana Boulevard North, Suite 210 Saint Paul, Minnesota 55108
2008 Homeless Count Shows Need for Programs in Indianapolis
 I N D I A N A CENTER FOR HEALTH POLICY RESEARCH FOR A HEALTHIER INDIANA JUNE 2008 2008 Homeless Count Shows Need for Programs in Indianapolis In January 2008, a team coordinated by Indiana University s
Homelessness in Fargo, North Dakota and Moorhead, Minnesota. Key findings from the 2015 survey of people experiencing homelessness
 Homelessness in Fargo, North Dakota Key findings from the 2015 survey of people experiencing homelessness S E P T E M B E R 2 0 1 6 Contents Background... 1 Counts on the night of the study... 2 Key findings...
Kitsap County Annual Point-in-Time Count
 Kitsap County Annual Point-in-Time Count 2018 JANUARY 25TH WELCOME! Thank you for joining us, we are excited that you are willing to help us with the Annual Kitsap County Point-in-Time Count. The Point-in-Time
Homeless Leadership Coalition
 Homeless Leadership Coalition Point in Time 2018 Tri-County Results Working Together to Prevent and End Homelessness in Central Oregon June 19.2018 1 We are stronger, healthier, safer communities where
2017 Point-in-Time Training. Welcome & Introductions
 2017 Point-in-Time Training Welcome & Introductions What is Point-in-Time? A collaborative effort to survey people who are experiencing homelessness in our community Photo: seattleu.edu A snapshot of the
New Hampshire Continua of Care. PATH Street Outreach Program Entry Form for HMIS
 Please refer to the 2014 HUD HMIS Data Standards Version 5.1, available on the NH-HMIS website: www.nh-hmis.org for an explanation of the data elements in this form. Date form completed: Outreach worker
MCKINNEY-VENTO HOMELESS EDUCATION ASSISTANCE ACT. Valerie Todacheene, Education Specialist Division of Performance and Accountability
 MCKINNEY-VENTO HOMELESS EDUCATION ASSISTANCE ACT Valerie Todacheene, Education Specialist Division of Performance and Accountability McKinney-Vento Homeless Education Assistance Act The McKinney-Vento
Housing First: Brevard Strategic Plan
 Framework of Services to prevent and Eliminate Homelessness in Brevard Housing First: Brevard 2015-2018 Strategic Plan The Brevard Homeless Coalition s strategic planning statement was modeled on the 2010
2018 POINT IN TIME SURVEY AND TEN YEAR POINT IN TIME ( )
") Capital Area Coalition on Homelessness...to educate and mobilize our community and coordinate services to prevent and reduce homelessness in the Capital Region. 218 POINT IN TIME SURVEY AND TEN YEAR POINT
Capital Area Coalition on Homelessness...to educate and mobilize our community and coordinate services to prevent and reduce homelessness in the Capital Region. 218 POINT IN TIME SURVEY AND TEN YEAR POINT
2017 PIT Summary: Arapahoe County
 A Point-in-Time (PIT) count provides a snapshot of homelessness by interviewing those who are homeless at a particular time. The Metropolitan Denver Homeless Initiative (MDHI) conducted a PIT study of
An Introduction to Southern Nevada's Homeless Continuum of Care and Regional Plan to end homelessness
 An Introduction to Southern Nevada's Homeless Continuum of Care and Regional Plan to end homelessness Today you will leave with An understanding of homelessness in Southern NV An understanding of Help
How Many People Experience Homelessness?
 National Coalition for the Homeless 2201 P. St. NW Washington, DC 20037 Phone: (202) 462-4822 Fax: (202) 462-4823 Email: info@nationalhomeless.org Website: http://www.nationalhomeless.org How Many People
OKLAHOMA COMMISSION ON CHILDREN AND YOUTH OFFICE OF PLANNING AND COORDINATION
 OKLAHOMA COMMISSION ON CHILDREN AND YOUTH OFFICE OF PLANNING AND COORDINATION SB511: OKLAHOMA S HOMELESS CHILDREN AND YOUTH DECEMBER 1, 2015 SB511: Homeless Children and Youth Summary & Recommendations
Homelessness is a complex issue but it is not an unsolvable problem. It can be ended and philanthropy has a vital role to play.
 Homelessness is a complex issue but it is not an unsolvable problem. It can be ended and philanthropy has a vital role to play. People become homeless when they can t find housing they can afford. There
2015 HUD Continuum of Care Program Competition Quick Facts
 Three Overarching Things to know for the 2015 CoC NOFA 1. This is the most competitive NOFA ever. HUD is using this NOFA to implement a strong preference for performance and effective practices that Congress
North Dakota Coalition for Homeless People Statewide Point-in-Time Survey and Study of Homelessness January 25, 2007
 Report on Homelessness in North Dakota 2007 North Dakota Coalition for Homeless People Statewide Point-in-Time Survey and Study of Homelessness January 25, 2007 Acknowledgements The North Dakota Coalition
Greater Lansing Area 2015 Annual Homeless Report
 Greater Lansing Area 2015 Annual Homeless Report Virg Bernero, Mayor The state of homelessness in Ingham County Our mission is to serve the most vulnerable in our community with dignity and respect, valuing
Respond to the following questions for all household members each adult and child. A separate form should be included for each household member.
 HMIS Data Collection Template for Project EXIT CoC Program This form can be used by all CoC-funded project types: Street Outreach, Safe Haven, Transitional Housing, Rapid Rehousing, and Permanent Supportive
Arapahoe County Summary
 Arapahoe County Summary A Point-in-Time (PIT) count provides a snapshot of homelessness by interviewing those who are homeless at a particular time. The Metropolitan Denver Homeless Initiative (MDHI) conducted
Demographics. Households with children: 2,036 respondent households (2,095 total homeless)
") Denver County Summary A Point-in-Time (PIT) count provides a snapshot of homelessness by interviewing those who are homeless at a particular time. The Metropolitan Denver Homeless Initiative (MDHI) conducted
Denver County Summary A Point-in-Time (PIT) count provides a snapshot of homelessness by interviewing those who are homeless at a particular time. The Metropolitan Denver Homeless Initiative (MDHI) conducted
Ending Chronic Homelessness by July 22, 2013 Richard Cho, USICH
 Ending Chronic Homelessness by 2015 July 22, 2013 Richard Cho, USICH Overview Background on chronic homelessness Current progress on goal Community-level actions needed Federal strategy for accelerating
COLORADO STATEWIDE HOMELESS COUNT Summer, 2006 EXECUTIVE SUMMARY
 COLORADO STATEWIDE HOMELESS COUNT Summer, 2006 EXECUTIVE SUMMARY February 2007 Research Conducted by: CENTER FOR EDUCATION POLICY ANALYSIS and CENTER FOR PUBLIC-PRIVATE SECTOR COOPERATION, GRADUATE SCHOOL
Early Childhood Mental Health and Homelessness
 Issue Brief No. 1 September, 2013 Early Childhood Mental Health and Homelessness A Brief Overview of Family Homelessness The United States has the highest number of children who experience homelessness
100-DAY CHALLENGE CASE STUDIES COLUMBUS, OH: CREATING AND UTILIZING A YOUTH BY-NAME LIST
 100-DAY CHALLENGE CASE STUDIES COLUMBUS, OH: CREATING AND UTILIZING A YOUTH BY-NAME LIST Columbus, Ohio developed a by-name list of transitional-age youth (TAY) at-risk of and experiencing homelessness
Service Providers Working Collaboratively to Document the Plight of the Rural Homeless
 Service Providers Working Collaboratively to Document the Plight of the Rural Homeless Heather S. Feldhaus, Director, Center for Community Research and Consulting, Bloomsburg University Rich Kisner, Executive
Continuum of Care. Public Forum on Homeless Needs February 2, 2012
 Continuum of Care Public Forum on Homeless Needs February 2, 2012 Our Mission The Tarrant County Homeless Coalition provides leadership to prevent and end homelessness leadership Prevent and End Homelessness
The Impact of Homelessness on Students. Jon Bridges. Northwest Christian University
 THE IMPACT OF HOMELESSNESS ON STUDENTS 1 The Impact of Homelessness on Students Jon Bridges Northwest Christian University THE IMPACT OF HOMELESSNESS ON STUDENTS 2 The Impact of Homelessness on Students
Memorandum. San Jose AND EDUCATION COMMITTEE RECOMMENDATION
 NSE AGENDA: 08/10/17 ITEM: d(2) CITY OF CT 'S San Jose CAPITAL OF SILICON VALLEY TO: NEIGHBORHOOD SERVICES AND EDUCATION COMMITTEE Memorandum FROM: Jacky Morales-Ferrand RECOMMENDATION It is recommended
REGION 1. Coalition for the HOMELESS Report
 2008 Report On any given night, approximately 500 people face homelessness in our area. Homeless people can be adults, young people, couples, or families with children. They are living without shelter,
Strategic Plan to End Homelessness
 Strategic Plan to End Homelessness Approved 2013, Updated October 2016 Ohio Balance of State Continuum of Care 1 Homelessness in the Ohio BoSCoC When most people imagine what homelessness looks like, they
CoC Plan: Ending Homelessness Together Approved 4/19/2018 by the members of River Valleys Continuum of Care.
 CoC Plan: Ending Homelessness Together 2018-2028 Approved 4/19/2018 by the members of River Valleys Continuum of Care. 1 Homelessness in the River Valleys CoC When most people imagine what homelessness
Albany County Coordinated Entry Assessment version 12, 11/29/16
 Referral Completed by: PRE-SCREENING INFORMATION FOR SHELTER REFERRAL 1. First Name Last Name Date/Time: Other names (including nicknames): 2. Has client previously completed an application for assistance
2013 HOUSING STATUS SURVEY RESULTS. A Report on the Sheltered and Unsheltered Homeless in Billings
 2013 HOUSING STATUS SURVEY RESULTS A Report on the Sheltered and Unsheltered Homeless in Billings HUD Defined Homeless To be counted as homeless under HUD s definition, respondents had to indicate that
RECOMMENDATION PREVIOUS REPORTS PERTINENT TO THIS MATTER
 TO: FROM: SUBJECT: CHAIR AND MEMBERS COMMUNITY AND PROTECTIVE SERVICES COMMITTEE MEETING ON OCTOBER 18, 2016 LYNNE LIVINGSTONE MANAGING DIRECTOR NEIGHBOURHOOD, CHILDREN AND FIRE SERVICES LONDON S HOMELESS
April Prepared for the El Dorado County Human Services Department, Community Services Division By HomeBase / The Center for Common Concerns
 El Dorado County Homeless Count & Survey Results April 2008 Prepared for the El Dorado County Human Services Department, Community Services Division By HomeBase / The Center for Common Concerns HomeBase
County Department of Social Services. Wilson. Submitted By. Candice Rountree. Program Manager. Address. 100 NE Gold St Wilson, NC United States
 County Department of Social Services Submitted By Title Address Phone Number Email Project Title Category (Please select one) Wilson Candice Rountree Program Manager 100 NE Gold St Wilson, NC 27894 United
WHO IS HOMELESS IN WISCONSIN?
 WHO IS HOMELESS IN WISCONSIN? A LOOK AT STATEWIDE DATA ADAM SMITH, DIRECTOR INSTITUTE FOR COMMUNITY ALLIANCES About the Data Sources Data are reported from two origins: Longitudinal: count over time, typically
Hennepin County Project Homeless Connect. Summary of guests served on May 11, 2009
 Hennepin County Project Homeless Connect Summary of guests served on May 11, 2009 A U G U S T 2 0 0 9 Hennepin County Project Homeless Connect Summary of guests served on May 11, 2009 August 2009 Prepared
Administration: Assessor Information First Name: Last Name: Survey Date:
 Administration: Assessor Information First Name: Last Name: Survey Date: Agency: Email: Survey Time: Survey Location: Opening Script Hello, my name is [interviewer name] and I work for [organization name].
GAO HOMELESSNESS. A Common Vocabulary Could Help Agencies Collaborate and Collect More Consistent Data. Report to Congressional Requesters
 GAO United States Government Accountability Office Report to Congressional Requesters June 2010 HOMELESSNESS A Common Vocabulary Could Help Agencies Collaborate and Collect More Consistent Data GAO-10-702
St. Louis County Project Homeless Connect. Summary of guests served on November 5, 2008
 St. Louis County Project Homeless Connect Summary of guests served on November 5, 2008 D E C E M B E R 2 0 0 8 St. Louis County Project Homeless Connect Summary of guests served on November 5, 2008 December
Florida s Children and Youth Cabinet Child Welfare Indicator Workgroup Report. Homeless Children and Youth
 Florida s Children and Youth Cabinet Child Welfare Indicator Workgroup Report Homeless Children and Youth Workgroup Members: Jack Ahearn, Department of Juvenile Justice Lorraine Husum Allen, Department
Community Profile: Homeless Families in Washtenaw County Krista Dornbusch, Elsa Larson, Jennifer Montgomery, and Georgia Stamatopoulos
 Home less [hohm-lis] noun 1. The homeless, persons who lack permanent housing Community Profile: Homeless Families in Washtenaw County Krista Dornbusch, Elsa Larson, Jennifer Montgomery, and Georgia Stamatopoulos
Birmingham Homelessness Prevention Strategy 2017+
 Birmingham Homelessness Prevention Strategy 2017+ 24 August - 5 October 2017 Consultation Summary Birmingham Homelessness Prevention Strategy 2017+ 24 August 5 October 2017 What are we trying to achieve?
DATE: June 1, 2016 REPORT NO. PHSSS Public Health, Safety and Social Services. Manager of Homelessness Services
 DATE: June 1, 2016 REPORT NO. PHSSS2016-72 TO: FROM: PREPARED BY: Chair and Members Social Services Committee Jo Atanas, General Manager Public Health, Safety and Social Services David Miskiw Manager of
NJ s Transitional Housing Initiative
 NJ s Transitional Housing Initiative SARA WALLACH, DOH DHSTS PROGRAM MANAGEMENT OFFICER ANNIE CHEN, ARFC CHIEF OPERATING OFFICER Definition of Homeless person According to the Department of Housing and
Serving Homeless Survivors. Introduce yourselves
 Serving Homeless Survivors Maddie Graves-Wilson Executive Director of Beyond Survival Aberdeen, WA Introduce yourselves 1 Name: Maddie Graves-Wilson State: Washington Likes: Reading, outdoors, Riding quads,
15 th Annual Louisiana State Conference on Homelessness 2008 Ending Homelessness through Recovery, Rebuilding, and Rehousing Agenda and Workshops
 15 th Annual Louisiana State Conference on Homelessness 2008 Ending Homelessness through Recovery, Rebuilding, and Rehousing Agenda and Workshops Monday Dec.1, 8:00-11:00 Service Project (Optional) 8:00-10:00
A Conversation About Homelessness was held at Washington State University
 Conversation about Homelessness Washington State University Vancouver April 11, 2017 A Conversation About Homelessness was held at Washington State University Vancouver, in Vancouver, WA, on April 11th,
1. Respond to social and political agendas relating to young people and the youth services sector
 August 2012 Youth Homelessness Youth Action Policy Paper YOUTH ACTION Prepared by: Dr. Ann Deslandes, Research and Policy Analyst Contact person: Eamon Waterford Director Policy & Advocacy Youth Action
This is the first time the federal government has coordinated a national homelessness count which is fairly significant in terms of public policy.
 1 This is the first time the federal government has coordinated a national homelessness count which is fairly significant in terms of public policy. And they have chosen the point-in-time methodology to
SOLANO COUNTY. comprehensive report HOMELESS CENSUS & SURVEY REPORT PRODUCED BY ASR
 SOLANO COUNTY 2017 HOMELESS CENSUS & SURVEY comprehensive report REPORT PRODUCED BY ASR ABOUT THE RESEARCHER Applied Survey Research (ASR) is a social research firm dedicated to helping people build better
The Challenge to End Homelessness
 The Challenge to End Homelessness While Pinellas County is generally considered to be a prosperous community, with a strong economy, diverse communities, low unemployment, and quality educational and cultural
ENDING FAMILY HOMELESSNESS IN THE SAN FRANCISCO UNIFIED SCHOOL DISTRICT. Case Statement
 ENDING FAMILY HOMELESSNESS IN THE SAN FRANCISCO UNIFIED SCHOOL DISTRICT Case Statement Overview There are more than 1,800 homeless students in San Francisco s public schools translating to approximately
Chapter 4: RENTAL HOUSING PROGRAMS FOR THE LOWEST INCOME HOUSEHOLDS
 Chapter 4: RENTAL HOUSING PROGRAMS FOR THE LOWEST INCOME HOUSEHOLDS Homeless Assistance: McKinney-Vento Homeless Assistance Programs By Mindy Mitchell, Program and Policy Analyst, National Alliance to
Counting and Surveying Homeless Youth DC Alliance of Youth Advocates Washington, D.C.
 Counting and Surveying Homeless Youth DC Alliance of Youth Advocates Washington, D.C. Overview Having an accurate count of homeless youth helps a community to understand the scope of the problem and to
2017 Point-In-Time Report
 Seven-County Metro Denver Region Copyright 2017 All Rights Reserved. Permission to use, copy, and distribute this document without fee is herby granted for any educational or non-profit purpose provided
Location: Villager Mall-Atrium 2300 S Park St
 Homeless Services Consortium Community Feedback Session on Community Plan to Prevent and End Homelessness Thursday, June 9, 2016 4pm- 6pm Tuesday, June 14, 2016 4pm-6pm Location: Villager Mall-Atrium 2300
STATE OF THE HOMELESS ADDRESS 2014
 STATE OF THE HOMELESS ADDRESS 2014 February 26, 2014 TCHC Mission Lead, Coordinate and Develop Strategies and Resources to End Homelessness AGENDA Welcome Consumer Council Report FWISD Report on Homeless
Ending Family Homelessness Report: Understanding the scale and needs of families experiencing homelessness in Chicago
 INSERT PHOTO HERE Ending Family Homelessness Report: Understanding the scale and needs of families experiencing homelessness in Chicago Final Report UChicago Urban Labs June 1, 2018 Table of Contents Executive
County of Ventura Homeless Survey
 2011 County of Ventura Homeless Survey May 2011 Acknowledgements This report was made possible by the efforts of community volunteers and staff of organizations that provide services for persons who are
TABLE OF CONTENTS. Executive Summary Introduction Methodology Findings and Results.. 5. Conclusions and Recommendations...
 Texas Homeless Network Balance of State Survey Of Homelessness 2009 TABLE OF CONTENTS Executive Summary.... 1 Introduction...... 2 Methodology..... 3 Findings and Results.. 5 Conclusions and Recommendations...22
THE STATE OF HOMELESSNESS IN ALASKA. August Homeless Management Information System (HMIS) Report. Institute for Community Alliances
 Report. Institute for Community Alliances") 2016 THE STATE OF HOMELESSNESS IN ALASKA Homeless Management Information System (HMIS) Report Institute for Community Alliances August 2017 Photo Credit: Forget-me-Nots by A. Gonzalez TABLE OF CONTENTS
2016 THE STATE OF HOMELESSNESS IN ALASKA Homeless Management Information System (HMIS) Report Institute for Community Alliances August 2017 Photo Credit: Forget-me-Nots by A. Gonzalez TABLE OF CONTENTS
Results of the Urban Kingston 2016 Point-in-Time Count
 Results of the Urban Kingston 2016 Point-in-Time Count September 2016 2016 Results of the Urban Kingston Point-in-Time Count Conducted on Wednesday, April 6 2016 7:00 pm - 11:00 pm Overview On April 6,
ABOUT THE RESEARCHER HOUSING INSTABILITY RESEARCH DEPARTMENT (HIRD) LOCATIONS
 LOCATIONS") SONOMA COUNTY 2017 HOMELESS CENSUS & SURVEY comprehensive report (n=197) REPORT PRODUCED BY ASR ABOUT THE RESEARCHER Applied Survey Research (ASR) is a social research firm dedicated to helping people
SONOMA COUNTY 2017 HOMELESS CENSUS & SURVEY comprehensive report (n=197) REPORT PRODUCED BY ASR ABOUT THE RESEARCHER Applied Survey Research (ASR) is a social research firm dedicated to helping people
Wilder Research. Homelessness in Fargo, North Dakota and Moorhead, Minnesota Highlights from the October 2006 survey. Key findings
 Wilder Research Homelessness in Fargo, North Dakota and Moorhead, Minnesota Highlights from the October 2006 survey The purpose of this summary is to provide a current snapshot of people experiencing homelessness
What Are We Learning about Expanding Housing Options for Survivors?
 What Are We Learning about Expanding Housing Options for Survivors? NAEH Pre-Conference: Housing and Supporting Survivors of DV Washington, DC - July 23, 2018 Christie Bevis, Director of Safe Housing Practices
YWCA Greater Newburyport
 YWCA Greater Newburyport One Night Homeless Count January 26,2017 Full Report our mission YWCA is dedicated to eliminating racism, empowering women and promoting peace, justice, freedom and dignity for
Webinar 1 Transcript
 Webinar 1 Transcript Slide 1: This is the first of a series of webinars that will provide insights, techniques, tools and resources that will help us assist our homeless veteran clients address the many
National Alliance to End Homelessness NATIONAL CONFERENCE JULY 17 TH -JULY 19 TH WASHINGTON D.C.
 National Alliance to End Homelessness NATIONAL CONFERENCE JULY 17 TH -JULY 19 TH WASHINGTON D.C. Overview of the conference Workshops presented on best practices Provided opportunities to connect and learn
FIVE-YEAR STRATEGIC FRAMEWORK EXECUTIVE SUMMARY
 FIVE-YEAR STRATEGIC FRAMEWORK EXECUTIVE SUMMARY OCTOBER 2017 City and County of San Francisco DEPARTMENT OF HOMELESSNESS AND SUPPORTIVE HOUSING Letter from the Director of the Department of Homelessness
One in Four Convening October 23-24, 2014 Harvard University. Sofia Herrera, PhD, Office for Urban Initiatives Fuller Theological Seminary
 One in Four Convening October 23-24, 2014 Harvard University Sofia Herrera, PhD, Office for Urban Initiatives Fuller Theological Seminary 2013 Homeless Count and Subpopulation Survey Responses obtained
FROM THE HEART: Collaborative Supportive Housing Model for Child Welfare
 FROM THE HEART: Collaborative Supportive Housing Model for Child Welfare HEART Presenters Lisa Bayne, LCSW, KID Vice President of Programs Andria Dewson, MSW RCSWI, HEART Director Stacey Charles, MSW RCSWI,
First Name Middle Name Last Name Name You Prefer Date
 Supportive Housing for Homeless Women & Families Application for Residency First Fruit Ministries 2750 Vance Street Wilmington, NC 28412 Phone 910.794.9656 Fax 910.794.9657 First Name Middle Name Last
Fact Sheet October 2014
 SPECIALIST HOMELESSNESS SERVICES Going Home Staying Home District This fact sheet provides an overview of the new specialist homelessness services SHS in the FACS District of NSW. Going Home Staying Home
...IN BRIEF. April Larkin Street Youth Services Legislative Recommendations
 Larkin Street Youth Services...IN BRIEF 2011 Legislative Recommendations Larkin Street extends its impact beyond the youth we serve by sharing our knowledge and expertise with policymakers at the local,
Denton BASIC DEMOGRAPHICS QUICK REFERENCE OF 318 PEOPLE COUNTED
 Texas Homeless Network 2014 Point-In-Time Results Denton Contents Respondent History 2 Risk Factors 3 Employment & Education 4 Health Care 5 Children 6 Veteran Statistics 7 Community Needs and Estimates
The State of Homelessness in Canada 2013
 A HOMELESS HUB RESEARCH PAPER The State of Homelessness in Canada 2013 Stephen Gaetz, Jesse Donaldson, Tim Richter, & Tanya Gulliver Homeless Hub Paper #4 ISBN: 978-1-55014-632-5 2013 Canadian Homelessness
We can no longer shuffle our homeless neighbors around. We need to end their homelessness. Philip Mangano
 We can no longer shuffle our homeless neighbors around. We need to end their homelessness. Philip Mangano former Director United States Interagency Council on Homelessness the facts. Just because I m homeless
Criteria and Benchmarks for Achieving the Goal of Ending Family Homelessness
 Criteria and Benchmarks for Achieving the Goal of Ending Family Homelessness Frequently Asked Questions A resource for domestic violence and sexual assault victim service providers Domestic violence and
Modeling Unmet Need for HIV/AIDS Housing in San Francisco
 Modeling Unmet Need for HIV/AIDS Housing in San Francisco Executive Summary San Francisco Board of Supervisors Resolution 380-06 resulted in the formation of the Comprehensive HIV/AIDS Housing Work Group,
2012 HOMELESS Point in Time COUNT Red Deer. Red Deer Point In Time [PIT] Homeless Count 2012
![2012 HOMELESS Point in Time COUNT Red Deer. Red Deer Point In Time [PIT] Homeless Count 2012](/thumbs/90/103257452.jpg "2012 HOMELESS Point in Time COUNT Red Deer. Red Deer Point In Time [PIT] Homeless Count 2012") 2012 HOMELESS Point in Time COUNT Red Deer Red Deer Point In Time [PIT] Homeless Count 2012 FINAL REPORT NOVEMBER 30, 2012 CONTENTS 1 Overview...2 1.1 Key Findings...3 2 PIT Count Background...4 2.1 The
2012 HOMELESS Point in Time COUNT Red Deer Red Deer Point In Time [PIT] Homeless Count 2012 FINAL REPORT NOVEMBER 30, 2012 CONTENTS 1 Overview...2 1.1 Key Findings...3 2 PIT Count Background...4 2.1 The
Executive Summary. Opening Doors: Federal Strategic Plan to Prevent and End Homelessness :: United States Interagency Council on Homelessness
 Executive Summary Homelessness cannot be solved by a single agency or organization, by a single level of government, or by a single sector. Everyone should be reminded of the intricacies of homelessness
INTRODUCTION. Figure 1: Baseline Homeless Population Data -44% 18% -8% -46% -3% -3% -6% Singles Unshletered 1,701 1, ,700 1,
 SEMI-ANNUAL PROGRESS REPORT OCTOBER 2014 1 INTRODUCTION On the evening of January 22, 2014, hundreds of volunteers bundled up for the bitterly cold weather to conduct the 2014 Point-in-Time (PIT) count.
State of the Streets: Evidence on Reducing Homelessness. Bill Evans Wilson Sheehan Lab for Economic Opportunities University of Notre Dame
 State of the Streets: Evidence on Reducing Homelessness Bill Evans Wilson Sheehan Lab for Economic Opportunities University of Notre Dame 1 Goals of the presentation How is homelessness defined? What groups
Nashville HMIS Intake Template Use COC Funded Projects: HMIS Intake at Entry Template
 HMIS Data Collection Template for Project ENTRY CoC Program This form can be used by all CoC-funded project types: Prevention, Street Outreach, Safe Haven, Transitional Housing, Rapid Re-housing, Permanent
New Hampshire Continua of Care Basic Center Program Emergency Shelter Prevention (BCPp) Entry/Exit Form for HMIS
 Entry/Exit Form for HMIS") BCPp MCoC BCPp Seacoast Refer to the 2014 HUD HMIS Data Standards Data Manual Version 5, available on the NH-HMIS website www.nh-hmis.org for an explanation of the data elements in this form. Important!
BCPp MCoC BCPp Seacoast Refer to the 2014 HUD HMIS Data Standards Data Manual Version 5, available on the NH-HMIS website www.nh-hmis.org for an explanation of the data elements in this form. Important!
Respond to the following questions for all household members each adult and child. A separate form should be included for each household member.
 HMIS Data Collection Template for Project ENTRY CoC Program This form can be used by all CoC-funded project types: Prevention, Street Outreach, Safe Haven, Transitional Housing, Rapid Re-housing, Permanent
Modeling Unmet Need for HIV/AIDS Housing in San Francisco
 Modeling Unmet Need for HIV/AIDS Housing in San Francisco Executive Summary Charged with quantifying unmet housing need among San Francisco s HIV/AIDS population, the subcommittee conducted an extensive
YMCA of Reading & Berks County Housing Application
 YMCA of Reading & Berks County Housing Application Overall Eligibility Criteria To be eligible for these programs (not including SRO), applicants must be: Homeless Drug and alcohol free for at least 5
NVTAC Virtual Learning Class:
 NVTAC Virtual Learning Class: Strategies to Succeed in HVRP A Virtual Learning Class for New HVRP Staff Ian Lisman Advocates for Human Potential nvtac@ahpnet.com John Rio Advocates for Human Potential
How To Document Length of Time Homeless in WISP
 How To Document Length of Time Homeless in WISP Institute for Community Alliances TABLE OF CONTENTS If you wish to access a particular section directly from the table of contents you can do so by holding
A community United Over the last four years residents in Charlotte County have
 A community United Over the last four years residents in Charlotte County have witnessed remarkable change. There has been a new collaborative movement among human service providers, non-profits, government,