TABLE OF CONTENT TABLE OF CONTENT. 1 FIGURES. 2 ANNEX TABLES. 4 ACRONYMS. 5 FOREWORD. 6 ACKNOWLEDGEMENT. 7 EXECUTIVE SUMMARY. 8 I. INTRODUCTION.
|
|
|
- Ashley Poole
- 5 years ago
- Views:
Transcription
1
2 TABLE OF CONTENT TABLE OF CONTENT... 1 FIGURES... 2 ANNEX TABLES... 4 ACRONYMS... 5 FOREWORD... 6 ACKNOWLEDGEMENT... 7 EXECUTIVE SUMMARY... 8 I. INTRODUCTION II. MAINLAND TANZANIA HOUSEHOLD BUDGET SURVEYS (2000/1 & 2007) II.1. MAINLAND TANZANIA HBS II.2. FOOD DATA OF MAINLAND TANZANIA HBS II.3. NUTRIENTS CONVERSION FACTORS II.4. MINIMUM DIETARY ENERGY REQUIREMENT (MDER) III. TREND ANALYSIS OF FOOD SECURITY INDICATORS III.1. PREVALENCE OF FOOD DEPRIVATION III.2. DEPTH OF HUNGER III.3. DIETARY ENERGY CONSUMPTION (DEC) III.4. FOOD EXPENDITURE III.5. FOOD DIETARY ENERGY COST III.6. FOOD SHARE IN TOTAL CONSUMPTION III.7. FOOD CONSUMPTION BY SOURCES III.8. ANALYSIS OF INEQUALITY IN ACCESS TO FOOD III.9. ANALYSIS OF DIET COMPOSITION Macro nutrient consumption Composition of food consumption Analysis of dietary energy unit cost of food item IV. FOOD DIET IN TERMS OF MICRONUTRIENTS AND PROTEIN QUALITY IV.1. MICRONUTRIENT IN FOOD CONSUMED Vitamin A Thiamin (B1), Riboflavin (B2), Pyridoxine (B6) and Cobalamine (B12) Ascorbic acid Calcium Iron IV.2. ANALYSIS OF QUALITY OF PROTEIN Protein quality Protein quality assessed using different patterns of essential amino acids Lysine unit cost V. CONCLUSIONS AND RECOMMENDATIONS RECOMMENDATIONS REFERENCES GLOSSARY OF TERMS ON FOOD SECURITY ANNEX I. FOOD SECURITY INDICATORS AT NATIONAL AND SUB NATIONAL LEVEL ANNEX II. METHODOLOGY OF MEASURING DEPRIVATION ANNEX III. ESTIMATION OF MICRONUTRIENT REQUIREMENTS AND RECOMMENDATIONS FOR NATIONAL AND SUB-NATIONAL POPULATION GROUPS ANNEX V. ESTIMATION OF PROTEIN DIGESTIBILITY CORRECTED AMINO ACID SCORE (PDCAAS)... 95
3 Figures Figure 1: Population Pyramids 2000 and Figure 2: Trends in MDER in Tanzania, by area and household-head gender, 2000/1 and Figure 3: Trends in MDER by region, 2000/1 and Figure 4: Trends in prevalence of undernourishment in Tanzania by income level, area and household-head gender, 2000/1 and Figure 5: Trends in prevalence of undernourishment by region, 2000/1 and Figure 6: Trends in depth of hunger (kcal/person/day) in Tanzania by area and household-head gender, 2000/1 and Figure 7: Trends in depth of hunger by region, 2000/1 and Figure 8: Trends in DEC in Tanzania by income level, area and household-head gender, 2000/1 and Figure 9: Trends in dietary energy consumption by region, 2000/1 and Figure 10: Trends in daily food expenditure per person (TSh at 2007 constant prices) in Tanzania by income level, area and household-head gender, 2000/1 and Figure 11: Trends in daily food expenditure per person (TSh at 2007 Constant Prices) by region,...22 Figure 12: Trends in cost of 1000 kcal in food consumed (TSh at 2007 constant prices), in Tanzania by income level, area and household-head gender, 2000/1 and Figure 13: Trends in cost of 1000 kcal in food consumed (TSh at 2007 constant prices) by region,...24 Figure 14: Trends in food shares to total consumption (percent) in Tanzania by income level, area and household-head gender, 2000/1 and Figure 15: Trends in food shares to total consumption (percent) by region, 2000/1 and Figure 16: Share of DEC by food source in Tanzania by income level, area and household-head gender,...26 Figure 17: Share of DEC by food source in Tanzania by Regions, 2000/1 and Figure 18: Coefficient of variation of DEC due to income (percent) in Mainland Tanzania by area and household-head gender, 2000/1 and Figure 19: Coefficient of variation of DEC due to income (percent) by region, 2000/1 and Figure 20: Share of macronutrients (carbohydrate, fat and protein) in total DEC in Mainland Tanzania by income level, area, household-head gender, 2000/1 and Figure 21: Share of macronutrients (carbohydrate, fat and protein) in total DEC in Mainland Tanzania by region, 2000/1 and Figure 22: Share of animal protein in total protein energy contribution in Mainland Tanzania by income level, area of residence, 2000/1 and Figure 23: Share of macronutrients (carbohydrate, fat and protein) in total DEC in Mainland Tanzania by region, 2000/1 and Figure 24: Share of each food group to the total DEC in Mainland Tanzania, 2000/1 and Figure 25: DEC of ten food items in Mainland Tanzania, 2000/1 and Figure 26: Energy unit costs (TSh per 100 Kcals) of top food items providing at least 80 percent of DEC in Mainland Tanzania, 2000/1 and Figure 27: Protein unit cost (TSh per 100 grams) of food items providing at least one of protein per person per day by region in Figure 28: Daily vitamin A available for consumption per person (mcg) in Tanzania by income level, area and region, 2000/1 and
4 Figure 29: Ratio of consumption to recommendation values of vitamin B12 (percent) in Tanzania by income level, area and region, 2000/1 and Figure 30: Ratio of consumption to recommendation values of calcium (percent) in Tanzania by income level, area and region, 2000/1 and Figure 31: Iron of animal origin available (mg) in food acquired for consumption in Tanzania and by income, area and region, 2000/1 and Figure 32: Heme-iron available (mg) in food acquired for consumption in Tanzania and by income, area and region, 2000/1 and Figure 33: Non-heme iron available (mg) in food acquired for consumption in Tanzania and by income, area and region, 2000/1 and Figure 34: Ascorbic acid (vitamin C) available (mg) in food acquired for consumption in Tanzania and by income, area and region, 2000/1 and Figure 35: Meats and fish available (g) in food acquired for consumption in Tanzania and by income, area and region, 2000/1 and Figure 36: Phytate available (mg) in food acquired for consumption in Tanzania and by income, area and region, 2000/1 and Figure 37: Polyphenol available (mg) in food acquired for consumption in Tanzania and by income, area and region, 2000/1 and Figure 38: Protein digestibility-corrected amino acid score (PDCAAS) in Tanzania, 2000/1 and Figure 39: PDCAAS of lysine population-based in Tanzania, by income quintile, 2000/1 and Figure 40: Lysine PDCAAS with preschool children patterns by region, 2000/1 and Figure 41 Lysine PDCAAS with population-based patterns by region, 2000/1 and Figure 42: Estimated digested protein in Tanzania, by income quintile, 2000/1 and Figure 43: Estimated digested protein (grams) in Tanzania and by region...58 Figure 44: Unit cost of amino acid lysine (TSh constant price 2007) per 100 grams in Tanzania by income level, area and region, 2000/1 and
5 Annex Tables Table 1. Prevalence of Food Deprivation and other Food Security StatisticsTable 1. Prevalence of Food Deprivation and other Food Security Statisticsable 1. Prevalence of Food Deprivation and other Food Security Statistics...69 Table 2. Selected Statistics - MDER, DEC and Food Share...70 Table 3. Food Monetary Value, Energy Unit Cost, Total (TSh)...71 Table 4. Share Composition of Food Expenditure by Food Sources (%)...72 Table 5. Share Composition of Dietary Energy by Food Sources (%)...73 Table 6. Measures of Inequality of Food Access - Coefficient of variation of DEC and Food Expenditure due to Income and FAO CV parameter for estimation Food Deprivation...74 Table 7. Contribution Energy-Yielding Nutrients to Total DEC...75 Table 8. Macronutrient...76 Table 9. Food (Expenditure and DEC) by Food Commodity Group...77 Table 10. Micronutrients consumption by food commodity groups...77 Table 11. Share of DEC and Macronutrients of Food Commodity Groups to Totals Mainland Tanzania...78 Table 12. Daily Vitamin A per person in Retinol-Activity-Equivalent and Ratios to Requirements by Population Groups...78 Table 13. DailyVitamin B1 per Person in mg and Ratios to Recommendations by Population Groups...79 Table 14. DailyVitamin B2 per Person in mg and Ratios to Recommendations by Population Groups...80 Table 15. Daily Vitamin B6 per Person and Ratios (Recommendations and Requirements respectively) by Population Groups...81 Table 16. Daily Vitamin B12 per Person (mcg) and Ratios (to Recommendations and Requirements respectively) by Population Groups...82 Table 17. Daily Vitamin C per Person (mg) and Ratios to Recommendations by Population Groups...83 Table 18. Daily Calcium per Person (mg) and Ratios to Recommendations by Population Groups...84 Table 19. Share of Amino Acid in Total Amino Acid by Main Food Group
6 Acronyms AAS ADER BMI BMR COICOP CPI CV DEI DES DEC DSM EAR EC FAO FBS FCT FSSM FPI HBS IMR ISU MDER MDG NBS NPS PAL PCFP PDCAAS RNI SOFI SPSS TSh USDA WFS WHO UNU Amino Acid Score Average Dietary Energy Requirement Body Mass Index Basal Metabolic Rate International Classification of Individual by Purpose Consumer Price Index Coefficient of variation Dietary Energy Intake Dietary Energy Supply Dietary Energy Dar es Salaam Estimated Average Requirement European Community Food and Agriculture Organization Food Balance Sheet Food Composition Tables Food Security Statistical Module Food Price Index Household Budget Survey Infant Mortality Rate International System of Units Minimum Dietary Energy Requirement Millennium Development Goals National Bureau of Statistics National Panel Survey Physical Activity Level Prevalence of Critical Food Poverty Protein Digestibility Corrected Amino Acid Score Recommendations of Nutrient Intake State of Food Insecurity Statistical Package for the Social Sciences Tanzania Shilling United States Department of Agriculture World Food Summit World Health Organization United Nations University 5
7 Foreword This report presents the findings of the joint research work by the National Bureau of Statistics (NBS) and Food and Agricultural Organization of the United Nations (FAO). The research is the result of further analysis of the 2000/01 and 2007 Tanzania Household Budget Surveys (HBS) data. HBS surveys are conducted for a period of one year and contain rich information on the type, quantity and values of food consumed by the Tanzanians households. This joint research was conducted under the framework of technical assistance from FAO and the financial support from the European Community (EC) to the NBS and other stakeholders on food security. The availability of the two HBS data sets has made the trend analysis of food security indicators possible. The report presents both macro and micronutrients trends for Mainland Tanzania and therefore contributes to the availability of very useful information needed to assist policy makers and programme implementers to monitor and evaluate existing programmes and to design new food consumption related strategies. We therefore hope that the results of this study will be useful for advocacy, research, policy formulation, decision-making and program development. One important aspect of this report is that it contains the trend analysis, which is imperative in tracking and assessing the country progress in achieving the country and global goals. For example, the report enables us to assess the progress made in achieving the Millennium Development Goal (MDG) Number 1.9 indicator, which advocates for the reduction of hunger; that is to reduce the proportion of the population below minimum level of dietary energy consumption by half by The analysis was also meant to serve as a capacity building for the NBS and other stakeholders in using the food consumption data form Household Budget Surveys to derive food security indicators. This knowledge will enable the NBS staff to make more use of the HBS data in future and therefore contributes to the availability of food security information for development strategies of the country. The FAO organized the National Demonstration Centre (NDS) on Food Security and Statistics in Dar es Salaam in February, 2010 that introduced the researchers to the Food Security Statistics Module (FSSM) software developed by FAO Statistics Division. The workshop was attended by 15 national officers from NBS, Office of the Chief Government Statistician (OCGS) - Zanzibar, Ministry of Agriculture, Food Security and Cooperatives, and the Ministry of Trade, Industry and Marketing. The FSSM software was eventually used in the analysis that produced inputs for this report. 6
8 Acknowledgement The NBS and FAO wishes to acknowledge the contribution of various people who made this report a huge success. First and foremost, we appreciate the technical assistance provided by Mr. Seevalingum Ramasawmy, FAO Statistician, Mr. Ricardo Sibrian, former FAO Senior Statistician and Ms. Ana Moltedo, FAO Consultant for their valuable support and contribution to this food security activity. Grateful thanks to the FAO Representative in Tanzania, Ms Louise Setshwaelo and her staff who have provided the necessary administrative support since the inception of the project. We are also grateful to the analysts and participants of the NDC, these are Aldegunda Komba, Mlemba Abassy, Elinzuu Nicodemo, Israel Mwakapalala, Devotha Antony, Norvati Buberwa, Stephen Maganda and William Mabusi of NBS; Mdachi Kombo and the late Bakari Hamad of OCGS; Onasimbo Ntikha of Ministry of Agriculture, Food Security and Cooperatives, Francis Lwesya of Ministry of Industry, Trade and Marketing and Mansura M. Kassim of the Ministry of Agriculture Zanzibar. This report has benefited from contributions by experts from various Ministries and regional offices together with international experts from WFP, World Bank, DFID and UNICEF who participated in the National Seminar on of food security statistics and multisectoral perspectives, in October 2010, Dar es Salaam, Tanzania. This food security activity in Tanzania and report have been made possible from the financial support of the Economic Commission of the European Union. 7
9 EXECUTIVE SUMMARY At the start of the twenty-first millennium, one person out of four Tanzanians was not consuming enough food to cover his/her minimum daily requirements. Seven years later, even though the dietary energy consumption increased by 30 Kcal/person/day, the food deprivation level remained the same due to an increase in the inequality of access to food in the country. Level of hunger as measure by the MDG indicator 1.9 varied differently from region to region during the seven-year period of study. Out of the 20 regions of Tanzania, 9 showed an increase in the level of food deprivation with Tabora and Dodoma regions moving from a low level to a high level of food deprivation. On the other hand, among regions, which experienced decreases in their food-deprived level, Dar es Salaam and Kilimanjaro regions reached moderate levels of food deprivation in Level of hunger was not equally distributed over the country in 2007 when regions of Tanga, Morogoro and Iringa experienced moderate levels of food deprivation (10%) while Mara, Arusha, Manyara, Lindi, Mtwara, Rukwa, Kagera and Mwanza regions had more than 30 percent of their population suffering from hunger. It was observed that Mara was the region showing the maximum prevalence of undernourishment in Tanzania, with almost half of its population suffering from hunger. The average daily dietary energy consumption (DEC) of Tanzania which was 2200 Kcal per person in 2000/1 increased to 2,230 kcal in Cereals and their products, mainly of maize and rice, were the major contributors of energy to the Tanzanian diet, followed by roots and tubers. During the period of study, it was observed a change in the pattern of calories consumed between urban and rural areas. While in 2000/1, households in rural areas were consuming more energy than those in urban ones, in 2007 this situation reversed. The range of dietary energy consumption fell from 2120 kcal in 2000/1 to 1790 kcal in in rural areas decreased from 2210 to 2190 kcal while that in urban areas increased from 2190 to 2280 kcal. In 2007, the lowest DEC of 1820 kcal was observed in Mara and the highest Dec of 2620 Kcal/person/day was in Morogoro. Among income groups, the lowest income quintiles had a significantly low DEC of 1690 kcal while those of the highest income quintile had the highest dietary consumption of 3480 kcal/person/day. At the beginning of the decade, Tanzanians on average were spending TSh to purchase 1000 kcal and this value was more than doubled to reach TSh in However, food prices have gone up by only 54 percent during that seven-year period. In both surveys, about two third of the household consumption budgets was devoted to food. Food consumption from own production represented about 25 percent of total food expenditures but contributed to about 40 percent of total dietary energy consumed. Urban areas had much higher share of food from purchases than rural areas, rending urban households very vulnerable to price fluctuations. 8
10 While in the region of Shinyanga, big producer of cereals, reliance on own production was rending households of the region more vulnerable to changes in weather condition. The inequality of access to food also increased as revealed by measures of coefficient of variation (CV x/inc ) of dietary energy consumption due to income. The CV x/inc for rural areas increased from 23.2 to 25 percent, while that of urban areas moved marginally from 26.3 to 26.7 percent. However, Dar es Salaam, which registered a moderate level of food deprivation, had its CV x/inc felt from 34.4 in 2001 to 25.2 in Cereals and their products, mainly maize and rice, were the main sources of dietary energy, followed by roots and tubers. The diet consumption during both reference periods was diversified as food items from thirteen commodity groups were usually consumed. There has been a rise in the protein and fat consumption at the expense of a decrease of carbohydrate products between the two reference periods. Tanzanians are moving towards a balanced micronutrients diet particularly those in Arusha, Dar es Salaam and Tabora. Populations of the other regions were high consumers of carbohydrates, which are mainly cereals products. Food deprivation increased in poor households, particularly in the lowest income quintile, while it decreased in the rest of households nationwide. Food deprivation decreased in urban Tanzania, particularly in Dar es Salaam, while it failed in rural Tanzania; in 2000/1 rural households consumed more energy than those in urban ones, while in 2007 this situation reversed. Among the twenty regions of Tanzania, nine regions registered increases in the prevalence of food deprivation while eleven had improved their food insecurity from 2000/1 to The Tanzania diet has improved from the macronutrient viewpoint. The quality of protein consumed has improved with an increase in the share of animal protein from 21 percent in 2000/1 to 28 percent in However, total protein was still deficient in the essential amino acid lysine. Tanzania showed a low consumption of calcium and vitamin B12 in 2007, except the Iringa region with adequate calcium consumption. 9
11 10
12 I. INTRODUCTION Tanzania's economy has been growing steadily since the implementation of macroeconomic stabilisation and structural reform programme in the mid-nineties. Its annual growth rate of the gross domestic product (GDP) was between five and seven percent over the past decade. It relies heavily on agriculture, which accounts for nearly 25 percent of the GDP and employs about 80 percent of the labour force. The agricultural sector has benefited from the programme of the liberalisation of production and marketing structures and product prices. The service sector is growing, particularly the tourism, which ranks as the second highest foreign exchange earner after agriculture. Mineral production (gold, diamonds, and tanzanite) has grown significantly in the last decade. It represents Tanzania's biggest source of economic growth, provides over three percent of GDP and accounts for half of Tanzania's exports. The 2009 population estimate of Tanzania was 41 million compared to 33 million in the 2002 Population census. About 70 percent of the population live in rural areas of which 38.7 percent were below the rural poverty line in The poverty rate in urban regions was 29.5 percent and indicated inequalities among households living in rural and urban areas. Tanzania was rated 164th out of 177 countries on the Human Development Index in Stunting of preschool age children has decreased from 38 to 35 percent from 2004 to Boys were more stunted, 46 percent, than girls, 39 percent. Rural children were more stunted, 45 percent, than urban. Dodoma showed the largest share of stunting, 56 percent, in contrast Dar es Salaam showed the lowest share, 19 percent. The food consumption data collected in the 2000/1 and 2007 Tanzania HBS was analysed using the FAO statistical framework for the global estimation of the prevalence of undernourishment. The food security analysis of the Tanzania HBS was conducted in a training workshop in Dar es Salaam in February 2010 among national HBS experts of the National Bureau of Statistics and food security officers of the Tanzania Ministries of Agriculture and Trade and Commerce. The Food Security Statistics Module (FSSM) developed by FAO Statistics Division was applied to both the 2000/1 and 2007 Household Budget Survey (HBS). This report presents a trend analysis of food security indicators derived from the food consumption data collected in the 2000/1 and 2007 Household Budget Survey (HBS). The assessment of food insecurity at national and sub national levels from the two surveys provides information for evaluating the impact of food policies and programmes implemented during the reference period of study. The report provides a suite of food security indicators, including the hunger indicator 1.9 of the MDG and an assessment of some micronutrients and essential amino acids of the Tanzanian diet. 11
13 II. MAINLAND TANZANIA HOUSEHOLD BUDGET SURVEYS (2000/1 & 2007) II.1. Mainland Tanzania HBS The regular HBS programme of Tanzania National Bureau of Statistics (NBS) started in 1991/92 to collect information on consumption and expenditure in households for poverty mapping and analysis of changes in living standards of Tanzanians over time. NBS conducted the 2007 HBS from January to December sampling 10,752 households and the 2000/1 HBS with 22,178 households. The set of questionnaires used for the 2000/1 HBS with some minor improvements was implemented in the 2007 HBS. Both collected a wide range of information on households and its members relating to geographical, demographic, health, and socio-economic dimensions. The sampling design and selection of the 2000/1 HBS was based on information of the 1988 Population Census. Primary sampling units (PSU) in urban and rural areas were selected using probability proportional to size of households. A two stage stratified sampling was used and the selection of households in the sampled PSUs made using categories of household income. The same sampling design was implemented for the 2007 HBS using more up-to-date information from the 2002 Tanzania Population Census. Region was one of the sampling criteria in the 2000/1 HBS, but was not included in those for 2007 HBS. Regional estimates are very useful for the location and identification of the food insecure population groupings as different regions may require different types of food policies and programmes. The twenty regions of Tanzania were well represented in the 2007 HBS sample of households and they were used for deriving food security estimates, which should be interpreted cautiously. Comparison of the regional estimates are useful to link changes in food insecurity with the local and national policies implemented. II.2. Food Data of Mainland Tanzania HBS Almost the same collecting instruments were used to collect household consumption and expenditure data in both surveys. A main household questionnaire was used to collect household and member characteristics. The daily diary was used for recording household consumption, expenditure and income over the household survey period of one month. A personal diary was given to each adult of the sampled households to record of daily outside home expenses. A recall questionnaire was used to collect information on non-food items purchased in the past year. Food consumption collected in both surveys included the purchases and non-purchases, which are the home produced food items, food received by the household (gifts or support from other households) and food payments in kind for work done. Both quantity and monetary values were recorded for each food item. Some quantities of a few food items were in local units of quantity measurement and were converted using appropriate conversion 12
14 factors prepared by the NBS. Food items that had not been purchased were valued in monetary terms at local market prices. Both surveys have a common food list of 135 items. II.3. Nutrients Conversion Factors All food quantities were converted to nutrients values using corresponding nutrients values from the Tanzania Food Composition Table (TFCT), which contains information on 47 nutrients for over 400 food items including local dishes. The TFCT supplied most of nutrient conversion factors for the 135 food items of the HBS and a few missing ones were complemented with some additional information from the USDA Food Composition Table (FCT). The nutrients include macro and micronutrients, and amino acids, which allows further analysis of micro nutrient consumption and diet quality. The quantities of all food items as reported in the HBS were in terms of purchased quantities. These quantities were converted to quantities consumed using corresponding values of edible portions. Edible portions coefficients from the USDA-FCT were used, as they were not available in the TFCT. Nutrient values for liquid and semi-liquid food items were given by 100 grams weight in the TFCT. Quantities for liquid and semi-liquid food items were converted to grams using specific density factors derived from the USDA-FCT. II.4. Minimum Dietary Energy Requirement (MDER) The daily minimum dietary energy requirement per person is one of the parameters for estimating food deprivation using the FAO methodological statistical framework in the global estimations of prevalence of undernourishment. The energy requirement of groups of individuals is the amount of energy from food intake that will balance energy expenditure when individuals have body size and composition, consistent with long-term good health, and allow individuals for performing physical activity, economically necessary and socially desirable. The standards of energy requirement for populations by sex and age groups are reviewed and updated by experts in FAO/WHO/UN consultations regularly. The last update was held in Rome from October 2001, in the 2004 Report of a Joint FAO/WHO/UNU Expert Consultation on Human Energy Requirements. The human energy requirements are expressed as multiple of the Basal Metabolic Rate (BMR) based on the Physical Activity Level (PAL). The BMR is the energy needed for complete rest. The energy needed is BMR multiplied by the PAL index. Additional energy for growth in children and pregnancy and lactation in women is taken into account. The energy requirement for each sex-age group depends on body weight and index. For a given height, there is a range of body weight that is consistent with good health; similarly, there is a range of PALs that is consistent with the performance activity of economically necessary and socially desirable. 13
15 The minimum dietary energy requirement is the weighted average of low limits of energy requirements estimated for each sex and age group. The low limit of energy requirement corresponds to the low acceptable weight-for-height and the low acceptable physical activity, that is, sedentary. The weighted MDER estimates for all national and sub-national population groupings for the 2000/1 and 2007 HBS were calculated using as weights the sex and age population structures derived from household member data on sex and age of the corresponding HBS. The MDER is used as the cut-off point for estimating the prevalence of food deprivation within the statistical framework under the assumption that DEC is distributed as lognormal. MINIMUM DIETARY ENERGY REQUIREMENT (MDER) In the entire population, the minimum dietary energy requirement is the weighted average of the minimum energy requirements of the different sex and age groups in the population. In a specified sex and age group, the amount of dietary energy per person that is considered adequate to meet the energy needs for minimum acceptable weight for attained-height maintaining a healthy life and carrying out a sedentary physical activity level. Height data were not available from any of the two surveys. However, the attained-height data were available from the recent 2008 anthropometric panel survey and was used for deriving body weight for estimating MDER for both surveys on the assumption that attained height varies slowly over time. The MDER estimates ranged from 1655 to 1782 kcal/person/day. There was no significant change in MDER in Tanzania at the national and sub national levels from 2000/1 to The national age and sex structure of the population of Mainland Tanzania has not changed significantly see figure 1. Figure 1: Population Pyramids 2000 and 2005 Figure 2 shows the MDER estimates from both surveys for Mainland Tanzania, by area of residence and gender of head of household. 14
16 Figure 2: Trends in MDER in Tanzania, by area and household-head gender, 2000/1 and HBS 2007 HBS Kcal/person/day Tanzania Dar es Salaam Other Urban Rural Male Female However, the MDER by region changed significantly as shown in Figure 3. MDER increases were noted in the regions of Lindi, Arusha and Manyara and Mwanza. These increases are due to higher percentage of adults. The remaining 11 regions showed decreases up to three percent (Iringa). These shifts in the age and sex structure of those regions could be explained by migration of the population across of regions. Figure 3: Trends in MDER by region, 2000/1 and HBS 2007 HBS Kcal/person/day
17 III. TREND ANALYSIS OF FOOD SECURITY INDICATORS This section presents the results and findings derived from a cross section analysis of the food consumption data with households and household members characteristics collected in the two HBS, 2000/1 and The derived food security information is useful to identify the direction of trends and quantify the magnitude of food insecurity as well as locate and identify the food deprived population groupings in terms of geographic, demographic and socio economic population factors available in the HBS. Total household expenditure is used as a proxy of income as the data contained inconsistencies due to misreporting and sensitivity of income among Tanzanian households. The trend analysis use the regional groupings as for the 2000/1 HBS. The statistics derived are indicative within acceptable limits of reliability. III.1. Prevalence of Food Deprivation The prevalence of food deprivation, as defined by the FAO methodology, is based on a parametric approach with three key parameters. Two parameters are for the specification of the distribution of dietary energy consumption (DEC) under the assumption of log normality, the mean or average dietary energy consumed (Section III.3), and the variance of the distribution estimated as a nonlinear function of the coefficient of variation reflecting the inequality in access to food (Section III.4). The third parameter is the cut-off value of DEC below which within the distribution of DEC food deprivation occurs, that is, the minimum dietary energy requirement (MDER) for a minimum acceptable body weight for attained-height and carrying out a minimum acceptable level of light physical activity while maintaining a healthy life and (Section II.4). The prevalence of food deprivation is thus the proportion of people whose daily DEC is lower than the MDER. It is assumed that DEC is the closest measure of dietary energy intake (DEI), which is very difficult to measure through HBS in practical and conceptual terms. Between the two HBS, 2000/1 and 2007, the prevalence of undernourishment did not change, being 23 percent for Mainland Tanzania as shown in Figure 4. 16
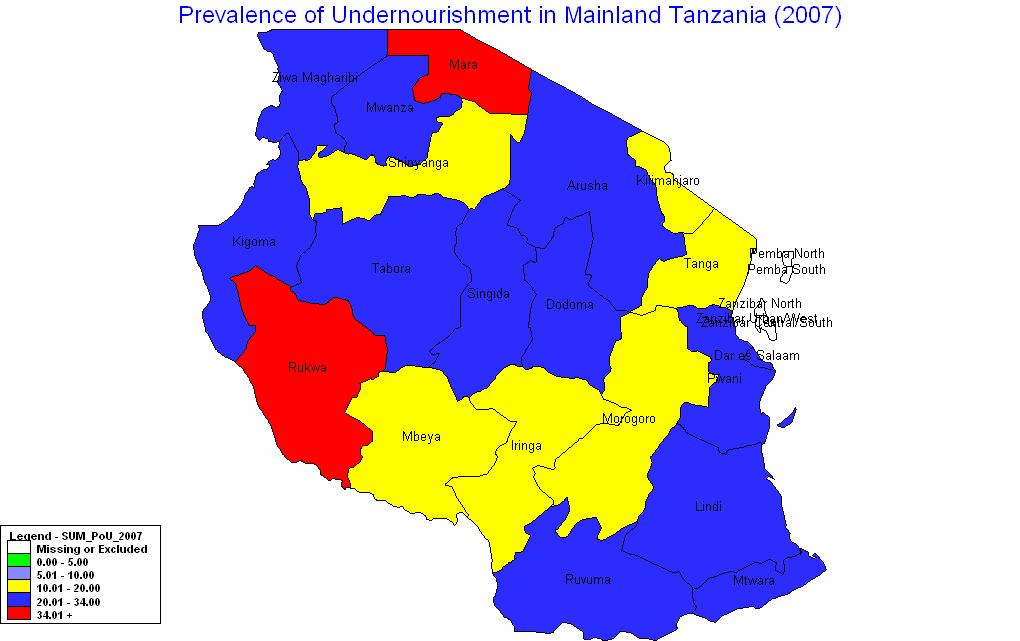
18 Figure 4: Trends in prevalence of undernourishment in Tanzania by income level, area and household-head gender, 2000/1 and HBS 2007 HBS % Tanzania Quintile 1 Quintile 2 Quintile 3 Quintile 4 Quintile 5 Dar es Salaam Other Urban Rural Male Female Not all extremely poor population groups are food deprived. Less than one half were food deprived in households in the lowest income quintile in both reference periods. The population in this group of households showed an increase from 42 to 47 percent in the prevalence of food deprivation, while the second income quintile decreased from 10 to 8 percent. No change was noted for households of the other quintiles grouping which had marginal low food deprivation. However, Dar es Salaam showed a decrease of 21 percentage points in the prevalence of undernourishment; this indicates that food security has improved in the commercial capital city of Mainland Tanzania. While in 2001 rural households were more food secure than urban ones, the level of prevalence of undernourishment became 23 percent for both of them in Food insecurity by gender of head of households showed stagnation among maleheaded households, 21 and 22 percent, and among female-headed households, 24 and 23 percent Figure 5 shows levels of prevalence by region. Eleven of the twenty regions showed reductions in the level of undernourishment from 2000/1 to Within these regions, Dar es Salaam, Kilimanjaro, Tanga and Morogoro reduced their level of undernourishment more than half, but still the former had a high value of prevalence of undernourishment (21 percent). Among the regions increasing of their level of undernourishment, the regions of Dodoma and Tabora increased their prevalence from 7 to 30 percent and from 4 to 25 percent respectively. In the region of Mara the prevalence was more than 40 percent in 2000/1 and got worse becoming 47 percent in
19 Figure 5: Trends in prevalence of undernourishment by region, 2000/1 and HBS 2007 HBS % III.2. Depth of Hunger Depth of hunger is measured as the food gap between the minimum dietary energy needs and the average dietary energy consumption of the food-deprived population. The daily food gap in terms dietary energy per food deprived person was 262 Kcals in 2007, which slightly increased from 2000/1 as depicted by Figure 6. In terms of food grain, the daily Tanzanian food gap per food deprived person, is equivalent to more than 75 grams of cereals for removing individuals out of food deprivation, that is, more than 28 kg of cereals per person per year. While the food-deprived population of rural areas faced an increment of 16 Kcals gap needed, those food deprived in urban areas decreased energy gap by 13 Kcals, excluding Dar es Salaam that decreased food gap substantially, 130 Kcals. Food gap of undernourished population in male-headed households increased while in female-headed households decreased. 18
20 Figure 6: Trends in depth of hunger (kcal/person/day) in Tanzania by area and household-head gender, 2000/1 and HBS 2007 HBS Tanzania Dar es Salaam Other Urban Rural Male Female Figure 7: Trends in depth of hunger by region, 2000/1 and HBS 2007 HBS kcal/person/day Figure 7 shows the evolution of the food gaps of food deprive people by region between 2000/1 and 2007 in Tanzania. On one hand, Dar es Salaam and Kilimanjaro decreased in their food gap by 130 Kcals and 103 Kcals respectively. On the other hand, Tabora increased their food gap by more than 130 Kcals and Dodoma by almost 100 Kcals. In 2007, the regional food gaps of food deprive people varied from 187 Kcals in Tanga to 400 Kcals in Mara. 19
21 III.3. Dietary Energy (DEC) Mainland Tanzanian DEC was 2230 Kcals in 2007, 30 Kcals higher than 2200 Kcals in 2000/1. Figure 8: Trends in DEC in Tanzania by income level, area and household-head gender, 2000/1 and HBS 2007 HBS Tanzania Quintile 1 Quintile 2 Quintile 3 Quintile 4 Quintile 5 Dar es Salaam Other Urban Rural Male Female Dietary energy consumption increased with higher income as depicted by the income quintiles in Figure 8. Households in the highest income quintile acquired and consumed larger quantities of food as compared to those of the lowest income quintile, whose average DEC decreased from 1740 Kcals in 2000/1 to 1690 Kcals in Households in rural areas decreased by 20 Kcals their average DEC from 2210 Kcals in 2000/1, while in urban areas the DEC increased by 90 Kcals, from 2190 Kcals in 2000/1, excluding Dar es Salaam with an increase of 340 Kcals, from 2070 Kcals in 2000/1. The DEC by region of Tanzania is shown in Figure 8. The half of the regions decreased DEC from 2000/1 to Dodoma faced the highest decrease of DEC, from 2400 Kcals to 2030 Kcals and Tabora from 2620 Kcals to 2190 Kcals. On the contrary, the regions of Kilimanjaro, Morogoro and Dar es Salaam experienced the highest increments of DEC with 410, 350 and 340 Kcals, respectively, more than in 2000/1. The DEC by region ranged from 1890 Kcals in Mara to 2620 Kcals in Tabora, in This range increased in 2007, from 1820 Kcals in Mara to 2620 Kcals in Morogoro. 20
22 Figure 9: Trends in dietary energy consumption by region, 2000/1 and HBS 2007 HBS kcal/person/day III.4. Food Expenditure Food was mainly obtained from purchases whether to be consumed inside the household or outside usually in restaurants, canteens, food courts, food street vendors, etc. Household food consumed came also from own production, food business, received from friends or relatives or even as payment in kind. All food acquired which were not purchased had to be valued using the corresponding unit prices from purchased food items. The average Tanzanian household spent on food a daily average of 481 TSh per person in 2007, which was more than doubled the 221 TSh in 2000/1. The increase over the six-year period was about 117 percent, but when adjusted with the food inflation rate over the period, the increase was more than 45 percent. Figures 10 and 11 show that food expenditure has increased in all population groups, except the region of Mtwara where households decreased by 12 percent their food expenditure at 2007 constant prices. 21
23 Figure 10: Trends in daily food expenditure per person (TSh at 2007 constant prices) in Tanzania by income level, area and household-head gender, 2000/1 and HBS 2007 HBS TSh Figure 11: Trends in daily food expenditure per person (TSh at 2007 Constant Prices) by region, 2000/1 and HBS 2007 HBS TSh Figure 10 illustrates that households in the highest income group registered the highest food expenditure increase, which was almost 100 percent more than the 2000/1 value, at 2007 constant prices. Rural households spent on food less than urban households. In Dar es Salaam, food expenditure was 22
24 significantly higher at a value of 892 TSh in Female-headed households had slightly higher food expenditure than counterpart male-headed households. As mentioned above Dar es Salaam was the region where food expenditure was the highest and has registered the highest increase from 2000/1 to 2007 as shown in Figure 10 at 2007 constant prices. The region of Singida had the lowest food expenditure in The region of Rukwa had the lowest food expenditure in 2000/1; however, food expenditure rose by 61 percent in III.5. Food Dietary Energy Cost The general increase in food expenditure was greater than the food inflation rate from 2000/1 to 2007; it may be attributed to higher food prices reflected by increasing unit cost of calories. The Figure 12 illustrate that the cost of 1000 Kcals consumed increased by 45 percent, using 2007 constant prices, at national level from 2000/1, being 216 TSh in Dietary energy cost was lower in rural areas than in the capital city and urban areas. Most food is produced in rural areas and available at lower prices. Food prices in urban areas and Dar es Salaam include transportation and other overhead costs. Female-headed households paid a higher value for acquiring 1000 Kcals. Figure 12: Trends in cost of 1000 kcal in food consumed (TSh at 2007 constant prices), in Tanzania by income level, area and household-head gender, 2000/1 and HBS 2007 HBS TSh Tanzania Quintile 1 Quintile 2 Quintile 3 Quintile 4 Quintile 5 Dar es Salaam Other Urban Rural Male Female The unit energy cost of 1000 Kcals by region is shown in Figure 13. All the regions, except Mtwara showed a decrease in cost, from 180 to 173 TSh. The region of Mwanza experienced the highest increase of 94 percent between 2000/1 and Dar es Salaam had the highest unit energy cost of 369 Tsh, while the region of Singida had the lowest of 137 Tsh per 1000 Kcals in
25 Figure 13: Trends in cost of 1000 kcal in food consumed (TSh at 2007 constant prices) by region, 2000/1 and HBS 2007 HBS TSh III.6. Food Share in Total The food share is the percentage of household consumption expenditure that goes to food. Following the Engel s law, food share decreases with increasing income and is an indicative measure of wealth and quality of life in a country. Figure 14: Trends in food shares to total consumption (percent) in Tanzania by income level, area and household-head gender, 2000/1 and HBS 2007 HBS % Tanzania Quintile 1 Quintile 2 Quintile 3 Quintile 4 Quintile 5 Dar es Salaam Other Urban Rural Male Female 24
26 While the national level food share remained almost stable at around 62.5 percent, there had been some changes in food shares in sub-national population groups as shown in Figure 14. Increase in food shares were observed in all income quintiles, except the highest, indicating higher amounts of income going to food for those households in 2007 for 80 percent of the population. Even Dar es Salaam had its food share increased. The food share in the highest income quintile fell by eight percent points from 2000/1 to Figure 15: Trends in food shares to total consumption (percent) by region, 2000/1 and HBS 2007 HBS % Figure 15 shows food shares by region. Although there had been changes in food shares from 2000/1 to 2007, food shares by region are less sensitive to changes. The highest changes were observed in the regions of Iringa and Mara, both decreased by eight percent points their food share. In the region of Ruvuma, on the contrary, the food share increased from 58.5 to 69.5 percent. In 2007, the regional food shares ranged from 55 to 70 percent. III.7. Food by Sources Figure 16 depicts household food acquisition for dietary energy consumption by sources of food. Purchases were the main source of food acquisition, including food consumed away from home, for most households followed by own production and from other sources (friends or relatives or even receive as income in kind). At national level, more than one-half of food in energy terms was acquired by purchases. Food from own production represented in monetary terms 26.4 and 23.6 percent in 2000/1 and 2007 respectively, while in energy represented 40 percent of total energy consumed in HBS. 25
27 The contribution of own production to the total DEC was lower as with higher income levels. It was more than one-half of total DEC in households of the lowest income quintile compared to less than one fifth of total DEC in the wealthiest population group. It was half of total DEC in rural households in The highest share of energy from purchases as food consumed away from home (AFH) in total DEC, as expected occurred in Dar es Salaam and among the other regions the shares were very low; it was also higher as with higher income levels. More than one-half of total DEC nationwide was acquired on markets but this share was higher among households of the two highest income quintiles, more than 70 percent. Figure 16: Share of DEC by food source in Tanzania by income level, area and household-head gender, 90 Purchased (2000/1) Purchased (2007) Own Production (2000/1) Own Production (2007) Away from Home (2000/1) Away from Home (2007) Others (2000/1) Others (2007) As expected by region, the highest share of energy from purchases in total DEC was in Dar es Salaam and among the other regions the shares ranged from 41 to 69 percent reflecting the importance of food markets in the local economy in 2007 as shown in Figure
28 Figure 17: Share of DEC by food source in Tanzania by Regions, 2000/1 and Purchased (2000/1) Purchased (2007) Own Production (2000/1) Own Production (2007) Away from Home (2000/1) Away from Home (2007) Others (2000/1) Others (2007) III.8. Analysis of inequality in access to food Food security exists when all people, at all times, have physical, social and economic access to sufficient, safe and nutritious food, which meets their dietary needs and food preferences for an active and healthy life. Inequality in access to food, measured by the coefficient of variation (CV) of the dietary energy consumption distribution, is one of the key parameter in estimating the prevalence of food deprivation using the FAO approach. The CV is measured as the aggregation of the variation of DEC due to income level and the variation of DEC due to energy requirement levels among sex and age population groups in the study total population. The variation of DEC due to energy requirement levels depends on the range of weights for attained-heights and the range of physical activity levels by age and sex population groups weighted by the sex and age population structures at national and sub-national levels. The CV of DEC due to energy requirements is usually very close to 20 percent. The CV of DEC is estimated for sub-national population groups. The analysis of inequality in access to food mainly focuses on CV at sub national levels and dispersion ratios will be discussed when needed to complement the analysis of inequality at national level. The national prevalence of food deprivation is derived from those corresponding to rural and urban areas weighted by sampled population. 27
29 Figure 18 shows that in 2000/1 inequality in access to food due to income was higher in urban areas than in rural areas. Figure 18: Coefficient of variation of DEC due to income (percent) in Mainland Tanzania by area and household-head gender, 2000/1 and 2007 HBS HBS Dar es Salaam Other urban areas Rural areas Male Female Dar es Salaam showed the highest level of inequality among urban areas with a CV of 34 percent compared to 26 percent in other areas and 23 percent in rural areas. However, in 2007 Dar es Salaam decreased inequality to 25 percent, while other urban areas remained at 27 percent and rural areas at 25 percent. Both HBS showed that inequality was higher among households headed by women compared to households headed by men. The CV values for women-headed and men-headed households respectively were 26.4 and 21.4 percent in 2000/1 and 26.7 and 24.2 percent in Figure 19 shows the trends in levels of inequality of DEC due to income by region. Ten out of 20 regions increased in inequality from 2000/1 to 2007, which in part may have increased the magnitude of food deprivation, in particular in Dodoma, Tabora, Rukwa and Kagera where the DEC decreased. In the region of Ruvuma the increase in inequality may have been compensated by the increase in DEC, already described in Figure 8. Dar es Salaam, Kilimanjaro, Mbeya and Singida showed decreases in inequality, which may have contributed to decrease the magnitude of food deprivation, in particular in Dar es Salaam, Kilimanjaro and Singida where DEC increased; however, in Mbeya the decrease in DEC may have cancel the effect of decreasing inequality. Still in 2007, CV of DEC due to income was very high (over 30 percent) in the regions of Mara, Lindi and Rukwa, high (20-30 percent) in other 16 regions and only the region of Tanga showed a moderate level of less than 20 percent. 28
30 Figure 19: Coefficient of variation of DEC due to income (percent) by region, 2000/1 and III.9. Analysis of Diet Composition The FAO/WHO/UNU recommendations for a macronutrient balanced diet the contribution of energy-yielding macronutrients in total energy range from 55 to 75 percent from carbohydrate, from 15 to 30 percent from fat and from 10 to 15 percent from proteins. Macro nutrient consumption Mainland Tanzania average diet has improved in its consumption of macronutrient towards the balanced diet recommended norms. Nationwide the share of energy from carbohydrate, fat and protein in total DEC have improved towards mid-values of recommended ranges from 2000/1 to As depicted by Figure 20, the share of energy from carbohydrate in total DEC decreased from 74 to 70 percent, while the share from fats increased from 16 to 18 percent and for protein from 10 to 12 percent. The patterns of micronutrients contributions to total DEC were within the recommended ranges in both survey periods. Households with higher income tended to substitute food sources of carbohydrate with a food high in fat, keeping total protein consumption at the same level. There have been decreases of consumption of carbohydrates food products towards those of high fat content in all population groupings, except in the region of Shinyanga, which showed a slight increase. Thus, the fat dietary energy contribution increased from 15.8 to 19 percent over the reference period. Protein consumption has marginally improved among many population groupings. The 29
31 population of Pwani regions showed a deficiency in food of high protein content as its contribution was below the recommended norms of 10 percent. Figure 20: Share of macronutrients (carbohydrate, fat and protein) in total DEC in Mainland Tanzania by income level, area, household-head gender, 2000/1 and 2007 Protein Protein 2007 Fat Fat 2007 Carbohydrates 2000/01 Carbohydrates Figure 21: Share of macronutrients (carbohydrate, fat and protein) in total DEC in Mainland Tanzania by region, 2000/1 and 2007 Protein 2000/01 Protein 2007 Fat 2000/01 Fat 2007 Carbohydrates 2000/01 Carbohydrates Urban households consumed more fatty food and less starchy food than rural households. From 2000/1 to 2007, carbohydrate and fat contributed respectively more than 70 percent and less than 18 30


32 percent of the total DEC in rural areas, while in urban ones these shares ranged from 64 to 70 percent and from 20 to 24 percent. There were some regional differences in the share of energy from protein in total DEC were observed in For example, the highest shares in the regions of Iringa and Tabora with more than 13 percent, while the lowest share in the region of Pwani less than 10 percent. Although the share of DEC from protein remained at the same level from 2000/1 to 2007 among several population grouping and most particularly income quintiles, the share of animal protein in total protein consumed increased for all income levels (Figure 22). Figure 22: Share of animal protein in total protein energy contribution in Mainland Tanzania by income level, area of residence, 2000/1 and 2007 Figure 23: Share of macronutrients (carbohydrate, fat and protein) in total DEC in Mainland Tanzania by region, 2000/1 and
"The content of this publication is the sole responsibility of the National Bureau of Statistics Service, Dar es Salaam, Tanzania and can in no way
 "The content of this publication is the sole responsibility of the National Bureau of Statistics Service, Dar es Salaam, Tanzania and can in no way be taken to reflect the views of the European Union".
Food Insecurity Assessment based on food consumption statistics derived from Tajikistan 2005 Household Budget Survey
 STATE COMMITTEE OF STATISTICS TAJIKISTAN Food Insecurity Assessment based on food consumption statistics derived from Tajikistan 2005 Household Budget Survey Preliminary Summary Report Dushanbe, Tajikistan
FOOD INSECURITY ASSESSMENT IN ARMENIA
 National Statistical Service Yerevan, Armenia SUMMARY REPORT FOOD INSECURITY ASSESSMENT IN ARMENIA INTEGRATED LIVING CONDITIONS SURVEY 2004 Yerevan October 2007 The EC-FAO Food Security Information for
Part 3. Consumption versus acquisition approaches for deriving food security statistics
 Part 3. Consumption versus acquisition approaches for deriving food security statistics Part 3. Consumption versus acquisition approaches for deriving food security statistics 59 Food data collected using
Tanzania Socio-Economic Database. Elide S Mwanri National Bureau of Statistics TANZANIA
 Tanzania Socio-Economic Database Elide S Mwanri National Bureau of Statistics TANZANIA 1 Presentation About TSED How we can make use of Indicators Examples of some MKUKUTA/MDGs indicators Challenges and
Myanmar Food and Nutrition Security Profiles
 Key Indicators Myanmar Food and Nutrition Security Profiles Myanmar has experienced growth in Dietary Energy Supply (DES). Dietary quality remains poor, low on protein and vitamins and with high carbohydrates.
Myanmar - Food and Nutrition Security Profiles
 Key Indicators Myanmar - Food and Nutrition Security Profiles Myanmar has experienced growth in Dietary Energy Supply (DES). Dietary quality remains poor, low on protein and vitamins and with high carbohydrates.
Biomedical, Behavioral, and Socio-Structural Risk Factors on HIV Infection and Regional Differences in Tanzania
 Biomedical, Behavioral, and Socio-Structural Risk Factors on HIV Infection and Regional Differences in Tanzania Suzumi Yasutake, PhD Johns Hopkins Bloomberg School of Public Health Deanna Kerrigan, PhD
ATTITUDES RELATING TO HIV/AIDS 5
 ATTITUDES RELATING TO HIV/AIDS 5 5.1 KEY FINDINGS Tanzanian adults generally have accepting attitudes towards those living with HIV/AIDS, with a majority expressing acceptance on each of the four main
Solomon Islands Food and Nutrition Security Profiles
 Key Indicators Solomon Islands Food and Nutrition Security Profiles Solomon Islands has experienced stagnation in percapita GDP and undernourishment in recent years. Dietary Energy Supply (DES) has continued
Country Profile: Food Security Indicators
 I. FOOD DEPRIVATION AND CONSUMPTION INDICATORS Food Deprivation Proportion of undernourishment 38 47 54 47 4.1 2.6-2.2 Number of undernourished millions 0.2 0.3 0.4 0.4 7.0 5.1 0.2 Food deficit of undernourished
HIV/AIDS-RELATED KNOWLEDGE 4
 HIV/AIDS-RELATED KNOWLEDGE 4 4.1 KEY FINDINGS Over 99 percent Tanzanians age 15-49 have heard HIV/AIDS. Awareness the modes HIV transmission is high, with almost 90 percent adults knowing that having only
What do we really know? Metrics for food insecurity and malnutrition
 What do we really know? Metrics for food insecurity and Hartwig de Haen, Stephan Klasen, Matin Qaim University of Göttingen, Germany Workshop on Measuring Food Insecurity and Assessing the Sustainability
TANZANIA HIV IMPACT SURVEY (THIS)
") summary sheet: preliminary findings DECEMBER 2017 TANZANIA HIV IMPACT SURVEY (THIS) 2016-2017 The Tanzania HIV Impact Survey (THIS), a householdbased national survey, was conducted between October 2016
summary sheet: preliminary findings DECEMBER 2017 TANZANIA HIV IMPACT SURVEY (THIS) 2016-2017 The Tanzania HIV Impact Survey (THIS), a householdbased national survey, was conducted between October 2016
Laos - Food and Nutrition Security Profiles
 Key Indicators Laos - Food and Nutrition Security Profiles In Lao PDR, GDP per capita has increased consistently during recent years, as has Dietary Energy Supply (DES) per person. Nevertheless, undernutrition
Methodology of Poverty Measurement Since 2009
 MEASURING POVERTY IN ARMENIA: METHODOLOGICAL CLARIFICATIONS 169 Methodology of Poverty Measurement Since 2009 A consumption aggregate is used to approximate well-being in Armenia. It is assumed that consumption
Considerations in calculating flour consumption in a country. Janneke H. Jorgensen, World Bank
 Considerations in calculating flour consumption in a country Janneke H. Jorgensen, World Bank 1 Overview Why calculate flour consumption Factors to be considered Potential sources and quality of data National
Unnayan Onneshan Policy Brief December, Achieving the MDGs Targets in Nutrition: Does Inequality Matter? K. M.
 Unnayan Onneshan Policy Brief December, 211 Achieving the MDGs Targets in Nutrition: Does Inequality Matter? K. M. Mustafizur Rahman Introduction The nutritional status of a population is a key indicator
Brunei Darussalam - Food and Nutrition Security Profiles
 Key Indicators Brunei Darussalam Food and Nutrition Security Profiles Brunei Darussalam has one of the highest rates of GDP per capita and of Dietary Energy Supply (DES) per person in the region. For decades,
Empirical Analysis of the Impact of Income on Dietary Calorie Intake in Nigeria. Babatunde, R. O
 Empirical Analysis of the Impact of Income on Dietary Calorie Intake in Nigeria. Babatunde, R. O Department of Agricultural Economics and Social Sciences (490b), University of Hohenheim, D-70593 Stuttgart,
CURRENT MALARIA SITUATION IN TANZANIA
 CURRENT MALARIA SITUATION IN TANZANIA According to Tanzania HIV and Malaria indicator survey (THMIS) 2011, Malaria prevalence has declined in Tanzania from 18% in 2007 to 10% in 2011. In addition, Malaria
Brunei Darussalam - Food and Nutrition Security Profiles
 Key Indicators Brunei Darussalam Food and Nutrition Security Profiles Brunei Darussalam has one of the highest rates of GDP per capita and of Dietary Energy Supply (DES) per person in the region. For decades,
The FAO method to estimate the Prevalence of Undernourishment Undernourishment
 The FAO method to estimate the Prevalence of Undernourishment Undernourishment Conceptually it is the condition of not being adequately nourished Operationally, it is the condition by which a household
Food Consumption Pattern and Dietary Diversity
 12Round I survey of CFPR phase II Food Consumption Pattern and Dietary Diversity Chowdhury SB Jalal, Nuzhat Choudhury and Munshi Suliman INTRODUCTION This chapter provides information about the quantities
A Comparison of Food Consumption Pattern in Rural and Urban Areas of Bangladesh between 2005 and 2010
 A Comparison of Food Consumption Pattern in Rural and Urban Areas of Bangladesh between 2005 and 2010 Sadika S a, b*, Mohd Isa B b, Wan Abdul Manan WM b a Department of Rural Sociology, Bangladesh Agricultural
Nauru Food and Nutrition Security Profiles
 Key Indicators Nauru Food and Nutrition Security Profiles Nauru has remained stationary in health and child survival outcomes and will not achieve the Millennium Development Goal (MDG) on child mortality.
Cambodia Food and Nutrition Security Profiles
 Key Indicators Although Cambodia has an integrated framework for food and nutrition security, it has not yet achieved the desired nutritional outcomes. Cambodia has experienced rapid growth in per capita
Draft of the Rome Declaration on Nutrition
 Draft of the Rome Declaration on Nutrition 1. We, Ministers and Plenipotentiaries of the Members of the World Health Organization and the Food and Agriculture Organization of the United Nations, assembled
Women & Men intanzania
 Women & Men intanzania FACTS AND FIGURES 2017 Women & Men in Tanzania FACTS AND FIGURES 2017 Contents Page ABBREVIATION... iv PREFACE... v ACKNOWLEDGEMENT... vi CHAPTER ONE... 1 Introduction... 1 1.1 Situational
The Status of Food Security and Vulnerability in Egypt, 2009
 The Status of Food Security and Vulnerability in Egypt, 2009 December 2011 ACKNOWLEDGEMENTS The Status of Food Security and Vulnerability in Egypt for 2009 is Part I of the food security and vulnerability
Promoting household food and nutrition security in Myanmar
 S34 Asia Pacific J Clin Nutr (2001) 10(Suppl.): S34 S39 Original Article Promoting household food and nutrition security in Myanmar Aye Thwin MPH (NUTRITION), DFs&N, MB, BS National Nutrition Centre, Department
METHODOLOGICAL GUIDELINES
 MONTENEGRO STATISTICAL OFFICE METHODOLOGICAL GUIDELINES Minimal consumer basket - Revision - 79 METHODOLOGICAL GUIDELINES 79 Podgorica, February 2018 Contents THE LEGAL BASIS... 3 Conclusion of Statistical
Tuvalu Food and Nutrition Security Profiles
 Key Indicators Tuvalu Food and Nutrition Security Profiles Tuvalu has experienced a decreasing trend in infant mortality rates, but the country will not meet the Millennium Development Goal (MDG) target.
Tanzania. Tanzania HIV/AIDS. Indicator Survey. National Bureau of Statistics. Tanzania. Commission for AIDS
 Tanzania HIV/AIDS 2003 04 Indicator Survey Tanzania Commission for AIDS National Bureau of Statistics Tanzania Tanzania HIV/AIDS Indicator Survey 2003-04 Tanzania Commission for AIDS Dar es Salaam, Tanzania
Cook Islands Food and Nutrition Security Profiles
 Key Indicators Cook Islands Food and Nutrition Security Profiles Mortality in children has shown a constant reduction over the years, but unless further acceleration, Cook Islands will not achieve the
ASIA AND PACIFIC COMMISSION ON AGRICULTURAL STATISTICS. Learning Experience of Trend Analysis of Estimating PoU Using SUSENAS Data
 APCAS/18/6.2.2P ASIA AND PACIFIC COMMISSION ON AGRICULTURAL STATISTICS TWENTY-SEVENTH SESSION Nadi, Fiji, 19 23 March 2018 Agenda Item 6.2 Learning Experience of Trend Analysis of Estimating PoU Using
Fill the Nutrient Gap Pakistan: Rationale, key findings and recommendations. Fill the Nutrient Gap National Consultation Islamabad, 11 April 2017
 Fill the Nutrient Gap Pakistan: Rationale, key findings and recommendations Fill the Nutrient Gap National Consultation Islamabad, 11 April 2017 Meeting nutrient requirements is a prerequisite for preventing
Country Road Map KENYA
 CAADP Nutrition Capacity Development Workshop EAST & CENTRAL AFRICA, 25 th February-1 st Dar-Es-Salaam, Tanzania Country Road Map KENYA Content A. Objective of the group work... 2 B. Background... 2 C.
Achieving the MDGs Targets in Nutrition: Does Inequality Matter?
 Achieving the MDGs Targets in Nutrition: Does Inequality Matter? Authors Rashed Al Mahmud Titumir K. M. Mustafizur Rahman Acknowledgement: The report is an output of the programme titled Enhancing the
The Case for Flour Fortification
 FFI Global Update 1 The Case for Flour Fortification Loss of vitamins and minerals during milling of wheat 120% Fortification replaces nutrients 100% lost during the milling process and can add other vitamins
IANDA New Indicators of the Cost of Nutritious Diets
 IANDA New Indicators of the Cost of Nutritious Diets Collaborators: Joyce Kinabo & Fulgence Mishili Sokoine University of Agriculture (Tanzania) Anna Herforth, Columbia University (USA) William A. Masters,
Patterns: A Nigerian Example
 USING HCES FOOD ACQUISITION DATA TO Better Understand Dietary Patterns: A Nigerian Example Case Study: Nigeria General Household Survey, Post-Harvest Panel, 2010-2011 Odilia I. Bermudez, PhD, MPH, LDN
TANZANIA. Assessment of the Epidemiological Situation and Demographics
 Estimated percentage of adults living with HIV/AIDS, end of 2001 These estimates include all people with HIV infection, whether or not they have developed symptoms of AIDS, alive at the end of 2001: 7.8%
GLOBAL NUTRITION REPORT. ABSTRACT This is a summary of the recently published Global Nutrition Report prepared by an Independent Expert Group.
 ABSTRACT This is a summary of the recently published Global Nutrition Report prepared by an Independent Expert Group. HERD GLOBAL NUTRITION REPORT SUMMARY REPORT SUDEEP UPRETY AND BIPUL LAMICHHANE JUNE,
Indonesia - Food and Nutrition Security Profiles
 Key Indicators Indonesia - Food and Nutrition Security Profiles The levels of underweight and stunting remain persistently high in Indonesia, despite considerable increase in GDP per capita. Notable disparities
Marshall Islands Food and Nutrition Security Profiles
 Key Indicators Marshall Islands Food and Nutrition Security Profiles Marshall Islands has made significant improvements in health and child survival; nevertheless, it will not achieve the Millennium Development
Odilia I. Bermudez, Tufts University School of Medicine with John L. Fiedler and Keith Lividini International Food Policy Research Institute (IFPRI)
") Odilia I. Bermudez, Tufts University School of Medicine with John L. Fiedler and Keith Lividini International Food Policy Research Institute (IFPRI) Globally, there is a scarcity of national food consumption
Odilia I. Bermudez, Tufts University School of Medicine with John L. Fiedler and Keith Lividini International Food Policy Research Institute (IFPRI) Globally, there is a scarcity of national food consumption
Volume 5, Issue 1, January 2016, e-issn:
 Volume 5, Issue 1, January 2016, www.ijfans.com e-issn: 2320-7876 e-issn 2320-7876 www.ijfans.com Vol. 5, No. 1, January 2016 All Rights Reserved Research Paper Open Access NUTRITIONAL STATUS OF MIGRANT
Trends in food availability in the SLOVAK REPUBLIC the DAFNE V project
 Trends in food availability in the SLOVAK REPUBLIC the DAFNE V project Leskova Emilia 1 and Sukenikova Helena 2 1 Food Research Institute, Bratislava, Slovak Republic 2 Statistical Office of the Slovak
Working Paper Series. Measuring food insecurity: Global estimates. Nanak Kakwani Hyun H. Son ECINEQ WP
 Working Paper Series Measuring food insecurity: Global estimates Nanak Kakwani Hyun H. Son ECINEQ WP 2015-370 ECINEQ 2015-370 August 2015 www.ecineq.org Measuring food insecurity: Global estimates Nanak
Faculty of Health Sciences Food Consumption Patterns among Syrian Refugees
 Faculty of Health Sciences Food Consumption Patterns among Syrian Refugees Vulnerability Assessment and Mapping Unit. WFP Lebanon. Presented by Mazen Makarem Background Increasing influx of Syrian refugees
Executive Board of the United Nations Development Programme, the United Nations Population Fund and the United Nations Office for Project Services
 United Nations Executive Board of the United Nations Development Programme, the United Nations Population Fund and the United Nations Office for Project Services Distr.: General 12 July 2011 Original:
An Economic Analysis of Changes in the Per Capita Nutrient Intake and Nutritional Inadequacy in Tamil Nadu, India
 International Journal of Current Microbiology and Applied Sciences ISSN: 2319-7706 Volume 6 Number 3 (2017) pp. 2265-2275 Journal homepage: http://www.ijcmas.com Original Research Article http://doi.org/10.20546/ijcmas.2017.603.259
FOOD AID FLOWS. A: Analysis of the adequacy of the planned theoretical ration 2
 FOOD AID FLOWS An analysis of food security in a food aid dependent population needs to take into account the overall performance of the food distribution system 1, in addition to the household-level questions
Trends in food availability in MALTA the DAFNE V project
 Trends in food availability in MALTA the DAFNE V project Lucienne Pace 1, Etienne Caruana 2 and Nicola Camilleri 2 1 Health Promotion Department, Ministry of Health, Malta 2 National Statistical Office,
The cost of the double burden of malnutrition. April Economic Commission for Latin America and the Caribbean
 The cost of the double burden of malnutrition April 2017 Economic Commission for Latin America and the Caribbean What is the double burden of malnutrition? Undernutrition and obesity are often treated
Section 1: Nutrition Competencies and Grade Level Expectations Middle School and High School
 and Nutrition Competency I: Students will know and understand the relationship between the human body, nutrition and energy balance. (A) Know the six nutrient groups and their functions: Name the key nutrients
genetic diversity for sustaining agricultural diversity
 genetic diversity for sustaining agricultural diversity Thomas Dubois Global Action Plan for Agricultural Diversification (GAPAD) contribution of agricultural diversification to SDG2 of the UN sustainable
SUMMARY REPORT GENERAL NUTRITION SURVEY
 SUMMARY REPORT GENERAL NUTRITION SURVEY 29-21 NATIONAL NUTRITION STRATEGY FOR 211 22, WITH A VISION TOWARD 23 NATIONAL INSTITUTE OF NUTRITION MINISTRY OF HEALTH UNITED NATIONS CHILDREN S FUND SUMMARY Assessment
Maternal Dietary Intake and Nutritional Status in the Philippines: The 8 th National Nutrition Survey Results
 ILSI SEA Region Seminar on Maternal, Infant and Young Child Nutrition, July 24, 217, Bangkok, Thailand Maternal Dietary Intake and Nutritional Status in the Philippines: The 8 th National Nutrition Survey
Measuring dietary energy deficiency and the impact of food price variations at the household level
 Measuring dietary energy deficiency and the impact of food price variations at the household level Gustavo Anríquez, Panagiotis Karfakis, Silvio Daidone and Erdgin Mane ESA Working paper No. 10-02 July
Review of Approaches to Measuring Food Consumption for Food-based Micronutrient Programming
 Review of Approaches to Measuring Food Consumption for Food-based Micronutrient Programming Jennifer Coates, Brooke Colaiezzi, James Wirth, Jack Fiedler, Bea Rogers MAD Group Food Consumption Measurement
PROTEINS: the often neglected nutrient in development
 PROTEINS: the often neglected nutrient in development by WILNA OLDEWAGE-THERON PhD RD (SA) CENTRE OF SUSTAINABLE LIVELIHOODS Vaal University of Technology South Africa OUTLINE of PRESENTATION The role
FOOD AND AGRICULTURE ORGANIZATION OF THE UNITED NATIONS (FAO) Project: Intensified Monitoring of Food Security in 5 CIS Countries (GCP/INT/814/EC)
 Project: Intensified Monitoring of Food Security in 5 CIS Countries (GCP/INT/814/EC)") FOOD AND AGRICULTURE ORGANIZATION OF THE UNITED NATIONS (FAO) Project: Intensified Monitoring of Food Security in 5 CIS Countries (GCP/INT/814/EC) TRAINING IN THE PREPARATION OF FOOD BALANCE SHEETS Prepared
FOOD AND AGRICULTURE ORGANIZATION OF THE UNITED NATIONS (FAO) Project: Intensified Monitoring of Food Security in 5 CIS Countries (GCP/INT/814/EC) TRAINING IN THE PREPARATION OF FOOD BALANCE SHEETS Prepared
From malnutrition to nutrition security
 From malnutrition to nutrition security Martin W. Bloem, MD, PhD Senior Nutrition Advisor/WFP Global Coordinator UNAIDS World Food Program Nurturing development: Improving human nutrition with animal-source
Food and Nutrition Security Indicators: A Review
 Food and Nutrition Security Indicators: A Review Evita Pangaribowo Based on FoodSecure WP5 by Evita Pangaribowo, Nicolas Gerber, Maximo Torero Outline Background The Conceptual Framework Existing indicators
Prospective study on nutrition transition in China
 Prospective study on nutrition transition in China Fengying Zhai, Huijun Wang, Shufa Du, Yuna He, Zhihong Wang, Keyou Ge, and Barry M Popkin The aim of the prospective study reported here was to examine
Uganda Fortification Assessment Coverage Tool: (FACT) Overview and Results Kampala, Uganda 23 May 2016
 Overview and Results Kampala, Uganda 23 May 2016") Uganda Fortification Assessment Coverage Tool: (FACT) Overview and Results Kampala, Uganda 23 May 2016 www.gainhealth.org Background 2 Background and Rationale High burden of malnutrition in Uganda National
Uganda Fortification Assessment Coverage Tool: (FACT) Overview and Results Kampala, Uganda 23 May 2016 www.gainhealth.org Background 2 Background and Rationale High burden of malnutrition in Uganda National
Sources of nutritional data
 The use of household budget survey data for monitoring food availability in Europe the Data Food Networking (DAFNE) initiative Antonia Trichopoulou & Androniki Naska for the DAFNE team Dept. of Hygiene
Biofortified pearl millet cultivars to fight iron and zinc deficiencies in India
 Biofortified pearl millet cultivars to fight iron and zinc deficiencies in India Inadequate intake of energy-providing organic macronutrients (largely carbohydrate, followed by protein and fat, in that
Canada s Food Supply: A Preliminary Examination of Changes,
 Canada s Food Supply: A Preliminary Examination of Changes, 1992-2002 Canada's Food Guide to Healthy Eating, released in 1992, is a key nutrition education tool for Canadians aged four years and over.
Rosalind S Gibson, Tommaso Cavalli-Sforza, Research Professor, Department of Human Nutrition, University of Otago, Dunedin New Zealand
 Using reference nutrient density goals with food balance sheet data to identify likely micronutrient deficits for fortification in countries in the Western Pacific Region Rosalind S Gibson, Research Professor,
SUSTAINABLE DEVELOPMENT GOALS
 SUSTAINABLE DEVELOPMENT GOALS (SDGs) ETHIOPIA FACT SHEET JULY 2017 Federal Democratic Republic of Ethiopia Central Statistical Agency (CSA) Demographics Indicator Source Value Total population 2017 Projection
WFP and the Nutrition Decade
 WFP and the Nutrition Decade WFP s strategic plan focuses on ending hunger and contributing to a revitalized global partnership, key components to implement and achieve the Sustainable Development Goals
A Simple Method of Measuring Dietary Diversity at Population Level
 A Simple Method of Measuring Dietary Diversity at Population Level NP Steyn, D Labadarios, JH Nel Social science that makes a difference Date: Introduction Determining dietary diversity in RSA adults has
The persistence of global hunger and malnutrition highlight the continuing problems of food insecurity (defined as a situation in which all houses
 4 Food Security 81 Introduction The persistence of global hunger and malnutrition highlight the continuing problems of food insecurity (defined as a situation in which all houses do not have both physical
The Pork Consumption Characteristics of Chinese Urban Residents: The Outlook for 2020
 Journal of Food Science and Engineering 6 (2016) 11-20 doi: 10.17265/2159-5828/2016.01.002 D DAVID PUBLISHING The Pork Consumption Characteristics of Chinese Residents: The Outlook for 2020 Zhiyang Yin
Nutritional Profile of Urban Preschool Children of Punjab
 KamlaRaj 2003 Anthropologist, 5 (3): 149153 (2003) Nutritional Profile of Urban Preschool Children of Punjab Inderjit Singh and Kiran Grover Growth retardation and malnutrition are the major public health
VAM GUIDANCE PAPER. Conducting Food Security Assessments using Household Expenditure Surveys (HES)
") VAM GUIDANCE PAPER Conducting Food Security Assessments using Household Expenditure Surveys (HES) Prepared by: Astrid Mathiassen, Darryl Miller, Aysha Twose, Amit Wadhwa. Reviewed by: Rossella Bottone
VAM GUIDANCE PAPER Conducting Food Security Assessments using Household Expenditure Surveys (HES) Prepared by: Astrid Mathiassen, Darryl Miller, Aysha Twose, Amit Wadhwa. Reviewed by: Rossella Bottone
Effect of Socio Economic Factors on Food and Nutrient Consumption of Rural Women
 IOSR Journal Of Humanities And Social Science (IOSR-JHSS) Volume 23, Issue 12, Ver. 4 (December. 2018) 65-79 e-issn: 2279-0837, p-issn: 2279-0845. www.iosrjournals.org Effect of Socio Economic Factors
The Relative Importance of Per Capita Expenditure on Animal Protein by Different Income Categories in Egypt's Urban and Rural Sectors
 AMERICAN-EURASIAN JOURNAL OF SUSTAINABLE AGRICULTURE ISSN: 1995-0748, EISSN: 1998-1074 2016, volume(10), issue(1): pages (15-23) Published Online 22 February 2016 in http://www.aensiweb.com/aejsa/ The
A Comparison of Nutritional Status of Women Suffering from Mental Illness in Urban and Rural Areas of Bangladesh
 International Journal of Nutrition and Food Sciences 2017; 6(2): 65-70 http://www.sciencepublishinggroup.com/j/ijnfs doi: 10.11648/j.ijnfs.20170602.12 ISSN: 2327-2694 (Print); ISSN: 2327-2716 (Online)
Fill the Nutrient Gap Analysis: An introduction. Giulia Baldi, MPH WFP, Nutrition Division
 Fill the Nutrient Gap Analysis: An introduction Giulia Baldi, MPH WFP, Nutrition Division 2 Meeting nutrient requirements is a prerequisite for preventing malnutrition MALNUTRITION Inadequate dietary intake
THE ROME ACCORD ICN2 zero draft political outcome document for 19 November 2014
 THE ROME ACCORD ICN2 zero draft political outcome document for 19 November 2014 We,..., assembled at the Second International Conference on Nutrition, on 19-21 November 2014, to address the multiple threats
2. food groups: Categories of similar foods, such as fruits or vegetables.
 Chapter 2 Nutrition Guidelines: Tools for a Healthy Diet Key Terms 1. nutrient density: A description of the healthfulness of foods. 2. food groups: Categories of similar foods, such as fruits or vegetables.
The Millennium Development Goals Report. asdf. Gender Chart UNITED NATIONS. Photo: Quoc Nguyen/ UNDP Picture This
 The Millennium Development Goals Report Gender Chart asdf UNITED NATIONS Photo: Quoc Nguyen/ UNDP Picture This Goal Eradicate extreme poverty and hunger Women in sub- are more likely than men to live in
Philippines - Food and Nutrition Security Profiles
 Key Indicators Philippines - Food and Nutrition Security Profiles Although the Philippines has experienced growth in per-capita GDP and Dietary Energy Supply (DES), the dietary quality has remained poor
Improving Efficiency in Health Washington, D.C. 3 February 2016
 HIV Resource Allocation using the Goals Model John Stover Adebiyi Adesina, Lori Bollinger, Rudolph Chandler, Eline Korenromp, Guy Mahiane, Carel Pretorius, Rachel Sanders, Peter Stegman, Michel Tcheunche,
Food for a healthy and active life: New indicators to guide action in the agriculture and food sector
 Food for a healthy and active life: New indicators to guide action in the agriculture and food sector Anna Herforth, Ph.D. Independent Consultant Visiting Fellow, Cornell University Festschrift, Dec 13,
THE UNITED REPUBLIC OF TANZANIA September 2017
 THE UNITED REPUBLIC OF TANZANIA HEALTH DATA COLLABORATIVE (THDC) LAUNCH MEETING Update of M&E Strengthening Initiatives (M&E SI) A Tanzanian Platform for Health Information and Accountability 11-12 September
Demographic and Health Survey Key Findings
 Tanzania 2004-05 Demographic and Health Survey Key Findings This report summarizes the findings of the 2004-05 Tanzania Demographic and Health Survey (2004-05 TDHS), carried out by the Tanzania National
The State of Food and Agriculture 2013: Food systems for better nutrition Questions and Answers
 The State of Food and Agriculture 2013: Food systems for better nutrition Questions and Answers What is malnutrition? Malnutrition is an abnormal physiological condition caused by inadequate, unbalanced
Executive Board of the United Nations Development Programme and of the United Nations Population Fund
 United Nations DP/FPA/CPD/MOZ/7 Executive Board of the United Nations Development Programme and of the United Nations Population Fund Distr.: General 18 October 2006 Original: English UNITED NATIONS POPULATION
Policy Brief. Connecting the dots between supplementary feeding and school gardens
 Policy Brief Connecting the dots between supplementary feeding and school gardens Introduction The Philippine National Nutrition Survey conducted by the Food and Nutrition Research Institute of the Department
Presentation Objectives
 Assessment of Nutritional Status & Food insecurity Presented by Megan Christensen, MS, RD Health and Aging Policy Fellow Assistant Chief/Clinical Nutrition Manager VA Salt Lake City Health Care System
Supplementary Materials for
 www.sciencemag.org/content/348/6245/238/suppl/dc1 Supplementary Materials for Metrics for land-scarce agriculture Ruth DeFries, Jessica Fanzo, Roseline Remans, Cheryl Palm, Stephen Wood, Tal L. Anderman
3. FOOD CONSUMPTION PATTERNS IN INDIA
 3. FOOD CONSUMPTION PATTERNS IN INDIA Introduction India is a vast and varied subcontinent, with 2.4% of its global landmass supporting over one-sixth of the world s population. At the time of independence
Chege et al...j. Appl. Biosci Study on diet, morbidity and nutrition of HIV/AIDS infected/non-infected children
 A comparative study on dietary practices, morbidity patterns and nutrition status of HIV/AIDS infected and non-infected pre-school children in Kibera slum, Kenya Chege P.*, Kuria E. and Kimiywe J. Journal
Internally displaced people at Camp Bentiu in South Sudan collect aid, including sorghum, salt, vegetable oil, and baby food. Many South Sudanese
 0 Internally displaced people at Camp Bentiu in South Sudan collect aid, including sorghum, salt, vegetable oil, and baby food. Many South Sudanese have left their villages seeking not only refuge from
BATAN ES L U Z O N S T R A I T BABUYAN CHANNEL SIBUYAN SEA M O R O G U L F
 BATAN ES N Cordillera Administrative Region (CAR) (Abra, Apayao, Benguet, Ifugao, Kalinga, Mt. Province) Region I-Ilocos (Ilocos Norte, Ilocos Sur, La Union, Pangasinan) L U Z O N S T R A I T BABUYAN CHANNEL