AICSTE 2013 CONFERENCE PROCEEDINGS. Abuja International Conference on Science, Technology and Engineering. let s meet at the centre of excellence
|
|
|
- Joshua Gilmore
- 5 years ago
- Views:
Transcription


1 AICSTE 2013 Abuja International Conference on Science, Technology and Engineering November ABUJA-NIGERIA CONFERENCE PROCEEDINGS let s meet at the centre of excellence
2 AICSTE2013 ABUJA INTERNATIONAL CONFERENCE ON SCIENCE, TECHNOLOGY AND ENGINEERING November ABUJA-NIGERIA Proceedings Book EDITED BY Jacinta A. Opara,PhD Nkasiobi S. Oguzor,PhD Abraham I. Oba,PhD
3 2013 Beverly Scientific Organisation (BSO) All rights reserved Printed and Published in the Kingdom of Spain First Published in 2013 Calle Barcelona bajo s/n Granada Spain Tel/Fax: The right of the Editors to be identified as the authors of this work has been asserted according to relevant EU laws and regulations. The publication is indexed and registered at Ministry of Culture, Madrid Typeset and Illustrations by Luis Cabellero(Spain) Proofreading by Ms Betty Oruhwo (Ghana) and Veronica Ezebuiro Cover Design by Christophe Guerrero(France) Project Manager: Joseph Kosu(Ghana) Project Assistant: Felicia Uwakwe and Nkeiru Kamalu(Nigeria) Lithography: Beverly Resources, Spain Sub-Editing: Dominic Connolly(Ireland) Media and ICT: Prince Alexis(Ghana) Apart from any fair dealing for the purposes of research or private study, or criticism or review, as permitted by European Commission, this publication may only be reproduced, stored or transmitted, in any form or by any means, electronic, mechanical, photocopying, recording or otherwise with the prior permission in writing of the publishers.
4 DETERMINATION OF PULP AND PAPER MAKING SUITABILITY INDICES OF SOME NIGERIAN SPECIES OF LEGUMINOSAE: CAESALPINOIDEAE Ojo Dorcas Olufunmilayo Department Of Biology, Federal College Of Education (Special), Oyo-Nigeria ABSTRACT Uncontrolled felling of trees for domestic and industrial uses is fast depleting the tropical forests and has led to a continued exploitation of Gmelina arborea Roxb. plantations for fuel wood and timber, a development that is threatening the ecosystem and the survival of the pulp and paper making (PPM) industries in Nigeria. This study proposes an objective method for selecting hardwood species for PPM by statistically comparing the available anatomical and other related data in the reference wood (i.e G. arborea Roxb.) with those of alternative hard wood species. (i.e twelve Nigerian species of Caesalpinioideae ). Mature stem branches (8-12cm diameter ) of twelve species, representing nine genera of the family were collected at various locations in Oyo state. A similar stem branch of G. arborea Roxb. was collected as a standard raw material for pulp and paper making. Using conventional wood anatomical techniques, nine qualitative and twenty quantitative characters were determined. The means of all the quantitative characters were compared by conducting a One-way classification analysis of variance using the version 17.0 SPSS package. Also t-test conducted indicated a significant difference between data from each of the species of Caesalpinoideae and that of G. arborea. Based on the result of the comparison, a numeric value by which the PPM potential of the alternative hardwood species was precisely defined. Results show that the woods of Caesalpinioideae species investigated are highly suitable wood resources for PPM, virtually all the species can be said to be among the best substitutes for G. arborea each being at least 75% suitable for papermaking in comparison with G. arborea. The Caesalpinioideae species investigated in order of their preferences for PPM are listed as Tamarindus indica (1.5426), Delonix regia (1.2781), Brachystegia eurycoma (1.1801), Senna sieberiana (1.1565), Bauhinia rufescens (1.1119), Afzelia africana (1.0836), Senna siamea (1.0647), Danielia ogea (1.0400), Piliostigma thoningii (0.9431), Detarium senegalensis (0.9114), Danielia oliveri ( ) and Caesalpinia pulcherima (0.7562). Key words: Suitability Index; Caesalpinoideae; G. arborea; pulp and paper; algorithmic botany Introduction Paper is cellulose, extracted from plant materials the quality of which depends on fineness and brightness of the fibres. Papers are produced from muli bamboo (Melocanna baccifera), sugarcane bargasse (Saccharum officinarum) Exoecaria agallocha, Phragmites karka, Gmelina arborea, Albizia falcataria e.t.c. Also, green jute plant (Cocchorus capsularis and C olitorius ) are being used for making pulp (Walton, 1981). Paper is defined as thin material mainly used for writing upon, printing upon or packaging. It is produced by the amalgamation of fibres, typically vegetable fibres composed of cellulose, which are subsequently held together by hydrogen bonding. While the fibres are usually natural in origin, a wide variety of synthetic fibers, such as polypropylene and polyethylene, may be incorporated into paper as a way of imparting desirable physical properties. The most common source of natural fibres for paper making is wood pulp from pulpwood trees. Vegetable fibre materials such as cotton, hemp, linen and rice are also used (Tsuen-Hsuin, 1986).
5 According to Anon, 1984; 1990 in Ogunkunle 2010, Gmelina arborea Roxb. and Eucalyptus species have been found among many Nigerian hardwood species to be suitable for pulp and papermaking ( PPM). In Nigeria, the high cost of newsprint and other paper grades has necessitated a search for suitable pulpwood to support the pulp and paper mill. G. arborea has been exhaustively studied and recognized as suitable for pulp and paper production (Kpikpi, 1989) and is now the most popular pulpwood species in Nigeria (Chow and Lucas, 1988) (Ojo, 2012). This is because of its conformity with the qualities of an ideal pulpwood such as rapid growth rate for economical plantation management, longer than average fibre length, Runkel ratio of less than 1, low basic wood density, low chemical extractives and so on (Ogunkunle, 2010). Therefore in the search for an alternative wood resources for paper production, researchers usually evaluate anatomical and other relevant PPM characteristics in tropical wood samples and define their suitability in relation to the available data on G. arborea wood ( Ogunkunle and Oladele 2008). Caesalpinioideae is a botanical name at the rank of subfamily, placed in the large family Fabaceae or Leguminosae. Its name was derived from the generic name Caesalpinia. According to Wojciechowski, M.F, Johanna M, and Bruce J. (2006), Caesalpinioideae can be said to be paraphyletic because Papilionoideae and Mimosoideae arose from within it. Therefore, it is likely to be split into several subfamilies, although it is not yet clear what those subfamilies should be. (Wojciechowski, M.F, Johanna M, and Bruce J., 2006; Bruneau, B. F., Forest, P.S., Herendeen, B.B., Klitgaard, and Lewis,G.P., 2001). The 2000 species of sub- family Caesalpinioideae are mostly native to tropical and sub-tropical regions. Nearly all of the taxa are shrubs and trees. The purpose of this paper is to statistically determine the suitability indices of some species of Caesalpinoideae and compare data on these potential PPM wood resources with one another and with those of the widely accepted standard raw material, G. arborea using the Suitability Index model to compute the PPM suitability indices of these species of Casalpinoideae. Materials and methods Matured wood of each species of between 8 and 12cm thick were collected, cut into blocks of about 10cm long. Transverse Section, (T.S), Tangential Longitudinal Section (T.L.S) and Radial Longitudinal Section (R.L.S) of the wood samples of about 10 micron thickness was done using sledge microtome. These sections were stained,mounted in DPX and examined with a monocular light microscope. Some cell dimensions such as fibre length (L), fibre diameter (D), height and width of rays in TLS, diameter and lumen width of vessels, thickness of fibre in TS, and vessel wall thickness were determined with the aid of a calibrated ocular micrometer fitted to the microscope. The other wood characteristics determined included number of cells in ray height and ray width (in TLS), densities of fbre, vessel, ray and parenchyma per mm², percentage composition of fibre, vessel, parenchyma and ray in the wood of the 12 species of Caesalpinioideae. The sample size in each case was 30 except in such cases as length of isolated vessel members in which the structures were usually few. From the various fibre, vessel, and ray dimensions, a derived ratio namely; the relative fibre length that may be of diagnostic value was computed using the formula: Relative fibre length (RFL) =L/D Where L=fibre length; D=fibre diameter The percentage composition by volume of wood tissue in respect of fibres, vessels, axial parenchyma and rays were determined from the slides of wood TS. In doing this the ocular cytometer with 100 squares was used. An area of four squares on the cytometer was viewed each time and each tissue type that fell within this area was noted with tally. Twentyfive such observations were made within the 100 squares area. The frequency by volume of a tissue type was determined as a simple percentage of the total number of occurrence within the 100 squares of the cytometer. Four of such slides were observed and the mean value reported. From the percentage tissue composition by volume, some standard ratios such as Fibre-to-Vessel ratio (F/V) and Fibres to Non-fibrous tissue ratio (F/NF) were determined (Kpikpi and Olatunji, 1990 and Kpikpi, 1992). The percentage occurrence of vessels with tylose was also computed from TS of wood. Fifty vessels were randomly observed from prepared slides and the number of those
6 vessels containing tylose was noted. The percentage of this number was then determined from its simple ratio to the total number of observations. From 10 randomly selected fields of view in the wood TLS, the percentage of occurrence of different ray types was calculated. For each field of view, the number of each ray type and the total number of all ray types were first determined. Furthermore, the number of each ray type was noted and its percentage of occurrence calculated from a simple ratio of this number to the total number of observations. The mean of all the fields of view was computed and reported. The density of vessels, fibres, axial parenchyma and rays also determined per mm² area of wood. While the slides of wood TS were used for vessels, fibres and axial parenchyma that of TLS was used for ray density determination. In each case, the ocular grid of 100 squares whose dimension had earlier been determined was used. The slides were made to pass under the grid at known objective lenses and the number of cells of each tissue type falling within the grid was counted. This number was then converted into number of such cells in one mm² of wood by direct proportion, the sample size being 30. Moreover, some pulp and paper-based derived ratios were computed. The relevant formulae as variously defined by Wood (1989); Kpikpi and Olatunji (1990) and Uju and Ugwoke (1997) are: Runkel ratio = 2C/I Coefficient of fibre flexibility (or felting coefficient) = L/D Where, L= fibre length; C = fibre cell wall thickness; D= fibre diameter ; I = fibre lumen width. The Conventional Approach to Wood comparison and selection for Pulp and Papermaking: Using both the mean wood dimensional and qualitative characteristics obtained from Gmelina arborea as a standard, those wood characteristics in the 12 species of Caesalpinioideae were compared with one another and with those of the standard using the orthodox or the descriptive technique. The technique consisted in the use of photographs, and descriptive statements of comparison (Kpikpi and Olatunji, 1990); the use of purely descriptive statements vis-à-vis dimensional data from G. arborea and those of the species of Caesalpinioideae placed side by side (Kpikpi and Olatunji,1990; Fuwape,1991;and Kpikpi, 1992), and the use of results of statistical analyses with reference to the charts of the principal fibre dimensional characteristics and their derived ratios (Uju and Ugokwe, 1997). Standard Plant Material Mature wood of Gmelina arborea tree was taken as the standard plant material (Ogunkunle, A.T.J, Oladele, F.A. and Ayinde, K., 2004). Seventeen pulp and paper based quantitative characteristics (Tables 1 and 2 ) were drawn from this sample, the reference data were then taken to be the most desirable mean values of each of the 17 wood parameters, of which the mature Gmelina arborea tree was representative. The % tissues by wood volume (i.e. vessels, fibres, parenchyma, ray, F/V ratio and F/NF ratio), were determined in replicates of four while data on the other eleven parameters were taken in replicates of 30 (Ogunkunle, A.T. J, Oladele, F.A. and Ayinde, K., 2004). Experimental Plant Materials The experimental plant materials were the wood samples of 12 species of Caesalpinioideae collected (Table 1). From these alternative wood samples, data on the 17 pulp and paper- based wood characteristics were drawn in replicates as in Gmelina arborea wood with the aim of determining their PPM suitability in relation to the standard plant material. The formula used was as presented by Ogunkunle, A.T.J, Oladele, F.A. and Ayinde, K. (2004), as follows: SI = { φjwi }{ φjwj} { μiwi }{ μiwj} Where : SI= suitability index of experimental wood material φj = mean values of the parameters in the alternative wood μi= mean values of the parameters in the standard wood wj = projected PPM output values of φj wi = projected PPM output values of μi
7 Results and discussion Tables 1 and 2 show the data obtained from both the reference (G. arborea ) and the alternative ( Caesalpinoideae species) wood samples. The Caesalpinoideae species studied can be listed in order of their preference for PPM as Tamarindus indica, Delonix regia, Brachystegia eurycoma, Senna sieberiana, Bauhinia rufescens, Afzelia africana, Senna siamea, Danielia ogea, Piliostigma thoningii, Detarium senegalensis, Danielia oliveri and Caesalpinia pulcherima, with suitability indices of , , , , , , , , , , and respectively. These results show that the woods of Caesalpinioideae species investigated are highly suitable wood resources for PPM. From these results, virtually all the species can be said to be among the best substitutes for G. arborea each being at least 75% suitable for papermaking in comparison with G. arborea. The results of the t-tests conducted indicated a significant difference between data from each of the 12 species of Caesalpinioideae and that of G. arborea (Table 3). These results cannot be overemphasized for the fact that the data from Caesalpinioideae species used in the comparisons were the means of the projected PPM outputs for the species rather than the computed suitability indices themselves. Table 1: Mean proportion by volume of some tissue types in the wood of G.arborea and some Nigerian species of Caesalpinoideae Mean Percentage by Volume Mean Number of cells / mm 2 Species Fibre*(F) Vessel*(V) Parenchy (P)* Ray* ( R) F/V* F/NF* Fibres Vessels Ray Parenchyma 1.Gmelina ± ± ± ± ± ± a ± b ± d ± b ± arborea 2.Afzelia 21.87± ± ± ± ± ± ª± ª± ª± ª ± africana 3.Bauhinia 28.19± ± ± ± ± ± b ± e ± b ± ª ± 6.76 rufescens 4.Brachystegia 18.52± ± ± ± ± ± ª± b ± ª± b ± eurycoma 5.Caesalpinia 23.95± ± ± ± ± ± ª± f ± b ± ª ± 6.76 pulcherima 6.Danielia 48.85± ± ± ± ± ± b ± d ± ª± ª ± 9.49 ogea 7.Danielia 26.40± ± ± ± ± ± ª±9.49 2ª± ª± ª±2.92 oliveri 8.Delonix 33.29± ± ± ± ± ± ª±9.49 2ª±0.18 3ª± ª±9.13 regia 9.Detarium 3.85± ± ± ± ± ± ª± ª± ª± b ±27.02 senegalense 10.Piliostigma 14.72± ± ± ± ± ± ª± b ± c ± ª±5.48 thoningii 11.Senna 33.55± ± ± ± ± ± b ± c ± ª± ª±11.5 siamea 12.Senna 32.74± ± ± ± ± ± ª± b ± b ± b ±16.34 sieberiana 13.Tamarindus indica 21.24± ± ± ± ± ± c ± b ± b ± b ±76.87 F/V =Fibre-to- Vessel ratio; F/NF =Fibres to nonfibrous tissue ratio= (F/V+P+R); Table 2 : Some pulp and paper-based wood fibre and wood constituent characteristics in G. arborea and some Nigerian species of Caesalpinoideae Mean Fibre dimensions ( µm) Mean fibre - derived ratios Species Length Diameter Wall thick Lumen width RFL (L/D) Runkel (2C/I) Coeff. I/D 1.Gmelina arborea a ± b ± a ± b ± a ± b ± f ± Afzelia africana l b ± ª± ª± ª± b ± a ± c ± Bauhinia rufescens b ± ª± ª± ª± b ± b ± b ± Brachystegia eurycoma b ± ª± ª± ª± b ± a ± c ± 0.02
8 5.Caesalpinia pulcherima ª± ª± b ± ª± b ± b ± b ± Danielia ogea b ± ª± b ± ª± b ± b ± b ± Danielia oliveri b ± a ± c ± ª± b ± c ± a ± Delonix regia b ± c ± ª± b ± b ± a ± d ± Detarium senegalense ª± ª± ª± ª± ±3.59 b 0.44 a ± d ± Piliostigma thoningii b ± ª± ª± ª± b ± b ± b ± Senna siamea b ± Senna sieberiana b ± ª± ª± ª± b ± a ± c ± ª± b ± ª± b ± c ± a ± Tamarindus indica ª± ª± ª± ª± b ± b ± b ± 0.03 RFL= Relative fibre length ( Fibre slenderness); Coeff.= Coefficient of flexibility; Runkel = Runkel ratio ; Means of Caesalpinoideae species with no significant difference from that of G. arborea bear the same superscripts with G. arborea (P 0.05) while means with significant difference bear a different superscript (P 0.05) Table 3 : PPM suitability indices and means of projected PPM suitability values compared for 12 Nigerian species of Caesalpinioideae * Species Suitability index t df Mean Sig.2-tailed Mean Difference. 1.Afzelia africana Bauhinia rufescens Brachystegia eurycoma Caesalpinia pulcherima Danielia ogea Danielia oliveri Delonix regia Detarium senegalense Piliostigma thoningii Senna siamea Senna sieberiana Tamarindus indica * Test value= 1; PPM, Pulp and paper making Figs.1 to 5 shows the variations in five PPM key parameters of the thirteen woody species studied namely, the mean Fibre-to-Vessel ratio (fig.1), mean Fibre-to-Non-fibrous tissues ratio (fig.2), the mean fibre slenderness ratio (fig3), mean Runkel ratio (fig. 4) and mean coefficient of fibre flexibility (fig. 5).
9 Mean gme afa bar bre cap dao dal der des pit ses seb tai Fig. 1 Variations in the mean Fibre - to - vessel ratios in the wood of 13 tree species studied. Error bars: +/- 1 SE gme = Gmelina arborea ; afa = Afzelia africana; bar = Bauhina rufescens ; bre = Brachstegia eurycoma ; cap = Caesalpinia pulcherima ; dao = Danielia ogea; dal = Danielia oliveri; der = Delonix regia; des = Detarium senegalensis ; pit = Piliostigma thoningii ; ses = Senna siamea; seb = Senna sieberiana ; tai = Tamarindus indica Mean gme afa bar bre cap dao dal der des pit ses seb tai Fig.2 Variations in the mean Fibre-to-Nonfibrous tissue ratios in the wood of 13 tree species studied. Error bars: +/- 1 SE gme = Gmelina arborea ; afa = Afzelia africana; bar = Bauhina rufescens ; bre = Brachstegia eurycoma ; cap = Caesalpinia pulcherima ; dao = Danielia ogea; dal = Danielia oliveri; der = Delonix regia; des = Detarium senegalensis ; pit = Piliostigma thoningii ; ses = Senna siamea; seb = Senna sieberiana ; tai = Tamarindus indica.
10 Title Mean gme afa bar bre cap dao dal der des pit ses seb tai Error bars: +/ 1 SE Fig.3 Variations in the mean Relative Fibre Lengths in the wood of 13 tree species studied. gme = Gmelina arborea ; afa = Afzelia africana; bar = Bauhina rufescens ; bre = Brachstegia eurycoma ; cap = Caesalpinia pulcherima ; dao = Danielia ogea; dal = Danielia oliveri; der = Delonix regia; des = Detarium senegalensis ; pit = Piliostigma thoningii ; ses = Senna siamea; seb = Senna sieberiana ; tai = Tamarindus indica Mean gme afa bar bre cap dao dal der des pit ses seb tai Fig 4 Variations in the mean Runkel ratios in the wood of 13 tree species studied. Error bars: +/- 1 SE gme = Gmelina arborea ; afa = Afzelia africana; bar = Bauhina rufescens ; bre = Brachstegia eurycoma ; cap = Caesalpinia pulcherima ; dao = Danielia ogea; dal = Danielia oliveri; der = Delonix regia; des = Detarium senegalensis ; pit = Piliostigma thoningii ; ses = Senna siamea; seb = Senna sieberiana ; tai = Tamarindus indica.

11 Conclusion The pulp and paper making suitability of 12 hardwood species have been quantified, a contribution that has an edge over the conventional method. Moreover, going by the fibre characteristics of eight of the experimental wood samples, (namely, Tamarindus indica, Delonix regia, Brachystegia eurycoma, Senna sieberiana, Bauhinia rufescens, Afzelia africana, Senna siamea, Danielia ogea, with over 100% suitability index value) the wood can be said to be more suitable raw material than G.arborea in pulp and papermaking. References Anon, 1984.Chemical Analysis of Nigerian Grown timbers. Annual Report Of The Forestry Research Institute of Nigeria (FRIN). Jan-Dec pp: Anon, Raw materials requirements of industries and their local availability. In: Raw Materials Sourcing for Manufacturing in Nigeria. MacMillan Nigerian Publishers, pp: 122. Bruneau, B. F., Forest, P.S., Herendeen, B.B., Klitgaard, and Lewis, G.P. (2001). Phylogenetic relationships in the Caesalpinioideae (Leguminosae) as inferred from chloroplast trnlintron sequences. Systematic Botany 26: Chow P., and Lucas E.B. (1998). Fuel characteristics of selected four-year-old trees in Nigeria wood and fibre. Science.20 (4) : Kpikpi, W. M. (1989). Trema guineesis: an appropriate tropical hardwood for pulp and paper production. TAPPI journal 72 (1): Kpikpi W.M. (1992) Paper making potential of two hard woods. Nigerian Journal of Botany Vol.5 pp Kpikpi W.M and Olatunji O.A (1990).Wood anatomy consideration in deciding the suitability of some Nigerian Hardwoods for pulp and paper production. Nigerian Journal of Botany Vol.3 pp Ogunkunle, A.T.J, Oladele, F.A. and Ayinde, K. (2004). A Model for optimizing the use of Gmelina arborea wood in Pulp and Paper making. Science Focus, Vol.7 pp Ogunkunle, A.T.J. and Oladele, F.A. (2008). Structural Dimensions and Paper Making Potentials of Wood in Some Nigerian Species of Ficus L. (Moraceae). Advances in Natural and Applied Sciences, 2(3): Ogunkunle, A.T.J. (2010) A quantitative Modeling of Pulp and Paper Making suitability of Nigerian Hardwood Species. Advances in Natural and Applied Sciences, 4(1):14-21.
12 Ojo, D.O (2012). The diagnostic potentials of wood structure in Leguminosae: Caesalpinioideae.(Unpublished thesis). Tsuen-Hsuin, T. (1986). Paper and printing, Vol.5 part 1of Needham Joseph, Science and Civilisation in China: Cambridge university press. Uju, C. C. and Ugwoke, C.E. (1997). Studies on the dimensions and suitability of wood fibres of selected tree species of the family Moraceae in papermaking. Nigerian Journal of Botany, 10: 7-13 Watson, J.A. (1981). Wood work in Theory and Practice. Anstralasian Publishing Company, London. Wojciechowski, M. F, Johanna M, and Bruce J. (2006). "Fabaceae". The Tree of Life Web Project.
13 RAPID DIAGNOSTIC TEST CASSETTE: A SOURCE OF DNA FOR MALARIA DIAGNOSIS BY PCR AND A QUALITY CONTROL TOOL FOR THE TEST PERFORMANCE Godwill A. Engwa 12, Olivia A. Achundoh 1, Wilfred F. Mbacham 1 1 Laboratory for Public Health Research Biotechnologies (LAPHER-Biotech), the Biotechnology Center, University of Yaounde I, Yaounde, Cameroon 2 Department of Biotechnology, International Bio-Research Institute, Ugwogo-Nike, Enugu State Nigeria ABSTRACT RDT is a malaria diagnostic tool used for early diagnosis of the disease. Though reliable, their challenging performance demands for continuous quality control monitoring. In this study, we evaluated the use of RDT cassette as a source of DNA to detect malaria parasite by PCR and in quality control of RDT in malaria diagnosis. Malaria parasite DNA was extracted from both immediately used ( fresh ) and archived RDT cassettes and was amplified by PCR for msp 1, msp 2 and glurp gene and the test performance of RDT was evaluated comparing PCR results for msp 2 with those of microscopy and RDT. Findings from this study showed RDT as a source of malaria parasite DNA as DNA was successful extracted from RDT cassettes and amplified by PCR. Comparing PCR, microscopy and RDT results showed PCR to be most reliable in detecting malaria parasite. It was confirmed that RDT cassette is a potential cost effective source of DNA in molecular epidemiology studies to detect malaria parasite by PCR and in quality control of malaria diagnostic test performance. Keywords: RDT, PCR, malaria parasite, DNA, microscopy, msp 2 INTRODUCTION Malaria remains the most deadly tropical disease in the world, responsible for about 225 thousand clinical cases and 1 million deaths yearly. The greatest disease burden lies within the sub-saharan region of Africa particularly affecting children and pregnant women (WHO, 2010). In recent time, there is so much concern in the control of the disease among which are the use of Artemisinin based combination therapy(act), long lasting insecticide treated nets, Intermittent preventive treatments and case management of the disease (WHO, 2010). Case management defined by rapid diagnosis and prompt treatment is a control strategy of interest to minimize complications as well as reduce mortality. Rapid Diagnostic Test (RDT), which permits malaria diagnosis within minutes, can be used at community level for case management (Tangpukdee et al, 2009; Chansuda et al, 2007; Moody, 2002). Though reliable, RDTs are limited in detecting sub-microscopic parasitaemia levels. The World Health Organization (WHO) recommendations for performing quality assurance of RDTs among other things demands that quality control (QC) of RDT should be monitored in the field by comparing the results of RDTs with those of microscopy monthly (McMorrow et al, 2010; 2008; WHO, 2008; NVBCP, 2007). Though microscopy remains the goal standard for diagnosis, it has been challenging using microscopy as reference tool for QC due to difficulties to re-read slides usually covered with fungi growth as a result of poor conservation facilities in local health centers. alternatively, dried blood on geimsa stained slides could be collected and used as a source of DNA for PCR amplification to detect malaria parasite but the harsh staining of blood with geimsa may hampers the DNA extraction process and PCR amplification (Cnops et al, 2010; Scopel et al, 2004; Edoh et al, 1997)..
14 RDT is an immunochromatographic technique which contains fixed antibodies bound on nitrocellulose strips to detect soluble antigens of the parasite in blood to produce visible bands (Tangpukdee et al, 2009; Chansuda et al, 2007; Moody, 2002). Previous studies have shown RDT as a source of DNA for molecular analyses by PCR in the detection of malaria parasite (Cnops et al, 2011 Ishengoma et al, 2011, Veron and Carme, 2006). In this study, we investigated the use of Rapid Diagnostic Test cassettes as a source of DNA to detect malaria parasite by PCR and in quality control of RDT in malaria diagnosis. METHODS Study Site This study was conducted at the laboratory for Public Health Research Biotechnology (LAPHER-Biotech) at the Biotechnology Centre (Nkolbisson) of the University of Yaounde I, Yaounde, Cameroon. Study Procedure This study was part of the Research on the economics of ACTs (REACT) project in Cameroon. A malaria positive blood sample was obtained from the etoug-ebe Baptist Health Centre, Yaounde in About 5ul of the blood sample was dispensed unto the sample well followed by 4 drops of assay diluents into the diluent well of 4 SD Bioline test kit for P. falciparum and pan malaria antigens according to the manufacturers instructions. The RDT cassettes were allowed for minutes and result were read. DNA was extracted from the 4 immediately used ( fresh ) RDT cassettes and amplified by PCR for merozoite surface protein 1(msp 1), merozoite surface protein (msp 2), and glutamate rich protein (glurp) genes of Plasmodium falciparum. DNA was then extracted from forty five 18 months old archived RDTs collected in 2009 and amplified by PCR for msp 2 gene to detect malaria parasite. As part of QC testing of RDTs, PCR results were compared with those of RDT and microscopy previously screened for malaria. DNA extraction, PCR amplification and electrophoresis The RDT cassettes (previously screened for malaria) were opened and the nitrocellulose membrane taken off. The portion containing the sample blotting side of the nitrocellulose membrane was carefully excised using sterile scissor and forcep and transferred in 1.5µl eppendorf tubes. DNA was extracted following the chelex boiling method as described by Plowe et al, (1995). Amplification of msp 2, msp 1 and glurp genes was done by nested PCR using the T3 thermal cycler machine (Biometra) as described by Mbacham et al, (2008) using primers from Malaria Research and Reference Reagent Resource Center (MR4). 1.5% agarose gel (Seakem Nusieve) was prepared and was visualized under UV transilluminator (High Performance) and photographs taken using a digital camera. Data and Statistical analysis From the electrophoresis result, distance migrated by DNA was plotted against log of DNA molecular weight marker to determine the molecular sizes of PCR products. The genetic diversity was calculated as the number of alleles present divided by the total number of distinct DNA fragments. Complexity of infection was defined as the average number of alleles present per individual was calculated as the total number of distinct DNA fragments divided by the total number of samples. SPSS 16 statistical software was used for data analysis and graph plotting and confidence interval was taken at 95%. RESULTS PCR, Microscopy and RDT DNA was extracted from both fresh and archived RDT cassettes and successfully amplified by PCR (Figure 1). In total 41 out of 47 RDT samples were positive by PCR. Among these
15 samples, 4 from fresh RDT cassettes were positive by PCR for msp 2, msp 1 and glurp genes and 37 from archived RDT cassettes was positive for msp 2 gene. Comparing the PCR results with those of RDT and microscopy showed that all 4 Fresh RDT cassettes positive for malaria were all positive for malaria parasite by PCR. Among the 37 archived RDT samples positive by PCR, 12 were RDT and microscopy positive samples, 14 were RDT negative but microscopy positive samples and 11 were RDT positive but microscopy negative samples. From this results, PCR was more performant in malaria diagnosis as it could detect malaria parasite in both RDT and microscopy negative sample (RDT and microscopy false negatives). Results are shown on table 1. Genetic diversity of Plasmodium falciparum Genotyping the 37 msp 2 PCR positive samples from archive RDT cassettes, genetic diversity of P. falciparum was 35.4% (17 alleles of 48 fragments) and complexity of infection was 1.3 (48 DNA fragments for 37 samples) (Table 2). The infection types were single or mixed with a dominance of single genotype in 28 samples (75.7%). Mixed infection was 24.3% (9 of 37) existing as 6 double (16.2%) and 3 triple (8.1%) mixed infections respectively (Figure 2). 17 alleles were detected with band sizes ranging from 400bp-630bp. The most dominant allele was the 500bp with a frequency of 38.3% (Figure 3). DISCUSSION The introduction of RDT in malaria diagnosis has greatly improved on the case management of the disease and its control. Though this diagnostic tool is effective in early diagnosis of the disease, their test performance remains a major worry. This has edge WHO to recommend QC of RDT by monitoring their test performance using microscopy for at least 20 malaria positive and negative RDT samples (McMorrow et al, 2010; 2008; WHO, 2008; NVBCP, 2007). Microscopy remains the most effective tool for malaria diagnosis and used as the gold standard but their use in quality control remains challenging because it necessitates that control slides needs to be prepared alongside certain test RDTs (Igbinosa et al, 2010). Also, re-reads of the slides in a long run could produce false negative or positive results due to poor long term storage of the slides enhancing the development of fungi growth (Ishengoma et al, 2011). Recently, RDT was shown to serve as a source of DNA to detect malaria parasite by PCR (Cnops et al, 2011 Ishengoma et al, 2011, Veron and Carme, 2006). In these studies, malaria parasite was detected in 18 months old archive RDT cassettes which were stored at room temperature. This suggests that PCR on RDT as a source of DNA could be used for QC to monitor the performance of RDT and will not be affected by the storage condition. From the results obtained in this study, we confirm that DNA could successfully be extracted and amplified by PCR from both fresh and archived RDT cassettes. Comparing the results of PCR with RDT, and microscopy, PCR showed to be more reliable in detecting malaria parasite as PCR could detect malaria parasite in RDT and microscopy negative samples. Similar studies using RDT as a source of DNA showed PCR to be more effective than microscopy or RDT in malaria diagnosis (Cnops et al, 2011 Ishengoma et al. 2011, Veron and Carme, 2006). This confirms PCR on RDT as a more reliable tool than microscopy for QC in monitoring the performance of RDT in malaria diagnosis. Equally, in a study by Sandor et al, (2005), PCR on RDT showed similar result to PCR on filter paper as source of DNA when chelex method was used for DNA extraction suggesting that the DNA extracted from RDT cassette in this study was pure. Merozoite surface protein 2 (msp 2) is a protein located on the surface membrane of malaria parasite (Kiwanuka, 2009). Due to the high polymorphic nature of the protein showing length polymorphism, it has been used in several studies to monitor the genetic diversity of malaria parasite (Ghanchi et al, 2010; Farnert and Bjorkman, 2005). As msp 2 was among the genes amplified to detect malaria parasite in this study, we also assessed the genetic diversity of msp 2 from the 37 PCR positive archived RDT samples. From our results, msp 2 showed
16 limited diversity with a low complexity of infection. The alleles ranged from bp and the 500bp was the most frequent. The use of RDT as a source of malaria parasite DNA for molecular analysis by PCR could be of great importance to monitor the test performance of malaria diagnostic tools especially in QC monitoring of RDTs. Also, it could be used as an alternative to filter paper in molecular epidemiologic studies to monitor the genetic diversity, identify drug resistant markers etc. of the parasite. Most molecular epidemiology studies have relied on filter paper as a source of malaria parasite DNA which is costly. Thus, the use of RDT cassettes as a source of DNA will be a more cost effective source of DNA to serve for molecular epidemiologic studies especially in areas were limited studies on malaria are conducted. CONCLUSION This study confirm that newly used ( fresh ) or archived RDT could be a potential source of DNA to detect malaria parasite by PCR and can serve in quality control monitoring of the test performance of RDT. The cost effectiveness of this source of DNA could be of great importance in molecular epidemiologic studies especially in area of declining malaria prevalence where limited studies are been conducted to enhance malaria control and elimination. REFERENCES Chansuda W, Barcus M.J, Muth S, Sutamihardja A, and Wernsdorfer W.H. (2007). A Review of Malaria Diagnostic Tools: Microscopy and Rapid Diagnostic Test (RDT). American Journal of Tropical Medicine and Hygiene 77: Cnops L, Merel B, Gillet P, Esbroeck M. V, and Jan J. (2011). Rapid diagnostic tests as a source of DNA for Plasmodium species-specific real-time PCR. Malaria Journal 10: Edoh D, Steiger S, Genton B, and Beck H.P. (1997). PCR amplification of DNA from malaria parasites on fixed and stained thick and thin blood films. Transaction of the Royal Society of Tropical Medicine and Hygiene 91: Farnert A, and Bjorkman A. (2005). Short report: Limited advantage of multiple consecutive samples for genotyping Plasmodium falciparum populations during the first day of tratment." American Journal of Tropical Medicine and Hygiene 73(1): Ghanchi K.N, Andreas M, Johan U, Sana J, Sándor B, Rabia H and Mohammad A. (2010). Genetic diversity among Plasmodium falciparum field isolates in Pakistan measured with PCR genotyping of the merozoite surface protein 1 and 2." Malaria Journal 9:1-6. Igbinosa O, Igbinosa N, Asowata O, and Chenyi J. (2010) A sequential review on accuracy of detecting malaria Parasitemia in developing countries with large restriction on resources." Journal of Medicine and Medical Sciences 1(9): Ishengoma D. S, Lwitiho S, Madebe R.A, Nyagonde N, Ola P, Lasse S.V, Lemnge M.M, and Alifrangis M. (2011). Using rapid diagnostic tests as source of malaria parasite DNA for molecular analyses in the era of declining malaria prevalence." Malaria Journal 10:6-13. Kiwanuka G. (2009). Genetic diversity in Plasmodium falciparum merozoite surface protein 1 and 2 coding genes and its implications in malaria epidemiology: a review of published studies from " Journal of Vector Borne Diseases 46, Mbacham W. F, Nsangou P. M., Palmer M. N., Evehe B. M-S, Akindeh N, Immaculate A, Johanna D, Valerie M, Kayla L, Songmbe M.Y, Lomah N, Enyong P, and Titanji P.K. (2008). Limited variation of the 5 cis-control region of the transmission blocking vaccine candidate Pfs25 amid great genetic diversity of Plasmodium falciparum in Cameroon." African Journal of Biotechnology 7 (5):
17 Moody A. (2002). Rapid Diagnostic Tests for Malaria Parasites. Clinical Microbiological reviews 15(2); NVBCP. (2007). Manual on quality assurance for laboratory diagnosis of Malarial:Rapid Diagnostic Test. National Vector Borne control Programme of the Ministry of Public Health and Ware fare, India 21-33, Plowe C.V, Djimde A, Bouare M, Doumbo O. and Wellems T.E. (1995). Pyrimethamine and proguanil resistance-conferring mutations in Plasmodium falciparum dihydrofolate reductase: polymerase chain reaction methods for surveillance in Africa. American Journal of Tropical Medicine and Hygiene 52: Sandor B, Pedro Gil A M J, and Farnert A. (2005). Rapid DNA extraction from archive blood spots on filter paper for genotyping of Plasmodium falciparum." American Journal of Tropical Medicine and Hygiene 72(3): Scopel K.K, Fontes C.J, Nunes A.C, Horta M.F, and Braga E.M. (2004). Low sensitivity of nested PCR using Plasmodium DNA extracted from stained thick blood smears: an epidemiological retrospective study among subjects with low parasitaemia in an endemic area of the Brazilian Amazon region." Malaria Journal 3:8. Tangpukdee N, Duangdee C, Wilairatana P and Krudsood P. (2009). Malaria Diagnosis: A Brief Review." Korean Journal of Parasitology 47 (2): Veron, V.and Carme B. (2006). Recovery and use of Plasmodium DNA from malaria rapid diagnostic tests. American Journal of Tropical Medicne and Hygiene 74(6) WHO. (2008). Quality Assurance of Malaria Rapid Diagnostic Tests: Buying well andmaintaining accuracy Geneva, Switzerland. World Health Organisation. WHO. (2010). World malaria report Global Malaria Programme WHO/HTM/GMP/ TABLES Table 1: Amplification success of DNA extracted from archive RDT RDT sample category Number of RDT PCR Positive (%) Negative (%) Fresh RDT RDT positive 4 4 (100%) 0 (0%) Archive RDT RDT and microscopy positive (100%) 0 (0%) RDT negative but microscopy (100%) 0 (0%) positive RDT positive but microscopy (100%) 0 (0%) negative RDT and microscopy negative 6 0 (0%) 6 (100%) Total
 of infection size (bp) (bp) samples fragments 37 48 17 35.4% 1.3 528.")

18 Table 2: Allelic distribution and complexity of infection for Plasmodium falciparum Number Number of Number Genetic Complexity Mean allelic Range of msp 2 alleles of DNA of alleles diversity (%) of infection size (bp) (bp) samples fragments % ± Legend: bp; base pair FIGURES A MWN MWM MWN MWM MWN MWN MWN MWN B MWN MWM MWN MWM
, 3A: Positive result for msp 2;")
; lane 4, 5 and 6, lane 2; positive control, lane 7; Negative result for glurp.")
; lane 2, 4, 5 and 6, lane 1; positive control. P.")
19 C MWN MWM MWN MWM Figure 1: Agarose gel electrophoresis of nested PCR product Legend: Lane MWM: Molecular weight marker ( in base pairs), 3A: Positive result for msp 2; lane 2-5 and 10-13, Negative result for msp 2; lane 6, Positive control; lane 7 and 15, 3B: Positive result for glurp (4 RDT replicates); lane 4, 5 and 6, lane 2; positive control, lane 7; Negative result for glurp. 3C: Positive samples for msp 1 (4 RDT replicates); lane 2, 4, 5 and 6, lane 1; positive control. P. falciparum msp 2 infection 5% 19% 76% single infection double infection triple infection Figure 2: Distribution of Plasmodium falciparum msp 2 infections


20 msp 2 allele Frequency (%) allelic size (bp) Figure 3: Allelic distribution of Plasmodium falciparum msp 2 gene
21 SEASONAL VARIATION OF MINERAL CONTENT OF GRAZING GRASSES IN OIL-PRODUCING AREA RUIKPOKWU IN RIVERS STATE Asira, Enim Enim Department Of Chemistry,College Of Education,Akamkpa - Cross River State,Nigeria Abstract The mineral content of grazing grasses from an oil-producing area (Rukpokwu) in Rivers State, Nigeria was determined from January to June, 2008, to evaluate the effects of seasonal variation of mineral concentrations of grazing grasses, using Izzi in Ebonyi State as control. The grasses analyzed were guinea grass (Pannicum Maximum) and giant star grass (Cynodon nleufuensis). The results obtained indicated high concentrations (mg1kg) of Potassium (17.0±0.2/15.0±0.01), sodium (1.90±0.03/1.7±0.001), Calcium (55.0±0.), Magnesium (17.0±0.02/16.0±0.02), Manganese (5.80±0.00/5.60±0.00) and Copper (1.30±0.01/0.90±0.01) and low concentrations of Iron (46.0) and Zinc (3.4±0.02) for guinea and giant star grasses respectively. During dry season, the concentrations of Calcium (52.0±0.2/43.0±0.00), Iron (31.0±0.01/28.0±0.02), Copper (0.4±0.01) and Zinc (3.0±0.02/3.1±0.00) in guinea and giant star grasses respectively were observed. In spite of the variation in mineral content of both grasses with season, the grasses still contain sufficient quality of most elements required by livestock Key words: Grasses, Season, Oil-producing area, minerals and content. INTRODUCTION The 1992 earth summit resolved to save the environment and maintain the productive capacity in our plant. Improving the management of hazardous substances, waste toxic chemical and maintaining soil fertility and unpolluted water resources were among the urgent undertakings (United Nations, 1992). Environmental health can be regard as a global public goods and the upkeep of these goods required international cooperation Grasses are pasture grown to meet the nutritive requirements for optimal lactation and growth of animals reared for subsistence and commercial purpose (Corah and ives, 1981). The grazing grasses, like other plants, depend on the soil, water for the supply of mineral elements, and animal in turn obtain majority of their nutrient from grasses. The primary production of these grasses and their quality in many parts of the world are threatened by contamination of soil and water (Macnairi, 1993; Achangya et al, 1999; Lyangar and Nair, 2000). Even now many livestock are undernourished every day. Vulnerably to toxic waste and contaminated grasses are implicated in poverty both in industrialized and developing world (Lyengar and Nair, 2000 and FAO, 2000). Grazing grasses, being primary producers of food chain, accumulate contaminants from the soil and atmosphere (Harrison and Chingawol, 1989) and contribute mineral elements in harmful concentration to the food chain. The concentrations, of mineral elements in grazing are dependent on soil, plant species, stage of maturity, yield, pasture management and climatic conditions can be important factor in severity of deficiency state by livestock. The mineral elements commonly found in grazing grasses are classified into micro-minerals, Calcium, Potassium, Sodium, Magnesium, Phosphorus, Nitrogen and Sulphur; and Micro minerals such as Zinc, Iron Copper, Cobalt, Manganese and Selenium. The macro minerals are required in substantial amounts in grasses, while the micro minerals are required in small amount (Stanley, 1991). Rivers State, like other state in southern Nigeria falls within the tropical zone experiences heavy rainfall, high humidity and low temperatures during rainy season and considerable high temperatures low rainfall during dry season (October March). This variation in the climate affects the concentrations of minerals elements in grazing grasses and soil found in the study area.
22 The oil-producing area (Rukpokwu) in Rivers State has had her share in the despondent of aquatic essential biota of late. Since 2007, the area has been faced with several petroleum spillages, primarily caused by oil bunker and leakages pipes due to rusts. Also, the areas is one of the homes of oil production in Nigeria. Some of the grazing grasses found in this giant are elephants grasses (Pannicum purpurum), giant star grass (Cynodon nlemfuensis) and guinea grass (Pannicum maximum) AIM AND OBJECTIVES The main aim of the study was to determine the effects of seasonal variation on the mineral content of some selected grazing grasses in oil-producing area (Rukpowu) in Rivers State, Nigeria, using Izzi in Ebionyi State as control. The specific objectives were: - To determine the total hydrocarbon content of the soil in oil-producing area to ascertain the presence of petroleum oil. - To determine the mineral content of the soil in the study area. - To determine the mineral content of the grazing grasses in the said study area - To determine the variability of the mineral concentrations of the study grasses species with climatic conditions SCOPE OF THE STUDY The scope covers the collection of soil and grasses from the oil- producing area and the control sole every month end from January to June, MATERIALS AND METHODS MATEIALS APPARATUS: Polythene bags, shovel, hand forks, evaporating basin, air-evacuation oven, desiccators, weighing balance, knife, 50ml beakers, pit meter, colorimeter, 200ml volumetric flask Atomic absorption spectrometer (Perkin Elmer 3II Model) Flame emission photometer, 100ml volumetric flask, stirrer, thermometer and plastic curette (1cm) REAGENTS 70-72% Perchloric acid, 40% hydrofluoric acid, 95-97% tetra-oxosulphate VI acid, 6.0m hydro chloric acid, acetic. Acid, 50ml xylene, 40% tetra-oxochlorate VI, 70% Trioxonitrate v Acid. EXPERIMENTAL GRASSES Giant star grass (Cynodon nlemfuensis) and guinea grass (Pannium maximum) METHODS COLLECTIONS OF SOIL SAMPLES Soil samples from oil-producing area (Site A) and non-oil producing area (control) site B were collected at the end of each month at depths of 0-15cm with shovel. The two samples were put in polythene bags labeled OPSS and NOPSS (oil-producing soil samples and non-oil producing soil sample. The samples were bulked, air dried at 85 C for three days filtered and digested (Onyeike and Osiji, 2003). COLLECTION OF GRASS SAMPLES The experimental grass were back at heights of 10cm and 5cm for guinea and giant star grasses respectively at the end of each month (from January to June, from three randomly selected area (1.m in size). These grass species were taken to the laboratory in polythene bags labeled OPGS 1, 2, 3 and NOPGS 1. The grasses were then chopped and dried and ground using mortar and pestle and filtered.
.")
23 DETERMINATION OF PH OF THE SIOL The ph of the soil samples was determined using ph Meter (Jenway 3015 model). DETERMINATION OF MINERAL ELEMENTS IN THE SOIL SAMPLES Soil phosphorus in the soil was determined by molybdenum method (Onyeike and Osuji, 2003). The concentrations of potassium and sodium ion were determined by flame photometry. Calcium, Copper, Magnesium, Manganese and Zinc ions concentrations were determined by atomic absorption spectrometric method (Perkin Elmer 3110 model). The concentration of iron was done using colorimetric method (Onyeike and Osuji, 2003) DETERMINATION OF MINERAL CONTENT OF GRASS SAMPLES The concentrations of potassium and sodium were determined by flame emission photometer, iron content was determined by colorimetric method; and Calcium, Magnesium, Manganese, Copper and Zinc were determined by AAS at their respective wavelengths. DETERMINATION OF TOTAL HYDROCARBON CONTENT (THC) One gram (1g) of soil samples was put into a conical flask and 50ml of xylene added. The extract was centrifugal for 15 minutes. The absorbance of the extractable hydrocarbon content was obtained using a Hack DR/2010 particle Data logging spectrophotometer at 425nm. The THC was estimated from a calibrated curve. RESULTS THE ph OF THE SOIL SAMPLES Fig. 1: Histogram of ph of the soil of oil-producing Area (Rukpokwu) and non-oil producing Area, Izzi-Ebonyi State (Control) against time (months) Represents ph of the soil from oil producing area (Rukpokwu) against time. The ph of the soils from a non-oil producing area Izzi in Ebonyi State (Control)
 from Rukpokwu and Izzi (Control) at 0.15cm.")
24 Concentration mg/kg Fig. 2: Histogram of the total hydrocarbon content of polluted soil and unpolluted soil samples at the surface after nine months soil spillage (mg/kg) from Rukpokwu and Izzi (Control) at 0.15cm. The total hydrocarbon content of non-polluted soil from Izzi in Ebonyi State at 0.15cm The total hydrocarbon content of the polluted soil from Rukpokwu in Rivers State at the surface after nine months of oil spillage (mg/kg) at 0.15cm. Table 1A: Mineral contents of soil from an oil producing area (Rukpokwu) in Rivers State at different months of the year 2008 MONTH/ELEMENT JAN FEB MARCH APRIL MAY JUNE MEAN Potassium mg/kg Phosphorus mg/kg Sodium mg/kg , Calcium mg/kg Iron mg/kg Magnesium mg/kg Manganese mg/kg Zinc mg/kg Copper mg/kg Table 1B: Mineral content of soil from non-oil producing area (Izzi) in Ebonyi State at different months of the MONTH/ELEMENT JAN FEB MARCH APRIL MAY JUNE MEAN Potassium mg/kg Phosphorus mg/kg
25 Sodium mg/kg Calcium mg/kg Iron mg/kg Magnesium mg/kg Manganese mg/kg Zinc mg/kg Copper mg/kg
26 Table 2A: Mineral content of guinea grass from oil producing area (Rukpokwu) of Rivers State (Bracket) represents values of mineral contents of guinea grass from non-oil producing area (Izzi) in Ebonyi State - Control MONTH/ELEMENT JAN FEB MARCH APRIL MAY JUNE MEAN CV Potassium mg/kg 1.0±0.02 (22.00±0.1) 1.4± ± ±0.04 (1.7±0.00) 2.0±0.1 (3.0±0.01) 17±0.3 (14.0±0.2) 14.0±0.2 (13.0±0.4) 6.18 (5.85) 47.7 (52.79) Phosphorus mg/kg 5.0±0.01 (9.0±0.3) 5.0±0.03 (0.7±0.00) 5.0±0.1 (4.0± ±0.1 (4.0±0.00) 10.00±0.03 (10.00±0.00) 6.0±0.2 (8.0±0.2) 6.00 (7.17) 33.3 (32.14) Sodium mg/kg 0.50±0.02 (0.60±0.02) 0.05±0.02 (1.50±0.05) 0.50±0.03 (0.50±0.00) 43.0±0.01 (52.0±0.2) 1.90±0.003 (0.08±0.00) 0.9±0.09 (0.40±0.00) 0.91 ( (52.5) Calcium mg/kg 49.0±0.00 (70±0.2) 52.00±0.2 (42.0±0.2) 48.00±0.1 (50.0±0.00) 43.0±0.00 (51.0±0.00) 55.0±0.00 (54.0±0.2) 39.0±0.00 (43.0±0.00) 47.0 (50.67) (10.07) Iron mg/kg 30.0±0.2 (39.0±0.00) 31.0±0.1 (23.0±0.3) 48.00±0.1 (40.0±0.00) 42.0±0.2 (35.0±0.00) 46.0±0.00 (59.0±0.02) 14.0±0.2 (9.0±0.00) ) (48.49) Magnesium mg/kg 7.00±0.00 (8.0±0.02) 7.00±0.02 (5.0±0.00) 5.00±0.01 (4.0±0.02) 5.0±0.00 (3.0±0.00) 15.00±0.00 (14.0±0.00) 17.0±0.2 (13.0±0.2) 9.50 (7.83) 59.3 (60.2) Manganese mg/kg 3.050±0.01 (3.5±0.00) 2.90±0.09 (4.5±0.04) 4.80±0.00 (5.0±0.00) 3.20±0.02 (5.0±0.00) 5.80±0.02 (5.1±0.00) 3.20±0.01 (10.0±0.02) 3.90 (5.51) (41.66) Zinc mg/kg 3.10±0.00 (3.5±0.18) 3.0±0.02 (2.5±0.00) 3.01±0.01 (3.3±0.01) 3.20±0.00 (4.5±0.02) 3.40±0.02 (4.5±0.00) 2.10±0.00 (2.4±0.02) 2.98 (3.45) (12.13) Copper mg/kg 0.23±0.01 (0.20±0.01) 0.4±0.00 (0.25±0.00) 0.60±0.02 (0.25±0.004) 0.50±0.02 (0.42±0.00) 1.30±0.01 (1.00±0.00) 0.6±0.01 (0.60±0.01) 0.68 (0.45) (59.3)
27 Table 2B: Mineral content of Giant star grass from oil producing area (Rukpokwu) of Rivers State (Bracket) represents values of mineral contents of giant star grass from non-oil producing area (Izzi) in Ebonyi State - Control MONTH/ELEMENT JAN FEB MARCH APRIL MAY JUNE MEAN CV Potassium mg/kg 0.9±0.00 (1.5±0.00) 1.2±0.02 (1.2±0.02) 1.5±0.01 (1.5± ±0.02 (2.0±0.02) 15.0±0.1 (12.0±0.2) 12.0±0.2 (11.0±0.1) 5.4 (4.87) Phosphorus mg/kg 5.0±0.1 (8.0±0.00) 4.0±0.00 (6.0±0.1) 4.0±0.2 (3.5±0.00) 5.0±0.01 (4.8±0.00) 12.0±0.2 (9.0±0.1) 7.00±0.00 (6.0±0.3) 6.7 (6.21) (32.5) Sodium mg/kg 0.5±0.02 (0.6±0.02) 0.6±0.02 (1.6±0.00) 0.6±0.00 (0.6±0.01) 1.3±0.00 (0.7±0.01) 1.70±0.001 (0.70±0.00) 0.8±0.00 (0.40±0.01) (0.76) 40.5 (57.5) Calcium mg/kg 50.0±0.08 (68.0±0.00) 43.0±0.2 (40.0±0.2) 52.0±0.00 (50.0±0.00) 43.0±0.00 (51.0±0.00) 55.0±0.00 (53.0±0.1) 39.0±0.00 (42.0±0.00) 47.0 (50.67) (26.44) Iron mg/kg 27.0±0.2 (30.0±0.2) 28.0±0.2 (20.0±0.00) 47.0±0.00 (38.0±0.02) 42.0±0.2 (35.0±0.00) 46.0±0.00 (59.0±0.02) 14.0±0.2 (9.0±0.00) 34.0 (31.83) 38.6 (53.5) Magnesium mg/kg 8.0±0.00 (10.0±0.2) 8.0±0.00 (7.0±0.00) 6.5±0.001 (5.0±0.1) 5.0±0.00 (4.0±0.00) 14.0±0.2 (9.2±0.00) 16.0±0.2 (8.0±0.1) 9.58 (7.17) 45.9 (71.7) Manganese mg/kg 3.4±0.00 (3.6±0.01) 2.7±0.01 (4.6±0.00) 4.6±0.00 (5.0±0.01) 3.0±0.01 (5.0±0.00) 5.6±0.00 (5.2±0.01) 3.1±0.00 (1.0±0.00) 3.73 (4.07) 30.6 (66.7) Zinc mg/kg 3.2±0.01 (3.1±0.00) 3.1±0.00 (2.2±0.01) 3.2±0.01 (3.1±0.00) 3.2±0.00 (4.4±0.01) 3.4±0.00 (4.5±0.00) 2.0±0.00 (2.1±0.00) 3.0 (3.23) 22.6 (33.4) Copper mg/kg 02. ±0.02 (0.36±0.00) 0.4±0.01 (0.20±0.00) 0.6±0.01 (0.20±0.02) 0.41±0.00 (0.04±0.00) 0.9±0.01 (0.8±0.02) 0.5±0.00 (0.5±0.00) 0.5 (0.41) 48.0 (54.64)
28 Table 3A: Mean mineral content of guinea grass from oil producing area (Rukpokwu) in Rivers State and NRC (1986) recommended mean values for daily meals (DM) for domestic animals. ELEMENT RESEARCH MEAN VALUES NRC (1976) RECOMMENDED MEAN VALUES REMARKS Potassium Within range mg/kg Phosphorus mg/kg Lower than DM requirement Sodium mg/kg Not sufficient for daily requirement Calcium mg/kg Higher than daily requirement Iron CAMPEN (1990) Grossly higher mg/kg Magnesium Within range mg/kg Manganese mg/kg Slightly higher than daily requirement Zinc mg/kg Higher than daily requirement Copper mg/kg Within range
29 Table 3B: Mean mineral content of giant star grass from oil producing area (Rukpokwu) in Rivers State and NRC (1986) recommended mean values for daily meals (DM) for domestic animals. ELEMENT RESEARCH MEAN VALUES NRC (1976) RECOMMENDED MEAN VALUES REMARKS Potassium Within range mg/kg Phosphorus mg/kg Grossly lower than daily requirement Sodium mg/kg Grossly lower than daily requirement Calcium mg/kg Higher than daily requirement Iron Within range mg/kg Magnesium Within range mg/kg Manganese Within range mg/kg Zinc Within range mg/kg Copper mg/kg Within range
30 DISCUSSION The ph of the soil from oil-producing area (Rukpokwu) in Rivers State declines gradually from dry season to rainy season with peak of 6.4 value recorded in January (see fig.1). Very high hydrocarbon content (most saturated type) was observed in the soil from oil-producing area (Rukpokwu) (fig. 2) thus confirming the presence of petroleum oil in the soil (see fig. 2). The concentrations of potassium (152.0 mg/kg), sodium (11.6 mg/kg), Iron mg/kg) and Zinc (65.5 mg/kg) in the soils from oil producing area recorded during dry season were lower. During rainy season, the concentrations of magnesium (302mg/kg), manganese (604.0mg/kg) and copper (7.4mg/kg) in same soil were higher. Cozzarelli et al (1987) reported elevated concentrations of magnesium and manganese twice their background level at Creasote dump in Pensacote, Florida during rainy season (see tables 1A and 1B). The concentration of potassium in both guinea and giant grasses from the oil producing area was observed to be higher than dry season. Particularly in May (0.9mg/kg). This concentration of sodium in both grasses was found to be lower than the total daily meal (DM) ration of 2.50mg/kg and 50.0mg/kg for growing cattle and lactating cows respectively. NRC, (1976) (see tables 2A & B). There was low concentration of phosphorus in both grass species from the oil-producing area throughout the dry season. Gomide (1978) associated the low phosphorus content in young tissues to their being mobile and thus easily translocated from the old tissue to young tissues. During rainy season, high concentration of phosphorus was recorded, particularly in May, 12.0mg/kg and 10.0mg/kg for guinea and giant star grasses. The mean phosphorus content 6.0mg/kg and6.17mg/kg in guinea and giant star grasses respectively from oil-producing area was lower than the requirement for growing and finishing cattle, NRC, (1976). The concentration of Sodium in both grasses was high during the rainy season. The mean Sodium content in both experimental grasses in oil producing area was lower than the sodium content of 13.0mg/kg in the total DM ration for lactating cows NRC, (1976). High Calcium content of both grasses from oil-producing area was recorded in May (rainy season). However, significant difference in month to month was observed in giant star grass (P<0.05). Nevertheless, a mean Calcium content of 47.0mg/kg of the grass species from oil-producing area was found to be higher than (NRC, (1976) Calcium requirement of 30.0mg/kg and 44.0mg/kg for growing and finishing cattle (see table 3A &B). This research data confirmed those of Gleadening et al (1983), who reported 57.0mg/kg and 41.0mg/kg calcium content of some grazing grasses in Arkansas. The Magnesium content of both grasses in the research area (Rukpokwu) was high during rainy season. This increase in concentration agrees with similar observation recorded my Segel, (1987), who reported elevated concentration of magnesium in grasses in the oil dump in Minnesota in U.S.A during rainy season. Also, significant difference in magnesium content (P<0.05) in months was observed. The low magnesium concentration of the grass samples during dry season could be due to high calcium/magnesium ratio. Stanley (1991). The mean magnesium content (9.50mg/kg) and 9.58mg/kg for guinea and giant star grasses respectively fails within mean magnesium requirement of 6.0mg/kg and 15.0mg/kg for growing cattle. (NRC; 1976). Gradual increase in the concentration of Iron was observed in both grass samples from the research area during the dry season. But during rainy season, decrease Iron concentration was observed (see table 2A and B). Similar declining iron content with plant maturity had been reported in bromo grass (Brom spp.) Loper and Smith, (1961), during rainy season. Month to month significant difference (P<0.05) was
31 observed in giant star grass Iron content. Cattle through require Iron, the minimum has not been established. (NRC, 1976), Van Campen (1991) gave Iron requirements of 3.0mg/kg for calves and 0.5mg/kg to 0.6mg/kg for mature cattle, values far below those found in this research work. Kechgnessner, (1996) reported that Meadow grass s lowest Iron content was higher than grass species. This may be due to decrease ph caused by organic acid, which results in dissolution of ferric acid. High values of manganese (5.80mg/kg and 5.60mg/kg) for guinea and giant star grasses were recorded during rainy season. There was month to month significant difference (P<0.05) in manganese content in giant star grass, while guinea grass did not show significant difference. The mean manganese concentration 3.73mg/kg and 3.90mg/kg in giant star and guinea grasses respectively were higher than NRC (1976) recommend values cattle (table.) Though it has been observed that season has no effect on Zinc content of guinea and giant grasses, Zinc content in the both grasses was observed to be high in rainy season. No month to month significant difference (P<0.05) was recorded. The mean Zinc content of 2.98mg/kg and 3.0mg/kg in guinea and giant star grasses respectively were within NRC (1976) recommended Zinc content of 1.0mg/kg to 3.0mg/kg for cattle, hence the grasses may contain sufficient Zinc for cattle performance, except when diet with high calcium suppresses Zinc availability. Copper content in the experimental grass species was higher in rainy season than dry season. There was significance (P<0.05) difference in months, of copper content in guinea grass, whereas non exist in giant star grass. The mean copper content was slightly higher than 0.5mg/kg Copper content recommended for most domestic animals (NRC, 1976) Van Camper, (1990) gave a Copper requirement for growing and finishing cattle as 0.4mg/kg. CONCLUSION Data from the study reveal that mineral imbalances/or deficiency in grazing grasses for livestock are related to season and soil pollution. High concentration of total hydrocarbon was confirmed in the soil from oilproducing area (Rukpokwu). The soil equally recorded high concentrations of potassium, phosphorus and copper during dry season and high concentrations of sodium, calcium, magnesium, manganese and zinc in rainy season. Both guinea and giant star grasses recorded high concentrations of Iron during dry season and high concentrations of potassium, phosphorus, sodium, calcium, magnesium, manganese, copper and zinc in rainy season. The low concentrations of mineral elements during dry season may be due to natural dilution process and the translocation of mineral elements to the root of grasses as they get matured. In line with NRC, (1978, 1984 and 1985), mineral requirements recommended for cattle and sheep, the two grass species were observed to be adequate in potassium, magnesium, calcium, Iron, Zinc and Copper. On the contrary, low concentrations of phosphorus and sodium were observed in the two grass species in the study. High mean content of copper, manganese and Iron in the guinea grass from oil-producing area may be as a result of their ability to build up in grass tissue and thus less susceptible to leaching. The mineral elements analysed in the grass species (guinea and giant star grasses) from oil-producing area (Rukpokwu) suggest that season variation affects the mineral concentrations of grazing grasses and livestock many suffer deficiency in phosphorus and sodium when they depend mainly on guinea and giant star grasses dominant in the polluted area of Rukpokwu, particular during dry season. Equally, high mean content of the trace elements. Irons, manganese and copper, may lead to toxicity in animals that depend mainly or guinea grass in the area.
32 REFERENCES Achangya, S. K; Chakra borty, P; Lahirisi, S; Raymahashey, B.C; Guha, S. (1999). Arsenic poisoning of Ganges Delta. Nature 40:545 Corah, L. P and Ives, S. (1991). The effects of essential trace minerals on reproduction in beef cattle. Vet.clin. N. American food chain. Animal Pract. 7: Cozzarelli, M. I.; Baedecker, M.J; and Hoople, J.A. (1987). Creosote products on the aqueous geochemistry of unsuitable constituents in superficial aquifer. Inc, U.S geological survey programmes, toxic waste ground water contaminants, U.S geological survey open file reports ,pp A F. A. O, (2002). World food chain summit. Five years, headquarters. Rome, Italy June, Gomide, J. A. (1978). Mineral composition of grasses and tropical Leguminous forages. Latin American symp on minerals. Nutrition research with grazing ruminants. University of Florida. Gainonesvile. Florida pp Harrison, R. M; Chingawol, M.B. (1989). The Assessment of air and soil as contractors of some trace metals to vegetable plants use of a filtered air growth cabinet science tot. Environment. 83: Kiechgessner,M.(1996). Supply and availability of trace elements. World rev. Animals prod. Pp Lopper, G.M; and Smith, D. (1961). Changes in macro-nutrients composition of the herbage of alfalfa, medium rev. clove ladino clover and bromo grass with advance in maturity. Rep. No. 8 wis. Agric expo. Sta 19p. Lyangar, G.V. and Nair, P.P. (2000). Global out work on nutrition and the environment meeting the challenges of the next millennium. Sci. tot. Environ. 249: NRC (1978). Nutrient requirements daily cattle. 5 th ed. Nutrients Aca. Of Sci. Washington D.C. NRC, (1985). Nutrient requirements for domestic animals. Nutrient requirements of daily cattle 6 th ed. Nutrient Aca of Sci. Washington D.C. Onyeike, E.N and Osuji, J.O. (2003). Research techniques in biological and chemical sciences. Published in Nigeria by spring field publishers Ltd. 26: Siegel, D.I. (1987) Geochemical facies and mineral dissolution. Bemidj Minnesota, Research site. In: U.S. geological survey programme on toxic waste pp. c13-c15. Stanley, E.M (1991). Environmental chemistry 5 th ed; Lewis publishers Inc. 121 south main street, Chelsea, M.Chigan Van Campen, D. (1970) Trace elements in farm animals. Progress in Agric. 13:
33 UNDERSTANDING NANOTECHNOLOGY AND NANOSCIENCE FOR NATIONAL DEVELOPMENT Usman Maijama a Kallamu Department of Mechanical Engineering, The Federal Polytechnic, Damaturu, Yobe State, Nigeria Abstract The emergence of nanoscience and nanotechnology has opened a myriad possibilities to revolutionize a wide range of fields ranging from cosmetics to space technologies; there are also important contributionsto diagnostics and therapeutic practices, especially for treating cancer. Nanoscience is also making a difference in many areas of engineering and technology, such as energy environmental pollution control, textile, automobile and electronics. Nanoscience and nanotechnology combine the essence of knowledge in many fields of science and are truly interdisciplinary. There is little doubt that the next generation of citizens will be the beneficiaries of the applications of nanoscience and nanotechnology in their daily life. It is, therefore, vital to have adequate awareness of this important field, irrespective of the specialization or profession that one may choose. 1.0 INTRODUCTION One of the scientific research areas in recent years, with astonishing developments, has been nanomechanics, as an important part of nano-technology. This relatively new field of mechanical sciences is becoming more and more responsive to the practical needs of nano-technology. Fluids with nanoparticles suspended in them are called nanofluids. This term was coined by Choi in 1995 at Argonne National laboratory of USA [1]. Nanofluids are tough to be the next-generation heat transfer fluids, and they offer exciting possibilities due to their enhanced heat transfer performance compared to ordinary fluids. The advantages of these nanofluids are (1) better stability compared to those fluids containing micro-or millisized particles and (2) higher thermal conductive capability than the base fluids themselves. Nanofluids proposed for various uses in important fields such as electronics, transportation, medical, and HVAC [2]. Hence, there is a need for fundamental understanding of the heat transfer behavior of nanofluids in order to exploit their potential benefits and applications. 1.1 HISTORY AND SCOPE The word nano is to a Greek prefix meaning dwarf or something very small and depicts one billionth (10 9) of a unit (refer Table 1.1). Nanomaterials,therefore, refer to the class of materials with at least one of the dimensions in the nanometric range.how small is a nanocrystal? For an immediate comparison, a nanometre represents a dimension about a few tens of thousand times thinner than human hair, In the case of polycrystalline materials, the grain size is typically of the order of microns (1 micron = 10 6 m). Nanocrystalline materials have a grain size of the order of nm,and are therefore times smaller than conventional grain dimensions. However,compared to the size of an atom ( nm in diameter), nanocrystalline grains are still significantly big.for example, a nanocrystal of size 10 nm contains over a hundred thousand atoms (assuming a spherical nanograin of 10 nm and atomic diameter of 0.2 nm), large enough to exhibit bulk properties, i.e., properties different from those of single atoms or clusters. As the dimensions reduce to below nm, they can no longer be treated as infinite systems and the resultant boundary effects lead to fascinating and useful properties, which can be explored and tailored for a variety of structural and functional applications. In principle, one cannot define an exact dimension for the grain size below which materials can be classified as nano. This is because it is subjective and depends
34 on the application or end property of interest. Most electronic and optical properties vary when the grain size is reduced typically below 10 nm. However, their mechanical, chemical and many physical properties begin to vary significantly from bulk below nm. Hence, nanomaterials may be classified as those materials which have at least one of their dimensions in the nanometric range, below which there is significant variation in the property of interest compared to microcrystalline materials. Nanomaterials can be metals, ceramics, polymers or composites. Nanotechnology is an umbrella term for many areas of research dealing with objects that have one of their dimensions Table 1.1 The world of small dimensions Number Name Symbol 0.1 deci d 0.01 centi c milli m micro μ nano n pico p femto f atto a zepto z yocto y 4 Nanoscience and Nanotechnology. 2.0 APPLICATIONS OF NANOFLUIDS A. Heat transfer Intensification Since the origination of the nano fluid concept about a decade ago, the potentials of nanofluids in heat transfer application have attracted more and more attention. Up to now, there are some review papers, which present over views of various aspects of nanofluids [1, 3-6, ], including preparation and characterization, techniques for the measurements of thermal conductivity, theory and model, thermo physical properties, convective heat transfer. 1) Electronic applications Due to higher density of chips, design of electronic components with more compact makes heat dissipation more difficult. Advanced electronic devices face thermal management challenges from the high level of heat generation and the reduction of available surface area for heat removal so, the reliable thermal management system is vital for the smooth operation of the advanced electronic devices. In general, there are two approaches to improve the heat removal for electronic equipment. One is to find an optimum geometry of cooling devices; another is to increase the heat transfer capacity. Nanofluids with higher thermal conductivities are predicated convective heat transfer coefficients compared to those of base fluids. 2) Transportation Nanofluids have great potentials to improve automotive and heavy-duty engine cooling rates by increasing the efficiency, lowering the weight and reducing the complexity of thermal management systems. The improved cooling rates for automotive and truck engines can be used to remove more heat from higher horsepower engines with the same size of cooling system. Alternatively, it is beneficial to design more compact cooling system with smaller and lighter radiators.
35 3) Industrial cooling applications The application of nanofluids in industrial cooling will result in great energy savings and emissions reductions. For US industry, the replacement of cooling and heating water with nanofluids has the potential to conserve 1 trillion Btu of energy [4, 6]. For the US electric power industry, using nanofluids in closed loop cooling cycles could save about trillion Btu per year (equivalent to the annual energy consumption of about 50, ,000 households). The associated emissions reductions would approximately 5.6 million metric tons of carbon dioxide, 8,600 metric tons of nitrogen oxides, and 21,000 metric tons of sulfur dioxide [5]. 4) Heating building and reducing pollution Nanofluids can be applied in the building heating systems. Kulkarni et al. evaluated how they perform heating buildings in cold regions [8]. In cold regions, it is a common practice to use ethylene or propylene glycol mixed with water in different proportions as a heat transfer fluids. 5) Nuclear systems cooling The Massachusetts institute of Technology has established an interdisciplinary center for nanofluid technology for the nuclear energy industry. The researchers are exploring the nuclear applications of nanofluids, a specifically the following three [9, main reactor coolant for pressurized water reactors (PWRs). It could enable significant power upgrates in current and future PWRs, thus enhancing their economic performance. Specifically, the use of nanofluids with at least 32% higher critical heat flux (CHF) could enable a 20% power density uprate in current plants without changing the fuel assembly design and without reducing the margin to CHF; 2) coolant for the emergency core cooling systems (ECCSs) of both PWRs and boiling water reactors. The use of a nanofluid in the ECCS accumulators and safety injection can increase the peak-cladding-temperature margins (in the nominal-power core) or maintain them in uprated cores if the nanofluid has a higher post-chf heat transfer rate; 3) coolant for in-vessel retention of the molten core during severe accidents in high-power-density light water reators. It can increase the margin to vessel breach by 40% during severe accidents in high-power density systems such as Westinghouse APR1000 and the Korean APR ) Space and defense Due to the restriction of space, energy and weight in space station and aircraft, there is a strong demand for high efficient cooling system with smaller size. You et al. [7] and Vassalo et al. [1] have reported order of magnitude increases in the critical heat flux in pool boiling with nanofluids compared to the base fluids alone. B) Mass transfer enhancement Several researches have studied the mass transfer enhancement of nanofluids. Kim et al. initially examined the effect of nanoparticles on the bubble type absorption for NH 3 /H 2 O absorption system [2]. The addition of nanoparticles enhances the absorption performance up to 3.21 times. Then they visualized the bubble behavior during the NH 3 /H 2 O absorption process and studied the effect of nanoparticles and surfactants and nanoparticles on the absorption characteristics [3]. The results show that the addition of surfactants and nanoparticles improved the absorption performance up to 5.32 times. The addition of both surfactants and nanoparticles improved the absorption performance up to 5.32 times. The addition of both surfactants and nanoparticles enhanced significantly the absorption performance during the ammonia bubble absorption process.
36 c) Energy applications For energy application of nanofluids, two remarkable properties of nanofluids are utilized, one is the higher thermal conductivities of nanofluids enhancing the heat transfer, another is the absorption properties of nanofluids. 1) Energy storage The temporal difference of energy source and energy needs made necessary the development of storage system. The storage of thermal energy in the form of sensible and latent heat has become an important aspect of energy management with the emphasis on efficient use and conservation of the waste heat and solar energy in industry and buildings [7]. Latent heat storage is one of the most efficient ways of storing thermal energy. 2) Solar absorption Solar energy is one of the best sources of renewable energy with minimal environmental impact. The conventional direct absorption solar collector is a well established technology, and it has been proposed for a variety of applications such as water heating; however the efficiency of these collectors is limited by the absorption properties of the working fluid, which is very poor for typical fluids used in solar collectors. D) Mechanical applications Why nanofluids have great friction reduction properties? Nanoparticles in nanofluids form a protective film with low hardness and elastic modules on the worn surface can be considered as the main reason that some nanofluids exhibit excellent lubricating properties. Magnetic fluids are kinds of special nanofluids. Magnetic liquid rotary seals operate with no maintenance and extremely low leakage in a very wide range of applications, and it utilizing the proprety magnetic properties of the magnetic nanoparticles in liquid. 1) Friction reduction Advanced lubricants can improve productivity through energy saving and reliability of engineered systems. Tribological research heavily emphasizes reducing friction and wear. Nanoparticles have attracted much interest in recent years due to their excellent load-carrying capacity, good extreme pressure and friction reducing properties. 2) Magnetic sealing Magnetic fluids (Ferromagnetic fluids) are kinds of special nanofluids. They are stable colloidal suspensions of small magnetic particles such as magnetite (Fe 3 O 4 ). The properties of the magnetic nanoparticles, the magnetic component of magnetic nanofluids, may be tailored by varying their size and adapting their surface coating in order to meet the requirements of colloidal stability of magnetic nanofluids with non-polar and polar carrier liquids [4]. E) Biomedical application 1) Antibacterial activity Organic antibacterial materials are often less stable particularly at high temperatures or pressures. As a consequence, inorganic materials such as metal and metal oxides have attracted lots of attention over the past decade due to their ablilty to withstand harsh process conditions. The antibacterial behavior of ZnO nanofluids shows that the ZnO nanofluids have bacteriostatic activity against [8].
37 2) Nanodrug delivery Over the last few decades, colloidal drug delivery systems have been developed in order to improve the efficiency and the specificity of drug action [1]. The small size, customized surface, improved solubility, and multi-functionality of nanoparticles open many doors and create new biomedical applications. The novel properties of nanoparticles offer the ability to interact with complex cellular functions in new ways [1]. F) Other applications 1) Intensify micro reactors The discovery of high enhancement of heat transfer in nanofluids can be applicable to the areas of process intensification of chemical reactors through integration of the functionalities of reaction and heat transfer in compact multifunctional reactors. Fan et al. studied reactor-heat exchanger [2]. The overall heat transfer coefficient increase was up to 35% in the steady state continuous experiments. This resulted in a closer temperature control in the reaction of selective reduction of an aromatic aldehyde by molecular hydrogen and very rapid change in the temperature of reaction under dynamic reaction control. 2) Nanofluids as vehicular brake fluids A vehicle s kinetic energy is dispersed through the heat produced during the process of braking and this is transmitted throughout the brake fluid in the hydraulic brake], and now there is a higher demand for the properties of brake oils. Copper-oxide and aluminum oxide based brake nanofluids were manufactured using the arc-submerged nanoparticle synthesis system and plasma charging arc system, respectively [1]. 3) Nanofluids based microbial fuel cell Microbial fuel cells (MFC) that utilized the energy found in carbohydrates, proteins and other energy rich natural products to generate electrical power have a promising future. The excellent performance of MFC depends on electrodes and electron mediator. Sharma et al. constructed a novel microbial fuel cell (MFC) using novel electron mediators and CNT based electrodes [4]. The novel mediators are nanofluids which were prepared by dispersing nanocrystalline platinum anchored CRTs in water. 4) Nanofluids with unique optical properties. Optical filters are used to select different wavelengths of light. The ferro fluid based optical filter has tunable properties. The desired central wavelength region can be tuned by an external magnetic field, Philip et al. developed a ferrofluid based emulsion for selecting different bands of wavelengths in the UV, visible and IR regions [1). 3.0 Preparation of nanofluids Preparation of nanofluids is the first key step in experimental studies with nanofluids. Nanofluids are not simply liquid-solid mixtures. Some special requirements are essential e.g. even and stable suspension, durable suspension, negligible agglomeration of particles, no chemical change of the fluids, e.t.c Nanofluids are produced by dispersing nanometer-scale solid particles into base liquids such as water, ethylene glycol (EG), oils, e.t.c. In the synthesis of nanofluids, agglomeration is a major problem. There are mainly two techniques used to produce nanofluids: the single-step and the two-step method. The single-step direct evaporation approach was developed by Akoh et al. [4] and is called the VEROS (vacuum Evaporation onto a Running Oil Substrate) technique. The original idea of this method was to produce nanoparticles, but it is difficult to subsequently separate the particles from the fluids to produce dry nanoparticles. A modified VEROS process was proposed by Wagener et al. [5]. They employed high pressure magnetron
38 sputtering for the preparation of suspension with metal nanoparticles such as Ag and Fe. Eastman et l. [6] developed a modified VEROS technique, in which Cu vapor is directly condensed into nanoparticles by contact with a flowing low-vapor-pressure liquid (EG). Zhu et al. [7] presented a novel one-step chemical method for preparing copper nanofluids by reducing CuSO 4.5H 2 O with NaH 2 PO 2.H 2 O in ethylene glycol under microwave irradiation. Results showed that the addition of NaH 2 PO 2.H 2 O and the adoption of microwave irradiation are two significant factors which affect the reaction rate and the properties of Cu nanofluids. A vacuum-sanss (submerged arc nanoparticles synthesis system) method has been employed by Lo et al. [8] to prepare Cu-based nanofluids with different dielectric liquids such as de-ionized water, with 30%, 50%, 70% volume solutions of ethylene glycol and pure ethylene glycol. They found that the different morphologies, which are obtained, are mainly influenced and determined by the thermal conductivity of the dielectric liquids. CuO, Cu 2 O, and Cu based nanofluids also can be prepared by this technique efficiently. An advantage of the one-step technique is that nanoparticle agglomeration is minimized, while the disadvantage is that only low vapor pressure fluids are compatible with such a process. Recently, a Ni nanomagnetic fluid was also produced by Lo et al. [7] using the SANSS method. The two-step method is extensively used in the synthesis of nanofluids considering the available commercial nanopowders supplied by several companies. In this method, nanoparticles was first produced and then dispersed the base fluids. Generally, ultrasonic equipment is used to intensively disperse the particles and reduce the agglomeration of particles. For example, Eastman et al. [6], Lee et al. [10], and Wang et al. [1] used this method to produce Al2O3 nanofluids. Also, Murshed et al. [2] prepared TiO 2 suspension in water using the two-step method. Other nanoparticles reported in the literature are gold (Au), silver (Ag), silica and carbon nanotubes: As compared to the single-step method, the two-step technique works well for oxide nanoparticles, while it is less successful with metallic particles. Except for the use of ultrasonic equipment, some other techniques such as control of ph or addition of surface active agents, are also used to attain stability of the suspension of the nanofluids against sedimentation. These methods change the surface properties of the suspended particles and thus suppress the tendency to form particle clusters. It should be noted that the selection of surfactants should depend mainly on the properties of the solutions and particles. Xuan and Li [3] chose salt and oleic acid as the dispersant to enhance the stability of transformer oil-cu and water-cu nanofluids, respectively. Oleic acid and cetyltrimethyle ammonium bromide (CTAB) surfactants were used by Murshed et al. [2] to ensure better stability and proper dispersion of TiO 2 -water nanofluids. Sodium dodecyl sulfate (SDS) was used by Hwang et al. [4] during the preparation of water-based MWCNT nanifluids since the fibers are entangled in the aqueous suspension. In general, methods such as change of ph value, addition of dispersant, and ultrasonic vibration aim at changing the surface properties of suspended particles and suppressing formation of particles cluster to obtain stable suspensions. However, the addition of dispersants can affect the heat transfer performance of the nanofluids, especially at high temperature. 3.1 Nanoparticles In nanotechnology, a particle is defined as a small object that behaves as a whole unit with respect to its transport and properties. Particles are further classified according to diameter. Coarse particles cover a range between 10,000 and 2,500 nanometers. Fine particles are sized between 2,500 and 100 nanometers. Ultrafine particles or nanoparticles are sized between 1 and 100 nanometers. The reason for this double name of the same object is that, during the s, when the first through fundamental studies with nanoparticles were underway in the USA (by Granqvist and Buhram) and Japan, (within an ERATO Project they were called ultrafine particles (UFP). However, during the 1990s before the National
39 Nanotechnology Initiative was launched in the USA, the new name, nanoparticle had become fashionable (see, for example the same senior author s paper 20 years later addressing the same issue, lognormal distribution of sizes ). Nanoparticles may or may not exhibit size-related properties that differ significantly from those observed in fine particles or bulk materials.(5) Although the size of most molecules would fit into the above outline, individual modules are usually not referred to as nanoparticles. 4.o CLUSTERS AND MAGIC NUMBERS When atoms come together, they initially form two-dimensional clusters. When more atoms join the cluster, they become three-dimensional with topographically close-packed arrangements, before taking up a crystal structure. It has been found that clusters of certain critical sizes, i.e., clusters with a certain number of atoms in the group, are more stable than others. Such clusters are stabilized either by geometric or electronic considerations. Magic number is defined as the number of atoms in the clusters of critical sizes with higher stability. This effect was initially observed in gaseous metal atoms, in the early 1980s. Subsequently, a similar effect was also noticed during the condensation of atoms from a vapour phase on a substrate surface, for example, during thin film deposition. Magic numbers based on electronic shells were first observed in mass spectra of alkali metal clusters. The stability of such clusters continuous function. It was seen that for some specific number of 4.1 CHALLENGES AND FUTURE PROSPECTS With so many achievements already realised, it is perhaps pertinent to ask Where is nanotechnology heading? It is envisaged that nanotechnology will lead to tiny robotic devices, utilizing nanoelectronics, sensors and MEMS/NEMS for in-vivo monitoring and diagnosis of electro-optic deficiencies and malfunctions of human systems. Yet, the current applications of nanotechnology are much more mundane:stain-resistant trousers, better sun creams, tennis rackets reinforced with carbon nanotubes! There is a huge gap between what nanotechnology is believed to have promised and what it has actually delivered so far, In his book, Engines of Creation: The Coming Era of Nanotechnology, published in 1986,Drexler imagined sophisticated nanoscale machines that could operate with atomic precision. He envisaged a particular way of achieving nanotechnology, which involved using hard materials like diamond to fabricate complex nanoscale structures by moving reactive molecular fragments into position. His approach was essentially mechanical, whereby tiny gears and bearings are integrated to make tiny robot factories, probes and vehicles. Drexler postulated that since nanoscale machines are expected to be extensively employed in biological systems and would be synthesized in significantly large quantities under ambient conditions, it should be possible to discover the growth conditions to synthesize them for a variety of other applications as well. The beauty of nanotechnology is that it is truly multidisciplinary, re-unifying the common threads between science, engineering and technology.it is so vivid, with possibilities left only to the constraint of perhaps human imagination. With a little exaggeration, it seems possible that materials with any desired physical, chemical or electronic properties can be tailor-made by playing with the nano-dimensions. The next generation is going to be directly or indirectly exposed to a variety of nano-products ranging from cosmetics to sports, from medical to industrial, and also space applications. With the advent of any new revolutionary technology with enormous potential for applications, it is perhaps even more pertinent to assess the risks and challenges accompanying them. The effect of nanoparticles on biological and ecological systems in large is a subject to be studied with the highest priority. A new field, nano-toxicology, has evolved in order to probe this field. It is important to qualify the application of nanomaterials for industrial and large-scale societal applications, not only based on their properties but also based on their possible long-term side effects
40 5.0 Conclusion Nanofluids are advanced fluids containing nano sized particles that have emerged during the last two decades, Nanofluids are used to enhanced system performance in many thermal engineering systems. This paper presented a review of the application of Nano fluids in solar thermal engineering%. REFERENCES 1. Choi SUS Developments and applications of non-newtonian flows, in: signer DD, Wang HP, Eds. American Society of Mechanical Engineering, New York 1995:231 (66):99 2. Cheng L. Bandarra FEP, Thome JR. J Nanocsi Nanotech H Masuda. A Ebata. K Teramac, N. Hishinuma, Alteration of thermal conductivity and viscosity of liquid by dispersing ultra-fine particles (dispersion of 7-A1203, Si02, and Ti02 ultra-fine particles), Netsu Bus-esi (Japan) 7 (4) (1993) S.A. Putnam, D.G. Cahill, P.V. Braun, Z. Ge, R.G. Shimmin, Thermal conductivity of nanoparticle suspensions, Journal of Applied Physics 99 (8) (2006) s 5. M.J. Assael. C.F. Chen, I.N. Metexa, W.A. Wakeham, Thermal conductivity of suspensions of carbon nanoubes in water, international Journal of Thermophysics 25 (4) (2004) C.Y.Tsai, H.T. Chien, P.P. Ding. B Chan, T.Y Luth, P.H Chen Effect of structural character of gold nanoparticle in nanofluid on heat pipe thermal performance, Material Letters 58 (20004) P. Keblinski J.A Esatman. D.G. Cahill, Nanofluids for thermal transport, Materials Today 8 (6) 92005) S.M.S. Murshed, K.C Leong, C. Yang Enhanced thermal conductivity of Ti0 2 -water based nanofluids. International Journals of thermal sciences 44 (4) (2005)
41 PROXIMATE ANALYSIS AND HYDROLYSIS OF MALTED MILLET (PANICUM MILIACEUM) BLENDED WITH MAIZE AND RICE FLOUR ABSTRACT Umaru Ayuba Alfa Dept of Chemistry,College Of Education, Gindiri, Nigeria and Emmanuel Ishaya Genwa Boys Seconday School, Gindiri, P.M.B, 1001, Gindiri, Nigeria The physico chemical result of the analysis of proso millet (Panicum milliaceum) showed the optimum water uptake of the millet to be 96 hours, optimum malting time 96 hours, ash content 3.26 ± 0.03, moisture content 11.37%, ± 0.33, crude fat content 1.30% ± 0.20, crude protein content 13.87% ± 0.5, carbohydrate content 71.46% ± 0.80, reducing sugars 35.08% ± 0.80, hydrolysable sugars 54.29% ± 0.70 and fibre content 6.37% ± the mineral composition of proso millet in mg/100g showed that the millet contains K (2.14), Fe (1.04), mg (0.85), Ca (0.65), Na (0.17), Al (0.13), Mn (0.013), Zn (0.04), Pb (Lead) was not detected in the milled. Temperature and P H Shidies on the malted millet showed the optimum values to be 50 0 c 60 0 c and 5-6 respectively. The blending ratio of the gelatinized maize flour ground with the chaff with malted millet was found to be 50%, while the blending ratio of gelatinized maize after removing the chaff with malted milled was determined to be 60%. The blending ratio of the gelatinized rice flour with malted millet was also found to be 60%. The decrease of about 10% in the value of reducing sugar production between the two maize flours could be due to the fact that, the unprocessed seeds have more lignified materials which could inhibit access to amylase during hydrolysis. The absence of heavy metal lead (Pb) and high carbohydrate content of proso millet indicates that it could be used in the brewing industry as an adjunct to barley. INTRODUCTION Proso millet (Panicum miliaceum) belongs to the family Gramineae, which is a large family of grasses with about 620 genera and 1,000 species dispersed in many parts of the world where plants can survive. Gramineae is
42 economically the most important family of flowering plants; the grasses provide diet of most of the world population. This is the reason for the extensive studies of the chemical composition of cereals, optimum water uptake, optimum malting time and also the determination of whether the amylases of the malted cereals could be used to hydrolyse starches of other cereals such as maize flour before and after removing the chaff and also rice flour. Maize (Zea mays) is one most important cereals in the world apart from wheat and rice. It also belongs to the family Gramineae. It is also an adjunct needed in the brewing industry as raw material for the production of starch and other beverages. It is ground into powdered form and made into porridge called Kpekple in Ghana, Kunu (Hausa) in Northern Nigeria. Bidia in Zaire, Sadza in Zimbabwe, puto in Zulu land. The meal obtained from maize is cooked with water to provide a thick meal called tuwo (Hausa) Northern Nigeria. Rice (Oryza sativa) is the seed of the monocot plant. Rice is the most important grain with regard to human nutrition and caloric intake. It provides more than one fith (1/5) of the calories consumed worldwide by humans. Rice is usually cooked by boiling and is eaten mostly with fish, vegetable or meat. Raw rice may be ground into powder (flour) and converted into many uses including rice milk, rice wine etc. CARBOHYDRATES. Canbolydrates belong to the class of organic compounds having the general molecular formular of CnH2nOn. Starch, glucose, cellulose and glycogen all belong to this class of organic compounds. Starches are substances which constitute the major part of the human diet for almost half of the world population as swell as animals. Starch molecules are glucose polymers linked together by α 1 4 and α 1 6 glycoside bonds as opposed to theβ1 4 glycoside bonds for cellulose. Enzymes are capable of hydrohyzing starch usually to form oligosaccharides and other smaller units e.g disaccharides and monosaccharides. This is possible with a special type of enzymes called alpha amylase which is present in the saliva of human beings and can hydrolyse starch to maltose and glucose. Partial hydrolysis of starch usually produces Dextrin which is a mixture of D glucose and branched oligosaccharide. Dextrin is often a component of infant diet because it is easily digestible starch granules are
43 quite resistant to penetration to both water and hydrolytic enzymes due to the formation of intermolecular and intermolecular hydrogen bonds. However the hydrogen bonds can be weakened as the temperature of the suspension is raised. When this happens, water absorption becomes possible and the starch granules swell. This process is called gelatinization. MALTING:- The process of malting actually refers to all the charges that take place during the development of the seed into seedling in which water is absorbed by the seed through the micropyle, thus causing the entire seed to swell up. The cells of the cotyledon become active and turgid and begin to make use of the water to dissolve and digest the food solution stored in them. The solublised foods reserved are then transported to the growing plumule and radicle. Malting also called germination is affected by a number of factors such as temperature, water, air, enzymes, and β amylase provide an appropriate medum for the degradation of the starch inside the grain into simple sugars such as glucose and maltose. In addition to starch degradation, the reserved protein inside the seed is also degraded into appropriate mixture of polypeptide and amino acid by specific enzymes called protein degrading enzymes. MATERIALS AND METHODS COLLECTION OF SAMPLES AND PREPARATION FOR ANALYSIS The millet seeds (Panicum Miliaceum) were obtained from Kadamo in Jengre, Bassa Local Government Area of Plateau State. The feeds were winnowed to remove dust and pebbleds. The seeds were ground into powder and stored in a dessicator for the analysis, but maize seeds were divided into two, one part ground with the chaff and the other part ground after removing the chaff, while some millet seeds were kept aside for water uptake and malting quality analysis. OPTIMUM WATER UPTAKE DETERMINATION 5.0g of millet grains was weighed at room temperature 25 0 C 28 0 C and steeped in twelve (12) pre-weighed petri dishes for various hours from 12 hours to 144 hours. Each of the petri dishes was removed after predetermined time interval of 12 hours and the water drained off and was allowed to dry at temperature of 25 0 C C for exactly 2 hours. The sample
44 was then re-weighed and the increase in weight was then expressed as the percentage water uptake of the millet grains. DETERMINATION OF OPTIMUM MALTING TIME 5.5g millet grains were each placed into five different pre-weighed petri dishes containing filter paper inside them in order to keep the grains wet and were steeped at room temperature. The millet grains were allowed to germinate (i.e green malting) for various number of hours by changing the water at time intervals of 16hours. Each of the samples was milled after a time interval of 24 hours, 48 hours, 72 hours, 96 hours and 120 hours. Each of the milled samples was transferred into 100ml standard volumetric flask and acetate buffer solution P H 5.5 was added to each milled sample and hydrolysed at various temperatures of 30 0 C, 50 0 C, 60 0 C, 70 0 C and 80 0 C respectively for 2hours using thermostat water bath. The hydrolysed sample was then centrifuged and assayed for reducing sugar by Nelson Method. DETERMINATION OF ASH CONTENT About 3.0g, 4.0g and 5.0g of ground moisture free millet samples were placed inside pre-weighed porcelain crucibles. The crucibles were then placed in a muffle furnace and the temperature maintained at C for about 8hours. The crucibles were then removed and reweighed. The weight of the ash was expressed as the % ash content of the millet samples. TABLE 1: Determination of Ash Content s/no weight of weight of weight of weight Weight lost in % ash sample (g) empty sample and before after weight content crucible crucible ashing ashing % % Ash Content = DETERMINATION OF MOISTURE CONTENT 5.0g, 6.0g and 7.0g of ground moisture free millet samples were weighed into 3 pre-weighed dry clean small size beakers (50ml) and were allowed to dry inside a hot air Gallen kanp oven for about 24hours maintained at a temperature of C. After drying, the samples were allowed to cool in
45 dessicators for about 2 hours after which they were reweighed. The % loss in the weight was expressed as the moisture content of the millet. Table 2: determination of moisture content S/No weight of sample (g) weight of empty beaker sample + beaker (before) sample + beaker (after lost weight in % moisture content % moisture content = ± 033 DETERMINATION OF CRUDE FAT Ground moisture free millet samples of 8.0g, 9.0g and 10.0g were weighed into 3 different pre weighed fat free white cloths and wrapped separately. The wrapped samples were then weighed into 3 different fat free thimbles. This was then soxhlet extracted using petroleum ether (60 0 C-80 0 C) for 8 hours after which the thimbles were carefully removed and allowed to dry at room temperature. The thimbles and the samples inside were reweighed after drying. The difference in the weight was expressed as the percentage crude fat content of millet. S/No Table 3: Determination of crude fat weight of sample (g) weight of white cloth weight of thimble total weight before extraction total weight after extraction lost in weight %crude fat % Crude fat content = DETERMINATION OF CRUDE PROTEIN AND NITROGEN 0.5g of ground moisture free millet samples were weighed on different ashless filter papers wrapped together and quantitatively transferred into 3 different Kjeldahl digestion flasks labeled A,B,C with the fourth flask labeled D, blank sample 0.2g of the catalyst (mixture of anhydrous Na2S04, CuSO4 and SeO2) was added to each flask followed by 10ml of concentrated H2SO4 and few pieces of anti-bombing granules was added to each of the flask. The Kjeldahl
46 flasks were heated gently at first. As the fumes ceased, the heating is increased and would continue for about 2-4 hours after which a clear solution is obtained. The solution was allowed to cool and diluted with distilled water with the flasks immersed inside the bath. The diluted solution was then transferred into a 100ml volumetric flask and made up to the mark for all the samples with distilled water. Kjeldahl distillation apparatus (Markehan still) was assembled over a Bunsen burner and 10ml of the digested sample was transferred into the flask through the funnel connected by means of a spray bulb to the condenser. 20ml 0f 40% NaOH was added to the flask containing the digested sample while the tip of the condenser was deeped into 20ml of 2% Boricacid containing few drops of the indicator (mixture of methylred and methylene blue indicators) was added. Ammonia released was passed through the condenser to the Boricacid which changed the colour from purple colour to green. The heating was stopped after about 75ml of the solution was collected. The solution was then titrated against 0.05M H2SO4 untill the purple colour of the Boricacid reappeared. This is the end point. Percent protein was expressed according to the formula % N2 = 14(TS Tb) X M X 100X X 10 X weight of sample Where Tb = volume of the standard acid of blank Ts = Volume of the standard acid in the titration M = Molarity of the H2SO4 10 = Volume of the sample used 100 = Dilution factor used 14 = Atomic weight of Nitrogen. Table 4: Determination of Crude protein S/No weight of Titre value of volume of % % protein sample (g) sample (CM 3 ) sample- volume N2 of blank 1 sample sample
47 sample % Crude Nitrogen= Titre value % % Crude protein = Blank sample = 0.37 PREPARATION OF STANDARD CURVE FOR TOTAL CARBOHYDRATE USING D (+) GLUCOSE g Vacuumdried D (+) glucose was weighed and quantitatively transferred into a 100ml volumetric flask and dissolved and made up to the mark with distilled water producing 0.01M glucose solution (10 μm/ml). From the solution 5ml were each pipetted and transferred into a 100ml standard volumetric flask and made up to the mark with distilled water, with the concentrations as 0.5 μm/ml. 1.0 μm/ml, 1.5 μm/ml, 2.0 μm/ml, 2.5 μm/ml, 3.0 μm/ml, 3.5 μm/ml, 4.0 μm/ml, μm/ml, 4.5 μm/ml and 5.0 μm/ml respectively. To each of the above standards, 1ml was taken and placed in a test tube standing inside ice bath and 5ml of L Cysteine, sulphuricacid was added in the ratio 1:5. The test tubes were then covered with aluminium foils and then heated inside boiling water for 3 minutes after which they were allowed to Cool to room temperature and the absorbance immediately taken at 420nm using colorimeter. The reading of the absorbance was then plotted against the corresponding values of the sugar concentration. Table 5: standard curve values of D (+) glucose by L Cysteine sulphuricacid method. No of test tube Dilution of Standard conc. Absorbance max 420 glucose and dist. Of sugar (nm) water (ml) (μm/ml) 1 5/ / / / / / / / / /
48 Absorbance max (420 nm) Concentration ( μm/ml) FIG 1: Total carbohydrate by L Cysteine sulpuricacid method.
49 DETERMINATION OF MINERAL CONTENT 2.0g each of the ground millet sample was weighed and placed into two different crucibles and ashed at temperature of C for 8 hours. The crucibles were then removed after ashing and cooled in dessicators. The ash was quantitatively transferred into 150ml beakers. To the ashes in the beakers, 10ml of distilled water, 10ml of concentrated perchloricacid, 10ml of concentrated hydrochloricacid and 10ml of concentrated trioxonitrate (v) acid were added. The beakers were covered and heated at a temperature of C on a hot plate until the emmission of brown fumes stopped. The sides of the beakers were rinsed with dislilled water and then heated further to concentrae the solution to 5ml. the beakers were then removed and cooled before adding 10ml of concentrated HNO3. To the solution, 5ml of distilled water was added and boiled for 5 minutes. The solutions were then filtered into 100ml standard volumetric flask and made up to the mark with distilled water. The solutions of the samples prepared were then used to determine the elements of interest using atomic absorption spectroscopy machine (AAS). The metals determined were; Ca, Fe, Se, Mg, Ni, Mn. K, Cd, As, Na, Pb, Cu, Zn, Al. Table 6: Determination of mineral content S/NO Element Mg/L Mg/100g Sample/ dry weight Mean values A B A B 1 Al As Ca Cd Cr Cu Fe K Mg Mn Na Ni Pb N.D N.D N.D N.D N.D 14 Se Zn
50 DETERMINATION OF OPTIMUM BLENDING RATIO OF MALTED MILLET AND RICE FLOUR Rice flour and malted millet were blended in the following ratio to make up 5g. 0.5: 4.5, 1:4, 1.5: 3.5, 2:3, 2:5, 2.5, 3:2, 3.5:1.5, 4:1, The rice flour was gelatinized first in 100ml of 0.05M acetate buffer P H 5.5 then cooled to a temperature of 50 0 C before adding the malted millet. The solutions were then allowed to hydrolyse at a temperature of 50 0 C for exactly 2 hours. Samples of the solutions were withdrawn, centrifuged and assayed for reducing sugar by Nelson method, max 520nm using a colorimeter. Table 7: Determination of optimum blending ratio of malted millet and rice flour. S/NO Weight of Weight of Absorbance Concentration % hydrolyted rice flour (g) malted millet (g) at max 520 mg/ml nm sugar
51 Consecration of Sugars mg/ml * * * * * * * Fig2 DETERMINATION OF OPTIMUM BLENDING RATION OF MALTED MILLET AND MAIZE FLOUR GROUND WITH THE CHAFF (UNPROCESSED) Maize flour ground with the chaff was blended with malted millet in the following ratios to make 5g. 0.5: 4.5, 1.0:4.0, 1.5:3.5, 2.0:3.0, 2.5:2.5, 3.0:2.0, 3.5:1.5, 4.0:1.0, 4.5:0.5. The maize flour was gelatinized first in 100ml of 0.05ml acctate buffer P H 5.5. It was cooled to a temperature of 50 0 c before the malted millet was added. The solution was hydrolysced at a temperature of 50 0 c using a thermostat water bath for about 2 hours. Samples were withdrawn, centrifuged and assayed for reducing sugars by Nelson method max 520nm using a colorimeter.
52 Table 8: Determination of optimum blending ratio of malted millet and maize flour ground with chaff. S/No weight of weight of Absorbance concentration % maize flour (g) malted millet (520nm) (Mg/Ml) hydrolyzed (g) Fig3: Percentage of blended Malted Millet and Maize flour with the chaff DETERMINATION OF OPTIMUM BLENDING RATION OF MALLTED MILLET AND MAIZE FLOUR WITHOUT THE CHAFF Maize flour obtained after removing the chaff was blended with malted millet in the following ratio to make up to 5g. 0.5:4.5, 1.0:4.0, 1.5:3.5, 2.0:3.0, 2.5:2.5, 3.0:2.0, 3.5:1.5, 4.0:1.0, 4.5:0.5, the maize flour was gelatinized first in 100ml 0.05ml acetate buffer Ph 5.5, allowed to cool to a
53 temperature of 50 0 c before malted millet was added, the solutions were hydrolyzed at a temperature of 50 0 c using a thermostat water bath for 2 hours. Samples were withdrawn, centrifuged and assayed for reducing sugar by Nelson method using a colorimeter with max 520nm. Table 9: S/No weight of maize weight of absorbance concentration % flower (g) malted millet at 520nm (mg/ml) hydrolyzed (g) Fig4: Percentage of blended malted millet and maize flour without chaff DISCUSSION: The result of the water uptake of the millet shows that there was rapid absorption of water at the initial steeping time but shows no significant change at 96 hours. This shows that, at 96 hours there is maximum Saturation of water by the seeds. Results for the hydrolysis of malted millet for various hours (24-120) for temperatures between 30 0 c-80 0 c shows that amylase activity was higher at 96 hours of malting time. The temperatures at which the amylase functions best was found to be 50 0 c. At higher temperature, there was
54 decrease in the activity of the amylase. This could be due to the denaturation of the enzymes. In table 1, the ash content of the millet grains was determined to be 3.26% ± This indicates a high mineral content in the millet grain. Table 2 shows that the moisture content of the millet is 11.37% ± The moisture content of Cereals usually depends on factors such as harvesting time as well as storage conditions. Adequate moderation of these conditions is needed to prevent detoriation due to high moisture content especially insect attack and fungal growth. However, moisture content of 10-12% is reported to be safe for grains intended to be stored for a long period of time. The Crude fat content as shown in table 3 was determined to be 1.3%± 0.2. generally, the total lipid (fat) content of cereals is about 5% of the dry grains. Though fats are useful nutritionally, they can constitute a problem in the brewing industries. This is because the degradation of fatly acid may give rise flavor defect in bear and milk drinks. Table 4 shows the Crude protein of the millet to be 13.37% ± 0.5. In general, lower values of protein content is associated with cereals with higher carbohydrate content and vice-versa. Such cereals with higher carbohydrate content are said to produce extract which is rich in malt. The carbohydrate content of the millet was determined to be 71.46% The reducing sugar content was found to be 35.08% while the hydrolysable sugar was determined to be 54.29% The lower values suggest that the use of acid hydrolysis could have resulted in the conversion of some carbohydrates to furans and pyrans. Tables 7, 8 and 9 show the blending ratio of millet with gelatinized rice flour, maize flour with the chaff and maize flour without the chaff respectively. The values are 60%, 50% and 60% respectively. The decrease of 10% of reducing sugar production of the gelatinized maize with the chaff compared to the one without the chaff could be due to the fact that chaff of the seeds contain some lignified materials such as proteins fats and fibre, which are found in the outer seed coat of the grains and could constitute hindrance to enzyme activity.
55 Table 6 shows the presence of metals in the proso millet. Absence of lead metal (Pb) is an indication of the safety of consumption of the grain. CONCLUSION This research work shows that. Proso millet (panicum millaceum) is rich in protein, carbohydrate and also contains some important minerals such as calcium, Potassium, magnesium and Iron hence it is a good source of food and as an adjunct in the brewing industry. REFERENCES Aisien, A. O. (1982) Enzymes modification of sorghum endosperm during seedling growth and malting, Journal of science food and agriculture. Vol 33: Benz. C. and Brue.F ) Maize Origin, domestication and development: oxford encyclopedia of meso-american Culturs Vol , New York Oxford University. Chris I.A. (2010) Laboratory Organic chemistry techniques qualitative analysis, organic preparations and spectroscopy. Maybinso publishers new Jersey USA Crowford G.W and Shen C. (1998) The origin of rice Agriculture recent progress in east Asia. A Journal of antiquity Vol 72: Dashak, D.A. and Nwanegbo, V. (2002). Chemical composition of the seeds and calyxes of (Hibiscus Sabdariffa) grown in Jos North local government are of plateau state. Journal of natural sciences Vol 5: Dashak A.D, Alabi O.A and Osadebe, J. (2004) An evaluation of the chemical composition and malting properties of finger millet. A journal of science and technology research Vol 3, number 4 Food and nutrition Board (2005) Dietary intake for energy, carbohydrate, fibre, fatty acids cholesterol, proteins and amino acids, Washington DC USA, the national academic press Gabo L.E. (1994) Hydrolysis of maize grits blended with malted barley, the effect of metal ions on the hydrolysis. MSc thesis Department of Chemistry, university of Jos.
56 Hands- Dieter B Werners G, and Peter S. (2004) food Chemistry 3 rd Springer edition Odabe C.K (2006) Hydrolysis of malted millet (Pennisetum Typhoides) blended with cassava flour, undergraduate thesis department of Chemistry University of Jos. Shambe T, Voncir N. and Gambo, E (1989) Enzyme and acid hydrolysis of malted cereals Journal of institute of brewing. Vol 77:Page Steiner, E. Gastl, M. and Becker, T ). Protein changes during malting and brewing with focus on haze and foam formation: a review of European food research technology. Vol. 332 No. 2:
57 DESIGN AND IMPLEMENTATION OF AN EFFICIENT ALGORITHM USING DATA STRUCTURES: A RECIPE FOR THE STRUCTURED PROCESS CALLED TOP DOWN PROGRAMMING Chukwudi Igbe and Elei Florence.O Department of Computer Science, Imo State University Owerri,Nigeria ABSTRACT Top-down programming is procedural programming style, which design begins by defining the solution at the highest level of functionality and breaking it down further and further into small routines that can be easily documented and coded. The main aim of this paper is a revisiting of the generic top down programming approach in solving and implementation of an efficient algorithm. we went into these research because programming is traditionally taught using bottom up approach where details of syntax and implementation of data structure are the predominant concept. The top down approach proposed focuses instead on understanding the abstractions represented by the classical data structures without regard to their physical implementation. This paper discusses the benefits of this approach and how it is used in an object oriented world. Key word: Stepwise refinement, Deductive, Procedural Language, 1.0 INTRODUCTION 1.1What is Top-down programming? Top-down programming, as the name implies, takes a high level definition of the problem and subdivides it into sub problems, which can then be solved to a pieces that will be easy to code. In order words, to solve a large problem, break the problem into several pieces and work on each piece separately; to solve each piece, treat it as a new problem that can itself be broken down into smaller problems; repeat the process with each new piece until each can be solved directly, without further decomposition [2].The technique for writing a program using top down methods is to write a main procedure that names all the major functions it will need. Later, the programming team looks at the requirements of each of those functions and the process is repeated. These compartmentalized sub-routines eventually will perform actions so simple they can be easily and concisely coded. When all the various sub-routines have been coded the program is ready for testing. [4]. Top down programming, also called deductive reasoning or stepwise refinement is a software development technique that imposes a hierarchical structure on the design of the program. It starts out by defining the solution at the highest level of functionality and breaking it down further and further into small routines that can be easily documented and coded. [5].
58 Top-down and bottom up are both strategies of information processing and knowledge ordering, used in a variety of fields including software, humanistic and scientific theories and management and organization. In practice, they can be seen as a style/design methodology. A top-down approach, in many cases used as a synonym of analysis or decomposition, since is the breaking down of a system to gain insight into its compositional sub-systems. In a top-down approach an overview of the system is formulated, specifying but not detailing any first-level subsystems. Each subsystem is then refined in yet greater detail, sometimes in many additional subsystem levels, until the entire specification is reduced to base elements. A top-down model is often specified with the assistance of "black boxes", these make it easier to manipulate. However, black boxes may fail to elucidate elementary mechanisms or be detailed enough to realistically validate the model. Top down approach start with the big picture. It breaks down from there into smaller segments. [4] 2.0 BACKGROUND Top-down design was promoted in the 1970s by IBM, researcher Harlan Mills and Niklaus Wirth. Mills developed structural programming concepts for practical use and tested them in a 1969 project to automate the New York Times morgue index. The engineering and management success of this project led to the spread of the top-down approach through IBM and the rest of the computer industry. Among other achievements, Niklaus Wirth, the developer of Pascal programming language, wrote the influential paper Program Development by Stepwise Refinement. Since Niklaus Wirth went on to develop languages such as Modula and Oberon (where one could define a module before knowing about the entire program specification), one can infer that top down programming was not strictly what he promoted. Top-down methods were favored in software engineering until the late 1980s, and objectoriented programming assisted in demonstrating the idea that both aspects of top-down and bottom-up programming could be utilized. [4] 3.0 TOP-DOWN DESIGN When designing and implementing something, it is generally preferable to start at the most abstract level, and work down from there. For example, when designing and building a house, we prefer to start by deciding what kind of house we want. This in turn helps us determine how many floors, the rooms on each floor, and eventually what kind of building materials we'll need. This is the top-down approach. The bottom-up approach begins with the materials we have available and determines the higher level features based on what's possible with what we have. For example, if we start by deciding that our house will be made of snow, mud, or straw, this will strongly influence the type of house we end up with. The top-down approach doesn't prevent us from using pre-existing components at any level of the design or implementation. It merely allows the design to dictate the components, rather than vice-versa. These principals apply to computer programs as well as to houses. In order to end up with a program that closely matches our needs, it is preferable to begin at the highest level of abstraction (what the program does and how is used), and let that determine how the more detailed levels are designed and implemented.


59 In the implementation stage, the top-down approach involves writing the main program first, along with a stub for each subprogram called by main. A stub is simply an empty subprogram which has a complete interface [6]. Describe a problem in terms of high-level sub-problems. For each of the high-level sub-problems: o Describe it in its turn in terms of slightly simpler sub-problems. Continue this breakdown until the subtasks are sufficiently simple to be implemented directly as statements in a programming language. Each subtask becomes a subprogram (procedure/function). 3.1 TOP DOWN DESIGN IN AN OBJECT ORIENTED WORLD 3.3 Functional Decomposition Diagrams Top down diagram source:[1]
60 THE DESIGN PROCESS AND IMPLEMENTATION 1) Abstract Level In design, as we have say before, it is preferable to start at the most abstract level, and work down from there. For example, when designing and building a house, we prefer to start by deciding what kind of house we want to build. This in turn helps us determine how many floors, the rooms on each floor, and what kind of building materials we'll need. 2) Higher Level Task Write down the functionality of your system so you have a clear picture of what it does. For example, you can draw out the site map for a website and list all the pages, which will identify all the top-level functional requirements. The data appearing in our design is processed by means of certain operations. In fact, the particular data structure that one chooses for a given situation depends largely on the frequency with which specific operations are performed. In our top down example below, data structure operation are how to readintegers, sortintegers, printintegers. 3) More primitive level a) Identify the actors in your system (what are the major components in your system?). List the major message and data traffic interaction, which usually highlights some new helper objects. b) Group similar tasks or aspects of your program into a single object; objects have to play the role of modules or services in Java. 4) Individual sub task For each method of each object, apply top-down functional decomposition. Each method should have as few "operations" as possible while still being a complete concept. Further break down each of these operations until you think you have an "atomic" operation that is just a few simple programming instructions. 5.0 TOP-DOWN EXAMPLE Write a program to read in a sequence of integers, sort them, and print the sorted sequence. Step 1 public static void main(string[] args) { //readintegers; //sortintegers; //printintegers; } Step 2 readintegers Input?
61 Output? Lets store the integers in an array. Use a loop to read them in. Step 3 readintegers /** * Reads in 100 integers. */ public static int[ ] readintegers() { int[ ] vals = new int[100] ; // Loop to read in integers return vals ; } step 4 sortintegers Input? Output? /** * Sorts an array of integers. */ public static int[] sortintegers(int[] vals) { // Do the sorting return vals; } step 5 sortintegers Input? Output? /** * Sorts an array of integers. */ public static int[] sortintegers(int[] vals) { // Do the sorting return vals; } step 6 public static void main(string[] args) { int[] vals = readintegers() ; vals = sortintegers(vals) ; printintegers(vals) ; }
62 Ways of gradually filling in programs when doing top-down. // read in integers // TODO read in integers readinintegers(vals); static void readinintegers(int[] vals){/* TODO write code */} static void readinintegers(int[] vals){ // TODO replace this dummy code for(int i;i<vals.length;i++) vals[i]=i; } Actually write the function! A variant using object references public static void main(string[] args) { int[] myints = new int[100] ; readintegers(myints) ; sortintegers(myints) ; printintegers(myints) ; } [3] 6.0 ADVANTAGES OF TOP DOWN PROGRAMMING 1. Top-down allows the designer to dictate the components to use. 2. Operation and maintenance resources are not initially impacted as severely as with the bottom-up approach. 3. The top level function that calls the sub functions is like an index 4. Each sub function has a nice name that clearly identifies its function. Break functions into smaller chunks It is better to start design with a smaller and simple task, and then proceed into a bigger task because; 1. It is hard to understand long sequences, especially if there are IF conditionals 2. Hard to reuse big chunks whereas each smaller chunk could be reusable; factoring your code into smaller methods usually makes the whole program shorter due to code reuse. Top-down program design is a useful and often-used approach to problem solving. However, it has limitations:
63 It focuses almost entirely on producing the instructions necessary to solve a problem. The design of the data structures is an activity that is just as important but is largely outside of the scope of top-down design. It is difficult to reuse work done for other projects. By starting with a particular problem and subdividing it into convenient pieces, top-down program design tends to produce a design that is unique to that problem. Adapting a piece of programming from another project usually involves a lot of effort and time. Some problems by their very nature do not fit the model that top-down program design is based upon. Their solution cannot be expressed easily in a particular sequence of instructions. When the order in which instructions are to be executed cannot be determined in advance, easily, a different approach is required. [3] 7.0 CONCLUSION Top-down programming is one way of solving problems. It is useful for small-scale problems or subproblems. During the design and development of new products or software, designers and engineers uses both bottom-up and top-down approach. In object oriented programming, you commonly subdivide the problem by identifying domain objects (which is a top down step), and refining them, then recombining them into the final program (a bottom up step). Although an understanding of the complete system is very necessary for good design, leading theoretically to a top-down approach, most software projects attempt to make use of existing code to some degree. It does not scale-up because bottom-up approach allows designers to reuse codes. 8.0 REFERENCES 1) Chukwudi Igbe ph.d,( 2002): General note on fundamental data structures and algorithm, Department of Computer Science, Imo State University Owerri. 2) Dr K R Bond ( retrieved march 2013): Structured Programming versus Object-Oriented Programming. 3) Lewis D Griffin,( retrieved June 2013) 10-Top-Down Programming, Department of computer science UCL 4) Top down and bottom up design,( retrieved march 2013) en.wikipedia.org/wiki/topdown+bottomup+design. 5) Definition of top down ;( 10/03/13) http;// 6) Top down design in an object oriented world ;( 10/03/13) en.wikipedia.org/wiki/topdown+bottomup+design.
64 CURRENT APPROACHES IN MEDICAL TECHNOLOGY FOR EFFECTIVE DIAGNOSIS Rebecca Bello Federal University Lokoja, Kogi State, Nigeria Recent science and technology studies have analyse questions of expert and non-expert participating in science technology policy from an empirically grounded perspective, the issue offers a double contribution. It present a summary of the state of the act and an outline of the historical emergence of the participatory question, it distinguish four periods since the late nineteenth century each with a spec.ific relationship between expert and non-expert knowledge ranging from hybrid to politicized to an autonomous to a participatory relationship. In the early beginning of humankind, diseases were viewed with mysteries and were common occurrences that claimed many lives. Medical technology evolved slowly in response to high mortality rates associated with diseases example (malaria, yellow fever etc.) Advance medical technology has become the antidote for illnesses and diseases that formerly resulted in the destruction of entire societies. Advance medical technology now makes doctors and technologist to use mechanical techniques to diagnose patients. Medical technology slowly changed from the use of subjective evidence provided by patients to objective evidence obtained by mechanical and chemical technological devices. Patient s population now became concentrated in urban centres and large numbers of patient create economic incentives for doctors. This modern equipment saves time, energy and resources compared to the antediluvian approach. Therefore, multifarious diagnosis can be conducted with high degree of accuracy within a short period of time. KEY WORDS: Health care, medical intelligence, medical surveillance systems Nigeria, Nigerian health care system, INTRODUCTION Objective, These study aim to review the state of medical technology in Nigeria and to provide recommendation on how to improve the technological system with regards to medical intelligence. To improve the knowledge of technologist, researchers and health personnel s. To imbibe the use of modern equipment in health care delivery, regulatory agencies, research institute and school laboratories. Medical technology can be used to refer to the procedures, equipment, and processes by which medical care is delivered. Examples of changes in technology would include new medical and surgical procedures (e.g. angioplasty joint replacements), drugs (biological agents), and medical devices (CT scanners, implantable defibrillators) and new support systems e.g. electronic medical records and transmission of information. Medical technology is the application of energy forms to diagnose and treat body systems using knowledge, procedures, and devices within the context of both science and technology in society.
65 Medical technology cross disciplinary nature, medical technology applies energy forms to body systems. Energy forms are the physical forms of energy that exist in the universe, that is magnetic energy, thermal energy, electrical energy, chemical energy. Medical technology applies energy forms using devices such as x-ray machines, electrocardiographs, to diagnose and treat various than learning about energy forms and the body systems. Medical technologist must also know about the appropriate procedures and devices for the diagnostic/therapeutic application of the energy forms to the body systems. Therefore, knowledge, procedures and devices simultaneously define the application of medical technology. Consequently, medical technology requires a foundation in both science and technology. In addition to science and technology, the basis for medical technology resides within the context of the social, political and cultural world. THE HISTORY AND IMPACT OF MEDICAL TECHNOLOGY In the early beginning of mankind, disease was viewed with mystery and was a common occurrence that claimed many lives. It was thought that disease was caused by negative interaction between environmental elements and body fluids. Poor health was considered a physical, social or personal deficiency within the patient lived. The four humours as described by Hippocrates ( B.C) and ( A.D) were an attempt to qualitatively measure a deficiency or excess body fluids (blood, phlegm, non-medical terms for sputum, urine) with respect to the changing seasons, Hippocrates and Galen were the first documented western physicians to actively engage in rudimentary science of healing designed to increase the quality of life for their patients. Advance medical technology evolved slowly in response to the high mortality rates associated with diseases. Medical technology has become the antidote for illness and diseases that formerly resulted in the destruction of society. CURRENT APPROACH TO MEDICAL TECHNOLOGY Medical technology is the application of devices, procedures and knowledge for diagnosing and treating of disease for the purpose of maintaining, promoting and restoring wellness while improving quality of life. These are the basis of medical technology. Knowledge-: All technology starts with knowledge and this comes from multiple sources, this knowledge comes from the primary sources, educational institutions, governments and the collective or individual knowledge of those in the medical and science field. Educational institutions-: Medical technology resides in hospital, clinic, universities, public libraries, medical laboratories and the internet. This knowledge consists of information or raw data. Specialized knowledge of medical technology is discipline based and usually resides in educational department of institution of higher learning. Specializations and unique disciplines of cardiology, neurology, homeopathic remedies, paediatrics anaesthesia and veterinary medicine. Government-: A second source of medical technology knowledge comes from governments. There seems to be an increasing concern among democratic society for access to quality health care. The right to medical technology and services is beginning to be viewed as an obligation of the governments to it citizens by taking a serious interest in the application and administration of medical technology. In
66 United States most of the medical technology research using new approve medical devices is been funded by government through universities and medical centres. Some of the common research and regulatory agencies include centres for disease control and prevention (CDC), National Institutes of Health (NIH), the Food and Drugs Administration and the office of health technology. These governmental agencies set agendas for research funding, investigate outbreak of infectious disease, monitor and approve new drugs and devices and evaluate medical technology. Individual and collective knowledge-: The third source of medical technology knowledge is the individual and collective knowledge that reside within the mind of people and organizations that practice medicine and health care such as researchers, physicians, radiologist, laboratory workers, clinical insurance agencies, government and schools. Common knowledge about medical technology is both known and available, is characterize by it accessibility, availability and general understanding among the local population or society. METHODS AND PROCEDURE Databases were searched for relevant literatures using the following keywords: Nigerian health care, Nigerian health care system, and Nigerian primary health care system. Additional keywords used in the search were as follows: United States (or Europe) health care dynamics, Medical Intelligence, Medical Intelligence systems, Public health surveillance systems, Nigerian medical intelligence, Nigerian surveillance systems, and Nigerian health information system. Literatures were searched in scientific databases PubMed and African Journals on line. Internet searches were based on Google and Search Nigeria. EQUIPMENTS USE FOR THE EFFECTIVE MEDICAL LABORATORY DIAGNOSIS Microscope, Stethoscope, Sphygmomanometer, Thermometer, Spectrophotometer, Autoclave, Centrifuge, Incubator, Distiller, Electrophoresis machine, Automatic tissue processor, Microtome machine, Medical X-ray machines, Water bath, Anaesthesia machine, Single Photon Emission Computing Tomography (SPECT) Scanning machine etc. FUNCTIONS AND PROCEDURE OF OPERATION OF SOME SELECTED EQUIPMENTS Microscope is an instrument use for magnifying object that cannot be seen with the naked eyes, without microscope technologist, scientist, and clinical researchers will be lost. The microscope is an important part of a biology laboratory that help one observe specimen, microscope help magnify object 1000x their size. Microscope was invented by Antonio Phillip Van Leeuwenhoek ( ). A Dutch trade man and scientist should be credited for the invention of this magical instrument, his crude microscope helped detect animalcules that is single cell organism, these led to research on bacteria, virus, fungi, protozoa as well as discovery of DNA. This proves that microscope are the most useful tools in the technology world, it is also useful in chemistry, metallurgy, and many other scientific field. There are different types of microscope ranging from simple monocular to compound binocular, there is also electron microscope, metallurgical microscope, fluorescence microscope etc. Different kinds of microscope and their uses
67 Light microscope is also called the optical microscope. This is also a type of compound microscope that is used to view microorganisms. The microscope uses visible light and a system of lenses to magnify images of the manifold, light microscope can be simple which has single convex lens that is commonly observed in the loupe. It can also be compound microscope use in school, college laboratory to observe plant and animal cell, bacteria, algae it uses two optical lenses called the ocular lens and the objective lens, these microscope are heavier and larger than the simple microscope. A separated set of lenses is use to focus the light into the eye to form image. Metallurgical microscope is a microscope used to observed metal, plastic, ceramic as well as other material samples. Electron Microscope is one of the most advanced microscope used today, the microscope is powered by a beam of electrons with very short wavelengths. These electron strike objects that come in its path and helps increase the resolution of the microscope. The electron microscope is use in the study cells like viral cell as well as larger molecules. Autoclave is an instrument use for sterilization of materials use in the laboratory, surgical materials and biological waste, etc. The sterilization of instrument, food, glass vessels, medical liquid, culture medium etc. by saturated steam under pressure has been widely adopted by advance technology. Laboratory centrifuge is an instrument driven by a motor which spin liquid samples at high speed, by exerting a force greater than that of gravity. Which sediments particles (cells, bacteria, casts, parasites). The greater the outward pull due to rotation that is centrifugal force the more rapid and effective is the sedimentation, heavy particles sediment first followed by lighter particles. There is general purpose bench centrifuge which is design for clinical samples and sedimentation of cells, bacteria, parasites for microscopic examination e.g. blood, urine, cerebrospinal fluid, and micro haematocrit centrifuge use to diagnose and monitor anaemia. Although most modern centrifuge are fitted with an imbalance detector and lid interlock. Stethoscope is an acoustic medical device for auscultation, or listening to the internal sound of an animal or human such as those in the heart and lungs. A simple stethoscope usually consists of a diaphragm or an open bell shaped structure which is applied to the body connected by rubber or plastic tubes to earpieces for the examiner. Sphygmomanometer is an instrument for measuring blood pressure in the arteries. It consists of an inflatable cuff connected via a rubber tube to a column of mercury with a graduated scale. The cuff is applied to a limb usually the arm and inflated to exert pressure on a large artery until the blood flow stops. The pressure is then slowly released and with the aid of a stethoscope to listen to the pulse, it possible to feel the systolic and diastolic pressures which can be read on the scale. RESULT AND CONCLUSION Medical intelligence and surveillance represent a very useful component in the health care system and control diseases outbreak, bio attack, etc. There is increasing role of automated-based medical intelligence and surveillance systems, in addition to the traditional manual pattern of document retrieval in advanced medical setting such as those in western and European countries.
68 Medical technology represent a very useful component in the health care system and even the educational system in the world, the provision of health care and quality education remain the functions of the government both federal, state and local level. The advancement of these equipment shows that technology is of utmost important in Nigeria and the world, there is increase in automated based medical equipment in the technology world in addition to manual in advance setting in the western and European countries. In conclusion Nigeria should develop more by upgrading its facilities and training of medical personnel, technologist, and researchers, on the use of advance method of diagnosis and treatment for effective work. Educational sectors need to improve it teaching aids in the institutions. There should be adequate management with strong leadership principle. REFERENCES David M. Cutter and McClellan (Sep-Oct 2001) is technological change in medicine worth it? FDA Guidance concerning demonstration of comparability of human biological products. (Review 2013) George B. Moseley, (2005) changing conditions for medical technology in health care industry. Henry J. Kaiser (2007) how changes in medical technology affect health care costs Health Reform Foundation of Nigeria (HERFON) [Last accessed on 2010 Nov 23]. Available from: Maternal Mortality in Nigeria. [Last accessed on 2010 Dec 16]. Available from: Nigeria National Health Conference 2009 Communique. Abuja, Nigeria. [Last accessed on 2010 Nov 5]. Available from: Nnamuchi O. The right to health in Nigeria. Right to health in the Middle East project, Law School, University of Aberdeen. Draft Report December [Last accessed on 2010 June 21]. Available from: Onwujekwe O, Onoka C, Uguru N, Nnenna T, Uzochukwu B, Eze S, et al. Preferences for benefit packages for community-based health insurance: An exploratory study in Nigeria. [Last accessed on 2010 June 21];BMC Health Services Research :162. Available from: [PMC free article] [PubMed]
69 COMMUNICATION AND CONNECTIVITY AS VERITABLE TOOLS FOR INFORMATION SHARING IN NIGERIA Mamudu, Friday and Mustapha Ismail Department of Mathematics, Gombe State University, P.M.B 127 Tudun Wada, Gombe-Nigeria. Abstract This paper discusses the contributions of communication technologies to modern civilization and globalization and the role of connectivity as facilitator to efficient global information sharing today. The background study of networks, satellites, statement of the problem and the objectives of the paper were looked into. A brief historical development of Nigeria communications and their beneficial applications today were presented. Presentation was made on why internet communications in Nigeria is dominated by wireless/satellite link. It was adduced that the absence of information technology infrastructure, particularly the complete absence of fiber optics backbone and weak telecommunication base were responsible for the predominant wireless internet application in Nigeria. The paper concludes that a good information technology infrastructure base such as the construction of domestic optics backbone as ongoing by some of the GSM operators such as GlobaCom and MTN, launching of domestic communication satellite such as Nigcomsat1R in December, 2012; and the interlinking of our communication will enhance information sharing and as well reduce the cost of internet applications and motivate a larger population to participate in our new information society. Keywords: Communication, Connectivity, Wireless/Satellite, Infrastructure and Interlinking. INTRODUCTION Internet and satellite communication networks deal with the science and technology of interconnectivity of networks and the role of satellite as packet channel agent in a complex web of global networks. Networks are all about interconnection of independent nodes to exchange or share information. THE INTERNET Information Technology (IT) is the convergence of micro-electronics telecommunications and computer technology. This explains UNESCO S definition, which states that IT is the scientific, technological and engineering disciplines and the management technologies used in information handling and process, their application, computers and their interaction with man, machines and associated socio-economic and cultural matters. The computer networks have become so developed that they span the entire globes. The convergence of computer technology and telecommunications has necessitated the need to research for international open standards that could make possible for dissimilar networks and topologies to link and share information without hiccups. An article concludes that ( the internet) has become a mass medium used most by relatively passive consumers, and as such major content providers ( Margolis and Resnick, 1999). The book (Winston, 1998) also presents the internet as the next step in the evolution of mass media.

70 THE SATELLITE According to Osuagwu (2002), a satellite can be defined as a powerful radio transmitter with transponders positioned aerodynamically in the orbit at 36,000ft above sea level. They amplify, sort or route signals. Unlike wireless ground repeaters which relay signals between two fixed locations; satellite interconnect many locations, both fixed and mobile over a wide area. It receives microwave signals from equipment on the earth in a given frequency band (uplink) and re-transmits them at a different frequency to earth stations (downlink). Nigcomsat1R A satellite is anything that orbits something else just as the moon orbits the earth. However, a satellite is a specialized wireless transmitter/receiver that is launched by a rocket and placed in orbit around the earth. Satellite can be used either for security, weather forecasting, identifying mineral deposits, television broadcast, amateur radio communications, internet communications, global positioning system (GPS), Motor vehicle tracking system, e.t.c. There are three major categories of satellite systems namely: (i) A geostationary satellite which orbits the Earth directly over the equator, approximately 22,000 miles up. It then takes 24 hours to make one complete revolution around the earth. Hence, it remains at the same spot on the earth s surface at all times, and stays in the sky from any point on the surface from which it can be seen. E.g. weather satellites are in this category. Images can be viewed from these satellites on the internet via the Purdue weather processor. One of these satellites can view approximately 40% of the earth s surface and such three of it can view the whole world. (ii) A low-earth orbit (LEO) satellite system employs a large fleet of birds, each in a circular orbit at a constant altitude of a few hundred miles. Each revolution takes approximately 90 minutes to a few hours. The fleet is arranged in such a way that, from any point on the surface at any time, at least one satellite is on a line of sight. In this type of satellite, the transponders are moving rather than being fixed, and are in space rather than on the earth. The good thing about this satellite is that it makes it possible for anyone to access the internet via wireless from any point on the planet using an antenna. (iii) Elliptical orbit satellite system revolve around the earth in elliptical orbits. These satellites move rapidly when they are in their lowest altitude and slowly when they are in their highest altitude. Such satellites are used by amateur radio operators, and by some commercial and government services. They require directional antennas whose orientation must be constantly adjusted to follow the satellite s path across the sky. (Prince, 2011).
 sent were not delivered but the sender is being charged.")
71 Earth Station STATEMENT OF THE PROBLEM The present communication network in Nigeria is poised with a lot of problem such as network failure whereby a caller and the receiver cannot hear each other at times while the caller s credit is being deducted. Even the short messages (SMS) sent were not delivered but the sender is being charged. These immense problems had led the researchers to find the best means of sharing vital information in Nigeria communication system so that the network user will not be disappointed and lose confident in the ability of the service provider whenever they make call. OBJECTIVES (i) To ascertain how wireless internet, satellite and fiber optics are tools for information sharing; (ii) To determine the effect and the best tool for information sharing; (iii)to make projections for the future role of internet, satellite and fiber optics. BRIEF HISTORICAL DEVELOPMENT OF COMMUNICATION IN NIGERIA Telecommunications facilities in Nigeria were first established by the colonial administration. At independence in 1960, with a population of about 40 million people, Nigeria had only about 18,724 telephone lines for use which translated to teledensity of about 0.5% telephone lines per 1000 people. The telephone network consisted of 121 exchanges of which 116 were the manual (magneto) type and only 5 were automatic type. Between 1960 and 1985, the telecommunication sector consisting of the department of posts and telecommunications (P & T) limited in charge of internal network and, the Nigerian external telecommunications (NET) limited, responsible for the external telecommunications services provided the gateway to the outside world. The install switching capacity at the end of 1985 was about 200,000 lines as against the planned target of about 460,000 lines. All the exchanges were analogue. Telephone penetration remained poor as one telephone line to 100 inhabitants was recommended by international telephone union (ITU) for developing countries. The equality of service was largely unsatisfactory, unreliable, congested, expensive and customer unfriendly. Arising from the foregoing, in January 1985, the erstwhile posts and telecommunications department was split into postal and telecommunications limited (NITEL), a limited liability company. The main
72 objective of establishing NITEL was to harmonize the planning and co-ordination of the internal and external telecommunications development, and provide accessible, efficient and affordable services. Forty six years ago after independence, the Nigeria telecommunication PLC (NITEL); had roughly half a million lines available to over 120 million Nigerians. NITEL, the then only national carrier, had a monopoly on the sector, and was synonymous with epileptic and unreliable services and poor management. On assumption of office on the 29 th of May, 1999; former president Olusegun Obasanjo s administration swung to gear to make a reality, the complete deregulation of the telecommunications sectors, most especially, the much touted granting of licenses to GSM service providers and setting in motion the privatization of NITEL. Also, this administration immediately replaced the management of Nigerian Communication Commission (NCC) with a new breed of professionals in the telecommunication industry. The commission duly organized and successfully executed the first ever digital mobile license auction for the provision of GSM services in Nigeria namely, MTN, M-Tel (which went out of business) and ECONet (now Airtel). Out of the seven companies that applied for the digital mobile license, only three mentioned above were qualify upon the payment of two hundred and eighty five (285) million Naira capitalization fee each. This proactive approach by federal government of Nigeria to the telecom sector has made it possible for over 2.5 million Nigerians clutch to GSM cell phones and handsets today. Similarly, the advent of GSM in Nigeria has created the habit of time management and consciousness. This phenomenon can be seen from the curtailment of telephone conversations, while at the same time eliminate long journey for pleasure and businesses. Also, Nigerians are now able to operate their savings, current, mobile money transfer, recharging of GSM, DSTV, searching for old friends whom they have lost contact for years via cell phones or handsets. (Agbasi et al, 2007). METHOD Discussion will be used in this paper throughout which is employed in the analysis of both present and future communications system in Nigeria. FIBER OPTICS According to Maaki (2004), the idea of fiber optic cable is a fairly new but old technology that was borne in some years back which is designed to be used in data transmission and networking nodes. It is a new technology whereby the cable is made to transmit data that is converted to light pulses. Fiber optics are either made of glass or plastic and conducts light just as copper wire conducts electrons. They are very small in diameters and measure about 6-200µm (microns). A micron is about 10-6 m. The glass or plastic is made of a fiber, often included with a metallic covering to protect it from environmental hazards when buried underground. This fiber optics technology is realistic because of the use of lasers. This cable transmits data for a long distance without loss of information or what is known as attenuation. Though very expensive but can carry a huge amount of data over long distance and it is said to have a very high bandwidth. It was found to be very useful when a laser light, which was directed into the fiber, remained into it until it emerged at the other end with the same intensity. That showed that there was no loss of light as it travelled along the length of the fiber. When it is used in data transmission between nodes, a converter

73 is attached to one node, which converts the electrical signals that are emerging from the node into light signals to travel along the fiber until a converter at the other node converts it back into the electrical signals as it enters the node at the other end. The fiber has advantages over other transmission media because of its weight, size, efficiency, huge bandwidth and physical tempering. According to John (2011), a fiber optic cable use light pulses to transmit information down lines instead of using electronic pulses to transmit information down copper lines. Light pulses move easily down the fiber optic line because of the principle of total internal reflection. In this principle, when the angle of incidence exceeds a critical value, light cannot get out of the glass; instead the light bounces back in. This principle was applied to the construction of fiber optic strand, which made it possible to transmit information down fiber lines in the form of light pulses. OPTICAL FIBERS IN COMMUNICATION Nelkon and Parker (1995), in their book title Advanced level Physics. Light signals can travel along very fine long glass fibers roughly the same diameter as the human hair. Optical fibers have replaced the copper cables previously used in telecommunications. The fiber is a very fine glass rod of diameter about 125µm (125x10-6 m) with a central glass core surrounded by a glass coating or cladding of smaller refractive index than the core. The fibers are classified into two main types namely: (i) Monomode This fiber has a very narrow core of diameter approximately 5µm (5x10⁻⁶ m) or less and as such the coating (cladding) is relatively big. Cladding Core 5µm 125µm Monomode (ii) Multimode This type of fiber has a core of relatively large diameter that is approximately 50µm. In one form of multimode fiber, the core has a constant refractive index ɲ 1 such as 1.52 from its center to the boundary with the coating (cladding). The refractive index then changes to a lower value ɲ 2 such as 1.48 which remains constant throughout the cladding. This is called a step index multimode fiber since the refractive index steps from 1.52 to 1.48 at the boundary with the cladding.


74 To transmit light signals more efficiently, a multimode fiber is made whose refractive index decreases smoothly from the middle to the outer surface of the fiber. There is no noticeable between the core and cladding. This is called a Graded-Index multimode fiber. 2 Cladding 1 Core 50µm 125µm Step-index multimode Decreasing Graded-index multimode OPTICAL PATHS IN FIBERS Let s see what happens when a light signal enters one end of an optical fiber. The figure below shows a step-index fiber. With a large angle of incidence, a ray OA entering one end at O is refracted into the core along OP and then refracted along PQ in the cladding at Q. In this case, only a very small amount of light, due to reflection, passes along the fiber.
75 c c Light path by total internal reflection-multiple reflections. With a small angle of incidence, however, a ray such as BO is refracted in the core along OD and meets the boundary between the core and cladding at their critical angle, C. In this case, since ɲsini is constant ɲ 1 sinc = ɲ 2 sin90 = ɲ 2 Where ɲ 1 is the core refractive index and ɲ 2 the slightly smaller cladding refractive index. Since, ɲ 1 =1.52 and ɲ 2 =1.48, Hence, SinC= ɲ 2 / ɲ 1 =1.48/1.52=0.974 C 77 o The ray OD is now totally reflected at D along DE, where it again meets the core-cladding boundary at the critical angle. At E, therefore, it is totally reflected along EF. In this way, by total internal reflection, a ray of light entering one end of a fiber can travel along the fiber by multiple reflections with a fairly high light intensity. At the other end of the fiber, the ray emerges in a direction X (odd number of multiple reflections) or a direction Y (even number of multiple reflections). DISCUSSION So far we have seen that optical fiber has thin glass core coated by glass of smaller refractive index which make total internal reflections occurring repeatedly at the interface of the glasses all along the fiber. Telecommunication industries took advantages of the fact that light in glass travels faster than electrical signals in copper cable, more messages per cable length can be sent and clearer sound can be heard to employ and deploy optical fiber to boost their business activities.
76 OPTICAL FIBER VIEWING SYSTEMS Even though optical fibers have found their main application in high-speed communications, they are also used to make remote viewing systems for medical and other purposes where access to the scene is restricted. The idea is that very large numbers of tiny fibers are packed together to form a flexible bundle: one end is placed in contact with the scene, the other end forms a remote image of the scene which may be around a corner or on the other side of the small aperture. Each individual fiber transmits light along its length from the scene to the viewer. Individual fiber is incapable of forming an image: they merely collect light from a small area of the scene and transmit it to the viewer. However, since each fiber sees a slightly different part of the scene, they collectively transmit an image from the scene to the viewer. It is important to ensure that the fibers do not change their relative positions over the length of the bundle; otherwise the image will be scrambled at the viewer s end and will be totally unintelligible. Small bundles of fibers need not be much larger than a hypodermic needle, and can easily be inserted without pain into a patient. Part of the bundle carries illumination from the outside, while the other part transmits the image. Using such techniques, keyhole surgery can be performed, without the need for any major incisions. FOCUS ON THE FINDING The finding focus is on the deployment of fiber optic infrastructure as the most effective and efficient reliable tool for communication among the various nodes on the internet. CONCLUSION The internet has been described as the greatest invention of man after the industrial revolution. This revolutionary marvel has been made possible by satellite and microwave communications. As M bowformer UNESCO scribe rightly pointed out over a decade ago, information technology has opened up such tremendous vistas for modern societies that any failure to master it would mean a life of permanent insubordination. The technology among others have an ability to make use of other techniques to give or to refuse access to a whole range of scientific data and knowledge and thus to design new models of development. Joining our new international information society in Nigeria is plagued with several bottlenecks such as the absence of information technology infrastructures like optical fiber backbone, weak telecommunications backbone, and epileptic power supply. RECOMMENDATIONS (i) Nigeria has to urgently overhaul the existing copper cable and wireless networks and replace them with well-structured underground cabling manhole ducts to take care of fiber systems and future expansions. (ii) Developed National information super highway infrastructure base on a nationwide fiber backbone linked to Africa on fiber network for fast and easy link to the rest of the world. (iii) Encourage foreign investors to establish an industry that will manufacture optic fiber cable locally in order to reduce the cost of purchasing, transportation and installation which in turn reduce the cost of service provision that will negatively affects the end users.
77 It is pertinent at this junction to point out that Monomode optic fiber infrastructure is the best communication tool that should urgently be employed and deployed in Nigeria in order to boost and overcome the problems of network connectivity experienced over the years. Even though it is more expensive than multimode optic fiber, it gives a higher transmission rate of up to fifty-times more than multimode. This is because the small core and single light-wave virtually eliminate any distortion that could result from overlapping light pulses, thereby providing the least signal attenuation which is the highest transmission speed of any fiber cable type. Though, multimode fiber gives a high bandwidth at high speed (GB) over medium distances than monomode; but by virtue of the fact that light waves (laser) are dispersed into numerous paths as they travel through the cable s core makes it typically to cause signal distortion at the receiving end, thereby resulting in an unclear and incomplete data transmission as is the case with wireless services we have today in Nigeria. Hence, new monomode optic fiber cable should be designed to use Gigabyte and beyond. REFERENCES Agbasi, K.C; Nnebbe, S.E; Onyejegbu, L.N; and Momodu, J.B. (2007), GSM operation in Nigeria. Conference proceedings of Nigeria computer society, vol pp. John Machesney (2011), Fiber Optics Retrieved 15 th December, 2011 from http// Maaki, P.T. (2004), Introduction to computers and basic programming. First published by oracle business Ltd printing press, Makurdi 35-36pp. ISBN Margolis, M and Resnick, D. (1999), Third voice: vox populi vox Dei? First Monday, vol. 4. No. 10 (October), at http// Nelkon, M and Parker, P. (1995), Advanced level physics seventh editon. Published by CBS publishers and distributors. 11, daryaganj, New delhi (india) pp. Osuagwu, O.E. (2002), Internet and satellite communication networks being leture delivered at national workshop on communications organized by erosion telecommunications Ltd for the Rivers state government held from th September, 2002 at the civic centre hall of River state government, PortHarcourt. Prince Osuagwu (2011), How NigComsat-1R will impact Nigerian economy Retrieved 27 th December, 2011 from http// will impact-nigerian economy. Winston, B. (1998), Media technology and society: A history from the telegraph to the internet. New York Routledge.
78 THE POOR STATE OF BROADBAND IN NIGERIA: AN IMPEDIMENT TO NATIONAL DEVELOPMENT AND GLOBALISATION Ariyo Ayodeji Olusola Olaojoyetan Modupe Christianah Department of Computer Engineering, Abraham Adesanya Polytechnic, PMB 1020, Ijebu-Igbo, Ogun State. Nigeria Abstract Harnessing ICT for development requires a strategic framework that takes advantage of various ICT roles which helps integrate the options made possible by technological revolution into the design and implementation of sector development strategies. As such, ICT is not just a sector of the knowledge economy, but a lens through which new possibilities and modalities of comprehensive development can be realised. There has been a competition among many nations nowadays toward the adoption of ICT as a veritable tool for national development and globalization. In spite of the rush towards the adoption of ICT by many African countries, the reports of WEF on NRI released for year 2013 reveals that many African countries are still ranked low. The review made in this paper is to investigate the causes of low rankings characterizing the African countries, Nigeria as a case study. This paper also investigated the present level of broadband ICT infrastructures available in the country and made suggestions on how the rate of broadband penetration could be increased. As a result, People from all walks of life such as youths, professionals, career personnel and host of others would benefit from the wealth embedded in ICT world. In conclusion, the recommendation was made on what to be done for Nigeria to move up some steps in NRI ladder. There are tendencies that when the country fully harness the benefits of ICT available within her that would develop the country economically and tackle the challenges of unemployment which seems to be one of the prevailing problems in Africa and even in some developed countries.sarcastically in Nigeria, in spite of the satellite own by the country and several cables at the shore of the country, broadband penetration is presently less than 6% Key words: WEF (World Economic Forum), NRI (Networked Readiness Index ) GDP (Gross Domestic Product), Broadband, ICT Infrastructure, Optical Cables I. INTRODUCTION Access to advanced information and communication technology (ICT) is a key factor in the economic and social development of Sub-Saharan Africa. Analysis of economic data at the national level shows that investment in ICT results in a higher rate of long-term economic growth [1]. At the level of small businesses, research shows that access to basic ICT services can result in a sustained increase in the incomes of the poor in developing countries [2]. Although limited data make the impact of broadband harder to quantify, emerging evidence suggests that access to more advanced ICT services, such as those that require broadband connectivity for delivery, can also have a positive economic and social impact [3]. However, In spite of Nigeria s growing appetite for data to provide for high speed Internet, e- commerce, e-learning, e-health, e-business register, e-law, e-policing, e-prescription, e- governance, data ICT, and cloud computing, video and voice services, the level of ICT uptake and broadband penetration in the country is still very low. Validation of this assessment is borne out by our low position on the World Economic Forum (WEF) Networked Readiness Forum for 2013 [4].
79 In other to reverse the trend, urgent steps must be taken to investigate the reasons for the low rate of ICT uptake and mete out appropriate strategies and tactics to address the situation. The country needs to move up in the ladder of (Networked Readiness Index) NRI especially nowadays that ICT has become the pivot that holds growth and development A. The Global Information Technology Report 2013 The Global Information Technology Report 2013 features the results of the NRI and offer an overview of the state of ICT readiness in the world for the year The report coverage includes a record number of 144 economies, accounting for over 98 percent of global GDP. [5] Table 2.1: Leading 20 Countries In GITR And NRI Ranking RANK COUNTRY/ECONOMY SCORE 1 Finland Singapore Sweden Netherlands Norway Switzerland United Kingdom Denmark United States Taiwan/China Korea Republic Canada Germany Hong Kong SAR Israel Luxembourg Iceland Australia Austria New Zealand 5.25 Table 2.2: Leading African Countries on GITR: WEF NRI Ranking RANK COUNTRY/ECONOMY SCORE 70 South Africa Egypt Cape Verde Rwanda Morocco Kenya Ghana Botswana Liberia Gambia Uganda Namibia Nigeria 3.27
80 B. Interpreting the Global Information Technology Report 2013 The Global Information Technology Report 2013 is a project within the framework of the World Economic Forum s Global Competitiveness and Benchmarking Network and the Industry Partnership Programme for Information and Communication Technologies. However, Networked Readiness Index (NRI) 2013 Benchmark ICT Uptake and Support for Growth and Jobs in a Hyperconnected World for the year The NRI includes features related to access and usage that cover not only affordable ICT infrastructure but also digital resources, including software and skills. In addition, the NRI includes proxies to assessing some of the economic and social impacts accruing from ICTs. Thus, the Index facilitates the identification of areas where policy intervention through investment, smart regulation, and/or incentives could boost the impact of ICTs on development and growth. The country ranked 113 out of 144 countries surveyed in the Networked Readiness Index (NRI), declining by one rank on the ladder from its position of 112 (out of 142) in the previous year s Report. However, the country inched up by 0.1 points in actual NRI scores to 3.3 points this year from 3.2 points in 2012, when measured on a scale of one (lowest) to seven (highest). According to the latest World Economic Forum (WEF) report on Global Information Technology Report (GITR) 2013 and published with the theme Growth and jobs in a hyper connected world, it measured the extent to which 144 countries took advantage of ICT and other new technologies to increase their growth and well-being. Highlight of the report about Nigeria s ICT competitiveness showed that the country has remained in the lowest quartile of countries sampled in the report. This shows the extent to which the country still grapples with the necessary conditions to close the ICT competitiveness gap with most advanced economies. Notwithstanding this gap, the report noted that the country has improved in seeking the delivery of societal benefits from ICT by initiating a broad-based National Broadband and ICT Plan, which focuses on greater broadband adoption through intensifying the motivators of technology use. This is attributed to ICT Skill Development Plan incorporated in Nigeria s National Information Communication Technology (ICT) Policy Draft This development has led to Nigeria s significant improvement in one of the 10 NRI pillars - Social Impacts - ranking 88 in 2013 from 102 in 2012, the WEF report noted. The report also acknowledged that Nigeria s market and regulatory framework has been able to support high levels of ICT uptake, adding, however, that the cost of accessing ICT, either via mobile telephony or fixed broadband internet, has remained a constraint towards widespread technology adoption in the country. The GITR 2013 underscored Nigeria s clear divide in ICT usage between individuals and businesses. While corporate organisations in the country have intensified their efforts to integrate ICT into business processes - improving in that regard to a rank of 68 from 77; the penetration of ICT among individuals has deteriorated to a rank of 111 from 105 in the last one year. C. WHY NIGERIA IS RANKED LOW IN YEAR 2013 GLOBAL INFORMATION TECHNOLOGY REPORT (GITR) WEF AND NRI REPORT The apparent success recorded in the country s ICT sector is as a result of the great success made by the telecommunication industry. The situation in the data communication is highly
81 incomparable. The rates of Internet usage and broadband penetration are both still very low. Though investigation shows that Nigeria is in number 10 position when considering the countries alongside their respective number of internet users but the number is a low percentage of the population of the country. Table showing the Top 10 countries with Internet users Rank Country With tele-density in the country growing from below 2 per cent in 2001 to about 65 per cent within 10 years, the broadband segment is yet to catch-up. Recent statistics show that there are over 47.1 million internet users in Nigeria, which on the surface appears to be a large number but that figure represents only 29 per cent of the population. In reality, we estimate that actual broadband penetration in Nigeria is in the 10 per cent range, (which) places us in several published studies behind South Africa, Kenya and Ghana in sub Saharan Africa. Evidently, the issue of low ranking in the uptake of ICT lies majorly with poor broadband (data) communication in spite of the potential that lies in the broadband infrastructures at the shore of the country which could make us ranked among the best in the sub-sahara region. II. WHAT ARE THE ICT INFRASTRUCTURE NEEDED FOR BROADBAND COMMUNICATIONS A. Various Elements of Broadband Connectivity Population of Active Internet users 1. China 511,963, USA 242,614, India 119,749, Japan 101,376, Brazil 88,917, Russia 69,837, Germany 67,621, France 51,962, United Kingdom 51,412, Nigeria 47,143,356 Broadband is the common term for a very fast connection to the Internet. It allows users to download online entertainment such as video clips and music, listen to digital radio and television, send faster and speeds up everything they do online. A broadband service can transmit information at up to 40 times the speed of a dial-up modem connection. As the connection is always on, like water or electricity, users don't need to dial up every time they want to log on. [9] The provision of broadband connectivity to end users involves several elements. A problem in any of these elements will constrain the delivery of affordable broadband services. In Nigeria, the inadequacy of one element, domestic backbone networks, is one of the factors underlying the limited growth of broadband in Nigeria.

82 Retail Services The Soft input acquired such as sales, customer care and billing Table1: Broadband Communication Supply Chain Supplying communications services involves a combination of network elements, processing, and business services. These can be thought of as the supply chain. At the top of the chain is the international connectivity that provides the link to the rest of the world. The second level is the domestic and regional backbone networks that carry traffic from the landing point of the international communications infrastructure to other points within the country (in some African countries, regional connectivity is missing). The third level is the intelligence contained in the networks. Below this is the access network that links the core network to the customer. Finally, there is a suite of retail services such as customer acquisition, billing, and customer care that allow the business to function. This supply chain is illustrated in Table 1 In practice, there are many variations on the structure of this supply chain. For example, voice services do not rely as heavily on international connectivity as Internet services, and landlocked countries require regional connectivity if they are to access high bandwidth submarine fiberoptic cable networks.
83 Domestic backbone networks lie at the heart of any communications services supply chain and are an integral component in the provision of broadband connectivity. One of the first decisions to be made is what kind of connection you want. There are several options for setting up high-speed services, which all come under the broadband umbrella. However, the type of broadband service you need and have access to will be determined by the speed requirements, budget, and the location (city or regional) of your home or office. B. Comparative advantage of fiber optic networks over satellite in building broadband backbones The two commonly used media of connectivity of a country to the rest of the world and domestic backbone include satellite and fiber optic networks. However, in spite of the popularity of satellite in building national backbone, there are still some shortcomings associated with satellite when the issue involves building a national or international communication backbones. One of the most likely reactions one gets when discussing fiber-optic networks in Nigeria is why not satellite technology? Satellite communications has been around for a while and has provided telecommunications links between Nigeria and the rest of the world. However, a comparison between fiber optic and satellite technologies reveals that although satellite systems are the most efficient solutions for TV broadcast, for access to remote locations, and essentially, for wireless access to the local loop and the network backbone, fiber optic networks are more suited for high bandwidth transmission between countries and continents though core networks (or backbones) and submarine links respectively. Fiber optic networks offer very high bandwidth necessary for a country (Nigeria) or African nations to catch up with the new global information technology. For example, fiber cables today can have capacity up to 2 Tbps - an equivalent of millions of simultaneous voice channels per cable. This is far from the reach of any anticipated satellite system, which is less than 1Gbps - lower than our own SAT-3/WASC/SAFE undersea cable system. Real time transmission and very low bit error rate offered by fiber optic networks are among the advantages of fiber over satellite. Satellite communications add a delay to communications making interactive data transmission difficult and subject the quality of transmission to external factors. A geostationary satellite link has a transmission delay of up to 600 milliseconds compared to 100ms for a combination of fiber and coaxial cable networks. The open space nature of satellite (and any other wireless) communications makes satellite communication vulnerable to interception and corruption. Although several schemes are available for data encryption for IP over satellite, the high bit error rate may cause failures in the encryption systems. Fiber optic transmission offers undoubtedly the best confidentiality and security of transmission than any other means by its mere nature. In order to address increasing traffic demand, it is relatively easy to increase the capacity of fiber optic networks during their lifetime by means of wavelength division multiplexing technology. For example, the SAT-3/WASC/SAFE system can be upgraded 12 fold from 10Gbps to 120Gbps. It is impossible to do a similar upgrade on satellite systems. Perhaps the main disadvantage of satellite communication is their high cost relative to fiber optics communication. In the US, for example, the monthly rate for broadband connectivity through cable is about $35 for 3Mbps data rate compared to $200 for 200Kbps by Satellite. While the initial cost of a continental fiber optic network for Africa may appear too high, the long term cost savings over satellite transmission are overwhelming.
84 Thus due to their high bandwidth, high reliability, high signal quality, long lifetime, better security and low service cost, fiber optic networks are suited for inter and intra continental backbone network infrastructure. On the other hand, satellite systems are more dedicated to video broadcasting and personal communication services such as mobile telephony satellite or to access remote areas. III. PRESENT STATE OF BROADBAND INFRASTRUCTURE IN NIGERIA According to experts, any country seeking growth, job and wealth creation must address how it can increase its access to broadband and if governments can improve broadband penetration in the continent most Africans would have increased access to the internet. Today, people are realising their life goals due to broadband services with greater access to researches and findings about education, culture and entertainment. The major Broadband backbone infrastructure in Nigeria includes NigcomSat-1R, WACS, Main-one and Glo 1 fiber optic Cables. SAT-3/WASC (South Africa Trans-Atlantic - West Africa Submarine Cable) which continues from South Africa to Portugal and Spain in Europe with landings at a number of west and southern African countries; Nitel s cable, international submarine fibre-optic cable (Glo-1), A. BROADBAND INFRASTRUCTURE FOR BUILDING COMMUNICATION BACKBONES THAT CONNECT NIGERIA TO THE REST OF THE WORLD NIGCOMSAT-1R NigComSat-1R is a hybrid geostationary satellite located at an orbital position of E with a life span of at least 15 years, a total of 40 transponders which will provide optimal and cost effective voice, data, video, internet and application services solutions. NigComSat-1R is a replacement satellite for NigComSat-1 Satellite. It is a critical ICT backbone infrastructure to drive the National ICT revolution in providing revenue diversification for the Nation and offering cost effective solution and affordable access to meet Nigeria s telecommunications, broadcast, aviation, maritime, defense and security needs. SAT-3/WASC (South Africa Trans-Atlantic - West Africa Submarine Cable) SAT-3/WASC (South Africa Trans-Atlantic - West Africa Submarine Cable) which continues from South Africa to Portugal and Spain in Europe with landings at a number of west and southern African countries. The funding agreement for the project was signed in 1999 and President Wade, one of the founding members of NEPAD, officially launched the networks in Dakar in May The original capacity was 20 Gbps and is upgradeable to 120Gbps. The submarine cables span a total of 28,000 km and connect the countries of Portugal, Spain (Canary Islands), Senegal, Ghana, Benin, Cote D Ivoire, Nigeria, Cameroon, Gabon, Angola, South Africa, France (Reunion), Mauritius, India and Malaysia. Mainone and GLO-1 and WACS (own by MTN) Submarine cables These submarine cables landed in Nigeria to produce additional capability to the earlier existing ones. With the advent of these cables there is a huge broadband capacity for Nigerians to benefit from. B. BROADBAND INFRASTRUCTURE FOR BUILDING DOMESTIC BACKBONES In Nigeria, the inadequacy of one element, domestic backbone networks, is one of the factors underlying the limited growth of broadband in Nigeria.
85 Fibre-Optic backbone infrastructure in the Nigeria states and the federal capital territory are not interconnected and are concentrated in the state capitals and a few urban areas. It is recorded that Broadband penetration is low and of about 6% (Omobola Johnson- the Minister of Communication,) while that of Internet penetration is equally low and of about 28%and 33%. Few states such as Ondo State are having special schemes inaugurated mainly to supervise the connectivity of broadband infrastructure to the interior towns apart from the state capital having interconnection of broadband infrastructure with other parts of the state. The situation is different in most states of the country. There is no long distance national backbone to carry and distribute the capacities provided by submarine cables to the users in offices, schools, and homes in the hinterland. IV. SUCCESSES AND CHALLENGES FACING BROADBAND COMMUNICATION IN NIGERIA A. Successes of made in the area of Broadband communication Development in Nigeria In spite of low penetration in the broadband communications in the country, Nigeria still records some success in the area of the development of broadband communication. Some of the successes are as discussed below: Several operators have successfully landed submarine cables in Lagos that provide over 9 terabits per second of combined capacity which has enhanced the infrastructure for broadband communication and will help to accommodate the increase in broadband penetration. The network roll out of number of licenses has also resulted in the installation of a fibre-optic backbone infrastructure in all Nigeria states and the federal capital territory. Some states such as ondo state are special schemes inaugurated mainly to supervise the connectivity of broadband infrastructure to the interior towns apart form the state capital. having interconnection of broadband infrastructure with other parts of the state. B. CHALLENGES FACING BROADBAND COMMUNICATION IN NIGERIA Fibre-Optic backbone infrastructure in the Nigeria states and the federal capital territory are not interconnected and are concentrated in the state capitals and a few urban areas. It is recorded that Broadband penetration is low and of about 6% (Omobola Johnson) while that of Internet penetration is equally low and of about 28%and 33%. National Broadband Plan identifies some of the major challenges faced by operators, such as: 1. High cost of procuring rights of way which ultimately results in high costs for leasing of transmission infrastructures); 2. The incumbent operator, Nigerian Telecommunication Limited (NITEL) has been out of operation for a number of years and all attempts made to privatise NITEL and its subsidiary MTEL, have been unsuccessful. 3. Dearth of investment in fixed household broadband primarily because of the multi-faceted challenges facing operators which prompt the operators to concentrate their household broadband activities on the major cities. 4. Long delay in procuring approval for such rights of the way; 5. Multiple forms of taxation and
86 6. Regulation; 7. Vandalism; and 8. Distruption caused by roadworks. 9. Generally power supply is a major problem to (operators) doing business in Nigeria Other reasons for low penetration of broadband include: 10. Incumbent operator NITEL has been out of operation for a number of years. 11. Dearth of investment in fixed household broadband, primarily because of the multi-faceted challenges facing operators. So far some operators have concentrated their household broadband activities on the major cities, such as Abuja, Lagos, and PortHarcourt. C. HOW TO DEVELOP BROADBAND INFRASTRUCTURE IN NIGERIA Ajayi,[7] therefore, says the goal of tremendously increasing Internet/broadband penetration in Nigeria must be given utmost priority in He advises that the major way to fast-track broadband penetration is to stimulate demand for broadband access by promoting the deployment of applications that are relevant to Nigerian users and will add values to their lives. Incentivize the quick and effective rollout of new infrastructure and services by all players in the industry; provide universal access to broadband services to the same extent as basic telephony services; provide industry players with requisite spectrum and other resources; and ensure requisite protection for existing infrastructure. Stanley Jegede, Chief Executive Officer, Phase 3 Telecoms has called on the Federal Government to invest in a national backbone infrastructure that will carry and distribute data capacity from the shores of the country to the hinterland. Jegede made the statement in Lagos recently, insisting that a fully established national backbone infrastructure would boost capacity distribution of broadband and deepen internet penetration in the country. He noted that Nigeria has a lot of broadband capacities from MainOne, Glo 1, and MTN s West African Cable System (WACS) at the shores of the country, but without a long distance national backbone to carry and distribute the capacities to users in offices, schools, and homes in the hinterland, our dream of accelerated broadband penetration would be grossly hindered. There is a serious need for government to subsidize the creation of a national broadband backbone network, this subsidy which is very similar to subsidy in America, Australia, and in the UK, will work towards effectively building critical infrastructure required to create a platform where costs associated in delivering the services to the consumers at the right price is determinable. Jegede said. D. BENEFITS DERIVABLE FROM BROADBAND COMMUNICATION Mrs. Opeke (CEO of Main One Cable Company) maintained that when broadband is readily available, behaviour patterns will change because we will rely on such to obtain services and get tasks required in our daily existence as students or workers or business people done. [12] The 2009, World Bank Information and Communications for Development report showed that access to broadband boosts economic growth in all countries, but most especially in developing ones. The study showed that in developing countries, for every ten-percentage
87 points of broadband penetration, their economies grew by 1.38 per cent. The report, conducted in 120 countries between 1980 and 2006, showed that developed countries economies grew by 1.21 per cent. The figures confirm that broadband access is key for economic growth and even more vital in developing countries. Many Africans are seizing the opportunity that it offers to move their economies forward. In the same way that the construction of electricity grids and transport links spurred innovation far beyond the dreams of their builders, high-speed broadband networks stimulate greater efficiency and the advancement of businesses. The 2010 U.S. National Broadband policy document captures it even better when it states: Broadband is the great infrastructure challenge of the early 21st century. Like electricity a century ago, broadband is a foundation for economic growth, job creation, global competitiveness and a better way of life. It is enabling entire new industries and unlocking vast new possibilities for existing ones. It is changing how we educate children, deliver health care, manage energy, ensure public safety, engage government, and access, organize and disseminate knowledge. It is a known fact that one of the key requirements for any successful business is the ability to communicate effectively and efficiently especially in this digital age. Anything that can speed up the rate at which communication takes place improves radically the output from any business endeavour and enhances the efficiency with which business processes are carried out. This is the whole new vista of opportunity that broadband technology offers us. Broadband gives you a high-speed, always-on connection to the Internet, which is typically at least 10 times faster than regular Internet connections. Besides being fast, it is highly cost-effective and provides consistency and reliability. It can save you time when using and the web, thereby helping your staff to become more productive. In addition, it allows you to build online links with customers and suppliers, as well as with off-site and remote workers. The term broadband is used to describe any high-speed connection to the Internet with speeds starting from at least 1mbps. V. CONCLUSION In the review work, the reasons for the low ranking in WEF NRI for 2013 was discussed with the major reason being the poor development of broadband communication industry in Nigeria. Based on this discovery, the level of broadband infrastructure in the country was also investigated. However, it was also discovered that Nigeria has enough fibre optic cable at her shore to provide us with the capacity needed for the Nigerians but due to lack of domestic connectivity, many Nigerians are not benefitting from this wealth of Broadband communication capability. Not that alone the ways of developing broadband communication was also discussed. Finally, what the country stand to benefit by improving on the broadband communication was also discussed. By implementing the suggestions given in this paper, I am very optimistic that Nigeria will soon been singing a new song of great innovation.
88 REFERENCES 1. Roller, Lars-Hendrik, and Leonard Waverman Telecommunications Infrastructure and Economic Development: A Simultaneous Approach. The American Economic Review 91 (4): Jensen, Robert The Digital Provide: Information (Technology), Market Performance and Welfare in the South Indian Fisheries Sector. The Quarterly Journal of Economics 122 (3): Goyal, Aparajita Information Technology and Rural Markets: Theory and Evidence from a Unique Intervention in Central India. Working paper, University of Maryland, 4. Qiang, Christine Zhen-Wei, and Carlo M. Rossotto, with Kaoru Kimura Economic Impacts of Broadband. In Information and Communications for Development 2009: Extending Reach and Increasing Impact, Washington, DC: World Bank. 5. Beñat Bilbao-Osorio, Soumitra Dutta, and Bruno Lanvin; Growth and Jobs in a Hyperconnected World; The Global Information Technology Report 2013; by the World Economic Forum and INSEAD 6. Dayo Oketola: Broadband, infrastructure protection top ICT stakeholders demands The Punch Nigerian Newspaper, January 7, ONDONET: Advantages of ONDONET broadband communications Africa Partnership Forum: ICT in Africa: Boosting Economic Growth and Poverty Reduction; 10th meeting of the Africa Partnership Forum. Tokyo Japan 7-8 April Enrique De Argaez : What You Should Know About Internet Broadband Access; Publish Online at: Internet World Stats Jul 28, Towela NYIRENDA-JERE; Enhancing ICT Development in Africa: a framework for collaboration between NEPAD and African Research and Education Networks; NEPAD e-africa Programme, CSIR 43B, P.O. Box 395, Pretoria 0001, RSA 11. Osofisan A.O, Osunade O; ICT Infrastructures Available in Nigerian Educational and Research Institutes; Conducted by Department of Computer Science University of Ibadan Ibadan, Nigeria Tel: ao.osofisan@mail.ui.edu.ng; Source: NUC (2005) 12. Maim One Cable Company Nigeria Limited; Broadband Nigeria The Next Frontier? paper presented by main one cable company Nigeria limited at the Nigerian Communications Commission s Stakeholders Consultative Forum for the year strategic management plan; April Engr Ernest C. A. Ndukwe; ICT Infrastructure: an Essential Foundation for Implementing the WSIS Process in Nigeria; Chief Executive Nigeria Communication Commission, Kehbuma Langmia; The role of ICT in the economic development of Africa: The case of South Africa; Bowie State University, USA. Published in International Journal of Education and Development using Information and Communication Technology (IJEDICT), 2005, Vol. 2, Issue 4, pp Mark D.J Williams; Broadband for Africa: Developing Backbone Communications Networks. Delivered by The World Bank e-library to: The World Bank IP : Mon, 03 May :41:29
89 16. Jabulani Dhliwayo; Developing a Fiber Optic Backbone for Africa; Steering committee chairman: NEPAD Council 17. Marketing Communication: ITU World 2012 To Experience Nigeria as a Connected Nation; Posted in News on September 19, 2012 by Marketing Communications; Source: Marketing Communication: NCC Considers New Structure to Drive Broadband Growth; Posted on September 18, 2012 by Marketing Communications
90 SURVEY OF CYSTICERCUS (BLADDER WORM) IN MEAT SOLD FOR CONSUMPTION IN BUKURU, PLATEAU STATE NIGERIA. ABSTRACT Kaze, P.D., and Gam, K.P. School of Science and Technology, Plateau State Polytechnic, Barkin Ladi, Nigeria. A cross sectional study of bovine, porcine and dog cysticercosis was carried out in Bukuru Plateau State Nigeria,in 2010 using Gyel Bukuru abattoir, Fwagul and Kuru trade centre slaughtering abattoir, as study areas. Two hundred and twenty-five samples were collected at random comprising of seventy-five samples each from cattle, dog and pig respectively, where twenty-five samples were taking for raw meat, cooked meat and feaces in relation to the sex of the animals examined. The overall prevalence rate of 28 (12.44%) was recorded out of the total sample of 225. Raw meat records 10(4.44%), cooked meat record 7(3.11%) and feaces records 11(4.98%) infection rate. X 2 analysis show no significant difference in the prevalence rate of cysticercus in meat and cyst in feaces of the examined animals (p>0.05). There was no record of infection in cattle, both in beef and feaces in different sexes of the cattle examined, sex specific incidence rate obtained in both studies did not differ significantly (p>0.05). The female animal studied had the highest infection rate of 17(60.71%).There was significant difference in tapeworms encountered with the meat and feaces examined (p<0.05) Taenia solium had the highest infection rate of 14(6.22%), Dipylidium caninum had 12(5.33%) with the least infestatioin recorded in T. hydatigena 2(0.89%). Hence no record of T. saginata infection was encountered in the present study. However mixed infection was recorded in Dog with T. hydatigena & D. caninum. INTRODUCTION Cysticercosis is caused by the larval stage of the tapeworm Taenia solium, Taenia saginata and Dipylidium caninum, clinical syndromes include neurocysticercosis (NCC) and extraneural cysticercosis. In endemic areas NCC is an important cause of adult-onset seizures (Montano et al, 2005). Cysticercosis caused by the larval stage of the worms (T.Solium, T. Saginata, 0and D.caninum) are highly important, but under-recognised parasitic zoonosis in many developing countries and particularly in Africa (Geerts et al, 1995). Cysticercosis is a frequent infection in Pigs, Dogs and humans in developing countries (Manuela et al, 2003). Human taeniasis is mainly caused by two parasites which use man as definitive host Taenia solium and Taenia Saginata. The adult tape worms live in the small intestine. If eggs of the parasite that have been passed out in the faeces and are ingested by pigs (T.Solium), cattle (T.Saginata) or Dog (Dipylidium caninum), they develop into the larval forms called cysticerci. These are frequently located in the muscle. Human contact
91 taeniasis/ cysticercosis after ingesting viable cysticerci in raw or undercooked pork, beef or dog meat. The scolex within the cysticercus is freed, attached in the human small intestine and matures into the adult tapeworm within 10 weeks. When the tapeworm matures, microscopic eggs containing infective Onchosphere are passed in human faeces and ingested by pigs, cattle or dogs the intermediate host. The egg hatches in the intestinal tract and the Oncosphere is freed, migrates through the intestinal wall, and gains access via the circulatory system to the muscles, brain and other tissues of the host, where it transforms into the metacestode form or cysticercus.it has effect on human health economic losses due to the condemnation of heavily infected carcasses and the necessity to freeze or boil infected meat. Losses may also occur from restriction of exports (Murrel, 1991).Control of cysticercosis has been achieved in developed countries through improved hygiene, sanitation and properly maintained commercial piggeries. However, in developing counties including Nigeria the disease is highly endemic in all areas where pigs, cattle and Dogs raising is practiced. Eating infected raw or undercooked pork, beef or dog meat can cause people to become infected with the adult tapeworm form of the parasite (taeniasis). If humans come into contact with infected human stool and accidentally ingest the eggs develop into the larval form of the tapeworm, which targets the muscles the eyes and most commonly the brain (Neurocysticercosis), manifesting as cysts. This may occur through direct contact with a tapeworm carrier s infested stool, by putting contaminated fingers in the mouth, or through ingestion of water or foods that have become contaminated with the infected faeces. 1.2 AIM AND OBJECTIVES OF THE STUDY i. The project is aimed at surveying for the presence of cysticercus (Bladder worm) in meat. ii. iii. To detect the cystic form of the larvae on faeces of the infected animals in the study area. To compare the rate of infection in relation to the sex of the study animals. MATERIALS AND METHOD The materials used for this project (research work) include: sample container, hand glove (Rubber), Laboratory coat, cover slip, sterile grease free glass slide, universal bottle, sterile Polythene bag, Nose mask, siever, Rubber Beaker, Applicator stick, stainless
92 steel tray, compound Binocular microscope, fresh feaces of cow, pig & Dog, Fresh meat of cow, pig and dog, cooked meat of cow, pig and Dog, sterile scissors, sterile petri-dishes, maskin tape and bold pen. 3.2 SOLUTIONS USED Saturated salt solution (SSS) Lime water (Ca(OH) 2 ) and Tap water. 3.3 CASE STUDY AREA :The case study area for this work was Bukuru and its Environs, which comprises of Bukuru Abbatoir (Gyel), Fwagul and Trade centre Kuru pig slaughtering Abbatoir. SAMPLE SIZE: The total sample size was 225, it is sub divided into the following: i. Twenty five (25) pieces of fresh meat (Beef) ii. iii. iv. Twenty five (25) pieces of fresh meat (Pork) Twenty five (25) pieces of fresh meat (Dog Meat) Twenty five (25) portion of fresh feaces of cow v. Twenty five (25) portion of fresh feaces of Pig vi. vii. viii. ix. Twenty five (25) portion of fresh feaces of Dog Twenty five (25) pieces of cooked meat (Beef) Twenty five (25) pieces of cooked meat (pork) Twenty five (25) pieces of cooked Dog 0(meat) METHOD OF SAMPLE COLLECTION The method of sample collection employ for this project work (research) was the random sampling technique. The sample were collected at an interval of two (2) weeks at random five consecutive times, total of 50 (fifty) sample were collected each two weeks. In the last week 25 sample were collected. The sex of each study animal was also noted in the course of the sample collection. The samples were transported to the laboratory for analysis. TECHNIQUES USED Two techniques were employed here. Liming technique was to detect the presence of the larval form of the parasite (cysticercus) in the meat sample (both fresh and cooked meat) and floatation technique was employ to detect the presence of the cystic form of the parasite in the fresh feacal samples collected.
93 PROCEDURE I: LIMING TECHNIQUE - Sterile Petri dish were labeled and placed on a stainless steel tray. - Each samples were cut using sterile scissors and were placed on the petri dishes according to their label. -Some few drops of lime water were apply on the piece of the meat contained in the petri dish. - The set up was allowed to stand for 60 to 120 seconds - And was observed for the presence of the larval form of the parasite (cysticercus) -The results obtained is shown in chapter four of this research work. PROCEDURE II: FLOATATION TECHNIQUE - About 50ml solution of saturated salt solution (SSS) were added to a labeled universal container. - About 1g of fresh feacal sample was added to the solutions in the container. - Applicator stick was used to mix the fresh feacal sample with the solution. - The mixed sample was sieved into a beaker using siever. - The universal container was washed with the applicator stick using a gentle flood tap water. - The filtrate was decanted into the universal container and saturated salt solution was added to it until it was filled to the brim in a stainless steel tray. - Clean grease free sterile glass slide was placed gently on the container trapping of air bubbles was avoided. - The set ups was allowed to stand for minute. - The slide were removed carefully and covered with a cover slip and was examined using a compound Binocular microscope with X10 and X40 objective lens respectively. - Same procedure was repeated to all the numbers of samples analyzed using the floatation method RESULTS TABLE I: PREVALENCE RATE OF CYSTICERCUS IN MEAT (RAW & COOKED) AND CYST IN FEACES OF THE EXAMINED ANIMALS Animals examined No. of samples examined(meat and feaces) No. of meat examined No. of feaces examined (%) No. of meat infected in (%) No. of feaces infected in (%)
94 RM CM Total RM CM Cattle Dog Pig (25 50(25 50(25 25) 25) 25) (0.00) 14(18.67) 14(18.67) 0(0.00) 5(6.67) 5(6.67) 0(0.00) 3(4.00) 4(5.33) 0(0.00) 6(8.00) 5(6.67) Total (12.44) 10(4.44) 7(3.11) 11(4.89) Key RM= Raw Meat; CM=Cooked Meat. X 2 calculated value X 2 Tabulated value df = 4 at 0.05p. TABLE II: INFECTION RATE OF THE TAPEWORM (CYSTICERCUS & CYST) IN THE DIFFERENT SEXES OF THE EXAMINED ANIMAL Animals No. of samples No. of meat No. of No. of No. examined examined (meat examined feaces infected feaces & feaces) examined meat in (%) infected (%) (%) (%) (%) RM CM RM CM M F M F M F M F M F M Cattle (0.00) 0(0.00) 0(0.00) 0(0.00) 0(0.00) Dog (2.67) 3(4.00) 1(1.33) 2(2.67) 4(5.33) Pig (1.33) 4(5.33) 2(2.67) 2(2.67) 1(1.33) Total 225 3(1.33) 7(3.11) 3(1.33) 4(1.78) 5(2.22) Key: M= Male; F= Female RM= Raw Meat CM =Cooked Meat X 2 calculated value X 2 Tabulated value df= 10 at 0.05p. TABLE III: TAPEWORMS (CYSTICERCUC & CYST) ENCOUNTERED AND THEIR PREVALENCE RATE IN THE EXAMINED ANIMALS Animals No. of No. of meat No. feacal samples Taenia T. solium T. D examined samples examined(rm&cm) examined(m&f) saginata hydatigema c
95 examined (%) (%) (%) Cattle (0.00) 0(0.00) 0(0.00) 0 Dog (0.00) 0(0.00) 2(2.67) 1 Pig (0.00) 14(18.67) 0(0.00) 0 Total (0.00) 14(6.22) 2(0.89) 1 X 2 Calculate value X 2 Tabulated value df = 6 at 0.05P. Table I shows the prevalence rate of cysticercus in meat (raw & cooked) and cyst in feaces of the examined Animals. There was no record of any infection associated with cysticercus in cattle as well as cyst in feaces. Pigs and dogs recorded same infection rate of 5 (6.67%) in raw meat while 4(5.33%) and 3 (4.00%) in cooked meat repectively. The feacal sample of dog and pigs showed infection as 6(8.0%) and 5(6.67%) respectively. This study reveals an overall prevalence rate of 28 (12.44%) in the examined samples. However, X 2 analysis indicates that there was no significant difference in the prevalence rate of cysticercus in meat and cyst in feaces of the examined animals (P>0.05). Table II: Shows the infection rate of the tapeworm (cysticercus & cyst) in the different sexes of the examined animals. The raw meat of the female animals examined had the highest infection rate of 7(3.11%) with the least infection rate recorded in the raw and cooked meat of the male animals 3(1.33%) respectively. The cyst was more in the female feacal sample recording 6(2.67%). the raw meat (pork) from the female pig had the highest infection rate of 4 (5.33%), followed by the female raw meat of Dog 3(4.00%), with least recorded in the male raw and cooked meat of Pigs and dogs, respectively. The cysts of the parasite were more common in the male and female, dogs and pigs 4 (5.33%) respectively. Hence, X 2 analysis reveals that there was no significant difference in the infection rate of the tapeworm in different sexes of the studied animals (P>0.05).
96 Table III: Shows the tapeworms encountered and their prevalence rate. There was no record of infection associated with cattle both in beef and feaces. Taenia solium had the highest rate of infection of 14 (6.22%) followed by Dipylidium caninum 12(5.33%) with the least recorded in T. hydatigena 2(0.89%) respectively. In Dogs, D. caninum had the highest rate of infection of 12 (16.00%) and the least record of infection in T. hydatigena 2(2.67%), T. Solium was the only tapeworm encountered in pigs with infection rate of 14 (18.67%). However, X 2 analysis indicate that there was significant difference in tapeworm encountered in the examined animals (P<0.05). However, at the course of this research the following cyst of parasite were also encountered in the feaces of the examined animals: Cattle Oesophagastomum radiatum Mecistocirrus digitatus, Bunastomum phlebotomum, Paramphistomum cervi, Eimeria sp strongyla eggs, Toxocara vitulorum, Fasciola gigantica & Trichuris globulosa Dogs Ancylostoma caninum, Necator sp, Isospora canis, Pigs Eimeria sp, Paragonimus westermonii, Necator sp, Oesophagostomum dentatum, Nnetastrongylus apri & Ascaris lumbricoides. DISCUSIONS In the present study, no cysticercus or cyst of Taenia saginata was recorded in the meat and feaces of cattle examined, with prevalence rate of 75 (0.0%). This result is in partial accordance to the report of Ofukwu et al, (2009) that recorded 0.7% in bovine (cattle) in Makurdi, North central Nigeria. This partial accordance may be attributed to local regulation to keep cattle restrain particularly the crises that restrict cattle rearing, latrines inside or outside household, awareness of personal hygiene and proper beef preparation, avoidance of ingestion of infected beef, rejection by the butchers of infected cattle and awareness of the population. Pigs had a prevalence rate of 9(32.14%) after routine meat (Pork) investigation as compared to that of Phiri, et al., (2006) in porcine Cysticercosis in Zambia village Pigs, that reported prevalence rate of 31 (47.7%). However, a prevalence rate of 5 (17.86%) was recorded for cyst in feaces of the examined pigs. This is inconsistent to the report of Allan et al., (1996) with 2.7% in Guatemala. These variations may be due to dissimilarities in sample size, awareness of the population on the transmission dynamics of porcine cysticercosis. In the study, a
97 prevalence rate of 8 (28.57%) and 6 (21.43%) was recorded for Dog meat with Dipylidium caninum and cyst in feaces of Dogs respectively, as against Echinococcus granulosus reported by Verastegui, et al., (2003) with a prevalence rate of 16(80.0%) in Peru, France. This variation may be due to differences in sample size, Dog management operations and environment. Generally, Raw meat of the examined animals, had the highest infection rate than the cooked meat (P>0.05) and the feaces having cyst than the meat examined. In the present study, Bovine cysticercosis was not recorded in cattle, both in the meat and cyst of feaces in the males and females examined. However, Ofakwu, et al (2009) reported a higher proportion of infection with cysticercosis in meat and feaces of males 273 (69.2%) and females 121 (30.7%) cattles investigated respectively. Also, Allan et al, (1996) reported infection rate of porcine cysticercosis in meat (Pork) and feaces of males 33(2.1%) and females 59(3.3%) of pigs examined. Generally the females animals examined had the higher infection rate 17(60.71%) as against the males with 11(39.29%). These variations may be due to differences in sample size and awareness or public health education on the transmission of taeniasis. In this study, Taenia saginata was not encountered in cattle examined in both the meat and cyst in feaces respectively. T. hydatigena 2(2.67%) and D.caninum 12(16.0%) recorded in dogs examined and T. solium 14(18.67%) found in pigs examined. Multiple infections were only recorded in dogs as against monoparasitism or no parasitism in pigs and cattle respectively. Generally pigs had the higher infection rate of 14 (6.22%). Phiri et al., (2003) revealed an infection rate of 43(66.15%) of Taenia solium in meat and cyst in feaces of pigs, also Ofukwu, et al., (2009) reported an incidence rate of 9.2% of Taenia saginata in cattle at Makurdi, North central Nigeria. These variations may be attributed to dissimilarities in sample size, public awareness on cysticercosis and environment. CONCLUSION Cysticercus is of public health importance as long as meat remain the source of protein to man. The common meat in the study area includes Dog meat, pork and beef. The meat should be properly cooked so as to kill the bladder worm. Hence with proper management of meat and meats product the bladder worm will be reduced drastically.
98 RECOMMENDATIONS Further study should be carried out in different part of the state (local government areas) on the same incidence in other to compare the rate of infection in the entire state.health Education should be carried out in other to minimize infection to both man and animals. Meat and meats products should be properly cooked and prepared, and the feaces of the animals be properly disposed. REFERENCES Allan J.C; Velasquez-Tohom M.; Garcia-Noval J.; Torres-Alvarez R.; Yurrita P.; Fletes P.; De Mata F.; Sotode Alfaro,H. and Craig,P.S. (1996): Epidemiology of intestinal taeniasis in four rural Guatemalan Communities. Annal of Tropical Medicine and parasitology. 90:2: Geerts S; Tsang V.C.W and Wilson M (1995): Cysticercosis in Africa. Parasitol Today.11:389. Manuela,V.; Robert, H.; Hector, H.; Garcia; Armando, E.;Gonzalez; Yanina, A.; Cesar, J.; Isakra, T.; Cesar, M.; Gavida; Minlevine; Victo and Tsang (2003). Prevalence of antibodies to unique Teania solium oncosphere antigen in Teaniasis and human, porcine cysticercosis.the cysticercosis working group in Peru.Pub July No Montano SM; Villaran MV and Yiquimiche L.(2005): Neurocysticercosisi. Association Between seizures serelogy and brain CT in rural Peru. Neurology. 65:2: Murrell KD.(1991): Economic losses resulting from food-borne parasitic zoonoses.south-east Asian trop med pub health.22: Ofukwu R.A; Akawuobu CA and Okwori AI. (2009): Epidemiology and public health Importance of bovine cysticercosis in Markurdi North-Central Nigeria. Tanzania Veterinary Journal. 26:1: Phiri, I.K; Dorny P; Gariel S; Willingham AL; Sikasunge C; Siziya s and Verestegui J.(2006): Assessment of routine inspection method for porcine cysticsrcosis in Zambian village pigs. Journal of Helminthology 8: Verastegui M; Gonzalez A and Gilman RH.(2003): Experimental infection model for Taenia solium cysticercosis in swine. Vet Parasitol 94:33-44.
99 MICROELECTRONICS MANUFACTURING: THE NIGERIAN CONTENT Peneg Moqeni Bornu-Gberesuu Department of Electrical/Electronic Engineering Rivers State Polytechnic, Bori, Rivers State, Nigeria. ABSTRACT For several years now, Nigeria has been vocal on what she called Transfer of Technology. This is a good idea but the question is; have those technologies been transferred?. No one gives his secret of success and livelihood to another. The technology so sought must be home grown. This article is intended to find out what are available in Nigeria in the area of Microelectronic Manufacturing. Part one, presented in this volume, is titled Semiconductor Materials: The production of semiconductor material is the basis for microelectronic manufacturing. All the semiconductor materials are identified, projections are on their sources in Nigeria. Methods of preparation are explained from the perspective of methods employed in developed economies. The aim is to get at where in the manufacturing processes that we can deploy appropriate technology. Keywords: Transfer of technology, home grown, basis, sources in Nigeria, appropriate technology 1.1 PREAMBLE In today world, digital electronics is the focus of technology. Micro- and Nano- electronics command the present man-machine values. Nigeria is one nation that has all the potentials needed to manufacture personal, domestic, and industrial appliances from the scratch to finish. In this article, I try to explore the possibilities for the complete manufacture of micro- and nanoelectronics from extraction of raw materials to the finished and refined semiconductor substrates; from constructing electronic components on the semiconductor substrates to a complete and functional integrated circuit or chip. 1.2 SEMICONDUCTOR MATERIALS SOURCES 1. Raw Material To make a microelectronic circuit the raw materials, must be obtained. These raw materials are the semiconductors ores. These ores are obtained from sand at sea shores; and can also be extracted from rocks In Nigeria, good sandy beaches with crystalline sand are littered all along the long stretch of coast line from Ogun State in South Western Nigeria to Cross- River State in the South-South of the country. If Semiconductor ores are obtained from rocks, then Nigerians have everything it takes to get the ores in abundance. Rocks are found cladding all of South East and the middle belt of Nigeria. And if you go to the North East and East of the country, the whole stretch of

 3. Cadmium Sulphide (CdS) 4.")
 Low Temperature α - rhombohedral (ii) Tetragonal, (iii) High Temperature rhombohederal.")

100 land from Gwoza in Borno state to Obudu in Cross-River State are rocky and mountainous. Where on earth do we have this vast source of Semiconductor materials. 2. Semiconductor Materials Listed here are some of the semiconductor materials that researches have proven to be useful in the electronic industry. 1. Bismuth Telluride. (Bi 2 Te 3 ) Bismuth occurs in nature, but often associated with silver, gold, etc. It has a complex rhombo-hedral structure and exhibits very anisotropic thermal and electrical properties. Used primarily as a thermoelectric material. It is a compound of bismuth and tellurium. 2. Boron. (B) 3. Cadmium Sulphide (CdS) 4. Diamond (D) Thius coccurs naturally in borates and in the silicates:- tourmaline, axinite and datolite.this is a very hard material with a dark, non-metallic lustre. Presently there are three crystallographic modifications - (i) Low Temperature α - rhombohedral (ii) Tetragonal, (iii) High Temperature rhombohederal. Boron has high activation energy hence its use as a thermistors material. Cadmium occurs in nature as the sulphide, greenockite, zinc ores. It is brittle and can be found in any colour even transparent depending on the kind and amount of impurities present. The cubic form is unstable. The hexagonal modification is stable. These are the only two modifications, this semiconductor material is used as thin- film photoconductor. Used also in light meters and various other optical sensors designed to operate in the physical spectrum. It can also be used in solar cell. It is a compound semiconductor material. This occurs in igneous rocks and in alluvial deposits. There are two types:- type I-behaves as an insulator. Though type II is rare, it is considered semiconductor material,. It has the p-type material property.it is used occasionally as mounting blocks for high power semiconductor devices.


 Gray semiconductor cubic (α) form stable below 13.2 0 C (ii) A metallic white dragooned structure form that is stable above 13.")
 or stibnite. It is a bright shiny material. The primary use is in the production of photovoltaic infrared detectors.")
101 5. Gallium Arsenide (GaAs) 6. Germanium (G) Gallium (Ga) is obtained as a bye-product of bauxite refining. Arsenic occurs in many sulphide ores. A compound semiconductor material, it is a dark gray material with Zinc blende structure used in high-temperature transistor material. Other applications include Varactor Diodes, Schottky Barrier Diodes, Light Emitting Diodes etc. It is. A brittle silvery gray metallic element It is a p-type semiconductor material. Its use in diodes and transistors is declining. Used mostly in devices which require very low forward - voltage drop. For instance low-voltage inverter application. 7. Gray Tin Tin is found in Nigeria in cassiterites or tinstone. Casseterite is obtained from lodes and alluvial deposits. Here, there are two modifications (i) Gray semiconductor cubic (α) form stable below C (ii) A metallic white dragooned structure form that is stable above C up to its melting point of o C 8. Indium Antimonite (InSb) 9. Lead Sulphide (PbS) Indium is obtained as a bye-product of smelting and refining lead, zinc, tin and copper. Antimony occurs as sulphide, antimonite (Sb 2 S 3 ) or stibnite. It is a bright shiny material. The primary use is in the production of photovoltaic infrared detectors. It can also be used in the photoconductive mode. Because of its high magneto-resistive effect it is used in various displacement gages and variable resistors; flux meters and analog multipliers Is a dark metallic appearing material which occurs naturally as large crystal called galena. Deposits of galena oxidize in their upper parts into oxysalts; eg. Cerussite (PbCO 3 ), and anglesite (PbSO 4 ). Lead occurs as lodes or veins. Used as an RF and infrared detectors. 10. Selenium (Se) It occurs in sulphide and all pyritic ores. Found in monoclinic, hexagonal and atmospheric forms. The monoclinic form has α and modifications. The Hexagonal form is gray or metallic-looking and consists of zigzag chains running parallel to the z-axis. Used in rectifiers and photoconductive application. The amorphous form softens from 50 o C and flows at 100 o C


102 11. Silicon (Si) 12. Silicon Carbide (SiC) 13. Tellurium Silicon is found as silica (SiO2) and occurs as quartz, chaldcedony, agate, flint etc. It is brittle and hardness is rated intermediate between germanium and quartz. It is used in the production of integrated circuits, rectifiers, diodes, transistors, SCRs and triacs; solar cells, positive temperature coefficient resistors. This is an alloy of silicon and carbon. But occurs naturally only in meteor specimens. It may have the colour of black, green, orange or pale blue or virtually clear, used mostly as heat sink for light-power semiconductor devices. It decomposes at 2830 o C at atmospheric pressure.it does not melt to a molten state. Thus occurs in nature, but mostly combined with bismuth, lead, gold, or silver. It is a white, metallic- looking element used in thin-film transistors and as content of various semiconductor components. Draining from the list of semiconductor materials above, Boron, Diamond Germanium, Selenium, Silicon and Tellurium are the only pure elements whose ores are naturally occurring by mere acetylene and oxygen flame and on charcoal. By their description one can make good identification at the preparation of the pure element. Others are alloys of their respective constituent elements. These elements can also be identified 1.3 SUBSTRATE REALISATION Space failed me to discuss all the processes to realize the pure substrate of semiconductor material for each of the thirteen semiconductor materials listed in the last section so I have left out the compound semiconductors and concentrate on the pure semiconductors whose ores are readily available. 1. Boron Boron is extracted from a halide; that is, a salt of Boron and other metals like fluorine, chlorine, bromine, iodine and astatine. Notice that there elements are in the seventh group of element on the periodic table. The extraction process is that the halide (ore) is heated to a temperature of about C for α- rhombohedra, C for high-temperature and above C for rhombohedra modification At each of those temperature the vapour from the halide (Boron Chloride, Boron-Fluoride, etc.) is collected above this vapour; solidifies to form Boron semiconductor material.
103 2. Diamond Diamond mines may not have been found in Nigeria, but found in other sister countries. With good negotiation one can import same. African 3. Germanium The process of extraction is: Germanium Chloride is obtained and hydrolysing it (ie adding ambient amount of water) to reduced it to Germanium Oxide (GeO 2 ) and later reducing the oxide with hydrogen. 4. Selenium The one suspected of containing selenium is heated. It begins to softer at temperature from 50 0 to 60 0 C and flows at C for the amorphous form. The hexagonal form melts at C At the point of flow Selenium is decanted to a container where purification process begins. The purification process involves more stages of heating and decanting. 5. Silicon Silicon is not found naturally. It is found in various other minerals like silica and silicates. To make Silicon, quartz sand has to be reduced with coke. The product is converted to a halide like Silicon Tetrachloride or SiHCl 3. The next step is to purify it by repeated distillation which is later reduced with hydrogen. This is done either of two methods: hydrogen reduction of SiHCl 3 or SiCl 4 ; or the thermal decomposition of SiH Tellurium An element found in nature. Single crystals are grown by either the Czochralski or the Bridgeman method. It is purified by distillation. 1.4 CRYSTAL GROWTH This article is not intended to deal with theories, rather, the thrust herein is to make a realizable approach to manufacturing microelectronic from the local content and by the use of appropriate technology in Nigeria Walter R. Bunyan and Stacy B. Watelski of Texas Instruments Incorporated, Dallas-Texas, USA in their contributing articles to Handbook of Material Processes for Electronics stated that most microelectronic devices require single- crystal semiconductors for best performances and that a number of processes are available, depending on the desired properties. Crystal Growing Environment Over the years there has been several methods adopted for crystal-growing. It is also noted that each of these methods have its own different sub methods. However, three main categories have been prominent. 1. Crystallization from One-Component System.
104 This has not been done purely because of impurities. But then for practical purposes, it is agreed that process can go on. So these processes are possible. i. Crystallization from a liquid of the same composition ii. Crystallization from a vapour of the same composition. iii. Crystallization in the solid state. 2. Crystallization from a multicomponent system. The steps in item one is also followed. 3. Crystallization from a multicomponent system coupled with chemical reaction (s). The steps in item one is also followed. 1.5 PREPARATION OF SEMICONDUCTOR MATERIALS Discussion here is centred on the preparation of two most commonly used semiconductors. Preparation of Germanium The basic source of germanium is from zinc refining or from the flue dust of certain coals. Germanium has a gray metallic lustre. And because it is available in the oxide form (GeO 2 ) it is easily treated with heat. Primary processes. Step I: Heat Germanium Oxide to C in an atmosphere of hydrogen Result: GeO 2 + 2H 2 Ge + 2H 2 O Germanium is obtained as germanium powder (Ge) Step II Heat Germanium (Ge) to above melting point of about C Result : Germanium bars, but it is of low impurity type. Secondary Processes Float Zoning Process. Step I: The germanium melt from the end of the primary process is kept in a graphitic pot lined internally by quarts liner. The ambient temperature is kept above melting temperature. Step II: A tout rod is obtained and a tiny seed of germanium is positioned at one end rod. of the Step III: Immerse the rod with the end holding the seed into the molten germanium Step IV: Rotate the rod (to promote stirring in the molten germanium) Step V: Slowly withdraw the rod with the seed as the liquid freezes on the colder seed.
105 The technique here is that the growing crystal is raised at such a rate as to keep the interface between the solid and the liquid at the surface of the molten germanium RESULT: It is expected that the atoms in the solidified melt arrange themselves in such a way that they have the same crystal structure as the seed crystal. The grown crystal is usually circular and 2 to 3 cm in diameter. But several centimetres in length depending on construction length. Doping for p-type and n-type Germanium The arrangement for crystal growth incorporates quartz tube through which donor or acceptor type impurities can be added to produce p-type or n-type germanium The process is done in the atmosphere of hydrogen-argon which is introduced through the side tube. Preparation of Silicon Silicon has a bluish-grey metallic lustre. Though hard, its melting point is C. at 80 o C it becomes ductile. The semiconductor is obtained in Silicon Hydro-Chloride (SiHCl 3 ) or Silicon Tetra Chloride (SiCl 4 ) or Silicon Hydride (SH 4 ). Primary Processes: Step I: Quartz Sand + Coke SiHCl 3 Quartz Sand + Coke SiCl 4 Quartz Sand + Coke SiH 4 Depending on the type of quartz sand. Step II: SiHCl 3 or SiCl 4 or SiH 4 is purified by repeated distillation Step III; 2SiHCl 3 + 3H 2 2Si + H 2 + 6HCl or SiCl 4 + 4Zn Si + 4 ZnCl or Pyrolytic decomposition of Silane (SiH 4 ) SiH 4 + Heat Si + 2H 2 Secondary Processes
106 Any of the following methods are used here. Viz: Float zoning or zone level or Czochralski methods. Discussed fully in part three of this article. 1.6 SILICON CRYSTAL GROWTH Polycrystalline Silicon: A practical Approach Several methods are employed to produce semiconductor grade polycrystalline silicon. Depending on the silicon ore obtained. The following four basic practical process steps are as follows: 1. Submerged electrode arc furnace reduction of quartzite and carbon reducing agent of coal, coke, and wood chips to metallurgical grade silicon. If quartzite is SiO 2 then the reduction process is SiO 2 + 2C = Si + 2CO 2. Conversion of metallurgical silicon by chlorination into trichcorosilane via a fluidization bed reaction with anhydrous HCL: Si + 3HCl = SiHCl 3 + H 2 3. This trichlorosilane (SiHCl 3 ) is further subjected to severe purification processes. 4. Trichlorosilane (in this forth step is treated with Hydrogen in a process called chemical Vapour Deposition. The process is; SiHCl 3 + 2H2 = 6HCl + 2Si Float Zone Growth Silicon is heated to a molten state and drained into a vertical poly silicon rod. RF heating process is used to keep the silicon in molten state continuously. The molten zone is freely suspended by surface tension and RF levitation forces. In these process particles of the container does not contaminate the silicon to obtain exceptional purity. Float zoning takes two processes, first process involves the molten zone is produced at the end of the silicon rod placed in a vacuum, the rod shown moved through its length to further purify the silicon rod. Here the impurities are segregated and by evaporation particularly the volatile one. The second process is carried out under partial pressure of an insert gas (argon). Here a seed crystal is attached to the lower end of a driven shaft and to slowly move the rod with the seed crystal vertically up, keeping the seed crystal always at the surface of the molten zone. This produces single crystal silicon. The driving shaft are rotated independently for uniform thermal distribution
107 1.7 CZOCHRALSKI GROWTH This process is similar to that of the process used for germanium. The only difference is that both the top rod and the base in Czochralski growth are rotated. The arrangement shall be treated in the third part of this article. 1.8 COMPOUND SEMICONDUCTORS A compound semiconductor is that in which two or more element are combined to form a single semiconductor material: The basic difference between the growth of elemental and compound semiconductors are as follows: 1. The difficulty of maintaining stoichiometry the correct chemical ratio of the continent species, since one component is usually highly volatile than the other. 2. Achieving high crystalline perfection for semiconductor with lower thermal conductivities critical resolved shear stress, and stacking fault energies than elemental silicon, following are the techniques used for producing crystal of compound semiconductors. 1. Purification and Synthesis Slowly reacting the two components in a thick walled quartz tube in a horizontal furnace. 2. Horizontal Bridgeman/Gradient Freeze Techniques This usually is a two step processes: 1. By exothermic reaction in a sealed heavy walled quartz tube. 2. A boat is loaded with the compound with its crystal seed at one end. This boat is contained in a heavy-walled quartz tube within a furnace. Moving the boat from low temperature to very high temperature. There are other method like vertical gradient freeze, Liquid Encapsulated Czochralski Technique. 1.9 WAFER PREPARATION Wafer specifications are varied: diameter, thickness, primary and secondary orientation, flats location, orientation (on- orientation or up to several degrees off- orientation, wafer flatness, etc. In another category issues like tapper and bow which are dictated by the use of submicrometer lithography are specified. I stated earlier that the molten mix is passed through crystallization process described earlier; forming a cylindrical ingot. To form wafers, the cylindrical ingot is cut with diamond saws into thin circular wafers. Some authorities quote the thickness of the wafer as between 250 to 400 and put the diameter from 1 to 3 inches.
108 1.10 CONCLUSION I have touched on possible sources of semiconductor materials in Nigeria but the determination of what semiconductor comes out of which site is a matter of actually mining on a particular site. The presentation here is less of theories and focus is on the practical ways of realizing the goal of semiconductor materials production which will pave way for micro- and nanoelectronics manufacture in Nigeria. The most approximate appropriate technological methods to achieve this objective shall be arrived at in subsequent researches and articles. REFERENCES 1. Charles A. Haper ( 1970), Handbook of Materials and Processes for Electronics 1 st Edition, Mc-Graw Hill, Maryland, 2. Charles A. Harper and Ronald M. Sampson (1993), Electronic Materials and Processes Handbook. 2 nd Edition, McGraw Hill, Inc. 3. Cheng T. Wang (1990), Introduction to Semiconductor Technology 1 st Edition, John Wiley & Sons, Inc. 4. Dal Koshal (1993), Manufacturing Engineer s Reference Book 1 st Edition, Butterworth Heinemann. 5. C. D. Gribble, Rutley s Elements of Mineralogy, 27 th Edition CBS Publishers and distributors Donald G. Fink and Donald Chriatiansen (1989), Electronic Engineers Handbook 3 rd Edition, McGraw Hill, Inc. 7. Mark E. Hazen (1991), Exploring Electronic Devices 1 st Edition, Sounders College Publishing, Florida, 8. Paul Horowitz and Windfield Hill (1997), The Art of Electronics 2 nd Edition, Cambridge University Press, Cambridge. 9. R. J. Rajput (2004), Material Science and Engineering 3 rd Edition, S. K. Kataria and Sons, Reprint: William F. Smith and Javad Hashemi (2006), Foundations of Materials Science and Engineering. 4 th Edition, McGraw Hill, Inc. Singapore,
109 ANTIFERTILITY EFFECT OF SOME PLANT LEAF EXTRACTS ON THE PROLIFIC BREEDING OF OREOCHROMIS NILOTICUS *1 Obaroh, I. O. and 2 Nzeh, G. C. 1 Department of Biological Sciences Kebbi State University of Science and Technology, Aliero, Kebbi State,Nigeria 2 Department of Zoology, University of Ilorin, P.M.B 1515 Ilorin, Kwara State,Nigeria ABSTRACT The major problem in tilapia culture is in their prolific breeding habit; which usually results into overpopulation in the culture system thus leading to stunted growth. Effect of crude extracts of Azadirachta indica, Psidium guajava and Mangifera indica leaf on reproduction of Oreochromis niloticus was investigated. One hundred and eighty fish (per plant leaf extract) of approximately the same mean weight were grouped into 6 (Represented as; D1, D2, D3, D4, D5 and D6) and stocked in out-door concrete tanks. Fish were fed 3% of their body weight for 56 days with basal diet (35% crude protein) containing varying concentrations (0.0, 0.5, 1.0, 2.0, 4.0 and 8.0 gkg 1 ) of the leaf extracts. There was significant difference (p 0.05) in the hatchling counts of Oreochromis niloticus fed crude extract of A. indica and M. indica with complete inhibit on reproduction at 1.0 and 2.0 gkg 1. Hatchling counts of crude extract of P. guajava leaf showed no significant difference (p 0.05), thought gradual decrease in the hatchling counts were observed as the concentration of the leaf extract in the diets increases. This infers that A. indica and M. indica could be used effectively to control prolific breeding associated with tilapia culture. Keywords: Prolific, breeding, concentrations, plant extracts, culture. INTRODUCTION Tilapia, an African freshwater fish belong to the family Cichlidae with over 100 species. Culture of tilapia could be found across most countries of he world (Balarin and Hatton 1979), this is because they possess attributes that makes it suitable for culture amongst which are; high tolerance to environmental conditions, ability to withstand wide range of salinity, converts food efficiently and high yield potentials (Ridha, 2006). Tilapia culture is however fraught with the problem of prolific breeding which usually lead to over population in the culture system and stunting in growth of the fish species. Oreochromis niloticus had been reported to reach sexual maturity at about 20 g of body weight, breeding in small size in tilapia had also been observed to divert energy from growth into reproduction which involves territorial/courtship behavior and the metabolic cost of gametes formation. Furthermore the progeny produced by the stocked fish compete for available space and food resources, thereby limiting the growth of the stocked fish, especial in ponds where space and food quickly becomes limiting (Mairs and Little 1991). For efficient and sustainable development of tilapia culture, the prolific breeding needs to be reduced or stopped. The various methods that had been used to controlling reproduction in tilapia includes; intermittent harvest, high density effect, manual sexing, use of predators, cage culture, sterility and hybridization (Mairs and Little 1991) are not without their shortfalls; for example wide spread adoption of hybridization had been found to possibly lead to introgression of tilapia species with deleterious implications for the conservation of tilapia genetic resources, hormonal sex reversal had been observed to have negative effects on human health, furthermore its use had been prohibited in some countries of the world, while achieving 100% manual sexing had been found not to be possible, thus the need to search for alternative.
110 Several plant materials had been reported to possess properties that prevent conception when administered orally amongst which are; Jatropas curcas, Carica papaya, Azadirachta indica, Psidium guajava, Curcuma longa, Gossypium herbaceium, Dioscora esculenta, Mangifera indica etc., (Bodhankar, et al., 1974; Lohiya and Goyal, 1992; Goonasekera, et al., 1995; Purohit and Daradka, 1999; McNeil et al., 2003 and Aliyu, 2007), most of these herbs were observed to have interfered with normal sperm production or motility. Antifertility drugs usually act as antiimplantation, abortifacient, antizygotic, blastocystoxic, postcoital antifertility, antiandrogenic or antispermatogenic agent when administered orally thus, suppressing or inhibiting reproduction. Azadirachta indica is an evergreen tree, with densed crown, the leaves which are globrous are divided into leaflets, matured leaf is asymmetric with dentate margins except for the base of the basicopal half, which is strongly reduced and cuneate or wedged shaped (Bokhari and Aslam, 1985). Mangifera indica tree has simple alternate evergreen leaf, they are dark green when matured (Wikipedia.org). Psidium guajava is a low evergreen tree or shrub with wide- spreading branches and square downy twigs (Ayensu, 1978), the leaf is aromatic when crushed. Extract of A. indica leaf have been reported to cause sterility in rats (Dixit et al., 1992; Shaikh et al., 1993; Khillare and Shrivastav 2003), extract of Mangifera indica leaf was observed to reduce the number of litter in rats (Ibraheem et al., 2007). Extract of Psidium guajava leaf had also been reported to possess antiimplantation substance in white mice (Sri Retno et al., 2008), there are few report on the effects of these plant extracts on the reproduction of Oreochromis niloticus (Obaroh and Nzeh, 2010; Obaroh and Achionye-Nzeh, 2011, 2012). The use of plant extract could be a possible solution that could be used to control prolific breeding in O. niloticus. MATERIALS AND METHODS Study Locations The study was carried out at the Hatchery Farm of Ministry of Agriculture and Natural Resources, Ilorin, Kwara State. It is on the latitude 8 30'N and longitude 4 23'E. Acquisition of Fish Oreochromis niloticus for this research work were obtained from the Hatchery Farm of Ministry of Agriculture and Natural Resources, Ilorin, Kwara State. Extraction of Plant Leaf The fresh plant leaf of Azadirachta indica, Mangifera indica and Psidium guajava obtained within Ilorin metropolis, were authenticated in the herbarium section of the Department of Plant Biology, University of Ilorin, Kwara state. The plant leaf were shade dried for two weeks before grinding with a blender, 100 g of ground leaf was soaked in 500 ml ethanol for 24 hours with constant shaking at intervals as described by Musa et al., (2000). It was filtered using Watman filter paper, the filtrate was concentrated by drying it in the oven at a temperature of 40 C for 8 hours it was then left open for several days to obtain a jelly-like extract. The concentrated jelly-like extract was stored in clean bottle, labeled and then preserved in the refrigerator until when needed. Preparation of Experimental Diets A basal diet containing 35 % crude protein was prepared with the following ingredients; Yellow maize, Groundnut cake, Soybean meal, Fish meal, Blood meal, Cassava starch (binder), Methionine and Vitamin/Mineral premix. All ingredients were weighed and hand mixed in a bowl after which, each of the inclusion levels (0.0, 0.5, 1.0, 2.0, 4.0 and 8.0 g) of the plant extracts were also weighed, and then mixed separately with 1 kg of the basal diet as reported by Dada and Ikuerowo (2009) with little modification. The experimental diets were further mixed in a Hobbart A-200T pelleting/mixing machine, hot water was added at interval to gelatinize the starch. All the 6 diets were pelletized with a
111 die of 2 mm in diameter, they were further air dried, kept in labeled cellophane bags and stored in the refrigerator. Experimental Design A total of 180 Oreochromis niloticus juveniles (for each set-up, 4 set-up altogether making a total of 720 O. niloticus) were divided into 6 groups representing the treatments (D1, D2, D3, D4, D5 and D6, with D1 representing the control). Each group was further divided into 3 to give a total of 18 replicates consisting 10 fishes per replicate, 5 males and 5 females according to Ekanem and Okoronkwo (2003). Each group of 10 fishes were stocked in outdoor concrete tanks ( m) supplied with 450 litres of water (Plate 5). The fish were fed 3 % of their body weight, 1.5 % between the hours of h and 1.5 % between the hours of h. Diet ratio were adjusted based on the weight obtained weekly. Water in each tank were replaced weekly. The same experimental design was used for each of the plant extracts administered independently at various times (3 set-up altogether). The study lasted for 24 weeks with each set up having 8 weeks per plant. Determination of Dissolved Oxygen, Temperature and ph The dissolved oxygen, temperature and ph of the water in tanks were determined bi-weekly viz: Temperature The water temperature was taken using mercury-in-glass thermometer. By dipping the thermometer to about cm depth, the reading was taken at the point where the mercury thread became static. ph The water ph was determined using ph meter, before use the ph was standardized using ph 4, 7 and 9 buffer solutions. Water samples from the 6 groups were collected in clean labeled reagent bottles, 60 ml of the water was measured into a clean beaker, the probe was then dipped into the water, the reading was recorded when a steady figure was obtained. Each time a sample was determined the probe was dipped into distilled water and wiped clean before reusing again. Dissolved oxygen The dissolved oxygen in the water was determined by the Winkler s method as described by Boyd (1981). Water sample from each tank were collected using a glass stopper bottle, the bottle was dipped completely in water by avoiding contact with air, it was completely filled and the stopper replaced, immediately 1ml of Manganese sulfate solution was added just below the water surface by using a pipette, 1ml of alkaline potassium iodide solution was also added in similar manner. The stopper was inserted and the bottle was inverted several times to mix the content, the precipitate formed was allowed to settle half way before mixing again, 1ml of concentrated hydrogen tetraoxosulphate VI acid (H 2 SO 4 ) was added and shaken severally, all these were done at the concrete tanks site before the water samples were taken to the laboratory for further analysis. The samples were brought into the laboratory and allowed to settled for 5 minutes, 100ml of the sample was measured and poured into a conical flask, immediately it was titrated with N of freshly prepared sodium thiosulfate solution to a pale straw colour, 1 ml of starch solution was added resulting into a blue colour, the titration was continued until the blue colour just disappeared. The concentration of the dissolved oxygen in the water sample is equivalent to the number of millitres of titrant used, thus the total number of milliliters of titrant used before and after adding the starch solution equals the total dissolved oxygen in the sample in mg/l.
112 Statistical Analysis The data obtained were analyzed using SPSS 18.0 a statistical software package for mean, standard deviation and one-way ANOVA. Duncan s Multiple Range Test was used to test for significant differences among the means, and Student's t-test to test between two independent observations. The bar charts were determined using Excel. RESULTS Ingredients and Percentage Crude Protein Composition of Experimental Table 1a shows the ingredient composition of the basal diet obtained locally. Table 1b presents the percentage crude protein of the experimental diets incorporated with different concentrations of the A. indica, M. indica and P. guajava leaf extract, the three plant extracts at different concentrations were observed not to have significant effect on the percentage crude protein of the experimental diets. Table 1a: Ingredients Composition of Basal Diet Ingredient Treatments D1 D2 D3 D4 D5 D6 Plant extract Fish meal Yellow maize Soybean meal Blood meal Groundnut cake Vit/min premix Methionine Cassava starch Table 1b: Percentage Crude Protein Composition of Experimental Diets Treatments D1 D2 D3 D4 D5 D6 Plant (0.0 gkg -1 ) (0.5 gkg -1 ) (1.0 gkg -1 ) (2.0 gkg -1 ) (4.0 gkg -1 ) (8.0 gkg -1 ) Azadirachta indica 35.23± ± ± ± ± ±0.71 Mangifera indica 34.55± ± ± ± ± ±0.22 Psidium guajava 35.04± ± ± ± ± ±0.11 Hatchling Count of O. niloticus fed Crude Extract of A. indica, M. indica and P. guajava Table 2 shows the hatchling counts of O. niloticus fed crude extracts of A. indica, M. indica and P. guajava at varying concentrations. In the fish species fed varying concentration of A. indica, the control group (D1) bred twice with the highest hatchling count of in the 3 rd week and in the 5 th week; group fed 0.5 gkg -1 (D2) A. indica leaf also bred twice with hatchling count in the 6 th week and 35-51hatchlings count in the 7 th week. There was no breeding in groups D3, D4, D5 and D6 respectively. In the group of fish species fed varying concentrations of crude extract of M. indica leaf, three groups including the control (D1) spawned, the control group spawned twice with the highest hatchling count of in the 2 nd week and in the 4 th week, while least hatchling counts were observed in group fed 1.0 gkg -1 (D3) with hatchling count, Fish fed varying concentrations of crude extract of P. guajava
113 was observed to breed through out the groups, highest hatchling count was observed in the group fed 0.0 gkg -1 (D1) with hatchling counts, while the lowest count was observed in group fed 8.0 gkg -1 (D6) with hatchling counts. All the groups spawned twice with the exception of groups D3 and D6. Statistical analysis of the hatchling counts in groups fed varying concentrations of A. indica and M. indica showed significant difference (p 0.05) between each the groups, there was no significant difference (p 0.05) in the hatchling counts of fish fed crude extract of P. guajava. Gradual decrease in hatchling counts were observed as the concentrations of the three plant leaf extracts increase. Physico-chemical Parameters of water in Tanks used for Culture Table 3 presents some physic-chemical parameters of water in tanks used for culture of O. niloticus fed varying concentrations of crude extracts of A. indica, M. indica and P. guajava leaf. In fish group fed varying concentrations of A. indica leaf extract, the highest dissolved oxygen, temperature and ph (5.65±0.25 mg/l, 28.50±0.50 ºC and 7.70±0.05) were observed in group fed 0.0, 0.5 and 8.0 gkg -1 diets respectively (D1, D2 and D6), while the least (5.00±0.06 mg/l, 27.00±1.00 ºC and 7.51±0.03) were observed in groups fed 8.0, 1.0 and 8.0 gkg -1 diets respectively (D6, D3 and D6). In the group of fish fed varying concentrations of M. indica leaf extract, the highest dissolved oxygen, temperature and ph (5.75±0.76 mg/l, 28.33±0.58 ºC and 7.69±0.04) were observed in groups fed 4.0, 0.5 and 8.0 gkg -1 diets respectively (D5, D2 and D6), while the least (4.99±0.59 mg/l, 27.00±1.00 ºC and 7.46±0.01) were observed in groups fed 1.0, 0.0 and D4 gkg -1 diets respectively (D3, D1 and D4). In the group of fish fed varying concentrations P. guajava leaf extract, the highest dissolved oxygen, temperature and ph (5.70±0.23 mg/l, 27.17±0.76 ºC and 7.60±0.03) were observed in groups fed 8.0, 0.5 and 8.0 gkg -1 diets respectively (D6, D2 and D6), while the lowest (5.25±0.05 mg/l, 28.50±0.50 ºC and 7.42±0.25) were observed in groups fed 2.0, 4.0 and 0.0 gkg -1 diets respectively (D4, D5 and D1). Statistical analysis of the mean values of dissolved oxygen, temperature and ph showed no significant difference (p 0.05) within the groups except the ph ((p 0.05)) of water in tanks used to culture fish fed with varying concentrations of crude extracts of M. indica and P. guajava leaf.
114 Table 3: Hatchling Counts of O. niloticus fed crude extract A. indica, M. indica and P. guajava Azadirachta indica Mangifera indica Psidium guajava Groups/Concns Range Mean Period Range Mean Period Range Mean Period (wk) (wk) (wk) D1 (0.0 gkg -1 ) ±47.52 a 3 rd ±38.11 c 2 nd ±33.13 a 3 rd ± th ± th ± th D2 (0.5 gkg -1 ) ±27.54 b 42.75± th 7 th ±27.10 b 3 th ±48.57 a 76.98± nd 4 th D3 (1.0 gkg -1 ) ±12.50 a 5 th ±33.42 a 3 rd D4 (2.0 gkg -1 ) ±37.51 a 70.33±4.16 a 3 rd 4 th D5 (4.0 gkg -1 ) ± ±15.50 a 2 nd 3 rd D6 (8.0 gkg -1 ) ±24.25 a n = 3. Values in each column with the same superscript are not significantly different (p > 0.05). 4 th Table 3: Some Physico-chemical Parameters of water in tanks used to culture Oreochromis niloticus fed crude extract of the three plants D1 (0.0 gkg -1 ) D2 (0.5 gkg -1 ) D3 (1.0 gkg -1 ) D4 (2.0 gkg -1 ) D5 (4.0 gkg -1 ) D6 (8.0 gkg -1 ) DO (mg/l) Temp. ( 0 C) ph 5.63±0.25 a 28.00±1.00 a 7.51±0.05 a 5.58±1.06 a 28.50±0.50 a 7.62±0.28 a 5.40±0.30 a 27.00±1.00 a 7.59±0.10 a 5.37±0.30 a 27.5±0.50 a 7.58±0.07 a 5.65±0.25 a 28.00±1.53 a a 5.00±0.06 a 27.50±0.5 a 7.70±0.05 a 5.33±1.07 a 5.17±0.57 a 4.99±0.59 a 5.40±0.50 a 5.75±0.76 a 5.50±0.43 a 27.00±1.00 a 28.33±0.58 a 28.17±0.76 a 27.33±0.58 a 28.33±1.57 a 27.00±1.00 a 7.51±0.21 a 7.48±0.08 a 7.50±0.04 ab 7.46±0.01 a 7.58±0.06 ab 7.69±0.04 c n = 3. Values in each column with the same superscript are not significantly different (p > 0.05). 5.60±0.65 a 5.45±0.49 a 5.38±0.33 a 5.25±0.05 a 5.49±0.07 a 5.70±0.23 a 27.50±0.50 a 27.17±0.76 a 28.00±1.00 a 28.33±0.58 a 28.50±0.50 a 27.33±0.58 a 7.42±0.25 a 7.54±0.05 b 7.58±0.02 b 7.61±0.08 b 7.59±0.15 b 7.60±0.03 b
115 DISCUSSION The crude leaf extracts of A. indica and M. indica leaf significantly inhibited prolific breeding in O. niloticus. The varying concentrations of crude extract of A. indica leaf resulted in the reduction of hatchlings count in O. niloticus fed 0.5 g/kg diet while no reproduction was observed in groups that were fed 1.0, 2.0, 4.0 and 8.0 g/kg diets respectively. The varying concentrations of crude extract of M. indica leaf also resulted in the decline in the hatchlings count of O. niloticus fed 0.5 and 1.0 g/kg diets respectively when compared with the control. The result also showed no reproduction in groups fed 2.0, 4.0 and 8.0 g/kg diets respectively. This finding is in line with the result of previous study carried out on rats, mice, rabbits and guinea pigs. Deshpande et al., (1980) reported that aqueous extract of crush green leaf caused sterility in mice, rats, rabbits and guinea pigs. Purohit and Dixit, (1991) observed inhibition of spermatogenesis in rat when neem seed oil (petroleum ether extract) at a dose of 0.5 g/kg body weight was administered. Shaikh et al., (1993) also observed antifertility effect in male rats when mg/kg dried leaf were administered to male rats for 24 days. Similar result was also observed by Ibraheem, et al., (2007) when 1 g/kg of methanolic leaf extract of Mangifera indica leaf was administered to some group of male Sprague Dawley rats that were allowed to mate with untreated female rats. Although Psidium guajava leaf had been reported to possess antifertility properties and its antiimplantation effects had already been observed on rats (Aliyu, 2007; Sri Retno et al., 2008), in the present study the varying concentrations of crude extract of P. guajava leaf had no significant effects on the reproduction of O. niloticus although slight reduction in the number of hatchlings were observed with no significant difference within the treatments as the concentration levels of crude extract of P. guajava leaf increased, suggesting that at much higher level of concentrations, P. guajava may be effective at controlling prolific breeding in O. niloticus. Recent studies showed that saponins a glycoside and one of the active photochemical substance present in most plants was responsible for the antifertility effect observed when it was incorporated into feed and fed to tilapia (Mohammed, 1996; Luckstadt et al., 2006; Kuhlmann et al., 2006; Obaroh et al., 2012). Earlier worker reported high concentration of alkaloids, saponins and tannins in A. indica, M. indica and P. guajava (Atangwho et al., 2009; Aiyelaagbe and Osamudiamen 2009; Uboh et al., 2010). Variation was observed in the dissolved oxygen, temperature and ph in all the treatments but no significant difference (p>0.05) except in the ph of water in tanks containing fish fed varying concentration of crude extracts of M. indica and P. guajava leaf. The water parameters were however within the acceptable range for tilapia culture as reported by Ross, (2000). There was no mortality during the course of this study. CONCLUSION This study is an attempt to investigate the effects of crude extracts of A. indica, M. indica and P. guajava leaf on reproduction of O. niloticus. This study infers that, for efficient and sustainable development of tilapia culture, ethanolic crude extracts of Azadirachta indica and Mangifera indica leaf could effectively be used to control prolific breeding in Oreochromis niloticus. 115
116 REFERENCES Aiyelaagbe, O. O. and Osamudiamen, P. M. (2009). Phytochemical screening for active compounds in Mangifera indica leaves from Ibadan, Oyo state. Plant Sciences Research. 2(1): Aliyu, B. S. (2007). Some Ethno-medicinal Plants of the Savanna Region of West Africa: Description and Phytochemicals. Triumph Publishing Company Limited, Gidan Sa adu Zungur, Kano. 200p. Atangwho, I. J., Ebong, P. E., Eyong, E. U., Williams, I. O., Eteng, M. U. and Egbung, G. E. (2009). Comparative chemical composition of leaves of some antidiabetics medicinal plants: Azadirachta indica, Veronia amygdalina and Gongronema latifolium. African Journal of Biotechnology. 8(18): Ayensu, E. S. (1978). Medicinal plants of West Africa. Reference Publication, Algonac, Michigan. Pp Balarin, J. D. and Hatton, J.P. (1979). Tilapia: A guide to their biology and culture in Africa. University of Sterling Scotland. Pp Bodharkar, S. L., Garg, S. K. and Mathur, V. S. (1974). Effect of five indigenous plants on early pregnancy in female albino rats. Journal of Medical Research. 62 (6): Bokhari, M. H. and Aslam, K. M. (1985). Neem (Melia Azadirachta A. Juss). A useful tree in Northern Nigeria. Annals of Borno. II: Boyd, C. E. (1981). Water quality in warm water fish pond. Craftmasters Printers, Inc., Opelika. 369 pp. Dada, A. and Ikuerowo, M. (2009). Effects of ethanolic extracts of Garcinia kola on growth and haematology of catfish (Clarias gariepinus) broodstock. African Journal of Agricultural Research. 4 (4): Deshpande, V. K., Mendulkar, K. N. and Sadre, N. L. (1980). Male infertility activity of Azadirachta indica in mice. Journal of Postgraduate Medicine. 26: Dixit, V. P., Jain, P. and Purohit, A. K. (1992). Medicinal uses of neem (Azadirachta indica) in fertility regulations diabetes and atherosclerosis. Recent Advance in Medical and Aromatic Spice Crops. 2, Ekanem, S. B and Okoronkwo, T. E. (2003). Paw paw seed as fertility control agent on male Nile tilapia. NAGA Worldfish Center Newletter. 26 (2) Goonasekera, M. M, Gunawardana, V. K., Jayasena, K., Mohammed, S. G., Balasubramaniam, S. (1995). Pregnancy terminating effect of Jatropa curcas in rats. Journal of Ethnophamacology. 47 (3): Ibraheem, S. O., Olatunji-Bello, I. I. and Awobajo, F. O. (2007). Anti-fertility effect of methanolic leaf extract of Mangifera indica (mango leaves) on male Sprague Dawley rats. The Federation of American Society and Experimental Biology Journal. 21: Khillare, B. and T. C. Shrivastav (2003). Spermicidal activity of Azadirachta indica neem leaf extract. Contraception 68, Kuhlmann, M., Y. Primavera-Tirol, C. Luckstadt, R. Ampoyos, R. Remetio and Pastrana E. (2006). Effects of Quillaja saponins supplementation on growth performance and 116
117 reproduction activity of saline tolerant Tilapia (Oreochromis niloticus). Proceedings of the 7 th International Symposium on fish Nutrition and Feeding, Biarritz, France. Pp Lohiya, N. K. and Goyal, R. B. (1992). Antispermatogenic effects of tolnidamine in Langur (Presbytis entellus). Indian Journal of Experimental Biology. 30(11): Luckstadt, C. P. Kuhlmann and Y. Primavera-Tirol. (2006). Benefits of saponin supplementation to tilapia. Feed Mix. 14 (5): Mair, G. C and D. C Little (1991). Population Control in farm tilapia. NAGA ICLARM Quarterly. 17(4): McNeil, R.T, C.C Noronha, J.O Kesumiju and A.O. Okanlawon (2003). The anti ovulatory effect of seed extracts of Ricinus communus Linn. Nigerian Journal of Health and Biomedical Science. 2 (1): Mohammed, S. D. S (1996). A review of plants with antifertility activity. Journal of Medicinal and Aromatic Plant Science. 18, Musa, K. Y, A. Ahmed, H. Ibrahim, G. Arowosaiye and O. S. Olonitola (2000). Phytochemical and antimicrobial studies of leaves of Acalypha racemosa. Nigerian Journal of Natural Products and Medicine. 4, Obaroh, I.O. and Achionye-Nzeh, G.C. (2010). Effect of Mangifera indica Leaves Extract on Growth Response of Oreochromis niloticus. Journal of Biological Sciences and Bioconservation. Vol 2, Obaroh, I. O., Nzeh, G. C and Oguntoye, S. O. (2012). Control of Reproduction in Oreochromis niloticus (L) Using Crude Extract of Azadirachta indica Saponin. Advances in Environmental Biology. 6 (4): Obaroh, I. O. and Achionye-Nzeh, G. C. (2011). Effects of Crude Extract of Azadirachta indica Leaves at Controlling Prolific Breeding in Oreochromis niloticus (Linnaeus, 1758). Asian Journal of Agricultural Research 5 (5): Obaroh, I. O., Nzeh, G. C and Oguntoye, S. O. (2012). Control of Reproduction in Oreochromis niloticus (L) Using Crude Extract of Azadirachta indica Saponin. Advances in Environmental Biology. 6 (4): Purohit, A and Daradka, H. M. M. (1999). Effect of fixed oil of Nigella sativa on male fertility in normal and hyperlipidemic rats. Indian Drugs 36 (2): Purohit, A. and Dixit, V. P. (1991). A review on medicinal plants exhibiting antifertility activity in males. Neem Newsletter. 8 (2): Ridha, M. T. (2006). Tilapia Culture in Kuwait: Constrains and Solutions. NAGA International Center for Living Aquatic Resources Management Quarterly. 29 (3-4): Ross, L. G. (2000). Environmental physiology and energetic. In Tilapia: biology and exploitation (Editors, M. C. M. Beveridge and B. J. McAndrew) Kluwer Academic Publishers. UK. Pp
118 Shaikh, P.D., Manivannan, B., Patham, K. M., Kastrim, M. And Ahmed, R. N. (1993). Antispermatic activity of Azadirachta indica leaves in albino rats. Current Science. 64 (9): Sri Retno, D. A., Endang, S., Elfi, V. H. S. and Setiyani, S. (2008). Activity test of guava (Psidium guajava) leaf methanol extract as contraception antifertility to white mice (Rattus norvegicus). Indian Journal of Chemistry, 8 (2): Uboh, F. E., Okon, I. E. and Ekong, M. B. (2010). Effect of aqueous extract of Psidium guajava leaves on liver, enzyme, histological integrity and haematological indices in rats. Gastroenterology Research. 3 (1):
119 PLANT LET REGENERATION FROM LEAF EXPLANTS THROUGH ORGANOGENESIS IN BITTER MELON (MOMORDICA CHARANTIA L.) SAMMAIAH.D 2 SRILATHA.T 4, SRINIVAS.T1, SRINIVAS.A1, ANITHA DEVI.U 3 AND *UGANDHAR.T 1 1 Department of Botany, SRR Govt. Degree& P.G College Karimnagar (A.P.) India. 2 Department of Botany, Govt Degree College Huzurabad (A.P.) India 3 Department of Botany, Govt. Degree &P.G.College for Women Karimnagar (A.P.) 4Department of Botany, Govt. Degree &P.G.College for Women Warangal (A.P.) ABSTRACT Efficient plant regeneration via organogenesis was established using leaf explant. Callus cultures from the leaf explants were tested for growth and organogenic capacity on MS medium fortified with different concentrations and combination of 2,4-D with BAP and 2,4-D with TDZ. The maximum morphogenic callus induction rate (65%) was observed from leaf explant by culturing in MS medium supplemented with 2.5 mg/l 2,4-D mg/l BAP when compared to 2.5 mg/l 2,4-D mg/l TDZ (63%). High frequency shoot regeneration (75%) from leaf derived callus was observed on MS medium supplemented with 2.5 mg/l 2,4-D and 3.0 mg/l TDZ. At the end of 3 weeks the regenerated shoots were transferred on the same medium (MS mg/l 2,4-D mg/l TDZ) for further proliferation and elongation. The regenerated shoots were rooted with high frequency (60%) in MS medium supplemented with 1.5 mg/l IBA when compared to other auxin NAA. The in vitro raised plantlets were successfully established in green house and transplanted to natural conditions with 70% survival. KEY WORD:- In vitro, organogenesis, Thiadiazuron, Rhizogenesis, bitter melon. INTRODUCTION:- Cucurbits belong to the family Cucurbitaceae and consist of about 118 genera and 825 species, according to the last taxonomic treatment 1 Cucurbits are among the most important plants supplying humans with edible fruits and useful seeds. Plants of this 119
120 family are very similar in above ground development, but they have high genetic diversity for fruit, shape and other characteristics, resulting in a variety of uses. The most important cultivated genera bitter gourd (Momordica charantia L.) is the summer vegetable grown extensively throughout the country and covers an area of about 5697 ha with an annual production of about tons in the country 2 which serve as the main source of nutrition, energy, valuable vitamins and minerals. A good micropropagation protocol could reduce the cost of hybrid seed production, which can account for 30% of the total seedling cost. The commercial application of in vitro techniques in cucurbitaceous taxa has been well demonstrated and the regeneration of plants has been reported from excised cotyledons 3,4,5,6,7and 8 leaf explants 9,10,11 and 8 The present communication describes in vitro multiple shoot regeneration from Leaf explants, and the rooting and successful greenhouse establishment of bitter melon. MATERIAL AND METHODS:- The seeds of Bitter melon (Momordica charantia. L.) were collected from Agriculture Research Institution Karimnagar (A.P) India. These seeds were washed in running tap water for three minutes and then washed repeatedly in double distilled water Bitter melon (Momordica charantia. L.) Now under aseptic conditions the seeds were surface sterilized with 70% ethanol for one minute followed by a twenty minute treatment with 2% sodium hypochloride and washed with sterilized triple distilled water five times followed by 0.1% Mercuric chloride (HgCl 2 ) for five minutes and rinsed five times in sterile distilled water. The sterilized seeds were then placed on MS basal medium 12 solidified with 0.8% bacto agar for germination in 250 ml culture bottles, 20 seeds were cultured per bottle containing 30 ml of medium. This was incubated in dark at 26 o C till it germinated and then transferred to cool-white-fluorescent light room and incubated at 24+2 o C and allowed to grow. The plant after reaching a height of 6 centimeters was taken in an aseptic condition the leaf explants were excised using a sterile scalpel and cut into 6-8 mm sections. Sterilized leaf explants were cultured on MS medium supplemented with various concentrations of 2, 4-D ( mg/L) with BAP ( mg/L) and 2,4-D( mg/L) with TDZ( mg/L) (Table 1). After 3 weeks, efficient callus was induced and subcultured into fresh media with various concentrations and combinations of 2,4-D with 120
121 BAP and TDZ for developing potentially organogenic nature (Table 1). Nodular and friable calli are potentially organogenic and were sub cultured for adventitious shoot bud induction and plantlet regeneration. The regenerated shoots were sub cultured onto the same shoot induction medium after days for shoot proliferation and elongation. In vitro raised micro shoots after attaining a height of cm were transferred to MS medium fortified with different concentrations of IBA and IAA for root induction (Table 2). RESULTS:- The leaf induced efficient callus on MS medium containing 2.5 mg/l 2,4-D mg/l BAP and 2.5 mg/l 2,4-D mg/l TDZ respectively (Plate I, Fig 1 & 2 and Table 1). Highest growth response was obtained with 2,4-D and TDZ (63%) than with 2,4-D and BAP (65%). Levels above or below this gradually decreased the frequency of callus induction. After 3 weeks, the actively growing callus were sub cultured on fresh medium of culture on the same composition of medium enhanced peripheral greening of callus inducing shoot buds (Plate I, Fig 3). Combination of 2,4-D and TDZ showed low response to callus formation compare to 2,4-D and BAP showed best results from leaf explants culture. The calli derived from leaf explants were best for regeneration and were sub cultured on MS medium with 2.5 mg/l2,4-d mg/l TDZ and 2.5 mg/l 2,4-D mg/l BAP. After 2 weeks shoot buds from green callus were regenerated to plantlets (Plate I, Fig 4). The combination of 2.5 mg/l 2,4-D and 0.5 mg/l TDZ is effective and induced minimum percentage of (36%) in plantlet formation when compared to 2.5 mg/l 2,4-D mg/l BAP (55%) (Table 1). The percentage of culture response in inducing callus and regeneration from callus derived from leaf is low when the concentration of increased to BAP/TDZ up to 3.0mg/L shoots formation were increased then 3.0 to 6.0mg/L BAP/TDZ shoots formation were decreased. The regenerated micro shoots were sub cultured on the same composition of medium for further shoot proliferation and elongation. Rooting of shoots Micro shoots (3-4 cm) developed from leaf regenerated were excised and cultured on MS medium supplemented with ( mg/L) IAA and ( mg/L) IBA. Profuse 121
 IAA compared to (1.")
 of rooting with highest")
 when compared to IBA (1.")
 per shoot (Table 2).")
122 rhizogenesis was observed on (1.0 mg/l) IAA compared to (1.0 mg/l) of IBA alone is most potential in inducing high percentage (70%) of rooting with highest number of roots per shoot ( ) when compared to IBA (1.0 mg/l) induced (54%) of rooting with highest number of roots ( ) per shoot (Table 2). Most of the shoots had produced roots within 2 weeks after placing on rooting medium. a b 122
123 c d Figure1: Plantlet induction of Leaf explants through organogenesis of Momordica charantia. L a) Initiation of callus from leaf explants on MS+ 2.5mg/l 2,4-D+3.0mg/L BAP b) Greening of callus derived from leaf explants on MS+ 2.5mg/l 2,4-D+3.0mg/L TDZ c) Multiple shoot buds developed on callus culture of leaf on MS+ 2.5mg/l 2,4- D+3.0mg/L TDZ d) In direct shoots formation on MS+ 2.5mg/l 2,4-D+3.0mg/L TDZ after six weeks Acclimatization of the plantlets After in vitro rooting the regenerated plantlets were taken out and were washed carefully to remove agar and then transferred to pots containing sterile vermiculite. Each pot was enclosed in a polyethylene bag after watering and maintained in a plant growth chamber at 25+1 C under 16-h illumination with fluorescent lamps. Bags were progressively opened weekly. After 3 weeks of field. The percentage of survival was found to be 70% and the plants were morphologically identical to the acclimatization, plantlets were transferred to large pots filled with garden soil and farmyard manure (1:1) in the open parental plants. In all experiments a minimum of three plates were cultured. Each single treatment consisted of five to ten explants per plate. Data recorded at 3 weeks included the number of shoots per explants, length of shoots and rooting were statically analyzed using one way analysis of variance. Table-1:- Frequency of callus induction and shoot regeneration from Leaf explants of Bitter melon (Momordica charantia. L) On MS medium with different concentration of auxin and cytokinin. Hormone cone % of cultures responding % of Shoot regeneration (mg/l) 2.4 D+BAP
124 D+TDZ Table-2:- Rooting ability of regenerated shoots from Leaf explants culture of Bitter melon (Momordica charantia. L) Cultured on MS medium supplemented with IAA and IBA. Growth Hormones (mg/l) Percentage of response Average no of roots IAA IBA (S.E)* ± ± ± ± ± ± ± 0.36 * Mean ± Standard Error DISCUSSION In our study, high rate of callus growth was induced on MS medium containing 2-4-D and BAP than 2,4-D and TDZ. 2,4-D is widely used for in vitro callus induction in a wide range of plant species. Combination of 2.5 mg/l 2,4-D mg/l BAP induced potentially organogenic callus from leaf explant. Levels above or below this gradually decreased the frequency of callus induction. Similar results were reported previously in 124
125 Cucurbit pepo L. 13 Moreover, there is a report of induction of organogenic calli using a combination of BAP and NAA in Citrullus vulgaris 14. Friable and creamy calli derived from leaf explants were sub cultured on (2.5 mg/l) 2,4-D + (3.0 mg/l) TDZ are suitable for acquiring green granular organogenic callus with subsequent shoot bud induction after 3 weeks. In Cucumis metuliferus and Cucumis figrei, highest regeneration frequency 15 and (92.5%) was achieved under the combination of (1.0 mg/l BAP and 0.2 mg/l TDZ) 16. Regeneration of plantlets was observed on the same medium after four weeks of subculture. Organogenic response in Cucurbitaceae is highly genotype dependent. An expressive organogenic response in cotyledon explant from Momordica charantia. L using only BA as growth regulator was reported 17. Also, organogenesis depends on the endogenous concentration of plant growth regulator. An adverse effect of prolonged in vitro cultures reduce shoot organogenesis was reported 18 and 19. Shoot bud proliferation is satisfactory by cytokinin BAP (1.0 mg/l) alone in Momordica charantia. L 20. Among different concentration it was concluded that (2.5 mg/l 2,4-D) with (3.0 mg/l) TDZ was impressive and best suitable phytohormones for shoot regeneration from leaf explants of Momordica charantia. L. Further an increase or decrease of this hormone level showed a negative trend in multiple shoot formation. In our studies, TDZ at low concentration (0.5 mg/l) increased shoot differentiation and marked effect on the quality of regenerated plants when compared to BAP. At higher level of TDZ lead to undifferentiated hard green callus development. In the present investigation rooting occurred in all concentrations, but with different rooting percentages. Highest numbers of roots were produced at (2.0 mg/l) IBA and (1.5 mg/l) IAA. When exposed to high concentration above (3.0 mg/l) IBA/ IAA shoots become necrotic, lost leaves and the shoot tips died gradually. While at lower below (1.0 mg/l concentration of IBA and IAA low frequency number of roots was induced. The present study reveals that auxin, IBA is better than IAA in inducing rooting ability. Among all plants growth regulators, IBA is widely used for root induction in Cucurbits 21, while IAA is also used 22. Efficient rooting was achieved in Trichosanthes dioica at different concentration if IBA (0.5 mg/l) and NAA (2.0 mg/l) 23. Variation in rooting response may be a result of genotype or culture conditions. Subsequently, the rooted plantlets were 125
126 removed from agar medium, washed thoroughly and placed in soil pots after 2 weeks for acclimatization and initial hardening under culture room conditions. Almost 70% of these regenerants survived and developed new branches and were ready for planting in the field for further growth. The importance of Momordica charantia. L. as a medicinal cucurbit is growing up substantially with increasing and stronger reports in support of its multifarious therapeutic uses. Medicinal plants are the most important source of life saving drugs for the majority of the world s population. Greater demand for these plants especially for the purpose of food and medicine is one of their rapid depletion from primary habits 24. In the present study, shoot induction and plantlet regeneration from leaf explant is the best and first report to our knowledge on large scale multiplication in a short period of time for conservation of medicinally important species Momordica charantia. L. REFERENCES:- 1. JEFFERY C (1990). Biology and utilization of the Cucurbitaceae. Ithaca and London: Cornell Univ., ANONYMOUS (2005). Agri. News. Habib Bank Ltd: Special issue; Vegetable production in Pakistan: Area and production, p HALDER T AND GADGIL VN (1982). Morphogenesis in some species of the family cucurbitaceae. In: Rao AN (ed.). Tissue Culture of Economically Important Plants. pp Singapore: Natl. University. 4. GAMBLEY RL AND DODD WA. (1990). An in vitro technique for the production of de novo multiple shoots in cotyledon explants of cucumber (Cucumis sativus L.). Plant Cell Tissue Organ Cultue, 20: GAMBLEY RL AND DODD WA. (1991). The influence of cotyledon in axillary and adventitiousshoot production from cotyledonary nodes of Cucumis sativus L. (cucumber). J Exp Bot, 42: SINGH MN KATHAL R AND BHATNAGAR SP. (1990). Regeneration of plants from hypocotyl and cotyledon cultures of Cucumis melo cv pusa Maduras. Phytomorphology, 40:
127 7. SINGH MN MISHRA AK AND BHATNAGAR SP. (1996). In vitro production of plants from cotyledon explant of Cucumis melo L. and their successful transfer to field. Phytomorphology, 46: STIPP LCL MENDES BMJ PIEDADE SMDS AND RODRIGUEZ APM. (2001). In vitro morphogenesis of Cucumis melo var. inodorus. Plant Cell Tissue and Organ Culture, 65: KATHAL R BHATNAGAR SP AND BHOJWANI SS. (1988). Regeneration of plants from leaf explant of Cucumis melo cv. pusa sharbati. Plant Cell Reports, 7: MISHRA AK AND BHATNAGAR SP. (1995). Direct shoot regeneration from the leaf explant of cucumber (Cucumis sativus L.). Phytomorphology, 45: Kumar HGA Murthy HN and Paek KY. (2003). Embryogenesis and plant regeneration from anther cultures of Cucumis sativus L. Scientia Hort 98: MURASHIGE T AND SKOOG F. (1962). A revised medium for rapid growth and bioassays with tobacco tissue culture. Physiol Plant, 15: LELJAK LEVANIC D, BAUER N, MIHALJEVIC. S & JELASKA S (2004) Somaticembryogenesis in pumpkin (Cucurbita pepo L.). Control of somaticembryo development by nitrogen compounds. J. Plant Physiol. 161: SRIVASTAVA R, ANDRIANOV V.M & PIRUZIAN.V.S.(1989) Tissue culture and plantregeneration of watermelon (Citrullus vulgaris Schrad. Cv. Melitopolski) Plant cell Rep. 8: OTCZYK, W. NADOLSKA G-ORCZYK S & MELEPSZY S (1988). Plant regeneration of wildcucumis species. Acta Societatis Botanic Orum Polonice. 57 (2): DRIKS R & BUGGENUM M.V. (1989). In vitro regeneration from leaf and cotyledonexplantsof Cucumis melo L. Plant cell Rep. 7: DABAUZA M. ( 1995) Seleccion Y caracterizacion de hirbrides somaticos Cucumis melo L. (+)Cucumis anguria L. var. longipes, Cucumis melo L. (+) Cucumis myriocarpus Naud y Cucumis melo L. (+) Citrullus colocynthis (L.) Schard. 272 ff. Tesis (Doctorado en Ciencias Biologicas), E.T.S.I.A. Universidad Politecnica de Valencia, Espana. 127
128 18. JURETI B & JELASKA. S (1991) Plant development in long-term embryogenic callus lines of Cucurbita pepa. Plant Cell rep. 9: CHOI, P.S, SOLI W.Y, KIM Y.S, YOO O.J.AND LIU J.R ( 1994). Genetic Transformation and Plant Regeneration of watermelon using Agrobacterium tumefaciens. Plant Cell Rept. 13: READ P.E AND YOUNG Q (1987). Novel plant growth regulator delivery system for in vitro culture of horticulture plants. Acta Hort. 212: SAROWAR S. OH H.Y,HYUNG N.I MIN, B.W (2003). In vitro microprpogation of a Cucurbita interspecific hybrid cultivar a root stock plant. Plant Cell Tiss. Org. Cult. 75: KATHIRAVAN K, VENGEDESAN G, SINGER S., STEINITZ B, PARIS H & GABA V (2006) Adventitious regeneration in vitro occurs across a wide spectrum of squash Cucurbita pepo) genotypes. Plant Cell Tiss. Org. Cult. 85: KUMAR H.G.A MURTHY H.N AND PAEK K.Y.(2006) Embryogenesis and plant regeneration from anther cultures of Cucumis sativus L. Scientia Hort.,98: BORO P.S SHARMA DEKA A.C AND KALITA. M.C. (1998) Clonal propagation of Alternanthera sessilis: A biopharmaceutically potent herbal medicinal plant. J. Phytol. Res. 11: (1998). 128
129 A CONCEPTUAL FRAMEWORK OF APPLYING INFORMATION TECHNOLOGY INNOVATION FOR SOLVING SOCIETAL ISSUES/CHALLENGES: A CASE OF OBESITY VERSUS DIABETES Yekini, Nureni Asafe., 1 Olukumoro Olugbenga * Aigbokhan Edwin * 1,2 and 3 Department of Computer Technology, Yaba College of Technology, Lagos, Nigeria Abstract A social issue, challenges, ill is an issue that relates to society's perception of people's personal lives. Different societies have different perceptions and what may be "normal" behavior in one society may be a significant social issue in another society. Obesity is a prevalent social problem in today's society, with rates steadily increasing. Obesity is a medical condition in which excess body fat has accumulated to the extent that it may have an adverse effect on health, leading to reduced life expectancy and/or increased health problems. Obesity increases the likelihood of other diseases especially type 2 diabetes. An individual with Obesity challenge is likely to have diabetes. Diabetes is a chronic disease that needs to be regularly monitored to keep the blood sugar level within normal ranges. The frequent visit to the main hospital seems to be tiring and time consuming for diabetes and obesity patient. Consequents to this, the author of this paper proposed the design of web-based electronic monitoring system for monitor and management of Diabetes in obesity patients. The system will provides a daily monitoring and monthly services. The daily monitoring will includes recording the result of daily analysis and activates to be transmitted from a patient s mobile device to a central database. The monthly services require the patient to visit a nearby care center for medical examination. The result of this visit entered into the system and then synchronized with the central database. Finally, the endocrinologist can remotely monitor the patient record and adjust the treatment plan and the insulin doses if need. Keywords: Endocrinologist, Diabetes, Obesity, Social issues, electronic monitoring system, web-based, Information Technology Introduction Information technology is a contemporary term that describes the combination of computer technology (hardware and software) with telecommunications technology (data, image, and voice networks). Information Technology is at the root of information systems Yekini and Oyeyinka (2013). This information technology has become a household term and tool in every human endeavors to extend that people are learning and discovery new ways of applying 129
130 it in solving problems. There is no area of human endeavors where use of information technology is not applicable. Consequent to this I say: If there is anybody that is not IT literate either partly or fully as at year 2010 up to date, such individual is living but not existing. Because he or she is static (not moving) with the dynamic world we find ourselves. To be IT literate, an individual must be aware of the term IT and it tools, learning and obtains knowledge about IT and interact with IT tools regularly. Yekini and Lawal (2011). Information Technology is one of the major tools available in the area of application of scientific and technological innovations in solving societal issues, i.e. an issue that relates to society's perception of people's personal lives. it is important to improve the methodologies, procedure and techniques of managing as it consequents may be disastrous to the nation at large. Some social issues can result to war. Some social issues/challenges are: unemployment, as of October 2012, unemployment is social issue in United States of America as their unemployment rate becomes 7.8 percent. Dewan, Shaila. (2012). Obesity versus diabetes mellitus, a medical condition in which excess body fat has accumulated to the extent that it may have an adverse effect on health, leading to reduced life expectancy and/or increased health problems. Haslam and James (2005). The term diabetes mellitus includes several different metabolic disorders that all, if left untreated, result in abnormally high concentrations of a sugar called glucose in the blood. The main focus of this research work is on propose of conceptual framework for use of information technology innovation in monitoring and management of Obesity versus diabetes in patients so that an individual suffering such social issue don t needs to be going to hospital regularly for medical check-up as that may be time tiring, time consuming and aggravate other issues related to their current problem e.g heart disorder. The documentation of this research write-up is organized as follows; in section II, literature survey which include the collection and summary of discussion of various social issues and some area of applying computer in medicine. In Section III, we presents the system architecture and describe it modes of operations which include how it various components will work together to archive the set objective. Section IV, presents the 130
131 design and implementation of the system. And finally in section V, we present the recommendation, conclusion and highlight some future works required in application of Information Technology managing some other medical societal challenges like abortions, HIV/AIDs etc. Objective of the Study The objectives of the study are - To design and implement the Web-Based electronic monitoring system for management of obesity versus diabetics. - to add a general physician role to the system in order to balance the load with the endocrinologist; the general physician will have a preview privilege with an authority to insert new test examination. Each test examination result is associated with the doctor id for the doctor who did it. So, the endocrinologist will know who did this examination for the patient. Purpose of the study The purpose of this study is to analyze the past and current position of social challenges and to highlights how the information technology innovation can play role in management of social challenges especially the challenges associated with medical world. Research Questions Based on the overall objective stated i.e. design and implement of the Web-Based electronic monitoring system for management of obesity versus diabetics. The major research questions is to what extent will proposed system assist in managing and monitoring of the said medical social challenges. Scope and Limitation of the Project The scope of this project is within medical social challenge s and it is application is currently obesity versus diabetes as social challenges. Problem Statement The burden of obesity versus diabetes is growing with 347 million people currently affected worldwide (Danaei et al 2011) and numbers projected to increase to 552 million by In the UK, the cost to the National health Service (NHS) related to diabetes in 2002 was estimated to be around 1.3 billion a year, with most of this cost 131
132 arising from the long-term complications resulting from diabetes not being managed properly, the International Diabetes Federation (IDF) suggests that in the developed world the cost of caring for patients with diabetes is double that of the background population (International Diabetes Federation 2011). Consequents to this it is important to improve the methodologies, procedure and techniques of managing this social issue. Improving blood sugar control in patients with obesity versus diabetes can reduce the risk of death and microvascular complications which this paper is focused on. Literature Survey Social Issues This is an issue that relates to society's perception of people's personal lives. Different societies have different perceptions and what may be "normal" behaviour in one society may be a significant social issue in another society. Social issues are distinguished from economic issues. Some issues have both social and economic aspects, such as immigration. There are also issues that don't fall into either category, such as wars. Some perceives social issues are discussed below: Agism: Throughout the life course there are social problems associated with different ages. One such social problem is age discrimination. An example of age discrimination is when a particular person is not allowed to do something or is treated differently based on age. Inequality Inequality is "the state or quality of being unequal". Inequality is the root of a number of social problems where things such as gender, race and age may affect the way a person is treated. A past example of inequality as a social problem is slavery in America. Africans brought to America were often enslaved and mistreated, and did not share the same rights as the white population of America (ex. voting). Dictionary.com (2013) Abortion Abortion is split between pro choice and pro-life. Pro choice people believe abortion is a right that women have that shouldn't be limited by government. Pro life people believe personhood begins at conception so abortion is the wrongful killing of an innocent person. Valence Issues 132
133 A valence issue is typically a social problem that is uniformly agreed upon. These types of issues generally generate a widespread consensus and provoke little resistance from the public. An example of a valence issue would be incest or child abuse. Unlike a valence issue, a position issue typically outlines a social problem in which the popular opinion among society is divided. An example of a position issue is vegetarianism or veganism, due to the lack of widespread consensus from the public. Nelson, Barbara J (1986). Obesity versus Diabetes Obesity is a prevalent social problem in today's society, with rates steadily increasing. Obesity is a medical condition in which excess body fat has accumulated to the extent that it may have an adverse effect on health, leading to reduced life expectancy and/or increased health problems. People are considered obese when their body mass index (BMI), a measurement obtained by dividing a person's weight in kilograms by the square of the person's height in metres, exceeds 30 kg/m2. Haslam DW, James WP (2005). Obesity increases the likelihood of various diseases, particularly heart disease, type 2 diabetes, obstructive sleep apnea, certain types of cancer, and osteoarthritis and obesity has been found to reduce life expectancy. Haslam DW, James WP (2005). Obesity is most commonly caused by a combination of excessive food energy intake, lack of physical activity, and genetic susceptibility, although a few cases are caused primarily by genes, endocrine disorders, medications or psychiatric illness. Evidence to support the view that some obese people eat little yet gain weight due to a slow metabolism is limited; on average obese people have a greater energy expenditure than their thin counterparts due to the energy required to maintain an increased body mass. Kushner, Robert (2007), Adams JP, Murphy PG (2000). Dieting and physical exercise are the mainstays of treatment for obesity. Diet quality can be improved by reducing the consumption of energy-dense foods such as those high in fat and sugars, and by increasing the intake of dietary fiber. Anti-obesity drugs may be taken to reduce appetite or inhibit fat absorption together with a suitable diet. If diet, exercise and medication are not effective, a gastric balloon may assist with weight loss, or surgery may be performed to reduce stomach volume and/or bowel length, 133
134 leading to earlier satiation and reduced ability to absorb nutrients from food.imaz I, et al, (2008). Obesity is a leading preventable cause of death worldwide, with increasing prevalence in adults and children, and authorities view it as one of the most serious public health problems of the 21st century. Barness LA, Opitz JM, Gilbert-Barness E (2007). Obesity is stigmatized in much of the modern world (particularly in the Western world), though it was widely perceived as a symbol of wealth and fertility at other times in history, and still is in some parts of the world. Haslam DW, James WP (2005), Woodhouse R (2008). Excessive body weight is associated with various diseases, particularly cardiovascular diseases, diabetes mellitus type 2, obstructive sleep apnea, certain types of cancer, osteoarthritis and asthma. Haslam DW, James WP (2005), Poulain M, Doucet M, Major GC et al. (2006). Hate crime In both crime and law, hate crimes (also known as bias-motivated crimes, or race hate) occur when a perpetrator targets a victim because of his or her perceived membership in a certain social group. Examples of such groups include but are not limited to: racial group, religion, sexual orientation, ethnicity or gender identity. Stotzer, R (2006). Hate crime is a category used to describe bias-motivated violence: "assault, injury, and murder on the basis of certain personal characteristics: different appearance, different color, different nationality, different language, different religion. Streissguth, Tom (2003). "Hate crime" generally refers to criminal acts that are seen to have been motivated by bias against one or more of the types above, or of their derivatives. Incidents may involve physical assault, damage to property, bullying, harassment, verbal abuse or insults, or offensive graffiti or letters (hate mail). The issue is a social problem because it is widespread and affects much of our communities and the individuals who do not fit the norm. Religious, Ethnics and Political Intolerance (Intergroup Relation) Many societies all over the world have had to grapple with the problem of intergroup relations. Such concepts as apartheid, discrimination, prejudice, pogrom, ethnicity, hatred, fanaticism, intolerance, war, and terrorism, etc are terms in 134
135 common use. The Jews, the chosen people of God divided mankind into themselves and the Gentiles. The Arabs on the other hand, regarded themselves as the noblest nation in comparison with all other nations. This egoistic feeling of the nations of the Middle East resulting in intolerance and discrimination has given rise to the many years of intractable Middle East question. Ojie, A.E (2002). In relation to Nigeria, one of the greatest and most inhuman problems of intergroup relations witnessed in the country s political history is the civil war ( ). The Eastern region, under the leadership of Col. Odumegwu Ojukwu, seceded, declaring itself the Republic of Biafra. Thirty months of civil war began in July, claiming more than a million lives and devastating the Eastern region. Diamond, L (1995) Nigeria is composed of peoples with different religious, ethnic and cultural diverse backgrounds. Home to some 250 distinct linguistic groups, Nigeria has been proned to the intense politicization of ethnic and religious differences. Regional location and religion have served to reinforce the tripartite cleavage of the three dominant ethnic groups (Yoruba, Igbo and Hausa). The transfer of power from the military to civilian in 1999 witnessed a rising spate of ethnic, religious and communal conflicts with devastating consequences on lives and property. It seems as if decades of bottled up anger under military rule have suddenly exploded and found expression in violent ethnic, religious and communal conflicts... no fewer than 40 violent ethno-religious and communal conflicts were reported within the first three years of the return to civil rule in Other Social Issues Some other social issues include education, lack of literacy and numeracy, school truancy, violence and bullying in schools, immigration, and discrimination of all sorts, the role of women, gender issues, unplanned parenthood, and teenage pregnancy. Wikipedia (2013) Computer in Medicine Mycin Mycin is an early expert system, or artificial intelligence (AI) program, for treating blood infections. In 1972 work began on MYCIN at Stanford University in California. MYCIN would attempt to diagnose patients based on reported symptoms and medical test results. The program could request further information concerning the patient, as well as suggest 135
136 additional laboratory tests, to arrive at a probable diagnosis, after which it would recommend a course of treatment. If requested, MYCIN would explain the reasoning that led to its diagnosis and recommendation. Using about 500 production rules, MYCIN operated at roughly the same level of competence as human specialists in blood infections and rather better than general practitioners B.J. Copeland (2002). Despite MYCIN's success, it sparked debate about the use of its ad hoc, but principled, uncertainty framework known as "certainty factors". The developers performed studies showing that MYCIN's performance was minimally affected by perturbations in the uncertainty metrics associated with individual rules, suggesting that the power in the system was related more to its knowledge representation and reasoning scheme than to the details of its numerical uncertainty model. Some observers felt that it should have been possible to use classical Bayesian statistics. MYCIN's developers argued that this would require either unrealistic assumptions of probabilistic independence, or require the experts to provide estimates for an unfeasibly large number of conditional probabilities. Buchanan, B.G., Shortliffe, E.H. (1984). Research conducted at the Stanford Medical School found MYCIN to propose an acceptable therapy in about 69% of cases, which was better than the performance of infectious disease experts who were judged using the same criteria. This study is often cited as showing the potential for disagreement about thereapeutic decisions, even among experts, when there is no "gold standard" for correct treatment. Heckerman, D. Shortliffe, E. (1992). Virtual Doctors The Virtual Doctor is either online or offline medical doctors that see his patients non-physically via HealthSpot. The virtual doctor uses computer-based system and some ICT tools to discharge it duties. In this case doctor doesn t see his patients physically. Some of the advantages of virtual doctor are; Doctor can pay better attention to other activities since patients can consult doctor offline, patients feel like doctors pay better attention to them during virtual visits, more convenient, automatic record-keeping, increased patient engagement thanks to screen sharing, a virtual waiting room is better than the physical one, and convenient for both patient and doctor. Jonah Comstock (2012). 136
137 Telemedicine Telemedicine involves the use of ICT to deliver health care (information and services) to patients separated (from medical providers) by geographic boundaries [Bashshur, 1995]. Telemedicine is the use of telecommunication and information technologies in order to provide clinical health care at a distance. It helps eliminate distance barriers and can improve access to medical services that would often not be consistently available in distant rural communities. It is also used to save lives in critical care and emergency situations. Early forms of telemedicine achieved with telephone and radio have been supplemented with videotelephony, advanced diagnostic methods supported by distributed client/server applications, and additionally with telemedical devices to support in-home care Sachpazidis, Ilias (2008). telemedicine often refers only to the provision of clinical services while the term telehealth can refer to clinical and non-clinical services involving medical education, administration, and research Coach Newsham (2013). III. The System Architecture In this section III, we presents the system architecture and describe it modes of operations which include how it various components will work together to archive the set objective. The diagram below, figure 1 is the proposed system architecture. The proposed architecture will make up of the following sections that will be integrated together to form a whole System. 1. Users Section: There are three categories of user the user can access the system interface by logging to the system and assigned an access rights; the obesity versus diabetes patients, the Endocrinologist and general physician. This section will serve as the point of interaction between the users and proposed system. It contains the patient, the glucose meter, and the internet service that will enable the users to make connection with the system globally. The patient can manually enter daily food intake, physical activities and information about some medications and injection. The system will be design to; first alert the patient about injection time, special medicine reminder, date for medical examination and tests. And secondly also to enable patient to chat via exchanging messages with a general physician in case of emergency or inquiries. The general physician in the medical center is allowed to enter results of the HA1c (Hemoglobin A1c test is used as a standard tool to determine blood sugar control for patients with 137
138 diabetes). The endocrinologist can remotely monitor the patients status, send advises, and take an action in urgent cases. The endocrinologist is the only actor who allowed modifying the insulin doses regarding to the daily glucose reading and the result of the HA1c test. The endocrinologist can have the following functions by using the system: - Preview patient record: shows record number, patient name, patient ID, Date of birth, and phone number. - Glucose Injection: present the injection dose and whether the patient took it or not. The Endocrinologist has an ability to edit the glucose injection dose. - Physical Examination: shows the last examination date, the HA1c result and physical examination result. The Endocrinologist has an ability to enter new test result for a specific patient. - Appointments: shows the last visit, and the next visit. Sometimes the endocrinologist needs to make an urgent appointment according to some results, HA1c result for example, so the endocrinologist will have authority to make an urgent appointment by specifying the date and the priority for this appointment. - Insulin Doses: presents the doses for the insulin injection, the start date for these doses and for how many months. The endocrinologist has the ability to edit these doses and accept the changes. 2. Service Section: This will make up of Internet tools and some other information technology devices/tools such report extractor, web application servers, and smart analyzer for rendering services to the users section from database section. The service section is the core of the proposed system. It performs the services to the system units. 3. Database Section: this section will make up the databases for the system. The systems will depends on many data that make-up of databases such as: medical information s, patients' information, and users' information. 138
139 IV. Design And Implementation Section IV, presents the design and implementation of the proposed system. The design and implementation here is tentatively approved. It could be modified and change totally the period of the real implementation and design. The system environment will be designed and implemented using java programming language. And we proposed multilingual (two or more language) support with reference English language having priority over other languages. Users can set their preferred language. This preferred selection is saved in the database. Once the user logged in to the system he/she preferred language will be retrieved, and according to the preferred language the application will launched with that language. The design will be flexible to support system more languages in future. Bluetooth Connectivity technology will been used in the proposed system. The Android platform support exchanging data over a Bluetooth network stack. The proposed system will use remote communication with central database 139
140 to authenticate users log in information and also to retrieve/update patient medical information in the database. The communication process with MySQL database will be by posting data using HttpRequest. First, the application has to make a connection with a PHP script which locates in the server. This is done by use HTTP protocol. The system will provide send SMS. The patient can send SMS message to the endocrinologist throw the system. The database section will be design with PHP MySQL database, and the doctor's information will contain privilege field that will contain one of the two values: 'ENDO' for the endocrinologist and 'GP' for the general physician. If the doctor has 'ENDO' privilege, this means that he/she have higher scope of functionality. These central databases will be installed using WampServer to synchronies the information between the clients. There will be two databases: 'accounts' database and 'dms' database. 'Accounts' database contains the users log in information. The data in account database will be used to authenticate users log in information. Once the application is authenticate the user, it will connect with the 'dms' database. 'Dms' database contains all the system relational tables such as: patient, doctor, appointment etc. V. Recommendation, Conclusion and Future Research Direction In this section V, we present the recommendation, conclusion and highlight some future works required in application of Information Technology managing some other societal challenges like abortions, HIV/AIDs etc. Conclusion In this paper, we discuss A Conceptual Framework of Applying Information Technology Innovation for Solving Societal Issues/Challenges: A Case of Obesity versus Diabetes. We considered general physicians and endocrinologists as two major stakeholders in managing obesity versus diabetes. The general physician can do the medical checkups and examinations and feed the system with the results. The endocrinologist can access the system and request a report for a certain patient. He/she can modify the insulin doses and the treatment plan if needed. The architecture of the system is depends on three sections: Users Section, Service Section and Database 140
141 Section. This system if designed and implemented it will reduce the amount of regular medical checkups and examinations a patient with obesity do. Hence reduce stress on general physicians and endocrinologists. It is highly recommended that scientist and IT professional to partner with other professional in other to studying the area application of scientific and technological application in solving various societal problems. This work involves the IT professional research alone, for widely acceptability, and usability of the proposed system. It is also recommended that professional general physician and endocrinologist been carried along towards the design and implementation of the proposed system. References Adams JP, Murphy PG (July 2000). "Obesity in anaesthesia and intensive care". Br J Anaesth 85 (1): doi: /bja/ PMID B.J. Copeland (2002). Description of Mycin, retrieved May 22, Barness LA, Opitz JM, Gilbert-Barness E (December 2007). "Obesity: genetic, molecular, and environmental aspects". Am. J. Med. Genet. A 143A (24): doi: /ajmg.a PMID Bashshur, L (1995) On the definition and evaluation of telemedicine. Telemed J 1995 Buchanan, B.G., Shortliffe, E.H. (1984). Rule Based Expert Systems: The MYCIN Experiments of the Stanford Heuristic Programming Project. Reading, MA: Addison-Wesley. ISBN Coach Ceo Don Newsham., About Telehealth: Telehealth Definition, Canadian Telehealth Forum. Retrieved from Coach:Canada's Health Teleinformatics Association website on August 25, Danaei G, Finucane MM, Lu Y, Singh GM, Cowan MJ, Paciorek CJ, et al. National, regional, and global trends in fasting plasma glucose and diabetes prevalence since 1980: systematic analysis of health examination surveys and epidemiological studies with 370 country-years and 2 7 million participants. Lancet 2011; Vol. 378, issue 9785:
142 Dewan, Shaila NY Times Diamond, L Nigeria In Lepset, S.M. (ed.) The Encyclopedia of Democracy. Vol III (London: Routledge, 1995). Wikipedia, Social issues available at: Accesed may Haslam DW, James WP (2005). "Obesity". Lancet 366 (9492): doi: /s (05) PMID Haslam DW, James WP (2005). "Obesity". Lancet 366 (9492): doi: /s (05) PMID Haslam DW, James WP (2005). "Obesity". Lancet 366 (9492): doi: /s (05) PMID Heckerman, D. Shortliffe, E. (1992). "From certainty factors to belief networks". Artificial Intelligence in Medicine 4 (1): Imaz I, Martínez-Cervell C, García-Alvarez EE, Sendra-Gutiérrez JM, González- Enríquez J (July 2008). "Safety and effectiveness of the intragastric balloon for obesity. A meta-analysis". Obes Surg 18 (7): doi: /s PMID International Diabetes Federation (2011), International Diabetes Federation. IDF Jonah Comstock (2012)., Advantages of Virtual Doctor., May 8, 2013 Kushner, Robert (2007). Treatment of the Obese Patient (Contemporary Endocrinology). Totowa, NJ: Humana Press. p ISBN Retrieved April 5, Nelson, Barbara J (1986). Making an Issue of Child Abuse: Political Agenda Setting for Social Problems. ISBN Ojie, A.E Prejudice and Discrimination: A Sociological Overview of Inter-Group Relations in Nigeria. In Igun, U.A and Mordi, A.A (eds) Contemporary Social Problems in Nigeria. (Ijebu Ode: Shebiotimo Publications, 2002). 142
143 Poulain M, Doucet M, Major GC et al. (April 2006). "The effect of obesity on chronic respiratory diseases: pathophysiology and therapeutic strategies". CMAJ 174 (9): doi: /cmaj PMC PMID Sachpazidis, Ilias (2008)., Image and Medical Data Communication Protocols for Telemedicine and Teleradiology (dissertation), Department of Computer Science, Technical University of Darmstadt, Germany, 10 July Stotzer, R.: "Comparison of Hate Crime Rates Across Protected and Unprotected Groups", Williams Institute, Retrieved on "A hate crime or bias motivated crime occurs when the perpetrator of the crime intentionally selects the victim because of his or her membership in a certain group." Streissguth, Tom (2003). Hate Crimes (Library in a Book), p.3. ISBN Woodhouse R (2008). "Obesity in art: A brief overview". Front Horm Res. Frontiers of Hormone Research 36: doi: / ISBN PMID Yekini N.A., and Oyeyinka I.K. (2013), Management information System Mordern Perspectives Hasfem Publication Yekini Nureni A., and Lawal Olawale N., (2012), Information Communication and Technology Mordern Perspective Hasfem Publication ISBN:
144 DEVELOPMENT OF FUNCTIONAL AND NUTRACEUTICAL BREAD USING AQUEOUS GARLIC EXTRACT H.A.R. Suleria 1 *, M. S. Butt 2, F. M. Anjum 2 and S. Sultan 2 1School of Agriculture and Food Science, The University of Queensland Australia 2National Institute of Food Science and Technology, University of Agriculture ABSTRACT Faisalabad, Pakistan Functional foods are gaining popularity worldwide in dietary modifications owing to consumer s preference, minimum side effect and low cost. Garlic (Allium sativum), is one of the most essential herbaceous vegetables having enormous health benefits due to array of bioactive ingredients. These bioactive moieties are responsible for curing various lifestyle related disorders like obesity, diabetes, hyperlipidemia and cancer insurgence. In this context, aqueous garlic extract was prepared followed by product development with resultant extract. In light of product development (Garlic bread) was prepared by adding aqueous garlic 3 ml, 6 ml and 9 ml. Phytochemical profile of aqueous garlic bread showed total phenols, flavonols, flavonoids, beta carotene, DPPH, FRAB, ABTS ±49.01, 8.87±0.22, ±49.01, 63.63±3.01, 50.41±0.79, 10.43±0.21 and 57.05±1.13, respectively. The sensory evaluation of various bread samples was carried out by a trained taste panel to find out the effect of garlic extract on external (volume, crust color, symmetry of form, evenness of bake and character of crust) and internal characteristics (grain, crumb color, aroma, taste and texture). It was investigated that during external characteristics maximum scores for volume, crust color, symmetry and evenness of bakes were 7.90±0.21, 6.63±0.17, 3.36±0.6 and 2.33±0.1 respectively. In regard to internal parameters it was found that maximum scores for grain, crumb of color, aroma, taste and texture 12.85±0.5, 7.05±0.4, 8.05±0.5, 16.23±0.7 and 12.70±0.5 respectively. Moreover, all the scores for sensory evaluation remained in acceptable limit showing their suitability for its further utilization. Keywords: Functional foods, aqueous garlic bread, photochemistry of garlic, aqueous garlic extract and sensory attributes. INTRODUCTION Functional foods having wide range of phytochemical profile likes antioxidants, flavonoids have shown therapeutic potential against various health related disorders (Jenkins et al., 2008). The concept of diet-based therapies aimed at maximizing physiological benefits of various functional foods that require 144
145 product development (Siró et al., 2008). Product development perspectives include selection of product, viewing segments of targeted population (Pernice et al., 2009; Paradiso et al., 2008). Diet health linkage and concept of diet-based therapy have led to the introduction of functional foods. High medical care cost is also one of the prominent factors to bring attention toward functional foods and its product development to reduce diseases risk. Health claims of various functional foods are affecting the consumer s acceptance, customer satisfaction, overall quality, convenience, price, age, and lifestyle (Verbeke, 2005). Plants are the cardinal components of human diet as they not only provide energy for metabolic pathways but also act as precursor for protein synthesis, source of micronutrients like vitamins and minerals. Garlic is bulbous perennial vegetable and used for various flavor and pharmaceutical industries (Sadhna et al., 2011). Moreover, consumption of plant based foods like fruit and vegetables, cereals and nuts facilitate to improve health by reducing disease rate (Shahidi, 2009). All segments of the population like bread owing to their high nutritional value and easy digestive mechanism. Bread, a fundamental dietary element dating back to the Neolithic era, is prepared by baking in an oven. It has several advantages at retails, materials and equipment reductions, greater varieties of bread; less production space is required and also facilitates the consumers and availability of fresh bread at any time of the day (Rosell, 2009). Today, a shortage of bread is identical to hard times, while its service is a call for better life (Scanlon & Zghal, 2001). Bread is different as compared to other common foods. It is a leavened product resulting from the fermentation of sugars in wheat flour by the action of natural enzymes present in flour. Fermentation is carried out by Saccharomyces cerevisiae, under the trade name of baker s yeast. Sugar is needed for fermentation initiation while salt is required for strengthening the gluten and 145
146 controlling the action of yeast for dough expansion. Flour contains 14.5% moisture, 13% protein, 0.55% ash with a ph of while the rest of the ingredients are in percent of that amount by weight (Zanoni et al., 1994). Shortening is added to improve the slicability or machinability. Fresh bread has a brownish and crunchy crust with pleasant aroma, tender and elastic crumb, fine slicing and a moist mouth feel (Giannou et al., 2003). Storage of different cereal products like bread, biscuits etc. at 4 C for 12 and 24 h significantly increased resistant starch content. Amylose content in maize product showed a higher correlation with resistant starch than any other cereal products (Ruchi & Mini, 2011). Currently due to mechanization, increased consumer demand, convenience and extended shelf life, and large scale production have developed the aim to use functional foods like emulsifiers and antistaling agents in bread to attain such desired quality (Stampfli & Nersten, 1995). In this context, various baking technologies were introduced in order to achieve improved response to market demands (Decock & Cappelle, 2005). Dramatic changes occur in both physical and chemical properties of dough during baking. Unklesbay et al. (1981) estimated the thermal conductivity of white bread in forced air convection during heat processing. A relationship was also derived among thermal conductivity and physical properties like moisture, volume, bulk density and porosity. Rask, (1989) has reported many thermophysical properties of bread like specific heat, apparent density, thermal diffusivity and conductivity. Rheological properties for dough development are the cardinal properties for product quality and process efficacy. These properties are related to specific volume and textural characteristics of the bakery products (Phan-Thien & Safari- Ardi, 1998). The most commonly used equipment for empirical rheological measurements is farinograph (Razmi-Rad et al., 2007). The texture and density of 146
147 bakery products mainly bread and cakes are under control of their rheological parameters and vapor content improvement throughout the baking process (Dobraszczyk & Morgenstern, 2003). Fresh bread flavour is one of the essential characteristics for consumer acceptability and product recognition and these volatile flavours play cardinal role in the perception of fresh bread. The flavour perception involves entirely complex interactions between taste, sensory sensation of olfaction, and trigeminal stimuli (Lawless & Heymann, 1998). Various sensory descriptive analyses have been applied to estimate the flavour and odour impressions of foodstuff (Stone & Sidel, 2004). MATERIAL AND METHODOLOGY Garlic white hybrid variety was procured from fruit and vegetable section of Ayub Agriculture Research Institute (AARI), Faisalabad, Pakistan. The raw material was cleaned to remove the adhered dirt, dust and other foreign materials. Afterwards, the garlic cloves were separated and peeled for further analysis and for the preparation of its aqueous extract. Method to prepare garlic aqueous extract The weighted peeled garlic bulbs were meshed to obtain a fine garlic juice. Afterwards, it was homogenized in 100 ml of 0.9% cold and sterile saline solution in a blender at high speed for 15 min. Filtration of homogenized mixture was carried out with muslin cloth. Resultant aqueous extract of garlic was stored at ( 20 o C). Garlic extract of different concentrations were prepared with 0.9% saline solution. Product development (Garlic bread) Application of functional food in baking industry is one of the cardinal steps to cope the various physiological threats. It has been focused to introduce several bioactive chemical compounds in bread development. Utilization of the 147
148 bioactive moieties in bread making process to not only improves dough handling properties, freshness, shelf life but main target is to combat various maladies. Materials for bread preparation The raw materials including wheat flour, sugar, shortening, yeast etc. were purchased from the local market. Different concentration of aqueous garlic extract was used to make breads treated with garlic extract. Proximate analysis The respective protocols of AACC, (2000) were followed to estimate moisture (Method No A), ash contents (Method No ), crude fat (Method No ), crude protein (Method No ), crude fiber (Method No ) and NFE (Nitrogen free extract) of wheat flour sample. All the data organized for statistical analysis are in the form triplicate. Dough rheological studies Farinographic studies The rheological behavior of wheat flours was evaluated by running samples through a Brabender Farinograph (Brabender GmbH & Co. KG, Germany) having 50 g bowl capacity to analyze the dough behavior of sample AACC, (2000). Farinograms were collected at 500 Brabender Unit (BU) line with 50g wheat flour under controlled conditions especially temperature at (30 C). The resultant farinograms were interpreted for the rheological characteristics like water absorption, dough development time, arrival time, mixing tolerance index and dough stability. Mixographic studies Mixographic study of wheat flour sample was carried out by using mixograph having 10g capacity bowl (National Mfg. Co, Lincoln, Nebraska). Flour sample was run through mixograph by adding water following the 148
149 protocol mentioned in AACC, (2000). The peak height and dough development time were interpreted from mixograph. Garlic bread preparation The garlic breads were prepared in the Bakery Section of the National Institute of Food Science and Technology, University of Agriculture, Faisalabad, using straight-dough flour following the method AACC, (2000). Aqueous garlic extract was used in the recipe with different concentrations 0, 3, 6, and 9 ml/250g flour. Bread ingredients were blended for 5 minutes in a Hobart A-200 mixer to develop straight dough and allowed to ferment at (30 C) with 75% relative humidity for about 180 minutes. The dough was moulded and panned into 200 g test pans followed by proofing for 45 minutes at (35 C) at 85 % relative humidity. The resultant garlic bread was baked at (230 C) for 25 minutes. The garlic extract was used during the dough mixing process. Phytochemical assay of aqueous garlic bread The antioxidant extract obtained from garlic was analyzed for respective antioxidant potential following various tests including phytochemical screening and antioxidant activity. Total flavonols, tannin, flavonoids, total phenols, DPPH radical scavenging activity (1,1-diphenyl-2- picrylhydrazyl), antioxidant activity by beta carotene assay, ABTS (2,2 -azino-bis, 3-ethylbenzothiazoline-6-sulphonic acid) and FRAP (Ferric reducing antioxidant power) were assed by their respective protocols. Determination of total flavonol content The total flavonol content was estimated by adapting the method of Miliauskas et al. (2004) with slight modifications. The quercetin calibration curve was prepared by mixing 1 ml of mg ml -1 quercetin methanol solution with 1 ml of 2% aluminiumtrichloride and 3 ml of 5% sodium acetate. The absorption at 440 nm was measured after 150 min at 20 o C. The same procedure 149
150 was carried out with 1 ml of plant extract (1 mg/ml -1 ) instead of quercetin solution. Total flavonol were expressed as mg quercetin equivalent per gram of extract. Qualitative test for flavonoids For qualitative analysis of flavonoids 2 ml of aqueous garlic bread extract was taken in test tube. 1 ml of conc. KOH was added to extracts and changed in color was observed from green to yellow. Then 0.5 ml of diluted ammonia was added in the extracts followed by the addition of 0.2 ml of conc. H2SO4 that gave yellow color indicating the presence of flavonoids. Determination of tannin content To determine tannins concentration, vanillin-hcl method with slight modification was used (Bhat et al., 2007). Aqueous garlic bread extract in methanol (1 ml) were treated with 5 ml of reagent mixture composed of 4 % vanillin in methanol and 8 % concentrated HCl in methanol. After 20 min, developed color was read at 500 nm using a UV-visible spectrophotometer (Shimadzu UV-160A). A standard calibration curve was prepared using catechin ( µg ml -1 ), and tannins were expressed as mg catechin equivalent per gram of extract. Total polyphenol content (TPC) Total polyphenol content (TPC) in aqueous garlic bread extract was measured using Folin-Ciocalteu method (Singleton et al., 1999) based on the reduction of phosphotungstic acid to phosphotungstic blue. For this purpose, 50 µl of sample extract was added to 250 µl of Folin-Ciocalteu s reagent along with 750 µl of 20 % sodium carbonate solution. Volume was made upto 5 ml with distilled water. After two hours, absorbance was measured at 765 nm with UV/visible light Spectrophotometer (CECIL, CE7200) against control, having all 150
151 reaction reagents except sample aqueous extract. Total polyphenols were estimated and values were expressed as gallic acid equivalent (mg gallic acid/g). Free radical scavenging activity (DPPH assay) DPPH (1,1-diphenyl-2-picrylhydrazyl) free radical scavenging activity of sample extract was measured using the protocol of Brand-Williams et al. (1995). Different solutions were prepared by dissolving ml of sample extract in 10 ml of ethanol. A fresh solution of DPPH mixed in ethanol ( M) was prepared before measurement. 3 ml of this solution were mixed with 77 μl extract in 1cm path length microcuvettes. The resultant samples were placed in dark place for 15 minutes at room temperature and then measured the decrease in absorbance at 515nm on UV/visible light spectrophotometer. Antioxidant activity (AA) Antioxidant activity of sample was based on both oxidations of β- carotene as well as of linoleic acid. It was evaluated by method as described by Taga et al. (1984). For this purpose 2 mg of β-carotene was dissolved in 20 ml of chloroform. A 3 ml aliquot was dissolved with 40 mg linoleic acid and 400 mg Tween20 followed by the addition of distilled water (100 ml) into the β-carotene emulsion and well mixed by a vortex mixer. Aliquots of 3 ml β- carotene emulsion and 0.12 ml phenolic extracts were taken in capped culture tubes and were thoroughly mixed. The capped culture tubes were immediately immersed in a water bath and incubated at 50 C. Oxidation of β- carotene emulsion was estimated after 30 minutes by measuring its absorbance at 470 nm on spectrophotometer. Ferric reducing antioxidant power (FRAP) The ferric reducing reducing power of sample extracts was determined according to the Yuan et al. (2000) with slight modifications. Sample extracts (0.5 ml) were mixed with phosphate buffer (1.25 ml, 0.2 M, ph 6.6) and potassium 151
152 ferricyanide (1.25 ml, 1%) followed by incubation at 50 C in water bath for 20 min. Moreover sample was then cooled and mixed with 10% TCA (1.25 ml). Afterwards, sample aliquot (1.25 ml) was mixed with distilled water (1.25 ml), 0.1% ferric chloride (0.25 ml) and then left to react at room temperature for 10 min. Sample absorbance was read at 700 nm. An increase in the absorbance (A) of the reaction mixture indicated an increase in the reducing power. ABTS (2,2 -azino-bis, 3-ethylbenzothiazoline-6-sulphonic acid) Assay: For ABTS radical scavenging activity assay, the method of Roberta et al. (1999) was used. In this context, the ABTS radical was freshly prepared by adding 5 ml of a 4.9 mm potassium persulfate solution to 5 ml of a 14 mm ABTS solution and keeping the mixture in the dark room for 16 hours. This solution was diluted further with methanol and estimated an absorbance at 734 nm. The final reaction mixture (1 ml) of the standard and extract comprised 950 µl of ABTS solution and 50 µl of the extract at variable concentration (10-50 µl - 1 ). The reaction mixture was vortexed for 10 sec and then after 6 min the absorbance was recorded at 734 nm using a UV-visible spectrophotometer (Shimadzu UV-160A, Kyoto, Japan) and compared with the control ABTS solution. Sensory evaluation The sensory evaluation of resultant garlic bread was conducted by a trained taste panel to find out the effect of various levels of garlic extract on external characteristics (volume, crust color, symmetry of form, evenness of bake, and character of crust) as well as internal characteristics (grain, crumb color, aroma, taste and texture) following the procedure of Meilgaard et al. (2007). All the evaluations were conducted at room temperature under clear white light spectrum. On evaluation day, the sliced of garlic breads from all the treated levels were placed in fine crystal glass trays, labeled with at random codes at different interval of times like at 0, 24, 48, 72, 96 and 120 hours. Panelists were 152
153 provided distilled water for rinsing their mouths between the judgments of each sample. The garlic bread samples were presented at random order and panelists were requested to rate their acceptance by providing score for all the parameters. RESULT AND DISCUSSIONS Extraction of aqueous garlic extract Solvent extraction is one of the basic techniques for the isolation of active ingredients that may influenced by various factors like quantity of sample, time, solvent, ratio of solvent to material as well as temperature. All these factors are responsible for the extraction yield collectively. Analysis of wheat flour The quality of the end product depends upon its total ingredients used therefore; the analysis of straight grade flour was conducted to assess its proximate composition. Proximate composition of flour used for the bread making showed it contain moisture, ash, crude fiber, crude protein, crude fiber and nitrogen free extract 10.5±0.02, 0.51±0.01, 0.98±0.02,10.52±0.03, 0.38±0.01 and 87.61±2.34 respectively. It was reported by Salim-ur-rehman et al. (2006) that the moisture, crude protein, crude fat, crude fiber, ash and NFE contents of whole wheat and pearled wheat ranged from 8.34 to 9.21%, 9.02 to12.03 %, 1.70 to 3.50%, 1.20 to 3.90%, 1.61 to 2.21% and to 84.81%, respectively. The highest concentrations of chemical constituents were present in whole grains except moisture and NFE. 153
154 Farinographic studies The rheological properties of flour sample were determined while running through Brabender Farinograph. The main farinographic parameters like water absorption (WA), arrival time (AT), dough development time (DDT), dough stability time (DST) and mixing tolerance index were studied. The means indicated that the water absorption (WA) was 57.9±0.8%, arrival time (AT) was 1.9±0.08 min, dough development time was 4.7±0.02 min. and dough stability (10±0.13 min). As far as mixing tolerance index (MTI) is concerned, MTI was 60±2.8 BU (Table 1). Salim-ur-rehman et al. (2006) elucidated the effect of pearling on physicochemical, rheological characteristics and phytate content of wheat-sorghum flour. It was found that water absorptions, dough development times, dough stabilities, tolerance indices, softening of dough and viscosities of wheatsorghum flours ranged between %, min., BU, BU and BU, respectively. Results of farinographic study indicated by Salim-urrehman et al. (2006) were closed to our findings. Mixographic studies The flour intended for bread making was subjected to mixographic studies to assess the mixing time and peak height. The flour sample exhibited the mixing time as 5.5±0.09 min., peak height was calculated in 57.5±2.80% (Table 1). Butt et al. (1997) reported that peak height of various wheat varieties ranged from 43 to 65%. Similarly, Rasool, (2004) elucidated that addition of non wheat plant materials like cottonseeds resulted in the decrease in peak height of composite flour. It was also found that replacement of non wheat flours with wheat flours result in reduction in gluten and dough dough stability. Singh et al. (2002) also showed the decrease in peak height value of wheat flour incorporated with lactic acid and fat. 154
155 Table 1: Means for farinographic and mixographic characteristics Treatments Values WA (%) 57.9±0.8 AT (min) 1.9±0.08 DDT (min) 4.7±0.02 DST (min) 10±0.13 MTI (BU) 60±2.8 Mixing time (min) 5.5±0.09 Peak height (%) 57.5±2.80 WA= Water absorption AT= Arrival time DDT= Dough development time DST= Dough stability time MTI= Mixing tolerance index Effect of aqueous garlic extract on bread quality Bread loaves were prepared from respective flour samples containing different concentration of aqueous garlic extract and evaluated for various quality attributes. In this section discussion has been made regarding the results of volume, density, texture, moisture activity and sensory evaluation of the bread samples. Photochemical assay of aqueous garlic bread It was evident from study that maximum flavonols were observed 9.06±0.02 at 45 minutes while minimum were 7.51±0.03 at 30 minutes in aqueous extract bread. Total flavonoids were dominant at 45 minutes followed by 30 minutes 91.13±0.83, 89.70±0.95 and 88.77±0.65, respectively. Means for tannins explicated that the highest tannin content 0.89±0.04a were at 45 minutes while lowest 0.80±0.04. Maximum value of TPC was recorded ±28.10 at 30 minute while lowest values ±15.52 after 1 hour. Aqueous garlic bread exhibited 155
156 highest (DPPH) radical scavenging activity (51.13±0.55) at 45 minutes while lowest was 49.57±1.19b at 60 minutes. Similarly, it was observed that maximum beta carotene value was recorded 67.07±1.00, 62.43±0.60 and 61.40±0.66 at 45, 30 and 60 minutes respectively. The higher mean value of FRAP (10.65±0.04) was observed at 45 minutes followed by 60 minutes (10.42±0.06). Means for ABTS value regarding different time factor of 30, 45 and 60 (57.17±1.59, 58.13±1.18 and 55.87±1.60) mentioned in Table 2. Ademoyegun et al. (2010) first time reported the total flavonoids content of different cooked spices. The effect of heated spices are significant (p<0.05) for turmeric, onion and garlic. The garlic showed an increase in the total flavonoid 1 hrs at % and further heated for 2 hrs was observed for %. It was reported that heat treatment increased the level of free flavonoid (Stewart et al. 2000). For Basil and ginger the effect of heat on the total flavonoid content has no significant (p<0.05), which show that the flavonoid content is relatively stable under thermal heat. Cao et al. (1996) reported that allium vegetables (onion leaves, Chinese chives leaves, and garlic) contained quite high levels of flavonoids. Garlic contained mg/kg myricetin, 47.0 mg/kg quercetin, and mg/kg apigenin. It was also found that garlic had the highest antioxidant activity against peroxyl radical among the samples they tested. Only mg/kg of quercetin could be detected in Chinese chives leaves. Allium spp. was reported to contain high levels of quercetin and its derivatives. Yizhong et al. (2003) reported that antioxidant activity and total phenolic content of methanolic extracts from common vegetables and fruits (dietary plants) like Allium sativum (garlic) of TEAC (µmol trolox/100 g DW) and Total phenolic content (g GAE/100g DW), 55.0 and Hala and Abdou, (2011) reported that DPPH in methanolic extract of cumin, chili, garlic, cloves, onion and thyme was (60.6, 60.95, 54.7, 85.31, 43.5, and 63.24, respectively). 156
157 Table 2: Phytochemical assay of aqueous garlic bread Treatments Time 30 mint 45 mint 60 mint Means Flavonols 8.62±0.15c 9.06±0.02a 8.94±0.03b 8.87±0.22a Total Flavonoids 89.70±0.95b 91.13±0.83a 88.77±0.65b 89.87±1.19a Tannins 0.84±0.02ab 0.89±0.04a 0.80±0.04b 0.84±0.04a TPC ±19.60b ±28.10a ±15.52b ±49.01a DPPH 50.53±0.74ab 51.13±0.55a 49.57±1.19bc 50.41±0.79a Beta Carotene 62.43±0.60bc 67.07±1.00a 61.40±0.66cd 63.63±3.01a FRAP 10.22±0.04c 10.65±0.04a 10.42±0.06b 10.43±0.21a ABTS 57.17±1.59ab 58.13±1.18a 55.87±1.60bc 57.05±1.13a Means sharing same letters in a column/row do not differ significantly when n=5 at P < TPC = Total Phenolic contents DPPH= (1,1-diphenyl-2-picrylhydrazyl) FRAP= Ferric reducing antioxidant power ABTS= (2,2 -azino-bis, 3-ethylbenzothiazoline-6-sulphonic acid) 157
158 Garlic contains polyphenol and sulphur compounds, which are responsible for its antioxidant activity (AA). Yara et al. (2009) evaluated fresh garlic (FG) and its products, i.e. chopped with salt (CGS), chopped without salt (CG), fried (FRG) and mixed garlic (FG with dehydrated garlic; MG) antioxidant activity by three different methods: DPPH (1,1-diphenyl-2-picrylhydrazyl) assay and b-carotene/linoleic acid assay. Amongst all the analyzed products, fried garlic presented the highest antioxidant activity. It was found by Romson et al. (2010) that the total phenolic content of garlic, galangal, turmeric, dried chili and keang-hleung paste extracts determined by the Folin Ciocalteu method were 0.3 ± 0.02, 0.2 ± 0.01, 0.3 ± 0.06, 0.6 ± 0.06 and 0.8 ± 0.02 mg GAE/100 g respectively. The DPPH (2,2-Diphenyl-1-Picrylhydrazyl) activity of garlic, galangal, turmeric, dried chili and the paste extracts were 0.38 ± 0.07, 0.65 ± 0.41, 1.01 ± 0.34, 0.28 ± 0.65 and 1.77 ± 0.38 mg GAE/100 g, while the ferric reducing power were 0.03 ± 0.01, 0.05 ± 0.01, 0.07 ± 0.02, 0.07 ± 0.02 and 0.05 ± 0.01 mg GAE/100 g, respectively. Yizhong et al. (2003) reported that antioxidant activity and total phenolic content of methanolic extracts of common vegetables and fruits (dietary plants) like Allium sativum (garlic) contained TEAC (µmol trolox/100 g DW) and Total phenolic content (g GAE/100g DW), 55.0 and 0.20, respectively. Sensory evaluation The sensory evaluation of various bread samples was carried out by a trained taste panel to find out the effect of garlic extract addition on external (volume, crust color, symmetry of form, evenness of bake, character of crust, and break & shred) and internal characteristics (grain, crumb color, aroma, taste and texture) and results are discussed in detail hereafter. External Characteristics It was observed that addition of various garlic extracts in bread recipe and storage intervals affected the external characteristics significantly. Unlike treatments 158
159 and storage, their interaction showed non-significant impact on all of the external quality parameters. Volume Volume is one of the imperative sensory attributes of the baked products. Breads prepared with varying concentrations of garlic extract were evaluated for volume at 0, 24, 36, 48, 72, 96 and 120 hrs of storage and results are presented in (Table 3). It is obvious from the means that maximum scores (7.8±0.5) were assigned to treatment T 2 followed by 7.5±0.4 in T3 whilst the minimum (6.6±0.3d) were obtained by control (T0). An inverse correlation was observed between storage interval and bread volume as the volume of the bread decreased with the increase of storage time. Maximum scores (8.4±0.2) were acquired at 0 day while the minimum scores (6.0±0.1l) were observed at 120 hrs of storage time. Crust color Crust color is an important parameter concerning the consumer acceptability towards bread. It is revealed from the means (Table 3) that the treatments showed significant variations in the color of crust. The maximum score (6.5±0.) was obtained by T 1 followed by 6.3±0.3 in case of T 2 whereas, the minimum score (5.9±0.3) was awarded to T 3. Likewise, the maximum score (7.0±0.1) was obtained by the treatments at 0 hrs of storage followed by 6.9±0.2 at 24 hrs and minimum scores (5.4±0.3) after 120 hrs of storage. Symmetry of Form The sensory evaluation of enzyme treated bread samples was carried out to evaluate the symmetry of form at various storage intervals. The higher mean value (3.3±0.6) was observed in T 2 followed by T 3 (3.1±0.5) nevertheless, the lowest mean score (2.9±0.5) were found in T 0 during bread storage (Table 3). The symmetry of form deteriorated with the increasing storage interval and maximum score (4.1±0.2) for symmetry was assigned at 0 hrs and the minimum scores (2.0±0.1) 159
160 were recorded at 120 hrs. Higher concentration of garlic extract resulted in more loosened structure due to excessive breakdown of cellulose therefore, significant variations were observed among different treatments. Evenness of Bake The mean values for evenness of bake (Table 3) demonstrated that the maximum scores (2.3±0.1) were assigned to T 2 followed by T 3 with a mean score (2.1±0.09) however, the minimum scores (2.0±0.1) were found in case of T 0. The treatments T 1 exhibited non-significant differences with each other. For storage time, maximum score (2.3±0.2) was given at 0 and 24 hrs of storage while the minimum score (1.8±0.2) was recorded at 120 hrs. As the evenness of bake is not a function of dough or the treatments rather it depends mainly upon the personnel skills so the treatments and storage time showed non-significant results for evenness of bake. Character of Crust: The mean values (Table 3) elucidated that T 1 ranked at top with a mean score of 2.6±0.4 followed by T2 (2.6±0.3) while T0 got the lowest mean score of 2.2±0.2. An inverse relation was observed between storage intervals and the character of crust. The results for storage intervals were found to be the maximum (3.2±0.2) at initiation of the study while the minimum score (1.8±0.2) at 120 hrs of storage. It was obvious from results that bread stored at 0 and 24 hrs performed better regarding character of crust however, after 96 and 120 hrs the loaves attained minimum scores for the trait. 160
161 Table 3: Changes in external quality characteristics of prepared bread with different treatments during storage at different time intervals Hours Treatments Means Characteristics 0 hr 24 hrs 48 hrs 72 hrs 96 hrs 120 hrs Volume 7.0±0.1gh 6.8±0.2hi 6.6±0.2ij 6.5±0.2ijk 6.3±0.2jkl 6.0±0.1l 6.6±0.3d Crust color 6.5±0.2cde 6.3±0.2def 6.2±0.2efg 6.5±0.2cde 5.9±0.2ghij 5.8±0.2hij 6.2±0.2b TO Symmetry 3.5±0.2bcd 3.3±0.3cde 3.2±0.2def 2.8±0.2fghi 2.4±0.3ijkl 2.0±0.1l 2.9±0.5c Evenness 2.1±0.2ab 2.2±0.4ab 2.0±0.1ab 1.9±0.2ab 1.9±0.3ab 1.8±0.2b 2.0±0.1b Crust 2.6±0.2bcdef 2.5±0.2cdef 2.2±0.2fghi 2.0±0.3ghi 1.9±0.3hi 1.8±0.2i 2.2±0.2b Volume 7.3±0.2fg 7.2±0.2fg 7.0±0.2gh 6.8±0.2hi 6.5±0.2ijk 6.2±0.1kl 6.8±0.4c Crust color 7.0±0.1a 6.9±0.2ab 6.7±0.1abc 6.5±0.2cde 6.2±0.2efg 5.9±0.3ghij 6.5±0.4a T 1 Symmetry 3.5±0.7bcd 3.6±0.2bcd 3.2±0.2def 2.9±0.2efgh 2.5±0.2hijk 2.1±0.2kl 3.0±0.5bc Evenness 2.2±0.2ab 2.2±0.1ab 2.1±0.4ab 2.0±0.2ab 1.9±0.3ab 1.9±0.4ab 2.1±0.1ab Crust 3.2±0.2a 3.0±0.3ab 2.8±0.2abcd 2.4±0.4defg 2.2±0.4fghi 1.9±0.4hi 3.2±0.2a Volume 8.4±0.2a 8.2±0.2ab 8.0±0.1bc 7.8±0.2cd 7.4±0.2ef 7.0±0.1gh 7.8±0.5a Crust color 6.6±0.1bcd 6.5±0.2cde 6.3±0.3def 6.2±0.1efg 6.6±0.2fgh 5.7±0.3ijk 6.3±0.3b T2 Symmetry 4.1±0.2a 3.8±0.3ab 3.5±0.2bcd 3.2±0.2def 2.8±0.2fghi 2.4±0.2ijkl 4.1±0.2a Evenness 2.3±0.2a 2.3±0.3a 2.2±0.2ab 2.1±0.2ab 2.1±0.4ab 2.0±0.1ab 2.3±0.1a Crust 2.9±0.4abc 2.9±0.3abc 2.7±0.3bcde 2.5±0.1cdef 2.3±0.1efgh 2.0±0.1ghi 2.6±0.3a Volume 8.0±0.1bc 7.7±0.1cde 7.5±0.3def 7.4±0.3ef 7.2±0.3fg 6.8±0.2hi 7.5±0.4b Crust color 6.3±0.3def 6.1±0.1fgh 6.0±0.1fghi 5.8±0.2hij 5.6±0.4jk 5.4±0.3k 5.9±0.3c T 3 Symmetry 3.7 ±0.1abc 3.5±0.2bcd 3.3±0.3cde 3.0±0.3efg 2.6±0.1ghij 2.3±0.2jkl 3.1±0.5b Evenness 2.2 ±0.1ab 2.2±0.3ab 2.1±0.3ab 2.0±0.1ab 2.0±0.2ab 2.0±0.3ab 2.1±0.09ab Crust 2.8 ±0.3abcd 2.7±0.3bcde 2.5±0.1cdef 2.2±0.1fghi 2.0±0.2ghi 1.8±0.2i 2.4±0.3b Volume 7.7±0.6a 7.5±0.6b 7.3±0.6c 7.1±0.5c 6.9±0.5d 6.5±0.4e Crust color 6.6±0.2a 6.5±0.3ab 6.3±0.2bc 6.3±0.3c 6.0±0.2d 5.7±0.2e Mean Symmetry 3.7±0.2a 3.6±0.2a 3.3±0.1b 3.0±0.1c 2.6±0.1d 2.2±0.1e Evenness 2.2±0.08a 2.2±0.08a 2.1±0.08ab 2.0±0.08ab 2.0±0.09ab 1.9±0.09b Crust 2.9±0.2a 2.8±0.2ab 2.6±0.2b 2.3±0.2c 2.1±0.1cd 1.9±0.09d Means sharing same letters in a column/row do not differ significantly when n=5 at P <
162 Internal characteristics It was indicated that the treatments showed significant effect on grain, color of crumb, aroma, taste and texture. Likewise, the storage of the bread loaves resulted momentous changes in these traits. Grain The results described in (Table 4) showed considerable variations in the grain of breads. The highest score was obtained by T2 (12.8±0.5) followed by T3 (10.8±0.4) while T 0 got lowest scores (10.1±0.3). The data described that results for storage intervals significantly affected the internal parameters of bread samples. The maximum score (13.5±0.3) was secured at initiation of the trial while the minimum score (9.6±0.2) at 120 hrs of storage. Crumb color Color of the bread crumb is an important criterion for consumer acceptability. It is obvious from the means (Table 4) that T3 was at the top with maximum score 7.0±0.4 followed by T 2 with mean value 6.7±0.4 whereas, T 0 was at the bottom (6.2±0.3). It is evident from the results that the storage intervals had negative impact on the crumb color and maximum score (7.6±0.2) was assigned at beginning of the study followed by 7.3±0.1 at 24 hrs whereas, the minimum score (5.7±0.3) was observed at 120 hrs of storage. Aroma Aroma is one of the characters, which make the product liked or disliked by the consumers. The aroma showed varied results for treatments as well as for the storage periods. The means presented in Table 4 explained that the maximum score (8.0±0.5) was obtained by T3 followed by T2 (7.8±0.5) while the minimum score (5.9±0.6) was assigned to the treatment T0. The aroma of the bread loaves exhibited an inverse correlation with the storage intervals and deteriorated with advancement in time. The 162
163 highest score for aroma (8.6 ±0.2) was given to fresh bread loaves followed by 8.4±0.2 at 24 hrs whereas, at 120 hrs, the lowest mean scores (4.96±0.3) were granted for this trait. Taste There was significant variation in the bread taste due to the treatments as well as the storage time. The means (Table 4) indicated that T2 acquired the highest score (16.2±0.7) followed by T 3 (15.3±0.5) while the control (T 0 ) ranked lowest with mean score of 12.5±0.5. The progression in storage showed negative correlation with taste and it is obvious from the results that the taste was adversely affected with the passage of time. The maximum taste score (17.1±0.3) was observed at the beginning and the minimum (11.7±0.3) after 120 hrs. Texture The treatment of flour with garlic extract showed pronounced effects on the texture of bread. The maximum mean scores (12.7±0.5) were assigned to T 2 followed by T 3 while minimum mean scores (10.6±0.3) were granted to the control (Table 4). Storage time exhibited a negative correlation with texture; at 0 hrs bread texture was the best with mean scores of 13.4±0.2 and after 120 hrs mean values were the lowest (10.0±0.2) presenting the least acceptable texture. 163
164 Table 4: Changes in internal quality characteristics of prepared bread with different treatments during storage at different time intervals Treatments Hours Characteristics 0 hr 24 hrs 48 hrs 72 hrs 96 hrs 120 hrs Means Grain 10.5±0.1hijk 10.4±0.1hijkl 10.2±0.2jklm 10.0±0.1klmn 9.8±0.2mn 9.6±0.2n 10.1±0.3c Crumb color 6.6±0.2efghi 6.5±0.1fghij 6.3±0.1hijkl 6.1±0.2jklm 5.9±0.3lm 5.7±0.3m 6.2±0.3c TO Aroma 6.7±0.3ijkl 6.5±0.1klm 6.2±0.1mno 5.8±0.2o 5.2±0.2p 4.9±0.3p 5.9±0.6d Taste 13.5±0.1lmn 12.8±0.4op 12.5±0.1pq 12.2±0.2qr 11.9±0.3rs 11.7±0.3s 12.5±0.5d Texture 11.1±0.2ijk 10.9±0.3jkl 10.7±0.3klm 10.5±0.3lmn 10.1±0.2no 10.0±0.2o 10.6±0.3d Grain 11.3±0.3ef 11.1±0.4efg 10.8±0.2fghi 10.5±0.3hijk 10.2±0.2jklm 9.9±0.4lmn 10.7±0.5b Crumb color 7.0±0.1bcde 6.8±0.3cdefg 6.7±0.1defgh 6.5±0.2fghij 6.2±0.2ijkl 6.0±0.2klm 6.6±0.3b T1 Aroma 7.5±0.1efg 7.3±0.2fgh 7.0±0.2hij 6.6±0.2jklm 6.3±0.3lmn 6.0±0.2no 6.8±0.5c Taste 14.6±0.2ij 14.2±0.1jk 13.9±0.3kl 13.7±0.3lm 13.4±0.4mn 13.1±0.2no 13.8±0.5c Texture 11.5±0.3hi 11.2±0.1ij 10.9±0.2jkl 10.7±0.3klm 10.4±0.4mno 10.1±0.2no 10.8±0.5c Grain 13.5±0.3a 13.2±0.4ab 12.9±0.4bc 12.6±0.4cd 12.4±0.3cd 12.1±0.2d 12.8±0.5a Crumb color 7.2±0.2abc 7.0±0.3bcde 6.8±0.4cdefg 6.6±0.1efghi 6.3±0.3hijkl 6.1±0.3jklm 6.7±0.4b T 2 Aroma 8.4±0.3ab 8.3±0.2abc 8.0±0.2bcd 7.7±0.3def 7.3±0.3fgh 6.9±0.2hijk 7.8±0.5b Taste 17.1±0.3a 16.8±0.2a 16.3±0.3b 16.0±0.2bcd 15.6±0.4def 15.2±0.2fgh 16.2±0.7a Texture 13.4±0.2a 13.1±0.3ab 12.8±0.3bc 12.5±0.3cd 12.2±0.2def 11.8±0.2fgh 12.7±0.5a Grain 11.4 ±0.3e 11.2±0.4efg 10.9±0.4efgh 10.7±0.1ghij 10.4±0.2hijkl 10.3±0.2ijklm 10.8±0.4b Crumb color 7.6 ±0.2a 7.3±0.1ab 7.1±0.2bcd 6.9±0.2bcdef 6.6±0.2efghi 6.4±0.2ghijk 7.0±0.4a T 3 Aroma 8.6 ±0.2a 8.4±0.2ab 8.3±0.2abc 7.9±0.2cde 7.6±0.4def 7.1±0.2ghi 8.0±0.5a Taste 16.1 ±0.3bc 15.7±0.3cde 15.3±0.2efg 15.1±0.2gh 14.8±0.3hi 14.5±0.3ij 15.3±0.5b Texture 12.3 ±0.3de 12.0±0.2efg 11.7±0.3gh 11.4±0.2hi 11.1±0.3ijk 10.9±0.2jkl 11.6±0.5b Grain 11.7±1.2a 11.5±1.2a 11.2±1.1b 11.0±1.1bc 10.7±1.1cd 10.5±1.1d Crumb color 7.1±0.4a 6.9±0.3ab 6.7±0.3bc 6.5±0.3c 6.3±0.2d 6.1±0.2d Mean Aroma 7.8±0.8a 7.6±0.8a 7.4±0.9b 7.0±0.9c 6.6±1.0d 6.2±1.0e Taste 15.3±1.5a 14.9±1.7b 14.5±1.6c 14.3±1.6d 13.9±1.6e 13.6±1.5f Texture 12.1±1.0a 11.8±0.9b 11.5±0.9c 11.3±0.9d 11.0±0.9e 10.7±0.8f Means sharing same letters in a column/row do not differ significantly when n=5 at P <
165 Discussion Federica et al. (2011) reported in their study that the addition of ginger powder in the bread formula would not interfere positively on bread acceptability; in fact the sample with the lowest amount of ginger powder (3%) showed the highest value of overall acceptability. This result is different from that obtained by Shalini & Lakshami, (2005) who found that bread with 10% of ginger was well accepted. This apparent disagreement is probably due to the differences dietary habit existing between the populations tested. In our work the garlic was used instead of ginger and its pungency taste was mainly resulting from organosulphur components, probably influenced the judgement. The concentration of these active ingredients in the dry garlic is slightly lower in comparison to the fresh one, whereas the concentration of shogaols from ginger increased because the latter are formed from the corresponding gingerol during thermal processing (Ali et al., 2008). It was investigated by Yadav et al. (2010) that the wheat flour samples containing different concentration of bran and had a negative (p 0.05) effect on peak viscosity, break down and final viscosity while in oat bran had a positive (p 0.05) effect on set back and final viscosity. Addition of aqueous garlic extract at different percentage (from 0% to 9%) changes dough machinability, viscoelasticity and breadmaking performances. The dough with the highest amount of aqueous garlic extract (9%) showed the highest value of elastic modulus evaluated by fundamental rheological measurements. The results showed that 3% of aqueous garlic extract could be included in bread formulation without altering dough handling and bread rheological properties. Incorporation of garlic extract in formulation markedly increased the total phenolics content and the radical scavenging activity of bread extracts. Therefore, garlic, onion and ginger powder could be regarded as a potential health-promoting functional ingredient. Ho et al. (2011) also reported that using different formulations of turmeric powder effect the rheology of bread like the crumb color of bread with 8% turmeric 165
166 powder had the lowest liking score. Since the color of turmeric powder was light yellow, 2% substitution of turmeric powder did not interfere with the original color of the bread made with wheat. The taste and overall acceptability of breads with turmeric powder at substitution levels of 0 4% had the highest liking score. For other sensory characteristics (aroma and texture), it was also observed that there was no statistically significant difference for all samples. However, bread which contained 6% or 8% turmeric was rated comparatively lower, which might be due to excessive amounts of volatiles and phenolic compounds, which can negatively affect the taste of food (Drewnowski & Gomez, 2000). The data on exact recommended dosage of these phytochemicals is not available however different in vitro and in vivo studies have been carried out to analyze their biological effects. Maheshwari et al. (2006) summarized various studies that list the biological activities of curcumin in terms of antioxidant activity, wound healing, modulation of angiogenesis and anti-cancer activity. Further studies are needed to verify its health giving-properties in vivo, after ingestion and full digestion. Thus, it is important to choose appropriate amount of aqueous garlic extract and processing parameters to obtain a healthy baked goods (high level of antioxidants) without promoting negative effects on the rheological properties of dough and also without changing the desirable physical and sensorial characteristics of the bread. Regarding this, further and deep investigations are currently in progress in our laboratory in order to examine the overall quality characteristics of bread obtained with a garlic, ginger and onion quantity between 3 and 4.5%. CONCLUSION Functional and nutraceutical foods and their diet base regimens are gaiaging popularity owing to number therapeutic applications and their safe utilization in various product developments. The health perspectives of these functional and nutraceutical foods are due to array of bioactive moieties. Garlic (Allium sativum L., Liliaceae.) is one of the essential vegetables used not only for culinary purposes but also in herbal remedies. Conclusively, in light of product development garlic bread was 166
167 prepared with different concentrations of aqueous garlic extract. Aqueous garlic extract is a good source of phytochemicals like, antioxidants, phenols tannins along with strong profile of active ingredients. Phytochemical profile of aqueous garlic bread showed total phenols, flavonols, flavonoids, beta carotene, DPPH, FRAB, ABTS ±49.01, 8.87±0.22, ±49.01, 63.63±3.01, 50.41±0.79, 10.43±0.21 and 57.05±1.13, respectively. Garlic bread containing all these active compounds may excellent source to curtail health related disorders with special perspectives to antioxidant, hypercholesterolemic and hyperglycemic potentials. REFERENCES AACC, (2000). Approved Methods of the American Association of Cereal Chemists, St. Paul. Ademoyegun, O. T., Adewuyi, G..O., Fariyike, T. A. (2010). Effect of heat treatment on antioxidant activity of some spices. Continental Journal of Food Science and Technology, 4, Ali, B. H., Blunden, G., Tanira, M. O., Nemmar, A. (2008). Some phytochemical, pharmacological and toxicological properties of ginger (Zingiber officinale Roscoe): a review of recent Research. Food Chemical and Toxicology, 46, Bhat, R., Sridhar, K. R., Yokotani, K. T. (2007). Effect of ionizing radiation on antinutritional features of velvet seed bean (Mucuna pruriens). Food Chemistry, 103, Brand-Williams, W., Cuvelier, M. E., Berset, C. (1995). Use of a free radical method to evaluate antioxidant activity. Lebensmittel-Wissenschaft und-technologie, 28, Butt, M. S., Anjum, F. M., Ali A., Rehman A. (1997). Milling and baking properties of spring wheat. Journal of Agriculture Research, 35,
168 Cao, G. H., Sofic, E., Prior, R. L. (1996). Antioxidant capacity of tea and common vegetables. Journal of Agriculture and Food Chemistry, 44, Decock, P., Cappelle, S. (2005). Bread technology and sourdough technology. Trends in Food Science and Technology, 16, Dobraszczyk, B. J., Morgenstern, M. P. (2003). Rheology and the bread making process. Journal of Cereal Sciences, 38, Drewnowski, A., Gomez-Carneros, C. (2000). Bitter taste, phytonutrients, and the consumer: A Review. American Journal of Clinical Nutrition, 72, Federica, B., Emiliano, C., Gian, G. P., Santina, R. (2011). Evaluation of antioxidant, rheological and sensorial properties of wheat flour dough and bread containing ginger powder. Journal of Food Science and Technology, 44, Giannou, V., Kessoglou, V., Tzia, C. (2003). Quality and safety characteristics of bread made from frozen dough. Trends in Food Science and Technology, 14, Hala, Abdou, M. (2011). Comparative Antioxidant Activity Study of Some Edible Plants Used Spices in Egypt. Journal of American Science, 7, Ho, S., Lim, S. H., Kashif, G., Sung, Y., Jiyong, P. (2011). Quality and antioxidant properties of bread containing turmeric (Curcuma longa L.) cultivated in South Korea. Food Chemistry, 124, Jenkins, D. J., Kendall, C. W., Nguyen, T. H., Marchie, A., Faulkner, D. A., Ireland, C., Josse, A. R., Vidgen, E., Trautwein, E. A., Lapsley, K. G., Holmes, C., Josse, R. G., Leiter, L. A., Connelly, P. W., Singer, W. (2008). Effect of plant sterols in combination with other cholesterol-lowering foods. Metabolism, 57, Lawless, H. T., Heymann, H. (1998). Sensory evaluation of food: principles and practices. Chapman and Hall, New York. Maheshwari, R. K., Singh, A. K., Gaddipati, J., Srimal, R. C. (2006). Multiple biological activities of curcumin: A short Review. Life Sciences, 78,
169 Meilgaard, M. C., Civille, G. V., Carr, B. T. (2007). Sensory evaluation techniques, 4th ed. CRC Press LLC, New York. Miliauskas, G., Venskutonis, P. R., Van, Beek, T. A. (2004). Screening of radical scavenging activity of some medicinal plants and aromatic plant extract. Food Chemistry, 85, Paradiso, V. M., Summo, C., Trani, A., Caponio, F. (2008). An effort to improve the shelf life of breakfast cereals using natural mixed tocopherols. Journal of Cereal Sciences, 47, Pernice, R., Borriello, G., Ferracane, R., Borrelli, R. C., Cennamo, F., Ritieni, A. (2009). Bergamot: A source of natural antioxidants for functionalized fruit juices. Food Chemistry, 112, Phan-Thien, N., Safari-Ardi, M. (1998). Linear viscoelastic properties of flour water doughs at deferent water concentrations. Journal of Non Newtonian Fluid Mechanics, 74, Rask, C. (1989). Thermal properties of dough and bakery products: a review of published data. Journal of Food Engineering, 9, Rasool, G. (2004). Characterization and evaluation of wheat flour enriched with oilseed proteins for chapatti making. Ph.D diss. Inst Food Sci Technol Univ Agric Faisalabad, Pakistan. Razmi-Rad, E., Ghanbarzadeh, B., Mousavi, S. M., Emam-Djomeh, Z., Khazaei, J. (2007). Prediction of rheological properties of Iranian bread dough from chemical composition of wheat flour by using artificial neural networks. Journal of Food Engineering, 81, Roberta, R., Nicoletta, P., Anna, P., Ananth, P., Min, Y., Catherine, R. (1999). Antioxidant activity applying an improved abts radical cation decolorization assay. Free Radical Biology & Medicine, 26,
170 Romson, S., Sunisa, S., Worapong, U. (2010). Antioxidant and antibacterial properties in Keang-hleung paste and its ingredients. Asian Journal of Food and Agro-Industry, 3, Rosell, C. M. (2009). Trends in breadmaking: low and subzero temperatures. In M. L. Passos, and C. L. Ribeiro (Eds.), Innovation in food engineering: New techniques and products Taylor and Francis, CRC Press. Ruchi, H. V., Mini, K. S. (2011). Processing and storage of Indian cereal and cereal products alters its resistant starch content. Journal of Food Science and Technology, 48, Sadhna, A., Sajeev, R. S., Satish, K. (2011). Thermodynamic models for water sorption by garlic. Journal of Food Science and Technology, 48, Salim-Ur-Rehman, Mushtaq, M. A., Ijaz, A. B., Rizwan, S., Ghulam, M. D., Mian, A. M. (2006). Effect of pearling on physico-chemical, rheological characteristics and phytate content of wheat-sorghum flour. Pakistan Journal of Botany, 38, Scanlon, M. G., Zghal, M. C. (2001). Bread properties and crumb structure. Food Research International, 34, Shahidi, F. (2009). Nutraceuticals and functional foods: Whole versus processed foods. Trends in Food Science and Technology (Retrieved Jan 20, 2009). Shalini, D., Lakshami, D. N. (2005). Development and acceptability of breads incorporated with functional ingredients.. Journal of Food Science and Technology, 42, Singh, N., Bajaj, I. K., Singh, R. P., Gujral, H. S. (2002). Effect of different additives on mixograph and bread making properties of Indian wheat flour. Journal of Food Engineering, 56,
171 Singleton, V. L., Orthofer, R., Lamuela-Raventos, R. M. (1999). Analysis of total phenols and other oxidation substrates and antioxidants by means of Folin-Ciocalteu reagent. Methods in Enzymologist, 299, Siró, I., Kápolna, E., Kápolna, B., Lugasi, A. (2008). Functional food. Product development, marketing and consumer acceptance-a Review. Appetite, 51, Stampfli, L., Nersten, B. (1995). Emulsifiers in bread making. Food Chemistry, 52, Stewart, A. J., Bozonnet, S., Mullen, W., Jenkins, G. I., Michael, E. J., Crozier, A. (2000). Occurrence of flavonols in tomatoes and tomato-based products. Journal of Agricultural and Food Chemistry, 48, Stone, H., Sidel, J. L. (2004). Sensory evaluation practice. 3rd ed. San Diego, Calif.: Acad. Press Taga, M. S., Miller, E. E., Pratt, D. E. (1984). China seeds as source of natural lipid antioxidation. Journal of American Oil Chemists Society, 61, Unklesbay, N., Unklesbay, K., Nahaisi, M., Krause, G. (1981). Thermal conductivity of white bread during convective heat processing. Food Science and Technology, 47, Verbeke, W. (2005). Functional foods: Consumer willingness to compromise on taste for health? Food Quality and Preference, 17, Yadav, D. N., Rajan, A., Sharma, G. K., Bawa, A. S. (2010). Effect of fiber incorporation on rheological and chapati making quality of wheat flour. Journal of Food Science and Technology, 47, Yara, S. Q., Emília, Y. I., Deborah, H. M., Bastos, Geni, R., Sampaio, Elizabeth, A. F. S., Torres. (2009). Garlic (Allium sativum L.) and ready-to-eat garlic products: In vitro antioxidant activity. Food Chemistry, 115,
172 Yizhong, C., Qiong, L., Mei, S., Harold, C. (2003). Antioxidant activity and phenolic compounds of 112 traditional Chinese medicinal plants associated with anticancer. Life Sciences, 74, Yuan, R. Y., Wu, M. Y., Hu, S. P. (2000). Antioxidant status in patients with Parkinson s disease. Nutrition Research. 20, Zanoni, B., Pierucci, S., Peri, C. (1994). Study of bread baking process II. Mathematical modeling. Journal of Food Engineering, 23,
173 ISSUES AND CHALLENGES IN THE NIGERIAN ELECTRICITY INDUSTRY: CASE OF BENIN ELECTRICITY DISTRIBUTION COMPANY Roland Uhunmwagho and Kenneth E. Okedu Department of Electrical Engineering University of Port Harcourt, Nigeria Abstract: Benin Electricity Distribution Company covers four states, viz: Edo, Delta, Ondo and Ekiti with its headquarters in Benin City. It presently has eighteen districts. This paper addresses and proffers solutions to some of the major issues and challenges in the Nigerian electricity industry considering the Benin electricity distribution company in the South West zone of Nigeria. The status of transmission, distribution and commercial activities in this zone were analyzed. Recommendations were made to improve or focus on the remedies which would help solve the erratic power supply in the region in particular, and in the country in general, if these measures could be extended to other geopolitical electricity companies. Keywords: Nigerian electricity, distribution, transmission, network and substation 1. Introduction Due to population growth and subsequent increased demand for higher efficiency and reliable electricity supply, power systems are being forced to operate at almost full capacity (Happ. H., 1994, and Illic M. et al, 1997). The electric utility industry is probably the largest and the most complex in the world (Silva E. Mesa, et al, 1998 and Park Y., et al, 1998). The complexity of a power system is directly proportional to the number of buses which it serves. In Nigeria, the electricity industry is in the process of deregulation and it is proposed that the old National Electric Power Authority (NEPA) now Power Holding Company of Nigeria (PHCN) which had a whole responsibility of generation, transmission and distribution of electricity, would be unbundled into six generating companies, eleven distribution companies and just one transmission company (PHCN annual report, ). These companies need to be result driven and profitable to the investors. Thus, each of them must be able to account for the amount of energy it draws or supplies to its clients. This paper presents and proffers solutions to some of the issues and challenges in one of the distribution companies named Benin electricity Distribution Company in the South West zone of Nigeria. The Benin zone covers four states which are Edo, Delta, Ondo and Ekiti. Also, there are eighteen districts in this zone. The way forward to solving some of the highlighted major issues and challenges in this zone were also suggested. 173
174 2. Benin Electricity Distribution Company (BEDC) Areas of Operation This paper is limited to issues and challenges in the BEDC as specified in the Nigerian map in Fig. 1. Figure 1 shows the four states of operation in the zone which comprises eighteen districts. River Niger River Benue Ekiti Ondo Edo Delta Fig.1 Nigerian map showing the BEDC areas of operation 3. Supply in Feed into the Zone The supply in feed into the BEDC zone is shown in Table 1. From the table, it could be observe that there are twelve main supply-in feed. 174
175 Table 1 Supply in feed to BEDC 1 Akure 132/33kV TS 1x60MVA; 2x30MVA 2 Okene 132/33kV TS 2x30MVA 3 Ondo 132/33kV TS 2x30MVA 4 Omu-Aran 132/33kV TS 2x30MVA 5 Ilesa 132/33kV TS 2x30MVA 6 Benin 132/33kV TS 4x60MVA 7 Onitsha 132/33kV TS 1x30MVA; 1x60MVA 8 Irrua 132/33kV TS 1x60MVA; 1x30MVA 9 Okpella 132/33kV TS 1x15MVA 10 Effurun 132/33kV TS 2x60MVA; 1x30MVA 11 Delta 132/33kV TS 1x60MVA; 1x30MVA 12 Amukpe 132/33kV TS 1x30MVA 4. BEDC Network Data The total installed injection capacity is 1,255.31MVA, while the total installed distribution capacity is 1,564.4MVA. The peak load demand is 560MW on the average load allocation of 403MW. The average monthly energy received from grid is 220 MWH in the four states and eighteen districts. 5. Status of Distribution Network and Commercial Activities The status of the distribution network and commercial activities are summarized in Table 2. Table 2 Status of distribution network and commercial activities (PHCN, 2011) Length of 33kV feeders (km) 6, Number of 33kV circuits 47 Number of injection substation (comprising of 175 PHCN owned and privately owned) Number of overloaded injection substation 51 Length of 11kV feeder (km) 6,840 Number of 11kV circuits 253 Number of distribution transformers in circuit 7,562 Number of overloaded distribution 1,183 transformers Length of 0.415kV line (km) 49, Length of undersized 11kV line (km) 229 Length of undersized LT line (km) 8,425 Energy billed (kwh) 220,225,460 Amount collected (in Naira) 1.457billion Outstanding Debt (N); about N2.2n owned by billion Government Account 175
176 5.1 Customer Service There are 666, 584 connections in the zone and residential amounts to 88.67%, consuming 73.19% of the energy billed. The commercial amounts to 10.36%, consuming % of the energy billed, while the industrial activities in the area accounts for 0.69% thereby consuming 4.37% of the energy billed. Special customers may go up to 0.26%, and consuming 6.82% of energy billed. However, 0.05% of the energy billed is for street lighting. Therefore, the average monthly sales lumps to NGN 1.9B, while the average monthly revenue is NGN 1.4M, with weighted average tariff of NGN 8.0/kwh. 6. Network Expansion and Revenue Improvement In the last few months there has been installation and commissioning of eight injection substations in the zone. Also, there has been installation of and commissioning of thirty eight distribution transformers of various ratings with combined capacity of 110 MVA as follows: Edo state is136, Delta state is152, ), Ondo state is 40, while Ekiti state is 52. The constructed network facilities are 36.3 km of 33kV overhead lines and 1.35 km of 33kV underground network, and 74.0km of 11kV overhead and 12.2 km of 11kV underground network. The number of metered customers grew from 212,216 in December 2010 to 449,294 in early this year. Hence the metering gap needs to be closed. The average monthly revenue moved from N 1.023bn in 2010 to a present value of N 1.45bn monthly by early this year. This is about 18.52% increase. The average daily supply availability in hours recorded in the zone is given in Table 3. Table 3 Average daily supply availability in the zone (PHCN, 2012) Areas 33kV feeders 11kV feeders Uromi district Auchi district Benin GRA Ikpoba Hill Sakponba Ekenwa road axis Ugbowo Asaba district 13 8 Agbor district 12 8 Ughelli GRA Sapele Warri Effurun Akure district Ondo district Owo district Igbara-Oke Ado-Ekiti
177 7. Issues and Challenges Some of the major issues and challenges in the distribution zone under study particular and the other distribution zones in the country are given as follows: 33kV line transverse difficult terrain is thick having mangrove vegetation; flooding and swampy areas with their peculiar line trace problems. Many 33kV feeders, 11kV feeders are fully loaded 1,183 number of distribution transformers and 51 number injection transformers are overloaded The metering gap that exists now is a big issue The present tariff structure does not make for efficient running of the distribution system Inability of customers to pay their electricity bills as at when due, particularly government institutions The issue of contract or casual staff is also there as they constitute a significant proportion of the workforce Vandalisation of PHCN equipment and lines Inadequate funding for the electricity business Asaba is the only state capital still on 33kV supply from Onitsha. The NIPP 132/33kV substation is very slow. 7.1 Transmission Substation Challenges The following are the transmission challenges in the studied zone: Okpella 132/33kV TS The 15MVA 132/33kV transformer is grossly overloaded. The substation should be upgraded to 60MVA, 132/33kV TS Irrua 132/33kV TS: There is poor voltage profile at the tail end of 33kV feeders due to overloaded power transformers and long lines. Also, there is load limitation due to undersized conductor between Benin and Irrua. The 300MVA transformer at Irrua substation should be upgraded to a 60MVA to accommodate more loads. The undersized conductor between Benin and Irrua should be upgraded to improve power delivery to Irrua TS. 177
178 Effurun 132/33kV TS: The substation was commissioned in the early 70s. Virtually all the 33kV switchgears and terminal equipments are now obsolete and cannot guarantee stable supply. This transmission substation requires major rehabilitation works and equipment upgrade. Amukpe-Sapele 132/33kV TS: The 30MVA 132/33kV transformer is already overloaded. Additional 30MVA transformer is required for immediate installation. 7.2 Transmission Substation Limitations Akure 132/33kV TS: There are serious load limitations due to undersized conductor-on the 132kV line between Osogbo and Akure. Urgent upgrading/re-conducting of Osogbo-Akure 132kV lines required to reduce the protracted load shedding in Akure. Ondo 132/33kV TS: The 33kV Siemens indoor feeder breakers at Ondo TS are obsolete and in a state of disrepair. This requires immediate replacement. Owo is fast city in Ondo state. The receiving end voltage here is low due to the absence of TS. A 60MVA, 132/33kV TS should be constructed in Owo. 8. Conclusions and Recommendations The major issues and challenges in the Benin Electricity Distribution Company (BEDC) comprising two states in the Nigeria south-south (Edo and Delta), and two states in the west (Ondo and Ekiti) has been investigated in this paper. The major issues amongst others are overloading of transformers, inadequate funding, and vandalisation of Power Holding Company of Nigeria (PHCN) equipments. These shortcomings are also experience by other power distribution companies in other geopolitical zones of Nigeria. Some valuable recommendations to restore the issues and challenges in the BEDC in particular and other distribution companies in general may be; improving the tariff structure, encouragement of customers to pay bill by using pre-paid meters, increase the number of distribution transformers and transmission substations to avoiding overloading, upgrading or reconstruction of 132kV lines in the zone to avoid load shedding, etc. 178
179 References 1. Happ, H., "Cost of Wheeling Methodologies," IEEE Transactions on Power Systems, Vol. 9, No. 1, pp , February Ilic, M., et al., "Toward Regional Transmission Provision and its Pricing in New England." Utility Policy, Vol. 6, No. 3, pp , 1997, 3. Park, Y., Park, J M Urn, J., and Won, J., "An Analytical Approach for Transmission Costs Allocation in Transmission System," IEEE Transactions on Power Systems, Vol. 13, No, 4, pp , November 1998, 4. Power Holding Company Annual Report ( ) 5. Silva, E., Mesa, S., and Morozowski, M. "Transmission Access Pricing to Wheeling Transactions: A Reliability Based Approach," IEEE Transactions on Power Systems, Vol. 13, No, 4, pp , November
180 EFFECTS OF PROCESSING ON THE PROXIMATE COMPONENTS AND AMINO ACID PROFILE OF BAUHINIA MONANDRA (KURZ) SEED Balogun B.I. Department Of Agric Education Federal College Of Education P.M.B. 1041, Zaria-Nigeria ABSTRACT Three (3) processing methods were used to investigate the effects of processing methods on the antinutrient levels of Bauhinia monandra (Kurz) seed. These processing methods were boiling (in water), toasting and soaking. The raw Bauhinia monandra seed sample were boiled with tap water in seed to water ratio of 1:10 w/v at the rate of 5kg: 10litres in a 15litres metal cooking pot for 10, 20, 30 and 40 minutes respectively and sundried to constant weight and milled before being taken to the laboratory for analysis. Toasting was done for 10, 20, 30 and 40 minutes respectively using a hot open pan and heated with fire from a stove burning with blue flame. The seeds were stirred constantly to prevent charring. The seeds were cooled and milled. The last processing method involved the soaking of the raw Bauhinia seed in a bowl containing seed to water ratio of 1:10 (w/v) at the rate of 5kg to 10litres which completely submerged the seeds in tap water at room temperature (30+2 o C) and for 24, 48, 72 and 96 hours respectively and sun-dried to constant weight. The seed samples were then milled. The anti-nutrient determined were HCN, tannin, oxalate, phytic acid and saponins. The HCN was determined by method of AOAC (1995), tannin (AOAC, 1980), oxalate (Abeza et al., 1968), phytic acid (Reddy et al., 1982) and saponin (Hudson and El-Difrawi, 1979). Results obtained indicated that processing methods had significant influence on the anti-nutritional composition of Bauhinia monandra (Kurz) seeds. Bauhinia seeds processed by soaking in tap water lost more of its anti-nutrient than seeds processed by other means. Keywords: Processing Methods, anti-nutrient levels, Bauhinia monandra INTRODUCTION In the fish production industry the prohibitive cost of aqua-feeds are primarily due to the extensive use of conventional fishmeal which now have attributes of scarcity and being expensive due to its increasing demand (Lim and Dominy, 1989; Alcestes and Jory, 2000; Abdel Wirth, 2001 and Ayoola, 2010). Fishmeal has been a major protein source in artificial fish diet production due to the suitable protein quality, amino acid profile that closely matches fish requirements as well as its palatability (NRC, 1983). Therefore, considering the escalating cost of aqua-feed which accounts for 60-80% of production cost in fish farming attempts have been made to reduce cost of commercially formulated aqua-feeds with the aim of producing fish at minimum cost to ensure their availability on the table of all Nigerians. 180
181 Several legumes exist whose seeds could be explored for nutritional potentials for aqua-feeds. One of such legumes is the Orchid plant (Bauhinia monandra Kurz.). Bauhinia monandra Kurz is a member of the Caesalpiniaceae family. Anhwange et al. (2004) analyzed the Bauhinia monandra seed for amino acid contents and the result indicated that the seed contained 33.09% crude protein which makes it a potential source of supplementary amino acids for both man and livestock provided the toxicants present in them were removed. There is information dearth on the proximate composition, amino acid profile, energy value and anti-metabolic constituents of processed Bauhinia seed meal particularly soaking. Before the adoption of a given feed/food resources in livestock feeding preliminary tests for its composition, nutritional value and health implications of its consumption are essential and permit credible enlightenment programmes and recommendations with regards to its quality and use. (Aletor et al., 2007; Owen et al., 2008a&b; Owen et al., 2009a and Shivprasad et al., 2012) This study therefore aims at evaluating anti-nutritional factors inherent in bauhinia seed meal. Sample Collection/Identification MATERIALS AND METHODS Bauhinia monandra seeds from dehiscenced mature pods of the plants within the main campus of Ahmadu Bello University, Zaria, Nigeria, were collected and used for this research. The plant pod and seed samples were identified at the Herbarium of the Department of Biological Sciences, Ahmadu Bello University, Zaria. Sample Preparation The collected seed samples were sorted, screened and distributed into four batches. The first batch was the untreated seeds, the second, third and fourth batches were toasted, boiled and soaked respectively. Processing of Untreated (Raw) Seeds Two hundred grams (200g) of raw, sorted Bauhinia seeds were used for proximate analysis, amino acid assay and anti-nutrient determination. Boiling Raw Bauhinia seed samples were boiled with tap water in seed to water ratio of 1:10(w/v) at the rate of 5kg:10litres (Vadivel and Pugalenthi, 2007) in a 15litre metal cooking pot for a duration of 10 minutes, 20 minutes, 30 minutes and 40 minutes. The water was brought to boil at a temperature of C before the seeds were poured into it. A portion (1kg) of the original seed samples were removed from the boiling water with a sieve at 10, 20, 30 and 40 minutes intervals respectively using a stopwatch while the boiling continued. Dense ox-brown exudates were noticed and this became more pronounced 181
182 as duration of boiling increased. The boiled samples at the stipulated intervals were allowed to cool and sun-dried to a constant weight. The seed samples were then packed in tightly sealed polythene bags. Toasting 5kg of raw Bauhinia seeds were placed in a hot open pan which was pre-heated on fire for 5minutes to ensure that sufficient and uniform heat was obtained for toasting. The heating processing continued and toasting was accomplished by constant stirring of seeds to ensure uniform application of heat and to prevent charring (Eyo, 2001). Toasted Bauhinia seeds were removed at 10, 20, 30 and 40 minutes intervals then spread and allowed to cool on clean trays placed on concrete slabs. The samples were then stored separately in tightly sealed labelled polythene bags. Soaking in Water Raw Bauhinia seed samples were soaked in a bowl containing tap water at room temperature (30 ± 2 0 C) in seed to water ratio of 1:10(w/v) at the rate of 5kg to 10litres which completely submerged the seeds (Vadivel and Pugalenthi, 2007). Dense ox-brown exudate was observed and was more pronounced as duration of soaking increased. The soaked seed samples were removed from the soaking water at the rate of 1kg with a sieve at 24, 48, 72 and 96 hours respectively and then spread separately on clean trays to sun-dry to a constant weight. The seed samples were then placed in appropriately labeled and tightly sealed polythene bags and stored in a cool dry place. Determination of Anti-Nutrients Anti-nutrients of the differently processed seeds were determined at the Food Science Laboratory, Faculty of Agriculture, Ahmadu Bello University, Zaria. Tanin was determined as described by AOAC (1980); Hydrogen cyanide (HCN) (AOAC, 1995); saponin (Hudson and El-Difrawi, 1979); phyate (Reddy et al., 1982); oxalate (Abeza et al., 1968). Statistical Analysis Data obtained were pooled and subjected to one way analysis of variance (ANOVA) at 5% level of probability. Least Significant Difference (LSD) was used to separate means. Anti-Nutritional Composition (mg/100g) of Boiled Bauhinia at Different Time Intervals The results showed that boiling reduces the values of HCN, Tannin, Oxalate, Phytic Acid and Saponins. The values of the antinutritional composition of Boiled Bauhinia Seed reduces with increase of boiling time. There was significant difference (P<0.05) between processed and raw seeds only oxalate shows significant difference (P<0.05) in the boiled seeds in all the four treatments (10, 20, 30 and 40 minutes) (Table 1). 182
183 Table 1: Anti-nutritional composition (mg/100g) of boiled Bauhinia at different time intervals Minutes Raw seed SED ± LSD(P<0.05) Trts HCN 0.64 c 0.53 b 0.23 a 0.22 a 0.68 d Tanin 6.24 b 6.23 b 6.23 b 4.35 a 8.75 c Oxalate 8.95 d 7.63 c 6.73 b 2.67 a e Phytic acid c 4.01 b 3.03 a 3.01 a d Saponins 0.55 a 0.54 a 0.51 a 0.44 c 2.74 b Values with the same superscripts in the same row are not significantly different (P > 0.05) LSD. Anti-Nutritional Composition (mg/100g) of Toasted Bauhinia Seed at Different Time Intervals The results indicated that toasting reduces antinutritional factors. There was significant difference (P< 0.05) between the toasted and raw seeds. In toasted seeds there was no significant difference in the values of phytic acid and saponins in the four treatments (Table 2). Table 2: Anti-nutritional composition (mg/100g) of toasted Bauhinia seed at different time intervals Minutes Raw seed SED ± LSD(P<0.05) Trts HCN 0.64 c 0.53 b 0.52 b 0.42 a 0.68 d Tanin 8.71 b 8.75 c 8.73 bc 6.23 a 8.75 c Oxalate c b b 8.74 a d Phytic acid a a a a b Saponins 0.61 a 0.58 a 0.55 a 0.53 a 2.74 b Values with the same superscripts in the same row are not significantly different (P > 0.05) LSD. 183
184 Anti-Nutritional Composition (mg/100g) of Soaked Bauhinia Seed The result clearly showed that soaking reduces value of anti-nutritional composition. There was significant difference (P< 0.05) between soaked and raw seeds. The soaked seeds Tannin, Oxalate and Phytic acid showed significant difference in all the four treatments. There was no significant difference (P< 0.05) in Saponins in soaked seeds in the four treatments (Table 3) Table 3: Anti-nutritional composition (mg/100g) of soaked Bauhinia seed Hours Raw seed SED ± LSD(P<0.05) Trts HCN 0.42 c 0.21 b 0.16 b 0.03 a 0.68 d Tanin 6.25 d 3.82 c 3.21 b 2.88 a 8.75 e Oxalate 6.71 d 2.35 c 2.18 b 1.94 a e Phytic acid 3.55 d 3.44 c 3.13 b 0.75 a e Saponins 0.51 a 0.43 a 0.40 a 0.31 a 2.74 b Values with the same superscripts in the same column are not significantly different (P > 0.05) LSD. Anti-Nutrients Results showed that there were significant differences in the antinutritional factors of the raw and differently processed Bauhinia monandra Kurz seed meals, for all the parameters measured which implies that there was a general and progressive reduction in the contents of anti-nutritional factors as a result of processing, though this varied in degree with the different processing times. The presence of tannin, HCN, phytate and saponins confirms the reports of earlier workers that Bauhinia monandra seeds generally contain such anti-nutritional factors (Anhwange et al., 2004; 2005, Vijayakumari, et al., 2007 and Agbugui, 2011). Amongst the various processing methods employed, the soaking method was found to reduce the levels of various anti-nutritional substances. Similar significant reduction of various anti-nutritional compounds during soaking treatment was reported for several under-utilized leguminuous materials such as Leucaena leaf meal (Wee and Wang, 1987); Leucaena Leucocephala (Pascal and Penaflorida, 1979; Falaye, 1988); rattle box seed, Crotolaria retusa L. (Yashim et al., 2009); Locust bean meal seed (Olaniyi, 2009b; Tamburawa, 2010); Mucuna Pruriens Var (Vidavidel and Pungalenthi, 2007); Bauhinia purpurea (Vijayakumari et al., 1997a). 184
185 The levels of anti-nutrients in soaked seeds obtained in this study were within the tolerable limits/permissible levels. According to Francis et al. (2001a), the tolerable HCN limits for fish is yet to be established; however, the HCN levels of 0.02mg/100g obtained in this study is within tolerance limit of 5 50mg/kg which has been established for man. The tannin levels of 2.86mg/100g obtained in the soaked seed is not within the tolerable or permissible levels for man which has been established as 15mg/kg. The tolerable limit for fish is not yet established (Francis et al., 2001a). However, it has been indicated that fish are sensitive to tannins and that caution should be exercised in incorporating seeds and agroindustrial by-products containing high levels of tannins in fish feed (Francis et al., 2001a). The oxalate level is also within the tolerable limit for man ppm/kg; phytic acid (0.74mg/100g) is within the recommended tolerable limits of below 5g/kg in fish feeds (Francis et al., 2001a). The saponin levels (0.30mg/100g) for this study is also within the established tolerance limits of below 1g/kg of diet in commonly cultured fish (Francis et al., 2001a). The mg/100g reduction of phytic acid was generally poor for all the processing methods with the exception of the soaked Bauhinia seed meal (SBSM 96 ). Alonos et al. (1998) reported that phytic acid content of faba bean seed was significantly reduced during soaking in water. Reduction in phytic acid during soaking could be attributed to leaching out in soaking water under concentration gradient (Kataria et al., 1989). High phytate contents have been found to retard growth and cause abnormalities in the intestinal histology of various commonly cultured fish species due to damage to the pyloric cecal region of the intestine with consequent impared nutrient absorption (Francis et al., 2001a). Phytate also reduce the bioavailability of dietary phosphorus in fish (Francis, 2002). Phytates inhibit dietary proteins (Satterlee and Abdulkadeer, 1983). Phytate also strongly inhibit the activity of trypsin and pepsin (Panda, 2006) and reduces the solubility of starch by binding it; reducing the absorption and hence lowering glucose utilization (Akinmutimi et al., 2009). Phytate chelate with divalent and trivalent metal ions such as Fe 2+, Zn 2+ (Khan et al., 1986) thereby decreasing their absorption in the intestinal mucosa of the fish (Francis, 2002); thus they are rendered unavailable. The trend observed in phytate levels in this study implies that the feed formulated may have bitter tastes particularly in the roasted seed meal sample (RBSM 40 ) which had relatively high and significant phytate content (P < 0.05) thus the feed could be rendered unacceptable due to the associated bitter taste. Phytic acid content of Bauhinia seed reduced from 11.39mg/100g in raw seed to 0.75mg/100g in soaked seed; boiled seeed (3.01 mg/100g) and toasted seed (10.00 mg/100g) respectively. According to Abu (2005) fermentation reduced phytate in Locust bean seed (Parkia filicoidea). Kumar et al. (1978) reported that cooking decreased both water and extractable phytate phosphorus in legumes. Tamburawa (2010) indicated that boiling best reduced the amount of phytate in locust bean seed meal from 0.71 mg/100g (raw) to the bearest minimum with increased duration of boiling followed by soaking. However based on the result of this study a reverse trend was obtained which indicated that the results are at variance with each other probably due to the time interval employed for processing. 185
186 The tannin and oxalate content reduction in this study were also very poor for all the processing methods particularly in the toasted meal which had the least tannin and oxalate reduction. None of the processing techniques employed was able to detoxify tannins and oxalates to the bearest minimum. Similarly, Tamburawa (2010) reported that soaking reduced the level of tannins to the bearest minimum with increased duration of processing time, from 1.08 in raw locust bean seed meal to 0.28 when soaked for 1day, 0.25 (2days), 0.17 (3days) Francis (2001a) indicated that tannins can interfere with digestive processes by binding to feed proteins, vitamins, minerals and digestive enzymes. Dietary hydrolysable tannins was also reported to retard growth. The presence of high concentration levels of tannins therefore implies possibilities of poor protein digestibility caused by formation of protein tannin complexes which irreversibly bind digestive enzymes, thus inhibiting the activities of the enzymes making them unavailable for breaking down proteins with the resultant effect that proteins and other nutrients are liable to escape digestion. The presence of high concentration of tannins also indicate possibilities of poor palatability of feed due to bitter tastes hence reduction in feed intake (Akinmutimi, 2004). Patridge et al., 1982; Cherbut et al., 1998 and Akinmutimi et al., 2009 also reported that high tannin contents depresses cellulase activity by binding fibre, thus affecting bio degradability (digestibility). Thus the high values of tannin in the raw (RBSM meal) toasted and boiled samples (RBSM 40 and BBSM 40 ) however renders them unsuitable for use in feed formulation. In all the processes the levels of HCN and saponins were reduced to the bearest minimum levels with the least in the soaked seeds SBSM 96 (0.03mg/100g and 0.31mg/100g respectively). Fish fed cyanogen containing feed materials have generally shown reduced growth when compared to their respective controls (Ufodike and Matty, 1983). Hydrogen cyanides the hydrolysed toxic products of cyanogens suppress natural respiration and cause cardiac arrest (Davies, 1991). The presence of cyanide inhibits action of porhyrin enzymes (cytochrome oxidase in tissues and rapidly leads to suffocation (Umar, 2006). The presence of high saponins levels in water are highly toxic to fish due to the damage caused to the respiratory epithelium of the gills by the detergent action of the saponins. Saponins have also been reported to affect protein availability. Endogenous saponins have been shown to reduce the protein digestibility of soybean (Shimoyamada et al., 1998). The presence of high levels of saponins indicates damage of intestinal mucosa in fish. The intestinal mucosa of Chinook salmon fed diets with purified extracts of soybean meal (extracted to isolate soy saponins) had intestinal morphology resembling that of a fasting fish probably due to the detergent action of saponins on feeding (Bureau et al., 1998). Extensive damage to the intestinal mucosa was observed when Chinook salmon and rainbow trout were fed at a dietary level of 1.5g/kg Quillaja bark saponin. However saponins have beneficial effect at lower levels. Francis (2002) indicated that low dietary levels of saponins promote fish growth. Saponins might increase the digestibility of carbohydrate rich foods because of their detergent like activity, which reduces viscosity and thus prevents the normal obstructing action of such foods against the movement of digesta in the intestine, thus considering the least minimum value for saponins in the processing methods applied in this study soaked Bauhinia seed may confer that advantage to the fish for the subsequent study; thus the soaked seed with the minimum level of saponin (0.30mg/100g at 96 hours) was chosen for feed formulation. 186
187 There is tendency of loosing organic sulphur amino acids in form of methionine and cystein (for cyanide detoxification) if raw and toasted Bauhinia seed meal (TBSM 40 ) which contain 0.68 mg/100g and 0.42 mg/100g of HCN respectively are used in feed formulation. Thus the soaked seed (SMSM 96 ) with the least amount of HCN (0.03) was most desirable for feed formulation. The presence of HCN also reduces bioavailability of oxygen and thus reduces the oxygen binding capacity of haemoglobin. The oxalate level of Bauhinia seed was substancially and significantly reduced from 12.08mg/100g in raw to 1.94mg/100g in the soaked seed sample SBSM 96 followed by the boiled seed BBSM 40 (2.67mg/100g) with least reduction in toasted seed sample TBSM 40 (8.74mg/100g). Oxalate impacts its effects by attaching to some divalent minerals like iron, copper and calcium thus reducing their bioavailabilities by impairing their absorption (Umar, 2006). The oxalate composition in all processed seeds with exception of soaked seeds sample in this study was higher than 2.5% oxalate level capable of exerting toxicological symptoms in man (Oke, 1969). This implies that BBSM 40 and TBSM 40 could be deleterious to fish production. The result of this study is in accord with the findings of Tamburawa (2010) which indicated that processing reduced the levels of oxalate to a substantial level from raw locust bean seed meal to the bearest minimum in soaked seeds with increased duration of soaking time. The results of Tamburawa (2010) indicated that oxalate reduced from 1.78mg/100g in the raw locust bean seed meal when subjected to soaking for 1day to 1.25, 2days (0.67mg/100g) and 3days (0.46mg/100g) while soaking and subsequent fermentation for 3days reduced the oxalate level to 0.43mg/100g. However this result is at variance with the finding of Tamburawa (2010) which indicated that toasting reduced the level of oxalate to 0.41mg/100g. According to Tamburawa (2010) boiling also progressively and substantially reduced the level of oxalate to the bearest minimum with increased duration of processing time; in 1hour (0.22mg/100g), 2hours (0.21mg/100g), 3hours (0.24mg/100g), 4hours 0.22mg/100g, this is at variance with the findings of this study which indicated that oxalate was not reduced to the bearest minimum in boiled Bauhinia seed samples probably due to increased duration of boiling used by Tamburawa (2010). The reduced level of undesirable anti-nutritional components is essential in order to improve the nutritional quality of the seed meals and to effectively utilize their full potentials as feed. The high levels of antinutritional factors (tannin, oxalate and phytic acid) in the raw Bauhinia seed meal (raw BSM), toasted Bauhinia seed meal (TBSM 40 ) rendered them unsuitable for feed formulation since high levels ultimately indicates retardation of growth. The levels of anti-nutrients in the boiled sample were more reduced to a considerable level than in the toasted. However, this was also unacceptable because the trend of reduction indicated that they still had higher values than the soaked seed samples. Since the soaking method of processing was able to reduce the anti-nutritional compounds to the bearest minimum without affecting the nutritional quality of Bauhinia seeds it follows therefore that it was the best processing method in this study. CONCLUSION On the basis of least retention of anti-nutritional components compared to other processing methods, reduced cost of processing the soaked Bauhinia seed SMSM 96 had high potentials of being 187
188 utilized as feed component in fish diet. Further investigation is recommended in the use of processing techniques such as fermentation and autoclaving which may further reduce anti-nutrient levels and enhance efficient utilization of feed stuff. REFERENCES Abdel-Warith, A; Davies S.J. and Rusel, P. (2001). Inclusion of a commercial poultry by product meal as a protein replacement of fishmeal in practical diets for the African catfish, Clarias gariepinus. Aquaculture Research 32, Abeza, R.H.; Blake, J.T. and Fisher, E.J. (1968). Oxalate determination: Analytical Problems Encountered with certain lant species. Journal of the Association of Official Agriculturual Chemists 51: Abu, E.A. (2005). Comparative study of the effects of natural fermentation of some biochemical and anti-nutrient composition of soyabeans (Glycine Max L. Merr) and locust bean (Parkia filicoidea). Journal of Tropical Biosciences, 5(1): Agbugui, M.O., Oniye, S.J., Auta, J. and Abeke, F.O. (2011) Growth performance and feed Utilization of Fingerlings of Clarias gariepinus (Teugels) Fed Processed Paulatia monandra (Kurz) Seed meal. Journal of Aquatic Science 26 (1): Akinmutimi, A.H. (2004) Effect of cooking periods on the nutrient composition of Mucuna utilis seeds; Nigerian Poultry Science Journal Vol. 2&3, Pp Akinmutimi, A.H., Essien, U.N. and Nwagboso (2009). Effect of Processing on Proximate, Mineral and Gross Energy Composition of Velvet bean (Mucuna Sloanei). Nigeria Society for Animal Production 14 th Annual Conference Alcestes C.C. and Jory D.E. (2000). Tilapia: Alternative Protein Sources In Tilapia feed formulation. Aquaculture magazine Jul/Aug Vol. 26 No.4. Aletor, O. Oshodin, A. and Ipinmoroti, K.O. (2007). Comparative Evaluation of the Nutritive and Psysiochemical Characteristics of the leaves and leaf protein concentrates from two edible vegetables. J. Food Tech. 5(2): Alonos, R., Orue, E. and Marzo, F. (1998). Effects of Extrusion and conventional processing methods on protein and antinutritional factors content in pea seeds. Journal of Food Chemistry.. 63: Anhwange, B.A, Ajibola, V. O., and Oniye, S. J., (2004). Amino acid composition of the seeds of Moringa oleifera (Lam), Detarium microcarpun (Guill and Sperr) and Bauhinia monandra (Linn). Chemclass Journal, 1:
189 Anhwange, B.A, Ajibola, V. O., and Oniye, S. J. (2005). Nutritional Potential of the Seeds of Bauhinia monandra (Linn). Journal of Food Technology, 3(2): AOAC (1980). Official Methods of Analysis. 13 th Washington D.C., PP Edition, Association of Official Analytical Chemists, AOAC (1995). Official Methods of Analysis. 23 rd Washington, D.C., PP Edition, Association of official Analytical Chemist, Ayoola, A. A. (2010) Replacement of Fishmeal with Alternative Protein Source in Aquaculture Diets. Unpublished M.Sc. Thesis, Faculty of Nutrition and Science, North Carolina State University, Raleigh, North Carolina, PP 145. Bureau, D.P.; Harris, A.M and Cho, C.Y. (1998) The effects of purified alcohol extracts from soy products on feed intake and growth of Chinook salmon (Oncorhynchus tshawytscha) and rainbow trout (Oncorhynchus mykiss): nutritional value and effects on thyroid status. Aquaculture 163, Cherbut, C., Barry, J.L., Wyers, M. and Delort Laval, J. (1998). Effect of the nature of dietary fibre on transit time and facca excretion in growing Pig. Animal Feed Science and Technology 45 (1): Davies, R.H. (1991) Cyanogens. In: D Mello, F.P.J., Duffus, C.M., Duffus, J.H. (Eds.). Toxic substances in Crop Plants. The Royal Society of Chemistry, Thomas Graham House, Science Park, Cambridge CB4 4WF, Cambridge,pp Eyo, A.A. (2001). Chemical Composition and Amino Acid Content of the Commonly Available Feedstuffs Used in Fish Feeds in Nigeria. In: Eyo, A.A. (ed.) Proceedings of the First National Symposium on fish Nutrition and Fish Technology, Nigerian Institute for Oceanographic and Marine Research (NIOMR), LAGOS. Published by Fisheries Society of Nigeria (FISON). Pp Falaye, A.E. (1988). Utilization of Cocoa hust in the nutrition of Tilapia (O. niloticus) (Trewavas). Ph.D Thesis, University of Ibadan, Nigeria. Francis, G.; Makkar, H.P.S. and Becker, K. (2001a). Antinutritional factors present in plant-derived alternate fish feed ingredients and their effects in fish. Aquaculture 199: Francis, G. (2002). Feed Ingredients: Antinutrients in Plant-derived Fish Feed Ingredients. The Advocate, April, p Hudson, B.J.F. and El-Difrawi, E.A. (1979). The Sapogenins of the seeds of four lupins Species. J. Plant food, 3:
190 Kataria, A., Chauhan, B.W. and Punia, D. (1989). Antinutrient and protein digestibility (in virtro) of mung bean as affected by domestic processing and cooking, Journal of Food Chemistry, 32:9-17. Khan, N.; Zaman, R. and Elali, M. (1986): Effect of processing on the phytic acid content of oil seed products. Journal of Agriculture Food and Chemistry. 34: Kumar, K.G., Venkataraman, L.V., Jaya, T.T. and karishnamaurthy, K.S. (1978). Cooking characteristics in some fermented legumes: changes in phyins, calcium, magnesium and pectins. Journal of Food Science, 43: Lim, C. and Dominy, W. (1989). Utilization of Plant Protein by Warm Water Fish American Soybean Association. USDA.ARS. Tropical Aquaculture Research Unit. The Oceanic Institute. Hawaii. Vol. 3AQ 15 : NRC (1983): Nutrient requirements of warm water fishes and shellfishes National Academy Press, Washington, D.C., 253pp. Oke, O.L. (1969). Chemical studies on some Nigerian foodstuffs. Lafun. West African Journal of Biology and Applied Chemistry 8: Olaniyi, C.O.; Bini Omote, T and Gbadamosi, M. (2009a). Growth Performance and Nutrient Utilization of Clarias gariepnus fed processed Mucuna seed meal. In: Proceeding Nigerian Society for Animal Production 34 th Annual Confernce March th held at University of Uyo, Uyo Akwa-Ibom State, Nigeria. (Eds) Umoh B.I.; Udedibie, A.B.I.; Solomon, P.I.; Obasi, O.L.; Okon, B.I. and Udoh, E.J. Pp Olaniyi, C.O.; Aderinola, O.A.; Rafiu, T.A.; Akande, T.O. and Okunola, D.O. (2009b). Growth Performance and Nutrient Utilization of Clarias gariepinus fed Locust bean seed meal. Proceedings of 14 Annual Conference of Animal Science Association of Nigeria (ASAN) September held at LAUTECH, Ogbmoso, Nigeria. (Eds) Akinlade, J.A.; Olayeni, T.B; Rafiu, T.A.; Akinwumi, A.O; Aderinola, O.A; Ojebiyi, O.O. and Odunsi, A.A. Pp Owen, O.J.; Alawa, J.P.; Wekhe, S.N.; Aniebo, A.O.; Ngodigha, E.M. and Amakiri, A.O. (2008a). Haematological and Biochemical responses of weaner rabbits fed diets containing graded levels of poultry litter. Int. J. Biotech. and Biochem. (IJBB) 4(1): Owen, O.J.; Alawa, J.P.; Wekhe, S.N.; Aniebo, A.O.; Ngodigha, E.M. and Amakiri, A.O. (2008b). Some bacteriological aspects of poultry litter used as feed supplement in rabbit diets. Tox. And Env. Chem. 90 (5-6): Owen, O.J; Alawa, J.P. Wekhe, S.N; Isirimah, N.O.; Chukuigwe, E.C.; Aniebo, A.O.; Ngodigha, E.M. and Amakirir, A.O. (2009a). Incorporating Poultry Litter in rabbit feed. A solid waste management strategy. Egyptain J. Anim. Prod. 46(1):
191 Panda, A.K. (2006). Phosphorus: The Essential Mineral. Feed Mix. 15(1): Partridge, I.G.; Low A.G. and Bambrook, I.E. (1982). Influence of diet on the endocrine pancreatic secretion of growing pigs. British Journal of Nutrition. 48: Pascal, F.P. and Penaflorida, V. (1979). The extraction of Mimosine from ipil-ipil (Leucaena leucocephala) by soaking in water. Aquaculture Department, SEAFDEC Q. Research 3(3): 4-6. Reddy, N.R.; Sathe, S.K.; Salunkhe, D.K. (1982). Phytate in Legumes and Cereals Asvances in food Res., 28:1-92. Satterlee, L.D. and Abdul-kadeer, R. (1983). Effect of Phytate content on Protein Nutritional quality of soy and Wheat bran proteins. Lebesm Wiss. Technology 16:8-14. Shimoyamada, M., Ikedo, S., Ootsubo, R. and Watanabe, K. (1998). Effects of soybean saponins on chymotryptic hydrolyses of soybean proteins.journal of Agriculture Food and Chemistry. 46 (12), Shivprasad. M., Sujata, V. and Varsha. R. (2012) Screening of anti-nutritional factors from some wild edible plants. Journal of Natural Product and Plant Resource, 2012, 2 (2): ISSN : Tamburawa, M.S. (2010). Effect of Locustbean Seed Meal Diets on the Performance and Carcass Charactersitics of Broiler Chickens A Ph.D Research Proposal, Presented at the Postgraduate Seminar Series of the Department of Animal Science, Faculty of Agriculture, Ahmadu Bello University (A.B.U.) Zaria. 15pp Ufodike, E.B.C., Matty, A.J., (1983) Growh responses and nutrient digestibility in mirror carps (Cyprinus carpio) fed different levels of cassava and rice. Aquaculture (31), Umar, R. (2006). Growth Performance and feed utilization of the Nile Tilapia (Oreochromis niloticus Trewavas) Fed Different Levels of (Senna occidentalis Linneaus) Seed Diet. Unpublished M.Sc Thesis. 94pp. Vadivel, V. and Pugalenthi, M. (2007) Biological value and protein quality of raw and processed seeds of Mucuna pruriens var. utilis. Livestock Research for Rural Development 19 (7) 11pp. Vijayakumari, K.; Siddhuraju, P. and Janardhanan, K. (1997a) Chemical Composition, amino acid content and protein quality of the little known legume Bauhinia purpurea L. Journal of Science of Food and Agriculture 73,
192 Vijayakumari, K; Pugalenthi, M. and Vadivel, V. (2007) Effect of Soaking and Hyrothermal Processing methods on the levels of anti-nutrients and in Vitro protgein digestibility of Bauhina purpurea L. seeds. Food Chemsitry 103, Wee, K.L. and Wang, S.S. (1987). Nutritive Value of Leucaena Leaf meal in pelleted feed for Nile Tilapia. Aquaculture 62: Yashim, S.M.; Segun, A.J.; Abdu, S.B.; Duru, S. and Adamu, H.Y. (2009). Effect of Duration of Soaking of Rattlebox seeds (Crotalaria retusa L.) on the level of some chemical composition and minerals In: Proceedings Nigerian Society for Animal Production 34 th Annual Conference
193 SYNTHESIS AND DYEING PROPERTIES OF BIFUNCTIONAL REACTIVE DYES VIA 4- (4-METHOXYPHENYL)-THIAZOL-2-AMINE AND 4-(4-BROMOPHENYL) -1, 3- THIAZOL- 2- AMINE ON NYLON FABRIC. Abstract Ezeribe A. I.1, Bello K. A. 2, Adamu H. M. 3 Chindo I, Y. 3 Boryo D,E,A, Department of S.L. T., Federal Polytechnic Bauchi,Nigeria 2. Department of Textile Technology, Ahmadu Bello University,Zaria-Nigeria 3. Chemistry Programme, Abubakar Tafawa Balewa, Bauchi-Nigeria Bifunctional reactive dyes are coloured compounds that posses more than one reactive moiety per molecule or groups, capable of forming covalent bonds between dye ions or molecules and the substrate. Two bifunctional reactive dyes 10c and 10d with a single monochlorotriazinyl and vinyl sulphone reactive groups were synthesised via (4-phenyl)-1,3-thiazol-2-amine and 4-(4- Chlorophenyl)-1,3- thiazol-2-amine. The intermediates were diazotized and coupled with J-acid and other coupling components to derive the dyes. Wavelength of maximum absorption (λmax ) of dyes were obtained. The dyes were applied on nylon fibres at various ph and temperature conditions. The optimum % exhaustion % fixation and fixation efficiency were determined in glubber salt as the fixing agent. Washing and light fastness properties of dye samples were determined. The result revealed a λmax of 500nm(10c) and 480nm(10d) respectively, % exhaustion values of 69 and 67 at ph 11, 73% and 69% at 80 o C in 70 minutes respectively, % fixation gave values of 69 and 65 at ph 11 respectively. The fixation efficiency values of 61% and 68% at ph of 11 respectively. The fairly good shades observed may be due to better, substantivity as well as good covalent fixation of the dyes with nylon fabrics. The colour strength and fastness properties of dyed fabrics were fairly comparable to that of cotton fabrics. The overall results suggest that bromo and methoxy groups introduced on the para position of benzene ring of dye molecules induced a hypsochromic shift of 10nm on 10c and 30n on 10d with respect to 10a. Key words: Bifunctional Reactive dyes, %Exhaustion %Fixation, Fixation Efficiency and Fastness properties INTRODUCTION In general, acid dyes have attracted much attention to nylon substrates due to their interaction mechanism and easy method for application (Yoon, 2002). However, to achieve satisfactory levels of wash fastness, recourse is required to an after treatment with a commercial syntan and other fixing systems. While an after treatment of the dyed nylon substrates can improve wash fastness, this treatment can impart a change in shade of ground colour but also it is temporary in 193
194 nature (Burkinshaw, 2001).Consequent upon this, application of reactive dyes to nylon substrates has attracted interests to solve those problems (Preston,1986). Reactive dyes react chemically with amino groups within nylon fibres to form a covalent bond. Theoretically, by virtue of the covalent nature of the dye-fibre bond, reactive dyeing on nylon fibres can display excellent wash fastness without any recourse to an after treatment. Especially, reactive dyes containing heterobifunctional groups can provide great opportunity for efficient dye-fibre reaction due to the sulphatoethylsulphone and monochlorotriazininyl reactive systems(broadbent, 2001), Thus, this paper concerns the build-up characteristics and wash fastness properties of the mixed anchor reactive dyes, of heterobifunctional reactive dyes (Hunger,2008). Exhaustion (%E), fixation (%F) and fixation efficiency (FE) were examined at various ph conditions and dyeing temperatures. These attach to the nylon via ion-ion linkages between the cationic, protonated, amino end groups of the nylon (NH 3 + ) and the anionic sulphonate residue of the dye (Dye-SO 3 - ). Although this mode of attachment renders the dyeing of nylon straightforward, at least in principle, the wet fastness is usually less than ideal, and there is often a delicate balance to be struck between level dyeing performance and wet fastness. Loss of colour and staining of adjacent fabrics arises from the facile partial dissociation of ion-ion links between dye and nylon. In order to render reactive dyes for nylon attractive to potential customers it is necessary that any such products exhibit an attractive balance of technical and commercial properties. Desirable technical features include high fixation, good build-up and fastness properties. The thrust of most published work on reactive dyes for nylon has been a comparison of the relative efficacies, of nylon, of existing cellulose reactive dyes. However, much less has been reported on the effect of other dye parameters, such as molecular size and fixed sulphonation, on the application properties of reactive dyes on nylon. Molecular size and shape are important in determining final dye fixation (Soleiman, 2005). In the case of dyeing nylon, at various ph, at fixed degree of sulphonation, hence low net negative charge, might be expected to lead to greater attraction with the positive charged fibre (Nylon-NH 3 + under various conditions). Additionally, the net charge of the nylon is negative, due to presence of anionic carboxylic acid groups and hence, at various ph values and fixed level sulphonation of dye may be expected to lead to increased attraction between dye and nylon. Applying the dye at ph 11 generate two important advantages, firstly would increase the elimination of the temporarily anionic sulphatoethylsulphone groups, secondly maximize the concentration of the nucleophilic amino end groups on the fiber. This may suggest that the nonionic bifunctional vinylsulphone derivative of the dye, generated from the elimination reaction of the two temporarily anionic sulphatoethylsulphone groups, in addition to the presence of the monochlorotriazine reactive group, can maximize the nucleophilic reaction with the amino groups on both fabrics. 194
195 195
196 196
197 EXPERIMENTALS Synthesis of Intermediate 4-(4-MethoxyPhenyl)-1,3-thiazol-2-Amine(1c) and 4-(4-BromoPhenyl)-1,3-thiazol-2- Amine(1d), Resublimed Iodine (7.6g, 0.03mol) was added to the slurry of acetophenone (0.03mol) and thio-urea (4.56g, 0.0mol) and the mixture was heated in an oil bath at C over night. After cooling, the reaction mixture was diluted with distilled water (50ml) and heated to dissolve most of the solid, again cooled to ambient temperature and treated with 25% aqueous ammonium hydroxide (to ph 9-10). The precipitated thiazole was collected and purified by crystallization from hot ethanol. The yield was computed and recorded. The melting point experiment was performed and the result recorded. Preparation of the Coupling Component using J-ACID. Cyanuric Chloride (1.9504g, mole) was stirred with acetone (40ml) and water (10ml) for 1 hour to form a fine suspension at the temperature (-2 0 C). After 1 hour, a neutral solution of 5-naphthol-2-amino-7-sulphonic acid (3.4g, 0.01 mole) was added in water and concentrated sodium bicarbonate solution (10%W/V) in such a way that the temperature did not exceed a level above 5 0 C. The reaction mass was stirred maintaining the ph 6.9 to 7 up to 3 hours. To the above solution, a further addition of newly neutralize solution of 2-methoxy-5-methyl-4-( -Sulphatoethyl) Sulphonyl aniline (3.18g, 0.098mole) in water (10ml). The mixture was stirred for half an hour at C, with a gradually rising of the temperature to 35 0 c adjusting the ph to 7.5. The mixture was stirred for 3 to 4 hours. Filtered, was held with cold water and the resultant product was used for subsequent coupling reactions. (Dalal and Desai 1996). General Method of Diazotisization Diazotization was carried out by method prescribed by Dalai and Desai( 1996) General Method of Coupling The coupling compound prepared (7.56g,0.01mole) was stirred thoroughly in water at 0 0 C, the diazonium chloride solution of 1c and1d (0.01 mole) were added slowly over 1 hour maintaining the ph at 7.0. The ph was adjusted to 7 or below such that sulphatoethyl sulphone remain as a functional group. The stirring was continued for 4 hours at C. A solution of sodium hydrogen phosphate (0.42g) and potassium dihydrogen phosphate (0.83g) in water followed by sufficient sodium chloride (15.20g) was added to precipitate the product. Organic impurities were extracted by washing with a small portion of diethyl ether. (Dalal and Desai, 1996). Purification of Fabric Cotton fabrics were purified by scouring, bleaching and mercerization by methods prescribed Sadov et al.,(1973;anon,1998 and Trotman,1975) Dyeing Dyeing was carried out as described by Giles. Weighing were carried out using Sauter RC 8021 digital weighing balance and optical density measurements were conducted using Jenway 6305 Spectrophotometer. Two dye baths were prepared and a blank containing all the regents except the dye. The dye baths were adjusted to ph of 3,5,7,9,11, and 13 respectively with acetic acid and sodium hydroxide. The dye baths 197
198 with the blank were placed in the water bath and the temperature was regulated to 60 0 C (optimum temperature). 2ml each of the solution in the dye bath and blank was taken using syringes. (OD 0 ), this was followed with the addition of moisten cotton fabric. Dyeing was allowed for 1 hour at 60 0 C, after which 2ml was again drawn from the dye baths. The samples drawn was diluted to 25ml and was evaluated for absorbance at 510 and 480nm with UV spectrophotometer. The initial and final absorbance values obtained were used to calculate % exhaustion for the dyeing at various ph. The values were tabulated and the graph of % exhaustion was plotted against ph. The experiment was repeated varying temperature C and Time 0-90-min and their % exhaustion were plotted against each variable respectively. (Ajayi, 2005). Measurement and Analyses Determination of dye % Exhaustion The dye % exhaustion of cotton fabrics (E%) is calculated according to the following equation(ajayi,2005) % Exhaustion = Initial OD - Final OD x 100 Initial O.D Where OD = Optical density OD 0 = values taken before the start of dyeing OD 1 = values taken at the end of dyeing. Determination of λ max The concentration (M/l) of dye solution was measured on Jenway 6305 UV visible Spectrophotometer at 0.001% of solution at λ max (510 and 450nm) respectively for 10c and 10d. FASTNESS TESTING The dyed samples are tested according to the American Association of Textile Chemists and Colourists (AATCC) standard methods(aatcc,1999). Colour fastness to washing: (i) (ii) (iii) The composite specimens are sewed between two pieces of bleached cotton fabric and wool fabrics. The composite specimen is immersed into an aqueous solution containing 5g/1 soap non-ionic detergent, at 60 o C with L.R. 1:50, the samples are then removed, rinsed in hot and cold distilled water. Evaluation of the wash fastness is established using the Grey-Scale for the change in colour for dyed samples and staining for bleached cotton fabric fabrics ( BS 1006, 1999). Colour fastness to light: (i) (ii) (iii) (iv) A specimen from the dyed fabric to be tested and standards are exposed simultaneously under specified amounts of colour change. The specimens are exposed to the light for about 20 hours. Evaluation of results is carried out by using the Grey- Scale (BS1006,1999), if the final assessment is greater, the preliminary assessment becomes significant with very high light fastness, standard fades to a contrast equal to 198
199 Grade (4) in gray scale. (Fan et al.,2004). If the final assessment is slower the rating to a contrast equals to grade 3 indicates that the sample has change very slightly. STRIPPING PROCESS The dye fixation ratio (%f) is the percentage of the exhausted dye chemically bound to the fabrics (nylon) was measured by refluxing the dyed fabrics samples in 25% pyridine for 10min at liquor ratio (LR) 1:20 to extract the unfixed dye (Abofarha, 2010). The procedure is repeated until the extract was clear. The concentration of extract was measured spectrophotometrically at λ max of the dye. The % fixation ratio (%f) and fixation efficiently (FE), which is the percentage of dye chemically bound relative to the total amount of dye used, were calculated using equation (2) and (3) respectively. Result. %F = D 0 -D T -D e (2) D 0 -D T FE = (E F) (3) 100 Where D e, is the amount of extracted dye at end of dyeing period. Table 1: The dye numbers, λmax, molecular weight and melting point. Dyes λmax (nm) molecular weight Mpt o C 10c d Table 2: Colour fastness according to AATCC Standard for dyes 10c and 10d at 2% dye concentration at best dyeing conditions in presence of glauber salt at ph c 10d Period in weeks Wash fastness Light fastness Wash fastness Light fastness
200 % EXHAUSTION c 10d TEMPERATURE Fig. 1: EFFECT OF TEMPERATURE ON % EXHAUSTION OF DYE 10a - 10f ON NYLON FABRIC 200
201 80 70 % EXHAUSTION c 10d PH Fig. 2: EFFECT OF PH % EXHAUSTION OF DYE 10a - 10f ON NYLON FABRIC % FIXATION c 10d TEMPERATURE Fig. 3: EFFECT OF TEMPERATURE ON % FIXATION OF DYE 10a - 10f ON NYLON FABRIC 201
202 % FIXATION c 10d PH Fig. 4: EFFECT OF PH ON % FIXATION OF DYE 10a - 10f NYLON FABRIC 202
203 FIXATION EFFICIENCY c 10d 0 PH Fig. 5: EFFECT OF PH ON FIXATION EFFICIENCY OF DYE 10a - 10f ON NYLON FABRIC EFFECT OF TEMPERATURE ON % EXHAUSTION OF DYE 10c and 10d ON NYLON FABRICS The effect of temperature on the absorption of 10c and 10d dyes on nylon 6,6 is investigated in the temperature range of o C at 2% shade and ph 11.0 in presences of 50g/l SS and 20g/l sodium carbonate Figure 1 shows the effect of temperature on percentage exhaustion of dyes 10c and 10d on nylon fabrics. In figure 1, the % exhaustion (10c) increases with temperature from 40% at 40 0 C to 73% at 80 0 C and, the % exhaustion of dye10d on nylon fabric increased from 48% at 40 0 C to 69% at 80 0 C and decreased as the temperature is extended above 80 0 C, The decrease in % exhaustion at the temperature above 80 0 C for nylon may be due to the instability of the dye molecules at high temperature. Figure 1 shows that the adsorption of 10c and 10d dyes on nylon enhanced with raise in temperature up to 80 o C for both dyes indicate that high temperature favoured the dye adsorption onto nylon fibre. However, temperature higher than 80 o C for10c and 10d dyes, respectively resulted to decrease in adsorption, which may be attributed to dye molecule instability at higher temperatures (Ali, 2009).The increase in temperature increase the mobility of large dye ions as well as produce a swelling effect with the internal structure of the fibre, thus enabling the large dye molecules to penetrate further (Yoshida et al,1993;venkat et al,2007). This may also be due an increase in the mobility of dye molecules with an increase in their kinetic energy, and the enhanced rate of intra particle diffusion of 203
204 sorbate with rise in temperature. It is clear that the sorption of 10c and 10d dyes onto nylon fibre is an endothermic process. EFFECT OF ph ON % EXHAUSTION OF DYE 10c and 10d ON NYLON FABRICS Figure 2, shows the effect of ph on % exhaustion on both nylon fabrics. In figure 2, the % exhaustion of dye 10c on nylon fabrics increased with ph from 24% at ph 3 and attains a maximum value of 69% at ph 11 while 10d increased from 16.% at ph 3 and attains a maximum of 67% at ph 11 and decreased as the ph is extended further. The low % exhaustion at the acidic medium may be due to the non ionization of the amino group of nylon fabric which facilitate the covalent bonding between the more electrophilic reactive groups of dyes base on monochlorotriazine and vinyl sulphone and the NH 2 groups of nylon fabric, This reflects the advantages of the combined reactive groups having different reactive levels, that complement each other for variations in dyeing conditions. Applying the dye at ph 11 generate two important advantages, firstly would increase the elimination of the temporarily anionic sulphatoethylsulphone groups, secondly maximize the concentration of the nucleophilic amino end groups on the fibre (Mohammed et al, 2013). This may suggest that the nonionic bifunctional vinylsulphone derivative of the dye, generated from the elimination reaction of two temporarily anionic sulphatoethylsulphone groups, in addition to the presence of the monochlorotriazine reactive group, can maximize the nucleophilic reaction with the amino groups on both fabrics. EFFECT OF TEMPERATURE ON %FIXATION OF DYE 10c and 10d ON NYLON FABRICS The results given in Figure 3 clearly show that the dye displays good build up and exhibits good rate of exhaustion on nylon fabric then equilibrate in sample(d) but decreased in sample (c) at further dyeing temperature, probably due to its good substantivity. It is also clear that the total fixation yield of the dye increases as the dyeing proceeds. This may be due to the hydrophobic character of the nonionic (vinylsulphone)/ MCT reactive systems in the dyes, generated from elimination reaction of the temporarily anionic (SES) groups, not only imparts high substantivity under the alkaline dyeing but also effectively exhibits high fixation efficiency. Figure 3 shows the effect of temperature on % fixation of dyes 10c, 10d on nylon fabrics. In figure 3, the % fixation of dye 10c on nylon fabrics increased with temperature from 36% at 40 o C and attains a maximum value of 69% at 80 o C while 10d increased from 35% at40 o C and attains a maximum fixation of 65% at 80 o C and decreased as the temperature is extended further. The observation is similar to the report of Rattanaphani (2007). FIXATION EFFICIENCY The fixation efficiency shows the effectiveness and efficiency of the dye in the dyeing process. It gives a comparison between the exhaustion and fixation of the dye on fabrics (nylon) with respect to ph. (Rattanaphani, 2007). Figure 4 shows the fixation efficiency of dye 10c on nylon fabrics increased with ph from 35% at ph 3 and attains a maximum value of 61% at ph 11 while 10d increased from 14% at ph 3 and attains a maximum of 68% at ph 11, decreased as 204
205 ph is extended further probably due to its good substantivity, then gradually equilibrates at dyeing ph 13 on both fabrics. This may be due to the hydrophobic character of the nonionic bis(vinylsulphone) reactive system in the dye, generated from elimination reaction of bis sulphatoethylsulphone) groups, not only imparts high substantivity under the alkaline dyeing but also effectively exhibits high fixation rate.( Farouk et al, 2012) Fastness properties The fastness properties of the dyes on nylon fabrics at 2%owf, liquor ratio 250:1, ph 11 and 80 C, were investigated and are given in Table 2. The results show that the fastness to washing and light on nylon displayed a good fastness to washing and light. Conclusion A new bifunctional reactive dye, derived from 2-amino thiazole containing two anionic SES and MCT reactive groups, has been synthesised and shown to have good dyeing performance on nylon 6,6 fabrics. Optimum exhaustion and fixation on fabrics was achieved by dyeing at ph 11 and 80 C. The β-elimination of the two anionic SES groups under alkaline conditions results in the formation of a nonionic reactive vinylsulphone derivative in combination with monochlorotriazine as having different reactivity level, achieving a complementary behaviour to resist variations in dyeing conditions, which in turn increase the dye fibre interaction and thus improve dye fixation on nylon 6,6 fabrics.bromo and methoxy group introduced on the para position of benzene ring of dye molecules induced a hypsochromic shift of 10nm and 30nm with respect to 10a. REFERENCES AATCC Technical Manual, American Association of Testile Chemists and Colorists, 75, 311, North Carolina, USA (1999). Abofarha S.A., Gamal A.M., Sallam H.B., Mahmoud G.E.A., Ismai L.F.M. (2010): Journal of American Science. Pp117, Ajayi J.O., (2005) Practical Manual of Textile, Faculty of Science, Department of Industrial Chemistry, ATBU. Unpublished Pp3-7 Ali S., Hussain T., Nawaz R., Journal of Cleaner Production, 17, 61 (2009). Anon, (2008). Broadbent Authur D. (2001) Basic principles of textile coloration. Bradford: Society of Dyers and Colourists; p 268. BS 1006: 1978, Color A02, A03 color fastness tests. Standard Mrthods for the Determination of the Colour Fastness of Textiles and Leather (A02, A03), Bradfotd: SDC, 4 th ed., (1996). Burkinshaw S.M., Son Y.A., (2001). Dyes Pigments. 48: Dalal M., and Desal K.R., (1996): Dyeing effects of bifunctional reactive dyes on knitted cotton fabric. Pp American science.org. Farouk R., Mohammed F.A, Youssef Y.A. and Mousa A.A., ( 2012). High Performance Thiophene- Based Bifunctional Sulphatoethylsulphone Disazo Reactive Disperse Dye on Silk and Nylon 6 Fabrics. J Am Sci;8(12): ]. (ISSN: ) Hunger K, (2008). Industrial dyes: chemistry, properties, applications. Weinheim: Wiley-VCJ Verlag 205
206 GmbH & Co. KGaA; p Mohammed F.A., Farouk R., Yousef Y.A. and Mousa A.A. (2013). Dyeing of Nylon 6 and Silk Fabrics with Novel Polyfunctional Disazo Reactive Disperse Dye. Journal of American Science 9(1):34-39]. (ISSN: ). Preston C (1986), The dyeing of cellulosic fibres. London: The Dyers Company Publications Trust; p Rattanaphani S., Chairat M., Bremner J.B. and Rattanaphani V. (2007). An adsorption and thermodynamic study of lac dyeing on cotton pretreated with chitosan, Dyes and Pigments, 72, Sadov F., Korchagin M. and Matetsky A. (1967) Chemical Technology of Fabrous Material. MIR Publishers, Pp14, 512, 642. Soleimani-Gorgani A., Taylor J.A. (2005). Dyeing of nylon with reactive dyes. Part 2. The effect changes in level of dye sulphonation on the dyeing of nylon with reactive dyes. Dyes and Pigments Trotman E.R. (1984), Dyeing and Chemical Technology of Textile Fabrics, Nottingham; 6 th ed; Venkat S.M., Indra D.M. and Vimal C.S., (2007). Use of bagasse fly ash as an adsorbent for the removal of brillian green dye from aqueous solution, Dyes Pigm., 73, Yoshida H., Okamoto A. and Kataoka T., Adsorption of acid dye on crosslinked chitosan fibers equilibra, Chem. Eng. Sci., 48, (1993). Yoon S.H., KimT.K.,.LimY.J,.SonY.A., Korean J, (2002). Soc Dyers Finishers 14:
207 EFFECTS OF SEEDING TIME AND COMPETITION PERIOD ON WEEDS, GROWTH AND YIELD OF DIRECT SEEDED FINE RICE (ORYZA SATIVA L.) Khuram Mubeen a, Amit J. Jhala b Muhammad Hussain a, M. H. Siddiqui a,faisal Zahoor a, Muhammad Shehzad a and Khalid Mehmood a a Department of Agronomy, The University Of Poonch, Rawalakot (Pakistan) b Department of Agronomy and Horticulture, University of Nebraska-Lincoln, , USA Department of Agronomy. The University of Poonch Rawalakot (AJK, Pakistan) ABSTRACT The information on combined effect of seeding time and competition period on weeds, phenology and yield of directly sown rice is very limited. Field experiments were conducted for two years during 2008 and 2009 to study these effects. Rice cultivar Super basmati was seeded during 1 st and 3 rd week of June and 1 st week of July and weeds were allowed to compete for 15, 30, 45, 60 days after seeding (DAS). Weed free treatment along with a weedy check was also maintained for comparison. Interaction effect of seeding time and competition period was significant. Weed crop competition until 15 DAS gave statistically similar kernel yield to weed free in different seeding times with better yield in plots sown in first week of June during both years. However an increase in competition period from 15 DAS to 30 DAS could not exhibit significant differences. Further increase in competition periods increased the weed density and biomass with significant reduction in yield. So rice may be direct seeded in first week of June and weeds be controlled from 15 to 30 DAS in direct seeded culture in agro physiological conditions of Faisalabad (Pakistan). However more research is needed on checking the competition between weeds and direct seeded rice in terms of density of weeds. Keywords: Oryza sativa, competition period, seeding time, weed, yield, hoeing. INTRODUCTION Rice is life for more than half of the world population. It is one of the most important cereal crops in Pakistan. Farmers will likely have to face limited availability of irrigation water in many rice-growing areas therefore, it is predicted that 17 million hectare of irrigated rice area in Asia may suffer from physical water scarcity and 22 million hectare area may have economic water scarcity by 2025 (Bouman and Tuong, 2001). Therefore, water shortage poses a significant threat to the sustainability of irrigated rice ecosystems as it may not be feasible for farmers to flood the fields to control weeds and to ensure good crop establishment (Johnson and Mortimer, 2005). Rice can be established in field primarily by transplanting nursery or by direct seeding. 207
208 Farmers are shifting towards direct seeding as it reduces crop establishment cost. Directseeding can potentially save water through earlier establishment of rice crop and facilitates early sowing of wheat (Ladha et al., 2003). Drill-seeding rice at optimum soil moisture conditions produced the maximum grain yield and net return. Other advantages of direct seeding over transplanting include stable growth, reduced lodging, less drought risks and flooding damage. Low herbicide price, availability of early maturing improved rice variety and shortage of labor have motivated rice farmers of several Asian countries to shift from transplanting to direct seeding (Pane, 2003). Dry-seeding on flat land with subsequent saturated soil conditions reduces the amount of water required during land preparation thereby reducing the water demand for rice production (Bouman and Tuong, 2001). On the other hand, there are serious problems associated with direct-seeded rice. Weed infestation is the most important constraint in achieving high yield of direct-seeded rice. Weeds adversely affect yield and quality of harvest and increase production costs, resulting in high economic losses (Alam, 1991). Among different factors responsible for lower yields, weed interference is of supreme importance. Compared to transplanted rice, the yield losses in DSR is greater due to absence of flooding water at the early stage of the crop to suppress weed growth (Singh et al. 2007). The critical weed crop competition period is very important for planning efficient weed control strategy. During this period, weeds offer maximum competition and cause significant yield losses. Critical period of competition varies from crop to crop depending on weed emergence time, weed type, weed density and management practices. It is important to determine critical period of weed-crop competition to plan effective weed control strategy (Mubeen et al. 2009). There are three relationships that can exist in critical period studies: a) When the critical weed free period is of no longer duration than the critical timing of weed removal, the crop must be kept weed free between these timings to prevent yield loss; b) the crop must be kept weedfree for the same duration that a weed infestation can be tolerated. In this situation, yield loss will be avoided if weed control is performed at this one critical time; c) when the critical timing of weed removal is longer than the critical weed-free period. In this case, yield loss will not occur if weeds are controlled at any point between these critical stages. To realize full economical and yield potential of rice, agronomic and cultural practices will have to be optimized to improve weed control efficiency and reduce cop-weed competition. In order to develop efficient herbicide use and provide a logical basis for the development of an integrated 208
209 weed management system, information on critical period of weed control is essential. This information may lead to less reliance on the use of residual herbicides and to more reliance on well-timed post-emergence herbicides. Reductions in quantities of herbicide applied will reduce potential environmental contamination and will reduce selection pressure for herbicide resistant weeds. In addition, timing of cover crop seeding and cultivations could be improved based upon critical period of weed competition in this crop. The value of critical period studies rests with the eventual uncovering of the physiological bases for crop-weed competition and its eventual use for weed control. Sowing of rice at the optimum time is very important for obtaining high yield and good quality of kernels (Anonymous, 1992). Delay in seeding increased yield losses of rice in competition of rice and red stem (Caton et al., 1999). Plant may exhibit its yield potential only when it is exposed to proper temperature by sowing at the proper time. The decreasing trend in grain yield with delayed seeding might be associated with significantly less number of filled grains per panicle, lower number of panicles m -2, and low 1000 kernel weight (Mishri and Kailash, 2005). Thus, to improve the yield potential of fine rice, optimum seeding time needs to be determined. Therefore, the present study was designed to determine the effects of weed competition periods and seeding time on the growth and yield of rice. MATERIALS AND METHODS 1. General Information Field experiments were conducted for 2 years in 2008 and 2009 at the research farm of the Department of Agronomy, University of Agriculture, Faisalabad, Pakistan. The research site was located at to N latitude and to 73.0 E longitude with an altitude of 150 m above sea level. The experimental soil was loam with ph 7.6, sand 36%, silt 45%, clay 17%, organic matter 1.0%, and total nitrogen 0.5%. 2. Treatment details Three seeding time of rice (1 st and 3 rd week of June, and 1 st week of July) and six competition period treatments were included in the experiment viz. Weed free, competition for 15, 30, 45, and 60 days after seeding (DAS). A weedy check (control) was also included in the 209
210 experiment for comparison. After prescribed period weeds were removed from plot by hoeing and were kept weed free till harvest. The field experiment was set up in a randomized complete block design with split plot arrangement with planting time in main plots and competition period treatments in sub plots with four replications. The net plot size was 5 m 2.6 m. To protect the crop from seed borne diseases, seeds were treated with thiophanate-methyl (Topsin-M fungicide, Arysta Life Science, 2 nd floor, Horizon Vista, Block No 4, Clifton, Karachi-75600, Pakistan) at 2 g kg -1. The seeds were soaked in water for 24 h and kept under shade in a gunny bag for sprouting. The nitrogen at 140 kg ha -1, phosphorus 80 kg ha -1, and potash 60 kg ha -1 was applied in the form of urea, diammonium phosphate, and sulfate of potash, respectively. All of the P and K and 1/3 rd of the N was incorporated into the soil at the time of seed bed preparation, while remaining N was top dressed in split dose at the time of booting and anthesis stage of the crop. The rice variety Super Basmati was planted in 20 cm rows using a single row hand driller (designed and manufactured at the University of Agriculture, Faisalabad, Pakistan) at a seed rate of 75 kg ha -1. First irrigation was given to the crop 4-5 d after planting in such a way that emerging seedlings are not submerged and this practice was continued for 2 weeks, after that irrigation was given until harvest of the crop. The crop was harvested manually at physiological maturity then allowed to be sun dried in the field. After a week, the crop was threshed depending on moisture level. 3. Data Collection The weed densities were assessed during the growing season within 0.5 m 2 quadrates (two quadrates per plot) for each competition period treatment at 30 DAT and at harvest. The weeds within a randomly selected 0.5 m 2 quadrates (two quadrates per plot) were cut at the stem base close to the soil surface, placed in paper bags, dried in an oven for 72 h at 60 C and total weed biomass was recorded (Table 1). Total number of tillers was counted within a randomly selected 0.5 m 2 quadrates (two quadrates per plot). Ten rice panicles were randomly selected to determine seeds per panicle and 1000 kernel weight. The crop was harvested manually and grain yield was recorded. Harvest index was calculated as the ratio of rice yield to total above ground biological yield and expressed in percent. Leaf area index was calculated as the ratio of leaf area to land area (Watson 1947). Plants were harvested four times from an area of 30 x 30 cm 2 and leaf area was measured using leaf area meter (CI-202, CID, Inc. Pakistan Land Scientific 210
211 Production, 30 Nisbet Road, Lahore, Pakistan). Leaf area duration (LAD) was estimated by using the following formula (Hunt 1978). LAD = (LAI 1 + LAI 2 ) (T 2 T 1 ) / 2 Where, LAD = Leaf are duration LAI 1 = Leaf area index at first harvest LAI 2 = Leaf area index at final harvest T 1 = Date of observation of first leaf area index T 2 = Date of observation of final leaf area index 4. Statistical Analysis All data were subjected to ANOVA using statistical analysis software version 9.2 (SAS, 2009) to test for treatment effects and possible interactions. Normality, homogeneity of variance, and interactions of treatments and years were tested. Interactions among years were significant; therefore, data were presented separately for each year. Weed density data were collected for each species; however, the data were combined and a total weed density data were presented. The data of weed density and biomass were square root transformed however; non-transformed means are presented with mean separation based on transformed values. Where the ANOVA indicated that treatment effects were significant, means were separated at P 0.05 and adjusted with Fisher s Protected Least Significant Difference (LSD) test. RESULTS AND DISCUSSION 1. Weed density and biomass Crowfootgrass [Dactyloctenium aegyptium (L.) Willd.], Horse purslane (Trianthema portulacastrum L.), goosegrass (Eleusine indica L.), and sedges (Cyperus spp.) were the common weed species found in the experimental area during both the growing seasons. At the harvest of crop not a single T. portulacastrum plant was observed as this weed had completed the life cycle before harvest of the crop during both the years. Treatment by year interaction was significant therefore, weed density and biomass data were presented separately for each year (Table 2 and 3). The results revealed statistically significant differences for total weed density 211
212 and biomass at 60 days after applying the treatment in 2008 and 2009 for individual and interactive response of seeding time and competition periods. Crop seeded earlier (first week of July) revealed maximum weed density and biomass after 60 days of applying the treatment which differed significantly to plots where crop was seeded late (first week of July) during both the growing seasons. The results are in accordance with the outcome of Mishra (2000) who reported that timely sown crop face more competition from jungle rice compared with delay in sowing of crop. Most of the weed seeds also require same environmental conditions as crop suitable for their growth and development. Furthermore rainfall early in the season favored the growth of weeds better than crop resulting in more density and biomass of weeds. Among competition period treatments significantly maximum density and biomass of weeds was noted in plots where weeds were allowed to compete with crop plants without adopting any control measure. The weed density increased gradually with increase in competition periods during both the years (Table 2). The combined effect of seeding time and competition period showed the maximum total weed density ( m -2 ) and biomass ( g m -2 ) when crop was sown late (first week of July) in 2008 where weeds were not removed at any stage (W 6 S 3 ). However, it could not differ significantly from crop sown earlier in weedy check condition (W 6 S 1 and W 6 S 2 ), respectively. Seeding time also could not bring significant variation in total weed density and biomass when weeds competed with crop for 15 DAS (Table 2). Similar trend was found in second growing season. This non-significant effect of delaying the seeding in weedy check and for 15 DAS might be owing to less variation in climatic conditions over time. 2. Growth attributes Significantly maximum leaf area index (LAI) was noted in weed free plots sown earlier among all treatments with minimum in plots sown late (first week of July) where weeds were not controlled throughout the growing season. Similar trend was observed during second growing season. Leaf area duration (LAD) highlights the importance of photosynthetic parts. Variation in yield between the treatments sometimes also determined based on leaf area duration as differences in kernel and straw yield may not truly explain the differences in their maximum LAIs. Significantly maximum leaf area duration was recorded in weed free plots with minimum in weedy check. LAD increased progressively with time (Table 4). Delaying the sowing of rice crop and increasing the competition period resulted in reduced leaf area duration. Second year of study also revealed similar results. Decreasing the competition period between crop and weeds 212
213 will help in improving the growth of rice. Weed free plots with improved leaf area index (LAI) and leaf area duration (LAD) in rice could be due to the lack of weed competition which improved the growth of crop. Absence of early weed competition improved the rate of crop growth which also improved the LAI. This confirms the previous finding of Oudhia and Tripathi (2000) that reducing the competition improved the growth and development of rice crop. 3. Rice yield attributes There was a significant difference among the years for rice yield attributes so the data of both the years is separately discussed. Difference in seeding time could not bring significant variation in total number of tillers during both the growing seasons. Among competition period significantly the maximum number of tillers ( and ) was observed in plots where weeds were not allowed to compete with crop throughout the season during 2008 and 2009, respectively. Significantly the maximum number of tillers per m 2 in weed free treatment was due to the availability of growth resources only to the crop where crop efficiently used all the growth resources as weeds were kept out of field by continuous removal until harvest. As the period of allowing weeds to compete with crop increased, the resources were also utilized by weeds. In weedy check plots where weeds competed with crop until harvest of the crop; significantly lowest number of tillers per m 2 was observed due to competition for resources between crop and weeds. With each increasing competition period the number of tillers decreased significantly (Table 5). Data on interactive effect of seeding time and competition period revealed that rice planted earlier (first week of June) showed the maximum number of tillers ( and ) when kept weed free throughout the growing season (W 1 S 1 ) during 2008 and 2009, respectively. Minimum number of tillers ( and ) was found when rice seeds were sown in third week of June and first week of July in weedy check plots (W 6 S 2 and W 6 S 3 ) during both the years, respectively. Maximum number of tillers m -2 in early sown crop (first week of June) during both the years could be attributed to more time available to crop for growth and development with quick and better canopy cover at early stage of the growth thereby suppressing weeds and subsequent increase in number of productive tillers per m 2. Whereas, in late sown rice (first week of July); less time was available to crop for providing the canopy cover. High rainfall at early stage also favored the weed germination and growth resulting in higher density and greater 213
214 competition. Thereby, weed cover on soil reduced the growth of crop and ultimately the stand of the crop. Altering the seeding dates could not reveal significant variation in weedy check plots and those where competition for 60 DAS was allowed during both the growing seasons. Crop seeded in first week of June showed no significant differences in plots with competition periods of 15 and 30 DAS during both the years. Almost similar trend was also observed for other seeding times (Table 5). Significantly less number of tillers in year 2008 over 2009 could be attributed to frequent and more rainfall in 2008 which favored the germination and growth of weed resulting in greater biological stress to crop due to weeds. Significant reduction in 1000 kernel weight was observed by delaying the seeding during both the years. Weed competition periods also had a pronounced effect on the kernel weight. The 1000 kernel weight decreased significantly with each increased competition period and the minimum 1000 kernel weight (13.65 and g) was noted in plots where weeds competed with rice plants throughout the growing period during 2008 and 2009, respectively. The interaction between weed competition periods and seeding times for 1000 kernel weight was significant. The early sown crop under weed free condition exhibited maximum 1000 kernel weight (18.87 and g) during both the years, respectively. Furthermore, among seeding times significantly more 1000 kernel weight in first week of June could be attributed to more time available for normal growth and development of rice. While delaying the sowing from first week of June to first week of July caused significant reduction in 1000 kernel weight due to gradual decrease in time available for crop growth and development to function efficiently and shifted to reproductive phase in less days with less assimilates and photosynthates in kernels. Reduction in kernel length and kernel length width ratio might also have caused reduction in 1000 kernel weight with each increase in competition period. Results are quite in consonance with the findings of Mishri and Kailash (2005) who reported that yield components of rice like tillers number m -2, number of filled grains panicle -1 and 1000-grain weight was found in the decreasing trend from the seeding of 15 th of June onward. The seeding time could not yield significant difference for kernel weight between (a) weed free, (b) competition for 15 DAS and (c) weedy check treatment during Whereas, during 2009; competition for 15 and 30 DAS was similar in all seeding times (Table 5). Relatively less and significantly lower 1000 kernel 214
215 weight in 2008 than in growing season of 2009 might be attributed to relatively high rainfall during early growth period which favored the growth and emergence of weeds. So a subsequent reduction in growth and development of crop was recorded. Management practices and growing conditions determine the kernel yield which is also dependent on cumulative effect of yield components. The data presented in Table 6 shows that seeding time and competition period affected the kernel yield significantly during both the years. The significantly maximum kernel yield of 2448 kg ha -1 and 2656 kg ha -1 was recorded when rice was sown early (first week of June) during 2008 and 2009, respectively. The kernel yield decreased significantly with each delay in sowing during both the growing seasons. The effect of competition period on kernel yield of rice was also significant with maximum kernel yield in weed free plots (W 1 ) during both the years. The plots with weed free situation and competition period for 15 DAS were statistically similar and thereafter each increase in competition period significantly decreased the kernel yield and with least in weedy check plots. The interactive effect of weed competition periods and seeding time for kernel yield was also significant during both the years. Rice sown in first week of June showed maximum kernel yield of 2973 and 3176 kg ha -1 when no competition was allowed between rice crop and weeds (W 1 S 1 ) during both the years, respectively. Whereas, the least kernel yield (1578 and 1723 kg ha - 1 ) was found in case of interactive effect of rice sown in first week of June and weed competition throughout the growing season during both the years, respectively. These results confirm the previous finding of Sreedevi and Thomas (1993) who reported lower grain yield in weedy check. Significant reduction in kernel yield with delay in sowing could be attributed to the fact that as the time available for normal growth and development was reduced the plants tend to complete their life cycle therefore forced early shift towards reproductive stage with less photosynthates accumulation. Delay in sowing significantly reduced 1000 kernel weight thereby causing a significant reduction in kernel yield. The differences between rice plants under weedy check situation and competition for 60 DAS were non-significant for late and medium sowing during both the years of study (Table 6). Due to an increase in competition duration between crop and weeds kernel yield decreased significantly from 1.75 % to % during 2008 and from 1.54 % to % during growing seasons of 2008 and 2009 respectively. Increase in period of weed crop competition resulted in increase in the resource sharing between weeds and rice ultimately showing less 215
216 number of productive tillers, spikelets per panicle, panicle length and 1000 kernel weight. At 15 DAS the loss caused by weeds was not significant as at that stage weeds were at early seedling stage which could not significantly fetch the growth resources of rice. Therefore the interactive effect of seeding time and rice plants under weed free plots beside rice plants facing weed competition for 15 DAS showed non-significant differences. Resource sharing was increased with each increase in competition period therefore kernel yield showed a linear and significant reduction in kernel yield. Among seeding times, maximum kernel yield in early sown crop (first week of June) in both the years might be due to the sufficient time available for crop to complete the physiological processes. Maximum kernel yield in weed free is due to lack of weed competition where crop plants had full chance to utilize the growth resources. Whereas the minimum yield in weedy check is due to the poor crop growth owing to presence of weeds throughout the growing season depleting the soil moisture and nutrients. The significant reduction in kernel yield observed in 2008 over 2009 could be attributed to lower 1000 kernel weight, panicle length, number of spikelets per panicle, kernel length and number of productive tillers per m 2 in Harvest index is the ratio of crop yield to total biological yield. Results obtained were similar as observed for kernel yield. Significantly maximum harvest index of rice (21.36 and %) was noted when crop was sown in first week of June (S 1 ) during 2008 and 2009, respectively. Delay in seeding time caused significant reduction in harvest index of rice crop with minimum (18.65 and %) when crop was directly sown in first week of July (S 3 ) during 2008 and 2009, respectively. In weed free (W 1 ) treatment maximum harvest index (23.20 and %) was noted while harvest index decreased significantly with each increase in competition period during 2008 and 2009, respectively. The significantly minimum harvest index (15.61 and %) was recorded in weedy check (W 6 ) in growing seasons of both years. The interaction between weed competition periods and seeding times were also significant during both the years. Crop sown early (first week of June) in plots kept weed free (W 1 S 1 ) yielded highest harvest index (23.85 and %) during 2008 and 2009, respectively. Whereas the minimum (15.14 and %) was noted when weeds competed with crop throughout the growing season (W 6 S 3 ) during 2008 and 2009, respectively (Table 6). Significantly higher harvest index (HI) in 2009 was due to higher 216
217 kernel yield beside other yield components like 1000 kernel weight and number of productive tillers per m 2 etc. Economic threshold level is monitored in terms of the (a) duration for which weed compete with crop and (b) density of the weed/s competing with crop. This research based on duration of competition for evaluating the economic threshold level shows that rice may be direct seeded in first week of June and weeds be controlled within 15 to 30 DAS in direct seeded culture in agro physiological conditions of Faisalabad (Pakistan). However more research is required to investigate the economic threshold level in terms of density of the common weeds in direct seeded rice in Pakistan for planning an effective, economical and eco friendly weed management plan. LITERATURE CITED Alam, S.M. (1991). Weed Science Problem in Pakistan. Pak. Gulf. Eco. 3-9: Anonymous (1992). Progress report. All India co-ordinated rice improvement project, pp: Bouman, B.A.M. and T.P. Tuong (2001). Field water management to save water and increase its productivity in irrigated lowland rice. Agric. Water Manage. 65: Caton, B.P., T.C. Foin and J.E. Hill (1999). A plant growth model for integrated weed management in direct seeded rice. III. Interspecific competition for light. Field Crops Res., 63: Hunt, R. (1978). Plant Growth Analysis. Edward Arnold, U.K., Pp., Johnson, D.E. and A.M. Mortimer (2005). Issues for weed management in direct seeded rice and the development of decision support framework. In Direct Seeding o of Rice and Weed Management in the Irrigated Rice Wheat Cropping System of the Indo Gangetic Plains (Y. Singh, G. Singh, V. P. Singh, P. Singh, B. Hardy, D. E. Johnson, and M. Mortimer, Eds.), p. 20. Directorate of Experiment Station, G.B. Pant University of Agriculture and Technology, Pantnagar, India. Ladha, J.K., D. Dawe, H. Pathak, A.T. Padre, R.L. Yadav, B. Singh, Y. Singh, P. Singh, A.L. Singh, R. Kundu, N. Sakal, A.P. Ram, S.K. Regmi, L. Gami, R. Bhandari, C. 217
218 Amin, R. Yadav, E.M. Bhattarai, S. Das, H.P. Aggarwal, R.K. Gupta and P.R. Hobbse (2003). How extensive are yield declines in long term rice wheat experiments in Asia. Field Crops Res. 81, Mishra, G.N. (2000). Crop weed competition under varying densities of jungle rice (Echinochloa colona) in upland rice (Oryza sativa). Ind. J. Agri. Sci., 70 (4): Mishri, L.S. and P.B. Kailash (2005). Response of wet seeded rice varieties to sowing Nepal Agric. Res. J., 6: 35. dates. Mubeen K., A. Tanveer, M.A. Nadeem, N. Sarwar and M. Shahzad (2009). Critical period of weed-crop competition in fennel (Foeniculum vulgare Mill.). Pak. J. Weed Sci. Res. 15 (2-3): Oudhia, P. and R.S. Tripathi (2000). Allelopathic effects of some plants extracts on rice var. Mahamaya. Res. Crops. 1(1): Pane, H. (2003). Perspective and constraints of direct-seeded rice technology expansion. J. Penelitian dan Pengembangan Pertanian, 22(4): SAS (2009). Statistical Analysis Systems. SAS/STAT User s Guide, SAS Institute, P.O. Box 8000, Cary, NC Singh, S., J.K. Ladha, R.K. Gupta, L. Bhushan, A.N. Rao, B. Sivaprasad and P.P. Singh (2007). Evaluation of mulching, intercropping with Sesbania and herbicide use for weed management in dry-seeded rice (Oryza sativa L.). Crop Prot. 26, Sreedevi, P., and C.G. Thomas (1993). Efficacy of anilofs on the control of weeds in direct sown puddle rice. In Absts. Papers, annual conference of Ind. Soc. Weed Sci., 3: Watson, D.J. (1947). Comparative physiological studies on the growth of field crops. I. Variation in net assimilation rate and leaf area between species and varieties and between years. Ann. Bot. 11,
219 Table 1. Dates of agronomic operations conducted during the research experiment in 2008 and 2009 Name of operation a Seeding date in 1 st week of June (S 1 ) Seeding date in 3 rd week of June (S 2 ) Seeding date in 1 st week of July (S 3 ) 03 June 06 June 18 June 20 June 03 July 06 July Competition for 15 DAS Kept weed free after 18 June, 03 July and 18 July respectively for 3 seeding dates S 1, S 2, and S 3 Competition for 30 DAS Kept weed free after 03 July, 18 July, and 03 Aug. respectively for 3 seeding dates S 1, S 2, and S 3 Competition for 45 DAS Kept weed free after 18 July, 03 Aug. and 18 Aug. respectively for 3 seeding dates S 1, S 2, and S 3 Competition for 60 DAS Kept weed free after 03 Aug., 18 Aug. and 03 Sept. respectively for 3 seeding dates S 1, S 2, and S 3 Kept weed free after 21 June, 05 July and 21 July respectively for 3 seeding dates S 1, S 2, and S 3 Kept weed free after 06 July, 20 July and 06 Aug. respectively for 3 seeding dates S 1, S 2, and S 3 Kept weed free after 21 July, 04 Aug. and 21 Aug. respectively for 3 seeding dates S 1, S 2, and S 3 Kept weed free after 06 Aug., 20 Aug. and 06 Sept. respectively for 3 seeding dates S 1, S 2, and S 3 Plants harvested for leaf area index 20 Aug., 5 Sep., 20 Sep., 5 Oct. 21 Aug., 6 Sep., 21 Sep., 6 Oct. Harvesting of rice 05 Nov. (for all seeding dates) 06 Nov. (for all seeding dates) Threshing 08 Nov. (for all seeding dates) 09 Nov. (for all seeding dates) a Abbreviations: DAS, days after seeding. 219
220 Table 2: Interaction effects of seeding time and competition period treatments on total weed density at 60 days after treatment in DSR a in 2008 and 2009 b Treatment Total weed density 60 days after treatment (m -2 ) S 1 S 2 S 3 S 1 S 2 S 3 No competition (Weed 00.00f 00.00f 00.00f 00.00g 00.00g 00.00g free) Competition for 15 DAS 27.82e 31.14e 42.44e 16.67f 22.14f 33.99ef Competition for 30 DAS 50.28de 66.40d 85.55cd 37.21ef 48.88e 61.77de Competition for 45 DAS 97.86c bc b 68.88d 93.33c 97.44bc Competition for 60 DAS b bc bc b bc bc Competition throughout the season (Weedy check) a a a a a a a DSR= Direct seeded rice b The data were arc-sine transformed for homogenous variance prior to analysis; however, data presented are the means of actual values for comparison. 220
221 Table 3: Interaction effects of seeding time and competition period treatments on total weed biomass at 60 days after treatment in DSR in 2008 and 2009 a Treatment Total weed biomass 60 days after treatment (g m -2 ) S 1 S 2 S 3 S 1 S 2 S 3 No competition (Weed free) f f f f f f Competition for 15 DAS e de e de de e Competition for 30 DAS d d cd de cd de Competition for 45 DAS c bc bc c b b Competition for 60 DAS Competition throughout the season (Weedy check) bc ab bc a b a b a b a b a DSR= Direct seeded rice 221
222 Table 4. Interaction effects of seeding time and competition period treatments on leaf area index and leaf area duration in 2008 and 2009 Treatment LAI LAD S 1 S 2 S 3 S 1 S 2 S 3 S 1 S 2 S 3 S 1 No competition (Weed free) Competition for 15 DAS 2.53 a 2.43 b 2.49 ab 2.38 bc 2.43b 2.57a 2.52ab 2.46b a ab bc a c 2.47b 2.40bc 2.34c b c d b 1 Competition for 30 DAS 2.31 c 2.25 cd 2.19de 2.35c 2.28cd 2.21d cd de ef c 1 Competition for 45 DAS 2.22 d 2.16 de 2.08e 2.26cd 2.18de 2.12de e ef fg 118.7d 1 Competition for 60 DAS 2.14 e 2.07 e 1.99f 2.17de 2.10e 2.03ef f g g e 1 Competition throughout the season (Weedy check) 1.99 f 1.95 f 1.85g 2.07e 1.97f 1.87g h h 98.69i f 1
223 Table 5. Interaction effects of seeding time and competition period treatments on number of rice tillers and 1000 kernel weight in 2008 and 2009 Treatment Number of tillers (m -2 ) 1000 kernel wt. (g) S 1 S 2 S 3 S 1 S 2 S 3 S 1 S 2 S 3 S 1 No competition (Weed free) a a a a ab ab a ab ab a 19 ab Competition for 15 DAS b b b b bc bc ab b b ab 18 Competition for 30 DAS bc bc bc bc c cd c cd de c 17 Competition for 45 DAS c c c c cd cd cd d g c 16 Competition for 60 DAS cd cd cd cd cd d de fg fg de 14 Competition throughout the season (Weedy check) d d d d d d f fg fg e 14
224 Table 6. Interaction effects of seeding time and competition period treatments on rice yield, percent reduction in yield, and harvest index in 2008 and 2009 Treatment Kernel Yield (kg ha -1 ) % reduction in yield in first ST over weed free H.I. ( S 1 S 2 S 3 S 1 S 2 S 3 S 1 S 2 S 3 No competition (Weed free) Competition for 15 DAS 2973 a 2902 ab 2921 ab 2839 ab 2847 ab 2807 ab 3176 a 3127 ab 3118 ab 3045 ab 3052 ab 3016 ab a ab ab ab b b Competition for 30 DAS 2580 b 2495 bc 2378 bc 2789 b 2604 bc 2587 bc b b c Competition for 45 DAS 2410 bc 2394 bc 1919 cd 2619 bc 2603 bc 2224 cd b bc d Competition for 60 DAS 2176 c 1709 d 1680 d 2385 c 1915 d 1849 d c de e Competition throughout the season (Weedy check) 1630 d 1602 d 1578 d 1839 d 1758 d 1723 d de e e
225 ACETYLATION OF WOOD FLOUR FROM FOUR WOOD SPECIES GROWN IN NIGERIA USING VINEGAR AND ACETIC ANHYDRIDE. Yakubu. Azeh 1 *, Gabriel. Ademola. Olatunji 2, Cheku Mohammed 3. 1 Chemistry Department, Ibrahim Badamasi Babangida University, Lapai. Nigeria. 2 Chemistry Department, University of Ilorin, Ilorin. Nigeria. 3 Chemistry Department, Ibrahim Badamasi Babangida University, Lapai. Nigeria. Abstract Effect of acetylation on pre-treated wood flour of different wood species, Boabab (Adansonia Digitata), Mahoganny (Daniella Oliveri), African locust bean (Parkia Biglobosa) and Beech wood (Gmelina Arborea), has been investigated. Acetylation was carried out in batches using acetic anhydride and then with commercial vinegar in the presence of varying amount of CaCl 2 as catalyst and at temperature of 120 C for 3 h under reflux. The success of acetylation was determined based on Weight Percent Gains. FT-IR spectroscopy, a veritable tool was used for the analysis of both treated and untreated samples to further investigate the success of acetylation. The results showed the presence of important band such as carbonyl absorptions at 1743, 1744, 1746, 1731, 1718 and 1696 cm -1 as appeared separately in the spectra of acetylated samples, confirming esterification occurred. The purpose of this work was to investigate the applicability of vinegar for acetylation of lignocellulosic fibers. Acetic anhydride is a common acetylation reagent, but its utilization is restrictly prohibited in some countries. Using commercial vinegar as an alternative reagent was quite novel and interesting. Blends/composites were prepared by solution casting and their kinetics investigated in distilled water. The results indicated they could be used in outdoor/packaging applications. Keywords: Acetylation, vinegar, acetic anhydride, wood flour, composites/blends. INTRODUCTION Composites have been described as materials composed of a hard material with discontinuous reinforcement that is embedded in a weaker, continuous matrix. The reinforcement matrix (Supri and Lim, 2009) maintains the position and orientation of the reinforcement. The constituents of the composites retain their individual, physical and chemical properties. Composites give a combination of qualities that are very different from the individual constituents that constituted the composite. Several reports on thermoplastic composites have been documented. Different types of modified and unmodified natural fibres such as wood fibers and flour, kenaf fibers, sago, rice starch, cornstarch, henequen fibers, and pineapple-leaf fibers, have been used as fillers in polymer matrices (Supri and Lim, 2009; Azeh et al, 2012). Dimensional stability and strength of unmodified wood flour polyethylene composites was reported to have improved by increased in fibre loading(s). Unmodified starch has been used to produce composites of low density polyethylene (LDPE). Composites of unmodified starch have been reported to exhibit low mechanical properties, though with improved biodegradation. The introduction of ester groups unto starch surface, manipulate its properties and support the blending mechanism (Sriroth, 2000). Wood-Plastic composites have been described as products form by combining treated or untreated wood in the form of fibre or particles and a thermoplastic polymer such as polyethylene, polyvinyl Chloride or polypropylene (Kristoffer et al, 2012). Wood-plastics have significant applications in various fields such as construction / engineering. Wood as a construction material, its use is impaired under certain degradative agents due to its hydrophilic nature, presence of cellulose, a food substrate for micro-organisms. For this reason, interest in eco-friendly methods to improve the performance of wood are been developed. All over the world, efforts are been made to move away from toxic to non-toxic means of wood modification.
226 Chemical modification of wood is a very good alternative to conventional wood preservation methods. Acetylation has received considerable attention more than any other chemical modification techniques known (Rowell et al, 1994). This method not only protect wood/wood based products against degradative agents, but also changes the hydrophilic nature of the wood components (Cellulose, Hemicelluloses and Lignin) to hydrophobic by increasing the acetyl contents in the polymers while decreasing their OH groups. This, therefore, enhances the surface energy and interfacial interaction between acetylated wood-dust and the hydrophobic polymers. It has been reported that for every acetyl gain, one OH group is eliminated. Implying, there is a reduction in hydrogen bonding within the wood reactive polymers. This can increase the interfacial bonding of PE with the acetylated wood surface (Frihart et al, 2004). Since, the surface qualities play a significant role to satisfactory interfacial performance; we therefore, acetylate four different wood flour of four wood species grown in Nigeria using acetic anhydride and as well investigate the feasibility to use commercially available vinegar for acetylation of cellulose in lignocellulosic materials because of its low cost, availability and renewability. Acetylation of cellulose in wood flour was carried out in the presence of varying amount of CaCl 2 as catalyst to manipulate its properties in order to support the blending mechanism. The objectives of this work were to investigate the feasibility of vinegar for acetylation, preparation of blends/composite and investigation of their sorption kinetics in distilled water for application in industry. MATERIALS AND METHODS Wood flour used were from four wood species Baobab (Adansonia Digitata), Mahoganny (Daniella Oliveri), African locust bean (Parkia Biglobosa) and Beech wood (Gmelina Arborea) collected from a saw-mill located in Niger State - Nigeria. Reagents and chemicals used were obtained from May and Baker and these include; Commercial Vinegar, Acetic anhydride, NaOH, ethanol, toluene, sulphuric acid, hypochlorite, CaCl 2. All reagents used were of analytical grade. SOXHLET EXTRACTION To reduce the influence of wood extractives on the acetylation, 5 g of 2 mm size wood particles were extracted with a mixture of ethanol-toluene (2 : 1 v/v) for 3 h. After extraction, samples were rinse with ethanol followed by hot water and then oven-dried at 105 O C for 24 h to reach constant weight. Extractible content was calculated as a percentage of oven-dried test samples. SAMPLE PRE-TREATMENT BY MERCERIZATION Mercerization of 2 g oven-dried extracted sample was mercerized using 20 ml of 10 % NaOH solution. The mixture was placed on a shaker and shake at 75 rpm for 1 h. The sample was washed with distilled water until it was neutral. The residue was oven-dried at 105 O C for 1 h. The procedure was repeated for each wood flour sample. CHEMICAL MODIFICATION Acetylation Acetylation was carried out in batches. The first batch was conducted using acetic anhydride while the second batch was carried out using commercial vinegar as acetylating agents in the presence of varying amount of CaCl 2 as catalyst. 2 g of oven-dried samples of wood species oven-dried at 105 O C with a constant weight (wunt) were treated with the acetylating chemicals each with 0.5, 1 g CaCl 2 catalyst at 120 O C during 3 h refluxing. After modification, the residues were thoroughly washed with distilled water until neutral and then oven-dried for 3 h. The extent of acetylation was calculated as weight percent gains (WPGs) based on the differences in oven-dried weight of the samples before and after modification (Wunt) and after modification (Wtrt) according to the equation;
227 BLENDING PROCEDURES The dissolution of high density polyethylene (packaged water sachets) follows the method described by (Abdulkareem et al, 2005). In brief, 1 g pieces of non-printed portion were placed in a reaction flask and 30 ml of toluene was added. The content was placed on a hot plate at 100 O C, and a thermometer was inserted. The sachets swelled at 60 O C, and then rapidly dissolved at 80 O C to give a clear solution. Blending of high density polyethylene and acetylated wood flour is thus described. Into the clear solution of high density polyethylene sachets was introduced 0.5 /1.0 g of each vinegar / acetic anhydride treated or untreated wood flour while stirring for 5 min and then spread on clean metal plates to form a film. The thin films formed were peeled-off the metal plates to afford acetylated wood flour / polyethylene blends (Azeh et al, 2012). WATER ABSORPTION TEST OF ACETYLATED AND UNTREATED BLENDS Three sets of specimens were prepared. Acetylated blends and untreated blends were subjected to water absorption test. The blends were soaked for 1, 2 and 16 h respectively. After each immersion, the blends were removed and wipe off using filter paper and then weighed and weight were noted. Using the formula 100 % Where H1= Initial weight of blend before immersion in water and H2 = Weight of blend after immersion in water. FOURIER TRANSFORM INFRARED SPECTROSCOPY ANALYSIS The properties of acetylated and untreated samples were characterized using FT-IR, Perkin-ELMER- 8400S Spectrophotometer in the range 4000 cm-1 to 400 cm-1. Samples were run using the KBr pellet technique at the National Research Institute for Chemical Technology (NARICT), Zaria, Kaduna- Nigeria. RESULTS AND DISCUSSION Table 1. Assignment of the IR spectra bands of functional groups in acetylated wood flour treated with acetic anhydride. Band position (cm -1) Functional group -OH bonded stretching vibrations C=O stretching vibrations of acetate group C H methyl and methylene groups. (- C-CH3 -) in acetate group due to acetylation. (νc-o) stretching band vibrations of the acetyl moieties OH of absorbed water. (C=C), Aromatic skeletal absorption caused by lignin. C O stretching vibrations in cellulose, hemicelluloses and primary alcohol. C O stretching in acetyl (Covalence vibration). C H out of plane stretching absorption of aromatic ring vibrations caused by lignin.
228 Table 2. Assignment of the IR spectra bands of functional groups in acetylated wood flour treated with Vinegar based on acetic anhydride and ketene related work. Band position (cm -1) and Functional group OH stretching (bonded) vibrations C=O stretching vibrations of acetate group C=O stretching in acetyl groups C H stretch of methylene in celluloses and hemicelluloses CH 3 symmetric stretch of methyl groups of aliphatic. (-C-CH 3 -) deformation of acetate group in cellulose and hemicelluloses (νc-o) stretching band vibrations of the acetyl moieties and (C=O) deformation in the ester bond during acetylation. C=C stretching of aromatic ring of syringyl in lignin. C=O stretching of (COOH) in glucoronic acid. C=C Stretching of the aromatic ring caused by lignin. C O stretching vibrations in cellulose, hemicelluloses and primary alcohol CH 2 deformation and stretching in Cellulose, Lignin and Xylan. C H out of plane stretching absorption of aromatic ring vibrations caused by lignin. The IR spectra of acetic anhydride or vinegar treated wood flour showing the major absorption bands are shown in table 1 and 2 above. The following strong absorption bands as reflected separately on the IR spectra of vinegar treated wood flour are characteristic absorptions of bonded OH and these include, , , , , , and cm -1 (Azeh et al, 2012; Tuong and Li, 2010; Mohebby, 2008). The following peak intensities at 3029, 3104, 3345, 3602, 3352, 3852 and 3938 cm -1 as reflected separately on the IR spectra of acetic anhydride treated wood flour are characteristic absorptions of bonded OH group stretching vibrations in cellulose and hemicelluloses. Acetic anhydride or vinegar treated wood flour showed reductions in OH absorption bands. The OH absorption bands of untreated wood flour were predominantly detected at 4008, 4055, 4107, 4290, 4394, 4413, 4567, 4570, 4685 and 4696 cm -1. The intensity of the OH absorption bands in treated samples decreased. This decrease in intensity of OH band is an indication that, the hydroxyl group contents in wood flour were reduced during reaction. Indicating that some level of acetylation had taken place (Azeh et al, 2012; Bodirlau and Teaca, 2007; Mohebby, 2008). The presence of OH absorption in vinegar/acetic anhydride treated wood flour has been attributed to hydroxyl functionalities that are not accessible to chemical reagent (Callum, 2002). The band at cm -1 as reflected on acetic anhydride treated wood flour is a characteristic absorption of carbonyl (C=O ester) stretching vibration of acetate group in cellulose and Uronic ester in hemicelluloses. This band showed evidence of acetylation (Bodirlau and Teaca, 2007; Nasar et al, 2010; Mohebby, 2008; Adebajo and Frost, 2004; Indrayan et al, 2000; Morrison and Boyd). The peak absorption increased in acetic anhydride treated samples, indicating high level of acetyl gain as shown in Table 3. While
229 vinegar treated samples showed this band at 1718 cm -1 and 1696 cm -1. The low level of acetylation could be attributed to low percent acetyl content in vinegar and shorter reaction time adopted for acetylation. Since, vinegar treated Baobab sample gave % (WPG) during four hour reaction unlike other samples who gave less than % during 3 h reaction as reflected in Table 3. This implies that, longer reaction times are required for acetylation using vinegar cm -1 carbonyl (C=O) absorption peak have been reported in ketene treated wood cellulose (Azeh et al, 2012). The peak here has been attributed to low penetration of acetyl. Consequently leading to lower percent gains. The absorption band at 2723 cm -1 and 2820 cm -1 observed in vinegar treated samples have been assigned to C-H stretching vibrations of CH 2 and CH 3 groups in cellulose and hemicelluloses (Azeh et al, 2012; Adebajo and Frost, 2004). The presence of absorption peaks at cm -1 reflected on acetic anhydride and cm -1 in vinegar treated samples have both been assigned to asymmetric stretching vibration of aliphatic CH 3 group which is evidence of acetylation (Azeh et al, 2012; Tuong and Li, 2010; Nasar et al, 2010; Nada et al, 2009; Cetin and Ozmen 2011). The small bands at and cm -1 in acetic anhydride or vinegar treated samples are assigned to adsorbed water, β-glucosidic linkages (ether - C O C -) in the cellulose chain or sugar units or could be due to aromatic ring (C = C) vibrations in lignin (Syringyl) (Azeh et al, 2012; Bodirlau and Teaca, 2007; Nasar et al, 2010; Mohebby, 2008; Callum, 2002). The absorption bands at cm -1 are characteristic absorption of aromatic (C=C) stretching vibrations caused by lignin (Guaiacyl) (Azeh et al, 2012; Bodirlau and Teaca, 2007; Tuong and Li, 2010; Nasar et al, 2010; Mohebby, 2008; Callum, 2002). This suggests the presence of lignin (Mohebby, 2008; Callum, 2002). The bands at cm -1 are due to C-H deformations and bending vibrations of CH 2 (methylene) in cellulose and hemicelluloses (Azeh et al, 2012; Morrison and Boy`d; Sandak et al, 2009; Adebajo and Frost, 2004; Sikorki et al, 2004). These bands were not found in acetic anhydride treated wood flour. The reason could be that, longer reaction time adopted led to product (cellulose/hemicelluloses) degradation and subsequently their extraction by acetylating chemical occurred and was probably washed alongside with the by-products. An important band which showed that some level of acetylation was achieved by the two reagents used for acetylation were observed at cm -1 for acetic anhydride and for vinegar. This important band was attributed to aliphatic C-H deformation/bending vibration of CH 3 in acetyl and this is evidence of the formation of ester bond due to acetylation in cellulose and hemicelluloses (Azeh et al, 2012; Bodirlau and Teaca, 2007; Mohebby, 2008; Indrayan et al, 2000). This absorption peak was missing in control samples. A prominent absorption band which further gave evidence of acetylation appeared at cm -1 for acetic anhydride while cm -1 peak absorption was detected for vinegar as alternative and novel acetylation agent. This band has been assigned for stretching of C O and deformation of C=O in the acetate bond formed during acetylation in xylan and lignin (Tuong and Li, 2010; Indrayan et al, 2000; Mohebby, 2008; Adebajo and Frost, 2004). The absence of absorption band at cm -1 in all the spectra of acetic anhydride treated samples was an indication that, the acetylated products were free of unreacted acetic anhydride, implying that the reagent was used-up during the reaction. While the absence of absorption peak at 1700 cm -1 in all spectra is evidence of the absence of unreacted carboxylic acid in vinegar treated samples and as a by-products in acetic anhydride treated wood flour respectively. The bands at cm -1 are assigned to C O stretching vibrations in cellulose, hemicelluloses and that of primary alcohol (Azeh et al, 2012; Bodirlau and Teaca, 2007; Nasar et al, 2010; Mohebby, 2008). The medium band at 1052 cm -1 ascribed to C-O stretching vibration of acetyl group in acetate (Azeh et al, 2012; Morrison and Boy`d; Nasar et al, 2010) is evidence of acetylation.
230 Table 3: Average Weight Percent Gain (WPG) in Vinegar and Acetic Anhydride Treated Wood Flour Sample Gmelina Mahogany Baobab Locust bean Acetic anhydride (%) Sample Vinegar (%) Gmelina Mahogany Baobab Locust bean Water Absorption Kinetics of Acetylated and Control Wood Flour Samples. Table 4: Percent of water absorption after soaking for 1, 2 and 16 hours. S/N Blend Sample Dry weight (g) 1 Acetic anhydride treated blends 1.00 Weight after soaking/h 1h, 2h, 16h Percentage of water Absorption (%)/h 1h 2h 16h Acetic anhydride untreated blends Vinegar Untreated blends Vinegar treated blends Three sets of specimens were prepared, as shown in table 3 above. Blends prepared from acetylated wood flour were flexible, brittle and very smooth and absorbed less water compared with untreated blends which were coarse with rough surface. Modification of fibre surface really help to manipulate its properties and supports the blending mechanism as was observed on blends made from treated wood flour. It has been established that when the accessible hydroxyl groups in the cell wall polymers have been substituted by acetyl, reduction in water and moisture sorption are observed, and this depends on the level of acetylation too. The results also showed that, water absorption of blends is dependent on fibres in the matrix. It is expected that, the sorption rate for 16 h soaking duration should give about 16 times the results obtained for 1 / 2 h soaking periods. However, this was not observed. Indicating that, the fibres in the polymer matrix have reached their saturation point and thereby cannot absorb much water molecules. Acetylated blends reached fibre saturation point faster compared to untreated blends as indicated by the percent water uptake / sorption rate in tables 3. This is attributed to modification of the hydrophilic fibre surface by acetyl moieties and subsequent hydrophobicity improvement of fibre surface which allowed for proper interfacial bonding with polyethylene. Results of the Formation of Blends Blends obtained from the incorporation of acetylated wood flour with polyethylene were flexible and had smooth surface (Figures 1a and 1b). These blends were easily peeled-off the film forming plate while those obtained from untreated wood flour were porous, coarse and were difficult to peel-off from the film forming plate. For this reason, blends had rough surface (Figure 1c). Poor blend formation exhibited by untreated wood flour could be attributed to facial differences between the two materialshydrophilic biopolymers in wood flour and the hydrophobic polyethylene, causing very poor interfacial interaction between the materials (Azeh et al, 2012). Treated wood flour resulted in the formation of
231 flexible blends with smooth surface after incorporation and solution casting on metal plates. The properties exhibited by these blends was an indication that, acetylation using vinegar and acetic anhydride successfully transformed accessible hydrophilic hydroxyl surfaces of the biopolymers in wood flour to hydrophobic surface (acetyls) which causes proper interfacial interaction with polyethylene as reported by (Azeh et al, 2012; George et al, 1998; Azeh et al, 2012). Figure 1a. Photographic Plate of Acetylated Blend (1 g Wood flour / 1 g Polyethylene Loading) Figure 1c. Photographic Plate of Acetylated Blends (0.5 g Wood flour / 1 g Polyethylene Loading) Figure 1b. Photographic Plate of Untreated Blend (0.5g Wood flour / 1 g Polyethylene Loading) CONCLUSION In this work we have been able to carry out acetylation of cellulose in wood flour using vinegar successfully. Results of the kinetic studies of blends indicated that, treated blends had lower water sorption than untreated blends. Because treated blends had lower hygroscopic surface with a high hydrophobic energy surface that facilitated its interaction with polyethylene during the blending
232 process. While untreated blends had high water sorption, due to the presence of accessible hydroxyl groups in cellulose and other biopolymers in wood which allowed for strong formation of hydrogen bonds with water molecules. Treated wood flour blends could be very useful in outdoor applications such as decking and packaging. Further work on the use of vinegar as acetylating agent is recommended based on the results reported in this work. REFERENCES 1. Azeh Y., Olatunji G. A., Sunday O., Olubunmi A. (2012). Ketene Acetylated Wood Cellulose for Industrial Applications in Wood-base and Polymer Industry. Journal of Environmental Science and Technology, 5 (3), Azeh Y., Olatunji G. A., Mamza P. A. (2012). Scanning Electron Microscopy and Kinetic Studies of Ketene-Acetylated Wood/Cellulose High-Density Polyethylene Blends. International Journal of Carbohydrate Chemistry, doi: /2012/456491, Abdulkareem S. A., Garba B. (2005). Novel Application of Polymer Dissolution Technique. Nig. J. Pure and Appl. Sci. 20, Adebajo Moses O., Frost Ray L. (2004). Infrared and 13C MAS Nuclear Magnetic Resonance Spectroscopic Study of Acetylated of Cotton. Spectrochemica Acta, Part A: Molecular and Biomolecular Spectroscopy, 60(1-2), Bodirlau R., Teaca C.A. (2007). Fourier Transform Infrared Spectroscopy and Thermal Analysis of Lignocelluloses Fillers Treated with Organic Anhydrides. Rom. Journ. Phys., 54 (1-2), Cetin N. S., Ozmen N. (2011). Acetylation of wood components and fourier transform infra-red spectroscopy studies. African Journal of Biotechnology, 10 (16), DOI: /AJB Callum A. S. H. (2002). How Does the Chemical Modification of Wood Provide Protection Against Decay Fungi, School of Agriculture and Forest Science, University of Wales Bangor. Presentation for COST E22, Finland. 8. Frihart C. R., Brandon R., Ibach R. E. (2004). Selectivity of Bonding For Modified Wood. USDA Forest Service, Forest Products Laboratory, Madison, WI, USA. Proceedings of the 27th Annual Meeting of the Adhesion Society, Inco. From Molecules and Mechanic to Optimization and Design of Adhesive Joints. February, 15-18, ISSN , Adhesion Society, George J., Bhagawan S. S., Thomas S. (1998). Effects of environment on the properties of lowdensity polyethylene composites reinforced with pineapple-leaf fibre, Composites Science and Technology, 58, (9), Indrayan Y., Yusuf S.,. Hadi Y. S, Nandika D., Ibach. R. E. (2000). Dry wood Termite Resistance of Acetylated and Polymerized Tributyltin Acrylate (TBTA) Indonesian and USA Wood: Proceedings of The Third International Wood Science Symposium, November 1-2, 2000, Uji, Kyoto, Japan JSPS- LIPI Core University Program in the Field of Wood Science. 11. Kristoffer Segerholm. B., Ibach Rebbecca E., Walinder Magnus E. P. (2012). Moisture Sorption of artificially aged wood-plastic composite. BioResources, 7 (1), Mohebby B. (2008). Application of ATR Infrared Spectroscopy in Wood Acetylation.J. Agric. Sci. Technol., 10, Morrison R. T., Boyd R. N. Organic Chemistry, Sixth Edition, Pp Nasar M.. Emam A, Sultan M., Abdel-Hakim A.A. (2010). Optimization of Characterization of Sugar Cane Bagasse Liquefaction Process. Indian J. of Science and Technology.13(12), Nada A. M. A., Moussa W. M., El-Mongy S. A., El-Sayed E. S. A. (2009). Physicochemical Studies of Cation Ion Exchange Wood Pulp. Australian.J. of Basic and Applied Sciences, 3, (1), 9-16.
233 16 Rowell R. M. Simonson R., Hess S., Plackett D. V., Dunningham E. (1994). Acetyl Distribution in Acetylated Whole Wood and Reactivity of Isolated Wood Cell Wall Components to Acetic Anhydride. Wood Fibre Science, 26 (1), Sriroth K. Chollakup R., Piyachomkwan K., Oates C. G.(2000) Biodegradable Plastics From Cassava Starch In Thailand. Department of Biotechnology, Kasetsart University, Bangkok, Thailand. 18. Supri A. G., Lim B. Y. (2009). Effect of Treated and Untreated Filler Loading on the Mechanical, Morphological, and Water Absorption Properties of Water Hyacinth Fibers-Low Density Polyethylene Composites. Journal of Physical Science, 20(2), Sandak A., Sandak J., Pradzynski W., Zborowska M., Negri M. (2009). Near Infrared Spectroscopy as a Tool for Characterization of Wood Surface. Folia Forestalia Pol. 40, Sikorki P., Wada M., Heux L., Stokkes H. B. T. (2004). Crystal Structure of Cellulose Triacetate I. Macromolecules Tuong V. M., Li J. (2010). Effect of Heat Treatment on the Change in Color and Dimensional Stability of ACACIA HYBRID. Bio- Resource 5(2),
234 EFFECTS OF ALTERNATIVE MERCERIZING AGENTS ON SOME MECHANICAL PROPERTIES OF COTTON / POLYESTER BLEND FABRIC Boryo D.E.A 1*, Bello K.A. 2, Ibrahim A.Q. 3, Gin N.S. 4, Ezribe A.I. 1 and Wasiu K.A. 1 1 Science Laboratory Technology Department, Federal Polytechnic P.M.B 0231 Bauchi Nigeria. 2 Textile Technology Department, Ahmadu Bello University, Zaria Nigeria. 3 Chemistry Programme, Abubakar Tafawa Balewa University P.M.B 248 Bauchi Nigeria. 4 Science Laboratory Technology Department, Abubakar Tatari Ali Polytechnic Bauchi Nigeria ABSTRACT This study was concerned with sourcing for suitable and reliable, safe and cheap alternative mercerizing agents that may improve the mechanical properties of cotton/ polyester blend fabric. The ph of the used liquor was evaluated. Cost analyses for the agents were investigated. Six alternative 19-23% mercerizing agents were used (namely liquid NH 3, NH 4 OH, (NH 4 ) 2 C 2 O 4, CH 3 CH 2 OH, CH 3 COOH, (COOH) 2 and NaOH as the control) after bleaching the fabric respectively. The optimum experimental results for the mercerizing agents showed that 19% NH 4 OH optimally improved the breaking load (16.19kgf) more than the control. The optimum value for breaking extension (24.98%) of the mercerized fabric was by 19% (NH 4 ) 2 C 2 O 4 ranking the highest. 19% CH 3 CH 2 OH mercerized fabric recorded the highest linear density ( tex). 21% NH 4 OH mercerized fabric ranked the highest for dry crease recovery (132 ). The alkalinity and acidity (ph) of the alternative agents after the mercerizing process were environmentally friendly in comparison with the highly alkaline NaOH (ph range of ), hence unfriendly. The cost analysis revealed some of the alternative agents far cheaper than the NaOH. These imply that the alternative agents are suitable and reliable as mercerizing agents than NaOH. Therefore the alternative agents could be employed in the Textile Industry and commercially as mercerizing agents so that the world could be a better and safe place for fabric users. Keywords: alternative mercerizing agents, mechanical properties, suitable, reliable, safe, cheap INTRODUCTION Mercerization is one of the most important processes before finishing processes on fabric. This consist of treatments of fabric with concentrated solutions of 20-22% of NaOH at a very low temperature (5-18 o C) as described by Sadov et al.(1973), Trotman (1975) and Taylor (1990). The demand for NaOH is high because of its numerous applications like in scouring and mercerization processes, thereby making it scarce and costly. This highly alkaline NaOH attacks the textile material if not properly handled leading to reduction in mechanical and poor finishing properties of the fabric. The effluents of these processes are corrosive and harmful to the environment too. When the waste water from such a mercerizing process is released, it has effect on the soil and water bodies. SCHER (2006) reported that ph should be one of the basic traditional parameters to be regularly monitored in waste waters. For example, Cutler and Peter (2008) concluded that an important factor affecting soil fertility is soil ph. Soil ph affects the health of microorganism in the soil and controls the availability of nutrients in the soil solution. Strongly acidic soils (ph less than 5.5) hinder the growth of bacteria that decompose organic matter in the soil. This result in a buildup of undecomposed organic matter which leaves important nutrients such as nitrogen in forms that is unusable by plant (Cutler and Peter, 2008). During mercerization, selective bonding of sodium to cellulose takes place according to the following schemes (Moji, 2000). C 6 H 7 O 2 (OH) 3 + 3NaOH C 6 H 7 O 2 (ONa) 3 + 3H 2 O Scheme 1: Formation of trisodium cellulose (alcoholate)
235 The equation was explained by Sadov et al. (1973) that the formation of trisodium cellulose, took place on subjecting cellulose to action of solution of metallic sodium. Other researchers, believed formation of alcoholate by the action of aqueous solution of caustic soda on cellulose is impossible. This is because alcoholate are hydrolysed by small amount of water (March, 1978), Another possible reaction is that caustic soda combines with cellulose to form a molecular compound: C 6 H 7 O 2 (OH) 3 + NaOH C 6 H 7 O 2 (OH) 3 NaOH Scheme 2: Formation of alkali cellulose The effects of this result to increase in luster, tensile strength, hygroscopicity, dye absorbability and specula reflection (gloss) (Sadov et al., 1973; Neal, 2004; Safra et al., 2004 and Smith, 2010). Recent work by Lee et al. (2005) revealed the use of liquid ammonia (NH 3 ) treatment to be more effective at improving the fabric hand of cotton and regenerated cellulose fibres than the usual NaOH. Literature search has not revealed the use of such alkali and others or any other agents on synthetic and cotton blends than the traditional NaOH. Thus, are there no other mild alkalis or agents to be use for cotton and synthetic blends than the traditional NaOH? Such highly alkaline NaOH mercerizing effluent is also for sure very hazardous to the environment more than in the case with NaOH scouring effluent. This is because the NaOH mercerizing effluent is at higher concentration. However, the use of ammonium oxalate by Ajayi et al. (1997), Boryo et al. (1999) and Boryo (1999) has proved to produce better mechanical properties on bast fibre than the traditional NaOH. Further findings by Boryo et al. (2013a) and Boryo et al. (2013b) proved the use of the alternative agents for scouring with improved dyeing and mechanical properties than the commercial NaOH. These findings contributed a part to the birth of this present work. This paper seeks to search for alternative mercerizing agents that will improve on the mechanical properties, cheaper and environmentally friendly, so that this will in turn improve on the economy of the nation and to also satisfy the fashion desire of the consumers of textile materials. The specific objectives are to determine the optimum alternative mercerizing agents with: Little or no damaging effects on the cotton/polyester blend fabric by evaluating some mechanical properties like breaking load, breaking extension, linear density and dry crease recovery. Friendly effects on the environment by monitoring the ph of the liquor before and after the mercerizing processes. To evaluate the cost implications of the alternative mercerizing agents with respect to the usual NaOH by cost analysis. Thus, this research aim at improving on the quality of fabrics and safety of the environment which is in line with the vision of repositioning of Nigeria, that is vision 20:20:20 Hence, this study envision that the same alternative scouring agents may give promising results as alternative mercerizing agents on cotton/ polyester blend fabric with respect to mechanical and dyeing properties METHODS Sample Collection 35% cotton/ 65% polyester blend fabric was bought from Funtua Textile Company Ltd in Katsina State, Nigeria. The fabric were cut into 10cm by 10cm dimension Souring Process The fabrics were completely immersed in a beaker containing 2 % NaOH which had boiled for 5 minutes. It was allowed to boil for 1 hour, rinsed, neutralized, washed in detergent solution and then rinsed and dried in the labouratory. This was done according to the standard method of Sadov et al (19 73) and Trotman (1975).
236 Bleaching Process The scoured samples were bleached with 4g/l NaClO 2 solution in accordance to procedure described by Sadov et al (1973). Mercerization Process The standard method of Sadov et al (1973) and Trotman (1975) was employed in this process. The bleached samples were mercerized in separate beakers of 19%, 20%, 21%, 22%, and 23% NaOH as control. Mercerization was carried out for 45 minutes at below 5 o C. Samples were rinsed, neutralized (appropriately), washed in detergent solution, rinsed and dried in the laboratory. The ph of the process was monitored and recorded. The procedure was repeated for 19-23% NH 4 OH, liquid NH 3, (NH 3 ) 2 C 2 O 4, (COOH) 2, CH 3 COOH and CH 3 CH 2 OH as alternative agents Evaluation of the Effects of Alternative Mercerizing Agent Determination of Breaking Load and Breaking Extension: These were evaluated in accordance with British Standard Method and American Standard for Testing Materials using Tensometric Tester model 220D (Anon, 1974 and Anon 1995). Determination of Linear Density The linear density of fabrics describes the fineness or coarseness of textile and can be expressed as tex. The expression proposed by Anonymous (1974); Morton and Hearle (1975) Anonymous (1995) and used by Boryo, (1999) was employed. It is defined as mass (g) per unit length (m). For the evaluation of linear density, the stretched samples were cut at both ends removing the masking ends. The remaining 5cm portions were weighed and recorded as mass of fabric then employed in the calculation of the linear density. Mass (g) 1000 Linear Density = (tex) Breaking Elongation (mm) Determination of Dry Crease Recovery: The method described by Anon (1974) and Anon (1995) was also adapted for this evaluation. Shirley loading device (DL 28) and Shirley crease recovery tester (SDL 3A) was calibrated and used for this evaluation. Determination of ph of Alternative Mercerizing Liquor The ph values of the alternative mercerizing liquor were monitored before and after the mercerizing process using ph. Determination of cost Implication of the Control and Alternative Mercerizing Agents Market survey of the cost of the alternative mercerizing agents was carried out in comparison with that of the control. Three different chemical shops in Jos, Kano and Bauchi were involved. The average costs were calculated and the costs per 1 ml or 1g were evaluated for comparison. RESULT AND DISCUSSION Effects of Scouring, Bleaching and Alternative Mercerizing Agents on the Physical Properties of Cotton/Polyester Blend Fabric Some physical changes were recorded during and after the pretreatment processes of the cotton/polyester blend fabric.
237 Scoured Samples The scouring solution changed from colourless to slightly yellowish solution. This implies that purification has taken place. The scoured fabric samples were cleaner, improved texture and there were little decrease in dimensions of the treated fabrics. It is expected to improve the mechanical and dyeing properties of the samples in accordance to Sadov et al. (1973), Darinka et al. (2000) and Safra et al. (2004). Bleached Samples: It was observed that the bleaching solution of NaClO 2 changed from cloudy solution to slightly faint yellowish colour. This indicates that pigments and any remaining impurities in the fabrics were removed. The bleached fabrics were whiter and brighter than the unbleached samples. Mercerized Samples with Alternative Agents: All the samples swell and gradually untwist during mercerization especially for NaOH (control) than the alternative agents. After drying, the samples became smooth, lustrous and glossy. There was also reduction in dimension of the fabrics, which was more for the control than the fabrics mercerized with the alternative agents. These changes are as a result of the chemical reaction between the fabrics and agents, which led to the formation of alkali cellulose. This in turns led to the hygral swelling making the fabric to be lustrous, smooth and glossy due to specula reflection. This agrees with the theory of NaOH mercerization described by Sadov et al. (1973); Neal (2004); Safra et al. (2004) and Smith (2010). Since similar changes were observed for the alternative mercerization agents, it is assumed that during mercerization, the fabric reacted with the respective agents to form molecular compounds with the cellulose: C 6 H 7 O 2 (OH) 3 + (NH 4 )2C 2 O 4(aq) C 6 H 7 O 2 (OH) 3 (NH 4 ) 2 C 2 O 4(aq) or C 6 H 7 O 2 (OH) 3 + 3(NH 4 )2C 2 O 4(aq) C 6 H 7 O 2 (ONH4) 3 + 3H 2 C 2 O 4 C 6 H 7 O 2 (OH) 3 + NH 3(aq) C 6 H 7 O 2 (OH) 3 NH 3 or C 6 H 7 O 2 (OH) 3 + 3NH 3(aq) C 6 H 7 O 2 (ONH 4 ) 3 + H 2 O C 6 H 7 O 2 (OH) 3 + NH 4 OH (aq) C 6 H 7 O 2 (OH) 3 NH 4 OH or C 6 H 7 O 2 (OH) 3 + 3NH 4 OH (aq) C 6 H 7 O 2 (ONH 4 ) 3 + H 2 O C 6 H 7 O 2 (OH) 3 + (COOH) 2 C 6 H 7 O 2 (OH) 3 (COOH) 2 or C 6 H 7 O 2 (OH) 3 + 3(COOH) 2 C 6 H 7 O 2 (O-COH) 3 + 3H 2 O C 6 H 7 O 2 (OH) 3 + 3CH 3 COOH C 6 H 7 O 2 (OH) 3 CH 3 COOH or C 6 H 7 O 2 (OH) 3 + CH 3 COOH C 6 H 7 O 2 (OCOCH 3 ) 3 + 3H 2 O C 6 H 7 O 2 (OH) 3 + 3CH 3 CH 2 OH C 6 H 7 O 2 (OH) 3 CH 3 CH 2 OH or C 6 H 7 O 2 (OH) 3 + 3CH 3 CH 2 OH C 6 H 7 O 2 (OCH 2 CH 3 ) 3 + 3H 2 O Scheme 1: Proposed Reactions of the alternative agents with cellulose This is believed to structurally modify the fabric and effect improvements on hygroscopicity, mechanical and dyeing properties. Effects of NaOH (control) and Alternative Mercerizing Agents on Mechanical Properties of Cotton/Polyester Blend Fabric The alternative mercerizing agents displayed some effects on breaking load, breaking extension, linear density and dry crease recovery properties of cotton/polyester blend fabric. Effect of Mercerizing Agents on Breaking Load of Cotton/Polyester Blend Fabric: Breaking load describe the force that can break the fabrics or fibre (Morton and Hearle, 1975 and Taylor 1990). Figure 1 shows independent responses to breaking load of each mercerizing agents
238 in each case. This is confirmed by the significant improvement in breaking load as compared with that of the untreated sample (9.75kgf). With respect to the control treatment, there is a kind of very close competition with the alternative agents. This implies that these agents are effective as mercerizing agents. Table 1 shows 19% NH 4 OH with optimum breaking load of 16.19kgf, slightly higher than the control (23% NaOH 15.8 kgf). The other alternative agents recorded optimum breaking load of 20% (NH 4 ) 2 CO 15.40kgf, 21% (COOH) kgf, 19% liquid NH kgf, 23% CH 3 CH 2 OH 14.81kgf and 23% CH 3 COOH 14.79kgf. These are compared favourably with the control. This signifies that these agents actually modified the structure physico-chemically (Sadov et al., 1973). This is to say that, when the fabric swells during mercerization, it leads to change in the arrangements of units in the cellulose macromolecule. The fibres in the fabric became tightened and the threads oriented to give smoothened alignments, improving and increasing crystallinity. The fabric becomes strong. This is confirmed by these competitive breaking loads. These improvements by alternative agents for mercerization process are even more effective than when used as scouring agents. This is because the breaking loads of the fabric treated with the mercerizing agents are higher than those with the scouring agents. Effect of the Mercerizing Agents on Breaking Extension of Cotton/Polyester Blend Fabric Figure 2 shows the effect of mercerizing agents on breaking extension of cotton/polyester blend fabric. It is observed that all the mercerizing agents improved the breaking extension of the fabric samples. This is seen in the higher values of the breaking extension at various concentrations of the agents as compared to that of the untreated sample (10.81%). This implies that these agents have positively modified the internal structure of the fabric. This led to reorientation and alignment of the molecular units, thus improved crystalllinity of the fabric, hence improved breaking extension (Safra et al., 2004 and Smith, 2010).
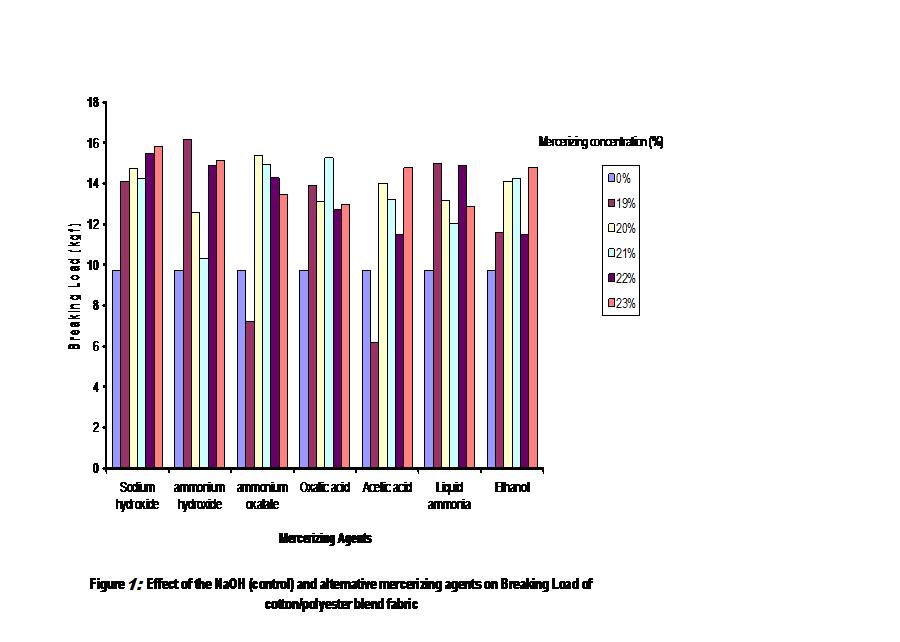
239
240 Table 1: Optimum breaking Load for the effect of Mercerizing Agents on Cotton/Polyester Blend Fabric Mecerizing Agent Concentration of mercerizing Agent (%) Breaking load (kgf) NH 4 OH NaOH (NH 4 ) 2 C 2 O (COOH) Liquid NH CH 3 CH 2 OH CH 3 COOH Untreated Breaking extension shows the extent of fabric damage. Then this implies that the mercerizing agents did not damage the fabric since there is improvement in the breaking extension of the treated samples compared to the untreated sample. However, only 19% (NH 4 ) 2 C 2 O 4 mercerized fabric that recorded higher values (24.98%) than 21% NaOH (control) mercerized fabric (23.84%) while 19% CH 3 COOH mercerized fabric (22.92%) competed favourably with the control. The other agents gave a range between % higher than untreated fabric (10.81%), (Table 2). Effect of the Mercerizing Agents on Linear Density of Cotton/Polyester Blend Fabric Fine (smooth) fabrics have high linear density and are less damaged (Trotman, 1975 and Morton and Hearle, 1975). With reference to Figure 3, it is observed that the untreated fabrics recorded highest linear density (5.153 Tex) than the fabrics mercerized with the different agents. This implies that the agents must have affected the surface of the fabrics making the fabrics less fine (coarse and not smooth). However, the interesting observation in the Figure 3 and Table 3 is that all the alternative mercerizing agents recorded at one concentration or the other a higher value than the control. The fabrics mercerized with the alternative agents recorded optimum linear density ranging from tex, with 19% CH 3 CH 2 OH mercerized fabric recording the highest and the control (NaOH) has a value of tex. This means that the alternative agents have achieved mercerizing better than NaOH treatments. It is believed that during mercerization fibre lumen swell and become round and untwist out, when dry, the lumen collapse with fewer twist, creating a round, smooth surface that reflect light creating a lustrous sheen (Beaudet, 1999). This implies that these alternative agents are suitable and reliable substitute for the industrial and commercial agents NaOH.
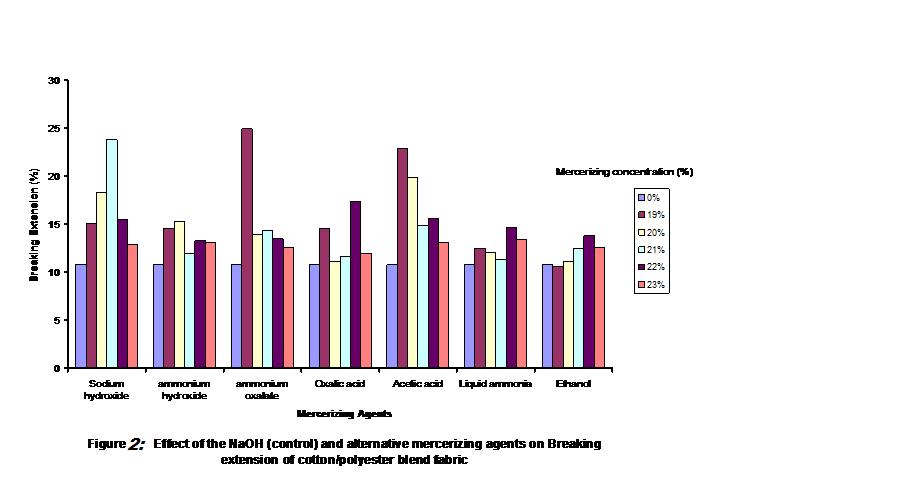
241
242 Table 2: Optimum Breaking Extension for the effect on Mercerizing Agents of Mercerized Cotton/Polyester Blend Fabric Mercerizing Agent Concentration of mercerizing Agent (%) Breaking extension (%) (NH 4 ) 2 C 2 O NaOH CH 3 COOH (COOH) NH 4 OH Liquid NH CH 3 CH 2 OH Untreated Secondly, these alternative agents truly affected mercerization better than the control. This is in the sense that the hygral swelling or expansion or contraction of the fibre length is due to increase in the mass per unit length (tex) of the fibres. Hence better or more improvement in linear density in the fabrics mercerized with the alternative agents than the control. Effect of Mercerizing Agents on Dry Crease Recovery of Cotton/Polyester Blend Fabric Crease recovery describes the ability of creased or wrinkled fabrics to recover its original shape over time. For any textile to be used in clothing, it must be flexible and capable of being crease and folded to confirm the figure and be comfortable to wear (Taylor, 1990). If textiles are to retain a good appearance, the textiles must have good crease shedding properties, which is recovery from unwanted crease that occurred in use and during laundry (Taylor, 1990) With reference to Figure 4, it is observed that the alternative mercerizing agents influenced and modified the fabric samples better than the control and the untreated samples. This can be seen in the higher values of their dry crease recovery angles. Table 4 shows the optimum dry crease recovery for the various agents. The order is 21% NH 4 OH (132.0 o ), 19% liquid NH 3 (130.5 o ), 20% CH 3 CH 2 OH (126.5 o ), 19% CH 3 COOH (126.5 o ), 19% (COOH) 2 (124.5 o ) 19% CH 3 COOH (126.5 o ), 19% (COOH) 2 (124.5 o ), 21% NaOH (123.5 o ) (control), 19% (NH 4 ) 2 C 2 O 4 (116.5 o ) and 0% untreated fabric (50 o ). Thus, alternative agents proved to be far better mercerizing agents for cotton/ polyester fabric compared to the NaOH control and the untreated fabric.
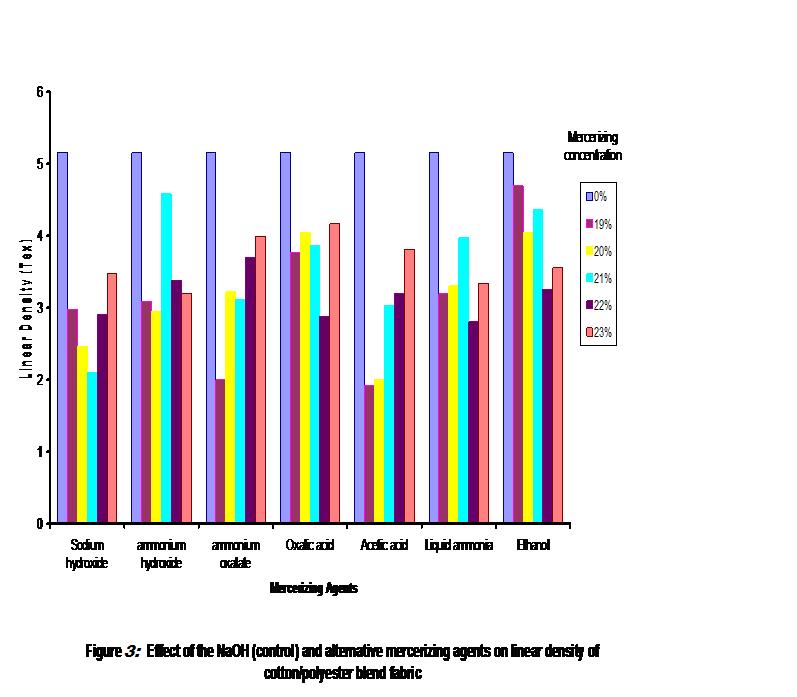
243
244 Table 3: Optimum Linear Density for the effect of Mercerizing Agents on Cotton/Polyester Blend Fabric Mercerizing Agent Concentration of mercerizing Agent (%) Linear density (Tex) CH 3 CH 2 OH NH 4 OH (COOH) (NH 4 ) 2 C 2 O Liquid NH CH 3 COOH NaOH Untreated This is also explained theoretically on a structure molecular level. When fabric structure is bent into crease, Morton and Hearle (1975) and Taylor (1990) suggested that two things can happen; the cross-link may break and reform at new position. On removal of the load there will be no recovery. Alternatively, the cross-links may be strained without breaking. Under this condition, there would be a recovery on moving the load and no crease will result. In view of this, fabrics with lower crease recovery angle in this study might have been weakened more than those with higher dry crease recovery angle, resulting in the breakage of the cross-links and little recovery. However mercerization has drastically improved the crease recovery property compared to the original sample and even the control treatments. It is also observed that these alternative agents were far more effective as mercerizing agents than as scouring agents in the previous work by Boryo et al. (2013b). This is because the dry crease recovery angles for mercerization are far higher than the dry crease recovery angles for scouring. This is possible because of the improved alignment and crystallinity of the treated fabrics by the mercerizing agents than the impurity removing property of the scouring agents. Effect of Alternative Mercerizing Agents and Control (NaOH) on ph of Mercerized Liquor of Cotton/Polyester Blend Fabric It is observed that in most cases, there is decrease in ph at the end of the process and in a few cases there is slight increase. This suggests that reactions occurred between the fabric and each of the mercerizing agents.
245 140 Mercerizing concentration Dry Crease Recovery ( ) % 19% 20% 21% 22% 23% Sodium hydroxide ammonium hydroxide ammonium Oxalic acidacetic acid oxalate Liquid ammonia Ethanol Mercerizing Agents Figure 4: Effect of the NaOH (control) and alternative mercerizing agents on Dry Crease Recovery of cotton/polyester blend fabric
246 Table 4: Optimum Dry Crease Recovery for the effect of Mercerizing Agents on Cotton/Polyester Blend Fabric Mercerizing Agent Concentration of mercerizing Agent (%) Dry crease recovery ( ) NH 4 OH Liquid NH CH 3 CH 2 OH CH 3 COOH (COOH) NaOH (NH 4 ) 2 C 2 O Untreated Table 5 shows the ph for the mercerization process. For NaOH mercerization process at the beginning, the ph ranged from and increased from after the process. This is highly alkaline and very unfriendly to the soil and aquatic lives when such a solution is released to the environment. This high alkalinity is as a result of high degree of dissociation of NaOH and thus high concentration of OH -. That is why there is need for mild alternative agents. Liquid NH 3 initially recorded a ph range of and after the mercerizing process increased to a range of (Table 5). This is also high but is less harmful when compared to NaOH. This is because only a small percent of the molecules dissociated to form OH - (Caret et al., 1997). NH 3(g) + H 2 O (l) NH 3.H 2 O (aq) NH 3.H 2 O (aq) NH 4 + (aq) + OH (aq) Scheme 2: Ionization of ammonia Liquid NH 3 will ionize to a limited extend in solution to liberate NH 4 + and OH -. Hence liquid NH 3 is a weak alkali (Ababio, 2003). Therefore as a weak base, the concentration of OH - is very low. Thus, this will have minimal effect on the environment. At the start of NH 4 OH mercerization process, the ph ranges from (Table 5) for the various mercerizing concentrations (19-23%). As the reaction progressed the ph decreased from Despite the high ph, NH 4 OH ionizes to a limited degree in solution to liberate NH 4 + and OH -, because is a weak base. Thus, it is less harmful as compared to the control (NaOH). Table 5 revealed that at the start of the CH 3 CH 2 OH mercerization process the ph ranged from After the mercerization reaction the ph decreased to a range of This ph values, although slightly acidic and faintly alkaline are within the optimum range of a suitable soil ph (7-8) for plant growth and streams/lakes ph (6-9) for aquatic lives (SCHER, 2006). Secondly being an organic component will be biodegradable. It also dissociates partially, so weak alkali. Therefore, is friendlier than NaOH. Table 5 showed initial ph range of for (NH 4 ) 2 C 2 O 4 mercerization process and decreased to a range of This also will not have adverse effect on disposal on the soil or
247 aquatic body. This is a better alternative to NaOH (control), since on dissociation it produces a kind of neutral solution. (NH 4 ) 2 C 2 O 4(aq) NH 4 OH (aq) + (COOH) 2(aq) Scheme 3: Ionization of ammonia oxalate At the start of CH 3 COOH mercerization the ph range was It changed with a ph range of at the end of the mercerization process (Table 5). Despite this ph range is very acidic but being a weak acid an organic acid, it may not affect the environment much (soil and aquatic body). Thus, it dissociates partially and thereby a better alternative than NaOH (control). Oxalic acid is another weak acid. At the beginning of the mercerization (Table 5), the ph ranged from and changed from This implies that it is an acidic solution but may not show pronounced acidic properties because it is a weak organic acid, thus dissociated partially. It may not have any harmful effects on the environment on disposal, so another alternative for the control (NaOH). Table 5: ph Range for the effect of Mercerizing Agents before and after Mercerizing Process on Cotton/Polyester Blend Fabric Mercerizing Agents ph range before mercerizing ph range after mercerizing Process process NaOH Liquid NH NH 4 OH CH 3 CH 2 OH (NH 4 )2C 2 O CH 3 COOH (COOH) Cost Implication of the Mercerizing Alternative and Control Agents Market survey of the cost of the alternative agents was carried out in comparison to that of the control. This was done using chemical shops in Jos, Kano and Bauchi all in the Northern Nigeria. NaOH, (NH 4 ) 2 C 2 O 4, (COOH) 2 are in solid form while CH 3 CH 2 OH, CH 3 COOH, NH 4 OH and Liquid NH 3 are in liquid state. Therefore it is assumed that 1 g is equivalent to 1 ml or vice versa. From Table 6, the average rate per ml or g for the alternative mercerizing agents ranged from N 9.30 N1.50 with the control agent costing N5.50. This shows that only (COOH) 2 and (NH 4 ) 2 C 2 O 4 that cost (N9.30 and N7.95 respectively) higher than the control. That notwithstanding since in some quality parameters evaluated, the (COOH) 2 and (NH 4 ) 2 C 2 O 4 recorded far better
248 improvements than the control. Furthermore considering the hazardous effect of the control on the environment, still makes (COOH) 2 and (NH 4 ) 2 C 2 O 4 a better substitute for NaOH. All other alternative agents cost far less than the control and have improved the quality performance of the treated cotton/polyester blend fabric. These agents are also environmentally friendlier than the control. Therefore, there is need for the embracement of these alternative agents industrially and commercially. This will go a long way to improve the economy and satisfy the fashion desire of the populace. Table 6: Average Cost of Alternative Mercerizing Agents and Control Agent NaOH Agents Quantity Average Average Rate per Rate (N) ml or g (N) (COOH) 2 500g 4, (NH 4 ) 2 C 2 O 4 500g 3, NaOH (control) 500g 2, NH 4 OH 2,500ml 5, CH 3 COOH 2,500ml 3, NH 3 2,500ml 4, CH 3 CH 2 OH 2,500ml 3, Assuming 1g is equivalent to 1ml CONCLUSION The alternative mercerizing agents (NH 4 OH, Liquid NH 3, (NH 4 ) 2 C 2 O 4, CH 3 CH 2 OH, CH 3 COOH and (COOH) 2 ) proved to be suitable and reliable because the physical changes observed on the treated fabric samples were in agreement with the theories of mercerization. The suitability and reliability of these alternative mercerizing agents were confirmed by the improved mechanical properties displayed by the mercerized fabric samples treated with alternative agents as compared to the control fabrics mercerized with NaOH agent. It was observed that the fabric sample treated with some of the alternative agents recorded higher values for breaking load, breaking extension, linear density, and dry crease recovery, than the control samples. In some cases fabric sample treated with the alternative mercerizing agents competed favourable with the control sample. The ph values (degree of alkalinity and acidity) of the alternative mercerizing agents were friendlier to the environment and some are even biodegradable as compared to the highly strong alkaline NaOH, which may be very hazardous to the soil and aquatic lives, corrosive to skin and equipments. The cost implication of using the alternative mercerizing agents is relatively cheaper when compared with that of the control. Thus, the study has provided alternative agents that are cheaper with improved quality fabric for the fashion conscious teaming population under safe environment. RECOMMENDATION It is recommended that the alternative mercerizing agents be adapted in the textile industry and commercially. ACKNOWLEDGEMENT This work would not have been possible without the sponsorship received from Ocean Energy Nigeria Limited, Knorr 296, Ozumba Mbadiwe Street Victoria Island Lagos NIgeria. I am deeply indebted to the company for taking interest in research and development.
249 REFERENCES Ababio, O. Y. (2003): New School Chemistry 3 rd edition. Reversed, Africana Ajayi, J.O., Bello, K.A. Yusuf, M. D. and Boryo, D. E. A. (1997). The influence of processing variables on the Mechanical Properties of bast fibres. Paper presented at the 20 th Annual International Conference of Chemical Society of Nigeria held at Arewa House Kaduna. Anonymous, (1974). British Standard Handbook Methods of Test for Textiles. British Standard Institution Pp Anonymous, (1995). American Society for Textiles Materials (ASTM D ) Standard Test method for Breaking Force and Elongation of Textile Fabrics (7.02) Philadelphia PA:ASTM. Pp Beautdet T. (1999). What is Mercerized Cotton. Retrieved March 11, 2010 from Boryo D.E.A, Ajayi J.O,Gin N.S and Yusuf M.D. (1999): The Effects of Sodium Hydroxide and Ammonium Oxalate on Mucilaginous Matters of Kinaf Fibers (Hibiscus Canabinus) Paper Presented at the 22 nd Annual National Conference of chemical Society of Nigeria at Hill Station Hotel Jos, Nigeria.Pp Boryo, D.E.A. (1999). Evaluation of Chemical Damage of Kenaf (Hibiscus cannabinus) Fibres During Processing. Unpublished M.Sc.Thesis. ATBU Bauchi. Boryo, D.E.A., Bello, K.A., Ibrahim, A.Q., Gin, N.S., Dauda, T.M., and Elabo, V.O. (2013a) Effect of alternative scouring agents on dyeing properties of cotton polyester blend fabric, Paper accepted for publication with: IOSR JAC iosrjac@gmail.com Article id: E3401(with the press) Boryo, D.E.A., Bello, K.A., Ibrahim, A.Q., Ezeribe A.I, Omizegba F.I, and Offodile P.U. (2013b) Effect of alternative scouring agents on machanical properties of cotton/ polyester blend fabric, Paper accepted for publication with: IJES theijes.editor@gmail.com Article id: (with the press) Caret, R. L., Denniston, K.J. and Topping, J.J. (1997), Strength of Acids and Bases. Principles and Application of Inorganic and Biological Chemistry. (2 nd Ed), The McGraw Hill Companies: Pp Cutler J.C. and Peter (2008) Principle of Environments Science,Published in Encyclopedia of Earth, Pp 157,163,264 and 265. Darinka, F. Darko, G. and Zoran, S.H. (2000), Fibres and Textiles, Eastern Europe, Vol. 16 No.2 Pp Lee Michael,Wakida Jomiji, Tokuyema Takako, Doi Chizuko (2005). Liquid Ammonia Treatment of Regenerate Cellulse Fabrics. Textile Research Journal Retrieved June 6, 2005 from March, J.T. (1978). Introduction to textiles Finishing. Chapman and Hall, London, Pp Moji, A.B. (2000). Polymers: The Chemistry and Technology of Modern Material. Yaba College of Technology, Yaba, Lagos, Concept Publications Ltd, Pp Morton W. E. and Hearle J. W. S. (1975): Physical Properties of Textile Fibers, Textile Institute, Heinemann, London and Manchester. Pp Neale, J. (2004): Textiles of Science and Technology. By P. K. Chatter Jee and B. S Gupta ISBN: , Pp 279,319
250 Sadov, F., Kauchagin, M. and Matestry, A. (1973). Chemical Technology of Fibrous Materials. MIR Publishers, Moscow. Pp , Safra, J. E. Constantine, S. Yannias, J. and Goulk, E. (2004). Encylopedia Britanica 15 th Edition. 9:10. Pp SCHER (2006) Scientific Committee on Health and Environmental Risks, Targeted Risk Assessment on sodium hydroxide and environment. European Commission on Health and consumer protection Directorate, Pp. 4-6 Smith S.E (2010), Polyester Fabric: edited by Niki foster. Mehsso Deffenbaugh, prentice hall inc. pg 47 Taylor, M. A Technology of Textile Properties 3 rd edition. Forbes publication Limited London Pp Trotman, E.R. (1975).Dyeing and Chemical Technology of Textiles Fibers. Charles Griffin Co. Ltd. London, 4 th Edition. Pp
251 APPRAISAL OF SULPHUR CONTAMINANTS FROM TRANSPORTATION IN URBAN ZARIA, NIGERIA 1 Aliyu, Y. A., 2 Musa, I. J and 3 Youngu, T. T. 1,3 Department of Geomatics, Ahmadu Bello University, Zaria-Nigeria 2 Department of Geography, Ahmadu Bello University, Zaria-Nigeria ABSTRACT As a step towards remediation of sulphur contaminants, this study used a Crowcon Gasman (gas detection instrument) to collect and analyze Sulphuric gas samples from densely populated areas of urban Zaria. The results showed varying concentrations of Sulphur Dioxide (SO 2 ) and Hydrogen Sulphide (H 2 S). The high concentrations of these pollutants detected can be attributed to increased population growth, increased production of gaseous wastes and increased number of vehicular movement. The results indicate also that the concentrations of pollutant sulphur component SO 2 measured at all sampling points, with exception of the control site were hazardous while that of H 2 S were within safe limit set by FEPA and ACGIH respectively. Statistical tests were performed which established significant variation/relationship between detected pollutants and traffic volume. Findings from this study imply that vehicular emission within urban Zaria is not within the safe limit which further reveals that transport-related pollution in Zaria urban area can be potentially hazardous to health. Key Words: Sulphur, Ambient Air, Health Hazard, Vehicle Emission and Pollution, Environment 1.0 INTRODUCTION Clean air is one of the basic requirements of human existence. However, air pollution continues to pose significant threats to human and environmental health worldwide. According to the World Health Organization (WHO), more than two million premature deaths each year can be attributed to the effects of urban outdoor and indoor air pollution and these effects are more prominent in developing countries (WHO, 2005a). Outdoor air pollution sometimes called ambient air pollution occurs in both rural and urban areas. However, the intensity and type of pollution depends on the available pollution sources. Sulphur oxides and hydrogen sulphide are two major sulphur-containing air pollutants. Both cause great environmental concern. Most sulphur oxides are released in the form of sulphur dioxide, which reacts in the atmosphere to form sulphates. Findings have shown that these gases interfere with normal breathing patterns, reduce visibility, and contribute to the formation of acid rain (Wang et al., 2005). Sulphur is a naturally occurring part of crude oil and must be removed during the refining process. Despite this removal, some sulphur remains in finished products, including both gasoline and diesel fuel. When these fuels are burnt, Sulphur Dioxide (SO 2 ) and sulphate particulate matter are emitted. Reduction in the sulphur content of transport fuels will immediately reduce the emissions of these sulphur pollutants (ACFA, 2008). Sulphur Dioxide is a colorless gas formed primarily during the combustion of a sulphur-containing fuel or sulphur-containing industrial waste gases. Once released to the atmosphere, sulphur dioxide reacts slowly because of photo-chemically initiated reactions and reactions with cloud and fog droplets, at rates of between approximately 0.1 percent and 3 percent per hour. These atmospheric reactions yield sulphuric acid, inorganic sulphate compounds, and organic sulphate compounds (Richards, 2000). Hydrogen Sulphide (H 2 S) is emitted from a number of metallurgical, petroleum, and petrochemical processes. Fugitive emission of Hydrogen Sulphide can occur from sour gas wells and certain petrochemical processes. It is a highly toxic gas due to its chemical asphixant characteristics. Despite
252 its strong rotten egg odour, it is often difficult to detect at high concentrations due to rapid olfactory fatigue. Hydrogen Sulphide is highly soluble in water and can be easily oxidized to form sulphur dioxide (Richards, 2000). The monitoring of air pollutants such as SO 2 and H 2 S in ambient air has received substantial attention over the past several years because they are among the major pollutants which significantly affect the chemistry of the atmosphere and human health (Wu et al., 2003). A recent study by WHO concluded that, One of the trends predicted to lead to increasing air pollution levels is the high rate of urbanization in countries where most of the population is on low income. It is expected that the rapid growth in urban populations will lead to a dramatic increase in vehicle numbers combined with inexpensive solutions for daily commuting, more frequent use of older and two-wheeled vehicles, poor car maintenance and other developments that increase air pollution (WHO, 2005b). Sulphur emissions influence the level of acidification of soils and freshwater ecosystems (Stoddard et al., 1999; Schopp et al., 2003), climate change (Haywood and Boucher, 2000; Ramanathan et al., 2001) and have impacts on human health (WHO, 2003; 2005b; 2006). The acidification situation was serious in large parts of northern Europe in the 1970s, mainly in the Fenno-Scandia region also due to slow weathering of soil and bedrock. Significant exceedances of critical loads were observed over large parts of central Europe, southern parts of Scandinavia and North-Western Europe (Lovblad et al., 2004). Emission and successive deposition of sulphur have caused material, soil and forest damage (Nellemann and Goul Thomsen, 2001; Akselsson et al., 2004) and surface water acidification. WHO (2000) also reported that in dry unpolluted atmospheric conditions, it is estimated that the average SO 2 concentration for urban areas showed annual mean ranging from 20 to 60 μg/m 3 ( to ppm) and daily means rarely exceeding 125μg/m 3 (0.045 ppm). Riordan and Adeeb (2004) carried a study on SO 2 concentration level in four sample points (Christies Beach, Elizabeth, Northfield and Kensington) all within Adelaide metropolis. Their findings show that SO 2 concentration level did not exceed the 0.08ppm one-day standard stipulated by the National Environment Protection Measure (NEPM). Therefore, the concentration level is not likely to have an adverse impact on either human health or vegetation in the metropolitan Adelaide region. Barman et al., (2008) conducted a study on the ambient air quality of the city Lucknow, India during Diwali festival. Results showed varied concentrations of PM 10, SO 2 and NO x for observations taken at four representative locations, during day and night times for Pre Diwali (day before Diwali) and Diwali day. On Diwali day, 24-hour average concentration of SO 2 was found to be 139.1μg /m 3 (0.05 ppm) and this concentration was found to be higher at 1.95 and 6.59 times higher when compared with the respective concentration of Pre Diwali and normal day. On Diwali night (12-hour) mean level of SO 2 was 205.4μg/m 3 (0.074ppm) which was 2.82 times higher than the daytime concentration. This study intends to appraise the level of sulphur contaminants from transportation in urban Zaria as a result of tremendous increase in urbanization and vehicular ownership. 2.0 THE STUDY AREA Zaria urban area is located in the central plains of the northern Nigeria highlands standing at an average height of 670m above mean sea level. It is the second largest city in Kaduna State with a geographical position located between East longitudes and North latitudes It comprises of parts of Zaria and Sabon-Gari Local Government Areas transversing about 70km from the west to east and roughly cover 8,950 square kilometers. It is drained by three major rivers namely: River Kubanni, River Saye and River Galma. The climatic characteristic is that of tropical savanna (Mortimore, 1970). According to the National Population Commission, the population of Zaria and Sabon Gari Local Government Area were totaled to be 695,069 people (NPC, 2006).

, Tudun Wada Agwaro roundabout (R/A), Park road roundabout (R/A), Kalabari off Aminu road junction and Total filling station junction")
253 Figure 1: Map of Nigeria showing Kaduna State and Urban Zaria Figure 2: Distribution of sampling points (Topographical Map of Zaria, Sheet 102) 3.0 MATERIALS AND METHODS This study is an exposure assessment performed in Zaria urban area in the northern part of Kaduna state, Nigeria. After reviewing the map of the study area, ten (10) sampling points were selected (See Figure 2). These include: the Zaria city market, Kofar Doka roundabout (R/A), Tudun Wada Agwaro roundabout (R/A), Park road roundabout (R/A), Kalabari off Aminu road junction and Total filling station junction both in Sabon Gari, PZ Samaru Bus stop, Kwangila Bridge, Samaru market and Ahmadu Bello University Staff School which serves as a control point. A total of 210 samples were obtained from the selected areas during morning, afternoon and evening observation periods with 21 samples collected from each sampling point. Traffic count was conducted to obtain statistics of car/motorcycle/truck movement in the various sampling traffic points. Concentration level of SO 2 and H 2 S were measured using the Crowcon Gasman sensor. The Crowcon (Gasman) gas sensor which was rented from the Kaduna State Enviromental Protection Agency (KEPA) is a unique single-gas monitor for detection of flammable gases, oxygen and toxic gases. It offers flexibility, assurance, and robustness. Intrinsically safe, it is a portable gas detector with embedded software designed to the exacting requirements of International Electrotechnical Commission (IEC ) which is the international standard for electrical,


254 electronic and programmable electronic safety related systems, guaranteeing reliable and dependable operation. It was used in this study to record emission values of hazardous gases detectable at these traffic points. Concentration level of these pollutant gases was obtained for a 7-day period at various sampling points along major motor roads within commercial areas in urban Zaria at different times so that the survey is statistically representative of the existing conditions of the concentration level. These times were: 7:30 9:15am, 12:30 2:15pm and 4:30 6:15pm. Measurements were performed when wind was near static and temperature was averagely about 29.8, 40.3 and 30.9 C for morning, afternoon and evening sampling periods respectively. The raw data obtained from this study were analyzed using statistical methods. The sampling points over which measurements were done are as shown in Fig. 1 above and obtained SO 2 concentration level was compared with the Federal Environmental Protection Agency (FEPA) standard limit of ppm (FEPA, 1991), 4.0 RESULTS AND DISCUSSION Results obtained for the volume and composition of vehicular movements within the various sampling points indicated in Figure 2, Figure 3. It showed that the volume of motorcycles is more than that of motors and trucks. Kwangila bridge sample point is a major junction which links Zaria City- Sabon Gari-Samaru and to other states like Katsina, Kano, Sokoto, Zamfara and Kebbi. While Kalabari off Aminu road junction sample point in Sabon Gari (which is the centre of commercial activity) has the highest number of motorcycles. This can be attributed to the fact that the Sabon Gari market is very close to the sampling point Motor 40 Motorcycle 20 0 Truck Traffic Volume (Count) Zaria City Market Kofar Doka R/A Tudun Wada Agwaro R/A Park Road R/A Kalabari Off Aminu Rd Junction Total Filling Station Junction PZ Kwangila Samaru Samaru Bus stop Bridge Market Figure 3: Average traffic volume across various sampling points ABU Staff School The concentration of Sulphur Dioxide (SO 2 ) ranged from ppm for Zaria City market sample point; ppm for Kofar Doka Roundabout; ppm for Tudun Wada Agwaro Roundabout; ppm for Park Road Roundabout; ppm for Kalabari off Aminu Road Junction; ppm for Total filling station Junction; ppm for PZ Samaru Bus stop; ppm for Kwangila under bridge; ppm for Samaru market and ppm for ABU Staff School which serves as the control point. Table 1 and Figure 4 show the variation across sampling days and sampling periods respectively.


255 Table 1: Average Sulphur Dioxide (SO 2 ) Emission across sampling sites Mon Tue Wed Thurs Fri Sat Sun Zaria City Market Kofar Doka R/A Tudun Wada Agwaro R/A Park Road R/A Kalabari Off Aminu Rd Junction Total Filling Station Junction PZ Samaru Bus stop Kwangila Bridge Samaru Market ABU Staff School Concentration (ppm) 0,1 0,09 0,08 0,07 0,06 0,05 0,04 0,03 0,02 0,01 0 Zaria City Market Kofar Doka R/A Tudun Wada Agwaro R/A Park Road R/A Kalabari Off Aminu Rd Junction Total Filling Station Junction PZ Kwangila Samaru Samaru Bus stop Bridge Market ABU Staff School Morning Afternoon Evening Figure 4: Mean Variation of Sulphur Dioxide (SO 2 ) across periods at sampling points For Hydrogen Sulphide (H 2 S), as stated in Table 2, the concentration level ranged from ppm for Zaria City market; ppm for Kofar Doka Roundabout; ppm for Tudun Wada Agwaro Roundabout; ppm for Park Road Roundabout; ppm for Kalabari off Aminu Road Junction; ppm for Total filling station Junction; ppm for PZ Samaru Bus stop; ppm for Kwangila under bridge; ppm for Samaru market and ppm for ABU Staff School which serves as the control point. Variation of H 2 S along the various sampling points is further displayed in Figure 5.

256 Table 2: Average Hydrogen Sulphide (H 2 S) Emission across sampling sites Mon Tue Wed Thurs Fri Sat Sun Zaria City Market Kofar Doka R/A Tudun Wada Agwaro R/A Park Road R/A Kalabari Off Aminu Rd Junction Total Filling Station Junction PZ Samaru Bus stop Kwangila Bridge Samaru Market ABU Staff School Concentration (ppm) 0,8 0,7 0,6 0,5 0,4 0,3 0,2 0,1 0 Zaria City Kofar Market Doka R/A Tudun Wada Agwaro R/A Park Kalabari Road R/A Off Aminu Rd Junction Total Filling Station Junction PZ Kwangila Samaru Bridge Bus stop Samaru Market ABU Staff School Fig. 5: Mean Variation of Hydrogen Sulphide (H 2 S) across periods at sampling points Morning Afternoon Evening From Figures 4 and 5, there is clear indication that on the average, evening periods recorded the highest level of SO 2 concentration. This can be attributed to flexibilty of the morning traffic whereby commuters/vehicle owners move at varying time-frames from as early as 6.30am for the primary/secondary student and working class and as late as 9.30am for the business operators/marketers. While for the evening traffic hours, the same workers who leave home as early as 7am do not have the laxity of closing work earlier than 3.45pm. This coincides with secondary school students extra moral lesson closing rush and market closing rush all on a limited access route. These is in agreement to the findings of high evening and lower morning periods of pollutant gases concentration as reported by Ragini et al. (2009); Okunola et al. (2012) where concentration of pollutant gases was lowest in the morning period. However taking one of the sampling points into consideration (Kwangila which records most of the high concentration levels) it can be seen in Figures 6 and 7 below that not all evening periods record higher concentration levels of SO 2 across the sampling days. While other days had higher
 serves as a transit route for travellers going to other north-western states which run into the evening hours.")

 across periods at sampling days for Kwangila Concentration (ppm) 1 0,8 0,6 0,4 0,2 0 Monday Tuesday Wednesday Thursday Friday Saturday Sunday Morning Afternoon")
257 evening concentration levels, Friday had a higher concentration during the afternoon period. This can be attributed to the fact that the sampling point (Kwangila) serves as a transit route for travellers going to other north-western states which run into the evening hours. Also Saturday morning period had the highest concentration for the day. This also can be attributed to the continuous travelling activities at the Kwangila bridge sampling point while the close gap for afternoon and evening periods can be attributed to the fact that most wedding events occur on that day. Concentration (ppm) 0,1 0,08 0,06 0,04 0,02 0 Monday Tuesday Wednesday Thursday Friday Saturday Sunday Morning Afternoon Evening Fig. 6: Variation of Sulphur Dioxide (SO 2 ) across periods at sampling days for Kwangila Concentration (ppm) 1 0,8 0,6 0,4 0,2 0 Monday Tuesday Wednesday Thursday Friday Saturday Sunday Morning Afternoon Evening Fig. 7: Variation of Hydrogen Sulphide (H 2 S) across periods at sampling days for Kwangila From the results obtained for SO 2 and H 2 S, it can be seen that highest level of SO 2 was recorded still at the Tudun Wada sampling point. Positive significant correlation at 0.01 and 0.05 levels (Table 5 below) between SO 2 and Motorcycles/cars during this season could be responsible. Furthermore, the concentration of SO 2 is lower than ranges of ppm, ppm, and ppm reported by Ayodele and Abubakar (2010), Ettouney et al. (2010), and Kalabokas et al. (1999), respectively but was with the range of ppm reported in Kano metropolis, Nigeria (Okunola et al., 2012). The reasons for these values at these points may be attributed to several processes such as, refuse dumpsite located along these sites. Comparing data with the FEPA standard level of 0.06 ppm, the air quality for SO 2 ranged between moderate and poor (between the stipulated ) in most of the sampling sites while at the ABU Staff School which is the control site, AQI for SO 2 was good. For H 2 S, the ambient area quality is acceptable for all the sites. This is because even though (WHO, 1981) stated that there is no international standards for H 2 S, many countries have adopted short time standards. Since FEPA has no quality standard for H 2 S, this study is compelled to compare with an international standard. ACGIH, (2005) announced their intention to lower the timeweighted-average (TWA) work-day limit from 10 ppm to 1 ppm and for short-term (15 minutes) exposure limit from 15 ppm to 5 ppm. From this it can be said that, even with a dump site close to some of the sampling points, the concentration level of H 2 S is still within safe limits.
258 Tables 3 and 4 present summary of statistical analyses (ANOVA and Pearson s correlation) that was conducted to determine if there was any variation/relationship between detected pollutant gases SO 2 and H 2 S with traffic volume at p = 0.05 significant level. Table 3: Analysis of Variance (ANOVA) SO 2 H 2 S Cars Motorcycles Trucks Between Groups Within Groups Total Between Groups Within Groups Total Between Groups Within Groups Total Between Groups Within Groups Total Between Groups Within Groups Total Sum of Squares df Mean Square F Sig Table 4: Correlation between detected SO 2 and H 2 S with traffic volume SO 2 H 2 S Cars Motorcycles Trucks SO ** * ** H 2 S ** * ** Cars * * * Motorcycles ** ** Trucks * **. Correlation is significant at the 0.01 level (2-tailed) *. Correlation is significant at the 0.05 level (2-tailed) Table 3 confirmed that there is significant variation between grouped as determined by one-way ANOVA (F (9, 200) = ; ; ; ; ) for SO 2, H 2 S, Cars, Motorcycles and Trucks respectively. This result is also subjected to correlation (See Table 4) which indicates a strong significant correlation (p < 0.01) between detected sulphur contaminants (SO 2 and H 2 S) with motorcycles while the correlation with cars is at p < 0.05 significant level. There was no correlation between the detected pollutant gases with heavy duty vehicles (trucks). This can be attributed to the fact that only three (Kofar-Doka Roundabout, Kwangila bridge and Samaru market) out of the ten sampling points recorded significant number of trucks. But there was correlation (P < 0.05) between cars and trucks. This can also be attributed to their orderly movement along access routes unlike motorcycles which move in clusters.
259 5.0 CONCLUSION An analysis of Sulphur Dioxide and Hydrogen Sulphide from vehicular emission in ambient air of urban Zaria showed the presence of the various degrees of these pollutants. Varying concentrations of these gases were detected at all sampling points, with exception of the control site. It is imperative therefore that the expansion of urban Zaria road network, standard control measures and proper waste disposal methods should be quickly put in place to avoid continuous emission that may lead to increased concentration of these pollutants. It is recommended that extensive awareness campaigns be carried out and further study will be appropriate to ascertain and proffer mitigation measures on their effects on humans and the environment. REFERENCES ACFA, (2008). Sulphur Reduction The Key to Lower Vehicle Emissions. Asian Clean Fuels Association Monthly Publication Vol. 6, Issue 6 - Aug/Sept, 2008 ACGIH, (2005). Guide to Occupational Exposure Values Notice of Intended Changes. American Conference of Governmental Industrial Hygienists In: MCDCP, (2006). Ambient Air Guidelines for H 2 S. Maine Centre for Disease Control and Prevention. Augusta, USA. Retrieved February 2, 2013, from: Akselsson, C., Ardo, J., and Sverdrup, H. (2004). Critical Loads of Acidity for Forest Soil and Relationship to Forest Decline in the Northern Czech Republic. Environmental Monitoring and Assessment. 98: Barman S.C., Singh R., Negi, M. P. S. and Bhargava, S. K. (2008). Ambient Air Quality of Lucknow City (India) during Use of Fireworks on Diwali Festival, Environ Monit. Asses, No 137: Ettouney, R. S., Zaki, J. G., El-Rifiai, M. A. and Ettouney, H. M. (2010), An Assessment of the Air Pollution Data from Two Monitoring Stations in Kuwait, Toxicology and Environmental Chemistry, Vol. 92 No. 4, pp Federal Environmental Protection Agency, (1991). Guidelines and Standards for Environmental Protection Control in Nigeria. In Ajayi, A. B. and Dosunmu, O. O. (2002). Environmental hazards of Importing Used Vehicles into Nigeria. Proceedings of International Symposium on Environmental Pollution Control and Waste Management (EPCOWM). (7-10) January 2002, Tunis, Tunisia. Pp Haywood, J. and Boucher, O. (2000). Estimates of the Direct and Indirect Radiative Forcing due to Tropospheric Aerosols: A Review. Reviews of Geophysics 38(4): Kalabokas, P. O., Viras, L. G. and Repapis, C. (1999), Analysis of the 11 years record ( ) of Air Pollution Measurements in Athens, Greece, Part I: Primary Air Pollutants, Global Nest Journal, Vol. 1 No. 3, pp Lovblad, G., Tarrason, L., Tørseth, K., and Dutchak, S. (Eds.) (2004). EMEP Assessment Report Part I, European Perspective, Retrieved July 15, 2013, from: Mortimore, M. J. (ed)(1970). Zaria and its Region: A Nigerian Savanna City and its Environs. Department of Geography, Ahmadu Bello University Zaria. Occasional Paper No 4 Nellemann, C. and Goul Thomsen, M. (2001). Long-Term Changes in Forest Growth: Potential Effects of Nitrogen Deposition and Acidification. Water, Air, & Soil Pollution Vol. 128: NPC, (2006). Population. National Population Commission Census Report. Nigerian Statistics Annual Report. Pp. 14 Retrieved May 22, 2012, from:
260 Okunola, O. J., Uzairu, A., Gimba C. E. and Ndukwe, G. I. (2012). Assessment of Gaseous Pollutant along High Traffic Roads in Kano, Nigeria. International Journal of Environment and Sustainability. Volume 1(1): 1-15 Ragini, N., Chandrashekara, M. S., Nagaiah, N. and Paramesh, L. (2009). Study of Atmospheric Electrical Conductivity, SO 2, NO 2, Aerosols SPM (> 10µ) and RSPM (< 10µ) in Mysore City, India, Toxicology and Environmental Chemistry. Vol. 91(4): Ramanathan, V., Crutzen, P. J., Kiehl, J. K., and Rosenfeld, D. (2001). Aerosols, Climate, and the Hydrological Cycle, Science. 294, Riordan, D. and Adeeb, F. (2004). Air Quality Monitoring for Sulphur Dioxide in Metropolitan Adelaide. Environment Protection Authority Document. Retrieved July 3, 2013 from: Richards, J. K. (2000). Control of Gaseous Emissions. United States Environmental Protection Agency Air Pollution Training Institute (USEPA APTI). Student Manual Course 415. Third Edition. Retrieved July 1, 2013, from: Schopp, W., Posch, M., Mylona, S., and Johansson, M. (2003). Long-Term Development of Acid Deposition ( ) in Sensitive Freshwater Regions in Europe. Hydrology and Earth System Sciences (7): Stoddard, J. L., Jeffries, D. S., Lukewille, A., Clair, T. A., Dillon, P. J., Driscoll, C. T., Forsius, M., Johannessen, M., Kahl, J. S., Kellogg, J. H., Kemp, A., Mannio, J., Monteith, D. T., Murdoch, P. S., Patrick, S., Rebsdorf, A., Skjelkvale, B. L., Stainton, M. P., Traaen, T., van Dam, H., Webster, K. E., Wieting, J., and Wilander, A. (1999). Regional Trends in Aquatic Recovery from Acidification in North America and Europe. Nature. 401(6753): Wang, L. K., Pereira, N. C. and Hung, Y. T. (2005). Advanced Air and Noise Pollution Control. Hand book of Environmental Engineering, Volume 2. Humana Press Inc. Totowa, NJ. WHO, (1981). Hydrogen Sulphide. World Health Organization, Environmental Health Criteria No. 19. Geneva. WHO, (2000). Air Quality Guidelines for Europe, Second Edition. WHO Regional Publications, European Series No. 91,Regional Office for Europe, Copenhagen. In Blair, L. (2003). Sulphur Dioxide: Environmental Effects, Fate and Behaviour. Alberta Environment. Retrieved July 4, 2013, from: WHO, (2003). Health Aspects of Air Pollution with Particulate Matter, Ozone and Nitrogen dioxide, Report on a WHO Working Group, Copenhagen, WHO Regional Office for Europe (document EUR/03/ ), available from int/document/e79097.pdf WHO, (2005a). WHO Air Quality Guidelines Global Update. Report on a Working Group Meeting, Bonn, Germany, October 2005, WHOLIS number E87950 WHO, (2005b). Hydrogen Sulphide. Geneva World Health Organization, Environmental Health Criteria, No. 19. WHO, (2006). Health Risks of Particulate Matter from Long-Range Transboundary Air Pollution. Joint WHO/Convention Task Force on the Health Aspects of Air Pollution, WHO Regional Office for Europe, European Centre for Environment and Health, Bonn Office, WHOLIS number E88189 Wu, C., Lin, M., Feng, C., Yang, K., Lo, Y. and Lo, J. (2003). Measurement of Toxic Volatile Organic Compounds in Indoor Air of Semiconductor Foundries Using Multi-sorbent Adsorption/ Thermal Desorption coupled with Gas Chromatography-Mass Spectrometry. Journal of Chromatography Vol. 996:
261 EFFECT OF DEGREE OF SUBSTITUTION ON THE ADHESIVE PROPTERTIES OF METHYL CELLULOSE DERIVED FROM WASTE BITTER ORANGE [CITRUS AURANTIUM (LINN.)] MESOCARP 1 *Hamza Abba, 2 Abdulqadir Ibrahim 1 Sani Uba, 3 Isuwa Kari 1 Department of Chemistry, Ahmadu Bello University, P.M.B.1045, Zaria, Nigeria. 2 Department of Chemistry, Nigeria Police Academy, P.M.B.3474, Wudil, Kano, Nigeria 3 Nigerian Institute of Leather Science and Technology, P.M.B. 1034, Zaria, Nigeria. Abstract Cellulose was extracted from waste bitter orange mesocarp and chemically modified by etherification in propan-2-ol as solvent with varying amount of methyl chloride and the degree of substitution (DS) of the methyl group for H of the native cellulose calculated by acid-base titration. Nine pastes (seven etherified cellulose (methyl cellulose) and the native cellulose (control) were prepared by dispersing them in distilled water (35% w/v) and heating the eight dispersions to 45 C with continuous agitation for 15min. The solutions were then cooled to room temperature and allowed to gel. The effect of DS on the adhesive properties of the pastes (tack strength, rolling ball test, gelation time, drying time, optical clarity, relative viscosity, and syneresis) was comparatively investigated. The results showed that the DS in the etherified cellulose ranged from 1.31 to 1.98 with the methyl cellulose giving higher values of viscosity and tack strength with increase in DS. However, lower values of syneresis, gelation time, optical clarity, drying time and rolling ball distance were recorded with increase in DS. Increase in desirable adhesive properties of the methyl cellulose is attributed to its relatively higher molecular weight compared to the native cellulose. Production and use of etherified cellulose, in place of petroleum-based synthetic adhesives, in remoistening applications such as envelope flaps, postage stamps, labels and other paper works in Nigeria and other developing economies is recommended from the viewpoints of economy, environment, health and safety. Keywords: Adhesion, cellulose, degree of substitution, tack strength, viscosity INTRODUCTION Adhesion, attachment between an adhesive and a substrate, is the molecular attraction exerted between bodies in contact. An adhesive is any substance that, when applied to the surfaces of materials, binds the surfaces together and resists separation (Mittal and Pizzi, 2003; Notley and Norgren, 2006; Ebnesajjad, 2010). Use of adhesives offers many advantages over other binding techniques such as sewing, welding, bolting and screwing (Forsström et al., 2005; Nolte et al., 2009). These advantages include the ability to bind different materials together and distribute stress more efficiently across the joint, cost effectiveness as an easily mechanized process, improvement in aesthetic design, and increase in design flexibility (Maeda et al., 2002; Chen et al., 2005; Huang et al., 2005; Eriksson et al., 2007; Pettersson and Dedinaite, 2008). Carbohydrates, in the form of polymers such as cellulose, starch, and natural gums, are available in large quantities from various plant sources. Each of them has potentials for utilization as adhesive and in adhesive formulations (McMurry, 2012). Bioadhesives are preferred to petroleum-derived synthetic adhesives from the points of view of economy, environment, health and safety (Doraiswamy et al., 2009; Blackman et al., 2012). Cellulose is considered to be a natural condensation polymer of 2000 to β-1,4-glycosidically linked glucose residues, each carrying
 Replacing one or more of the cellulose's hydroxyls with other functional groups results in production of cellulose derivatives with desired functional properties (Ito et al., 2007).")
x(OCH 3 ) y ] n is the condensed molecular formula of methyl cellulose, whose structural formula is (Carey, 2008; Henriksson et al., 2008; Villetti et al., 2011): : Fig. 2. Methyl Cellulose, R = CH 3 (adapted from Villetti et al.")
262 three reactive hydroxyl groups (Klemm et al., 2005; Carraher, Jr, 2010; Karabulut and Wågberg, 2011): Fig. 1. Glucose Residues in Cellulose (adapted from Klemm et al., 2005) Replacing one or more of the cellulose's hydroxyls with other functional groups results in production of cellulose derivatives with desired functional properties (Ito et al., 2007). Etherification, the process of making ether from alcohol, is an efficient method of modifying properties of polysaccharides, such as cellulose (Ahola et al., 2008; Fox et al., 2011). [C 6 H 7 O 2 (OH)x(OCH 3 ) y ] n is the condensed molecular formula of methyl cellulose, whose structural formula is (Carey, 2008; Henriksson et al., 2008; Villetti et al., 2011): : Fig. 2. Methyl Cellulose, R = CH 3 (adapted from Villetti et al., 2011 ) By varying both the length of the polymer backbone and the number of substitutive alkyl groups, derivatives of a wide range of modified cellulose grades can be manufactured to provide different levels of viscosity and tuning the several properties of the polymer for adhesive use. Thus, control of degree of substitution (DS) and uniform distribution of functional groups along the polymer s chain have been the major challenges confronting synthetic polymer chemists (Elomaa, 2004). Although the maximum DS for a glucose molecule would be 3, this is not practically possible to achieve because of other competing side reactions (Samios et al., 1997). Amim and colleagues (2009) have reported average DS values between for methyl cellulose with methoxy substitution between % (weight). Mario and associates (2005) have also reported as the average number of substituent groups (DS) for sodium carboxymethyl cellulose. Bitter orange (Citrus aurantium) tree is a hybrid between Citrus maxima (pomelo) and Citrus reticulata (mandarin) that is spiny and evergreen (Rodrigues et al., 2013). Many varieties of bitter orange are used for their essential oils in perfumery, as flavouring and as solvent, employed in herbal
Comparison of light microscopy and nested PCR assay in detecting of malaria mixed species infections in an endemic area of Iran
 Comparison of light microscopy and nested PCR assay in detecting of malaria mixed species infections in an endemic area of Iran Aliehsan Heidari, Manizheh Nourian, Hossein Keshavarz Associate Prof. Dept.
JOURNAL OF INTERNATIONAL ACADEMIC RESEARCH FOR MULTIDISCIPLINARY Impact Factor 2.417, ISSN: , Volume 4, Issue 3, April 2016
 UTILIZATION OF COCONUT LEAF SHEATH FIBER AND ITS PROPERTIES DIVYA.G* Dr. C.KRISHNAVENI** *M.Phil, Scholar, Dept. of Botany, PSGR Krishnammal College for Women, Coimbatore, Tamil Nadu, India **Associate
Malaria Rapid Diagnostic Tests: role and place in the diagnosis of malaria
 Malaria Rapid Diagnostic Tests: role and place in the diagnosis of malaria 1 Plasmodium falciparum Malaria : an overview 2 Plasmodium vivax 3 Plasmodium ovale Most serious Jan Jacobs Institute of Tropical
Level 3 Cambridge Technical in Laboratory Skills 05847/05848/05849/05874/05879
 Oxford Cambridge and RSA Level 3 Cambridge Technical in Laboratory Skills 05847/05848/05849/05874/05879 Unit 2: Laboratory techniques Friday 12 January 2018 Morning Time allowed: 2 hours You must have:
HUMASIS MALARIA ANTIGEN TEST HIGH SENSITIVE DIFFERENTIAL DIAGNOSIS OF MALARIA INFECTION
 HUMASIS MALARIA ANTIGEN TEST HIGH SENSITIVE DIFFERENTIAL DIAGNOSIS OF MALARIA INFECTION References 1) World Malaria Report 2010, WHO 2) Rapid diagnostic tests for malaria parasites, Clin. Microbiol. Rev.
MALARIA P. FALCIPARUM / P. VIVAX
 MALARIA P. FALCIPARUM / P. VIVAX 1. EXPLANATION OF THE TEST: Malaria is a serious, sometimes fatal, parasitic disease characterized by fever, chills, and anemia and is caused by a parasite that is transmitted
VOL. 5, NO. 6, June 2015 ISSN ARPN Journal of Science and Technology All rights reserved.
 VOL. 5, NO. 6, June 2015 ISSN 22-7217 Impact of Cumulative Sediment Deposition by Irrigation Water on Soil and Sugarcane in Savannah Sugar Company Limited; Numan, Adamawa State Nigeria 1 R.P. Ali, 2 H.M.
A Level Biology B (Advancing Biology) H422/03 Practical skills in biology Sample Question Paper SPECIMEN
 H422/03 Practical skills in biology Sample Question Paper SPECIMEN") A Level Biology B (Advancing Biology) H422/03 Practical skills in biology Sample Question Paper Date Morning/Afternoon Time allowed: 1 hour 30 minutes You may use: a scientific calculator First name Last
A Level Biology B (Advancing Biology) H422/03 Practical skills in biology Sample Question Paper Date Morning/Afternoon Time allowed: 1 hour 30 minutes You may use: a scientific calculator First name Last
Spotting Malaria reliably
 Spotting Malaria reliably Track down infections easily with highly sensitive Malaria-LAMP even in low-prevalent settings Molecular DX Microscopy and RDT s are not able to track down parasites in low-transmission
Department of Biochemistry, Faculty of Sciences, Ebonyi State University, Abakaliki, Ebonyi State, Nigeria.
 IDOSR PUBLICATIONS INTERNATIONAL DIGITAL ORGANIZATION FOR SCIENTIFIC RESEARCH ISSN: 2550-794x VITAMIN AND MINERAL COMPOSITION OF ANNONA MURICATA Offor C. E 1., Abara P. N 2., Ugwu Okechukwu P.C 1., Ekpono
Int.J.Curr.Microbiol.App.Sci (2016) 5(5):
 5(5):") International Journal of Current Microbiology and Applied Sciences ISSN: 2319-7706 Volume 5 Number 5 (2016) pp. 934-939 Journal homepage: http://www.ijcmas.com Original Research Article http://dx.doi.org/10.20546/ijcmas.2016.505.098
International Journal of Current Microbiology and Applied Sciences ISSN: 2319-7706 Volume 5 Number 5 (2016) pp. 934-939 Journal homepage: http://www.ijcmas.com Original Research Article http://dx.doi.org/10.20546/ijcmas.2016.505.098
Potential of Potassium Supply in Locally Available Soil Amendments for Use in Coconut Plantations
 Journal of Food and Agriculture 2014, 7 (1 & 2): 18-24 DOI: http://doi.org/10.4038/jfa.v7i1-2.5190 Potential of Potassium Supply in Locally Available Soil Amendments for Use in Coconut Plantations H.M.I.K.
3.0 Supplying Nutrients to Crops
 3.0 Supplying Nutrients to Crops Plants need for healthy growth and development. Plant nutrition involves the absorption of nutrients for plant growth and is dependent on, often referred to as nutrients.
T he diagnosis of malaria in clinical laboratories in the UK
 862 ORIGINAL ARTICLE Use of rapid diagnostic tests for diagnosis of malaria in the UK D Chilton, A N J Malik, M Armstrong, M Kettelhut, J Parker-Williams, P L Chiodini... See end of article for authors
Comparative studies on the effect of sun, smoke and oven drying methods on the nutrient contents of four wild edible mushrooms in Nigeria
 Available online at www.scholarsresearchlibrary.com Scholars Research Library J. Nat. Prod. Plant Resour., 2011, 1 (1): 70-74 (http://scholarsresearchlibrary.com/archive.html) Comparative studies on the
Addressing climate change driven health challenges in Africa
 Addressing climate change driven health challenges in Africa Ednah N Ototo, Parasitologist, Climate Change and Health Kenyatta University, Kenya Kenya Medical Research Institute Outline The impact of climate
Influence of Initial Moisture Content on Some Proximate Quality Attributes of Packaged Gari in Storage. Adejumo, B. A.
 IJABR Vol. 4(1&2): 32-38 (2012) Original Article Influence of Initial Moisture Content on Some Proximate Quality Attributes of Packaged Gari in Storage Adejumo, B. A. Department of Agricultural and Bioresources
Effects of Harvest Date and Late-Summer Fertilization Rate on Stockpiled Bermudagrass Forage Mineral Concentrations
 Effects of and Late-Summer Fertilization Rate on Stockpiled Bermudagrass Forage Mineral Concentrations D.L. Lalman, C.M. Taliaferro, A.A. Gelvin, C.R. Johnson, J.Ball Story in Brief The objective of this
Determination of available nutrients in soil using the Agilent 4200 MP-AES
 Determination of available nutrients in soil using the Agilent 4200 MP-AES Application note Agriculture Author Dharmendra Vummiti Agilent Technologies, India Introduction Multielement testing of soil samples
Against intervention No recommendation Strong Conditional Conditional Strong. For intervention. High Moderate Low Very low
 Draft recommendation: Consider using MDA as an additional tool for the elimination of malaria in low prevalence island or nonisland settings where the risk of imported malaria is low Balance of desirable
District NTD Training module 9 Learners Guide
 District NTD Training module 9 Learners Guide Session 3: Diagnostic and laboratory tools for filarial worms, Soil- Transmitted Helminths and Schistosomiasis Key message addressed to communities: Community
Lesson 3 Understanding Nutrients and Their Importance
 Unit B Understanding Animal Body Systems Lesson 3 Understanding Nutrients and Their Importance 1 Terms Balanced ration Carbohydrates Complex carbohydrates Disaccharides Essential nutrients Ether Fat Fat-soluble
How Do I Supplement My Livestock With Minerals? Part IV
 How Do I Supplement My Livestock With s? Part IV Randy Wiedmeier, Regional Livestock Specialist, South-Central Area All of our livestock animals possess a specific appetite or craving for sodium. As demonstrated
MALARIA PARASITE COUNTING
 VERSION 1 EFFECTIVE DATE: 01/01/2016 MALARIA PARASITE COUNTING MALARIA MICROSCOPY STANDARD OPERATING PROCEDURE MM-SOP-09 1. PURPOSE AND SCOPE To describe the procedure for counting malaria parasites on
A rapid test for the qualitative detection of Malaria pf and pv antigen in human blood sample
 A rapid test for the qualitative detection of Malaria pf and pv antigen in human blood sample For in vitro use only Intended Use For the rapid qualitative determination of Malaria P. falciparum specific
Chapter 7-2 Hydrocarbons
 Chapter 7-1 Carbon C atom - atomic # is 6; it has 6 protons and therefore 6 electrons - is in group 14; it has 4 valence electrons - atomic mass is 12; it has 6 neutrons - shares electrons when forming
STUDIES ON FICUS CARPENSIS (FRUIT AND LEAF): PROXIMATE AND MINERAL COMPOSITIONS
: PROXIMATE AND MINERAL COMPOSITIONS") Int. J. Chem. Sci.: 7(3), 2009, 1761-1765 STUDIES ON FICUS CARPENSIS (FRUIT AND LEAF): PROXIMATE AND MINERAL COMPOSITIONS G. A. ADEBISI and G. A. OYELEKE * Department of Science Lab. Technology, Osun State
Int. J. Chem. Sci.: 7(3), 2009, 1761-1765 STUDIES ON FICUS CARPENSIS (FRUIT AND LEAF): PROXIMATE AND MINERAL COMPOSITIONS G. A. ADEBISI and G. A. OYELEKE * Department of Science Lab. Technology, Osun State
KENYA STANDARD DKS Moringa leaf products Specification
 KENYA STANDARD DKS 2848 Moringa leaf products Specification KEBS 2018 First Edition 2018 TECHNICAL COMMITTEE REPRESENTATION The following organizations were represented on the Technical Committee: Ministry
Malaria (Pan-LDH) W/B
 W/B") CORTEZ DIAGNOSTICS, INC. 23961 Craftsman Road, Suite D/E/F, Calabasas, CA 91302 USA Tel: (818) 591-3030 Fax: (818) 591-8383 E-mail: onestep@rapidtest.com Web site: www.rapidtest.com See external label
CORTEZ DIAGNOSTICS, INC. 23961 Craftsman Road, Suite D/E/F, Calabasas, CA 91302 USA Tel: (818) 591-3030 Fax: (818) 591-8383 E-mail: onestep@rapidtest.com Web site: www.rapidtest.com See external label
Target Product Profile: Point-of-Care Malaria Plasmodium falciparum Highly Sensitive Rapid Diagnostic Test
 1 Target Product Profile: Point-of-Care Malaria Plasmodium falciparum Highly Sensitive Rapid Diagnostic Test For rapid detection of low-density, malaria infections Updated November 2015 2 Context Defining
BIOLOGY HIGHER LEVEL
 M 44 Write your Examination Number here Coimisiún na Scrúduithe Stáit State Examinations Commission LEAVING CERTIFICATE EXAMINATION, 2006 BIOLOGY HIGHER LEVEL TUESDAY, 13 JUNE AFTERNOON, 2.00 TO 5.00 Section
MALARIA IN KENYA FINDINGS FOR POLICY MAKERS. Executive summary. About the project. Strengthening actions towards a malariafree Kenya
 TDR-IDRC RESEARCH INITIATIVE ON VECTOR BORNE DISEASES IN THE CONTEXT OF CLIMATE CHANGE FINDINGS FOR POLICY MAKERS MALARIA IN KENYA Strengthening actions towards a malariafree Kenya Executive summary The
THOMSON & JOSEPH LTD. The Mineral Specialists GRASS SILAGE EARLY SEASON MINERAL PROFILE
 THOMSON & JOSEPH LTD The Mineral Specialists GRASS SILAGE - EARLY SEASON MINERAL PROFILE CALCIUM INCREASES AT EXPENSE OF PHOSPHORUS PHOSPHORUS DOWN BY 14% POTASSIUM MAINTAINS HIGH VALUE CAB FALLS BY 11%
Developing a mineral program: combining the art and the science. Mary Drewnoski, Beef Systems Specialist, University of Nebraska-Lincoln
 Developing a mineral program: combining the art and the science Mary Drewnoski, Beef Systems Specialist, University of Nebraska-Lincoln Historically, cattle producers believed that cattle contained nutritional
Analysis. Methods of. of Soils, Plants, Waters, Fertilisers & Organic Manures. Edited by HLS Tandon
 Methods of Analysis of Soils, Plants, Waters, Fertilisers & Organic Manures Edited by HLS Tandon Fertiliser Development and Consultation Organisation 204204A Bhanot Corner, 12 Pamposh Enclave New Delhi
Anatomical features of stem in relation to quality and yield factors in Saccharum clones
 Proc. Indian Acad. Sci., Vol. 88 B, Part II, Number 3, May 1979, pp. 203-212, 0 printed in India. Anatomical features of stem in relation to quality and yield factors in Saccharum clones K V BHAGYALAKSHMI
Maintaining proper nutrition is one of the best preventative measures a producer can take to maintain a healthy, efficient herd. Extensive research
 Regional Hay School Presented By Andy McCorkill Livestock Specialist University of Missouri Extension Ph: (417) 345-7551 Email: mccorkilla@missouri.edu Maintaining proper nutrition is one of the best preventative
Chapter 11: Range Animal Nutrition
 Chapter 11: Range Animal Nutrition 1. Nutritional Components of Forages a. Protein b. Energy c. Phosphorus d. Vitamin A 2. Comparative Nutrition of Forages a. Grasses b. Forbs c. Shrubs 3. Comparative
Effective Practices In Sheep Production Series
 Effective Practices In Sheep Production Series Understanding Feed Test Analysis Terms The key to accurate feed tests is correct sampling of your forages and grains. Equally important, is understanding
Maharashtra State Board Class IX Science and Technology Sample Paper 3
 Maharashtra State Board Class IX Science and Technology Sample Paper 3 Time: 3 hrs Max. Marks: 80 Note: 1. Use the same answer-sheet for Section A and Section B. 2. Draw well-labelled diagrams wherever
THE NATIONAL ACADEMIES
 THE NATIONAL ACADEMIES NATIONAL ACADEMY OF SCIENCES INSTITUTE OF MEDICINE NATIONAL ACADEMY OF ENGINEERING NATIONAL RESEARCH COUNCIL DIVISION ON EARTH AND LIFE STUDIES BOARD ON AGRICULTURE AND NATURAL RESOURCES
Reading and Analyzing your Fertilizer Bag. Dr. Cari Peters Vice President
 Reading and Analyzing your Fertilizer Bag Dr. Cari Peters Vice President caripeters@jrpeters.com Designer, Formulator, Producer and custom manufacturer of high quality fertilizer products. Hand s on Horticulture
Methods Tennessee Livestock Producers, Inc. (Tennessee Farm Bureau Federation, Columbia,
 Evaluation of Injectable Minerals and Growth Implants to Enhance Weaned Calf Development A.E. Fisher, W.W. Gill, C.D. Lane, Jr., R.L. Ellis and G.M. Pighetti Department of Animal Science Research and Education
Journal of Chemical, Biological and Physical Sciences
 JCBPS; Section B; May.2015 July.2015, Vol. 5, No. 3; 2634-2642. E- ISSN: 2249 1929 Journal of Chemical, Biological and Physical Sciences An International Peer Review E-3 Journal of Sciences Available online
Malaria Endemicity Among Pregnant Women Attending Antenatal Clinic in the University of Calabar Teaching Hospital, Calabar, Nigeria.
 Malaria Endemicity Among Pregnant Women Attending Antenatal Clinic in the University of Calabar Teaching Hospital, Calabar, Nigeria. B. E. MONJOL 1* and M. F. USEH 2 1 Microbiology Department, University
Specialists In Soil Fertility, Plant Nutrition and Irrigation Water Quality Management.
 Specialists In Soil Fertility, Plant Nutrition and Irrigation Water Quality Management. TOMATOES T PLANT NUTRITION & SAMPLING NOTES - 1 Noel Garcia, CCA he most important aspect of tomato production (field,
PARASITOLOGY CASE HISTORY #14 (BLOOD PARASITES) (Lynne S. Garcia)
 (Lynne S. Garcia)") PARASITOLOGY CASE HISTORY #14 (BLOOD PARASITES) (Lynne S. Garcia) A 37-year-old woman, who had traveled to New Guinea for several weeks, presented to the medical clinic with fever, chills, and rigors within
PARASITOLOGY CASE HISTORY #14 (BLOOD PARASITES) (Lynne S. Garcia) A 37-year-old woman, who had traveled to New Guinea for several weeks, presented to the medical clinic with fever, chills, and rigors within
years later the time has come to decide what vegetation should be planted. Because the City of Berkeley
 Chapter 4 SOIL ANALYSIS OF THE BERKELEY NORTH WATERFRONT PARK Rumall Randhawa In 1983 the Berkeley City Dump was closed, and the process of creating the North Waterfront Park began. A landscape architect
THE IMPACT OF FOLIAR APPLICATIONS OF NITROGEN AND BORON ON 'HASS' AVOCADO FRUIT SET
 : 35-46 THE IMPACT OF FOLIAR APPLICATIONS OF NITROGEN AND BORON ON 'HASS' AVOCADO FRUIT SET J. Dixon, D.B. Smith, T.A. Elmsly, A.C. Greenwood and E.M. Dixon Avocado Industry Council Ltd., P.O. Box 13267,
There are six general classes of nutrients needed in the horse s diet: water carbohydrates fats protein minerals vitamins.
 HORSE NUTRITION Nutrients A nutrient is defined as any feed constituent that is necessary to support life. The following is a list of functions that nutrients perform in the horse's body: source of energy
Scientific Inquiry Review
 Scientific Inquiry Review Adapted from Regentsprep.org Be able to USE AND APPLY the steps of the scientific method to solve a problem and design an experiment: Scientific Method: 1. Make observations about
Comparative Study On Concentration Of Some Minerals Found In Garlic (Allium Sativum Linn ) Species Grown In Some African Countries
 Species Grown In Some African Countries") Comparative Study On Concentration Of Some Minerals Found In Garlic (Allium Sativum Linn ) Species Grown In Some African Countries Sa adatu M. E. Department of Chemical Technology, Standards Organisation
Comparative Study On Concentration Of Some Minerals Found In Garlic (Allium Sativum Linn ) Species Grown In Some African Countries Sa adatu M. E. Department of Chemical Technology, Standards Organisation
BOTANY AND PLANT GROWTH Lesson 9: PLANT NUTRITION. MACRONUTRIENTS Found in air and water carbon C oxygen hydrogen
 BOTANY AND PLANT GROWTH Lesson 9: PLANT NUTRITION Segment One Nutrient Listing Plants need 17 elements for normal growth. Carbon, oxygen, and hydrogen are found in air and water. Nitrogen, phosphorus,
WHO Prequalification of Diagnostics Programme PUBLIC REPORT. Product: IMMUNOQUICK MALARIA falciparum Number: PQDx
 WHO Prequalification of Diagnostics Programme PUBLIC REPORT Product: IMMUNOQUICK MALARIA falciparum Number: PQDx 0045-018-00 Abstract IMMUNOQUICK MALARIA falciparum with product codes 1 0502_K25, 0502_K50
IRRIGATION AND NUTRITION MANAGEMENT FOR GOOD POSTHARVEST PERFORMANCE JOHN P BOWER
 IRRIGATION AND NUTRITION MANAGEMENT FOR GOOD POSTHARVEST PERFORMANCE JOHN P BOWER Agassiz, Canada Consultant: Horticultural Product Quality Objectives Fruit arrives in the market No external chilling damage
Understanding a Soil Report
 Understanding a Soil Report AGRONOMY SOIL ANALYSIS 1. Soil ph Soil ph is a measure of the acidity in the soil. An acidic soil has a greater amount of hydrogen (H+) ions and a ph below 7.0. Values above
Protn-Latex. For Determination of Protein in Latex. (Cat. # Latex, Latex) think proteins! think G-Biosciences
 think proteins! think G-Biosciences") 415PR-02 G-Biosciences 1-800-628-7730 1-314-991-6034 technical@gbiosciences.com A Geno Technology, Inc. (USA) brand name Protn-Latex For Determination of Protein in Latex (Cat. # 786-20Latex, 786-21Latex)
415PR-02 G-Biosciences 1-800-628-7730 1-314-991-6034 technical@gbiosciences.com A Geno Technology, Inc. (USA) brand name Protn-Latex For Determination of Protein in Latex (Cat. # 786-20Latex, 786-21Latex)
Raw Sugarcane Juice Nature's Perfect Wonder Food. Written by Dee McCaffrey, CDC Monday, October 03, 2011
 If you've ever had the pleasure of drinking freshly extracted raw fruit or vegetable juices, you know the health value of doing so. Freshly extracted juices contain live enzymes and nutrients that are
Epidemiological trends of malaria in an endemic district Tumkur, Karnataka
 International Journal of Community Medicine and Public Health Krishna C et al. Int J Community Med Public Health. 2017 Jun;4(6):2141-2145 http://www.ijcmph.com pissn 2394-6032 eissn 2394-6040 Original
Annex 5. Generic protocol for the calibration of seasonal and pandemic influenza antigen working reagents by WHO essential regulatory laboratories
 Annex 5 Generic protocol for the calibration of seasonal and pandemic influenza antigen working reagents by WHO essential regulatory laboratories Abbreviations 262 1. Introduction 262 2. Essential regulatory
CPGAN #002. FTIR Quantification of Absorbed Radiation Dose in Polyethylene
 1.1 Introduction Ultra-high molecular weight polyethylene (UHMWPE) is the current material of choice for bearing surface applications in total joint arthroplasty. In an effort to enhance the wear properties
BIOLOGY HIGHER LEVEL
 2011. M44 Write your Examination Number here Coimisiún na Scrúduithe Stáit State Examinations Commission LEAVING CERTIFICATE EXAMINATION, 2011 BIOLOGY HIGHER LEVEL THURSDAY, JUNE 16 MORNING, 9.30 TO 12.30
Paper 2 Data Analysis and Planning For Examination from 2016 SPECIMEN PAPER 1 hour 15 minutes
 www.xtremepapers.com Cambridge International Examinations Cambridge Pre-U Certificate *0123456789* BIOLOGY (PRINCIPAL) 9790/02 Paper 2 Data Analysis and Planning For Examination from 2016 SPECIMEN PAPER
Understanding your results Acidity... 3 Aluminium... 3 Base saturation... 3 Boron... 4 Bulk density... 4 Calcium... 4 Cations...
 Understanding your results Acidity... 3 Aluminium.... 3 Base saturation... 3 Boron... 4 Bulk density... 4 Calcium... 4 Cations... 4 CEC - Cation Exchange Capacity... 4 Copper... 5 Conductivity... 6 Deficiencies...
STUDY ON MINERAL NUTRIENT IN MANGO ORCHARD IN IRAN. A. H. Mohebi Date Palm & Tropical Fruit Research Institute of Iran
 Proceedings: International Conference on Mango and Date Palm: Culture and Export. 20 th to 23 rd June, 2005. Malik et al. (Eds), University of Agriculture, Faisalabad. STUDY ON MINERAL NUTRIENT IN MANGO
Matching Forages to the Nutrient Needs of Meat Goats
 Matching Forages to the Nutrient Needs of Meat Goats J. Paul Mueller, Matthew H. Poore, Jean-Marie Luginbuhl, and James T. Green, Jr. FORAGES FOR GOATS Goats offer an alternative to utilizing forage and
Chapter 11 Risk, Toxicology, and Human Health
 Chapter 11 Risk, Toxicology, and Human Health Risk Expressed in terms of probability: how likely it is that some event will occur. Risk = (Exposure)(harm) Risk assessment (identifying, occurrence, assessing)
EFFECT OF NUTRIENT SUPPLY ON QUANTITY AND QUALITY OF HEMPSEED
 EFFECT OF NUTRIENT SUPPLY ON QUANTITY AND QUALITY OF HEMPSEED Ildikó IVÁNYI, Zoltán IZSÁKI Szent István University Faculty Water and Environtal Management Institute Agricultural Science, Szarvas, H-5541
Supplying Nutrients to Crops
 Supplying Nutrients to Crops What is Plant Nutrition? Plants need nutrients for healthy growth and development. Plant nutrition involves the absorption of nutrients for plant growth and is dependent on
Example: Ammonium Sulphate (also called Sulphate of Ammonia) is composed of the following:
 is composed of the following:") Atoms are made up of smaller particles that are held together by electrical or magnetic forces. Each atom is, in effect, like a mini solar system with a cluster of particles called electrons orbiting it.
Atoms are made up of smaller particles that are held together by electrical or magnetic forces. Each atom is, in effect, like a mini solar system with a cluster of particles called electrons orbiting it.
BIOLOGY - ORDINARY LEVEL
 Write your Examination Number here 2007. M. 43 Coimisiún na Scrúduithe Stáit State Examinations Commission LEAVING CERTIFICATE EXAMINATION, 2007 BIOLOGY - ORDINARY LEVEL TUESDAY, 12 JUNE - AFTERNOON, 2.00
Insecticide Technology
 Insecticide Technology Insecticide plastic masterbatches used to control pests in agricultural, horticultural, forestry, home and golf course applications Symphony s comprehensive line of d 2 p masterbatches,
HI Total Acidity Mini Titrator for Water Analysis
 HI 84530 Total Acidity Mini Titrator for Water Analysis Piston Driven Pump with Dynamic Dosing The HI 84530 incorporates dynamic dosing to provide precison titrant delivery. Dynamic dosing adjusts the
Soil Fertility and Nutrient Management. Hailin Zhang. Department of Plant and Soil Sciences
 Soil Fertility and Nutrient Management Hailin Zhang Department of Plant and Soil Sciences C H O P N K 16 ESSENTIAL ELEMENTS Ca S Mg B Cl Cu Fe Mn Mo B NON-MINERAL NUTRIENTS Carbon (C) Hydrogen (H) Oxygen
Ultrastructural Studies on Plasmodium vivax
 Characterization of Human Malaria Parasites Ultrastructural Studies on Plasmodium vivax For the first time a detailed ultrastructural study was carried out on P. vivax. Fine structural analysis of growth
Fertilizer. Fertilizers. (FAO press release, April 1990): Nutrient Depletion. Nutrient Depletion 4/16/2012
: Nutrient Depletion. Nutrient Depletion 4/16/2012") Fertilizers Fertilizer Any organic or inorganic material of natural or synthetic origin which is added to a soil to supply elements essential to the growth of plants 1 2 (FAO press release, April 1990):
Fertilizers Fertilizer Any organic or inorganic material of natural or synthetic origin which is added to a soil to supply elements essential to the growth of plants 1 2 (FAO press release, April 1990):
AZOOSPERMIA Chromosome Y
 AZOOSPERMIA Chromosome Y M i c r o d e l e t i o n Ref.: PI EDP003024-40 testspi EDP002024 1. INTRODUCTION In 1976, Tiepolo and Zuffardi reported de novo, microscopically detectable deletions of the distal
Biosolids Nutrien Management an Soil Testing. Craig Cogger, Soil Scientis WSU Puyallup
 Biosolids Nutrien Management an Soil Testing Craig Cogger, Soil Scientis WSU Puyallup Nutrient Manageme Meet crop nutrient needs Maintain soil quality Conserve resources Protect water quality -- reduc
Efficiency of Arsenic Removal from Soil by Vetiveria zizanioides and Vetiveria nemoralis
 Efficiency of Arsenic Removal from Soil by Vetiveria zizanioides and Vetiveria nemoralis Thares Srisatit 1, Tuearnjai Kosakul 2, and Dusaluk Dhitivara 3 1 Department of Environmental Engineering, Faculty
Use of Soil and Tissue Testing for Sustainable Crop Nutrient Programs
 Use of Soil and Tissue Testing for Sustainable Crop Nutrient Programs Kelly T. Morgan Soil and Water Science Department Southwest Florida Research and Education Center Immokalee 239 658 3400 conserv@ufl.edu
FACTORS AFFECTING WATER QUALITY
 TECHNICAL PAPER WATER QUALITY PLANT HEALTH FACTORS Water quality is one of the most important factors affecting plant growth, as unwanted components in water can interfere with nutrient availability and
CORESTA Recommended Method No. 84
 Cooperation Centre for Scientific Research Relative to Tobacco E-Vapour Sub-Group CORESTA Recommended Method No. 84 DETERMINATION OF GLYCERIN, PROPYLENE GLYCOL, WATER, AND NICOTINE IN THE AEROSOL OF E-CIGARETTES
VETIVER FORAGE and BIOMASS
 VETIVER FORAGE and BIOMASS Vetiver grass is a very versatile plant that has been used worldwide to address a myriad of environmental and engineering rehabilitation issues. Due to its unique ability, except
CORESTA RECOMMENDED METHOD N 8
 CORESTA RECOMMENDED METHOD N 8 DETERMINATION OF WATER IN THE MAINSTREAM SMOKE OF CIGARETTES BY GAS CHROMATOGRAPHIC ANALYSIS (August 1991) 1. FIELD OF APPLICATION The method is applicable to the particulate
Animal Science: Isotopes and Nuclear Techniques
 Animal Science: Isotopes and Nuclear Techniques by John E. Vercoe In many regions of the world, animal production is limited by poor growth, reproductive performance and milk output of livestock, thus
Evaluation of Malaria Surveillance System in Hooghly district of West Bengal - India
 Original Research Article Evaluation of Malaria Surveillance System in Hooghly district of West Bengal - India Dan Amitabha 1,*, Kunal Kanti De 2, Pasi A R 3, Jalaluddeen M 4, Roy Bibhash 5 1 Airport Health
PRIMARY (MACRO) NUTRIENTS
 NUTRIENTS") Session 8 Earth: Fertility in the forest garden Lewis McNeill May 2014 Recap on nutrients Sixteen plant food nutrients are essential for proper plant and crop development. Each is equally important to
Session 8 Earth: Fertility in the forest garden Lewis McNeill May 2014 Recap on nutrients Sixteen plant food nutrients are essential for proper plant and crop development. Each is equally important to
Evaluation of murine model of malaria using ethanolic extracts of Pride of barbados (Caesalpinia pulcherrima)
") Original Research Article Journal der Pharmazie Forschung (Formerly-Recent Advances in Pharmaceutical Science Research) Vol-2 No-1 2013 Evaluation of murine model of malaria using ethanolic extracts of
Original Research Article Journal der Pharmazie Forschung (Formerly-Recent Advances in Pharmaceutical Science Research) Vol-2 No-1 2013 Evaluation of murine model of malaria using ethanolic extracts of
. MONITORING THEILERIA ON THE BASIS OF MICROSCOPIC EXAMINATION
 . MONITORING THEILERIA ON THE BASIS OF MICROSCOPIC EXAMINATION 3.1 Introduction Theileria is a vector borne protozoan parasite that causes theileriosis which is a fatal disease for cows. It is a disease
Balancing Rations for Sheep and Goats
 Cooperative Extension Program University of Arkansas at Pine Bluff Animal Science FSA9613 Balancing Rations for Sheep and Goats David Fernandez Extension Livestock Specialist To achieve the best production
Repellent Soap. The Jojoo Mosquito. Africa s innovative solution to Malaria prevention. Sapphire Trading Company Ltd
 The Jojoo Mosquito Repellent Soap Africa s innovative solution to Malaria prevention Sapphire Trading Company Ltd P.O.Box: 45938-00100 Nairobi, Kenya. Tel: +254 735 397 267 +254 733 540 868 +254 700 550
Malaria Pf/pan antigen Rapid Test
 Malaria Pf/pan antigen Rapid Test Cat. No.:IVDTS003 Pkg.Size:10T/50T Intended use The Malaria Pf/pan antigen Rapid Test is a self-performing, qualitative, sandwich immunoassay, utilizing whole blood for
ENVIRONMENTAL, ECONOMICS AND EQUITY ASPECTS OF VETIVER IN SOUTH INDIA
 ENVIRONMENTAL, ECONOMICS AND EQUITY ASPECTS OF VETIVER IN SOUTH INDIA E.V.S.Prakasa Rao, C.T.Gopinath and S.P.S.Khanuja* Central Institute of Medicinal and Aromatic Plants, Resource Centre, Allalasandra,
TNPSC Chemistry Study Material Fertilizers
 TNPSC Chemistry Study Material A fertilizer is any material of natural or synthetic origin (other than liming materials) that is applied to soils or to plant tissues to supply one or more plant nutrients
2014 National Curriculum Science Band 1
 2014 National Curriculum Science Band 1 ask simple questions and recognise that they can be answered in different ways (Year 1 variety of common animals including fish, amphibians, reptiles, birds and
NAME: DATE: Leaving Certificate Biology: Nutrition. Please see Teachers Notes for explanations, additional activities, and tips and suggestions.
 Leaving Certificate Biology Nutrition Please see Teachers Notes for explanations, additional activities, and tips and suggestions. Learning Support Vocabulary, key terms working with text and writing text
Interpreting Soils Report. Beyond N P K
 Interpreting Soils Report Beyond N P K What we will cover We will not discuss Macro Nutrients Nitrogen, Phosphorus, and Potassium. We will touch on Secondary Nutrients Magnesium, Calcium and Sulfur. We
SEASONAL VARIATIONS IN LEAF MINERAL CONTENT
 : 21-34 SEASONAL VARIATIONS IN LEAF MINERAL CONTENT J.Dixon,T.A.Elmsly,andE.M.Dixon Avocado Industry Council Ltd., P.O. Box 13267, Tauranga 3110 Corresponding author: jonathandixon@nzavocado.co.nz ABSTRACT
JV2 BUSINESSES S.A.C.
 AVOCADO BY SEA TECHNICAL DATA SHEET Scientific Name : Persea Americana Miller Variety : Hass / Fuerte Origin : PERU Production : January to August Boxes per container : 5,280 x 4 Kg. 2,280 x 10 Kg. HTS
Achieve universal primary education
 GOAL 2 Achieve universal primary education TARGET Ensure that, by 2015, children everywhere, boys and girls alike, will be able to complete a full course of primary schooling Considerable progress has