Lecture 21. RNA-seq: Advanced analysis
|
|
|
- William Walker
- 5 years ago
- Views:
Transcription
1 Lecture 21 RNA-seq: Advanced analysis
2 Experimental design
3 Introduction An experiment is a process or study that results in the collection of data. Statistical experiments are conducted in situations in which researchers can manipulate the conditions of the experiment and can control the factors that are irrelevant to the research objectives.
4 Statistical design of experiments Experimental design is the process of planning a study to meet specified objectives. Planning an experiment properly is very important in order to ensure that the right type of data and a sufficient sample size and power are available to answer the research questions of interest as clearly and efficiently as possible.
5 Designing an experiment Perform the following steps when designing an experiment: 1. Define the problem and the questions to be addressed 2. Define the population of interest 3. Determine the need for sampling 4. Define the experimental design
6 Define problem Before data collection begins, specific questions that the researcher plans to examine must be clearly identified. In addition, a researcher should identify the sources of variability in the experimental conditions. One of the main goals of a designed experiment is to partition the effects of the sources of variability into distinct components in order to examine specific questions of interest. The objective of designed experiments is to improve the precision of the results in order to examine the research hypotheses.
7 Define population A population is a collective whole of people, animals, plants, or other items that researchers collect data from. Before collecting any data, it is important that researchers clearly define the population, including a description of the members. The designed experiment should designate the population for which the problem will be examined. The entire population for which the researcher wants to draw conclusions will be the focus of the experiment.
8 Determine the need for sampling A sample is one of many possible sub-sets of units that are selected from the population of interest. In many data collection studies, the population of interest is assumed to be much larger in size than the sample so, potentially, there are a very large (usually considered infinite) number of possible samples. The results from a sample are then used to draw valid inferences about the population.
9 Determine the need for sampling A random sample is a sub-set of units that are selected randomly from a population. A random sample represents the general population or the conditions that are selected for the experiment because the population of interest is too large to study in its entirety. Using techniques such as random selection after stratification or blocking is often preferred.
10 Determine the need for sampling Determining the sample size requires some knowledge of the observed or expected variance among sample members in addition to how large a difference among treatments you want to be able to detect. Another way to describe this aspect of the design stage is to conduct a prospective power analysis, which is a brief statement about the capability of an analysis to detect a practical difference. A power analysis is essential so that the data collection plan will work to enhance the statistical tests primarily by reducing residual variation, which is one of the key components of a power analysis study.
11 Define experimental design Defining the experimental design consists of the following steps: 1. Identify the experimental unit. 2. Identify the types of variables. 3. Define the treatment structure. 4. Define the design structure.
12 Experimental units An Experimental (or sampling) unit is the person or object that will be studied by the researcher. This is the smallest unit of analysis in the experiment from which data will be collected (e.g. patient, mouse, plant, or cell line).
13 Experimental units An entity receiving an independent application of a treatment is called an experimental unit. An experimental run is the process of applying a particular treatment combination to an experimental unit and recording its response. A replicate is an independent run carried out on a different experimental unit under the same conditions.
14 Example: Two pots Experimental unit: plant on the pot No replication
15 Types of variables A data collection plan considers how four important variables: background, constant, uncontrollable, and primary, fit into the study. The explanatory variables are referred to as factors. Inconclusive results are likely to result if any of these classifications are not adequately defined. It is important to consider all the relevant variables before the final data collection plan is approved in order to maximize confidence in the final results.
16 Background variables Background variables can be identified and measured yet cannot be controlled; they will influence the outcome of an experiment. Background variables will be treated as covariates in the model rather than primary variables.
17 Primary variables Primary variables are the variables of interest to the researcher. Primary variables are independent variables that are possible sources of variation in the response. These variables comprise the treatment and design structures and are referred to as factors. When background variables are used in an analysis, better estimates of the primary variables should result because the sources of variation that are supplied by the covariates have been removed.
18 Constant variables Constant variables can be controlled or measured but, for some reason, will be held constant over the duration of the study. This action increases the validity of the results by reducing extraneous sources of variation from entering the data. For this data collection plan, some of the variables that will be held constant include: the use of standard operating procedures the use of one operator for each measuring device all measurements taken at specific times and locations
19 Uncontrollable variables Uncontrollable variables are those variables that are known to exist, but conditions prevent them from being manipulated, or it is very difficult (due to cost or physical constraints) to measure them. The experimental error is due to the influential effects of uncontrollable variables, which will result in less precise evaluations of the effects of the primary and background variables. The design of the experiment should eliminate or control these types of variables as much as possible in order to increase confidence in the final results.
20 Explanatory and response variables XX YY - Explanatory variables - Factors - Response variables
21 Factors - Noise factor - Blocking factor ZZ Treatment factor or design factor XX YY Response variables Levels: XX = xx Treatment combination or treatment: a particular combination of factor levels (e.g. xx 1, xx 2 if there are two treatment factors)
22 Levels The levels of the primary factors represent the range of the inference space relative to a study. The levels of the primary factors can represent the entire range of possibilities or a random sub-set. It is also important to recognize and define when combinations of levels of two or more treatment factors are illogical or unlikely to exist.
23 Fixed effects Fixed effects treatment factors are usually considered to be "fixed" in the sense that all levels of interest are included in the study because they are selected by some non-random process, they consist of the whole population of possible levels, or other levels were not feasible to consider as part of the study. The fixed effects represent the levels of a set of precise hypotheses of interest in the research. A fixed factor can have only a small number of inherent levels; for example, the only relevant levels for gender are male and female. A factor should also be considered fixed when only certain values of it are of interest, even though other levels might exist. Treatment factors can also be considered "fixed" as opposed to "random" because they are the only levels about which you would want to make inferences.
24 Three basic principles of experimental design Replication Randomization Blocking
25 Replication By replication we mean an independent repeat run of each treatment combination. Replication is essential for estimating experimental error. If a treatment condition appears more than one time, it is defined to be replicated. Misconceptions about the number of replications have often occurred in experiments where sub-samples or repeated observations on a unit have been mistaken as additional experimental units.
26 Randomization By randomization we mean that both the assignment of treatments to units and the order in which the individual runs of the experiments are to be performed are randomly determined. A completely randomized design is an experimental design in which treatments are assigned to all units by randomization.
27 Example: Randomized Experimental unit: plant on the pot 4 replicates for each treatment
28 Blocking Most experimental designs require experimental units to be allocated to treatments either randomly or randomly with constraints, as in blocked designs. Blocks are groups of experimental units that are formed to be as homogeneous as possible with respect to the block characteristics. The term block comes from the agricultural heritage of experimental design where a large block of land was selected for the various treatments, that had uniform soil, drainage, sunlight, and other important physical characteristics. Homogeneous clusters improve the comparison of treatments by randomly allocating levels of the treatments within each block.
29 Blocking Blocking is an experimental design strategy used to reduce or eliminate the variability transmitted from nuisance factors, which may influence the response variable but in which we are not directly interested. Blocking is the grouping of experimental units that have similar properties. Within each block, treatments are randomly assigned to experimental units. The resulting design is called a randomized block design. This design enables more precise estimates of the treatment effects because comparisons between treatments are made among homogeneous experimental units in each block.
30 Blocking ZZ XX YY
31 Blocking example Blocking removes the variation in response among chambers, allowing more precise estimates and more powerful tests of the treatment effects.
32 Design structure The design structure consists of those factors that define the blocking of the experimental units into clusters. The types of commonly used design structures: Completely randomized design Randomized complete block design Factorial design
33 Completely randomized design Subjects are assigned to treatments completely at random.
34 Randomized complete block design Subjects are divided into b blocks according to demographic characteristics. Subjects in each block are then randomly assigned to treatments so that all treatment levels appear in each block.
35 Factorial design Many experiments in biology investigate more than one treatment factor, because: 1. answering two questions from a single experiment rather than just one makes more efficient use of time, supplies, and other costs 2. the factors might interact.
36 Factorial design An experiment having a factorial design investigates all treatment combinations of two or more treatment factors. A factorial design can measure interactions between factors. An interaction between two (or more) explanatory variables means that the effect of one variable on the response depends on the state of the other variable.
37 Factorial design XX 2 XX 1 YY
38 Analyzing data
39 Regression Regression is a method that 1. predicts the average values of a response variable from values of explanatory variables (focusing on regression to represent relationships between variables) 2. summarizes how the average values of a response variable vary over subpopulations defined by functions of explanatory variables (focusing on regression as a comparison of average outcomes)
40 Ordinary linear regression yy ii = ββ 0 + ββ 1 xx iii + + ββ pp 1 xx iiii 1 + εε ii, εε ii NN 0, σσ 2, ii = 1,, n EE[yy ii ] = ββ 0 + ββ 1 xx iii + + ββ pp 1 xx iiii 1, ii = 1,, n EE[yy XX] = XXXX
41 Three components of the GLMs 1. Random component: yy = yy 1,, yy nn T and its probability distribution. The observations yy ii are treated as independent 2. Systematic component (or linear predictor): XXXX, where XX is a nn pp model matrix and ββ = ββ 0,, ββ pp 1 T 3. Link function: a function gg applied to each component of EE[yy] that relates it to the linear predictor, gg(ee yy ) = XXXX
42 Random component of a GLM The random component of a GLM consists of a response variable yy with independent observations yy = yy 1,, yy nn T having probability density or mass function for a distribution in the exponential family. By restricting GLMs to exponential family distributions, we obtain: 1. General expressions for the model likelihood equations 2. Asymptotic distributions of estimators for model parameters 3. An algorithm for fitting the models.
43 Systematic component of a GLM The linear predictor of a GLM relates parameters {ηη ii } pertaining to {EE yy ii } to the explanatory variables using a linear combination of them ηη ii = pp 1 jj=0 ββ jj xx iiii where xx ii0 = 1. This expression is linear in the parameters. In matrix form, we express the linear predictor as ηη = XXXX where ηη = ηη 1,, ηη nn T, ββ = ββ 0,, ββ pp 1 T is the column vector of model parameters, and XX is the nn pp matrix of explanatory variable values. The matrix XX is called the model matrix or design matrix.
44 Link function of a GLM The link function connects the random component with the linear predictor. Let μμ ii = EE yy ii. The GLM links ηη ii to μμ ii by ηη ii = gg(μμ ii ), where the link function gg is a monotonic, differentiable function: gg μμ ii = pp 1 jj=0 ββ jj xx iiii
45 Linear model: a GLM with identity link function The link function gg μμ ii = μμ ii is called the identity link function. A GLM that uses the identity link function is called a linear model. This GLM has pp 1 μμ ii = ββ jj xx iiii jj=0 The standard version of the linear model, which we refer to as the ordinary linear model, assumes that the observations have constant variance, called homoscedasticity: yy ii = pp 1 jj=0 ββ jj xx iiii + εε ii, where EE εε ii = 0 and VVVVVV εε ii = σσ 2. The ordinary normal linear model further assumes that εε ii NN(0, σσ 2 ).
46 Important GLMs Random component Systematic component Link function Model Normal Continuous Identity Regression Normal Categorical Identity ANOVA Normal Mixed Identity ANCOVA Binomial Mixed Logit Logistic regression Binomial Mixed Probit and others Binary regression Multinomial Mixed Generalized logit Multinomial response Poisson Mixed Log Poisson loglinear
47 Example: RNA-seq
48 Multiple factors Experiments with more than one factor influencing the counts can be analyzed using design formula that include the additional variables. In fact, DESeq2 can analyze any possible experimental design that can be expressed with fixed effects terms (multiple factors, designs with interactions, designs with continuous variables, splines, and so on are all possible). By adding variables to the design, one can control for additional variation in the counts. For example, if the condition samples are balanced across experimental batches, by including the batch factor to the design, one can increase the sensitivity for finding differences due to condition. There are multiple ways to analyze experiments when the additional variables are of interest and not just controlling factors.
49 Including type
50 Accounting for type We can account for the different types of sequencing, and get a clearer picture of the differences attributable to the treatment. As condition is the variable of interest, we put it at the end of the formula. Thus the results function will by default pull the condition results unless contrast or name arguments are specified. Then we can rerun DESeq.
51 Accounting for type
52 Accounting for type
53 Accounting for type
54 Accounting for type It is also possible to retrieve the log2 fold changes, p values and adjusted p values of the type variable. The contrast argument of the function results takes a character vector of length three: the name of the variable, the name of the factor level for the numerator of the log2 ratio, and the name of the factor level for the denominator.
55 Accounting for type
56 Gene Ontology
57 Annotating and exporting results Our result table only contains information about Ensembl gene IDs, but alternative gene names may be more informative for collaborators. Bioconductor s annotation packages help with mapping various ID schemes to each other.
58 Annotating and exporting results
59 Annotating and exporting results
60 Running topgo

61 Running topgo
62 Running topgo
63 Running topgo
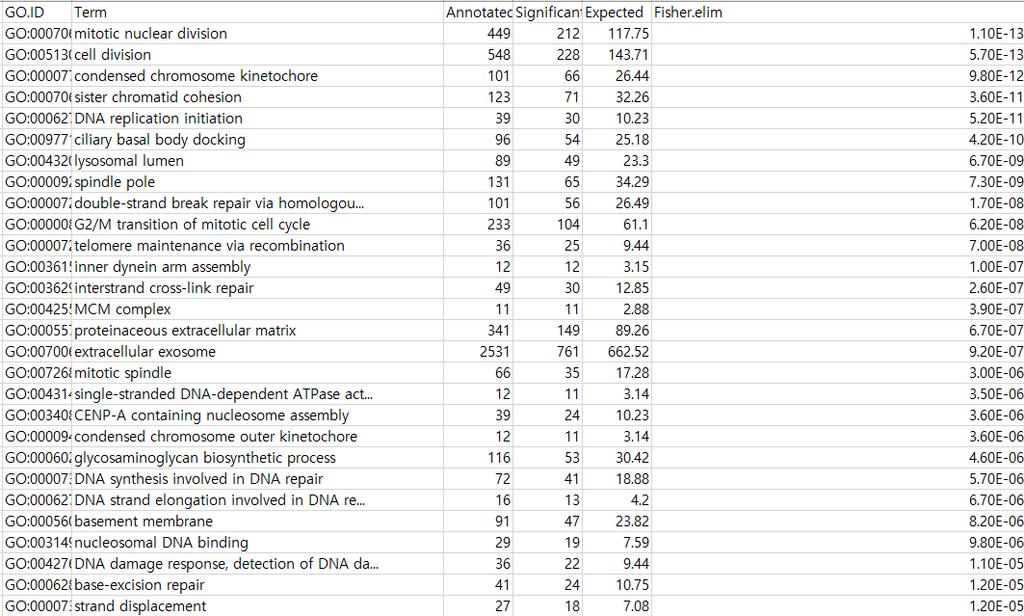
64 Downregulated GO
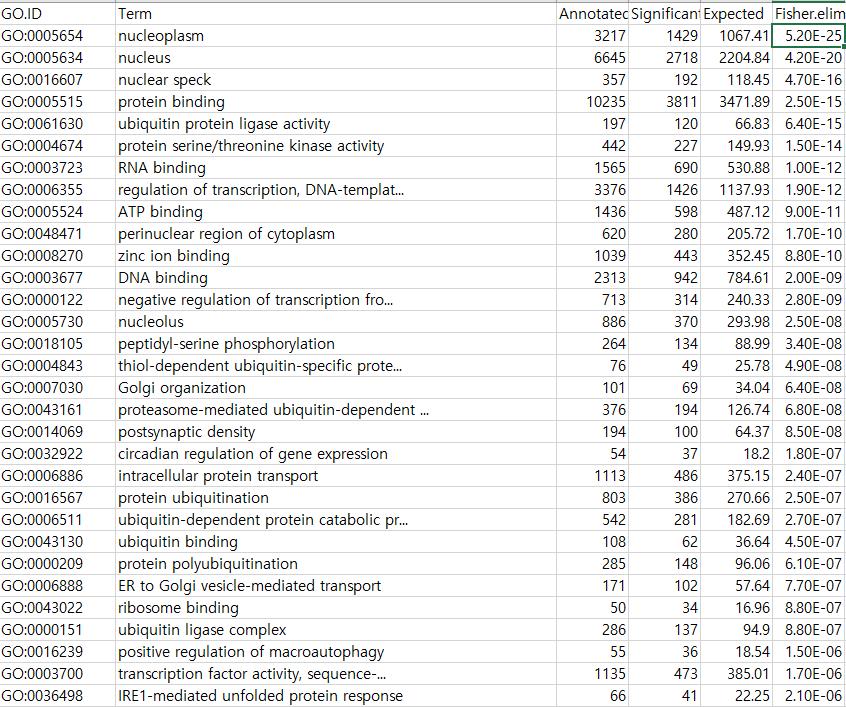
65 Upregulated GO
 and upregulated (E) genes, respectively.")
66 Published results The top 10 most significant terms are shown for downregulated (D) and upregulated (E) genes, respectively.
RNA-seq. Design of experiments
 RNA-seq Design of experiments Experimental design Introduction An experiment is a process or study that results in the collection of data. Statistical experiments are conducted in situations in which researchers
RNA-seq. Differential analysis
 RNA-seq Differential analysis Data transformations Count data transformations In order to test for differential expression, we operate on raw counts and use discrete distributions differential expression.
Experimental Studies. Statistical techniques for Experimental Data. Experimental Designs can be grouped. Experimental Designs can be grouped
 Experimental Studies Statistical techniques for Experimental Data Require appropriate manipulations and controls Many different designs Consider an overview of the designs Examples of some of the analyses
Use of GEEs in STATA
 Use of GEEs in STATA 1. When generalised estimating equations are used and example 2. Stata commands and options for GEEs 3. Results from Stata (and SAS!) 4. Another use of GEEs Use of GEEs GEEs are one
investigate. educate. inform.
 investigate. educate. inform. Research Design What drives your research design? The battle between Qualitative and Quantitative is over Think before you leap What SHOULD drive your research design. Advanced
Experimental Design for Immunologists
 Experimental Design for Immunologists Hulin Wu, Ph.D., Dean s Professor Department of Biostatistics & Computational Biology Co-Director: Center for Biodefense Immune Modeling School of Medicine and Dentistry
Biostatistics 2 nd year Comprehensive Examination. Due: May 31 st, 2013 by 5pm. Instructions:
 Biostatistics 2 nd year Comprehensive Examination Due: May 31 st, 2013 by 5pm. Instructions: 1. The exam is divided into two parts. There are 6 questions in section I and 2 questions in section II. 2.
Analysis of Environmental Data Conceptual Foundations: En viro n m e n tal Data
 Analysis of Environmental Data Conceptual Foundations: En viro n m e n tal Data 1. Purpose of data collection...................................................... 2 2. Samples and populations.......................................................
How to analyze correlated and longitudinal data?
 How to analyze correlated and longitudinal data? Niloofar Ramezani, University of Northern Colorado, Greeley, Colorado ABSTRACT Longitudinal and correlated data are extensively used across disciplines
f WILEY ANOVA and ANCOVA A GLM Approach Second Edition ANDREW RUTHERFORD Staffordshire, United Kingdom Keele University School of Psychology
 ANOVA and ANCOVA A GLM Approach Second Edition ANDREW RUTHERFORD Keele University School of Psychology Staffordshire, United Kingdom f WILEY A JOHN WILEY & SONS, INC., PUBLICATION Contents Acknowledgments
BIOL 458 BIOMETRY Lab 7 Multi-Factor ANOVA
 BIOL 458 BIOMETRY Lab 7 Multi-Factor ANOVA PART 1: Introduction to Factorial ANOVA ingle factor or One - Way Analysis of Variance can be used to test the null hypothesis that k or more treatment or group
Ecological Statistics
 A Primer of Ecological Statistics Second Edition Nicholas J. Gotelli University of Vermont Aaron M. Ellison Harvard Forest Sinauer Associates, Inc. Publishers Sunderland, Massachusetts U.S.A. Brief Contents
In this module I provide a few illustrations of options within lavaan for handling various situations.
 In this module I provide a few illustrations of options within lavaan for handling various situations. An appropriate citation for this material is Yves Rosseel (2012). lavaan: An R Package for Structural
Analysis of Rheumatoid Arthritis Data using Logistic Regression and Penalized Approach
 University of South Florida Scholar Commons Graduate Theses and Dissertations Graduate School November 2015 Analysis of Rheumatoid Arthritis Data using Logistic Regression and Penalized Approach Wei Chen
9.0 L '- ---'- ---'- --' X
 352 C hap te r Ten 11.0 10.5 Y 10.0 9.5 9.0 L...- ----'- ---'- ---'- --' 0.0 0.5 1.0 X 1.5 2.0 FIGURE 10.23 Interpreting r = 0 for curvilinear data. Establishing causation requires solid scientific understanding.
Measurement Error in Nonlinear Models
 Measurement Error in Nonlinear Models R.J. CARROLL Professor of Statistics Texas A&M University, USA D. RUPPERT Professor of Operations Research and Industrial Engineering Cornell University, USA and L.A.
QA 605 WINTER QUARTER ACADEMIC YEAR
 Instructor: Office: James J. Cochran 117A CAB Telephone: (318) 257-3445 Hours: e-mail: URL: QA 605 WINTER QUARTER 2006-2007 ACADEMIC YEAR Tuesday & Thursday 8:00 a.m. 10:00 a.m. Wednesday 8:00 a.m. noon
List of Figures. List of Tables. Preface to the Second Edition. Preface to the First Edition
 List of Figures List of Tables Preface to the Second Edition Preface to the First Edition xv xxv xxix xxxi 1 What Is R? 1 1.1 Introduction to R................................ 1 1.2 Downloading and Installing
Data Analysis Using Regression and Multilevel/Hierarchical Models
 Data Analysis Using Regression and Multilevel/Hierarchical Models ANDREW GELMAN Columbia University JENNIFER HILL Columbia University CAMBRIDGE UNIVERSITY PRESS Contents List of examples V a 9 e xv " Preface
Correlation and regression
 PG Dip in High Intensity Psychological Interventions Correlation and regression Martin Bland Professor of Health Statistics University of York http://martinbland.co.uk/ Correlation Example: Muscle strength
Lecture Outline. Biost 590: Statistical Consulting. Stages of Scientific Studies. Scientific Method
 Biost 590: Statistical Consulting Statistical Classification of Scientific Studies; Approach to Consulting Lecture Outline Statistical Classification of Scientific Studies Statistical Tasks Approach to
Today: Binomial response variable with an explanatory variable on an ordinal (rank) scale.
 scale.") Model Based Statistics in Biology. Part V. The Generalized Linear Model. Single Explanatory Variable on an Ordinal Scale ReCap. Part I (Chapters 1,2,3,4), Part II (Ch 5, 6, 7) ReCap Part III (Ch 9, 10,
Model Based Statistics in Biology. Part V. The Generalized Linear Model. Single Explanatory Variable on an Ordinal Scale ReCap. Part I (Chapters 1,2,3,4), Part II (Ch 5, 6, 7) ReCap Part III (Ch 9, 10,
Detecting Anomalous Patterns of Care Using Health Insurance Claims
 Partially funded by National Science Foundation grants IIS-0916345, IIS-0911032, and IIS-0953330, and funding from Disruptive Health Technology Institute. We are also grateful to Highmark Health for providing
Biostatistics II
 Biostatistics II 514-5509 Course Description: Modern multivariable statistical analysis based on the concept of generalized linear models. Includes linear, logistic, and Poisson regression, survival analysis,
EPI 200C Final, June 4 th, 2009 This exam includes 24 questions.
 Greenland/Arah, Epi 200C Sp 2000 1 of 6 EPI 200C Final, June 4 th, 2009 This exam includes 24 questions. INSTRUCTIONS: Write all answers on the answer sheets supplied; PRINT YOUR NAME and STUDENT ID NUMBER
Lec 02: Estimation & Hypothesis Testing in Animal Ecology
 Lec 02: Estimation & Hypothesis Testing in Animal Ecology Parameter Estimation from Samples Samples We typically observe systems incompletely, i.e., we sample according to a designed protocol. We then
Bayesian Logistic Regression Modelling via Markov Chain Monte Carlo Algorithm
 Journal of Social and Development Sciences Vol. 4, No. 4, pp. 93-97, Apr 203 (ISSN 222-52) Bayesian Logistic Regression Modelling via Markov Chain Monte Carlo Algorithm Henry De-Graft Acquah University
Where does "analysis" enter the experimental process?
 Lecture Topic : ntroduction to the Principles of Experimental Design Experiment: An exercise designed to determine the effects of one or more variables (treatments) on one or more characteristics (response
Part 8 Logistic Regression
 1 Quantitative Methods for Health Research A Practical Interactive Guide to Epidemiology and Statistics Practical Course in Quantitative Data Handling SPSS (Statistical Package for the Social Sciences)
Dr. Kelly Bradley Final Exam Summer {2 points} Name
 {2 points} Name You MUST work alone no tutors; no help from classmates. Email me or see me with questions. You will receive a score of 0 if this rule is violated. This exam is being scored out of 00 points.
Selection and Combination of Markers for Prediction
 Selection and Combination of Markers for Prediction NACC Data and Methods Meeting September, 2010 Baojiang Chen, PhD Sarah Monsell, MS Xiao-Hua Andrew Zhou, PhD Overview 1. Research motivation 2. Describe
Chapter 5: Field experimental designs in agriculture
 Chapter 5: Field experimental designs in agriculture Jose Crossa Biometrics and Statistics Unit Crop Research Informatics Lab (CRIL) CIMMYT. Int. Apdo. Postal 6-641, 06600 Mexico, DF, Mexico Introduction
Unit 1 Exploring and Understanding Data
 Unit 1 Exploring and Understanding Data Area Principle Bar Chart Boxplot Conditional Distribution Dotplot Empirical Rule Five Number Summary Frequency Distribution Frequency Polygon Histogram Interquartile
Name: emergency please discuss this with the exam proctor. 6. Vanderbilt s academic honor code applies.
 Name: Biostatistics 1 st year Comprehensive Examination: Applied in-class exam May 28 th, 2015: 9am to 1pm Instructions: 1. There are seven questions and 12 pages. 2. Read each question carefully. Answer
UNIVERSITY of PENNSYLVANIA CIS 520: Machine Learning Final, Fall 2014
 UNIVERSITY of PENNSYLVANIA CIS 520: Machine Learning Final, Fall 2014 Exam policy: This exam allows two one-page, two-sided cheat sheets (i.e. 4 sides); No other materials. Time: 2 hours. Be sure to write
Research Methods in Forest Sciences: Learning Diary. Yoko Lu December Research process
 Research Methods in Forest Sciences: Learning Diary Yoko Lu 285122 9 December 2016 1. Research process It is important to pursue and apply knowledge and understand the world under both natural and social
Intelligent Systems. Discriminative Learning. Parts marked by * are optional. WS2013/2014 Carsten Rother, Dmitrij Schlesinger
 Intelligent Systems Discriminative Learning Parts marked by * are optional 30/12/2013 WS2013/2014 Carsten Rother, Dmitrij Schlesinger Discriminative models There exists a joint probability distribution
Statistics 2. RCBD Review. Agriculture Innovation Program
 Statistics 2. RCBD Review 2014. Prepared by Lauren Pincus With input from Mark Bell and Richard Plant Agriculture Innovation Program 1 Table of Contents Questions for review... 3 Answers... 3 Materials
Generalized Estimating Equations for Depression Dose Regimes
 Generalized Estimating Equations for Depression Dose Regimes Karen Walker, Walker Consulting LLC, Menifee CA Generalized Estimating Equations on the average produce consistent estimates of the regression
The Practice of Statistics 1 Week 2: Relationships and Data Collection
 The Practice of Statistics 1 Week 2: Relationships and Data Collection Video 12: Data Collection - Experiments Experiments are the gold standard since they allow us to make causal conclusions. example,
THE USE OF NONPARAMETRIC PROPENSITY SCORE ESTIMATION WITH DATA OBTAINED USING A COMPLEX SAMPLING DESIGN
 THE USE OF NONPARAMETRIC PROPENSITY SCORE ESTIMATION WITH DATA OBTAINED USING A COMPLEX SAMPLING DESIGN Ji An & Laura M. Stapleton University of Maryland, College Park May, 2016 WHAT DOES A PROPENSITY
Introduction to Machine Learning. Katherine Heller Deep Learning Summer School 2018
 Introduction to Machine Learning Katherine Heller Deep Learning Summer School 2018 Outline Kinds of machine learning Linear regression Regularization Bayesian methods Logistic Regression Why we do this
STATISTICAL CONCLUSION VALIDITY
 Validity 1 The attached checklist can help when one is evaluating the threats to validity of a study. VALIDITY CHECKLIST Recall that these types are only illustrative. There are many more. INTERNAL VALIDITY
11/18/2013. Correlational Research. Correlational Designs. Why Use a Correlational Design? CORRELATIONAL RESEARCH STUDIES
 Correlational Research Correlational Designs Correlational research is used to describe the relationship between two or more naturally occurring variables. Is age related to political conservativism? Are
9 research designs likely for PSYC 2100
 9 research designs likely for PSYC 2100 1) 1 factor, 2 levels, 1 group (one group gets both treatment levels) related samples t-test (compare means of 2 levels only) 2) 1 factor, 2 levels, 2 groups (one
11/24/2017. Do not imply a cause-and-effect relationship
 Correlational research is used to describe the relationship between two or more naturally occurring variables. Is age related to political conservativism? Are highly extraverted people less afraid of rejection
Why Mixed Effects Models?
 Why Mixed Effects Models? Mixed Effects Models Recap/Intro Three issues with ANOVA Multiple random effects Categorical data Focus on fixed effects What mixed effects models do Random slopes Link functions
MTH 225: Introductory Statistics
 Marshall University College of Science Mathematics Department MTH 225: Introductory Statistics Course catalog description Basic probability, descriptive statistics, fundamental statistical inference procedures
Parameter Estimation of Cognitive Attributes using the Crossed Random- Effects Linear Logistic Test Model with PROC GLIMMIX
 Paper 1766-2014 Parameter Estimation of Cognitive Attributes using the Crossed Random- Effects Linear Logistic Test Model with PROC GLIMMIX ABSTRACT Chunhua Cao, Yan Wang, Yi-Hsin Chen, Isaac Y. Li University
Midterm Exam ANSWERS Categorical Data Analysis, CHL5407H
 Midterm Exam ANSWERS Categorical Data Analysis, CHL5407H 1. Data from a survey of women s attitudes towards mammography are provided in Table 1. Women were classified by their experience with mammography
Exercises: Differential Methylation
 Exercises: Differential Methylation Version 2018-04 Exercises: Differential Methylation 2 Licence This manual is 2014-18, Simon Andrews. This manual is distributed under the creative commons Attribution-Non-Commercial-Share
Research and Evaluation Methodology Program, School of Human Development and Organizational Studies in Education, University of Florida
 Vol. 2 (1), pp. 22-39, Jan, 2015 http://www.ijate.net e-issn: 2148-7456 IJATE A Comparison of Logistic Regression Models for Dif Detection in Polytomous Items: The Effect of Small Sample Sizes and Non-Normality
isc ove ring i Statistics sing SPSS
 isc ove ring i Statistics sing SPSS S E C O N D! E D I T I O N (and sex, drugs and rock V roll) A N D Y F I E L D Publications London o Thousand Oaks New Delhi CONTENTS Preface How To Use This Book Acknowledgements
Testing Statistical Models to Improve Screening of Lung Cancer
 Testing Statistical Models to Improve Screening of Lung Cancer 1 Elliot Burghardt: University of Iowa Daren Kuwaye: University of Hawai i at Mānoa Iowa Summer Institute in Biostatistics - University of
Applied Analysis of Variance and Experimental Design. Lukas Meier, Seminar für Statistik
 Applied Analysis of Variance and Experimental Design Lukas Meier, Seminar für Statistik About Me Studied mathematics at ETH. Worked at the statistical consulting service and did a PhD in statistics (at
Incorporating Infecting Pathogen Counts In Vaccine Trials. Dean Follmann National Institute of Allergy and Infectious Diseases
 Incorporating Infecting Pathogen Counts In Vaccine Trials Dean Follmann National Institute of Allergy and Infectious Diseases Vaccine Trial Randomize at risk healthy volunteers to vaccine or placebo Follow
STATISTICAL METHODS FOR DIAGNOSTIC TESTING: AN ILLUSTRATION USING A NEW METHOD FOR CANCER DETECTION XIN SUN. PhD, Kansas State University, 2012
 STATISTICAL METHODS FOR DIAGNOSTIC TESTING: AN ILLUSTRATION USING A NEW METHOD FOR CANCER DETECTION by XIN SUN PhD, Kansas State University, 2012 A THESIS Submitted in partial fulfillment of the requirements
Poisson regression. Dae-Jin Lee Basque Center for Applied Mathematics.
 Dae-Jin Lee dlee@bcamath.org Basque Center for Applied Mathematics http://idaejin.github.io/bcam-courses/ D.-J. Lee (BCAM) Intro to GLM s with R GitHub: idaejin 1/40 Modeling count data Introduction Response
Chapter 2 Planning Experiments
 Some Standard Designs Page 1 of 9 Chapter 2 Planning Experiments Careful planning of an experiment is crucial for good analysis with required precision. 2.2 A Checklist for Planning Experiments A. Define
A SAS Macro for Adaptive Regression Modeling
 A SAS Macro for Adaptive Regression Modeling George J. Knafl, PhD Professor University of North Carolina at Chapel Hill School of Nursing Supported in part by NIH Grants R01 AI57043 and R03 MH086132 Overview
Logistic regression. Department of Statistics, University of South Carolina. Stat 205: Elementary Statistics for the Biological and Life Sciences
 Logistic regression Department of Statistics, University of South Carolina Stat 205: Elementary Statistics for the Biological and Life Sciences 1 / 1 Logistic regression: pp. 538 542 Consider Y to be binary
CROSS-VALIDATION IN GROUP-BASED LATENT TRAJECTORY MODELING WHEN ASSUMING A CENSORED NORMAL MODEL. Megan M. Marron
 CROSS-VALIDATION IN GROUP-BASED LATENT TRAJECTORY MODELING WHEN ASSUMING A CENSORED NORMAL MODEL by Megan M. Marron B.S., Rochester Institute of Technology, 2011 Submitted to the Graduate Faculty of the
A review of statistical methods in the analysis of data arising from observer reliability studies (Part 11) *
 *") A review of statistical methods in the analysis of data arising from observer reliability studies (Part 11) * by J. RICHARD LANDIS** and GARY G. KOCH** 4 Methods proposed for nominal and ordinal data Many
A review of statistical methods in the analysis of data arising from observer reliability studies (Part 11) * by J. RICHARD LANDIS** and GARY G. KOCH** 4 Methods proposed for nominal and ordinal data Many
Lecture 14: Adjusting for between- and within-cluster covariates in the analysis of clustered data May 14, 2009
 Measurement, Design, and Analytic Techniques in Mental Health and Behavioral Sciences p. 1/3 Measurement, Design, and Analytic Techniques in Mental Health and Behavioral Sciences Lecture 14: Adjusting
IAPT: Regression. Regression analyses
 Regression analyses IAPT: Regression Regression is the rather strange name given to a set of methods for predicting one variable from another. The data shown in Table 1 and come from a student project
A Monte Carlo Simulation Study for Comparing Power of the Most Powerful and Regular Bivariate Normality Tests
 International Journal of Statistics and Applications 014, 4(1): 40-45 DOI: 10.593/j.statistics.0140401.04 A Monte Carlo Simulation Study for Comparing Power of the Most Powerful and Regular Bivariate Normality
The essential focus of an experiment is to show that variance can be produced in a DV by manipulation of an IV.
 EXPERIMENTAL DESIGNS I: Between-Groups Designs There are many experimental designs. We begin this week with the most basic, where there is a single IV and where participants are divided into two or more
Principles of Experimental Design
 Principles of Experimental Design Bret Hanlon and Bret Larget Department of Statistics University of Wisconsin Madison November 15, 2011 Designing Experiments 1 / 31 Experimental Design Many interesting
Principles of Experimental Design
 Principles of Experimental Design Bret Hanlon and Bret Larget Department of Statistics University of Wisconsin Madison November 15, 2011 Designing Experiments 1 / 31 Experimental Design Many interesting
Quantitative Methods in Managment. An introduction to GLMs and measurement theory
 Quantitative Methods in Managment An Introduction to GLMs and measurement theory Graeme D. Hutcheson 1 Luiz Moutinho 2 1 School of Education Manchester university 2 Department of Management Glasgow University
Reproducibility is necessary but insufficient for addressing brain science issues.
 1 Reproducibility is necessary but insufficient for addressing brain science issues. GLM promises nothing but the higher amplitude of the experimental trials on the average compared with the control trials.
Reliability of Ordination Analyses
 Reliability of Ordination Analyses Objectives: Discuss Reliability Define Consistency and Accuracy Discuss Validation Methods Opening Thoughts Inference Space: What is it? Inference space can be defined
MS&E 226: Small Data
 MS&E 226: Small Data Lecture 10: Introduction to inference (v2) Ramesh Johari ramesh.johari@stanford.edu 1 / 17 What is inference? 2 / 17 Where did our data come from? Recall our sample is: Y, the vector
Certificate Courses in Biostatistics
 Certificate Courses in Biostatistics Term I : September December 2015 Term II : Term III : January March 2016 April June 2016 Course Code Module Unit Term BIOS5001 Introduction to Biostatistics 3 I BIOS5005
VALIDITY OF QUANTITATIVE RESEARCH
 Validity 1 VALIDITY OF QUANTITATIVE RESEARCH Recall the basic aim of science is to explain natural phenomena. Such explanations are called theories (Kerlinger, 1986, p. 8). Theories have varying degrees
Chapter 1: Exploring Data
 Chapter 1: Exploring Data Key Vocabulary:! individual! variable! frequency table! relative frequency table! distribution! pie chart! bar graph! two-way table! marginal distributions! conditional distributions!
Index. Springer International Publishing Switzerland 2017 T.J. Cleophas, A.H. Zwinderman, Modern Meta-Analysis, DOI /
 Index A Adjusted Heterogeneity without Overdispersion, 63 Agenda-driven bias, 40 Agenda-Driven Meta-Analyses, 306 307 Alternative Methods for diagnostic meta-analyses, 133 Antihypertensive effect of potassium,
Modelling Research Productivity Using a Generalization of the Ordered Logistic Regression Model
 Modelling Research Productivity Using a Generalization of the Ordered Logistic Regression Model Delia North Temesgen Zewotir Michael Murray Abstract In South Africa, the Department of Education allocates
Syntax Menu Description Options Remarks and examples Stored results Methods and formulas References Also see
 Title stata.com teffects ra Regression adjustment Syntax Syntax Menu Description Options Remarks and examples Stored results Methods and formulas References Also see teffects ra (ovar omvarlist [, omodel
Designing Experiments... Or how many times and ways can I screw that up?!?
 www.geo.uzh.ch/microsite/icacogvis/ Designing Experiments... Or how many times and ways can I screw that up?!? Amy L. Griffin AutoCarto 2012, Columbus, OH Outline When do I need to run an experiment and
Clincial Biostatistics. Regression
 Regression analyses Clincial Biostatistics Regression Regression is the rather strange name given to a set of methods for predicting one variable from another. The data shown in Table 1 and come from a
Modeling Binary outcome
 Statistics April 4, 2013 Debdeep Pati Modeling Binary outcome Test of hypothesis 1. Is the effect observed statistically significant or attributable to chance? 2. Three types of hypothesis: a) tests of
Modeling unobserved heterogeneity in Stata
 Modeling unobserved heterogeneity in Stata Rafal Raciborski StataCorp LLC November 27, 2017 Rafal Raciborski (StataCorp) Modeling unobserved heterogeneity November 27, 2017 1 / 59 Plan of the talk Concepts
Glossary From Running Randomized Evaluations: A Practical Guide, by Rachel Glennerster and Kudzai Takavarasha
 Glossary From Running Randomized Evaluations: A Practical Guide, by Rachel Glennerster and Kudzai Takavarasha attrition: When data are missing because we are unable to measure the outcomes of some of the
Biostatistics for Med Students. Lecture 1
 Biostatistics for Med Students Lecture 1 John J. Chen, Ph.D. Professor & Director of Biostatistics Core UH JABSOM JABSOM MD7 February 14, 2018 Lecture note: http://biostat.jabsom.hawaii.edu/education/training.html
UNIVERSITY of PENNSYLVANIA CIS 520: Machine Learning Midterm, 2016
 UNIVERSITY of PENNSYLVANIA CIS 520: Machine Learning Midterm, 2016 Exam policy: This exam allows one one-page, two-sided cheat sheet; No other materials. Time: 80 minutes. Be sure to write your name and
Causal Research Design- Experimentation
 In a social science (such as marketing) it is very important to understand that effects (e.g., consumers responding favorably to a new buzz marketing campaign) are caused by multiple variables. The relationships
What you should know before you collect data. BAE 815 (Fall 2017) Dr. Zifei Liu
 Dr. Zifei Liu") What you should know before you collect data BAE 815 (Fall 2017) Dr. Zifei Liu Zifeiliu@ksu.edu Types and levels of study Descriptive statistics Inferential statistics How to choose a statistical test
What you should know before you collect data BAE 815 (Fall 2017) Dr. Zifei Liu Zifeiliu@ksu.edu Types and levels of study Descriptive statistics Inferential statistics How to choose a statistical test
Study Guide #2: MULTIPLE REGRESSION in education
 Study Guide #2: MULTIPLE REGRESSION in education What is Multiple Regression? When using Multiple Regression in education, researchers use the term independent variables to identify those variables that
Package inctools. January 3, 2018
 Encoding UTF-8 Type Package Title Incidence Estimation Tools Version 1.0.11 Date 2018-01-03 Package inctools January 3, 2018 Tools for estimating incidence from biomarker data in crosssectional surveys,
Estimating drug effects in the presence of placebo response: Causal inference using growth mixture modeling
 STATISTICS IN MEDICINE Statist. Med. 2009; 28:3363 3385 Published online 3 September 2009 in Wiley InterScience (www.interscience.wiley.com).3721 Estimating drug effects in the presence of placebo response:
Logistic Regression Predicting the Chances of Coronary Heart Disease. Multivariate Solutions
 Logistic Regression Predicting the Chances of Coronary Heart Disease Multivariate Solutions What is Logistic Regression? Logistic regression in a nutshell: Logistic regression is used for prediction of
CLASSICAL AND. MODERN REGRESSION WITH APPLICATIONS
 - CLASSICAL AND. MODERN REGRESSION WITH APPLICATIONS SECOND EDITION Raymond H. Myers Virginia Polytechnic Institute and State university 1 ~l~~l~l~~~~~~~l!~ ~~~~~l~/ll~~ Donated by Duxbury o Thomson Learning,,
Intro to SPSS. Using SPSS through WebFAS
 Intro to SPSS Using SPSS through WebFAS http://www.yorku.ca/computing/students/labs/webfas/ Try it early (make sure it works from your computer) If you need help contact UIT Client Services Voice: 416-736-5800
Package speff2trial. February 20, 2015
 Version 1.0.4 Date 2012-10-30 Package speff2trial February 20, 2015 Title Semiparametric efficient estimation for a two-sample treatment effect Author Michal Juraska , with contributions
Sawtooth Software. The Number of Levels Effect in Conjoint: Where Does It Come From and Can It Be Eliminated? RESEARCH PAPER SERIES
 Sawtooth Software RESEARCH PAPER SERIES The Number of Levels Effect in Conjoint: Where Does It Come From and Can It Be Eliminated? Dick Wittink, Yale University Joel Huber, Duke University Peter Zandan,
Chapter 2 Organizing and Summarizing Data. Chapter 3 Numerically Summarizing Data. Chapter 4 Describing the Relation between Two Variables
 Tables and Formulas for Sullivan, Fundamentals of Statistics, 4e 014 Pearson Education, Inc. Chapter Organizing and Summarizing Data Relative frequency = frequency sum of all frequencies Class midpoint:
Structural Equation Modeling (SEM)
") Structural Equation Modeling (SEM) Today s topics The Big Picture of SEM What to do (and what NOT to do) when SEM breaks for you Single indicator (ASU) models Parceling indicators Using single factor scores
Structural Equation Modeling (SEM) Today s topics The Big Picture of SEM What to do (and what NOT to do) when SEM breaks for you Single indicator (ASU) models Parceling indicators Using single factor scores
ANCOVA with Regression Homogeneity
 ANCOVA with Regression Homogeneity The purpose of the study was to compare the effectiveness of two different treatments in two populations. Both treatments have been repeatedly shown to work better than
Methodology for Non-Randomized Clinical Trials: Propensity Score Analysis Dan Conroy, Ph.D., inventiv Health, Burlington, MA
 PharmaSUG 2014 - Paper SP08 Methodology for Non-Randomized Clinical Trials: Propensity Score Analysis Dan Conroy, Ph.D., inventiv Health, Burlington, MA ABSTRACT Randomized clinical trials serve as the