Objective: To describe a new approach to neighborhood effects studies based on residential mobility and demonstrate this approach in the context of
|
|
|
- Deborah Davis
- 6 years ago
- Views:
Transcription
1 Objective: To describe a new approach to neighborhood effects studies based on residential mobility and demonstrate this approach in the context of neighborhood deprivation and preterm birth. Key Points: Associations between neighborhood characteristics and health outcomes are confounded by selection factors. The standard single time-point design often does not adequately control this confounding. A residential-mobility based approach which draws comparisons between individuals who share a baseline neighborhood can control for some of the confounding by selection factors. This approach has been demonstrated by our study of neighborhood deprivation and preterm birth. 1

2 Motivation for a new study design: These two maps show the 10-county Atlanta, GA metropolitan area. On the right are quintiles of neighborhood deprivation as measured by the Neighborhood Deprivation Index applied to census tracts. On the left are quintiles of preterm birth rates by census tract. At a glance, we can see similarities between the two patterns with overlap between high deprivation and high preterm birth rate tracts as well as between low deprivation and low preterm birth rate. 2

3 Motivation for a new study design: Quantifying the pattern observed on the previous slide, we see there are significant differences between preterm birth rates within different quintiles of neighborhood deprivation. In the high deprivation quintile the rate of preterm birth is nearly twice the rate in the low deprivation quintile. However, we would like to examine the causal association, implying that our conclusions must reach the individual level. Based only on this data, individual level inferences would be an ecological fallacy. The direction the field has taken has been to use hierarchical or multilevel regression. This strategy contrasts preterm birth outcomes between individuals living in high deprivation neighborhoods and those in low deprivation neighborhoods while controlling for individual-level differences between people. These studies have fairly consistently found an association, with odds ratios in the range from 1.1 to 1.7. However, there has been considerable discussion in the literature on the barriers to causal inference when using this study design and analytic strategy. (see reference slide) 3
4 Motivation for a new study design: One of the barriers to causal inference is the high potential for confounding by selection factors. Selection factors are the factors based on which individuals are selected into different neighborhood types. When selection factors are also associated with the health outcome, in this case preterm birth, they confound the association between the neighborhood characteristic and health outcome. 4
5 Motivation for a new study design: Three types of confounding by selection factors are particularly problematic for neighborhood effects studies. Residual Confounding: Occurs when a selection factor is crudely measured, such as using education as the sole measure of socioeconomic status (SES). Particularly problematic due to the strength of SES as a selection factor and the level of detail available in population health data such as birth records. Unmeasured Confounding: Particularly problematic because of lack of research and knowledge on selection factors and lack of measurement of selection factors in population health data. Structural Confounding: Occurs when there is lack of overlap in individual factors between neighborhood types. Statistical control of confounding relies on comparing individuals with the similar selection factors between neighborhood types. When there is near complete separation of individual selection factors between neighborhood types statistical control is not possible. Common structural confounders are race and SES. 5
6 Motivation for a new study design: Returning to the DAG, the benefit of a residential mobility based approach can be demonstrated. Some of the influence of selection factors on the follow-up neighborhood operate through the baseline neighborhood. If we control for the baseline neighborhood, we can indirectly control for some of the confounding by selection factors. If we draw comparisons only between individuals who share a baseline neighborhood, and hence are more likely to have similar selection factors than individuals never sharing a neighborhood, we can substantially reduce the potential for confounding bias. 6
7 Motivation for a new study design: The difference between the two designs can be further demonstrated by examining their counterfactual assumptions. The single time-point design assumes a degree of exchangeability between individuals living in different neighborhood types. 7
8 Motivation for a new study design: The difference between the two designs can be further demonstrated by examining their counterfactual assumptions. The residential mobility based design assumes exchangeability between individuals who were once neighbors. Individuals who move out of the neighborhood to different neighborhood types are compared to those who stay. 8
9 Neighborhood Deprivation was estimated using the Neighborhood Deprivation Index (NDI) which uses census measures in five domains: occupation, poverty, housing, employment and education. A year-specific estimate of NDI was calculated through linear interpolation between 1990 and 2000 U.S. census as well as the American Community Survey. The outcome, preterm birth at the 2 nd birth, was measured as <37 completed weeks of gestation as reported on the birth record. 9
10 Exposures were defined through a matrix of residential mobility and change in NDI between baseline and follow-up births. Residential mobility was defined as a change in Census tract between baseline and follow-up (binary). Change in deprivation was assessed by the difference between NDI at baseline and follow-up, categorized into quintiles. Those with the greatest decrease in deprivation had high upward mobility. Those with the greatest increase in deprivation had high downward mobility. Those with third quintile change in deprivation had relatively no change in deprivation, moving laterally. Stayers, those who did not change census tracts, are unexposed. 10
11
12 Analysis Type: Fixed-Intercepts Multi-Level Logistic Regression Comparisons are between exposure trajectories within baseline tracts. Including the intercept estimate for each tract allows the coefficients for each exposure trajectory to be the average within-tract association across all tracts. A primary difference between this design and the single time-point design is that our exposures are within-neighborhood rather than betweenneighborhood. 12
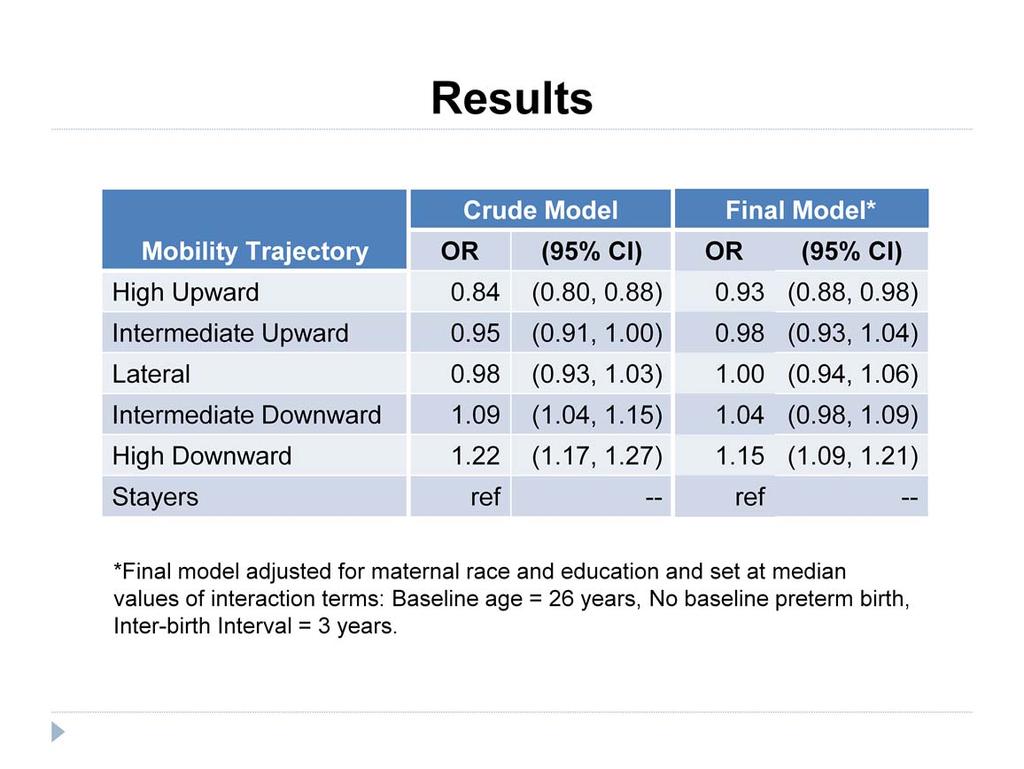
13 13
14 General Conclusions: Averaged across all baseline neighborhoods, those who move to less deprived neighborhoods have slightly decreased risk of preterm birth relative to those who do not move. Those who move to more deprived neighborhoods have slightly increased risk. If living in a deprived neighborhood is associated with increased preterm birth risk relative to living a non-deprived neighborhood, then we would expect that moving to a more deprived neighborhood would be associated with an increase in risk. Odds ratios from this approach are not directly comparable to odds ratios found in the single time-point approach.
15 DAG showed remaining potential for confounding by selection factors. Residual Confounding: Modelling process showed maternal education to be a confounder, which likely indicates broader SES is a confounder that is only partially controlled by adjustment for education. Unmeasured Confounding: Factors that influence mobility but not baseline neighborhood are not controlled for. For example, an increase in income between baseline and follow-up could be associated both with upward mobility and preterm birth risk and would not be controlled for through conditioning on baseline neighborhood. Pre-baseline deprivation exposures could confound the association. If living in a more deprived neighborhood before baseline is associated both with downward mobility and increased preterm birth risk, it could confound the association. 15
16 By drawing comparisons within baseline neighborhoods, we control for much of the confounding due to selection factors that differ between individuals living in different neighborhood types. The exposures could potentially be randomized in an experimental framework, which has been seen as a challenge to causal inference in single time-point designs. 16
17 17
18 18
19 19
20 A peer-reviewed publication is in process. A copy of the full-length thesis is available upon request. 20
Treatment disparities for patients diagnosed with metastatic bladder cancer in California
 Treatment disparities for patients diagnosed with metastatic bladder cancer in California Rosemary D. Cress, Dr. PH, Amy Klapheke, MPH Public Health Institute Cancer Registry of Greater California Introduction
Donna L. Coffman Joint Prevention Methodology Seminar
 Donna L. Coffman Joint Prevention Methodology Seminar The purpose of this talk is to illustrate how to obtain propensity scores in multilevel data and use these to strengthen causal inferences about mediation.
Parental age and autism: Population data from NJ
 Parental age and autism: Population data from NJ Introduction While the cause of autism is not known, current research suggests that a combination of genetic and environmental factors may be involved.
1.4 - Linear Regression and MS Excel
 1.4 - Linear Regression and MS Excel Regression is an analytic technique for determining the relationship between a dependent variable and an independent variable. When the two variables have a linear
Multiple Mediation Analysis For General Models -with Application to Explore Racial Disparity in Breast Cancer Survival Analysis
 Multiple For General Models -with Application to Explore Racial Disparity in Breast Cancer Survival Qingzhao Yu Joint Work with Ms. Ying Fan and Dr. Xiaocheng Wu Louisiana Tumor Registry, LSUHSC June 5th,
Appendix Identification of Study Cohorts
 Appendix Identification of Study Cohorts Because the models were run with the 2010 SAS Packs from Centers for Medicare and Medicaid Services (CMS)/Yale, the eligibility criteria described in "2010 Measures
Sensitivity Analysis in Observational Research: Introducing the E-value
 Sensitivity Analysis in Observational Research: Introducing the E-value Tyler J. VanderWeele Harvard T.H. Chan School of Public Health Departments of Epidemiology and Biostatistics 1 Plan of Presentation
George B. Ploubidis. The role of sensitivity analysis in the estimation of causal pathways from observational data. Improving health worldwide
 George B. Ploubidis The role of sensitivity analysis in the estimation of causal pathways from observational data Improving health worldwide www.lshtm.ac.uk Outline Sensitivity analysis Causal Mediation
i EVALUATING THE EFFECTIVENESS OF THE TAKE CONTROL PHILLY CONDOM MAILING DISTRIBUTION PROGRAM by Alexis Adams June 2014
 i EVALUATING THE EFFECTIVENESS OF THE TAKE CONTROL PHILLY CONDOM MAILING DISTRIBUTION PROGRAM by Alexis Adams June 2014 A Community Based Master s Project presented to the faculty of Drexel University
Using directed acyclic graphs to guide analyses of neighbourhood health effects: an introduction
 University of Michigan, Ann Arbor, Michigan, USA Correspondence to: Dr A V Diez Roux, Center for Social Epidemiology and Population Health, 3rd Floor SPH Tower, 109 Observatory St, Ann Arbor, MI 48109-2029,
What is Multilevel Modelling Vs Fixed Effects. Will Cook Social Statistics
 What is Multilevel Modelling Vs Fixed Effects Will Cook Social Statistics Intro Multilevel models are commonly employed in the social sciences with data that is hierarchically structured Estimated effects
I. Identifying the question Define Research Hypothesis and Questions
 Term Paper I. Identifying the question What is the question? (What are my hypotheses?) Is it possible to answer the question with statistics? Is the data obtainable? (birth weight, socio economic, drugs,
Epidemiologic Methods I & II Epidem 201AB Winter & Spring 2002
 DETAILED COURSE OUTLINE Epidemiologic Methods I & II Epidem 201AB Winter & Spring 2002 Hal Morgenstern, Ph.D. Department of Epidemiology UCLA School of Public Health Page 1 I. THE NATURE OF EPIDEMIOLOGIC
Is there an association between waist circumference and type 2 diabetes or impaired fasting glucose in US adolescents?
 Is there an association between waist circumference and type 2 diabetes or impaired fasting glucose in US adolescents? Meghann M. Moore, RD, CD Masters Thesis Maternal & Child Health Track School of Public
observational studies Descriptive studies
 form one stage within this broader sequence, which begins with laboratory studies using animal models, thence to human testing: Phase I: The new drug or treatment is tested in a small group of people for
Statistical Reasoning in Public Health Biostatistics 612, 2009, HW#3
 Statistical Reasoning in Public Health Biostatistics 612, 2009, HW#3 1. A random sample of 200 patients admitted to an adult intensive care unit (ICU) was collected to examine factors associated with death
NORTH SOUTH UNIVERSITY TUTORIAL 2
 NORTH SOUTH UNIVERSITY TUTORIAL 2 AHMED HOSSAIN,PhD Data Management and Analysis AHMED HOSSAIN,PhD - Data Management and Analysis 1 Correlation Analysis INTRODUCTION In correlation analysis, we estimate
MS&E 226: Small Data
 MS&E 226: Small Data Lecture 10: Introduction to inference (v2) Ramesh Johari ramesh.johari@stanford.edu 1 / 17 What is inference? 2 / 17 Where did our data come from? Recall our sample is: Y, the vector
Okayama University, Japan
 Directed acyclic graphs in Neighborhood and Health research (Social Epidemiology) Basile Chaix Inserm, France Etsuji Suzuki Okayama University, Japan Inference in n hood & health research N hood (neighborhood)
An informal analysis of multilevel variance
 APPENDIX 11A An informal analysis of multilevel Imagine we are studying the blood pressure of a number of individuals (level 1) from different neighbourhoods (level 2) in the same city. We start by doing
Data Analysis in Practice-Based Research. Stephen Zyzanski, PhD Department of Family Medicine Case Western Reserve University School of Medicine
 Data Analysis in Practice-Based Research Stephen Zyzanski, PhD Department of Family Medicine Case Western Reserve University School of Medicine Multilevel Data Statistical analyses that fail to recognize
Assessing the impact of unmeasured confounding: confounding functions for causal inference
 Assessing the impact of unmeasured confounding: confounding functions for causal inference Jessica Kasza jessica.kasza@monash.edu Department of Epidemiology and Preventive Medicine, Monash University Victorian
Investigating the Effects of Racial Residential Segregation, Area-level Socioeconomic Status and Physician Composition on Colorectal Cancer Screening
 Virginia Commonwealth University VCU Scholars Compass Theses and Dissertations Graduate School 2016 Investigating the Effects of Racial Residential Segregation, Area-level Socioeconomic Status and Physician
Neighbourhood deprivation and smoking outcomes in South Africa
 Neighbourhood deprivation and smoking outcomes in South Africa Lisa Lau, MPH. Department of Epidemiology, School of Public Health, University of Michigan.! Jamie Tam, MPH. Department of Health Management
Ecological Statistics
 A Primer of Ecological Statistics Second Edition Nicholas J. Gotelli University of Vermont Aaron M. Ellison Harvard Forest Sinauer Associates, Inc. Publishers Sunderland, Massachusetts U.S.A. Brief Contents
EPI 200C Final, June 4 th, 2009 This exam includes 24 questions.
 Greenland/Arah, Epi 200C Sp 2000 1 of 6 EPI 200C Final, June 4 th, 2009 This exam includes 24 questions. INSTRUCTIONS: Write all answers on the answer sheets supplied; PRINT YOUR NAME and STUDENT ID NUMBER
Multi-level approaches to understanding and preventing obesity: analytical challenges and new directions
 Multi-level approaches to understanding and preventing obesity: analytical challenges and new directions Ana V. Diez Roux MD PhD Center for Integrative Approaches to Health Disparities University of Michigan
Bayesian methods for combining multiple Individual and Aggregate data Sources in observational studies
 Bayesian methods for combining multiple Individual and Aggregate data Sources in observational studies Sara Geneletti Department of Epidemiology and Public Health Imperial College, London s.geneletti@imperial.ac.uk
Causal Inference in Observational Settings
 The University of Auckland New Zealand Causal Inference in Observational Settings 7 th Wellington Colloquium Statistics NZ 30 August 2013 Professor Peter Davis University of Auckland, New Zealand and COMPASS
Introduction to Multilevel Models for Longitudinal and Repeated Measures Data
 Introduction to Multilevel Models for Longitudinal and Repeated Measures Data Today s Class: Features of longitudinal data Features of longitudinal models What can MLM do for you? What to expect in this
CDRI Cancer Disparities Geocoding Project. November 29, 2006 Chris Johnson, CDRI
 CDRI Cancer Disparities Geocoding Project November 29, 2006 Chris Johnson, CDRI cjohnson@teamiha.org CDRI Cancer Disparities Geocoding Project Purpose: To describe and understand variations in cancer incidence,
Propensity scores: what, why and why not?
 Propensity scores: what, why and why not? Rhian Daniel, Cardiff University @statnav Joint workshop S3RI & Wessex Institute University of Southampton, 22nd March 2018 Rhian Daniel @statnav/propensity scores:
Pre-Conception & Pregnancy in Ohio
 Pre-Conception & Pregnancy in Ohio Elizabeth Conrey, PhD 1 January 217 1 State Maternal and Child Health Epidemiologist, Ohio Department of Health EXECUTIVE SUMMARY The primary objective of the analyses
Propensity Score Methods for Estimating Causality in the Absence of Random Assignment: Applications for Child Care Policy Research
 2012 CCPRC Meeting Methodology Presession Workshop October 23, 2012, 2:00-5:00 p.m. Propensity Score Methods for Estimating Causality in the Absence of Random Assignment: Applications for Child Care Policy
The Effect of Patient Neighbourhood Income Level on the Purchase of Continuous Positive Airway
 Online Data Supplement The Effect of Patient Neighbourhood Income Level on the Purchase of Continuous Positive Airway Pressure Treatment among Sleep Apnea Patients Tetyana Kendzerska, MD, PhD, Andrea S.
Ethnicity and Maternal Health Care Utilization in Nigeria: the Role of Diversity and Homogeneity
 Ethnicity and Maternal Health Care Utilization in Nigeria: the Role of Diversity and Homogeneity In spite of the significant improvements in the health of women worldwide, maternal mortality ratio has
Methods for Addressing Selection Bias in Observational Studies
 Methods for Addressing Selection Bias in Observational Studies Susan L. Ettner, Ph.D. Professor Division of General Internal Medicine and Health Services Research, UCLA What is Selection Bias? In the regression
Welcome Module Index Glossary Epiville Chamber of Commerce About this site Requirements. Faculty Highlight: Pam R. Factor-Litvak, PhD
 - Page 23 45 67 - Discussion Question While many consider the ecological study design methodologically inferior to the cohort and case control designs, this exercise will highlight some of its unique strengths
Data Sources & Issues for Health Inequalities Research. J. Dunn
 Data Sources & Issues for Health Inequalities Research J. Dunn Background & Introduction major challenge to find secondary data sources that are compatible with research questions in many instances, data
New York State Department of Health Center for Environmental Health
 New York State Department of Health Center for Environmental Health March 2002 Evaluation of Asthma and Other Respiratory Hospital Admissions among Residents of ZIP Codes 14043 and 14227, Cheektowaga,
EVect of measurement error on epidemiological studies of environmental and occupational
 Occup Environ Med 1998;55:651 656 651 METHODOLOGY Series editors: T C Aw, A Cockcroft, R McNamee Correspondence to: Dr Ben G Armstrong, Environmental Epidemiology Unit, London School of Hygiene and Tropical
Causal mediation analysis of observational, population-based cancer survival data
 Causal mediation analysis of observational, population-based cancer survival data Bernard Rachet & Ruoran Li Cancer Survival Group, Faculty of Epidemiology and Population Health, LSHTM Twitter: @CSG_LSHTM
Socioeconomic Vulnerabilities and Disparities in Preterm Birth Rates: Analysis of Mississippi Counties POPULATION BRIEF
 POPULATION BRIEF The University of Mississippi Center for Population Studies & State Data Center of Mississippi Socioeconomic Vulnerabilities and Disparities in Preterm Birth Rates: Analysis of Mississippi
Ec331: Research in Applied Economics Spring term, Panel Data: brief outlines
 Ec331: Research in Applied Economics Spring term, 2014 Panel Data: brief outlines Remaining structure Final Presentations (5%) Fridays, 9-10 in H3.45. 15 mins, 8 slides maximum Wk.6 Labour Supply - Wilfred
Epidemiology: Overview of Key Concepts and Study Design. Polly Marchbanks
 Epidemiology: Overview of Key Concepts and Study Design Polly Marchbanks Lecture Outline (1) Key epidemiologic concepts - Definition - What epi is not - What epi is - Process of epi research Lecture Outline
Lecture II: Difference in Difference. Causality is difficult to Show from cross
 Review Lecture II: Regression Discontinuity and Difference in Difference From Lecture I Causality is difficult to Show from cross sectional observational studies What caused what? X caused Y, Y caused
Causal Mediation Analysis with the CAUSALMED Procedure
 Paper SAS1991-2018 Causal Mediation Analysis with the CAUSALMED Procedure Yiu-Fai Yung, Michael Lamm, and Wei Zhang, SAS Institute Inc. Abstract Important policy and health care decisions often depend
Behind the Cascade: Analyzing Spatial Patterns Along the HIV Care Continuum
 Behind the Cascade: Analyzing Spatial Patterns Along the HIV Care Continuum Kathleen Brady 1,2, M. Eberhart 1, A. Hillier 2, C. Voytek 2, M. Blank 2, I. Frank 2, D. Metzger, 2 B. Yehia 2 1 Philadelphia
Anssi Auvinen University of Tampere STUK Radiation and Nuclear Safety Authority International Agency for Research on Cancer
 Sources of uncertainty in epidemiological studies Anssi Auvinen University of Tampere STUK Radiation and Nuclear Safety Authority International Agency for Research on Cancer Error and bias Concepts not
Social determinants, health and healthcare outcomes 2017 Intermountain Healthcare Annual Research Meeting
 Social determinants, health and healthcare outcomes 2017 Intermountain Healthcare Annual Research Meeting Andrew J Knighton PHD CPA Intermountain Institute for Healthcare Delivery Research Adversity is
Summary. Mental health and urbanization
 Summary Mental health and urbanization An investigation of urban-rural and inner-city differences in psychiatric morbidity Introduction The primary focus of this thesis is the examination of the differences
Department of Epidemiology and Population Health
 401 Department of Epidemiology and Population Health Chairperson: Professors: Professor of Public Health Practice: Assistant Professors: Assistant Research Professors: Senior Lecturer: Instructor: Chaaya,
You must answer question 1.
 Research Methods and Statistics Specialty Area Exam October 28, 2015 Part I: Statistics Committee: Richard Williams (Chair), Elizabeth McClintock, Sarah Mustillo You must answer question 1. 1. Suppose
Extended Case Study of Causal Learning within Architecture Research (preliminary results)
") Extended Case Study of Causal Learning within Architecture Research (preliminary results) Robert Stoddard, SEI Mike Konrad, SEI Rick Kazman, SEI David Danks, CMU Software Engineering Institute Carnegie
Extended Case Study of Causal Learning within Architecture Research (preliminary results) Robert Stoddard, SEI Mike Konrad, SEI Rick Kazman, SEI David Danks, CMU Software Engineering Institute Carnegie
On the use of the outcome variable small for gestational age when gestational age is a potential mediator: a maternal asthma perspective
 Lefebvre and Samoilenko BMC Medical Research Methodology (2017) 17:165 DOI 10.1186/s12874-017-0444-z RESEARCH ARTICLE Open Access On the use of the outcome variable small for gestational age when gestational
Citation for published version (APA): Ebbes, P. (2004). Latent instrumental variables: a new approach to solve for endogeneity s.n.
: Ebbes, P. (2004). Latent instrumental variables: a new approach to solve for endogeneity s.n.") University of Groningen Latent instrumental variables Ebbes, P. IMPORTANT NOTE: You are advised to consult the publisher's version (publisher's PDF) if you wish to cite from it. Please check the document
University of Groningen Latent instrumental variables Ebbes, P. IMPORTANT NOTE: You are advised to consult the publisher's version (publisher's PDF) if you wish to cite from it. Please check the document
Introduction to Multilevel Models for Longitudinal and Repeated Measures Data
 Introduction to Multilevel Models for Longitudinal and Repeated Measures Data Today s Class: Features of longitudinal data Features of longitudinal models What can MLM do for you? What to expect in this
MULTIPLE OLS REGRESSION RESEARCH QUESTION ONE:
 1 MULTIPLE OLS REGRESSION RESEARCH QUESTION ONE: Predicting State Rates of Robbery per 100K We know that robbery rates vary significantly from state-to-state in the United States. In any given state, we
10. Introduction to Multivariate Relationships
 10. Introduction to Multivariate Relationships Bivariate analyses are informative, but we usually need to take into account many variables. Many explanatory variables have an influence on any particular
Data Analysis Using Regression and Multilevel/Hierarchical Models
 Data Analysis Using Regression and Multilevel/Hierarchical Models ANDREW GELMAN Columbia University JENNIFER HILL Columbia University CAMBRIDGE UNIVERSITY PRESS Contents List of examples V a 9 e xv " Preface
Estimating Heterogeneous Choice Models with Stata
 Estimating Heterogeneous Choice Models with Stata Richard Williams Notre Dame Sociology rwilliam@nd.edu West Coast Stata Users Group Meetings October 25, 2007 Overview When a binary or ordinal regression
Bayesian graphical models for combining multiple data sources, with applications in environmental epidemiology
 Bayesian graphical models for combining multiple data sources, with applications in environmental epidemiology Sylvia Richardson 1 sylvia.richardson@imperial.co.uk Joint work with: Alexina Mason 1, Lawrence
Recinda L. Sherman, CTR Florida Cancer Data System
 Relationship of Community Level Socioeconomic Status and Stage at Diagnosis of Colorectal Cancer in Florida Recinda L. Sherman, CTR Florida Cancer Data System 1 Colorectal Cancer Common cancer in industrialized
A Bayesian Perspective on Unmeasured Confounding in Large Administrative Databases
 A Bayesian Perspective on Unmeasured Confounding in Large Administrative Databases Lawrence McCandless lmccandl@sfu.ca Faculty of Health Sciences, Simon Fraser University, Vancouver Canada Summer 2014
OHDSI Tutorial: Design and implementation of a comparative cohort study in observational healthcare data
 OHDSI Tutorial: Design and implementation of a comparative cohort study in observational healthcare data Faculty: Martijn Schuemie (Janssen Research and Development) Marc Suchard (UCLA) Patrick Ryan (Janssen
Measuring Impact. Program and Policy Evaluation with Observational Data. Daniel L. Millimet. Southern Methodist University.
 Measuring mpact Program and Policy Evaluation with Observational Data Daniel L. Millimet Southern Methodist University 23 May 2013 DL Millimet (SMU) Observational Data May 2013 1 / 23 ntroduction Measuring
Supplementary Online Content
 Supplementary Online Content Sun LS, Li G, Miller TLK, et al. Association between a single general anesthesia exposure before age 36 months and neurocognitive outcomes in later childhood. JAMA. doi:10.1001/jama.2016.6967
Data and Statistics 101: Key Concepts in the Collection, Analysis, and Application of Child Welfare Data
 TECHNICAL REPORT Data and Statistics 101: Key Concepts in the Collection, Analysis, and Application of Child Welfare Data CONTENTS Executive Summary...1 Introduction...2 Overview of Data Analysis Concepts...2
Subjective and Objective Neighborhood Characteristics and Adult Health
 Subjective and Objective Neighborhood Characteristics and Adult Health Margaret M. Weden, Ph.D. 1, Richard M. Carpiano, Ph.D. 2, Stephanie A. Robert, Ph.D. 3,4 1. RAND, Santa Monica, CA USA 2. Department
Comparison And Application Of Methods To Address Confounding By Indication In Non- Randomized Clinical Studies
 University of Massachusetts Amherst ScholarWorks@UMass Amherst Masters Theses 1911 - February 2014 Dissertations and Theses 2013 Comparison And Application Of Methods To Address Confounding By Indication
Assessing Studies Based on Multiple Regression. Chapter 7. Michael Ash CPPA
 Assessing Studies Based on Multiple Regression Chapter 7 Michael Ash CPPA Assessing Regression Studies p.1/20 Course notes Last time External Validity Internal Validity Omitted Variable Bias Misspecified
Causal Association : Cause To Effect. Dr. Akhilesh Bhargava MD, DHA, PGDHRM Prof. Community Medicine & Director-SIHFW, Jaipur
 Causal Association : Cause To Effect Dr. MD, DHA, PGDHRM Prof. Community Medicine & Director-SIHFW, Jaipur Measure of Association- Concepts If more disease occurs in a group that smokes compared to the
Design and Analysis Plan Quantitative Synthesis of Federally-Funded Teen Pregnancy Prevention Programs HHS Contract #HHSP I 5/2/2016
 Design and Analysis Plan Quantitative Synthesis of Federally-Funded Teen Pregnancy Prevention Programs HHS Contract #HHSP233201500069I 5/2/2016 Overview The goal of the meta-analysis is to assess the effects
Addressing Inadequate Information on Important Health Factors in Pharmacoepidemiology Studies relying on Healthcare Databases
 Addressing Inadequate Information on Important Health Factors in Pharmacoepidemiology Studies relying on Healthcare Databases Efe Eworuke, Ph.D. Simone P. Pinheiro, Sc.D. M.Sc. Division of Epidemiology
Quantitative Methods. Lonnie Berger. Research Training Policy Practice
 Quantitative Methods Lonnie Berger Research Training Policy Practice Defining Quantitative and Qualitative Research Quantitative methods: systematic empirical investigation of observable phenomena via
Generalized Linear Models and Logistic Regression
 Generalized Linear Models and Logistic Regression Author: Nicholas G Reich, OpenIntro This material is part of the statsteachr project Made available under the Creative Commons Attribution-ShareAlike 3.0
8/10/2012. Education level and diabetes risk: The EPIC-InterAct study AIM. Background. Case-cohort design. Int J Epidemiol 2012 (in press)
") Education level and diabetes risk: The EPIC-InterAct study 50 authors from European countries Int J Epidemiol 2012 (in press) Background Type 2 diabetes mellitus (T2DM) is one of the most common chronic
Education level and diabetes risk: The EPIC-InterAct study 50 authors from European countries Int J Epidemiol 2012 (in press) Background Type 2 diabetes mellitus (T2DM) is one of the most common chronic
Study Guide #2: MULTIPLE REGRESSION in education
 Study Guide #2: MULTIPLE REGRESSION in education What is Multiple Regression? When using Multiple Regression in education, researchers use the term independent variables to identify those variables that
TEACHERS TOPICS. The Role of Matching in Epidemiologic Studies. American Journal of Pharmaceutical Education 2004; 68 (3) Article 83.
 Article 83.") TEACHERS TOPICS American Journal of Pharmaceutical Education 2004; 68 (3) Article 83. The Role of Matching in Epidemiologic Studies Kevin W. Garey, PharmD College of Pharmacy, University of Houston Submitted
TEACHERS TOPICS American Journal of Pharmaceutical Education 2004; 68 (3) Article 83. The Role of Matching in Epidemiologic Studies Kevin W. Garey, PharmD College of Pharmacy, University of Houston Submitted
Examining Relationships Least-squares regression. Sections 2.3
 Examining Relationships Least-squares regression Sections 2.3 The regression line A regression line describes a one-way linear relationship between variables. An explanatory variable, x, explains variability
Role of respondents education as a mediator and moderator in the association between childhood socio-economic status and later health and wellbeing
 Sheikh et al. BMC Public Health 2014, 14:1172 RESEARCH ARTICLE Open Access Role of respondents education as a mediator and moderator in the association between childhood socio-economic status and later
National Child Measurement Programme Changes in children s body mass index between 2006/07 and 2010/11
 National Child Measurement Programme Changes in children s body mass index between 2006/07 and 2010/11 Delivered by NOO on behalf of the Public Health Observatories in England Published: March 2012 NOO
National Cancer Institute
 U.S. DEPARTMENT OF HEALTH AND HUMAN SERVICES Trends and patterns of childhood cancer incidence in the US, 1995 2010 Li Zhu National Cancer Institute Linda Pickle StatNet Consulting, LLC Joe Zou Information
Detection of Unknown Confounders. by Bayesian Confirmatory Factor Analysis
 Advanced Studies in Medical Sciences, Vol. 1, 2013, no. 3, 143-156 HIKARI Ltd, www.m-hikari.com Detection of Unknown Confounders by Bayesian Confirmatory Factor Analysis Emil Kupek Department of Public
Introduction Spatial Statistics
 Introduction Spatial Statistics Simon Rückinger Institut für Soziale Pädiatrie und Jugendmedizin Abteilung für Epidemiologie simon.rueckinger@med.uni-muenchen.de 1 / 41 Aim of this session Motivation for
Latent Variable Modelling for. Complex Observational Health Data
 Latent Variable Modelling for Complex Observational Health Data Wendy Jane Harrison Submitted in accordance with the requirements for the degree of Doctor of Philosophy The University of Leeds School of
Scottish mental health profiles for adults: summary report. Andrew D Millard, Gerry McCartney
 Scottish mental health profiles for adults: summary report Andrew D Millard, Gerry McCartney November 2015 We are happy to consider requests for other languages or formats. Please contact 0131 314 5300
Weight Adjustment Methods using Multilevel Propensity Models and Random Forests
 Weight Adjustment Methods using Multilevel Propensity Models and Random Forests Ronaldo Iachan 1, Maria Prosviryakova 1, Kurt Peters 2, Lauren Restivo 1 1 ICF International, 530 Gaither Road Suite 500,
Regression and causal analysis. Harry Ganzeboom Research Skills, December Lecture #5
 Regression and causal analysis Harry Ganzeboom Research Skills, December 4 2008 Lecture #5 Regression analysis is about partial associations Note that Berry & Feldman do not give any causal interpretation
TRIPLL Webinar: Propensity score methods in chronic pain research
 TRIPLL Webinar: Propensity score methods in chronic pain research Felix Thoemmes, PhD Support provided by IES grant Matching Strategies for Observational Studies with Multilevel Data in Educational Research
Multilevel analyses of neighbourhood socioeconomic context and health outcomes: a critical review
 J Epidemiol Community Health 2001;55:111 122 111 Department of Health Studies, University of Chicago, 5841 South Maryland Avenue, MC 2007, Chicago, IL 60637, USA K E Pickett Department of Family and Community
BIOSTATISTICAL METHODS
 BIOSTATISTICAL METHODS FOR TRANSLATIONAL & CLINICAL RESEARCH PROPENSITY SCORE Confounding Definition: A situation in which the effect or association between an exposure (a predictor or risk factor) and
Immigrant Density, Sense of Community Belonging, and Suicidal Ideation among Racial Minority and White Immigrants in Canada
 Immigrant Density, Sense of Community Belonging, and Suicidal Ideation among Racial Minority and White Immigrants in Canada Stephen W. Pan 1 & Richard M. Carpiano 2 1 University of British Columbia School
Critical Thinking Assessment at MCC. How are we doing?
 Critical Thinking Assessment at MCC How are we doing? Prepared by Maura McCool, M.S. Office of Research, Evaluation and Assessment Metropolitan Community Colleges Fall 2003 1 General Education Assessment
HIV Development Assistance and Adult Mortality in Africa: A replication study of Bendavid et al. (2012)
") HIV Development Assistance and Adult Mortality in Africa: A replication study of Bendavid et al. (2012) Jiangtao Luo, Ph. D. A replication study proposal submitted to 3ie s Replication Window 3: HIV Prevention
HIV Development Assistance and Adult Mortality in Africa: A replication study of Bendavid et al. (2012) Jiangtao Luo, Ph. D. A replication study proposal submitted to 3ie s Replication Window 3: HIV Prevention
Dylan Small Department of Statistics, Wharton School, University of Pennsylvania. Based on joint work with Paul Rosenbaum
 Instrumental variables and their sensitivity to unobserved biases Dylan Small Department of Statistics, Wharton School, University of Pennsylvania Based on joint work with Paul Rosenbaum Overview Instrumental
Answer keys for Assignment 4: Measures of disease frequency
 Answer keys for Assignment 4: Measures of disease frequency (The correct answer is underlined in bold text) 1. This statistic is used to estimate the risk of acquiring a disease. It may be measured as
PubH 7405: REGRESSION ANALYSIS. Propensity Score
 PubH 7405: REGRESSION ANALYSIS Propensity Score INTRODUCTION: There is a growing interest in using observational (or nonrandomized) studies to estimate the effects of treatments on outcomes. In observational
How was your experience working in a group on the Literature Review?
 Journal 10/18 How was your experience working in a group on the Literature Review? What worked? What didn t work? What are the benefits of working in a group? What are the disadvantages of working in a