Electronic Health Record Summarization over Heterogeneous and Irregularly Sampled Clinical. Data. Rimma Pivovarov
|
|
|
- Lynne Blair
- 6 years ago
- Views:
Transcription
1 Electronic Health Record Summarization over Heterogeneous and Irregularly Sampled Clinical Data Rimma Pivovarov Submitted in partial fulfillment of the requirements for the degree of Doctor of Philosophy under the Executive Committee of the Graduate School of Arts and Sciences COLUMBIA UNIVERSITY 2016
2 2015 Rimma Pivovarov All rights reserved
3 ABSTRACT Electronic Health Record Summarization over Heterogeneous and Irregularly Sampled Clinical Data Rimma Pivovarov The increasing adoption of electronic health records (EHRs) has led to an unprecedented amount of patient health information stored in an electronic format. The ability to comb through this information is imperative, both for patient care and computational modeling. Creating a system to minimize unnecessary EHR data, automatically distill longitudinal patient information, and highlight salient parts of a patient s record is currently an unmet need. However, summarization of EHR data is not a trivial task, as there exist many challenges with reasoning over this data. EHR data elements are most often obtained at irregular intervals as patients are more likely to receive medical care when they are ill, than when they are healthy. The presence of narrative documentation adds another layer of complexity as the notes are riddled with over-sampled text, often caused by the frequent copy-and-pasting during the documentation process. This dissertation synthesizes a set of challenges for automated EHR summarization identified in the literature and presents an array of methods for dealing with some of these challenges. We used hybrid data-driven and knowledge-based approaches to examine abundant redundancy in clinical narrative text, a data-driven approach to identify and mitigate biases in laboratory testing patterns with implications for using clinical data for research, and a probabilistic modeling approach to automatically summarize patient records and learn computational models of disease with heterogeneous data types. The dissertation also demonstrates two applications of the developed methods to important clinical questions: the questions of laboratory test overutilization and cohort selection from EHR data.
4 Table of Contents List of Figures...v List of Tables... vii Thesis Committee Members... viii Acknowledgements... ix Dedication... xii Chapter 1: Introduction The Need for Summarization of EHR Data EHR Datasets MIMIC II ICU Dataset NYPH Dataset Thesis Approach Aim I: Contextual Redundancy Removal in Clinical Notes Aim II: Exploiting Patterns of Missingness for Clinical Modeling of Laboratory Tests Aim III: Probabilistic Modeling of Patient Health States Contributions Guide for the Reader...15 Chapter 2: Background Approaches to EHR summarization Methodological challenges to EHR summarization Identifying and aggregating similar information Organizing and reasoning over temporal events Accounting for and interpreting missing data Reducing information to only the most salient Using existing clinical knowledge Deploying summarization tools into the clinic...36 i
5 Chapter 3: Contextual Redundancy Removal in Clinical Notes Introduction to Similarity Detection Related Work on Similarity Detection Methods for Semantic Similarity Calculation Context-Aware Computing Method for identifying similar concepts Data and Knowledge Sources Filtration Note-Based Similarity Ontological Similarity Definitional Similarity Experimental Setup Results Concept Similarity Results Discussion Impact of Context Impact of the Ontological-based Similarity Impact of the Definitional-based Similarity Impact of Combining Data-driven and Knowledge-driven Similarity Measures...64 Chapter 4: Exploiting Patterns of Missingness for Clinical Modeling of Laboratory Tests Introduction Capturing the Context of Laboratory Testing EHR Biases Materials and Methods Task 1: Correlation between Measurement Gap and Numerical Value Task 2: Finding Laboratory Test Measurement Motifs Task 3: Studying the Potential Effect of Measurement Motifs on Research Results...77 ii
6 4.3.1 Task 1: Correlation between Measurement Gap and Numerical Value Task 2: Laboratory Test Measurement Motifs Task 3: Measurement Patterns Highlight Clinical State Recommendation for EHR Research with Laboratory Measurements Discussion Separation by Measurement Pattern Mitigates EHR Bias...90 Chapter 5: Learning Probabilistic Phenotypes from Heterogeneous EHR Data Introduction to the Phenome Model Related Work Related work in Computational models of disease Probabilistic graphical models in the clinical domain The Phenome Model Inputs and Outputs of the Phenome Model Baseline Models to compare against the Phenome Model Graphical Model representation of the Phenome model Inference in the Phenome Model Grounding the Phenome Model Experimental Setup for the Phenome Model Datasets Model Parameters and Model Selection Evaluation Experiments Results Model Selection Evaluation 1: Coherence Evaluation 2: Granularity Evaluation 3: Pairwise Phenotype Comparison Evaluation 4: Label Quality Evaluation 5: Disorders to Phenotypes Comparison iii
7 5.5.7 Evaluation 6: Quantitative Metrics Discussion Joint modeling of heterogeneous EHR data Generative unsupervised modeling of EHR data Automated coherence metrics vs. human judgments Effects of Grounding the Phenome model Chapter 6: Applications to Clinical Questions Introduction Leveraging measurement motifs to study inappropriate use of laboratory tests Introduction Methods for Identifying HbA1c Temporal Trends Results of Temporal Analysis of HbA1c Measurement Discussion Leveraging the Grounded Phenome model for cohort identification Introduction Methods for Identifying Type II Diabetics from EHR data Results of the Type II Diabetes Cohort Identification Discussion Chapter 7: Conclusions and Future Work Conclusion Contributions Limitations Future Work References Appendix A: List of Correlations between Laboratory Value and Measurement Gap Appendix B: Phenome Model Inference iv
8 List of Figures Figure 1.1 Our methodology for finding context-dependent similar concepts. 7 Figure 1.2 The results of a binomial association test between high lipase and ICD-9 codes. 12 Figure 1.3 An example of a grounded phenotype learned by the Grounded Phenome model. 15 Figure 3.1 Our methodology for finding context-dependent similar concepts. 45 Figure 3.2 An example of the relationship-weighted path calculation. 51 Figure 3.3 Descriptive Statistics for sentences in our CKD corpus. 55 Figure 3.4 ROC curves comparing different parts of our methodology. 58 Figure 3.5 ROC curves of the baseline methods. 61 Figure 4.1 A schematic of a longitudinal record. 74 Figure 4.2 A Bayesian network describing the two factors that influence a laboratory tests measurement pattern. 80 Figure 4.3 Representative examples of the three measurement gap motifs identified. 83 Figure 4.4 The results of a binomial association test between high lipase and ICD-9 codes. 88 Figure 5.1 Graphical representation of the Phenome model. 100 Figure 5.2 Generative story for the Phenome model 100 Figure 5.3 An example of a learned phenotype. 110 Figure 5.4 Held-out likelihood calculation for the MIMIC dataset for different numbers of latent variables. 112 Figure 5.5 Distribution of manual coherence scores for the UPhenome and LDA-all phenotypes on MIMIC data. 113 Figure 5.6 Distribution of manual coherence scores for the UPhenome, GPhenome, and LDA-all phenotypes on NYPH data. 113 v
9 Figure 5.7 An example of LDA-all and Phenome phenotypes, both about Iron Deficiency Anemia, as paired automatically by Jensen-Shannon divergence. 115 Figure 5.8 Grounded and ungrounded Phenome model phenotypes. 116 Figure 5.9 The observations that had augmented counts for the grounded Sinusitis phenotype. 117 Figure 5.10 Association of manually identified ground-truth concepts and automatically inferred phenotypes over a set of patients, along with four example phenotypes. 119 Figure 6.1 Counts of all HbA1c orders over the years , stratified by HbA1c numerical value. 131 Figure 6.2 Probability density function estimated using a kernel density estimate on the aggregated gaps between HbA1c measurements for both the pre-guideline period ( ) and the post-guideline period ( ). 132 Figure 6.3 Joint probability between each HbA1c percentage and time to next measurement before the 2002 guidelines (left) and after the 2002 guidelines (right). 133 Figure 6.4 Proportion of HbA1c measurements taken within 10 days that follow the appropriate guidelines for diagnostic use Figure 6.5 Numerical stratification of HbA1c tests reordered within 10 days over the years Figure 6.6 Percentage of HbA1c tests that are reordered within 10 days over the years , stratified by numerical value. 137 Figure 6.7 The diabetes prior that was input to ground the Phenome model for T2DM. 142 Figure 6.8 The two T2DM phenotypes used for identifying T2DM case patients. 142 Figure 6.9 Distribution of T2DM phenotype weights. 144 Figure 6.10 The two T1DM phenotypes used for ruling out case patients that may have T1DM instead of T2DM. 145 Figure 6.11 Precision-Recall Curve for T2DM Cohort Selection. 146 vi
10 List of Tables Table 1.1 Top-10 Concept Pairs Found By Our Similarity Measure. 8 Table 2.1 A Sampling of Clinical Summarization Applications. 26 Table 3.1 Relationship Weights for our Algorithm. 50 Table 3.2 All of the UMLS-Similarity Measures and Their Inclusion or Exclusion in our Baseline. 54 Table 3.3 Note Types Selected Through the Note Filter. 56 Table 3.4 Top-10 Concept Pairs Found by the Composite Method. 59 Table 3.5 Missing Paths in Hierarchical Methods. 61 Table 4.1 Note Types in each Healthcare Setting (In vs. Outpatient). 84 Table 4.2 Words Associated with a Pancreatitis Health State. 86 Table 4.3 Measurement Gap Separation Method. 89 Table 5.1 Variables in the Phenome Model. 98 Table 5.2 Descriptive Statistics for the MIMIC ICU and NYPH Outpatient Training Datasets. 103 Table 5.3 Average NPMI for Different Numbers of Latent Variables. 111 Table 5.4 Held-Out Likelihood on a Test Set for Different Parameter Settings. 112 Table 5.5 UMLS Concept Unique Identifiers for the ShARE Annotations in Figure Table 5.6 Quantitative Evaluation For The UPhenome Model, GPhenome Model, and LDA-all Model. 120 Table 6.1 The Statistical Measures of Performance for emerge and GPhenome. 147 vii
11 Thesis Committee Members Advisor Noémie Elhadad, PhD Committee George Hripcsak, MD, MS Gilad Kuperman, MD, PhD Peter Stetson, MD, MA Peter Szolovits, PhD, FACMI viii
12 Acknowledgements There are so very many people to thank, but I will limit myself to only two pages. First, Noémie. There would be no thesis without Noémie. I ve always felt that the best decision I made at DBMI was choosing Noémie as my advisor. Noémie has spent countless hours helping me understand: (i) how to not break every server I log into, (ii) how to turn my convoluted ideas into a well thought out paper, (iii) how to be a kind and successful woman in science, and (iv) how nice roman numerals look in a paragraph of text. I m certain that with time I will recognize more and more things that Noémie has taught me and I m so thrilled that we can continue working together. Thank you to my wonderful committee: George, Gil, Pete and Pete. I am so honored you agreed to be a part of my dissertation. Thank you for reading all of my work so thoroughly and genuinely helping me create a more cohesive, coherent, and impactful body of work. Many many many people at DBMI have made this experience much brighter than it could have been. Hojjat, you have been the only person here for the entire time: from our first office together, to hours of co-ta office hours, to reunited cubicle buddies, to my brand new co-worker! I am in constant amazement of your kindness, which is so neatly wrapped in a very heavy layer of intelligence. Thanks for being my best DBMI buddy. Nicole, I m certain that your presence helped keep my sanity intact. Watching you complete the PhD process with such poise (and such a curly cute baby) continues to motivate me to this day. Dave Albers, I don t know who else has been so encouraging and has believed in me from the very beginning to the very end. Thank you for your constant advice, support, encouragement, snacks, and humor. Adler, thank you for the innumerable hours you have spent showing me derivations, explaining Greek letters, teaching me how to look so cool when programming, and most importantly for your never- ix
13 ending patience. And finally, to Marina and Sharon who both make me extra cheerful whenever I see them in the hallway, and that always counts for so much. Lizzy, my fellow (coffee-shop) dreamer, you always show me what I should strive for and with the PhD, it is no different. You are always able to hear me out, deeply empathize, and then make me laugh uncontrollably. Thank you for being my travel buddy and my favorite person to do many hours of nothing with. Mash, thank you to you as well. Your consistently honest, blunt, and absolutely hilarious way of interpreting any situation has helped keep me grounded and grateful. And finally, the family. Garush, thank you for being the only one who can handle my constant barrage of crazy with so much ease, hilarity, patience, piggy back rides, and high fives. MaPa, thank you for always answering all of my phone calls and texts and IMs and Facetimes and Skypes! Thank you for worrying about my safety and happiness and making it so wonderful to come home. Thank you for keeping me happy and sane. Everyone, I really could not have done it without you. x
14 Dedication To my Babushkas and Dedushkas. I hope you would all be proud. xi
15 Chapter 1: Introduction 1.1 The Need for Summarization of EHR Data The increased adoption of electronic health records (EHRs) has led to an unprecedented amount of patient health information stored in electronic format. Within the past decade, the number of healthcare practices that have some electronic capability to store patient data has grown to almost 80% and now hundreds of millions of patients across the United States have extensive medical histories in electronic form. As health information exchanges promise patient record integration across multiple care settings, the amount of available patient data will continue to explode (Adler-Milstein, Bates, and Jha 2011). In these health records, clinicians routinely document the care of their patients. Throughout the years, patient records accumulate medical history as a myriad of individual observations: results of laboratory tests and diagnostic procedures; interventions; medications; and detailed narratives about disease course, treatment options, and family and social history. There is great potential for research in leveraging these large amounts of clinical data to learn about human health. The informatics community is posed to develop methods to mine the available information and ask questions such as: how can we further clinical knowledge, how can we assist clinicians in performing searches within and across patient records, how can we predict patient hospital course, and 1
16 how can we automatically condense records to provide succinct summaries of a patient s medical history? With this eruption of rich, complex, and essential health data for millions of patients, the informatics community has a new opportunity to tackle the challenges entailed in interpreting a wealth of health information. However, this same availability of large records has raised concerns of information overload for the healthcare practioner (Farri 2012), with potential negative consequences on clinical work, such as errors of omission (McDonald 1976), delays (McDonald et al. 2014), and overall patient safety (Holden 2011). When caring for an individual patient, clinicians reason in the context of the patient s medical history. This is a cognitively difficult task. First, the search space for potential diseases that may account for the patients symptoms is very large. Second, the individual clinical observations that form the patient s record are many, thus potentially overwhelming in aggregate, and at the same time each of them is potentially imperfect and uncertain. Current EHR systems often do not present this tremendous amount of patient data in a way that supports clinical workflow or cognitive reasoning (Stead and Lin 2009). It is therefore imperative for patient care to automatically comb through the raw data points present in the records and detect timely and relevant information. Even more alarmingly, as the most chronically ill patients often have the largest datasets, their records are the most difficult to present coherently (Christensen and Grimsmo 2008). As an example, for a prevalent chronic condition in our institution, patients with chronic kidney disease have 338 notes on average in their record (from all clinical settings) gathered across an average of 14 years, with several patients records containing over 4,000 notes. It is clear that during a regular medical visit, no practitioner can read hundreds of clinical notes. Fortunately, electronic storage of this health information provides an opportunity for EHR systems to aid cognition through aggregation, trending, contextual relevance, minimizing superfluous data (Schiff and Bates 2010). Currently available commercial EHR systems, however, inadequately address this need, sometimes providing organization of data but lacking in information synthesis (Laxmisan et al. 2012). Some vendor EHR dashboards display problem lists that aggregate billing codes but these are low in actionable knowledge (Van Vleck et al. 2
17 2008; Rosenbloom and Shultz 2012). The focus of this thesis is to develop algorithms for automatically summarizing EHR data by creating methods to identify and address inherent challenges in the EHR data. 1.2 EHR Datasets To develop robust methods for reasoning and learning over clinical datasets derived from EHRs, we must be cognizant of challenges that derive from the uniqueness of medical data. Here we list a set of issues confronted when developing methods for these clinical datasets: Uncertainty: medicine inherently deals with uncertainty about both diagnoses and individual observations about patients. Clinicians observe patient symptoms and patient histories with different levels of certainty, and diagnoses themselves are probabilistic in nature. Data Heterogeneity: clinical records are composed of different structured and unstructured data types, each with complementary information. Often, medications are listed as pharmacy orders and discussed in the clinical notes as well, and laboratory tests are reported in structured form and additionally recorded in clinical notes. To make matters more difficult, it is not uncommon for different data types to disagree; medication lists in clinical notes are often out of sync with structured medication lists from pharmacy orders. Temporality: diseases evolve over different time scales. Some diseases are chronic in nature and their progression is documented in the record across many years, whereas other ailments are acute and appear in short spurts in the patient records. Data sparsity: records are riddled with missing observations, and there is very often no regularity in the rate at which patients are observed. Many clinical observations are missing not at random (e.g., patients are observed more frequently when they are ill and come to see their physicians for treatment). Healthcare features: in addition to the raw observations from clinical records (words in clinical notes, medications prescribed, etc.), features representative of the process of healthcare (rate of visitation, healthcare setting visited, etc.) can provide valuable information. 3
18 Inaccuracy: as clinicians themselves populate EHR information during the process of patient care, many mistakes are entered into the system: typos, selections from dropdowns, copy and paste errors that propagate old information, etc. This characteristic of EHR data differs greatly from clinical trial data, where there is a lot of manual effort involved in ensuring accuracy and validity of observations. We specifically develop algorithms to take these challenges into account. For the experiments reported in this thesis, we use two different EHR datasets: the MIMIC II ICU dataset and the clinical data warehouse at NewYork Presbyterian Hospital (NYPH). All of the studies presented in this thesis are completed on varying subsets of these data, depending on the purpose of the study. Here we broadly describe both datasets and within each study detailed later, we specify the preprocessed subset used MIMIC II ICU Dataset The MIMIC II Clinical Database (v2.26) (Saeed et al. 2011) is available at MIMIC II contains a de-identified set of over 23,000 adults from the Beth Israel Deaconess Medical Center s Intensive Care Units, including medical, surgical, and coronary care units. The dataset contains structured record data, and unstructured clinical note data. Patients have a broad set of existing conditions and reasons for being in the ICU. As this dataset is available to researchers who sign a data usage agreement, any work on this dataset can serve as a benchmark for future automated phenotyping algorithms NYPH Dataset This dataset is derived from data collected at NewYork-Presbyterian Hospital (NYPH), a not-for-profit hospital in New York City. The clinical data warehouse at NYPH contains patient data for over 4 million patients from as early as 1985 to present day. The information in these records include pertinent information for medical care such as demographics, visits, medications ordered, laboratory tests performed, diagnoses that are billed for, problem lists, and clinical notes written by healthcare practitioners. For all of the experiments reported in this thesis, only adult (18 years old and older) patient records were used. Patient records include all of their visits, ranging from outpatient visits to hospital 4
19 admissions, to emergency department visits. Like the MIMIC patients, the NYPH patients have a broad set of conditions, but unlike them their records span years instead of days, and the documented conditions differ as well. 1.3 Thesis Approach The dissertation describes mixed-methods approaches to dealing with some of the underlying issues in the summarization of both narrative and structured EHR data. Our goal was to use knowledge- and data-driven approaches to comb through clinical data and devise novel methods for dealing with redundancy, missing data, and automatic determination of saliency. Clinical records store patient information across a diverse set of data types. The work presented in this thesis examines a broad array of challenges in summarizing and making sense of clinical record data across many clinical data categories. The thesis explores the challenge of redundancy through the lens of clinical notes, examining how a patient s health history can influence which clinical concepts are redundant and which are not. The challenge of irregular sampling is explored through the lens of laboratory tests, examining whether the sampling rate of each laboratory test can provide important clinical insight. Finally, the thesis presents a method for combining diverse clinical data types to address the challenge of saliency, examining whether modeling laboratory tests, medications, clinical text, and diagnosis codes together can provide a clinically relevant summary of a patient s health states. Aim 1 describes an approach for minimizing redundancy in the narrative part of a patient record; Aim 2 defines a method for identifying and mitigating the biases that exist in laboratory test measurements; and Aim 3 designs a summarizer that uses heterogeneous data to identify salient pieces of a patient s record. Aim I: Develop a methodology to contextually reduce narrative redundancy in a patient s medical record by aggregating over-sampled concepts. Aim II: Create a method for exploiting a patient s non-random patterns of missing laboratory test values for clinical modeling. 5
20 Aim III: Design a summarizer synthesizing heterogeneous data: clinical notes, laboratory tests, medications, and billing codes Aim I: Contextual Redundancy Removal in Clinical Notes Objective: Develop a methodology to reduce over-sampling of concepts within patient records by identifying and aggregating similar concepts in clinical notes based upon the context of a patient s medical history. Research Questions: 1. Are there instances when clinical concepts should be aggregated? 2. Can a patient s medical history alter which clinical concepts should be aggregated? 3. Does adding ontological knowledge to data-driven patient knowledge increase the accuracy of identifying concepts that should be aggregated? Methods and Materials: Aim 1 relies on a hybrid approach of data-driven and knowledge-driven complementary methods in order to identify contextually redundant concepts within a patient s longitudinal health record. The datadriven method of distributional semantics is able to capture the context surrounding each instance of a concept and has been successful in many settings including information retrieval (Manning and Schütze 2003), while ontological techniques are used to refine the results from the data. The methodology for assessing redundant concepts consists of three complementary similarity measures (Figure 1.1). One primary measure is data-based and relies on distributional semantics of patient notes authored by clinicians, while the other two are knowledge-based and rely on concept definitions and their relationships in the Systemized Nomenclature of Medicine Clinical Terms (SNOMED-CT) terminology. Starting from a homogenous corpus of notes (i.e., notes about patients who share at least one clinical problem), notes are pre-processed to extract concepts mentioned in the corpus. The noted-based similarity measure ranks all pairs of concepts. The top-k pairs with the highest note-based similarity are then reordered using the two knowledge-based similarity measures. 6
21 Figure 1.1 Our methodology for finding context-dependent similar concepts. We choose to collect a homogenous and semantically coherent corpus of clinical notes; in order to ensure that concepts, which are clinically relevant to the patients, are likely to appear frequently enough and as the patient set is homogeneous we are able to find concepts that are similar specifically for the context of this particular disease. For this study, we collect a corpus of notes from patients with chronic kidney disease (CKD). The methods we employ are disease independent, but the fact that we select notes from patients all with at least one condition in common allows us to identify and aggregate concepts frequently mentioned when documenting a particular set of patients. Furthermore, CKD is a prevalent condition in our institution, thus allowing us to collect a large corpus of notes. Patients with CKD have many comorbidities and disorders, providing us with many different concepts to consider in our similarity computation. Primary Findings: Our approach scores the similarity of two input concepts by combining complementary information derived from usage patterns of clinical documentation, accepted definitions, and position of the concepts in an ontology. Our experiments show that given a coherent corpus of clinical notes, it is possible to determine automatically which concepts convey similar meaning in the context of the corpus. We demonstrate that by combining information from usage patterns in clinical notes and from ontological structure, the method can prune out concepts that are simply related from those which are semantically similar. Our method was evaluated against a gold-standard set of similar concepts: our method was able 7
22 to outperform the baseline methods and reached an AUC (area under the curve) of 92%. The results of the top 10 concept pairs identified by our method are demonstrated in Table 1.1. UMLS Concept Preferred Term C Traumatic injury of skeletal muscle C Penile hypospadias C Muscle tenderness C Thrill (finding) C Gastro-esophageal reflux disease with esophagitis C Anorectal fistula C Acquired hallux valgus C Aseptic Necrosis of Bone C Stenosis C Finding UMLS Concept Preferred Term C Muscle Injury C Hypospadias C Skeletal muscle tender C Cardiac thrill (finding) C Peptic Esophagitis C Anal fistula C Hallux Valgus C Bone necrosis C Acquired stenosis C Signs and Symptoms Similarity Score Similar according to Expert Consensus 1 Y Y Y N 0.95 Y Y Y Y Y Y Table 1.1 Top-10 concept pairs found by the average of the data- and ontologically-based similarity measure. 8
23 1.3.2 Aim II: Exploiting Patterns of Missingness for Clinical Modeling of Laboratory Tests Objective: Create a method for investigating and mitigating the effects of non-random sampling in laboratory tests on clinical modeling. Research Questions: 1. Are there different missingness motifs across different laboratory tests? 2. Do the missingness motifs provide separate information to the laboratory test s numerical value? 3. Can adding the missingness motif to a laboratory value threshold increase phenotyping accuracy? Methods and Materials: The studies performed in Aim 2 categorize the different missing data patterns of irregularly sampled laboratory tests and evaluate the effect of these different patterns on EHR studies. The first part of this study explores different patterns of irregularly sampled laboratory test data by considering the irregular sampling as a missing data problem. To understand the overall dynamics of laboratory tests recorded in the EHR, we categorize types of laboratory measurement motifs, identifying those more likely to cause biases in EHR-based research. We examine laboratory measurement patterns by looking at the distribution of days between consecutive measurements of each laboratory test, across the entire population. We examine and catalogue these resulting measurement gap histograms. If there is linearity in a measurement gap histogram when presented in log-log coordinates (i.e., a power-law) that implies scale-free measurement dynamics; in this situation all time scales are explainable by a single equation and likely represent a single context for ordering the laboratory test. If no approximately linear relationship between the frequency of measurement gaps exists, we looked for changes (e.g., peaks) that separate the different dynamics patterns; these different patterns may qualitatively imply different contexts of measurement based on either a change in health state or based on the healthcare documentation process. We catalogue the periodic measurement curves (measurement gap histograms) 9
24 based on observed approximate linearity and the presence of peaks in the histograms. Missingness Motifs vs. Laboratory Test Values In research with clinical data, there is an implicit assumption that a laboratory test s numerical value and the rate at which the test is ordered are highly correlated features. This assumption about value and measurement correlation likely stems from the existence of value-based guidelines and the widespread expectation that laboratory test values which fall outside of normal ranges prompt intervention and retesting. To investigate and quantify this assumption we ask: is there added information in looking at how a patient was measured, not only at the measurement value? Given a particular lab and all patients' time series for that lab, we construct a joint probability density function consisting of laboratory values and time between consecutive lab measurements (or gaps between measurement) in days. Using (i) linear correlation, (ii) mutual information, and (iii) differential entropy we explore the correlation of laboratory values to the laboratory test's time to repeat, examining whether the value and time between consecutive measurements (measurement gap) encode separate information or overlap in information content. The Effect of Patterns of Missingness on Phenotyping To demonstrate the utility of identifying and accounting for patterns of irregular sampling we conduct a typical EHR association test (Warner and Alterovitz 2012). In this task, we focus on a specific laboratory test as a use case for studying effect of measurement motifs on EHR-driven research. We examine lipase measurements and their impact on identifying acute pancreatitis. We asked the question: can the known association between an abnormal lipase value and acute pancreatitis be recovered from EHR data? To verify our hypothesis that patterns of missingness can impact the accuracy of identifying patients with acute pancreatitis, we considered three views of the data, based on the dynamics of lipase measurements within each patient s record: (i) only visits with short lipase measurement gaps, (ii) only visits with long lipase measurement gaps, and (iii) all visits independent of their lipase measurement gap. In each of these settings, we assessed the association between acute pancreatitis and lipase and studied the properties of visits that belong in the setting using ICD-9 codes and clinical notes. We hypothesize that as 10
25 acute pancreatitis is an acute disease, visits with short lipase measurement gaps will be more highly associated and relevant to acute pancreatitis. Primary Findings: We show that the context of a laboratory test measurement can often be captured by the way the test is measured through time. We perform three tasks to study the properties of these temporal measurement patterns. In the first task, we confirm that laboratory test measurement patterns provide additional information to the stand-alone numerical value. The second task identified three measurement pattern motifs across a set of 70 laboratory tests. Of these, two motifs exhibit properties that can lead to biased research results. In the third task, we demonstrate the potential for biased results on a specific example. We conduct an association study of lipase test values to acute pancreatitis. We observe a diluted signal when using only a lipase value threshold, whereas the full association is recovered when properly accounting for lipase measurements in different contexts (leveraging the lipase measurement patterns to separate the contexts) (Figure 1.2). We find that aggregating EHR data without separating distinct laboratory test measurement patterns can intermix patients with different diseases, leading to the confounding of signals in large-scale EHR analyses. This study results in a general methodology for leveraging measurement frequency to identify and reduce laboratory test biases. 11
26 Figure 1.2 The results of a binomial association test between high lipase and ICD-9 codes. The binomial test was performed in all three settings (short gaps between measurements of 0 3 days, long gaps of more than 3 days, and all visits regardless of gaps between lipase measurements). The top 20 most significant associations are shown. For illustration purposes, the ICD-9 codes are sorted by association to high lipase in the 3 + days gap Aim III: Probabilistic Modeling of Patient Health States Objective: Design a summarizer synthesizing heterogeneous data: clinical notes, laboratory test measurements, medications, and ICD-9 codes. Research Questions: 1. Is there a benefit to modeling different EHR data elements separately? 2. Are state-of-the-art evaluation techniques for probabilistic topic modeling applicable in the clinical domain? 12
27 3. Does the incorporation of ontological knowledge create inferred topics that better explain the data? Methods and Materials: Building computational models of disease has been an active area of research, with approaches ranging from building ontologies and taxonomies of diseases based on clinical expertise, to creating highly precise model of specific diseases of interest through a mix of data-driven and clinical expertise, to discovering models directly from clinical observations. In this Aim, we create a model, the Phenome model, which works with the heterogeneous and irregularly sampled data types studied in Aims 1 and 2. The Phenome model is an unsupervised, generative model, which given a large set of EHR observations, learns probabilistic phenotypes. The model is a mixed membership probabilistic model of longitudinal patient records and phenotypes. Under this model, a patient record can be represented as a probabilistic mixture of phenotypes, and the phenotypes can be defined as a mixture of characteristics derived from a large, diverse population. Phenotype is defined here as a set of observations all related to a particular condition. The observations types used in this model are: medications, laboratory test instances, billing codes, and words from the narrative clinical documentation. The Phenome model is based on Latent Dirichlet Allocation (LDA) (Blei, Ng, and Jordan 2003; Griffiths and Steyvers 2004). The model enables the heterogeneous data elements encoded in a patient s record to be grouped through one phenotype definition and distributed across a predetermined number of P phenotypes. The phenotypes are learned jointly over heterogeneous EHR observations drawn from a large set of potential medications, diagnosis codes, laboratory tests, and free-text clinical notes. When applied to specific patient records, the Phenome model can provide actionable representation of the records, by describing them as a distribution over the patient s inferred phenotypes. The goal of the Phenome model is to probabilistically identify sets of related heterogeneous clinical concepts that comprise phenotypes. Our goal is to learn phenotypes that are interpretable so that the model can be most useful in a clinical setting. To achieve this goal, we experiment with specifying informative prior distributions for the phenotypes such that each phenotype in the model is a priori 13
28 associated with concepts of clinical significance. We use a set of knowledge-bases to inject this clinical knowledge into the model. We perform a set of different evaluations for this research. Automated evaluations include loglikelihood on a held-out set and automated topic coherence measures (Lau, Newman, and Baldwin 2014). A clinical expert performed evaluations about the coherence and granularity of learned phenotypes and did pairwise assessment of phenotypes learned by the Phenome model and the baseline methods. In addition, to examine how well the automated evaluations correlate with clinical expert judgment, we report on their correlation with the clinician. To evaluate the inferred phenotypes for patients given their EHR, we quantified the association between learned phenotypes and manually annotated disorders extracted from patient records. To evaluate the a priori grounding of phenotypes using clinical knowledge bases, we compared coherence and granularity scores between ungrounded and grounded phenotypes. Primary Findings: We demonstrate that the Phenome model can learn from different care settings and documentations of different healthcare institutions, without any adaptation needed. Our experiments show that the Phenome model yields phenotypes that (i) combine all these data types in a coherent fashion better than baseline models; (ii) are representative of single diseases, while baseline models tended to produce representations of either mixes of disease or high-level healthcare process; and (iii) when applied to unseen patient records, are highly correlated with the patients ground-truth disorders. We also demonstrate that incorporating encoded clinical knowledge into the model leads to more coherent and cohesive phenotypes. Figure 1.3 presents an example of a phenotype that was learned after grounding the Phenome model. We demonstrate that large-scale probabilistic phenotyping is a promising approach to learning accurate and interpretable computational disease models. 14
29 Figure 1.3 An example of a grounded phenotype learned by the Grounded Phenome model. 1.4 Contributions The contributions of this dissertation are two-fold. The dissertation provides a literature review on work on clinical summarization as a whole and identifies important gaps that remain unsolved. The methodological contributions of this work include three novel methods for addressing some of the challenges in summarizing EHR data, namely: redundancy, irregular sampling, heterogeneity, and salience determination. This dissertation also presents different ways in which raw data and ontological knowledge can be married, providing evidence for the benefit of combining these two data sources. The work presented here provides a platform for future work in applying latent variable models to EHR data as the models presented here are extendable in many different ways. Finally, the dissertation also presents two studies that demonstrate the applicability of the created methods for answering clinical questions. 1.5 Guide for the Reader Chapter 2 is an in-depth review of the literature on EHR summarization. I identified published EHR summarization systems along with their inputs, outputs, method of summarization, methods of evaluation, and notable information. In addition, I highlight some of the remaining challenges in creating next generation EHR summarization systems. Chapter 3 describes an approach that uses both knowledge-bases and clinical note structure to identify similar concepts in clinical text, as a way of finding which concepts can be aggregated for which groups of patients in an effort to reduce signal dilution and redundancy in studies with EHR data. Chapter 4 reports on a study of the biases in laboratory test measurement and how these biases in measurement can be used to separate distinct patient populations. 15
30 Chapter 5 presents a probabilistic graphical model for summarizing patient data across heterogeneous data types along with an evaluation that demonstrates the utility of modeling different data types separately but jointly. Chapter 6 details two separate experiments that showcase the applicability of the methods outlined in this thesis to clinical questions. One experiment applies laboratory test measurement pattern analysis to identify hemoglobin A1c testing trends over time, and the other uses the probabilistic graphical model to identify cohorts of diabetic patients. Chapter 7 summarizes the contributions of the research described in this dissertation, as well as what I see as the next steps in EHR automated summarization. 16
31 Chapter 2: Background Approaches to EHR summarization Given the unmet and well-recognized need for comprehensive EHR summarization (Powsner and Tufte 1994; Payne 2000), many research groups have designed and evaluated clinical data summarizers. In this chapter, we sample summarization applications to highlight different features including seminal work, different evaluation strategies, and various input/output data. We also examine the current work and future directions for six challenges of EHR summarization: information redundancy, temporality, missing data, salience detection, rules and heuristics, and deployment of summarization tools. There are multiple theoretical frameworks for summarization in the clinical domain (Feblowitz et al. 2011) as well as for textual summarization in the general domain (Alterman 1991; Radev, Hovy, and McKeown 2002). In the broader field of summarization, there has been a lot of work in automated text 1 A large part of this chapter was originally published in JAMIA. The full citation for this publication is: Pivovarov R, Elhadad N. Automated Methods for the Summarization of Electronic Health Records. JAMIA
32 summarization, specifically within the genres of news stories and scientific articles (see (Nenkova and McKeown 2012) for an in-depth review). Clinical summarization, the act of collecting, distilling, and synthesizing patient information for the purpose of facilitating any of a wide range of clinical tasks (Feblowitz et al. 2011), presents a different set of challenges from summarization in other domains and genres of texts. While there exist other discussions on biomedical literature summarization methods (Afantenos 2006; Mishra et al. 2014) and EHR visualizations (Roque, Slaughter, and Tkatsenko 2010; Rind et al. 2010; West, Borland, and Hammond 2014), in this review we focus on characterizing existing clinical summarization systems by outlining the system outputs and evaluations as well as highlighting the remaining challenges that exist in automated summarization. To categorize the summarizers highlighted in this review, we focus on two common dimensions used in the text summarization literature: extractive/abstractive summarization, and indicative/informative summarization. We define the four categories that describe summary types. (1) Extractive summaries are created by borrowing phrases or sentences from the original input text. In the domain of clinical summarization, an extractive approach can identify pieces of the patient s record and display them without providing additional layers of abstraction. (2) Abstractive summaries generate new text that synthesizes the original text. In the domain of clinical summarization, abstractive summaries may provide additional higher-level context to explain the data, such as computed quantities (e.g., trends) or automatically generated text. Extractive and Abstractive summaries are further categorized as either indicative or informative. (3) Indicative summaries point to important pieces of the original text, highlighting significant parts for the reader. In the domain of clinical summarization, indicative summaries may convey, for instance, when key tests were performed or diagnoses were made. Indicative summaries are meant to be used in conjunction with the full patient record. 18
33 (4) Informative summaries replace the original text. In the domain of clinical summarization, informative summaries are designed to be used independently of the full patient record, meaning they are used as a replacement for the original full set of raw data. How to evaluate a summarizer, both its accuracy and its added value in supporting users carry out information-related tasks has also been the subject of investigation in general domain and clinical summarization. Intrinsic evaluations focus on the internal validity of a summarization tool. Typically, experts evaluate the quality of the automatically produced summaries; or themselves create gold-standard summaries, against which automatic ones are compared. In an extrinsic evaluation framework, the usefulness of the summarization tool is assessed through its effectiveness in helping individuals carry out a task. For instance, a clinical summary could be evaluated in an extrinsic fashion by comparing how quickly and accurately trial coordinators can identify patients eligible for a trial with access to patients full records or with access to a summary instead. Almost since the inception of EHRs, there has been an interest in creating meaningful succinct summaries for clinicians. The research on automated summary creation has spanned over 30 years and initiated with extracting recent structured events in a patient s history (Rogers and Haring 1979) evolving into performing natural language processing (NLP) (Liu and Friedman 2004) and automatically linking different data types (Cao et al. 2005; Klann et al. 2013) to create a more holistic view of the patient record. Table 1 lists clinical summarization systems proposed in the research literature in chronological order. We describe each system according to the following axes: the summarization approaches it implements, the type of input data it handles, the type of output summary, the way in which it was evaluated, and whether it was deployed in a clinical environment. Overall, summarization approaches investigated in clinical summarization have primarily been for indicative and extractive summarization. We also note a lack of evaluation, especially in the most recent years. We discuss in further detail the methods used for summarizing clinical data, along with the open research questions present in each of the summarization steps. 19
34 Summarization approach Input Output Evaluation Deployed (when is it generated) General Notes NUCRSS (Rogers and Extraction of Real An 8 page Laboratory study with Yes Early example of a Haring 1979; Rogers, clinical structured summary of: medical students and (each summarizer Haring, and Watson variables, EHR data Problem list, Vital physicians showed patient One of the few summary 1979) indicative signs, Cardiac- significant time savings and visit) evaluations that demonstrate pulmonary-renal increased accuracy an impact on quality of care diagnoses, and process outcomes. Treatments, Randomized controlled trial The study found that the use 19 Routine showed that the NUCRSS of the summarizer was able specialized improved process level to reduce patient s length of laboratory (patient s length of stay and stay and increase the amount examination, increased the amount of of laboratory tests that were Suggestions to laboratory tests ordered) ordered (perhaps because physicians outcomes and may have summarizer was able to regarding patient improved care. remind clinicians of all the care patients conditions that need monitoring).
35 STOR (O Keefe and Extraction of Real Loosely Clinical study found that Yes Early example of a Simborg 1980) clinical structured customizable, clinicians were better able to (each summarizer variables, and summary which predict their patient s future patient One of few examples of task- indicative unstructured included both symptoms and laboratory visit) based evaluation EHR data time- and test results when the using The summary is context- problem- oriented medical record in addition dependent on the patient, but views to STOR as opposed to just the context is manually the medical record. determined by the clinician (what problems are active, what observations are 20 relevant, etc.) Powsner and Tufte Extraction of Simulated A one page None No A widely referenced (Powsner and Tufte psychiatric structured, summary that prototype that continues to 1994; Powsner and variables and unstructured visualizes the serve as a model for current Tufte 1997) recent notes, and most salient EHR visualization and indicative genealogy content (as summarization applications. data defined by recency) of the patient record. Lifelines (Plaisant et al. Extraction of Simulated Holistic The original Lifelines No Lifelines is probably the most
36 1996; Plaisant et al. clinical structured interactive patient application was evaluated well-known summarizer tool. 1998) variables, data summaries using a for work with juvenile youth The display has served as a indicative temporal data records(plaisant et al. 1996) model for future timeline- view on top of the by a small group of users view clinical summarizers raw EHR data. who reported enthusiasm Displays facts as but mentioned potential Lifelines2 was created for lines on graphic biasing by the system s research and examining many time axis graphics. patients together. according to their temporal location 21 and categories/signific ance are represented by color and thickness. CliniViewer (Liu and Extraction of Real Combined NLP The system was able No One of the first examples of Friedman 2004) concepts from unstructured techniques and evaluated on accuracy and summaries created using text, indicative EHR data presented a tree speed using real discharge NLP view of a patient s summaries but no Allows for customizable user
37 problems evaluation with clinicians views extracted from the was conducted. Works on top of the MedLEE narrative text to (Friedman et al. 1994) NLP the clinician. engine which handles Displays concepts modifiers in context when clicked. IHC Patient Worksheet Extraction of Real 1-2 page A retrospective cohort study Yes (each One of the few example of a (Wilcox et al. 2005) clinical structured outpatient found that compliance with patient clinical outcome tested in the variables, EHR data summary of: HbA1c testing was higher visit) evaluation 22 indicative demographics, for patients who had a problems, worksheet printed than for medications, those who didn t. laboratory tests, actionable advisories CLEF (Hallett and Scott Abstraction from Simulated An interactive None No One of the few natural 2005; Rogers, Puleston, text and structured display of both language generation systems and Rector 2006; extraction of and navigational created for medical histories. Hallett 2008) clinical unstructured capabilities for the Represents histories as a
38 variables, cancer EHR (indicative) semantic network of events indicative patient data. and generates organized temporally and textual summaries semantically. (abstractive) to Lists requirements that are enhance very relevant to general comprehension. designers of clinical It uses summaries the list was information generated via initial extraction requirements elicitation techniques to process. 23 identify classes of Uses a logical model of data and relationships between them. cancer history KNAVE-II (Shahar et Abstraction and Real Interactive data A crossover study compared No Performs semantic, temporal, al. 2006) extraction of structured display of KNAVE-II with paper and context abstraction. clinical data on bone abstracted and charts and Excel Requires Domain-specific variables, marrow raw protocol- spreadsheet. ontologies. informative transplant based care data Users produced quicker Consists of a knowledge patients containing a tree- answers, had somewhat base, abstraction generator,
39 browser and time better accuracy and navigation engine, and chart. preferred KNAVE-II visualization. however it did not achieve a Lists 12 desiderata for very high system usability interactive, time-oriented score. clinical data that should be used to guide future summarization work as well. BabyTalk (BT-45) Abstraction of Real raw Automatically A laboratory study found No A novel example of (Hunter et al. 2008; van ICU data neonatal generated natural that human-generated text summarizing graphical ICU der Meulen et al. 2010) streams, ICU data language to summaries of ICU streams information by generating 24 informative streams describe ICU data helped nurses predict their text. streams for easier patient s trajectories better. comprehension by The team is working to the nursing staff. create automatically generated text summaries that perform as well as human-generated summaries. Were et al. (Were et al. Extraction of Real Patient summary A pre-post study design Yes A largely successful process 2010) clinical structured for use in an HIV using time-motion study (each outcome.
40 variables, EHR data clinic in Uganda techniques and surveys. patient indicative from The authors found that visit) Explores the utility of OpenMRS providers who used the summaries in a low resource summary sheet were both setting. able to spend more time directly with their patients and the average length of visit was reduced by 11.5 minutes. Timeline/AdaptEHR Abstraction from Real An interactive A pilot study on Timeline No Timeline had manually coded 25 (Bui, Aberle, and text and structured, data display that found that although the rules while AdaptEHR aims Kangarloo 2007; extraction of unstructured summarizes and initial learning curve was to automatically infer rules Bashyam et al. 2009) clinical and image integrates various high, with time, the and relationships from variables, data on pieces of the EHR clinicians were able to ontologies and graphical informative brain tumor including images perform image review models, the publication states patients and free text. quicker and were more that the conditional confident in their clinical probability tables are not yet conclusions than when they defined. used the EHR display Has four dimensions of representing data: time space
41 (where is the physical location of the tumor), existence (certainty), and causality (response to treatment) HARVEST (Hirsch et Extraction of Real A problem-based, A task-based, time Yes (real Aggregates information from al. 2014) concepts from structured interactive, evaluation found no time) multiple care settings. text and clinical and temporal difference in ability to Operates on top of a variables, unstructured visualization of a extract, compare, synthesize commercial EHR system indicative EHR data longitudinal and recall clinical using HL7 messages. 26 patient record. information when using Distributed computing HARVEST in addition to infrastructure to enable real- the EHR, when carried out time summarization. with subjects who had no prior experience with the summarization tool Table 2.1 A sampling of clinical summarization applications. The table is organized by publication date. The inputs, outputs, methods, and evaluation strategies are listed along with notable additional information for each summarizer.
42 2.2 Methodological challenges to EHR summarization The following sections present some unsolved challenges in clinical summarization. A conceptual framework proposed by Feblowitz et al. (Feblowitz et al. 2011) defines a set of actions that successful summarizers should accomplish with raw information: Aggregate, Organize, Reduce/Transform, Interpret, Synthesize. We discuss methodological challenges with automated summarization within the context of this framework. Specifically, - To successfully aggregate disparate clinical data sources, the ability to recognize and account for similarity is imperative. Such similarity occurs at different levels within narratives: from word-level similarity to concept to statement-level; as well as in other data types and across. We focus our discussion on textual similarity. - The organization and interpretation of the aggregated data requires extraction and reasoning over clinical events and their temporality. We examine extraction of temporal information from text along with representation and reasoning over clinical events. - The organization and interpretation of the aggregated data also requires that missing data points be accounted for. Patients are sometimes seen with predictable regularity but are most often seen at erratic intervals. Missing data points are often filled in by imputation, adding missing data indicators, deleting information with missing data, or other strategies. - In the reduction and transformation of data and its synthesis, it is critical to decide which pieces of information are important and must be contained in the summary. Some methods for automatically detecting importance have relied on linguistic structure while others use probabilistic modeling techniques. - To provide context for interpretation and synthesis of clinical data, it is useful to employ existing knowledge and create rules for the summarization. Knowledge-based heuristics often provide a way to specify time constraints, concept relationships, and abstractions. 27
43 - Finally, to successfully implement summarizers into clinical care, challenges of deployment need to be addressed. Because in vendor EHR systems there are limited opportunities to deploy innovative and experimental technology, there have been few attempts to translate patient record summarization systems into the clinic; however, to demonstrate utility, it is imperative to implement and study clinical summarization tools in the real world care setting Identifying and aggregating similar information We review approaches to identifying and aggregating similar information on three different levels of language abstraction: words, concepts, and statements, as investigated within and outside the field of clinical summarization. Word-level Similarity In clinical NLP, much work has been devoted to identifying lexical variants that are similar in meaning (Friedman and Elhadad 2014). The Unified Medical Language System (UMLS), an agglomeration of different biomedical terminologies (Lindberg, Humphreys, and McCray 1993), for example, provides essential knowledge towards that goal by grouping words into concepts. The UMLS aggregates terms from different vocabularies and maps them to semantic concepts, each labeled with a Concept Unique Identifier (CUI). For instance, the terms MI, myocardial infarction, and heart attack all share lexical similarity, and map to the same underlying CUI. Within clinical summarization, normalization of words to concepts has only recently been investigated (Hirsch et al. 2014; Zhang et al. 2011). An alternative, and most common approach in clinical summarization, is to identify word-level similarity by finding redundant strings of words. Patient records often contain redundant spans of text this can be explained by the fact that documentation is often formulaic but also by the common habit of clinicians to copy and paste text from one note to another (Hirschtick 2006). Multiple different automated methods have been employed to identify copy and pasted words within clinical notes. A plagiarism detection tool called CopyFind has been used to identify overlapping phrases in input texts (Thornton et 28
44 al. 2013). More recently, global (Wrenn et al. 2010) and local (Zhang et al. 2011; Cohen, Elhadad, and Elhadad 2013) bioinformatics-inspired alignments have been proposed for identifying redundant sections along with language modeling techniques for assigning probabilistic similarity scores for phrase pairs (Zhang et al. 2011). Concept-level Similarity Concept-level similarity represents a more abstract level of similarity than similarity between words and strings. For instance, the concepts epilepsy and seizure despite being two different UMLS concepts share much semantic similarity when conveyed in a patient record. In certain well-defined domains, clinical summarization approaches have relied on aggregating concepts, helping further the goal of synthesis (Shahar et al. 2006; Hsu et al. 2012) primarily through well-defined ontologies. For broader domains, how to identify that two semantic concepts are similar enough to be aggregated remains an open question. Furthermore, in text processing, mapping from words to concepts remains difficult because of the strong ambiguity of language (Friedman and Elhadad 2014). Detection of semantic redundancy has been investigated through two approaches: knowledge-free and knowledge-based. Knowledge-free similarity metrics have been developed for textual input. They rely on Harris 1968 hypothesis which stipulates that concepts that appear in similar contexts are similar (Harris 1968). In practice, concepts are compared in a vector space, where each concept is a vector representing the context in which the concept typically occurs. This method has been implemented multiple times in the clinical domain to identify similar UMLS concepts (Pedersen et al. 2007; Patwardhan and Pedersen 2006; Pivovarov and Elhadad 2012). Knowledge-free approaches are attractive when there is little ontological knowledge available. Alternatively, knowledge-based methods leverage existing resources to determine the similarity of two concepts. For instance, if the two concepts are present in an ontology, similarity can be assessed through the structure of the ontology. Other knowledgebased methods include examining similarity of the two concepts definitions. We refer the reader to detailed reviews of concept-based similarity (Pedersen et al. 2007; Pesquita et al. 2009). We discuss our hybrid methodology for finding similar concepts using knowledge-free, knowledge-based, and 29
45 ontological definitions in Chapter 3. However, despite the active research on this topic, these conceptlevel similarity methods have not been yet translated to most clinical summarization systems. Statement-Level Similarity A pervasive aspect of a patient record is the high level of statement redundancy across notes. For instance, two pathology reports for a given patient share many similar statements. Beyond the formulaic nature of documentation, statement-level redundancy also occurs because of copying and pasting from previous notes with some minimal editing of the copied statements. In clinical summarization, there has been little work on this important aspect of similarity identification. Recently, a topic modeling approach was proposed to identify and control for such redundancy across patient notes (Cohen et al. 2014). In the general NLP community, identifying statement level similarity has been studied through the tasks of paraphrasing identification and textual entailment (Androutsopoulos 2010). Many of the methods in text summarization for identifying both unidirectional (textual entailment) and bidirectional (paraphrasing) similarity employ a hybrid of methods for word-level and concept-level redundancy such as string similarity, logic-based methods, and contextvector (Dagan et al. 2010). Along with the need for higher order language similarity work in the clinical domain, there is an ongoing push to personalize similarity detection. It is well established that semantic similarity is contextdependent (Janowicz 2008) and a recent study suggests that redundancy be examined as a function of the patient s previous history (Farri 2012). While identification of similar contexts based on the patient s health is an ongoing direction of research (see Chapter 3), there is further work to be done in identifying context-specific similarity on higher-order semantic levels. Identifying similar words, concepts, and removing redundancy by patient-tailored information aggregation is an important direction for future EHR summarization methodology. 30
46 2.2.2 Organizing and reasoning over temporal events Patients health evolves on many different time scales. Some health events such as pneumonia present themselves sporadically while chronic conditions like diabetes develop and worsen over a period of years. The importance of presenting clinical data in a time-dependent fashion has been recognized for a long time (Fries 1974; Cousins and Kahn 1991; Samal et al. 2011) however accurate temporal representation remains an open problem (Zhou and Hripcsak 2007; Sun, Rumshisky, and Uzuner 2013; Wu et al. 2014). Automatic creation of a clinical data timeline from textual and structured clinical records requires temporal event extraction, ordering, and reasoning. Temporality is an active research area in the genre of news summarization given the quick news cycle and fast-paced evolution of news stories (Allan, Gupta, and Khandelwal 2001). However, news summarization research cannot always be readily translated into the health domain, as the challenges in health data are unique (Combi and Shahar 1997; Cios and Moore 2002). For example, different note types and specialties have different temporal relationships: pathology reports are often about one moment in time without reference to historical ailments whereas discharge summaries describe an entire inpatient hospital stay and instructions for future care. Styler et al. identified four complexities with extracting temporal information in clinical data: (i) diversity of time expressions, (ii) complexity of determining temporal relations among events, (iii) the difficulty of handling the temporal granularity of an event and (iv) general NLP issues (Styler, Bethard, and Finan 2014). After the extraction of event time, there is a need for performing relative temporal ordering (Savova, Bethard, and Styler 2009). Event ordering is difficult in part due to inexact wording, but also because clinical knowledge is often needed to infer how long conditions may last (e.g., a diabetes diagnosis is often not discussed at every visit but a clinician is aware that diabetes is a chronic condition, not an intermittently reoccurring condition each time the diabetes term is mentioned or the diabetes ICD-9 code is recorded) (Hripcsak et al. 2009). Some recent work in event ordering includes the representation of temporal disease progression separately for each problem by Sonnenberg et al., an 31
47 approach they call clinical threading (Sonnenberg et al. 2012) and frame-like semantic representations with rule-based temporal extraction to arrange problems on a timeline (Jung et al. 2011). Raghavan et al. identify and temporally order cross-narrative medical events across documents in clinical text using weighted finite state transducers (Raghavan et al. 2014). Reasoning and abstraction of extracted clinical events to highlight disease progressions and trends is critical for creating succinct clinical summaries. Abstractions of temporal data can include combining events within a certain time frame and performing interval-based abstractions such as combining multiple chemotherapy drug mentions into a chemotherapy regimen time span (Klimov, Shahar, and Taieb- Maimon 2010) or reasoning about the length of time that symptoms lasted and their relation to diagnosis (Zhou, Parsons, and Hripcsak 2008). The questions of which events should be combined and what an appropriate time frame is remain difficult and currently resolved by leveraging clinical knowledge and ontologies. Time-dependent clinical summarization is a continuingly evolving research area and there is opportunity for automatically identifying, accurately ordering, and performing reasoning over temporal clinical events Accounting for and interpreting missing data Clinical records are sparse: documentation only occurs when a patient is seen by a clinician, thus clinical records miss the overwhelmingly large amount of observations about a patient across their lifetime. When summarizing sparse data, a critical complication is how to interpret and reason over the missing data (Wells et al. 2013). In some cases, missing data is not important and can safely be ignored by a summarization system (e.g., a patient has no change in health status in between visits). In other cases, the presence of missing data hints at a salient aspect about the patient that needs to be highlighted within the summary (e.g., patient is too sick to come to their visit). How to interpret and determine the salience of missing data is a challenge, and one not investigated thus far in clinical summarization. In the field of general statistics, there are three types of missing data: Missing Completely at Random (MCAR), Missing at Random (MAR), and Missing Not at Random (MNAR) (Little and Rubin 32
48 2002). Most techniques for dealing with missing data assume that data are MCAR or MAR distributed, and include (i) variations of complete-case analysis, where only data with no missing values are used, (ii) single imputation, where missing data are imputed based on the values observed (using the mean, median, linear interpolation, etc.), and (iii) likelihood-based methods which compute maximum likelihood estimates for missing data (Enders 2006). In the clinical domain, there is mounting evidence that most of the data are MNAR (Lin and Haug 2008; Pivovarov et al. 2014). For these data, the missingness is informative, meaning that there is an underlying reason that the data are missing but that this reason is simply unobserved. Some techniques that use informative missing data properties to infer properties about clinical data have been proposed. Chapter 4 of this dissertation presents our work on identifying patterns of missing data and using them to help infer healthcare status of patients. A common way of using missing data in the clinical domain has been to look at how long values should last based on recorded measurements or documentation frequency. For example, laboratory test measurements have been studied to gather appropriate imputation time (Hug 2006) and to infer health status features (Weber and Kohane 2013). Van Vleck studied duration and persistence of problems in notes (Van Vleck and Elhadad 2010) as a function of missing data, while Klann (Klann and Schadow 2010) and Perotte (Perotte and Hripcsak 2013) both studied the duration of ICD-9 codes. Klann estimated the durations for which each ICD-9 code remains valid and Perotte automatically classified ICD-9 codes into chronic and acute conditions. The modeling work that most explicitly demonstrates informativeness in missing data examined the accuracy of prediction models when: (i) ignoring missing data, (ii) interpolating missing data, or (iii) incorporating a missing data indicator, and reported that the missing data indicator method performed best (Lin and Haug 2008). To properly provide context and infer trend lines, as demonstrated by Poh and de Lusignan for kidney disease data (Poh and de Lusignan 2011b; Poh and de Lusignan 2011a), or to make predictions in clinical summaries it is critical to incorporate missing data literature and techniques into summarizer applications. The utility of modeling missing data explicitly is clear, however this conclusion is not being translated into clinical summarization research yet. 33
49 2.2.4 Reducing information to only the most salient Salience identification has been heavily researched in the general domain text summarization literature. Early methods for identifying important topics relied on counts: frequency (Luhn 1958) and term frequency-inverse document frequency, which corrects for word specificity (Jones 1972). Other methods have focused on structure, such as document structure (Edmundson 1969) or syntax structure (Marcu 1997) to identify important phrases. Syntactic information gleaned from the input document can identify which parts of a sentence are salient and which may be safely removed from a summary (e.g., a relative clause). It is unclear, however, how these approaches translate to the clinical domain, where syntactic structure is unconventional. Using prior knowledge of the input document structure (e.g., biomedical papers have an introduction, followed by a methods section) to weigh the salience of information pieces based on where they are conveyed in the document is, however, promising in the clinical domain (yet not investigated thus far). Clinical notes follow a pre-specified structure; a diagnosis mention might be more relevant when conveyed in the past medical history than in the family history for instance. A different method for salience identification, still within the general domain summarization field, leverages discourse by considering sentences in input documents through a network, where lexical similarity between sentences is represented by the network edges. In this representation, salient sentences are the ones with the highest centralities (Radev, Jing, and Budzikowska 2000; Erkan and Radev 2004). An alternative method for identifying relevant information relies on probabilistic modeling techniques such as Hidden Markov Models for identifying topics and topic changes in a set of documents (Barzilay and Lee 2004) or hierarchical Latent Dirichlet Allocation (LDA)-type models for identifying novel information with respect to older documents (Delort and Alfonseca 2012). Our work on employing Bayesian learning techniques to the construction of effective automated summaries is described in Chapter 5. The one type of salience detection that has been explicitly studied in the clinical domain is based on cue phrases. Cue phrases are pieces of text that signify that what follows is likely to be important. For 34
50 example, In conclusion often precedes an important summarizing statement (Edmundson 1969). In clinical documentation, de Estrada et al. developed a system called Puya that found cue phrases indicating normality or abnormality in the physical exam sections of notes (de Estrada, Murphy, and Barnett 1997). Another way of detecting salience relies on n-gram language modeling to identify the most recent information in the record, under the assumption that the newest information is the most salient for the provider to see (Zhang, Pakhomov, and Melton 2012; Zhang 2014). A visualization prototype used this n- gram model to automatically highlight text that was found to be novel, drawing the provider s attention to the new findings (Farri et al. 2012). Defining salience in an operative fashion for automated summarization is an open question. In the general domain, there is evidence that humans sometimes disagree about what pieces of information are indeed salient, and that salience is often task-specific (Nenkova and Passonneau 2004). Similarly, in the clinical domain, determining what is important for a clinician is also probably quite task-specific. Nevertheless, it is safe to say that salience of elements in the patient record is related to capturing the health status of the patient and how it changes through time (Farri 2012; Suermondt et al. 1993). How to do so automatically, that is how to link textual and individual raw low-granularity observations to highlevel clinical abstractions is one of the paramount challenge of informatics research. For instance, there has been little formal investigation of clinically specific markers of importance such as absolute change of a laboratory test value, the rate of change, the rate of mention of a particular concept, and other importance cues Using existing clinical knowledge The informatics community has invested enormous effort into codifying clinical knowledge in a variety of terminologies and ontologies. This knowledge representation effort has been successful in helping efforts like phenotyping combine terminological knowledge, expert reasoning, and machine learning to create actionable disease definitions (Pathak, Kho, and Denny 2013). Similarly in summarization work, it is important to make use of these available clinical knowledge representations and 35
51 use them to generate rules and heuristics. Chapter 5 examines our efforts to incorporate coded clinical knowledge into an unsupervised, data-driven automated summarization engine. Several holistic summarization efforts leveraged terminologies to identify concepts that are semantically related (e.g., medications that treat particular conditions) (Klann et al. 2013) or rules to determine salience (e.g., identify and highlight the salient results that are abnormal) (Plaisant et al. 1998). However, summarization engines built for particular diseases benefit most often from manually crafted rules and disease-specific knowledge bases as they enable tailored, task-dependent systems. The KNAVE-II application (Shahar et al. 2006), created for synthesis of bone marrow transplant patients, relies on an expert-maintained knowledge base for creating a semantic navigation system and concept abstraction. The Timeline system (Bui, Aberle, and Kangarloo 2007) is also built on a manually coded set of rules which identify salient concepts for different diseases, and perform temporal event reasoning. In addition, summaries that are setting and user specific often use expert-driven rules to ascertain which pieces of data should be shown at which time and to whom. Although the incorporation of clinical expertise into summarization is often a laborious process and sometimes only covers specific domains of expertise, it provides critical help in addressing some of the similarity, temporality and salience challenges. Of relevance to this review, we note that while existing summarizers rely on established knowledge resources, there is an active field of research to create these resources either by translating clinical expertise or acquiring the resources from data (Noy et al. 2009; Mortensen et al. 2012; Tao et al. 2013) Deploying summarization tools into the clinic The ultimate goal of any clinical summarization tool is implementation and usage by clinicians at the point of care. To date, however, there has been no widespread adoption of automated summarizers, especially for the large holistic temporal summarizers (Samal et al. 2011). Pervasive deployment is often hindered by the commercial EHRs systems that have been adopted across the country. Building real-time computational tools to work atop commercially built EHR systems is still a daunting task as these vendor 36
52 EHR systems are often not built to support interaction with outside applications. In addition, as the systems are closed off, dissemination of summaries across different hospitals and EHRs is a challenge as well. However, there is promising work with the i2b2-smart platform that enables easier translation across institutions; researchers have developed a system to automatically link different data types across the EHR (mainly diseases and medications) and display a newly organized view of the patient record (Klann et al. 2013). To create meaningful and practical summaries that assist clinicians during their point of care needs, summarizers need to provide real-time information with patient record updates immediately available in the summary. This is an especially difficult task when the summary tool works with natural language, as the processing must be completed quickly and accurately. Current work with distributed infrastructures, like Apache Hadoop, provides promising results for immediate summarization (Hirsch et al. 2014). Another large barrier to translation of summarizer research into the clinical domain is rigorous evaluation. Hospitals often call for evidence of a useful summarizer before investing expensive resources into the implementation of the summarizer, but without adoption a summarizer is extremely difficult to evaluate. As is clear from Table 1, clinical summarization literature lacks standard evaluation metrics and there are very few extrinsic evaluations, a similar finding to a review of biomedical literature summarization by Mishra et al. (Mishra et al. 2014). Given the restriction of limited adoption, it is not clear on which dimensions clinical summarizers should be evaluated. Initially, in order to avoid costly development and implementations with marginal benefit, it is imperative to study the need for a summarizer tool, context of usage, and clinician workflow. However, without eventual implementation into clinical care, showing any process- or health-level outcomes is not possible and therefore how to perform useful evaluations remains unclear: should, for instance, summarization systems focus on accurate information extraction, facilitating information exploration (e.g., which concepts are most relevant to the clinician), or user-friendly designs? Although the rigorous user-interface and cognitive process evaluations that are necessary for creating new summarization systems often require deployment and study of actual use in practice, there exists guidance in the literature on cognitive aspects of clinical 37
53 reasoning that can inform summarization system creation. Prior work on general medical cognition (V. L. Patel, Arocha, and Kaufman 2001), clinical decision-making (Arocha, Wang, and Patel 2005; Kushniruk 2001), human-computer interaction for interface design (Patel and Kushniruk 1998; Jaspers et al. 2004; Thyvalikakath et al. 2014), handoff communication (Abraham et al. 2011; Abraham et al. 2014), clinical workflow analysis (Militello et al. 2014; Unertl et al. 2009) and some recent qualitative work specifically on clinical document synthesis which has identified common cognitive pathways for EHR document synthesis (Farri 2012) and patterns of EHR data access (Reichert et al. 2010) can guide the development of summarization systems. However, we emphasize that without actually studying the clinical context and manner in which clinicians use summarizers (either in the laboratory with prototype systems or in the clinic with deployed systems), it will be challenging to develop better evaluation strategies and better summarizers. 38
54 Chapter 3: Contextual Redundancy Removal in 3.1 Introduction to Similarity Detection Clinical Notes 2 A standard way of approaching unstructured biomedical texts, such as patient notes written by clinicians, is to map mentions of biomedical terms, like symptoms and disease names, to semantic concepts in structured and standardized nomenclatures. The mapping helps group all lexical variants of the same biomedical concept under a unique semantic representation, thereby abstracting away from stylistic differences. For instance, the terms heart attack, myocardial infarction, and MI are all mapped to the same concept in UMLS. However, most biomedical ontologies and terminologies are designed based on a fine-grained organization of semantic concepts. As a result, when mapping term mentions in a text to semantic concepts, all too often semantically similar terms are mapped to different 2 Most of this chapter was originally published in the Journal of Biomedical Informatics. The full citation for this publication is: Pivovarov R, Elhadad N. A Hybrid Knowledge-Based and Data-Driven Approach to Identifying Semantically Similar Concepts. J Biomed Inform. 2012;45(3)
55 concepts in the ontology. When the concepts are fed to data mining or pattern recognition analyses, this ontological granularity can result in problems of signal dilution (Popescu and Xu 2009). To enrich the sparse datasets and thus enable meaningful analysis, concepts that are semantically similar can be aggregated. The evaluation of whether two concepts are semantically similar enough for aggregation is often highly dependent on the context of the study itself (Dong, Hussain, and Chang 2010). For example, concepts such as obese and morbidly obese can be merged when studying Huntington s Disease, but should remain separate when investigating predictors for heart attack. In this chapter, we examine the problem of concept aggregation in the context of a clinical datamining task. We assess the value of corpus-driven and knowledge-driven methodologies to compute a similarity score for concept pairs. To evaluate similarity within a specific situation we rely heavily on context-specific data. Initial similarity calculations are compiled on a homogenous set of clinical notes, emphasizing the contextually dependent and corpus-driven methodology as a first step. The further refinement of the corpus-based measure is created on two types of ontological knowledge (path length and definitional word overlap), both aiming to differentiate related from semantically similar concept pairs. We evaluate the different methods, including a hybrid score that averages the three measures, on a large dataset of concepts. This work fits primarily within the field of clinical informatics with the goal of defining a comprehensive way to enrich the analysis of unstructured data located in EHRs. 3.2 Related Work on Similarity Detection It has been shown that people generally agree upon the notion of similarity or relatedness between ideas (Pakhomov et al. 2010; Tversky 1977). As a result, there has been a large effort across various disciplines, including natural language processing (Rada et al. 1989; Androutsopoulos 2010), and biomedical informatics (Benabderrahmane et al. 2010; Verspoor, Dvorkin, and Cohen 2009; Elhadad and Sutaria 2007; Pedersen et al. 2007), to create automated methods that can find semantically similar concepts. Much of the research focuses on the identification of both similar and related concepts. Relatedness indicates a semantic association between concepts, such as ear and nose, while similarity 40
56 specifies that two concepts can be used interchangeably (Budanitsky and Hirst 2005). The focus of this work is on similarity. Therefore, although many interesting methods have been published on relatedness identification, they are outside the scope of this chapter Methods for Semantic Similarity Calculation Methods developed to identify semantic similarity among concepts fall loosely into two categories knowledge-based (edge-based and syntactic) and corpora-based (distributional semantics), where information-content-based measures can span both. In this section, we review previous work with specific emphasis on the methods we later use for comparison (and are included in the publicly available UMLS-Similarity package) (McInnes, Pedersen, and Pakhomov 2009). Edge-Based Many methods have been developed for a hierarchical interpretation of similarity, based on the location of the concepts in an ontology and the paths among them. Some of the most common methods rely on edge counting, shortest path, and ontological depth (Rada et al. 1989; Caviedes and Cimino 2004; Leacock and Chodorow 1998), while others add the least common subsumer (LCS) to capture the granularity of a concept in the ontology (Wu and Palmer 1994; Al-Mubaid and Nguyen 2006). More recent advances have incorporated into similarity computation the distance to the LCS, assigning weights to the different path types (ontological depth, distance from concepts to LCS) (Matar and Egyed- Zsigmond 2008), as well as all of the superconcepts between two terms as a way to account for multiple inheritances (Batet, Sánchez, and Valls 2010). We list a few of them below. Conceptual Distance (CDist) (Caviedes and Cimino 2004) sim cdist (C1,C2)= shortest_path(c1,c2) (1) Leacock and Chodorow (lch) (Leacock and Chodorow 1998) sim lch (C1,C2)=-log( shortest_path(c1,c2) /(2*depth(ontology))) (2) Wu and Palmer (wup) (Wu and Palmer 1994) sim wup (C1,C2)=2*depth(LCS)/(depth(C1)+depth(C2)) (3) 41
57 Al-Mubaid and Nguyen (nam) (Al-Mubaid and Nguyen 2006) sim nam (C1,C2)=log(( shortest_path(c1,c2) -1)*(depth(ontology)-depth(LCS))+2) (4) Information-Content (IC) Based IC-based methods aim to create measures that incorporate the specificity of a concept within a similarity calculation. The IC calculation is based on the concept and all of its descendants frequencies within a corpus of texts. The original measure proposed by Resnik evaluated the information shared by two concepts by measuring the IC of their LCS (Resnik 1995). As the Resnik measure can assign perfect similarity to any two concepts that share the same LCS, two other measures were proposed by Lin (Lin 1998) and Jiang and Conrath (Jiang and Conrath 1997). They also take into account the IC of the concepts themselves, Lin using ratios and Jiang and Conrath using subtraction. More recently, Pirro and Seco devised a similarity measure founded on the idea of intrinsic IC which quantifies IC values by relying on the structure of an ontology itself as opposed to a separate corpus (Pirro and Seco 2008). Distributional Semantics Distributional semantics follow the assumption that the meaning of a target word or concept can be acquired from the distribution of words surrounding it, as a whole over its many mentions in a collection of texts. Thus, similarity between two concepts can be quantified according to the amount of overlap between their overall contexts. Here, by context, we are referring to a weighted count of all the words in the sentences surrounding all the instances of a concept. Distributional semantics have been applied to several problems in biomedical informatics (Cohen and Widdows 2009). The distributional semantics methodology represents an abstraction of patterns over a larger corpus, where individual mentions of terms are agglomerated to derive an overall pattern of usage. As the abstraction occurs over many mentions and the words in the vocabulary are weighted (typically tf-idf weights), individual negations and other modifiers all contribute to the salient textual patterns present in the corpus. As distributional semantics allow us to compare two concepts in their usage and thus assess their semantic similarity, 42
58 conversely, such a representation can help perform word sense disambiguation as different senses of a word will appear with different words and phrases surrounding them. The work of Pedersen et al. forms the basis of our context-based similarity measure (Pedersen et al. 2007). Pedersen et al. calculate similarity based on patterns of usage in text with the help of a context vector (which in their case, relied on the Mayo Corpus of Clinical Notes). Each concept of the corpus is represented as a sum of all word vectors that map to the concept, each of dimension the size of the vocabulary. The vector representing word w at index t is the number of times w and t co-occur in the same line of a note in the corpus. The similarity between two concepts is then computed as the cosine similarity between their corresponding context vectors. Pedersen found that the ontology-independent Context Vector measure is at least as effective as other ontology-dependent measures (Pedersen et al. 2007). Our note-based similarity approach differs mainly in the type of corpus we employ to derive the context vectors. Furthermore, we investigate to which extent this method and ontologically based methods, previously used independently of each other, can be used in complement. Definitional The idea of relying on the content of word definitions for assessing appropriate word senses was original proposed by Lesk (Lesk 1986). The Lesk algorithm selects the sense of a word in a text, which has the highest word overlap between its definition and its context in the text. Banerjee and Pedersen (Banerjee and Pederson 2002) adapted this method further using WordNet and essentially reversed the methodology for the assessment of semantic relatedness (they also added WordNet hyponyms into the computation). Given the Lesk measure, which identifies overlaps in the extended definitions of the two concepts, the relatedness score is defined as the sum of the squares of the consecutive word overlap lengths. A similar methodology was employed by Hamon and Grabar in the biomedical domain (Hamon and Grabar 2008). Other Methods Other published measures include similarity calculations between sets of concepts (Cordí et al. 2005), weights of different features in Gene Ontology (GO) (Benabderrahmane et al. 2010), and a 43
59 nonlinear model that is a function of various ontological features such as path length, depth, and local density (Li, Bandar, and McLean 2003). Alterovitz et al. implemented an information-theoretic technique to gauge similarity of GO terms and identify ontological inefficiencies (Alterovitz et al. 2010). Additionally, Rodriguez and Egenhofer focused on hybrid methods that compute both over term definitions and various hierarchical attributes such as features and neighborhoods. Petrakis et al. (Petrakis et al. 2006) refined the methodology further to compute neighborhood similarity Context-Aware Computing The notion that the context surrounding information is important is not a novel one and many have thought about applying it in the medical context. Specifically, applications have been developed to facilitate context-aware data mining that would help provide background when evaluating the similarity of the data mining results (Singh and Vajirkar 2003). Others have devised methods to convert traditional similarity measures into contextually dependent ones. Wu et al. propose a method in which given a similarity measure and a training set they are able to create a new distance function using the kernel trick (Wu, Chang, and Panda 2005). Dong et al. describe a method of ontological conversion designed to take context into account (Dong, Hussain, and Chang 2010). Other work has looked at the various types of context and how they affect similarity judgments specifically in the case of geospatial IR (Janowicz 2008; Kessler, Raubal, and Janowicz 2007). Most of these context measures are created to enhance personalization across information retrieval systems where the context consists of user, system, and background information. Our method is designed to incorporate an aggregate disease context over many patient records to create disease-specific similarity calculations. 3.3 Method for identifying similar concepts Our composite methodology consists of three complementary similarity measures (Figure 3.1). One primary measure is context-based and relies on distributional semantics of patient notes authored by clinicians, while the other two are knowledge-based and rely on concept definitions and their 44
60 relationships in the SNOMED-CT ontology. Starting from a homogenous corpus of notes (i.e., notes about patients who share at least one clinical problem), notes are pre-processed to extract concepts mentioned in the corpus. A three-way filter is applied to prune out the extracted concepts and keep a homogeneous set of concepts to be aggregated. The context-based similarity ranks all pairs of concepts. The top-k pairs with the highest context-based similarity are then reordered using the two knowledgebased similarity measures. This section describes the dataset and its pre-processing, the filtering of concepts, the three measures, and the experimental setup for our experiments. Homogenous set of patient notes Extract concept pairs All concept pairs found in the notes CUI 1 CUI 2 CUI 2 CUI 3 CUI 1 CUI 3 Context-Based Similarity Pairs with higher than 75% notes similarity CUI 1 CUI 2 CUI 2 CUI 3 Knowledge- Based Similarity Definitional Ontological Pairs reordered with comprehensive similarity measure CUI 2 CUI 3 CUI 1 CUI 2 Figure 3.1 Our methodology for finding context-dependent similar concepts. An overview of the entire pipeline, beginning with a set of patient notes and ending with a ranked list of similar CUI pairs Data and Knowledge Sources Distributional similarity techniques assume that the meaning of a word or concept can be represented by the context in which it appears, across a large number of mentions. As such, the more frequent a concept is in a corpus, the more accurate its context will be at representing the meaning of the concept. Corpus selection is important a random sample of notes from a random sample of patients might provide a large set of concepts pairs for which to assess similarity, but the concepts might be too sparse and the resulting contexts might be misleading. Our corpus selection process follows. We chose to collect a homogenous and semantically coherent corpus of clinical notes, in order to ensure that concepts, which are clinically relevant to the patients, are likely to appear frequently enough. For this study, we collected a corpus of notes from patients with chronic kidney disease (CKD). The methods we employ are disease-independent, but the fact that we select notes from patients all with at least one condition in common allows us to identify and aggregate concepts frequently mentioned when documenting a particular set of patients. Furthermore, CKD is a prevalent condition in our institution, 45
61 thus allowing us to collect a large corpus of notes. Patients with CKD have many comorbidities and disorders, providing us with many different concepts to consider in our similarity computation. Using ICD-9 codes as evidence of CKD, all notes for CKD patients recorded between 1990 and September 2010 were extracted from the NYPH dataset. Each note was processed by our in-house NLP pipeline (Lipsky- Gorman and Elhadad 2011), which identifies document structure (section boundaries and headers, list items, paragraph boundaries and sentence boundaries) (Li, Lipsky-Gorman, and Elhadad 2010), performs shallow syntactic analysis (part-of-speech tagging and phrase chunking), and named-entity recognition of UMLS concepts through dictionary matches. The named-entity recognition in our corpus was performed using the 2010AA UMLS version and restricted to the SNOMED-CT terminology. The full pipeline was tested on a manually curated gold standard of 31 notes and yielded an F-measure of The pipeline processed a patient note in 0.26 seconds on average. The knowledge-based part of our similarity computation relies on the SNOMED-CT. SNOMED- CT is a terminology of clinical terms and is a primary resource for concept standardization in the clinical domain. SNOMED-CT is particularly useful for our purposes because it provides term definitions and synonyms, as well as semantic relations among concepts. The relationship types have very specifically defined attributes and lend themselves well to our ontological similarity measure. We utilize the concept definitions and synonyms encoded in SNOMED-CT for the definitional similarity. The version of SNOMED-CT we use in this study is from the July 31 st 2010 release and consists of over 292,000 active concepts, 760,000 concept descriptions and 824,000 inter-concept relationships Filtration Given the pre-processed corpus of CKD notes, we can extract a list of all mentioned concepts. In an effort to create a concise and unambiguous list of similar concept pairs, however, we perform a threetiered filtration step. The filtration relies on the concepts (semantic types), the structure of the notes (section types), and the note category (note types). 46
62 The concept filtration follows the hypothesis that two concepts are more likely to be similar if they belong to the same semantic group, whereas two concepts from different semantic groups can indicate semantic relatedness only. For example, it is unlikely that an anatomical concept is similar to a disorder, whereas it is possible that the disorder and the anatomical concept are semantically related (a stroke occurs in the brain, for instance). In practice, limiting the set of semantic types constrains the set of potential relationship types among CUIs, by reducing potential meronyms and focusing instead on hyponyms and metonyms (Elhadad and Sutaria 2007). In this study, we filter in all concept mentions that belong to the Disorder (DISO) semantic group, as defined by McCray et al. (McCray, Burgun, and Bodenreider 2001) The DISO group contains 12 3 out of the total 133 semantic types. We chose this group as it represents the types of concepts we are interested in examining (e.g., diseases, findings, and signs and symptoms), but the method is agnostic to the chosen semantic group(s). The section filtration s aim is two-fold: to ensure the pool of input concepts is homogenous and to mitigate the potential CUI mapping errors that occurred during pre-processing. To keep the list of input concepts homogenous and specific to the patients under study, we filter out concepts mentioned in the Family History section of the notes. The concepts mentioned in the Medication section are filtered out in an attempt to reduce pre-processing mistakes, arising from the ubiquitous medication abbreviations that are prone to erroneous UMLS mapping. Because our pre-processing pipeline does not perform wordsense disambiguation and keeps all possible CUI mappings instead, the input concept list to our similarity computation can contain incorrect concepts. For instance, mg, a common abbreviation in the Medication section of notes, which stands for milligram, is mapped erroneously to Madagascar, and Magnesium. 3 Acquired Abnormality, Anatomical Abnormality, Cell or Molecular Dysfunction, Congenital Abnormality, Disease or Syndrome, Experimental Model of Disease, Finding, Injury or Poisoning, Mental or Behavioral Dysfunction, Neoplastic Process, Pathologic Function, Sign or Symptom. 47
63 The note filtration operates at a higher level and selects the notes that contain the richest content for our purposes. Our initial corpus of CKD notes has more than 1,700 different note types (e.g. Primary Provider note, Cardiology Consult note, and Miscellaneous Nursing note). We identified the note types that had more than 60,000 occurrences of SNOMED concepts in the DISO semantic group over the entire set of patients. The filter helps producing a homogenous, focused list of input concepts, on which to compute pairwise similarities Note-Based Similarity The note-based similarity takes two UMLS CUIs as input and returns a similarity score defined as the cosine similarity between the two concepts context vectors (Manning, Raghavan, and Schütze 2008). The context vectors are derived from the filtered, pre-processed notes for each CUI. They have V elements, where V is the size of the vocabulary. In our experiments, the vocabulary consists of all stemmed words present in the filtered notes. Given a CUI c and a stemmed word w, the value of the context vector for c at index w is defined as the tf-idf value of w, when c and w occur in the same sentence over the input filtered notes. The tf-idf value is based upon the number of times c and w appear both individually and together. Note that our metric differs from previous work slightly, as we operate over sentences, as opposed to lines in the note (Pedersen et al. 2007). The note-based similarity is computed for all concept pairs. However, because highly infrequent CUIs have very sparse context vectors, which do not represent their context accurately, we only considered CUIs that occur more than five times in the input corpus. Calculation of note-based similarity for all CUI pairs on our corpus took 5.28 hours on a linux machine with CentOS core, 2.93GHz Xeon X5570 model, 24GB RAM, with a Hitachi 10,000 RPM drive. Following our hypothesis that contextual similarity is the basis for semantic similarity, concept pairs with high note-based similarity are kept as candidates for similarity, while all the other pairs are discarded. In our experiments, we set the threshold for note-based similarity at 75% which resulted in
64 CUI pairs. For instance, in the context of CKD patients, the concepts pairs (Muscle Injury, Traumatic injury of skeletal muscle) and (Acne, Common Acne) both have a cosine similarity above 75%, and are considered for further processing. The concept pairs with lower similarity scores are filtered out, such as (Localized mass, Nodule) and (Chronic Low Back Pain, Pain, NOS) which each have similarity scores in the low 50% Ontological Similarity We describe a novel method for semantic similarity using ontologically defined relationships. We look at the SNOMED-CT ontology as a flat terminology and concentrate on edge types rather than the hierarchy itself. With this view of SNOMED-CT we are able to look at all of the layers that consist of deleted, moved, and retired concepts. This was highlighted as important in the Dong et. al paper that stated: in an ontology environment, the types of relations are various, and relations can be defined by multiple restrictions. Obviously, the two factors cannot be ignored when computing similarity for ontology concepts. (Dong, Hussain, and Chang 2010) The method is based upon the types of relationships between concepts where the different types are broken down into three tiers. The tiers are defined by the characteristic and refinability features of SNOMED-CT relationships (Table 3.1) and used to group the relationships into ones resembling the most to least closely related. The tiers were used to define weights for various relationships types and the weights were chosen to reflect the strength of each relationship type. There seems to exist a natural hierarchy of relationship strengths that we chose to exploit in the method, such as the observation that non-refinable relationships are of a stronger nature than ones that are optionally or mandatorily refinable. In addition, the weights chosen reflect a system to ensure a score between 0-1 for each relationship type and to delineate between tiers, a twice-larger difference between tiers was introduced (.2) in comparison to the weight difference within each tier (.1). To reduce complications every term listed as both qualifier and defining (Associated Finding, Access, Priority, Clinical Course, Laterality, Associated Procedure, Using Device, Surgical Approach) was grouped in the Defining, Optionally Refinable tier and always given a.5 weight. The weights described 49
65 here can be tweaked to assess similarity alternatively or even a different semantic relationship; our main contribution lies in proposing a novel way to consider ontological path length calculations. Characteristic Refinability Example Tier Weight Defining Not Refinable Is A 1 1 Historical Not Refinable Replaced By Additional Not Refinable Part Of Defining Optionally Refinable Associated With Qualifier Optionally Refinable Measurement Method Qualifier Mandatory Refinable Associated Finding Table 3.1 Relationship weights for our algorithm. Relationship tears are defined by concept Refinability and Characteristic, which are both assigned by SNOMED-CT. To find the path between two UMLS CUIs, each CUI was mapped to all of its SNOMED-CT concepts and all possible combinations of pairwise shortest paths were calculated. The average of these paths was taken and assigned as the official path length between the CUIs. The ontological similarity was calculated in 2.18 seconds for all 794 CUI pairs (15,187 SNOMED concept pairs) on a Linux machine with Ubuntu core, 2.4GHz Opteron 4176 model, 32GB RAM, with a Dell 7,200 RPM drive. The following algorithm (Eq 5) was used to assign ontological weights for each individual pairwise path: Sim 0 = ( ')*!"#$h& ' / E - α( E -1) (5) E = {e 1,e 2, e n } where " + = edge in path weight 2 = assigned weight for edge e 3 =.2 For example, one path between C (Amnesia) and C (Memory Loss) is between the SNOMED-CT concepts and , with a path similarity of as illustrated in Figure 2 and Eq 6. Sim O ( , )=( )/3 -.2(2)=.5333 (6) 50
66 Amnesia (disorder) Memory disturbance (& amnesia (& symptom)) Amnesia Same As (.9) Is A (1) May Be A (.9) Disturbance of Memory Figure 3.2 An example of the relationship-weighted path calculation. This is the shortest SNOMED-CT path between and An example of a path between two UMLS concepts that were mapped back to SNOMED-CT, the may be a edge is not found by hierarchical path methods Definitional Similarity The third similarity metric we used was definitional similarity. Definitional similarity is a measure of lexical commonality between two concepts a metric widely used in word sense disambiguation, which can be seen as a reverse goal of our task (Banerjee 2002). We focused on lexical inclusion as the metric and we used the following formula (Eq 7): Sim D = (C 1 +C 2 ) - {C 1 +C 2 } /Min( C 1, C 2 ) (7) Where C i ={words in definition and synonyms of all mappings of CUI C i in SNOMED-CT} We chose to use this metric as a way to capture complete subsets as being perfectly similar while adequately capturing the amount of discordance between the two sets of words. While the Lesk methods look at consecutive words, we treat the definitions as a bag of words. For example, the similarity between C : Tender Muscles and C : Muscle Soreness would be between SNOMED-CT concepts and with a definitional similarity of Skeletal muscle tender (finding), Skeletal muscle tender, Muscle tenderness, Muscle soreness, Tender muscles Tender muscles (finding), Tender muscles, Tender muscles C 1 = [skeletal, muscle, tender, tenderness, soreness, muscles] 51
67 C 2 = [tender, muscles] Sim D ( , )=((6+2)-6)/2=1 (8) The definitional similarity calculation for all 794 pairs took 0.31 seconds on the same Ubuntu machine used for ontological calculations Experimental Setup Our method finds similar pairs from a very large number of pairs (in our experiments, approximately 14 million); therefore, it would be impossible to create an annotated gold standard list for full evaluation of true negatives and positives. In addition, because the set of input pairs is extracted from a corpus of notes, any gold standard is bound to be corpus-dependent. Therefore, for an evaluation method, we instead assess the accuracy of our methods, its variants and a baseline on a subset of all 14 million pairs, namely the ones with high note-based similarity (i.e., above 75%). In our experiments, there were 794 such pairs. The evaluation of all three methods was calculated on the 794 pairs (those already filtered by the note-based similarity). The definitional and ontological similarity measures were used and evaluated as secondary metrics. The first evaluation was performed on the note-based method alone to assess its individual contribution. Next, the average of the note-based and ontological methods as well as the average of the note-based and definitional methods were calculated to see the added benefit of each. Finally, the average of all three methods was computed. To further assess whether a threshold on note-based similarity at the 75% level is appropriate, we calculated similarities and collected gold-standard annotations for 100 random CUI pairs from the 25%- 50% note-based similarity bracket and 100 random pairs from the 50-75% bracket as well. Annotations Two physician annotators evaluated the results of the similarity calculations. The annotators were presented with the 794 CUI pairs in random order along with all of their SNOMED-CT definitions and synonyms. The annotators were specifically asked about the similarity of the concepts within the context 52
68 of a general population of CKD patients. The annotators were asked to answer the following question with yes, no, or maybe: Considering a patient with CKD, from a clinical standpoint, would you say that these two concepts could be used interchangeably? The annotators were not shown any actual medical notes but only a pair of terms. Such an evaluation was chosen as the purpose of our method was to summarize the term usages from the corpus as a whole and use the shared kidney disease framework to find similarity specific to the kidney context overall. The inter-annotator agreement between the physicians was calculated using Cohen s Kappa (Cohen 1960) and after converting all Maybe s to Yes, this resulted in a kappa of.68 without any further adjudication. A kappa of.68 is accepted as representing a substantial amount of agreement between annotators (Landis and Koch 1977). A conversion of Maybe s to No s resulted in a slightly lower Kappa of.67. The final conversion from Maybe to Yes was appropriate in this instance not only because of the higher Kappa, but also as the Maybe was used to annotate terms that are similar in some cases and would require more specific knowledge on the particular patient to determine definitive similarity. A few examples of terms that were marked as Maybe are (Swollen Foot, Swollen Ankle), (Acute and Chronic Inflammation, Focal Chronic Inflammation), (Radiation Burn, Effects of Radiation). The accepting of a Maybe annotation as Yes gives us more opportunity to create a comprehensive list of similar concepts for large-scale concept aggregation. Given the two annotators answers for a particular pair, a consensus gold-standard answer was defined as Yes if both annotators answered yes, and No otherwise. Under this setup, the original list of 794 concept pairs contains 145 pairs annotated as similar. Baseline UMLS-Similarity (McInnes, Pedersen, and Pakhomov 2009) is a Perl package which encodes ten different similarity methods based on ontologies and corpora. UMLS-Similarity encodes path-based measures, information-content measures, definitional measures, and note-based measures. We ran five of the measures on the UMLS-2010AA as baseline, consisting of the path-based and definitional measures, as described in Table
69 Category Measure Used for Why not? Parameters Baseline? path No Same as the inverse of - cdist Path cdist Yes - SNOMED-CT vocabulary lch Yes - Parent/Child and Broader/Narrower Information nam Yes - wup Yes - jcn No IC was calculated on - content lin No different corpus - res No - Definitional lesk Yes - Definitions from SNOMED-CT vocabulary All relationship types - Note-based vector No Very similar to our vectorbased method Table 3.2 All of the UMLS-similarity measures and their inclusion or exclusion in our baseline. Evaluation Metrics As we are interested in evaluating each similarity measure independently as well as their combined effect, we created receiver operating characteristic (ROC) curves for each combination of similarities at every similarity threshold (Hanley and McNeil 1983) for both our method and the baseline comparisons. We used the areas under the curves as the single measure to compare how well each similarity measure did. 54
70 3.4 Results The total dataset collected for this experiment consisted of 2,569 patients and their notes, which covered a span of over 20 years ( ). In total, there were 403,819 notes from which we extracted 8,869 unique UMLS concepts that are in SNOMED-CT. The minimum unit of computation used in this study was a sentence containing a CUI and the corpus can be described as the set of these sentences. Figure 3.3 shows a histogram of the notes with respect to the number of sentences they contain. Figure 3.3 Descriptive Statistics for sentences in our CKD corpus. This graph illustrates the variety of sentence lengths found and chunked by the ClinNote pipeline. The note filtration was used to narrow down the total notes used for the experiment, while keeping rich content. Initially, the corpus consisted of 403,819 total notes with 1,739 unique note types. Selecting the note types with more than 60,000 DISO concepts occurrences overall resulted in keeping 17 concept-rich note types (Table 3.3). This filtration led to a total of 170,775 notes used for the analysis (that is, less than 1% of the note types captures over 40% of the notes). As many institutions have a similar problem of unrestricted note type changes within their medical departments, the rapidly growing and changing EHR note structures make it difficult to keep track of which notes are most important. As the importance of note types is dependent on the question being asked, it is possible to vary the semantic groups included in the analysis, thereby altering the concepts found and the note types considered to be most important. This simple way of ranking note importance by concept density is a dynamic and institution-independent way to identify the most contextually specific salient notes in their EHRs. 55
71 Note Type Number of CUIs that map to SNOMED-CT from the DISO group Clinical_Note Discharge_Summary_Note Admission_Note Signout Physical_Therapy Progress_Note Nursing_Adult_Admission_History Surgical_Pathology_Event Follow-up Consult_Note Lead_Electrocardiogram Transthoracic_Echocardiography Ambulatory_Internal_Medicine_Structured_Note AMB_Internal_Medicine_Follow-Up_Note Operative_Note Primary_Provider_Clinic_Note X-Ray_of_Chest,_Portable Table 3.3 Note types selected through the note filter 56
72 3.4.1 Concept Similarity Results To determine the best way to create the context vectors, we performed all experiments with stemming and without stemming the words in the corpus. The stemming approach showed a minor improvement over the unstemmed version and therefore we chose to report the stemmed similarity results. Experiments for Concept Pairs with High Note-based similarity We report in this subsection results on a full list of pairs with a note-based similarity above 75% similarity, corresponding to 794 pairs. The lexicographical comparison of definitions and synonyms of the concepts created a second layer of similarity which we used in addition to the ontological method to move pairs which are simply related to further down on the ranked list than those which are semantically similar. Given the algorithm used for definitional similarity, we often found high similarity between parent-child concepts or concepts with a short definition or list of synonyms. Figure 3.4 shows the ROC curves on the 794 pairs annotated for similarity with different combinations of the similarity measures (combinations represent an average of the individual measures). Although not reported in this chapter, we also experimented with the effect of simply applying the ontological and definitional scores to rank and re-order the 794 pairs (without averaging in the note-based score itself). These resulted in slightly smaller AUCs than their note-based averaged counterparts. 57
73 Figure 3.4 ROC curves comparing different parts of our methodology. We compared the curves of all similarity combinations between note-based, ontological-based, and definition-based measures. Table 3.4 shows the top-10 concept pairs ranked by the composite method, which averages the three similarity scores for each pair. 58
74 UMLS Concept UMLS Concept Similarity Similar according to Preferred Term Preferred Term Score Expert Consensus C Traumatic injury of skeletal muscle C Penile hypospadias C Muscle tenderness C Thrill (finding) C Gastro-esophageal reflux disease with esophagitis C Anorectal fistula C Acquired hallux valgus C Aseptic Necrosis of Bone C Stenosis C Finding C Muscle Injury C Hypospadias C Skeletal muscle tender C Cardiac thrill (finding) C Peptic Esophagitis C Anal fistula C Hallux Valgus C Bone necrosis C Acquired stenosis C Signs and Symptoms 1 Y Y Y N 0.95 Y Y Y Y Y Y Table 3.4 Top-10 concept pairs found by the composite (average of the note-based, ontological-based, and definitionalbased) method. It is difficult to assess the coverage of our approach to identify similar concept pairs over the original set of 14 million pairs. Instead, we investigate to which extent the automatically discovered candidate pairs are relevant for the input corpus. Since the goal of this method is to aggregate concept 59
75 pairs that are semantically similar, it is important to know whether the discovered pairs are frequent enough in the input corpus. We assessed the coverage of the concepts that made it into our annotated list of 794 pairs. The concepts made up for 6% of the total number of concepts in the corpus. They are common concepts however, as they cumulatively make up for 30% of the concept frequencies in the corpus. This confirms that our approach is appropriate for discovering pairs of similar concepts, which are frequent in the corpus, and thus important to discover. We compared our comprehensive method with 5 methods (lch, wup, cdist, nam, lesk) packaged in the UMLS-Similarity perl program. As all of the methods we used except Lesk rely upon the hierarchical relationships present in the UMLS only (Parent/Child or Broader/Narrower), they frequently missed paths between concepts. This happens because many concepts are linked with non-hierarchical relationships such as moved to or deleted from. Table 3.5 shows the number of missing paths (from the 794 total pairs, 145 of which are similar) when using PAR/CHD, RB/RN, or both. RB/RN misses the largest amount of paths and while PAR/CHD does quite a bit better, even combining the two, leaves over 10% of the total and 20% of the truly similar concept paths as null. We present the ROC curves for the combined PAR/CHD and RB/RN hierarchical methods as well the Lesk method, although the Lesk and CDist scores are coarse whole number measures and lead to fairly few data points for the ROC curves (Figure 3.5). The baselines all underperform compared to our three similarity metrics and their combinations. We compared our final list of similarities with the list of 566 concept pairs collected by Pakhomov et al. (S. Pakhomov et al. 2010) in their semantic similarity study. There were only four pairs in common (Rhonchi, Rales), (Polydipsia, Polyuria), (Vertigo, Dizziness), and (Constipation, Diarrhea). Only Rhonchi/Rales were found as similar by the annotators. 60
76 Broader/Narrower (RB/RN) Relationships Parent/Child (PAR/CHD) Relationships PAR/CHD or RB/RN Pairs with no path 77.8% 15.6% 11.3% Pairs with no path that are similar 75.9% 24.13% 20.0% Table 3.5 Missing paths in hierarchical methods. For the PAR/CHD or RB/RN method, we used a PAR/CHD path if it existed and RB/RN path otherwise. Figure 3.5 ROC curves of the baseline methods. We used five methods encoded in UMLS-Similarity and calculated the ROC curves including only the pairs between which paths were found, leaving only 116 similar pairs and 704 pairs in total. Experiments for Concept Pairs with Low Note-Based Similarity In the experiments described above, we focus on concept pairs with a high note-based similarity (above 75%). This assumes that the context from notes is the most salient cue towards semantic similarity 61
77 compared to definitional and ontological similarities. As a sanity check that note-based similarity does not miss pairs that are semantically similar, we expanded our gold standard with 200 more concept pairs and collected similarity assessment from our judges, following the same methodology as in the above data set: 100 random pairs from the set of pairs with a note-based similarity between 50% and 75% similarity and 100 random pairs from the set of pairs with a note-based similarity between 25% and 50% similarity. We calculated the path-based similarity and the ontological similarity for the 200 concept pairs. Out of the 200 pairs, only three were scored as interchangeable, and thus similar: (Respiratory alkalosis, Alkalosis), (Disturbance in sleep behavior, Sleep disorders) and (Liver palpable, Liver edge). Furthermore, none of the three were unanimously assigned a Yes by our experts. While, this is only for a random sample, it provides face validity to the claim that note-based similarity is the primary factor to assess context-based semantic similarity. 3.5 Discussion Impact of Context The experiments confirm that context plays a crucial role in assessing similarity of medical concepts: the writing patterns of clinicians provide valuable information to determine which concepts are mentioned in similar contexts and thus are good candidate pairs for aggregation. However, these patterns are all the more visible because the information used for the note-based similarity is derived from a large corpus, with a coherent set of concepts, all related to a particular topic (chronic kidney disease in our experiments). For example, consider the two concepts Difficulty Hearing and Complete Deafness. Generally, the two might be similar enough for aggregation but not given a history of kidney disease. One of our physician annotators pointed out that difficulty hearing might serve as a clue of an adverse drug event caused by an overly high dosage of medication. Complete deafness does not offer the same reaction, as total deafness is rarely an adverse drug event. Such examples illustrate the need for contextdependent similarity measures. 62
78 In our experiment, we found the inter-annotator agreement between the physicians was quite high given the subjective nature of the question. The fair amount of agreement indicates that physicians generally concur on medical concept similarity within a particular context. It is a testament to the fact studied generally by Tversky (Tversky 1977) and in the medical arena by Pakhomov et al. (Pakhomov et al. 2010; Pakhomov et al. 2011) that there is a universal concept of similarity that most people agree upon Impact of the Ontological-based Similarity The relationship-based ontological measure we proposed was able to locate many more paths than other popular methods encoded in the UMLS-Similarity package. Because the baseline methods rely upon hierarchical relationships only, they are often unable to find the complicated trajectories among concepts and focus primarily on more straightforward pairings. This limits the types of paths that can be found between two concepts. In contrast, our ontological similarity incorporates all types of ontological relationships into its path computation, and due to the disease/disorder and SNOMED-CT only filtrations, ensures that a path will always be found between two concepts. Our method takes care to assign greater weight to more significant relationships (Is-A), but does incorporate edges between concepts that others do not, such as may be a or moved to Impact of the Definitional-based Similarity The definitional similarity measure also provided important information about similarity and did surprisingly well, serving as the best individual similarity measure when averaged with the context-based primary. Nevertheless, it must be emphasized that this measure performs well as a discriminatory measure after the initial contextual similarity threshold, and would probably not perform well on its own to discover candidate similar pairs. In fact, when applied to the 14 million pairs, 85% of them share no words in their definitions, and thus have a 0.0 definitional-based similarity measure and conversely, 2,099 pairs have a perfect 1.0 definitional-based similarity measure. On its own, this measure does not have enough granularity to rank pairs. It performs well combined with more nuanced similarity metrics. 63
79 Leveraging the concept definitions for assessing similarity can be viewed as a word sense disambiguation method (the original proposition by Lesk was to use definitions in exactly this way (Lesk 1986)). Given the potential tagging ambiguity that may arise during the entity-recognition phase and would result in a perfect note-based similarity score, the definitional similarity helps to move apart those incorrectly perfectly similar concepts Impact of Combining Data-driven and Knowledge-driven Similarity Measures The note-based similarity measure, which relies on patterns of clinicians writing their notes, and the knowledge-based similarity measures, which rely on ontological knowledge, provide complementary cues to the assessment of concept similarity. Concepts that appear far away from each other in the ontology, but are used comparably in the clinical notes are generally irrelevant in the CKD context and can be aggregated for the purpose of data mining. For instance, the concepts C (Metrorrhagia) and C (Menstrual spotting) have a low ontological similarity score of.126, but a note-based score of.904, and thus can be correctly identified as similar. Alternatively, concepts may appear very close in a medical ontology but be used vastly differently in context. Such use indicates general similarity but a notable difference in the context of CKD. For example, the concepts C (Focal chronic inflammation) and C (Chronic inflammation) had a full ontology-based similarity of 1, but the note-based score was In general, we found that it was essential to incorporate ontological and definitional similarity to separate pairs misguided by abbreviations used in medical text. Although the note-based similarity helps anchor variants of the same concept it has no mechanism for word-sense disambiguation specifically when an abbreviation maps to multiple SNOMED concepts. Out of the 794 pairs that were evaluated, 80 of them had a note-similarity of 1, indicating that they were used in exactly the same way throughout the entire corpus. Most of this is due to a shared trigger, as our named-entity recognition tool maps each word to all possible UMLS CUI matches. The letters RA could trigger both Rheumatoid Arthritis and Refractory Anemia, giving them a note-based similarity of 1, but clearly they 64
80 are semantically different. Of the 80 pairs with perfect note similarity, 42 of them were actually similar such as (Incomplete Spontaneous Abortion, Incomplete Abortion Unspecified) both triggered by Incomplete Abortion and (Tonsillar Carcinoma, Malignant neoplasm tonsil) both triggered by Tonsil Cancer ; the rest were disambiguated thanks to the addition of ontological and definitional similarity. 65
81 Chapter 4: Exploiting Patterns of Missingness for Clinical Modeling of Laboratory Tests Introduction Automating feature selection from EHR variables is a difficult task, as the EHR is an inherently biased data source: EHR data are collected with the primary goal of delivering and documenting patient care, not with the primary goal of creating a curated research dataset (Hripcsak and Albers 2013; Hersh et al. 2013). Identifying and then mitigating such biases will result in not only the development of more accurate methods for deriving computational models of disease but also in learning better prediction 4 This chapter was originally published in the Journal of Biomedical Informatics. The full citation for this publication is: Pivovarov R, Albers DJ, Sepulveda JL, Elhadad N. Identifying and mitigating biases in EHR laboratory tests. J Biomed Inform. 2014;51:
82 models from EHR data. Currently, laboratory tests are one of the most widely used features in EHR disease-modeling research and are therefore the focus of this chapter. In this work, we hypothesize that (i) the specific context of a laboratory test order can be derived from EHR-observed measurement patterns, and (ii) that this context can be leveraged for better disease modeling. While a laboratory test s numerical values can help distinguish healthy from sick patients, test values themselves cannot separate sick patients by their ailment when the test is associated with multiple diseases. For instance, while the numerical results may be comparable, the rate of measurement for a gestational diabetes screening glucose test and a chronic diabetes monitoring glucose test will differ greatly. We predict that how often a laboratory test is ordered within a particular time window can help correctly separate one disease state from another. We further hypothesize that laboratory test measurement patterns provide complementary and independent information from the numerical values indicated by the laboratory tests. We formally explore the relationship between both laboratory test measurement gaps and laboratory test values to determine whether the context in which a laboratory test is ordered alters the way its value should be interpreted, and is therefore a critical feature for disease modeling. While analyses of laboratory measurement patterns have been conducted (Lyon et al. 2009; Saxena et al. 1993; Weber and Kohane 2013; van Walraven 2003), the analyses and interpretations have focused on resource overutilization and informing clinical practice rather than on EHR-driven research. Before describing our methods and findings, we provide background on laboratory testing from an informatics standpoint and report on previous work in the emerging research area of EHR bias identification and mitigation Capturing the Context of Laboratory Testing At the point of patient care, different laboratory tests are ordered at different rates, often dictated by what physiologic process the test is measuring, and very often there exist multiple reasons for ordering a particular laboratory test. The three most common reasons for ordering a test are (i) diagnosing a condition, (ii) screening for a condition, or (iii) monitoring a pre-existing condition. Some laboratory tests 67
83 are ordered for one specific, clinical reason: for instance, the prostate-specific antigen (PSA) test is ordered exclusively to screen patients for prostate cancer. Others serve multiple clinical purposes: TSH, for instance, is used both to diagnose and monitor patients with disorders associated with the thyroid hormone. Finally, some tests, such as creatinine, are ordered both for clinical purposes like monitoring chronic disease progression and diagnosing acute conditions, and for healthcare process purposes like following guidelines as part of a routine panel for preventive testing (McPherson and Pincus 2011). When hospital protocol dictates measurement times, as is the case with routine preventative panels, creatinine s measurement patterns arguably reflect healthcare processes more than they reflect the health status of a patient. Thus, the context in which a laboratory test is ordered depends both on its clinical purpose and the surrounding healthcare processes. Deriving the context of a laboratory measurement is a challenge, however. EHR data lack an explicit indication for why each laboratory test was ordered, and using other dimensions of EHR data for derivation of such information (such as ICD-9 codes and clinical notes) is equally problematic. ICD-9 codes are notoriously non-specific to patient disease state and are often not recorded for all patient ailments (Birman-Deych et al. 2005; Farzandipour, Sheikhtaheri, and Sadoughi 2010). Clinical notes rarely explicitly state the exact reason a test has been ordered. The specific description of the context in which a laboratory test is measured, therefore, is not included in most computational models of disease. In fact, most often models include only a laboratory test s numerical value, a range of values (Chen, Dudley, and Butte 2010; Lasko, Denny, and Levy 2013), or the presence or absence of a laboratory test (Lin and Haug 2008) as features, but no contextual information about the situation surrounding the order. In this chapter, we investigate whether aggregating numerical values of laboratory tests taken in multiple separate contexts without explicitly separating the contexts can lead to the confounding of research conclusions. In research with clinical data, there is an implicit assumption that a laboratory test s numerical value and the rate at which the test is ordered are highly correlated features. This assumption about value and measurement rate correlation likely stems from the existence of value-based guidelines and the 68
84 widespread expectation that laboratory test values which fall outside of normal ranges prompt intervention and retesting. Value-based guidelines for laboratory test ordering dictate measurement frequency based on a test s numerical value. For instance, the guideline for performing a diagnostic PSA test states that if a patient s PSA is slightly over 4.0 ng/ml in the initial measurement, the PSA test should be remeasured within 48 hours to confirm the need for a biopsy. Our work formally investigates the linear and nonlinear relationship between numerical value and measurement patterns in EHR-recorded data EHR Biases EHR data are biased because they are gathered in an uncontrolled environment and are not carefully curated for research purposes. EHR data are noisy, sometimes erroneous, and often sparse (Lasko, Denny, and Levy 2013). At the same time EHR data contain sometimes conflicting (e.g., notes and coded data provide differing medication lists) and redundant information (e.g., clinicians often copyand-paste from previous notes). From a temporal standpoint, the EHR contains data about elements that evolve at different time scales and often evolve over time, as treatment affects patient state. Because of these complexities, assessing the impact of EHR biases and correcting for their impact on data-driven methods is an emerging research topic. Recent research has shown that naive EHR statistical analyses can lead to the reversals of cause and effect (Hripcsak, Albers, and Perotte 2011), induction of spurious signals (Albers and Hripcsak 2010), large errors when predicting optimal drug dosage (Sagreiya and Altman 2010), value cancellation of temporal signals when aggregating different cohorts (Albers, Hripcsak, and Schmidt 2012; Albers and Hripcsak 2012; Albers and Hripcsak 2011), and model distortion when not accounting for redundancy in the narrative part of the EHR (Cohen, Elhadad, and Elhadad 2013). One particularly problematic bias inherent to the EHR is the prevalence of data points that are missing not at random (Rubin 1976) (e.g., patients are seen and measured more often when they are sick, and measured less often when they are healthy). Inferring missing information, such as values when the 69
85 patient is not seen, is a challenging research area. While there have been different approaches to mitigating this type of missingness (Schafer and Graham 2002; Lasko, Denny, and Levy 2013; Sammon et al. 2015), mostly researchers ignore missing values or interpolate them (Farhangfar, Kurgan, and Pedrycz, 2007.; Abdala and Saeed 2004; Hug 2006), with some recent work on classifying which variables should be interpolated and which should be ignored. Lin and Haug demonstrated that some missing values are themselves informative by creating Bayesian networks that explicitly model the absence of clinical variables; these models were able to predict medical problems better than those that ignored or interpolated missing values.(lin and Haug 2008) Our work builds upon Lin and Haug s findings and focuses on leveraging the temporal missingness within laboratory measurement data. We see the patterns of laboratory test measurement as patterns of missing data. As a way to mitigate the EHR biases, we explore the use of different missing-not-at-random patterns to classify different patient health states and stratify heterogeneous populations into homogenous patient groups. 4.2 Materials and Methods Our study is carried out in three consecutive tasks, as described below: Task 1 We explored the correlation of laboratory values to the laboratory test s time to repeat, examining whether the value and time between consecutive measurements (measurement gap) encode separate information or overlap in information content. Task 2 To understand the overall dynamics of laboratory tests recorded in the EHR, we categorized types of laboratory measurement patterns, identifying those more likely to cause biases in EHR-based research. Task 3 We used lipase as a case study for how rates of measurement can be used to account for biases in laboratory test measurement data. We narrowed our population to patients that have visited the NYPH Ambulatory Internal Medicine clinic at least 3 times. The full longitudinal records (i.e., all inpatient and outpatient data points) for these patients were gathered. Three physicians reviewed and edited a list of frequently measured laboratory tests. They 70
86 constructed a set of 70 laboratory tests of interest to primary care and internal medicine. We extracted the time series for these tests between September 1990 and September 2010 for all of the patients in the population Task 1: Correlation between Measurement Gap and Numerical Value We quantified the relationship between value and measurement gap, asking: in the patient population, is there added information in looking at how a patient was measured, not only at the measurement value? Given a particular laboratory test and all patients time series for that test, we constructed a joint probability density function (PDF) using a kernel density estimate in Matlab. The PDF consisted of laboratory values and time between consecutive lab measurements (or gaps between measurements) in days. To assess the degree of correlation between a laboratory test s numerical values and its measurement gaps, we experimented with (i) linear correlation (estimated at the 95% confidence interval) and an associated p-value and (ii) a non-linear measure of correlation, mutual information (MI) between laboratory test values and gaps between measurements. Mutual information attains a value of zero when the random variables underlying the distributions (values and measurement patterns) are completely independent. Mutual information attains a maximum when the two distributions are deterministic Task 2: Finding Laboratory Test Measurement Motifs We explored the different types of laboratory test measurement dynamics that exist in the EHR data by creating measurement gap histograms for 70 different laboratory tests. We computed the following quantity: for each laboratory test taken on each patient, we calculated the days between two consecutive measurements of that laboratory test on that patient. A histogram was created for each test, mapping the day gap between consecutive measurements and number of such gaps, when aggregated across the entire patient dataset. For example, if a patient had a creatinine test taken on February 3rd and another creatinine test taken on February 5th, the count of creatinine tests with a measurement gap of 2 days would be 71
87 incremented by one. We visualized the measurement gap histograms in different coordinate systems to explore the measurement dynamics across laboratory tests. We uncovered differences when examining the histograms in the logarithmic coordinate system. Using log-log coordinates, we visually looked for modes present in the histograms. If there is linearity in a measurement gap histogram when presented in log-log coordinates (i.e., a power-law) that implies scale-free measurement dynamics and that all time scales represent a single context or reason for ordering the laboratory test. If no approximately linear relationship between the frequency of measurement gaps exists, we visually looked for changes (e.g., peaks) that separate the different dynamics patterns; these different patterns may qualitatively imply different contexts of measurement based on either a change in health state or based on the healthcare documentation process. We catalogued the measurement gap histograms based on observed approximate linearity and the presence of peaks in the histograms, as determined by a manual review of the curves Task 3: Studying the Potential Effect of Measurement Motifs on Research In this task, we focus on a specific laboratory test as a use case for studying the effect of measurement motifs on EHR-driven research. For the use case, we chose to study lipase and acute pancreatitis. Acute pancreatitis is a wellunderstood condition and because its diagnosis is largely laboratory-based it is a good test case to validate our hypotheses. Both amylase and lipase tests have been used for acute pancreatitis diagnosis but they are not specific for this condition: both tests are also used for monitoring of chronic pancreatitis and diagnosing pancreatic cancer. We conducted all experiments on both laboratory tests; in this chapter, we focus on lipase as recent literature has shown it to have higher diagnostic sensitivity and specificity (Banks, Freeman, and Gastroenterology 2006). Our results for amylase were similar to those for lipase. We asked the question: can the known association between an abnormal lipase value and acute pancreatitis be recovered from EHR data? To verify our hypothesis that laboratory measurement 72
88 dynamics can impact the accuracy of identifying patients with acute pancreatitis, we considered three views of the data, based on the dynamics of lipase measurements within each patient s record: (i) only visits with short lipase measurement gaps, (ii) only visits with long lipase measurement gaps, and (iii) all visits independent of the length between lipase measurements. In each of these settings, we assessed the association between acute pancreatitis and lipase and studied the properties of visits that belong in the setting using ICD-9 codes and clinical notes. We hypothesize that as acute pancreatitis is an acute disease, visits with short lipase measurement gaps will be more highly associated and relevant to acute pancreatitis. Settings We divided each patient record into individual visits (defining a full inpatient admission as one visit). Each record (represented as a set of visits) was divided into bins of visits with short lipase measurement gaps and visits with long lipase measurement gaps. Figure 4.1 shows a schematic diagram of an individual s longitudinal record: visits 1 and 5 belong to the short-gap bin because the lipase measurements were taken in rapid succession, the other visits belong in the long-gap bin because they show a long time between consecutive lipase measurements. 73
89 Figure 4.1 A schematic of a longitudinal record. A single patient s longitudinal record is divided up into visits (represented here as a set of notes written during the visit) and visits are binned into short or long gaps with respect to lipase measurements. For instance, the first and fifth visit are binned as short-gap visits, because they contain at least two consecutive laboratory test measurements that occur within a short time period. Visits 2, 3, and 4 are long-gap visits because they occur between two consecutive lipase measurements that are taken over a longer period of time. To determine the threshold for how many days define a short-gap and long-gap, we used the laboratory test s measurement pattern histogram. Under the hypothesis that peaks in the histogram are indicative of the context within which a laboratory test is ordered we use the location of peaks and trends around them as thresholds for separating visits into short- and long- gap bins. This visit-separation method is generally insensitive to the exact threshold and is heuristically defined for each laboratory test as a function of the location and number of peaks in the measurement histogram. The measurement histogram of lipase (Figure 4.2) had one peak at one day and showed a change in measurement pattern at 3 days (the lipase histogram is only nearly linear after the 3-day gap). 74
90 As there is only a measurement gap when a patient has two or more tests, only patients with at least two lipase measurements were included in the analysis. Similarly, no visits after the last recorded lipase test were added to either bin. Our visit-binning method is not limited to two (short- and long- gap) bins and there can be more granular bins such as bins of regular weekly visits. In the case of lipase, the measurement pattern histogram illustrated two distinct measurement patterns. Figure 4.2 The measurement gap histogram curve for the lipase laboratory test. The measurement curve is presented on log log scale as a histogram of the days between consecutive lipase test measurements for each patient, aggregated across the full population. We examined the figure visually and found that the pattern in measurement gap frequency changes at approximately 3 days; after 3 days the histogram curve is nearly linear. We used 3 days as a threshold for separating measurements on a short time scale (0 3 days) from measurements on a long time scale (over 3 days). To analyze the differences between bins of short-gap measurements and long-gap measurements, we separated all ICD-9 codes and clinical notes created during short-gap lipase measurements from those collected during long- gap bins. We conducted association studies for lipase and acute pancreatitis in all three settings: (i) only short-gap visits, (ii) only long-gap visits, (iii) all visits. Analyses To assess in what ways the visits with short lipase measurement gaps differ from visits with long 75
91 lipase measurement gaps, we ran three analyses using ICD-9 codes and clinical notes. For all of the following analyses, we used patients who exist in both the short-gap and the long-gap bins. This filtration reduced the confounders and ensured that differences we uncovered were from genuine separate health states. All p-values were Bonferroni-corrected. Note Types. We looked at note types across the short and long measurement gap bins. Note types can inform the status of the patient. For example, a high frequency of admission and discharge notes indicate many inpatient visits, while primary provider notes are indicative of outpatient doctor visits. We performed a chi-squared test to assess the strength of association between the frequency of each note type and the gap bin; this test was chosen because we are comparing counts across different bins. Note Content. We analyzed the frequency and coverage of all words across the notes in each bin. Differences in note content indicate differences in topics and hint at different contexts of measurement across gap bins. To correct for the redundancy within notes, we calculated word coverage. Redundancy across notes within a patient was implicitly handled, as individual patient records were divided into both bins. We look at the note content, both frequency and coverage, to check the separation created by long and short lipase gaps. The presence of certain words that relate to specific health states can hint at the level of separation across the gap bins and provide clues as to whether relevant parts of the patient s record are indeed being separated out. For each word we calculated: Frequency = # times the word appears across all notes in the gap bin total # of words across all notes in the gap bin Coverage = # notes in which the word appears total # of notes in the gap bin We performed a chi-squared test to assess the strength of association between the coverage of each word and the gap bin. Association Study. To test whether laboratory measurement dynamics affect a typical EHR association study (Warner and Alterovitz 2012), we conducted a phenome-wide search using the binomial 76
92 test to find ICD-9 codes associated with an elevated lipase. For every ICD-9 code, we compared its frequency of occurrence with high lipase in all three settings. The binomial test was used to assess the statistical significance of deviations due to high lipase from the expected distribution of ICD-9 codes. The variables were defined as follows, per ICD-9: # visits where the ICD 9 is recorded H0: P(ICD 9) = # visits where a lipase lab tests is done # trials = # visits where median lipase > 43 # successes = # visits where (median lipase > 43 AND the ICD 9 is recorded) 4.3 Results Our final dataset consisted of 14,141 patients, their notes, ICD-9 codes, and laboratory test times and values for 70 tests, spanning 20 years. On average each patient had ICD9 codes [95% CI: ], laboratory tests [95% CI: ], and clinical notes [95% CI: ] over the entire study period Task 1: Correlation between Measurement Gap and Numerical Value Both correlation metrics, linear and nonlinear (through mutual information), between measurement patterns and test values were carried out for the 70 laboratory tests (see Appendix A Tables 1 and 2 for full results). When we did not separate by time scale, there was little correlation: with the linear measure, all laboratory tests had a correlation very close to zero. With the mutual information measure, although also very low, a few laboratory tests demonstrated some level of correlation. The highest mutual information was 0.15, detected for the albumin laboratory test and only nine other tests had a mutual information higher than 0.1 (see Appendix A Tables 1 and 2). Overall, these very low correlations indicate that there is separate information encoded in the laboratory test measurement pattern and the laboratory test s numerical value. Exploring the correlation statistics separately for different time scales (short and long gaps), some 77
93 laboratory tests such as LDL displayed no correlation (Figure 4.3(a)), using either metric, on any time scale, while other laboratory tests such as HbA 1c and creatinine, showed some degree of correlation. For LDL, the numerical value does not affect its testing rate. We interpret the absence of correlation in measurement patterns and value as a result of healthcare process, such as adherence to guidelines for testing (Grundy et al. 1993). HbA 1c displays a clear negative linear correlation of only on the slow time scale, a higher HbA1c value is correlated to a shorter time until next measurement (Figure 4.3(b)). Creatinine also displays a clear negative linear correlation of , but on the short time scale. The results from the linear correlation calculations were consistent with earlier work on the relationship between laboratory value and measurement frequency (Weber and Kohane 2013). Weber and Kohane assigned categories to laboratory tests based on how numerical values were perceived (e.g.: Bad-Good represented a laboratory test where a low value was bad, and a high value was good). In our work, a positive linear correlation indicates a Bad-Good test where a low value prompts rapid retesting and a high value has a longer measurement gap, similarly a negative linear correlation represents a Good-Bad test. The interplay between correlations on the full time scale and separately on the short and long time scales revealed interesting findings about measurement dynamics. For example, bicarbonate showed a positive linear correlation on both long and short time scales (the higher the value, the longer the gap between measurements), but when aggregating the time scales together and computing the total linear correlation, the correlation disappeared (Figure 4.3(c)). By contrast, the PSA screening test had very similar mutual information on the full and long time scales. The differences between tests such as bicarbonate and the PSA screening test hint at differences in the contexts in which laboratory tests are ordered (Figure 4.3(d)). As PSA is measured in a single context, it is not subject to signal dilution due to timescale aggregation. Alternatively, the correlation results for laboratory tests such as bicarbonate, which are measured for multiple reasons and in various contexts, indicate that it is sometimes necessary to separate laboratory measurements by underlying context of measurement. 78
94 Figure 4.3 Density plots of the PDFs (consisting of laboratory values and time between consecutive measurements) for four laboratory tests shown on the full time scales. The x axis represents the log time to next measurement in days: log (1 h) = 1.38, log (1 day) = 0, log (1 week) =.85, log (1 month) = 1.47, log (1 year) = Each graph shows different levels of correlation: LDL has no correlation on any time scale as shown by the mostly round ball, HbA1c has a negative correlation as shown by the L-shape of the curve, Bicarbonate separates along two time scales while PSA is almost exclusively measured on the long time scale of over a year between consecutive measurements. 79
95 4.3.2 Task 2: Laboratory Test Measurement Motifs Manual cataloguing of the measurement gap histograms for 70 laboratory tests uncovered a set of three motifs that were most common. The three motifs of laboratory test ordering are influenced by two factors: patient health state and the healthcare process (Figure 4.4). These two factors contribute to create the shape of the laboratory test s histogram. Certain histogram motifs highlight the presence of multiple contexts in which the test is being ordered. The histogram shape can determine whether further population stratification is necessary for conducting analyses or whether the laboratory measurements already represent a mostly homogenous patient set. The contributions of the patient health state and the healthcare process is dependent on the laboratory test itself and define the three motifs of test ordering: (i) primarily inpatient, (ii) primarily outpatient, (iii) a mixture of in- and outpatient. Figure 5 shows typical graphs from each of these three categories. Figure 4.2 A Bayesian network describing the two factors that influence a laboratory tests measurement pattern. The extent to which each factor contributes, changes which motif the test belongs to, thereby changing how it can be used in research settings. The mixed in- and outpatient motif represents laboratory tests taken across patients with multiple health states. Laboratory tests with mixed motifs may contribute to biased results when computing over the multiple health states as one population of patients. In general, laboratory tests that show peaks at very short time gaps in their measurement histograms are representative of tests taken during inpatient stays; laboratory tests with measurement graphs that peak 80
96 at longer gaps of a few months are representative of measurements obtained during an outpatient visit. For some tests, the documentation (outpatient vs. inpatient) reason is aligned with the clinical reason; related to the fact that the numerical value obtained from a particular test is valid for a specific time period only. For example, troponin levels are representative of a patient state at the hour level, and thus their measurements are on the timescale of days. Because troponin is measured for patients suspected of suffering a myocardial infarction, and such a diagnosis has a high rate of inpatient admission, the troponin measurement dynamics are representative of an inpatient stay. Troponin s measurement dynamics represent a primarily inpatient laboratory test, motif (i). Other laboratory tests such as microalbumin and HbA 1c change at a slower time scale and are ordered primarily in outpatient settings; as the values change slowly, there is no need to repeat their measurement during a short-term hospital admission. Therefore, HbA 1c and microalbumin measurement dynamics represent primarily outpatient visits, motif (ii). Laboratory tests that follow motif (iii) represent a set of tests whose measurement dynamics result from a mixture of both clinical and documentation reasons. For instance, glucose changes rapidly and is widely used in inpatient settings to monitor short-time scale changes but is also a regular test performed during outpatient visits to monitor chronic diabetics. The glucose dynamics are evident by the histogram diagram in Figure 5 where there is a fast time scale peak at 1 day, and a smaller slow time scale peak at 91 days. The peak at 91 days shows quarterly patient monitoring. Many other laboratory tests have motif (iii) measurement dynamics: for example, creatinine displays an almost identical histogram as glucose because they belong on the same basic metabolic panel and lipase along with amylase also have a mixture motif because of their use in both inpatient settings for acute events and outpatient settings for long-term monitoring. Triglycerides is also a laboratory test with a mixture motif but with very different mixture weight (iii.b). This type of mixture laboratory test represents a dynamic that is also a result of mixed documentation and clinical reasons but with much heavier weight on the outpatient component mixing. 81
97 Most of the population receives triglycerides at 3-month time scales to assess heart health but a small subset of patients have their triglycerides monitored on a much shorter time scale, these are ICU patients with feeding tubes. The large portion of outpatient testing is seen in the triglycerides measurement gap histogram because the peak at 91 days is at a similar height as the peak at 1 day. These three laboratory measurement motifs determine how to use different laboratory tests in EHR research. The tests for which clinical and documentation reasons align (laboratory tests used almost exclusively for in- patients or outpatients) represent a homogenous set of contexts, or patient states. Thus, with laboratory tests in motif (i) or (ii), aggregating across patient values is a safe approach. In contrast, the laboratory tests with the mixed measurement motifs, might represent several separate patient states (such as patients receiving triglyceride measurements as outpatient patients and patients receiving triglyceride measurements as ICU patients). Aggregating patient s values without separating the different patient state contexts in a large-scale study may introduce biases. The next section shows results of selecting patient cohorts by relying on a laboratory test with mixed dynamics (lipase) and how it impacts disease modeling (acute pancreatitis) Task 3: Measurement Patterns Highlight Clinical State We considered the histograms of measurement dynamics as plots of missing measurements. We presumed that for laboratory tests in the mixed motif category (iii), the data are missing not at random and may be informative of the patient s health state. Following intuition from Little s pattern mixture models (Little 1993) we hypothesized that different missing data patterns (or varying gaps between measurements) define different health states. We explored this idea using lipase and hypothesized that (i) lipase measurement dynamics indicate two distinct missing values patterns, each representative of a clinical condition, rather than a documentation state; and (ii) separating the dataset by missingness patterns (visits with short gaps between measurements vs. visits with long gaps between measurements) helps recover the association between elevated lipase and the health state of acute pancreatitis. 82
98 Figure 4.3 Representative examples of the three measurement gap motifs identified. Each laboratory test motif is presented on a log log scale as a histogram of the days between consecutive test measurements for each patient, aggregated across the full population. (i) Troponin represents a primarily inpatient laboratory test, with a peak at 0 days and displays an approximately linear relationship in the coordinate system; (ii) HbA 1c is an example of a primarily outpatient laboratory test, showing a highly peaked distribution around 91 days; (iii.a) Glucose represents a mixture of in- and outpatient measurements, evidenced by the complex histogram: a high peak at on a short time scale (less than 10 days) and another peak at long time scales (multiple months); (iii.b) Triglycerides is another example of mixed laboratory test dynamics but with a slightly different mixture type: triglycerides has a high outpatient component and shows two different time scale peaks with a large quantity of measurements on the long time scale. Note Types The note-type analysis indicated a significant difference between the common note types used in the short-gap and long-gap bins. The note types in Table 4.1 showed that lipase measurement dynamics 83
99 can highlight true clinical differences, rather than documentation differences between inpatient and outpatient visits. Note type 0-3 Day measurement gap 3+ Day measurement Difference in % gap Raw % Total note Raw %Total note frequency types frequency types Signout 6, , Miscellaneous Nursing 4, , Note 12-Lead Electrocardiogram 2, , X-ray of Chest, Portable 1, , Discharge Summary , Progress Note , Adult Social Work Progress , Note Physical Therapy , Admission Note , Respiratory Care Patient , Assessment Table 4.1 Note types indicative of healthcare setting (in vs. outpatient) are spread across short and long gap bins, hinting that the measurement gap-based separation is not representative of healthcare, but rather of health states. This table shows the top 10 normalized differences in % of total note types in each bin, each has a highly statistically significant difference in % total note types. There are note types that are only written during inpatient stays: an admission note, a signout note during a hospital shift change, and a discharge note. If separating visits based on lipase measurement dynamics were separating on a purely documentation basis with inpatient visits in the short-gap bin and outpatients in the long-gap bin, we would expect these inpatient-specific notes to be exclusively present in 84
100 the short-gap bin. Instead, there are more inpatient notes in the longer gap bin but the coverage of inpatient notes is larger in the 0-3 day bin; the signout, admission, discharge account for 14%, 2%, and 1% of the total note-types, respectively. The long-gap bin contains a large amount of inpatient data demonstrating that the laboratory test measurement dynamics are able to isolate visits based on health not hospital status in the short-gap bin. The note types present in the short-gap bin are relevant for diseases associated with lipase measurement as well. Elevated lipase often leads to testing for inflamed pancreas by ordering ultrasound scans, CT scans, ERCP or Chest X-Rays. Common note-types for all 4 procedures were significantly more frequent in the 0-3 gap bin and ranked in the top 10% of Table 4.1. The results from the note type analysis suggest that lipase measurement dynamics are able to separate by patient health status and find specific visits that more likely pertained to acute pancreatitis events. Note Content The words with the largest difference in coverage between the short-gap and long-gap bins are very relevant to pancreatitis (Table 4.2): both lipase and amylase can be used to diagnose pancreatitis, Librium is an anti-anxiety drug often given to alcoholic patients with withdrawal symptoms, and alcoholic patients often have pancreatitis. There are more references to pancreatitis in the long-gap bin but the normalized frequency and coverage of the word is much higher in the short-gap bin. This indicates that the notes written during shorter gaps in measurement are more focused on the pancreatitis diagnosis. The word pancreatic modified cancer with a high prevalence in both gaps. This results from many patients with long-term pancreatic disorders experiencing acute episodes during their illness. We found that the word cancer has a coverage and frequency about 3 times higher in the long-gap bin than in the short-gap bin. 85
101 0-3 Day measurement gap 3+ Day measurement gap Words Raw %Total % Notes Raw %Total % Notes Difference frequency words containing that frequency words containing in coverage word that Word pancreatitis 10, , lipase 4, , amylase 3, , withdrawal 4, , librium 3, , pancreatic 4, , epigastric 3, , Table 4.2 Words associated with a pancreatitis health state are more frequently found in the short gap bins, suggesting that the separation is grouping notes written during visits that are more concentrated on the pancreatitis diagnosis into the 0 3 day measurement gap. The raw, normalized, and coverage frequencies of words in each gap sorted by the difference in coverage between the two bins is shown in this table. The words with a larger than 1% difference are shown, each of the words shown is highly associated with the 0 3 gap Recommendation for EHR Research with Laboratory Measurements Knowing that acute pancreatitis is associated with high lipase levels, we used the binomial test to investigate whether separating visits by lipase measurement gaps highlight this association more prominently. In each setting, we performed a phenome-wide analysis to see the association between high lipase and ICD (Acute Pancreatitis). In the 0-3 day gap setting, the binomial test found the top association to be acute pancreatitis with an extremely significant Bonferroni corrected p-value of < In the other two settings (greater than 3 day gap, and no separation by gaps), acute pancreatitis was also found to be the top association but 86
102 with a much smaller p-value (Figure 4.3). The long-gap setting had the smallest association and therefore the no separation setting also showed a much lower p-value. These p-value differences demonstrate that signal dilution is a consequence of ignoring measurement frequency bias during phenome-wide analyses. The process of binning laboratory values by their gaps between measurements (Table 4.3) can reduce confounding by not mixing different patient health states. Our results also demonstrate the generalizability of this measurement gap separation method. The measurement bins, created based on lipase measurement dynamics, were able to differentiate levels of association in other diseases as well. Type II diabetes (which may reflect clinicians screening type II diabetics with high triglycerides for pancreatitis) and HIV were differently associated with each setting. Without the lipase measurementbased separation of visits these disease associations are confounded by the bias of short-term lipase measurements. Interestingly, the ICD-9 for chronic pancreatitis is similarly associated with all three settings. The consistency of chronic pancreatitis is from patients having acute episodes during their chronic illness, conversely, not all acute pancreatitis patients have chronic pancreatitis. This asymmetry is demonstrated in the association patterns for acute and chronic pancreatitis. 87
103 Figure 4.4 The results of a binomial association test between high lipase and ICD-9 codes. The binomial test was performed in all three settings (short gaps between measurements of 0 3 days, long gaps of more than 3 days, and all visits regardless of gaps between lipase measurements). The top 20 most significant associations are shown. For illustration purposes, the ICD-9 codes are sorted by association to high lipase in the 3 + days gap. 88
104 Step Action Motivation 1 Plot a histogram of the frequency and measurement gap in log log coordinates 2 Examine the modality of the plot; looking for multi-modality 3 If there are multiple peaks, define a measurement gap threshold to separate the peaks 4 Perform the EHR experiment separately for each setting The histogram provides a method to visually examine the laboratory tests measurement dynamics If the histogram is multi-modal, it may imply a difference in patient health states or a healthcare process bias This separation defines multiple settings for the EHR experiment, creating sets of homogenous data points with respect to their measurement gaps Separately performing experiments for different settings may remove confounding bias Table 4.3 Measurement gap separation method. The actionable measurement gap separation method for finding and removing a confounding bias in laboratory test EHR data. 4.4 Discussion EHR research studies rely heavily on laboratory tests and their numerical values. We studied how laboratory test s pattern of measurements may provide additional information to a laboratory test s values. We discovered there is very limited correlation between how often a test is ordered and the value of the test. This lack of correlation implies that the value and measurement gap are informationally orthogonal to each other and are both important features to include when looking at laboratory tests, and specifically when using laboratory tests as features to represent patient disease state. In addition, there is evidence of different correlation results when examining laboratory test values on different time scales, showing that temporality plays a crucial role in the use of clinical laboratory test data. We found evidence that measurement patterns of laboratory tests are dictated by clinical and physiological knowledge, but often confounded by the healthcare process, such as hospital documentation practices whether from workflows or guidelines. One clear artifact of hospital document patterns was revealed by examining the measurement gap 89
105 histograms of 70 laboratory tests. Many laboratory test histograms have peaks at exactly 91 days, although their histogram height is varied. Our hospital serves a highly captive and sick population of patients in the surrounding neighborhoods. As the population is sick, 3-month checkups are a common practice and as the population lives nearby, the general adherence to a strict 3-month (91 day) schedule is high. It is clear that this 91-day peak is caused by the operations of the hospital and makeup of the population not the clinical state of each individual patient. Although this particular healthcare process bias is specific to our institution, we postulate similar types of biases exist across the country and should be mitigated before using the EHR-recorded data for research. Upon cataloguing all 70 laboratory tests we uncovered three types of measurement dynamics motifs, one which represents mixed laboratory tests where clinical factors and documentation standards are misaligned Separation by Measurement Pattern Mitigates EHR Bias Laboratory tests with multiple ordering reasons, such as those used for both diagnosis and monitoring, present challenges to EHR-based research. When using laboratory values without accounting for the laboratory test s frequency of measurement, confounders can dilute the results of a study. The dynamics of laboratory measurement gaps across a population can reveal different measurement patterns present in the data; examining the measurement patterns of a particular test and then performing patient record decomposition in a strategic manner reduces signal dilution. For example, filtering the full patient cohort by visits within a particular measurement pattern of missingness will provide a more focused dataset of patient states. We demonstrated our method of visit separation through measurement gap analysis on lipase as a specific use case. Using note types, note content, and ICD-9 codes we showed that our method could group inpatient visits pertinent to a particular clinical condition (acute pancreatitis in our example) away from inpatient visits pertinent to other clinical reasons. We also performed a secondary analysis to test that separating on hospital status does not yield the same results as separating by measurement gap. When 90
106 looking exclusively at inpatient visits (without accounting for measurement gap), the association between high lipase and acute pancreatitis was only as high as the 3+ Days association found using the measurement gap separation method (Figure 4.6). Therefore, we infer that the measurement gap separation method can indeed separate on health status, not simply healthcare process. The work presented in this thesis is highly relevant to researchers working on cohort identification algorithms, especially with the recent push for more automated ways to perform high-throughput phenotyping (Chen et al. 2013; Wei et al. 2010; Lussier and Liu 2007). We present the stratification of an individual s medical record by laboratory test measurement frequency as a new conceptual paradigm for studying EHR data with EHR-recorded laboratory tests. 91
107 Chapter 5: Learning Probabilistic Phenotypes from Heterogeneous EHR Data Introduction to the Phenome Model Computational tools and techniques that reduce the dimensionality of many individual patient characteristics documented in the EHR, that discover underlying clinically meaningful latent states of the patient, and that allow reasoning in a probabilistic fashion over them would be powerful allies to clinicians. In fact, these tools would also facilitate many analytics tasks when applied to entire patient populations, including predicting disease progression, comparing effectiveness of treatments, and studying disease interactions (Hripcsak and Albers 2013; Wei and Denny 2015; Liao et al. 2015). For such tools to operate in a robust fashion across varied patients and enable high-throughput search over many diseases, modeling from large amounts of patient records is critical. How to build these tools is an open research question. Here, we tackle this challenge through jointly modeling a very large set of diseases and an overwhelmingly large set of clinical observations. The observations are drawn directly from the heterogeneous EHR data, and the diseases are modeled in an unsupervised fashion. We refer to this task as large-scale probabilistic phenotyping, in essence building computational models of diseases from patient records. We introduce the Phenome model in its first iteration, a graphical model for large-scale probabilistic phenotyping. The key contributions of the model are: 5 This chapter was originally published in the Journal of Biomedical Informatics. The full citation for this publication is: Pivovarov R, Perotte AJ, Grave E, Angiolillo J, Wiggins CH, Elhadad N. Learning Probabilistic Phenotypes from Heterogeneous EHR data. 2015: 58:
108 It models diseases and patient characteristics as a mixture model, thus scaling easily to large sets of diseases and clinical observations; It derives phenotypes individual disease distributions over patient observations from raw data and diverse data types common to most EHRs: text, laboratory tests, medications, and diagnosis codes; It is unsupervised, and as such, can learn disease models across datasets from different institutions and different care settings, such as intensive care, emergency care, and primary care; It can incorporate clinical knowledge through informative priors; thus enabling the phenotypes learned in an unsupervised manner to be guided towards more established models of disease. It leverages a topic modeling approach, handling issues inherent to EHR data such as sparsity and noise, and capturing relations amongst observations that are implicit in the records. 5.2 Related Work We discuss related work according to two areas of research: computational models of disease and probabilistic graphical models in the clinical domain Related work in Computational models of disease One of the promises of the EHR is to enable reasoning and decision support over patient record data. Therefore, deriving a computationally actionable representation of patients based on their clinical records has been a grand research challenge, with proposed solutions from several disciplines and research fields. Since healthcare is driven almost entirely by the presence and/or severity of disease, representing diseases in an actionable fashion has been much investigated over the years. The emerge phenotyping effort aims to model individual diseases one at a time. It relies heavily on expert consensus to build disease definitions that can be applied over a large set of EHRs. While time consuming, this effort yields precise phenotypes of single diseases (Newton, Peissig, and Kho 2013). More recently, single disease modeling efforts have experimented with automated feature extraction from 93
109 knowledge sources to reduce the manual effort involved in creating precise phenotypes (Yu et al. 2015). In addition to single disease phenotyping, researchers have also explored the use of clustering techniques to identify subtypes of a given individual disease (Doshi-Velez, Ge, and Kohane 2014; Lasko, Denny, and Levy 2013; Marlin et al. 2012; Schulam, Wigley, and Saria 2015). When it comes to modeling a very large set of diseases at once, most of the work to date has been heavily reliant on manual knowledge curation. Ontologies like SNOMED- CT encode information about diseases such as potential treatments, symptoms, and the relationships amongst them. Bayesian networks which encode relationships amongst diseases and symptoms have also been developed (Miller, Pople, and Myers 1982). The Internist 1/QMR-DT resource was created manually and allows for computational reasoning about diseases and symptoms (Shwe et al. 2005; Jaakkola and Jordan 1999). One drawback of these resources is that, while their content is curated, they do not necessarily link to observation types documented in patient records. Approaches that leverage healthcare data whether claims data or EHR data to represent diseases and their interactions have also been proposed in the literature (Hanauer, Rhodes, and Chinnaiyan 2009; Hidalgo et al. 2009; Roque et al. 2011). However, these approaches focus on interactions amongst diseases rather than modeling the diseases themselves. Recently, a novel method to learn representations of multiple diseases across a large set of patients was proposed based on matrix factorization (Ho, Ghosh, and Sun 2014). In this framework, unseen patients can be assigned phenotypes, as defined by a collection of diagnosis codes. Our work aims for a similar goal to that of Ho and colleagues (Ho, Ghosh, and Sun 2014): the Phenome model learns phenotypes for a wide range of diseases, and derives the model based on EHR data. However, the Phenome model departs from previous work in disease modeling in the following ways: (i) it learns a representation jointly over heterogeneous EHR data types (as it has been demonstrated that unstructured data adds valuable information to purely structured data in the context of phenotyping (Liao et al. 2015)), (ii) it operates in a probabilistic framework, thus enabling modeling of the uncertainty inherent in noisy EHR observations, and (iii) the model is not inherently limited to a set 94
110 number of data types, in this current iteration the Phenome model incorporates four different data types but provides a framework to expand and include many other clinically relevant data types as well Probabilistic graphical models in the clinical domain With the growing amount of EHR data in electronic format, modeling the EHR with latent variable models has been an increasingly active area of research. The well-established Latent Dirichlet Allocation (LDA) model (Blei, Ng, and Jordan 2003) has been applied to raw clinical text for several tasks, such as identifying sets of similar patients (Arnold et al. 2010), correlating disease topics with genetic mutations (Chan et al. 2013), analyzing themes in patient safety event data repositories (Fong and Ratwani 2015), and predicting ICU mortality (Ghassemi et al. 2014), with success, suggesting that topic modeling can act as a powerful and reliable dimensionality reduction technique. Such unsupervised modeling of topics is attractive as the language of clinical notes is particularly noisy with much paraphrasing power, and styles (e.g., abbreviations) that vary widely from one institution to another and from one care setting to the next. More recently, researchers applied LDA to billing codes from disparate EHRs and found sets of phenotypes that remain consistent across multiple institutions, further demonstrating the power and portability of unsupervised learning techniques (Chen et al. 2015). Researchers have also investigated novel probabilistic graphical models, also used in a variety of tasks, including ICU illness severity scoring (Saria, Koller, and Penn 2010), diagnosis code prediction (Perotte et al. 2011), redundancy-aware topic modeling (Cohen et al. 2014), disease progression modeling (Wang, Sontag, and Wang 2014), and disease subtypes identification (Schulam, Wigley, and Saria 2015). While some clinical latent variable models have been evaluated in task-based settings (Ghassemi et al. 2014), evaluating the intrinsic value of the learned latent variables beyond their face validity, as well as their ability to infer meaningful latent states on unseen data can yield much information about the models. For general domain texts, evaluation methods of topic modeling have been much investigated. Experiments to obtain human judgments have been proposed (Chang et al. 2009), and automatic metrics that aim to correlate with such judgments (i.e., held-out likelihood and automatic topic coherence) have 95
111 been explored (Wallach et al. 2009; Newman, Lau, and Grieser 2010; Lau, Newman, and Baldwin 2014). Reliable and valid human judgments of topics are difficult to obtain, and as such automatic metrics are attractive. In the clinical domain, these metrics have not been validated fully, and quality judgments from clinicians are critical. When it comes to our phenotyping task, we want to evaluate how well the latent variables represent individual diseases. Because clinicians are trained to think about diseases as probabilistic mixture of symptoms, treatments, and comorbidities, we can leverage this training towards collecting qualitative judgments of phenotypes. Our goal in developing the Phenome model is to build interpretable disease models that are clinically valid and actionable. As such, we developed the model with knowledge of the EHR characteristics in mind and designed experiments to test for clinical relevance of the learned phenotypes. 5.3 The Phenome Model The Phenome model proposed in this chapter is a mixed membership model, inspired by the topic model literature (Blei, Ng, and Jordan 2003; Griffiths and Steyvers 2004). This model learns computational representations of disease based on observations from patient records, as encoded in the EHR. In this chapter we present two versions of the Phenome model, the fully unsupervised (UPhenome) model, and the grounded (GPhenome) model which incorporates clinical knowledge via known relationships between diseases and medications, laboratory tests, words, and diagnosis codes Inputs and Outputs of the Phenome Model The input to the Phenome model consists of a large set of patient records, where each record is composed of free-text notes, medication orders, diagnosis codes, and laboratory tests. Each data type is treated as a bag of elements. The words in the notes are tokenized and simple filtering of vocabulary is based on token frequency as well as stop words removal. The medication orders are mapped whenever possible to bag of medication classes. The diagnosis codes are also encoded as a bag of codes. There are two outputs to the Phenome model: learned phenotypes and an inference mechanism to identify a specific phenotype distribution for an unseen patient record. The learned phenotypes can act as 96
112 computational models of disease, and can be evaluated according to their interpretability and clinical relevance. In addition, the top-ranked diagnosis for a given phenotype can be used as a label proxy, thus supporting the interpretability of the disease model. The inference mechanism acts as a dimension reduction technique, where each new patient record can now be represented as a distribution over a concise set of clinically meaningful variables (the learned phenotypes). Such a representation can be leveraged in many health analytics tasks, including patient record summarization, risk prediction, and patient cohort selection. The variables of the model are listed in Table 5.1. P R βr ηp Ir vi,r γi,r θp Nr wn,r δn,r ιp Or xo,r εo,r Number of phenotypes Number of patient records Phenotype distribution for patient record r Diagnosis code distribution for phenotype p Number of diagnosis codes in record r Diagnosis code instance i in record r Phenotype assignment for diagnosis code i in record r Words distribution for phenotype p Number of words in record r Word instance n in record r Phenotype assignment for word instance n in record r Medications distribution for phenotype p Number of medication orders in record r Medication instance o in record r Phenotype assignment for medication instance o in record r 97
113 κp Mr ym,r ζm,r Laboratory test distribution for phenotype p Number of laboratory tests in record r Laboratory test instance m in record r Phenotype assignment for laboratory test instance m in record r Table 5.1 Variables in the Phenome model Baseline Models to compare against the Phenome Model Before describing the Phenome model, we first describe two baseline models. The baseline models use LDA and are built on (1) clinical text and (2) all data types. Although billing codes are often used for identifying patient cohorts, it has been demonstrated that individual billing codes are not a reliable proxy for disease modeling (Wei et al. 2015). In addition, in our preliminary experiments (not shown) we were unable to produce clinically-reasonable phenotypes when running LDA with only billing codes. The first baseline, LDA-text, considers only the notes in the records, following the hypothesis that clinical information about the diseases of a patient will be documented in the notes and thus can be captured through standard topic modeling. This is a state-of-the-art approach in several models for clinical data. Our first baseline is thus a vanilla LDA applied to the bag of words in the notes. We additionally experimented with modeling the other data types separately but as they yielded much less interpretable phenotypes due to sparsity (each patient record has many fewer diagnosis codes than words), we only used the LDA-text as a baseline. The second baseline, LDA-all, learns topic models based on all observations in the record (words, medications, diagnosis codes, and laboratory tests). In this baseline we apply a vanilla LDA on all observation types in a single bag. The working hypothesis for this baseline is that diseases can be represented across the different data types in the record. This baseline model has the exact same input as the Phenome model. 98
114 5.3.3 Graphical Model representation of the Phenome model 6 In the Phenome model, a patient record is represented as a probabilistic mixture of phenotypes, and the phenotypes are defined as a mixture of characteristics derived from a large, diverse population of patients. More specifically, a phenotype is defined as a set of distributions over the observation vocabularies, one for each of the four heterogeneous data types. As in the LDA baselines, we model the observations and phenotype assignments as multinomial distributions, and the phenotype distributions as sets of Dirichlet distributions. The details of the probabilistic latent variable model are shown in Figures 5.1 and 5.2. The Phenome model departs from the LDA-text baseline by considering all data types in the record. It departs from the LDA-all baseline by treating each data type on its own, and learning the type-specific phenotype distribution separately (ηp, θp, ιp, κp variables). There are multiple advantages to treating the data types this way: (i) this formulation adheres to the genre and characteristic of EHRs; (ii) it allows for future specification of different levels of sparsity and distributions for each data types; (iii) it enables a platform for incorporating domain knowledge specific to each data type which we explore further in this chapter; and (iv) it enforces the principle that conditioned on phenotype assignments, the per-data type phenotype distributions are independent of each other. Since the four phenotype distributions must separately sum to one, this mitigates potential imbalance in data type prevalence, and thus hinders one frequent observation type (e.g., words) from overwhelming the less frequent ones (e.g., diagnosis codes). 6 The notation used in Figure 5.2 and in Section differs slightly from the notation used in the journal publication version of this work. The thesis notation is more precise, however, for readability purposes it was simplified for the journal article. 99
115 Figure 5.1 Graphical representation of the Phenome model. Figure 5.2 Generative story for the Phenome model 100
116 5.3.4 Inference in the Phenome Model To perform inference on the Phenome model, we derived a collapsed Gibbs sampler which collapses the parameters β, η, θ, ι, κ. Due to the similarity of the models, inference in the Phenome model follows methods previously outlined for inference in LDA (Griffiths and Steyvers 2004). The derivations for the sampler are available in Appendix B. For illustrative purposes, in equation (1), we show the conditional distribution necessary for Gibbs sampling for one of the phenotype assignment variables, the laboratory test phenotype assignment, and note that the conditionals for the other phenotype assignment variables follow closely. ^ Here, the notation X Y,.,*:\] ^ record r, that are assigned to phenotype p. Similarly for X Y,.,*:_] represents the total count of all diagnosis code tokens Ir in patient (1) ^ (word tokens) and X Y,.,*:`] (medications). The counts for laboratory tests are performed without counting the particular laboratory test instance, m, which belongs to the type l and for which the conditional distribution is being d^,d(e,y) evaluated. Therefore, X.,a,*:c represents the total count of all laboratory tests, M ] r, in patient record r, that are assigned to phenotype p, except (represented by a minus) for the current laboratory test instance m in record r. Finally, we note that the denominator of this conditional only contains counts for the laboratory test, demonstrating the differences across the phenotype distributions for each data type Grounding the Phenome Model A primary goal of our work is to generate phenotypes compatible with clinician s mental models of diseases. Incorporating a human in the loop, like in interactive topic modeling (Hu, Boyd-Graber, and Satinoff 2011) and clinical anchor learning (Halpern et al. 2014) is a promising approach. Another 101
117 approach to support this goal is to incorporate knowledge from existing clinical knowledge resources, inspired by the advances in constrained topic modeling (Andrzejewski, Zhu, and Craven 2009; Andrzejewski et al. 2011; Hu, Boyd-Graber, and Satinoff 2011), and incorporating known semantic relations in disease modeling (Doshi-Velez, Wallace, and Adams 2015). In this work, we experiment with automatically grounding the unsupervised Phenome model algorithm using existing clinical knowledge resources. Links between different data types and diseases are derived from a variety of curated terminologies. We used the following sources: RxNorm and NDFRT for medications linked to diseases by the May Treat or May Prevent relationship, Medical Entities Dictionary (MED - the terminology that underlies the NYPH data warehouse) for laboratory tests linked to diseases by the Procedure indicates Patient Problem relationship, UMLS for billing codes to diseases links through the ICD-9 to SNOMED-CT link, and the Observational Medical Outcomes Partnership Standard Vocabulary for words to diseases by collecting at all first-order relationships from that disease to all other entities and tokenizing the results. Although the Logical Observation Identifiers Names and Codes (LOINC) terminology is more widely used for encoding laboratory tests, we chose to implement the GPhenome model using the MED because the link between laboratory tests and diseases was readily available from the MED. The link information was encoded into the model priors by creating informative, asymmetric priors with pseudo counts when the links were identified. To ensure that this prior information would not be completely overwhelmed by the data, every observation-disease link found in the clinical ontologies had the pseudo count for the prior set to Experimental Setup for the Phenome Model We now describe our datasets, parameter settings and model selection, as well as the different evaluation experiments we carried out Datasets To investigate the generalizability of the Phenome model, we experimented with two qualitatively different mixtures of patients and patient diseases: (1) records of extremely sick patients who 102
118 are in the intensive care unit (ICU) with constant monitoring, which usually spans a few days; and (2) records for outpatients regularly followed by care providers over multiple years. These datasets are also from different institutions using different EHR systems. In each dataset, 80% of the records were used for training, and 20% for testing. Descriptive statistics about the training sets for each dataset are given in Table 5.2. MIMIC ICU Dataset NYPH Outpatient Dataset Total / Unique Total / Unique Patients 18,697 / 18,697 9,828 / 9,828 Words 13,086,278 /12,919 12,840,334 /12,295 Medications 1,044,541 / ,146/ 353 Lab Tests 7,499,446 / ,699 / 318 Diagnoses 159,740 / ,214 / 931 Table 5.2 Descriptive statistics for the MIMIC ICU and NYPH Outpatient training datasets. In this work, the number of patients and the number of input records is equivalent. Each MIMIC patient has one input record consisting of all data gathered during one ICU stay and each NYPH patient has one input record consisting of all data gathered during four consecutive outpatient visits. MIMIC II ICU Dataset We included all adult patients in the dataset, independently of their present or absent conditions. For each record, we selected one ICU admission and all of its corresponding observations: discharge summary, all medications, all diagnosis codes, and all laboratory tests. Medications and laboratory tests were mapped to the standard vocabulary definitions provided by MIMIC. For all data types, we limited the vocabulary to observations that appeared at least 20 times in the training dataset. 103
119 NYPH Outpatient Dataset For this study, the NYPH data was subset to select only outpatient visits, providing a contrast to the MIMIC ICU dataset. We included all patients, independently of their conditions. Since their records span decades and often hundreds of visits, we considered slices of records for each patient that capture a somewhat stable health status. We selected the most recent time slice of each record that contained four different primary provider notes with no intervening inpatient stays. We defined record lengths by number of notes and not absolute time to account for different rates of visit (Hripcsak, Albers, and Perotte 2015). Any patient whose record slice lasted less than 1 month or greater than 4 years was removed and this resulted in patient records with mean length of 10 months (7 months standard deviation). As in MIMIC, we collected all observations related to primary provider notes, medications, diagnosis codes, and laboratory tests. The range of medications is much more diverse than MIMIC medications, and thus we mapped all medications to their therapeutic class when possible (e.g., Tylenol was mapped to Analgesic ). Similarly, the laboratory tests were mapped to groups of tests when possible (e.g., Glucose finger stick was mapped to Glucose ). As this dataset (in contrast to MIMIC), is not deidentified, we applied a simplistic method for trying to automatically remove as many patient and physician names as possible by removing any first and last names that appeared in the Top 1000 Names as listed by the US Census. Thus, the vocabulary sizes for these observations were dramatically reduced. We applied frequency thresholds to the data to closely match MIMIC vocabulary sizes whenever possible Model Parameters and Model Selection MIMIC II ICU Dataset With the MIMIC dataset, we focused our model selection on identifying the best number of latent variables (P). We ran the UPhenome model with the following P settings on the MIMIC ICU dataset: 50, 75, 100, 250, 500, 750. All of the hyperparameters (α, µ, ν, ξ, π) were set to 0.1 for all models. To ensure appropriate burn-in time for each model, the Gibbs sampler was run 7,000 iterations and the log- 104
120 likelihood curves on training data were examined to verify burn-in. The learned phenotype assignment settings for each model were selected as the ones that produced the maximum log-likelihood over all 7,000 iterations on the training set. For model selection, we optimized for interpretability of phenotypes, and thus relied on both heldout likelihood and coherence of the learned phenotypes. The automated phenotype coherence calculation was performed using normalized pointwise mutual information (NPMI) over all observation types, as described by Lau et al. (Lau, Newman, and Baldwin 2014) and using the provided open source code. For each model, we used the average NPMI across all phenotypes to represent the overall coherence of the learned phenotypes from the model. For this experiment, NPMI is calculated for each observation (zi) in each phenotype, limited to the top N=40 most probable observations. The per-phenotype NPMI is the average of the NPMI of each word, and the model NPMI is the average of each per-phenotype NPMI value, defined by: fghi j + = _d* akl m(n o,n p ) m n o m(n p ) v)*, (2) qrs t(u o,u p ) where P(z i ) = probability of seeing observation z i and P(z i,z j ) = probability of seeing both observation z i and observation z j in the same patient record. To calculate the likelihood on the held-out set, we implemented a Chib-style estimator as described by(murray and Salakhutdinov 2009). The likelihood was calculated using 1,000 iterations of the estimator for every setting of P (likelihood curves and the NPMI coherence are provided in the online supplement material). The combination of the two metrics suggested that P=250 was likely to produce the best phenotypes given the current parameter settings on the MIMIC dataset. For both baseline models LDA-text and LDA-all, we used the MALLET software package (McCallum 2002) with similar number of topics as the selected UPhenome model (K=250) and similarly with 7,000 iterations to ensure burn-in. The hyperparameter settings for the baseline models were 0.01 to increase sparsity due to the larger size of the combined vocabulary. 105
121 NYPH Outpatient Dataset With the NYPH dataset, we experimented with grounding the Phenome model and with hyperparameter optimization. Grounding To identify the correct phenotypes on which to ground the Phenome model, we explored the disorders frequently documented in the NYPH dataset. Using counts of SNOMED-CT Core Problem List disorders most commonly found across the entire NYPH dataset, we found that 695 disorders were common enough in the NYPH dataset and contained enough information upon which to ground (ie. enough medications, laboratory tests, words, or diagnosis codes that are linked to this disorder across clinical ontologies). We ran GPhenome on 750 phenotypes: 695 of them had augmented counts for the identified grounding and the remainder were left ungrounded to learn other phenotypes present in the data. Hyperparameter Setting We ran several iterations of the UPhenome model with different hyperparameter settings to determine the best setting for α and the rest of the hyperparameters (µ, ν, ξ, π). The models were run until the burn-in and the log- likelihood curves on training data were examined to verify burn-in. The learned phenotype assignment settings for each model were selected as the ones that produced the maximum loglikelihood over all iterations on the training set. To find which hyperparameter setting produced the best model, we used the same Chib-style estimator as described by (Murray and Salakhutdinov 2009). The likelihood was calculated using 1,000 iterations of the estimator for every setting of the hyperparameters. For the baseline models LDA-all baseline model, we used the MALLET software package (McCallum 2002) with similar number of topics as the selected GPhenome model (K=750) and with a similar number of iterations to ensure burn-in. The hyperparameter settings were set to be the same as the optimal settings found for the NYPH dataset (α =0.1, [µ, ν, ξ, π]=0.001). 106
122 5.4.3 Evaluation Experiments In addition to the automated evaluation metrics, such as held-out likelihood and automatic coherence of the learned phenotypes, we carried out the following set of experiments: qualitative assessment of learned phenotypes (manual coherence, manual granularity, pairwise phenotype comparison, label quality) and ability of the phenotypes to characterize ground-truth disorders present in a set of unseen patients (disorders to phenotypes associations). All qualitative judgments were obtained from a clinical expert. The learned phenotypes were displayed using a modified version of the interactive topic modeling interface (Hu, Boyd-Graber, and Satinoff 2011). The interface is particularly useful to us because it enables users to edit learned phenotypes by adding/removing observations and marking them as important or ignorable. For each phenotype, the top 40 most probable observations were displayed and weighted by their phenotype probability (normalized by their data-type specific phenotype probability). The observations were also color-coded to signify their data types (purple for words, grey for medications, green for laboratory tests, and blue for diagnosis codes). Manual Coherence This experiment allows us to capture the intrinsic quality of the learned phenotypes across its probable observations, very much like the automatic coherence metric aims to. In our case, a coherent phenotype is one that describes a single condition and that does not contain observations that are not typically seen in patients with this condition. In the MIMIC ICU dataset we compared the UPhenome model with the baseline LDA-all model each. In the NYPH dataset, we compared the UPhenome model, the GPhenome model, and the baseline LDA model. For each experiment, 50 phenotypes were randomly selected from each model and presented one at a time to the clinical expert. The expert was asked to score the coherence of a given phenotype (without being told which model produced the phenotype) according to a 1-5 Likert scale, where 1 designated no coherence (i.e., uninterpretable) and 5, perfect coherence. To help the expert in his 107
123 assessment, we instructed him to use the interface to edit the phenotypes, and use his number of edits as a cue for lack of coherence. Manual Granularity Because both the baseline and the Phenome models are unsupervised, there is no guarantee that the learned phenotypes are good representations of clinically meaningful diseases. In particular, it is possible that the modeling of patient observations generates clusters that are reflective of the documentation processes of healthcare rather than of the documentation of clinical status of a patient. For instance, patient discharge to a nursing home in the MIMIC dataset contains very specific documentation patterns, which in an unsupervised setting could be easily grouped. We asked the clinical expert to categorize the random phenotypes into one of the following three granularities: (i) a non-disease phenotype (e.g., a healthcare process or uninterpretable phenotype phenotype); (ii) a mix of diseases; (iii) a single disease. Pairwise phenotype comparison In this experiment, we assess the compared overall quality between phenotypes learned from the different models. In the MIMIC dataset, we compared the learned UPhenome phenotypes and learned LDA-baselines phenotypes. To ensure that the comparison is fair, we selected the 50 random Phenome phenotypes, and identified the most similar corresponding LDA-all phenotype for each. For the NYPH dataset we compared the UPhenome and GPhenome phenotypes and selected 50 random UPhenome phenotypes and identified the most similar corresponding GPhenome phenotype for each. To compute pairwise phenotype similarity, we used Jensen-Shannon divergence over the posterior probabilities of all observations.(manning and Schütze 2003) The clinical expert was presented pairs of phenotypes without him knowing which model generated which phenotype. The expert was asked to choose which phenotype was more clinically coherent or to code the comparison as impossible when both phenotypes were unintepretable, equivalent, or paired improperly. Label Quality One of the data types used in the Phenome model is diagnosis codes. The diagnosis codes are ICD- 108
124 9 codes, which often describe specific diseases (e.g., breast cancer ), but can also describe classes of diseases (e.g., malignant neoplasms ), as well as generic statements about a patient (e.g., personal history of other diseases ). Since the diagnosis codes are often used in the clinical world as proxies for conditions present in a patient, this experiment assesses to which extent the most probable diagnosis code for a learned phenotype is a clinically appropriate label for the phenotype as a whole. Since the LDA-text baseline does not include diagnosis codes, this experiment was skipped for this model. Similarly, since in the baseline LDA-all model it is possible that the top-40 most probable observations do not include any diagnosis code (in our experiment, this happened actually very often), we assessed label quality for the 50 Phenome phenotypes only. We asked the clinical expert to categorize the top diagnosis code with respect to the phenotype as a whole as (i) related; (ii) unrelated; or (iii) actionable. An actionable label is one that accurately represents the phenotype at the right granularity and it can be relied upon when making a decision about a patient with the phenotype assigned. Disorders to Phenotypes Associations While the previous experiments assessed the quality of the learned phenotypes, this experiment assesses the ability of the Phenome phenotypes to characterize clinically relevant and ground-truth disorders present in a set of unseen patient records. If there is a strong association between phenotypes and the disorders in these records, then the phenotypes can be considered clinically relevant for a given patient. A potential application of the Phenome model to identify present disorders for a given patient by inferring the most probable phenotypes for the record. To validate this point, we relied on a gold-standard set of records, which contain manual annotations of the disorders present and mentioned in the records notes. The ShARe gold standard is based on MIMIC notes and contains such annotations (Semeval-2015 task 14: Analysis of clinical text, 2015.; Pradhan et al. 2014). We included the 350 discharge summaries from the ShARe corpus in our test set. For each record, gold-standard annotation provided a list of SNOMED-CT Disorder concepts, along with modifiers such as negation and uncertainty. Ground-truth 109
 and inferred phenotype assignments.")
125 disorders for a record were defined as concepts with no negation or uncertainty. In total, for each of the 350 records, we have ground-truth disorder concepts (from a set of 2,000+ unique concepts in the corpus) and inferred phenotype assignments. We created an association matrix, similar to work by Griffiths and Steyvers (Griffiths and Steyvers 2004), visualizing the degree of association between present concepts and phenotypes. We selected concepts, which occurred in at least 50 records. We selected the concepts that occurred in at least 50 records. This experiment examines associations between common disorders and learned phenotypes; with 350 patients, there are not enough annotations to associate phenotypes with rare disorders. The association was computed using normalized pointwise mutual information, and for each concept the top phenotype was selected. 5.5 Results Figure 5.3 An example of a learned phenotype. The top 40 most probable observations for the phenotype are listed. The Phenome model is able to produce interpretable results: Figure 5.3 shows an example of learned phenotype on the NYPH dataset. The label on the left is the most probable diagnosis code, in this case SLE (Systematic Lupus Erythematosus). The words (in purple) are indeed related to this disease and refer to abbreviations in clinical notes ( rheum ) or mentions of important laboratory tests for SLE ( ana, esr ), as well as mentions of specific drugs indicated for SLE ( plaquenil ). The medications are also related (plaquenil, one of the most common drug for SLE is an antimalarial medication), as well as prednisone. Both C3 and C4 levels are used as diagnosis tests for SLE, while ESR and others test for level of inflammation in a patient. SLE is a phenotype learned from the NYPH dataset, which represents outpatient records over long periods of time. Since SLE is a chronic disease it makes sense that it was discovered in this dataset. For comparison, there is no phenotype learned on the MIMIC dataset that 110
126 captures characteristics of SLE. Because the Phenome model is unsupervised, it models the diseases that are of interest to a given input clinical setting/patient cohort Model Selection MIMIC II ICU Dataset Using the NPMI (Table 5.3) and held-out likelihood (Figure 5.4) calculations together identified P=250 as the best number of latent variables to explain the MIMIC dataset. The likelihood was calculated on a held-out dataset of 4,685 (20%) MIMIC ICU patients. Model Number of Latent Variables Average Normalized Pointwise Mutual Information Phenome Model LDA-all LDA-text Table 5.3 Average NPMI for different numbers of latent variables 111
127 Figure 5.4 Held-out likelihood calculation for the MIMIC dataset for different numbers of latent variables. NYPH Outpatient Dataset The number of phenotypes (750) for the NYPH dataset was determined by disease concept frequency in order to perform grounding. Nine different hyperparameter settings were tested (Table 5.4) on a validation set to determine the optimal setting for the NYPH dataset. To ensure that (0.1, 0.001) is the optimal setting, the held-out likelihood for (0.1, ) was also calculated; the result was x10 7. α parameter setting µ, ν, ξ, π parameter settings x x x x x x x10 7 * x x10 7 Table 5.4 Held-out likelihood on a test set for different parameter settings. * represents the optimal setting Evaluation 1: Coherence MIMIC ICU Dataset For the comparison of the Phenome model with baselines, we report its comparison to the LDA-all baseline alone, but note that the results were similar as for the comparison to the LDA-text baseline. 112
128 Figure 5.5 Distribution of manual coherence scores for the UPhenome and LDA-all phenotypes on MIMIC data. A score of 1 represents an unintepretable phenotype and 5, a perfect phenotype. Figure 5.5 shows the distribution of coherence scores for the 50 phenotypes from the Phenome model and the 50 phenotypes from the LDA-all model. The LDA-all phenotypes contained many more unintepretable phenotypes than the Phenome ones, and at the same time contained slightly more perfectly coherent phenotypes than the Phenome ones. Overall, about 66% of the Phenome phenotypes were scored as good (coherence score above 4), while only about 52% of the LDA-all phenotypes were scored as good. NYPH Dataset Figure 5.6 Distribution of manual coherence scores for the UPhenome, GPhenome, and LDA-all phenotypes on NYPH data. 113
129 Figure 5.6 shows the distribution of coherence scores for the 50 phenotypes from the Phenome model, 50 phenotypes from the grounded Phenome model, and 50 phenotypes from the LDA-all model. The LDA-all phenotypes contained many more uninterpretable phenotypes than either of the Phenome ones. The GPhenome model was able to create more coherent phenotypes than the fully unsupervised Phenome model. Overall, about 48% of the Phenome phenotypes were scored as good (coherence score above 4), 56% of the Grounded Phenome model phenotypes were good, but only about 36% of the LDAall phenotypes were scored as good. We note, however, that by performing ad-hoc post-processing on the LDA-all results such as data-type mapping and data-type normalization (a step that the Phenome model does inherently during learning), we were able to achieve manual coherence results comparable to the Phenome model results Evaluation 2: Granularity MIMIC ICU Dataset The UPhenome model yielded more phenotypes that are clinically well-defined as representing a single disease than the LDA-all baseline. Furthermore, the LDA-all baseline suffered from a high number of unintepretable phenotypes (as confirmed by the Manual coherence experiment). For the UPhenome phenotypes, the clinical expert categorized 10% as non-disease phenotypes, 10% as a mix of diseases, and 80% as representing a single disease. In contrast, for the LDA-all phenotypes, the clinical expert categorized 42% as non-disease phenotypes, 6% as a mix of diseases, and 52% as representing a single disease. NYPH Dataset For the UPhenome phenotypes, the clinical expert categorized 46% as non-disease phenotypes, and 54% as representing a single disease. In contrast when the model was grounded, the clinical expert categorized 14% as non-disease phenotypes and 86% as representing a single disease. For the LDA-all model, the expert found that 62% of the phenotypes were non-disease, 4% represented a mixture of diseases, and only 34% of the phenotypes represented a single disease. 114
130 5.5.4 Evaluation 3: Pairwise Phenotype Comparison MIMIC ICU Dataset anemia iron chronic iron transferrin ctibc ferritin deficiency discharge admission negative outpatient studies low folate likely disease ferrous sulfate sulfate trf vitamin b12 caltibc folate ferrous ret aut vitamin one history ferritin secondary ferritn follow baseline patient guaiac primary due also stable (a) LDA-all phenotype anemia ferrous sulfate iron iron deficiency anemia transferrin ctibc iron ferritin anemia unspecified anemia of other chronic illness chronic vitamin b12 heparin sodium folate cyanocobalamin discharge low trf deficiency outpatient one caltibc ret aut likely multivitamins studies magnesium oxide folate pantoprazole admission history follow disease levofloxacin ferritn negative due sulfate secondary hospital (b) Phenome phenotype Figure 5.7 An example of LDA-all and Phenome phenotypes, both about Iron Deficiency Anemia, as paired automatically by Jensen-Shannon divergence. Figure 5.7 displays an example of paired phenotypes shown to the clinical expert. We can see that the most probable observations in the LDA-all phenotype are words and laboratory tests (except for one medication), with only a few highly probable and relevant words/tests and most irrelevant to iron deficiency anemia. In comparison, the most probable observations in the Phenome phenotype are spread across data types, with a majority of observations relevant to iron deficiency anemia. Overall, out of the 50 pairs of phenotypes assessed, the clinical expert considered comparison impossible for 9 pairs. The Phenome phenotype was superior to the LDA-all comparison in 80.4% of the remaining pairs and superior to LDA-text in 68.3% of the remaining pairs. 115

 Grounded Phenotype for Sinusitis Figure 5.8 Grounded and ungrounded Phenome model phenotypes. Figure 5.8 displays two phenotypes paired for the clinical expert evaluation.")
131 NYPH Dataset For this outpatient dataset, we performed a pairwise comparison between grounded and ungrounded phenotypes, to assess the effect of grounding on the quality of the learned phenotypes. Overall, the JS divergence was not able to match the phenotypes as well for this task and the clinical expert found that 12 pairs were not matched well or represented uninterpretable phenotypes. Of the remaining pairs, the clinician found that 55% of the time, the ungrounded Phenome model was superior to the grounded Phenome model. (a) Ungrounded Phenotype for Sinusitis. (b) Grounded Phenotype for Sinusitis Figure 5.8 Grounded and ungrounded Phenome model phenotypes. Figure 5.8 displays two phenotypes paired for the clinical expert evaluation. Since the NYPH data is not de-identified, names sometimes appear in phenotypes (especially clinicians that specialize in particular diseases as they often sign the clinical notes). A name has been blurred in the Figure 5.8. The expert chose the grounded phenotype (b) over the ungrounded phenotype (a) as a better representation of sinusitis. In both of the phenotypes, the learned laboratory tests are not ideal, however in the grounded 116
, demonstrates how the augmented priors that were inserted into the GPhenome model, the figure illustrated how the grounding is able to guide the phenotypes to better disease models using clinical")
132 phenotype displays a more relevant set of terms and medications. The grounding of the sinusitis phenotype (Figure 5.9), demonstrates how the augmented priors that were inserted into the GPhenome model, the figure illustrated how the grounding is able to guide the phenotypes to better disease models using clinical knowledge encoded in available knowledge resources. We note, however, that the informative priors specified by the grounding, apply equal weight to all of the words and medications displayed in Figure 5.9, but the phenotype (Figure 5.8b) has differing weights for the different medications and words; this confirms our hypothesis that the grounding can guide the modeling procedure but statistics of the input data are still well represented. Figure 5.9 The observations that had augmented counts for the grounded Sinusitis phenotype Evaluation 4: Label Quality MIMIC ICU Dataset Overall, the most probable diagnosis code for a given phenotype was evaluated as good proxy for a phenotype label. In the MIMIC ICU dataset, the clinical expert assigned a label as actionable for 48% of the UPhenome phenotypes, 44% of them were considered related, while only 8% of them were considered unrelated. NYPH Dataset The clinical expert compared the UPhenome labels to the GPhenome labels. The expert found that the UPhenome model, 42% of the labels were actionable, 26% were related and 32% were unrelated. The GPhenome labels were found to be superior: 56% actionable, 28% related, and 14% unrelated. 117
 Associations amongst ShARe annotations (y-axis) and phenotypes (x-axis). The x-axis is sorted to demonstrate the highest associations on the diagonal.")
133 5.5.6 Evaluation 5: Disorders to Phenotypes Comparison As the ground truth disorders were available for the notes from the MIMIC ICU dataset, this evaluation was performed only on the MIMIC dataset, not the NYPH outpatient data. (a) Associations amongst ShARe annotations (y-axis) and phenotypes (x-axis). The x-axis is sorted to demonstrate the highest associations on the diagonal. OR diabetes mg mellitus metformin type glyburide discharge insulin dm day history glipizide medications admission insulin human 70/30 glyburide metformin glipizide rosiglitazonemaleate metformin (glucophage) pioglitazone hcl potassium glucose chloride hct sodium mchc urea n wbc creat mch rdw plt count mcv rbc total co2 anion gap hgb magnesium glucose diabetes mellituswithout mention ofcomplication type II orunspecified type mitral valve regurgitation repair severe replacement mvr moderate tricuspid furosemide potassium chloride warfarin heparinsodium docusate sodium acetaminophen epinephrine magnesium sulfate milrinone potassium hct hgb glucose sodium inr pt plt count creat mch magnesium ptt rdw mchc pt urea n mcv rbc total co2 Interactive Topic Modeling wbc chloride mitral valve Round 0 Time left: 897:29 disorders rheumatic heart failure congestive diseases_of_tricuspid valve (b) Phenotype 1 (c) Phenotype 7 ct subdural head hematoma right left hemorrhage frontal neurosurgery subarachnoid phenytoin sodium phenytoin sodiumextended phenytoin glucose potassium mchc anion gap inr pt total co2 ptt sodium chloride plt count pt calcium rbc wbc creat rdw hgb mcv phosphate mch E888.9 unspecified accidentalfall subdural hemorrhagefollowing injury E880.9 accidental fall onor from other stairs or steps subdural hemorrhage following injury E885.9 accidental fall from other tripping or stumbling subduralhemorrhage closed fracture of base skull withsubarachnoid subdural extradural hemorrhage subarachnoid hemorrhage following injury discharge please pain stable history mg physical date dr needed call hours therapy service procedure room hospital tolerated transferred well hydromorphone (dilaudid) hct hgb rdw mch rbc plt count wbc mcv mchc chloride urea n sodium anion gap creat total co acute posthemorrhagicanemia asthma other iatrogenichypotension other specified cardiac dysrhythmias fever (d) Phenotype 10 (e) Phenotype
134 Figure 5.10 Association of manually identified ground-truth concepts and automatically inferred phenotypes over a set of patients, along with four example phenotypes. Concept Unique Identifier (CUI) C C C C C C C C C C C C C C C Concept Description Hypertension Type II diabetes mellitus Hypercholesterolemia Disorder of coronary artery Chest pain Shortness of breath Congestive heart failure Mitral valve regurgitation Atrial fibrillation Anemia Hemorrhage Pain Vomiting Nausea Edema Table 5.5 UMLS concept unique identifiers for the ShARe annotations in Figure Figure 5.10 shows the association matrix between the present disorders in the gold standard ShARe corpus and the inferred phenotypes on the gold-standard records. There were 15 disorder concepts that were present for at least 50 patients in the dataset. As such the matrix is 15x15. Borrowing from the visuals displayed by (Griffiths and Steyvers 2004), we sorted the matrix to clearly display the ShARe annotated disorders and their mostly highly associated inferred phenotypes on the diagonal. For clarity purposes, we grouped the 15 disorder concepts based on each other s clinical similarities. For instance, 119
135 hypertension, hypercholesterolemia, and type II diabetes are often seen together in patients, and similarly for the symptoms nausea and vomiting. The figure indicates there is an association between the disorders present in the gold-standard records and their inferred phenotypes. Upon inspection of the inferred phenotypes, they are good representations of the present disorders. For instance, Phenotype 7 has the highest association with the disorder Mitral Valve Regurgitation, and its most probable observations are perfectly coherent with respect to this disease. When concepts shared clinical characteristics (e.g., nausea and vomiting or the cluster of hypertension, diabetes, and hypercholesterolemia), the associated phenotypes are also shared amongst them (e.g., phenotypes 12,13 and phenotypes 1,2). We display two more examples of phenotypes. Phenotype 10, which is associated with hemorrhage shows several diagnosis codes, all potentially leading or describing hemorrhages. Phenotype 11 is an unintepretable topic, containing highly prevalent observations throughout the MIMIC dataset Evaluation 6: Quantitative Metrics The quantitative metrics for the MIMIC ICU dataset were used to inform model selection and as such we report only the quantitative calculations for the NYPH dataset in this section. Held-out likelihood NPMI UPhenome Model x GPhenome Model x LDA-All x Table 5.6 Quantitative evaluation for the unsupervised Phenome model, the grounded Phenome model, and the LDA-all model. All of the models were run on the same input set of Columbia patients, with 750 latent variables, 0.1 for the per-patient phenotype distribution hyperparameter and for the per-phenotype data distribution hyperparameter. The UPhenome model is able to outperform both the GPhenome and LDA-all model when predicting on a held-out test set (Table 5.6). As the GPhenome model is seeded with ontological knowledge that in some cases may not be perfectly aligned with the existing data, the model s ability to predict may be hindered 120
136 and can account for the lower held-out likelihood score. The very large benefit that the Phenome models have over the LDA-all models is due to the separation of data types. The LDA-all model is not inherently separating laboratory tests from medications from diagnosis codes from words, therefore the LDA-all model has a much more difficult task of predicting infrequent data types as they are competing with the overwhelming number of words that exist in the clinical notes. In contrast to the MIMIC ICU dataset, the Phenome models outperform the LDA-all baseline with the NPMI metric. 5.6 Discussion The results of the various automated and manual evaluations suggest that the Phenome model is a promising approach to discovering models of disease. We discuss next two characteristics of our model the joint modeling of heterogeneous data types and their unsupervised modeling as well as the differences between automated and manual coherence assessments for the task of phenotyping and the effects of grounding Joint modeling of heterogeneous EHR data Previous work has shown that single data types are not sensitive enough to perform phenotyping at a high accuracy. Wei et al. demonstrated that when phenotyping ten chronic conditions, algorithms that only used single instances of billing codes as a phenotyping algorithm achieved an average F-score of 0.17, algorithms that used multiple billing code instances achieved an average F-score of However, when multiple heterogeneous data types were leveraged (billing codes, clinical text, and medications), the algorithm was able to achieve an F-score of 0.70 on average (Wei et al. 2015). The Phenome model builds upon this knowledge as it is designed to jointly model multiple, different EHR data types. The Phenome model leverages the innate heterogeneity and incompleteness of EHR data. By modeling each data type separately as opposed to a bag of observations like in the LDA-all baseline, the model can accommodate for imbalance of observations from each data type. For instance, there are many more words than diagnosis codes, even after stop words removal and vocabulary filtering. By design, the 121
137 Phenome model ensures that each data type is represented in the learned phenotypes, thus truly modeling across data types. This explains for instance, why all Phenome phenotypes given as examples in the chapter have a mix of data types, while most LDA-all phenotypes are overwhelmed by words and laboratory tests (i.e., the most common data types in our observations). The separation of each data type in the Phenome model allows for specification of informative priors that are different for each data type. The ability to enhance the Phenome model with outside clinical knowledge, and even more specifically knowledge that is different for each data type is a powerful mechanism that will be explored further in the GPhenome model work. Although the model separates the different data categories, this separation does not render the data types independent. On the contrary, because the patient-specific phenotype distribution (b) is unobserved, the data types become dependent from the explaining-away effect. Therefore, the information learned about the billing code distribution across phenotypes is dependent on the medications distribution, the laboratory test distribution is dependent on the distribution of words, and so on Generative unsupervised modeling of EHR data Like all unsupervised models, the Phenome model is exciting in its ability to discover patterns in input datasets, such as disease models. When applied to the MIMIC corpus, the learned phenotypes are representative of diseases that are documented in an intensive care unit, like acute kidney failure, while when applied to the NYPH dataset, the learned phenotypes are more representative of chronic and acute conditions that do not require intensive care, such as SLE. Without careful modeling however, unsupervised models can yield unwanted results. The LDA-all phenotypes often highlighted information about hospital course in aspects nonspecific to any underlying condition, such as coagulation status, palliative care status, type of drug exposure, and plan for discharge. All of these topics make sense and represent distinct patterns in the input datasets, but they do not represent diseases. In contrast, the Phenome phenotypes represented a greater number of distinct disease 122
138 than the LDA-all phenotypes. Furthermore, they were more clinically relevant, as multiple aspects of a given disease were included such as secondary complications or potential treatments Automated coherence metrics vs. human judgments When comparing the average coherence of the LDA-all phenotypes and the Phenome phenotypes for MIMIC ICU data, LDA-all yielded a significantly higher average Normalized Pointwise Mutual Information (NPMI) (.07 vs..014). By contrast, in the NYPH dataset, the Phenome models had much higher NPMI scores than the LDA-all baseline (0.02 vs ). NPMI was established as a valuable automated evaluation metric of learned topics and was shown to correlate with human judgments of topic coherence (Lau, Newman, and Baldwin 2014). In our experiments however, we found little correlation between the clinician s judgments and the NPMI of the learned phenotypes (Pearson R=0.31 and Spearman=0.33 over the MIMIC ICU UPhenome phenotypes and Pearson R=0.34 and Spearman =0.31 in the NYPH UPhenome phenotypes). In our settings, the Phenome model is a mixture model over text but also coded data (e.g., diagnosis codes, medications, and laboratory results). It is possible that the computationally coherent (often co-occurring terms) are not actually clinically relevant. For instance, the LDA-all phenotype with the highest NPMI contained the following most probable observations: pm total co pt potassium gap sodium urea chloride anion glucose creat hct hgb rbc mcv mchc mch wbc rdw, a mix of routine, nondiscriminatory laboratory tests. By contrast, the NYPH data deals with much more varied note types and patient diseases and may explain the low NPMI scores yielded by the LDA-all model. It is also possible that different observations within coded data types may not occur frequently together. For instance, there are several diagnosis codes which are highly clinically relevant with each other, and yet do not get coded together in patient records: different stages of pancreatic cancer for example, would make sense in a single phenotype for the disease, but will not be seen jointly over many patients at a time. 123
139 5.6.4 Effects of Grounding the Phenome model Augmenting the Phenome model with known associations that exist in clinical ontologies is able to provide more coherent and cohesive phenotypes. A phenotype may be grounded by any combination of words, diagnosis codes, laboratory tests, or medications. We found that often when a phenotype was grounded exclusively by words, the final learned phenotype often did not reflect the data it was grounded with. However, when a phenotype was grounded with diagnosis codes or medications or laboratory tests, the phenotype would resemble the prior grounding information much more strongly. We attribute these results to (i) the difference in observations counts and (ii) vague grounding of words. The differences in the observation counts means that prior pseudo count of 100 does not apply very strong grounding to words as there are many word instances but a prior pseudo count of 100 does make a large difference to a much smaller set of observations such as medications or laboratory tests. The vague grounding of the words is due to the chosen method of word grounding: taking all first-order relationships that are encoded in the knowledge base as linked with the disease and tokenizing the results. This method often results in comorbidities or vague terms such as complications and chronic being grounded to a phenotype. Although this work presents a first pass at how to incorporate clinical ontologies into the Phenome model, future work in pseudo count refinement (perhaps having a different pseudo count augmentation for each data type) and newer methods for identifying links for the chosen ontologies (perhaps only chosing words that have particular ontological relationships) may result in phenotypes that are even closer to clinicians mental models of disease. 124
140 6.1 Introduction Chapter 6: Applications to Clinical Questions In an effort to apply some of the techniques outlined in this thesis to open questions in clinical informatics, we used two techniques on two different questions. High-throughput screening of laboratory test usage using measurement motifs was a helpful technique for identifying and mitigating biases that exist in irregularly sampled data (Chapter 3), and in this chapter, we apply the same idea and similar method to identifying laboratory test overutilization by examining measurement motifs. The other clinical question tackled in this section is one of high-throughput phenotyping (Hripcsak and Albers 2013), a question of identifying cohorts of patients using EHR data. We employ the grounded version of Phenome model, which was developed to automatically learn computational models of disease (Chapter 5), to the task of automatically finding a set of type II diabetic patients from raw and heterogeneous EHR data. 125
141 6.2 Leveraging measurement motifs to study inappropriate use of laboratory tests Introduction A recent report from the Institute of Medicine estimates that as much as 30% of healthcare costs in the United States are a result of unnecessary care. Finding ways to reduce unnecessary care can ease some of the healthcare cost burden without affecting the quality of patient care (Smith et al. 2013). One major contributor to excessive healthcare costs is the over-ordering of laboratory tests. Laboratory test orders recorded in an institution's EHR can be analyzed to identify patterns of ordering across a large patient population, study adherence to existing ordering guidelines, and quantify potentially unnecessary care. This approach is especially attractive for high-volume tests, for which robust pattern analysis can be conducted and for which guidelines have been specifically constructed through detailed analysis of the latest research and expert panel discussions to maximize the test s utility. One frequently ordered laboratory test with specific ordering guidelines is Glycated Hemoglobin A1c (HbA1c). HbA1c is the measure of average blood sugar control over 6-12 weeks. The healthy range of HbA1c is between 4-6% and diabetic patients have higher HbA1c values. Although diabetic classification as controlled and uncontrolled is usually measured with blood glucose measurements, it is commonly reported that the desired HbA1c level for a controlled diabetic is less than 7%. For uncontrolled diabetic patients, HbA1c levels often rise much higher. Historically, HbA1c has been a standard test for the monitoring of diabetes: in 2002 the American Diabetes Association (ADA) established that uncontrolled diabetic patients should have their HbA1c measured every 3 months and controlled diabetic patients should have it measured every 6 months (Sacks 7 This chapter was originally published in JAMIA. The full citation for this publication is: Pivovarov R, Albers DJ, Hripcsak G, Sepulveda JL, Elhadad N. Temporal Trends of Hemoglobin A1C Testing. JAMIA. 2014;21:
142 et al. 2002). Recently, new evidence suggests HbA1c can be used for the diagnosis of diabetes as well (Selvin et al. 2010; Handelsman et al. 2011). The 2009 ADA guidelines incorporated this finding and began recommending the use of HbA1c for the diagnosis of diabetes (International Expert Committee 2009; American Diabetes Association 2010). These guidelines state that if a patient has a HbA1c value of 6.5% or more for the first time, the patient should be retested (on a different day) to confirm the diabetes diagnosis; unless the patient exhibits clinical symptoms or has a blood glucose >= 200 mg/dl (American Diabetes Association 2013), then no retesting is necessary. The presence of guidelines (both in 2002 and 2009), along with the sharp distinction of how HbA1c should be ordered for monitoring and for diagnosis, both provide a point of comparison when analyzing patterns of HbA1c ordering. Despite these widely publicized guidelines for diabetes care, there are numerous reports of overordering of HbA1c labs. In a study focusing on newly diagnosed diabetes patients, HbA1c orders were analyzed over a period of two years (Laxmisan, Vaughan-Sarrazin, and Cram 2011). It was found that 8.4% of patients (N = 11,003) received at least one repeat HbA1c within 30 days of their initial test and 30.8% (N = 40,162) within 90 days. A more recent 10-year retrospective analysis at a UK university hospital found that 21% of 519,664 HbA1c orders were ordered too soon (as defined by sooner than 6 months for patients with < 7% HbA1c and less than 2 months for patients with 7% or over) (Driskell et al. 2012). Striking differences have been shown in the frequency of HbA1c orders across different healthcare settings. In a study at a Turkish university hospital, 10.3% of all 10,496 HbA1c orders over a two year study period were performed within less than a month of one another and when looking only at inpatient orders, 33.8% were found to be ordered within less than a month (Akan et al. 2007). Other studies have also found inappropriate repeat testing more frequent in hospitalized patients (van Walraven 2003; Salvagno et al. 2007). In this study, we focus on the overall temporal trends of HbA1c ordering across a 15-year span. Thus, we explore the ordering patterns across both inpatient and outpatient data points, as there might be an impact on ordering patterns for patients transitioning between outpatient and inpatient settings. 127
143 In this work, we analyze HbA1c laboratory test order data over a 15-year longitudinal time scale that covers the release of two separate ADA guidelines; thereby giving us an opportunity to retrospectively study the influence of both guidelines over time. Guidelines for HbA1c provide instruction on when to measure HbA1c for different types of patients. Specifically, we study how well both the diagnosis guidelines and the monitoring guidelines are being followed at our institution. Because of the large patient population with diabetes, HbA1c is a high-volume test and is one of the most frequently ordered tests in our institution. We comprehensively examine all of the HbA1c measurements in our clinical data warehouse; regardless of who is coded for having diabetes to generate a more complete view of the HbA1c measurement trends. We are also in position to link clinical notes to ordering patterns in order to qualitatively assess the reasons behind the ordering patterns we observe. We ask the following research questions: (i) What are the patterns of ordering HbA1c in a large patient population? (ii) Do HbA1c orders follow guidelines with respect to frequency of measurement? and (iii) If patterns of ordering do not follow guidelines, in which ways do they depart from the guidelines and what are potential explanations for the departure? Methods for Identifying HbA1c Temporal Trends We collected all HbA1c measurements in the NYPH data between January 1996 and December All measurements were included in the dataset, i.e., there were no selection criteria for the patients. Each data point consisted of a tuple (patient identifier, timestamp of individual measurement, and corresponding value). Patterns of HbA1c Ordering through Time To capture total yearly ordering patterns, we looked at all HbA1c orders performed in our institution. Across all 15 years, we report counts of HbA1c orders and stratify the counts by the numerical HbA1c values. 128
144 HbA1c Ordering Patterns Pre vs. Post 2002 Guidelines The 2002 ADA guidelines established that patients with controlled diabetes should be monitored every six months and patients with uncontrolled diabetes should be monitored every three months. To verify the extent to which these guidelines had an impact on practice, we aggregated our institution s HbA1c measurement data into two subsets: pre-guideline measurements ( ) and post-guideline measurements ( ). For each year, we include only tests that are conducted within the same calendar year; therefore, tests that are conducted in December and repeated in January of the next year are not included in our results. To visualize repeat ordering patterns, we aggregated data in the following way. For each patient s HbA1c time series we calculated the days between two consecutive measurements within a year and aggregated across all patients. A histogram was created for each year mapping the gap between consecutive measurements and number of such measurement pairs across the dataset that year. For instance, if a patient had two consecutive measurements 132 days apart and both measurements occurred in 2007, this would contribute twice to the 132-day gap for To test whether there was a change between the pre- and post-guideline ordering patterns, we performed a two-sample Kolmogorov-Smirnov (K-S) test (Massey 1951). The K-S test measures whether the pre- and post-guideline samples come from the same distribution. To quantify the specific differences in pre- and post-guideline periods, we performed an L 1 distance calculation separately on the 0-90 day and the day sections of the distribution. For the L 1 distance calculation, we transformed the discrete measurement counts for the pre- and post-guideline periods to probability density functions (PDFs) representing the probability of every measurement gap across the time period. We quantified the difference between the pre- and post guideline PDFs using the absolute difference between the distributions (i.e., the L 1 distance) defined by: w x, y = } { * ~ { w 129
145 Here, f 1 and f 2 are the probability density functions and a, b represent two time points. Additionally, to visualize measurement frequency differences between controlled and uncontrolled diabetic patients we created a density plot of the joint probability of HbA1c value and time to next measurement. This comparison is important as ADA guidelines are defined based on controlled and uncontrolled diabetic patients, that correspond to glucose and HbA1c levels. We hypothesize that high HbA1c values alert the physicians to an uncontrolled diabetic thereby influencing the patient's time to next measurement (likely closer to 3 months). Alternatively, a well-controlled diabetic patient would likely not be tested for another 6 months. Finally, to enable comparison to prior work that focuses on over-testing of well-controlled diabetics, we used HbA1c <7.0% as a proxy measure for well-controlled diabetes and calculated how many of the total HbA1c orders each year, are unnecessary (repeated within 180 days for a patient with HbA1c < 7.0%). Diagnostic Use of HbA1c Ordering Considering the 2009 ADA's recommendation for diagnostic use of HbA1c (when a patient has an HbA1c of >=6.5% for the first time, it is then encouraged to have the patient s HbA1c retested on another day to confirm a diabetes diagnosis), we tracked the values of the measurements across gaps. Our hypothesis is that rapid re-measurement of HbA1c (within 10 days) is due to the occurrence of a first high value. To test this hypothesis we looked at the proportion of rapidly retested HbA1c s that follow the diagnostic guidelines. Finally, we qualitatively assessed reasons that guideline deviations may occur by reading a sampling of clinical notes of patients who had HbA1c tests repeated within ten days Results of Temporal Analysis of HbA1c Measurement Overall, our dataset consisted of 397,926 HbA1c orders, measured for 119,691 unique patients across 15 years. The maximum number of orders per patient was 150, and the average was 3.32, with a large standard deviation of 5.83 orders. The high variance we observed is due to the various characteristics of our EHR data. As we are not filtering our population for only diabetic patients we have 130

146 large differences between regularly monitored patients and those who were tested once for screening purposes. In addition, we have a sparse dataset of patients some of whom may not be regularly followed up at the outpatient clinics and others who receive their care in other institutions. Patterns of HbA1c Ordering Over the 15-year period from , there was an increase in the raw number of HbA1c tests at NYPH (Figure 6.1). This increase follows a general increase in measured patients (6,232 patients who had their HbA1c measured in 1996 to 31,765 patients in 2010). Over the 15-year period, the rates of HbA1c testing have remained fairly steady, between tests per patient per year, with a very slight upward trend. The increase of tests with <6.5% values is consistent with the use of HbA1c for screening purposes, as most screened patients will be normal. Number of HbA1c Laboratory Tests Ordered HbA1c < 6.5% 6.5% < HbA1c <=7.5% 7.5% < HbA1c <=8.5% HbA1c > 8.5% Years Figure 6.1 Counts of all HbA1c orders over the years , stratified by HbA1c numerical value. This figure includes all patients with at least one HbA1c measurement. 131
147 To adjust for diabetes screening, we report statistics for patients who have had at least two HbA1c measurements within their record. There is still a steady increase of measured patients (4,434 in 1996 to 19,302 in 2010) and a steady increase from 2.3 tests per patient per year in 1996 to 3.09 in Pre and Post 2002 Guideline Ordering Patterns The two-sample K-S test showed a statistically significant difference between the measurement gap counts in the pre and post guideline time periods (p<0.001). By estimating the probability density functions of the measurement gap counts, we found the measurement gap distribution changed from a fairly unimodal to a bimodal distribution (Figure 6.2). The modality shift shows that a mostly homogenous dataset of measurement gaps transformed into a heterogeneous dataset. We observed that that the probability density functions of the pre and post guidelines measurement gaps were highly similar after 3 months, both sharply peaking at the 3-month time frame and the post-guideline curve having a slight peak at 180 days. Figure 6.2 Probability density function estimated using a kernel density estimate on the aggregated gaps between HbA1c measurements for both the pre-guideline period ( ) and the post-guideline period ( ). Noting that the two distributions look very different in the 0-90 days time frame, we performed a separate L 1 distance calculation for two parts of the distributions (0-90 day gap, day gap) to 132
148 quantify the differences in the distributions. We were able to detect an order of magnitude difference in the L 1 distances: L 1 (0-90 days) =.0012 and L 1 ( days) = We observed a sharp transition in 2002 in how patients are measured on short time scales of less than 90 days. This implies that how patients' HbA1c values are measured on time scales of longer than three months has not changed in 1.5 decades whereas there was a dramatic change in how patients' HbA1c values are measured on time scales of less than three months starting in approximately In addition to measurement gaps, we evaluated how values correlated to measurement gap in both pre and post 2002 guideline periods. Figure 6.3 is a density plot representation of the joint probability of each HbA1c level and the time to next measurement for both time periods. Figure 6.3 Joint probability between each HbA1c percentage and time to next measurement before the 2002 guidelines (left) and after the 2002 guidelines (right). The density plots indicate a change in ordering after the 2002 guidelines as well. Before the guidelines were released, there is almost no correlation between HbA1c value and time to next measurement; most of the population is measured between 60 and 500 days irrespective of the patient s value. After the 2002 guidelines, we see a much more prominent correlation between HbA1c value and time to next measurement as shown by the L-shaped curve; having a higher HbA1c value prompts quicker retesting (around 100 days) while lower HbA1c values have higher probabilities of being measured at longer time scales. If one's diabetes is more controlled (towards the left of the x-axis), there is a longer time to next measurement. 133
149 However, when looking specifically at unnecessary repeat tests for well-controlled diabetics (repeats within 180 days for patients with HbA1c < 7%), we still find that rates of inappropriate use increase over time. Between , 3.8-6% of the HbA1c tests were repeated inappropriately. After 2000, inappropriate testing rose to %, growing to over 20% in 2004 and remaining stable between 19-20% until Diagnostic Use of HbA1c After 2002, we found growing numbers of HbA1c tests repeated within 10 days. Orders repeated within 10 days accounted for 1-2% of all HbA1c orders in , and grew to % after Therefore, we examined the dataset in multiple ways to investigate whether the repeats were for justified diagnostic purposes or whether overutilization may be occurring. The 2009 guidelines for diabetes diagnosis allow for HbA1c rapid retesting if the patient exhibits a HbA1c value of >=6.5% for the first time. Looking across all 15 years, we tested whether the patients with rapid retests meet the criteria for a diagnostic measure. Surprisingly, in 1996, 37% of retests were justified, whereas only 13% in 2010 were justified according to the 2009 guidelines (Figure 6.4). 134
150 Figure 6.4 Proportion of HbA1c measurements taken within 10 days that follow the appropriate guidelines for diagnostic use. This graph only examines HbA1c repeated orders that are within 10 days. Each point was calculated per year as: (# of 10- day repeats where the initial test result was a patient s first HbA1c of 6.5%)/(all 10-day repeats). We find that the rapidly repeated tests cannot be explained by adherence to guidelines. In fact, over time, a larger portion of rapid repeats is conducted on HbA1c tests with lower values even as there is no justification for any <=10 day repeats when a value is <6.5%. In particular, beginning around the year 2000, between 40-50% of the rapidly repeated tests were ordered for the lowest of HbA1c values (Figure 6.5). 135
151 HbA1c tests repeated within 10 days stratified by value 80% 70% 60% 50% 40% 30% 20% 10% 0% HbA1c <6.5% 6.5% <= HbA1c < 7.5% 7.5% <= HbA1c < 8.5% HbA1c => 8.5% Year Figure 6.5 Numerical stratification of HbA1c tests reordered within 10 days over the years The overall rate of rapid retesting has grown similarly across all HbA1c values (Figure 6.6), but as the number of initial <6.5% orders has increased over time so has the number of inappropriately retested HbA1c tests. From , we find that 1-2% of HbA1c tests with an initial <6.5% value are rapidly retested and after 2001, 2-3.6% are rapidly retested. As a means to better understand the rapidly retested HbA1c phenomenon, we conducted a manual chart review for a subset of 100 randomly chosen patients that had HbA1c rapid repeats. A common pattern we identified was outpatients receive a HbA1c test, are admitted to the hospital a few days later and have a repeat HbA1c upon admission to the floor. This could be indicative of care-coordination issues where inpatient physicians are unaware of their outpatient counterparts ordering the HbA1c test only a few days prior (even though the laboratory results are visible in the EHR). Multiple times, consecutive outpatient visits within 10 days resulted in HbA1c being tested during several of the visits. This could also point to care-coordination issue amongst clinicians with different specialties (even though, once again, the laboratory results are visible in the EHR). Such care-coordination issues could lead to providers ordering a second initial HbA1c test, without realizing there already exists an initial test result. 136
152 Another pattern we identified was a retest of HbA1c because the value was much lower than expected; specifically, a HbA1c result seemed too low given a patient s previous history and therefore the same physician re-ordered the test; sometimes the clinical notes even referred to the surprisingly low first value. Finally, we found that between 5-10% of the rapid repeat tests were a result of physicians conducting point-of-care HbA1c testing and ordering a confirmatory laboratory-run test HbA1c test. Figure 6.6 Percentage of HbA1c tests that are reordered within 10 days over the years , stratified by numerical value Discussion Distributional analysis over time of consecutive HbA1c measurements frequencies has uncovered a number of phenomena. Overall, the raw number of HbA1c tests has increased over time. This can be explained in part by the natural increasing number of patients coming to our institution for care and in part by the increasing number of patients with diabetes. In addition to the general increase in testing, we 137
153 also see evidence for increase of inappropriate use from the growing number of very short gap measurements (between 0-10 days) over the 15-year period. We note that some of the measurement patterns established by the 2002 and 2009 guidelines predate their releases, although there were publications that hinted at diagnostic and monitoring recommendations before the guidelines as well (Goldstein et al. 2004; Singer et al. 1989; Peters et al. 1996). It seems that physicians have been using HbA1c as a diagnostic measure for at least 6 years before the official ADA guidelines which recommended HbA1c's usage for diagnostic purposes were released; we can see this by the prominent peak of short gap measurements that begins to appear around Additionally, we are able to see that during the mid 1990s, before the 2002 guidelines specifying 3 and 6- month measurement intervals were released, there were already slight peaks at those two measurements gaps. Overuse of HbA1c Measurements: Retesting Within 10 Days While clinicians roughly follow the 3-month and the 6-month guidelines, we find that there is a strong signal for seemingly unnecessary repeated measurements within 10 days. The findings from this study are well aligned with recent literature about HbA1c measurement dynamics and the overutilization of HbA1c over short periods of time. For instance, Lyon et al (Lyon et al. 2009) also uncovered a highly prevalent short-gap peak, but their peak was at approximately 30 days, not as short as the time gap in our dataset. By comparing ordering distributions in our dataset we find the trend towards repeated testing over very short time periods (<= 10 days) is increasing in volume and is the most frequent in In conjunction with a general increase in tests with values HbA1c <6.5%, we uncover a troubling trend: a growing proportion of rapid retests are conducted on tests with values <6.5%, despite ADA guidelines only recommending rapid retests on a subset of >=6.5% tests. Moreover, the signal stays salient, even after controlling for the usage of HbA1c as a diagnostic tool through two tests a few days part. Based on the results illustrated in Figure 6.4, we postulate that between 65-85% of the HbA1c repeat measurements occurring within 0-10 days are unnecessarily ordered a total of 9,491 tests from 138
154 The 9,491 tests represent HbA1c repeat test overutilization rate of 2.3% across the entire 15- year period. We use the Medicare reimbursement of $13.24 per test to estimate an unnecessary expenditure of approximately $125,600 at just one hospital in New York City. This figure does not account for personnel, laboratory time, ordering or interpretation time, any patient care costs, or over ordered laboratory tests as a result of transferred patients and a lack of health information exchange, which has also been shown to contribute to laboratory test overutilization (Stewart et al. 2010). There are many potential explanations for the increasing rate of overuse of HbA1c tests. The addition of HbA1c to preset laboratory order panels may lead to the retesting, as often it is more efficient for the clinician to order an entire panel rather than remembering to exclude the HbA1c test. Another reason for this trend could be a consequence of guideline-induced over-vigilance; providers are intent on following the monitoring HbA1c guidelines but do not always remember to check whether an HbA1c result has been recently recorded. In this chapter, we provided a methodology for studying utilization patterns that serves as a useful diagnostic approach for identifying trends of inappropriate laboratory test use over time. We analyzed the laboratory measurements of HbA1c for all the patients in our institution, over 15 years. Our study replicates prior work on HbA1c overutilization and offers new insight into the trends of laboratory ordering over time, in particular pre- and post-guidelines for diabetes monitoring, correlations between HbA1c value and testing frequency, and the use of HbA1c as a diabetes diagnostic tool. With the number of diabetes patients expected to continue to grow (Huang et al. 2009), it is essential to identify the ways in which HbA1c ordering is misused. Our study contributes to this effort. Impact on Informatics Research As the number of EHRs across the country increases, there is a growing potential for pertinent and effective IT interventions to help optimize healthcare resources, as well as to ensure that that clinicians adhere more closely to national guidelines for testing (Baron and Dighe 2014). For instance, identifying rapid retests of HbA1c as a strong pattern in an institution, the EHR could now implement a module that denies rapid retest of HbA1c without appropriate reasoning from the ordering physician, and perhaps 139
155 require a phone call to the laboratory to verify the need for a second test. Alternatively, there could be a systematic review and removal of HbA1c from laboratory test order sets. Our work on trends in measurement gaps is relevant to large-scale data analysis work in informatics as well. To properly study large patient populations (in our case, across the entire EHR), it is helpful to stratify or decompose the population into homogenous data points (Pivovarov et al. 2014). In the pre guideline period, the distribution of HbA1c data points by gap is mostly unimodal, but the postguideline period shows that the distribution changes towards a bi-modal distribution. Thus, the population of laboratory measurements is decomposable according to different reasons, some health-related (measurements 3 months apart for uncontrolled diabetic patients), but some for reasons that might not be health-related (measurements less than 10 days apart). The ability to quantify and recognize decomposable and not decomposable distributions of data points when performing large-scale research on the EHR is critical to ensure precise and robust inference. 6.3 Leveraging the Grounded Phenome model for cohort identification Introduction Performing cohort selection, or phenotyping, for clinical research studies is an important area of informatics research. The ability to accurately gather cohorts is necessary to perform studies on the exploding amount of electronic patient record data; studies on pharmacovigilance, comparative effectiveness, disease progression, and many others often rely on robust ways to measure cohorts. Recently, a consortium of informatics researchers (the emerge network) began creating repository of algorithms for selecting EHR patients with certain diseases. ( The algorithms use rule sets based on recorded laboratory tests, medications, billing codes, etc. to identify a set of case patients and control patients. The algorithms have been shown to have high specificity and positive predictive value and have been replicated across a handful of institutions. However, these algorithms have a few 140
156 drawbacks: (i) the phenotype definitions are very labor-intensive, include iterative design processes, and require the insight of clinical experts; (ii) as the process is so involved, there is very limited coverage of diseases that have an emerge algorithm created; (iii) the diseases are treated as binary events, a patient has the disease or not there is no severity scale or ranking or probability of having the disease. The Phenome model (presented in Chapter 5), presents an alternative to rule-based phenotyping. As the Phenome model learns phenotypes directly from the structure of the data (with the GPhenome model incorporating encoded clinical knowledge to provide prior information that can guide the phenotypes to be more clinically relevant), the model does not require heavy expert involvement. The model is able to learn the composition of many diseases at once, and because it was constructed in a probabilistic graphical modeling framework, it represents diseases states as probabilities: each patient has a certain probability of being ill with each disease. Because of the benefits outlined above, the Phenome model is an attractive alternative, leveraging unsupervised computational techniques for creating initial phenotypes, which can then be further refined by experts. In this study, we assess the ability of the GPhenome model to gather patient cohorts and directly compare the GPhenome model method with the emerge algorithm. We focus on identifying a cohort of Type 2 Diabetes Mellitus (T2DM) patients as it is a highly prevalent disease in our population and there exists a validated emerge phenotyping algorithm for it Methods for Identifying Type II Diabetics from EHR data The grounding of the Phenome model creates nonexchangeable phenotypes by augmenting counts for certain observations and for certain phenotypes. These observation-phenotype links that inform the augmented counts are automatically derived from clinical ontologies. In turn, these augmented counts form informative priors and encourage the formation of more cohesive and representative phenotypes. For this phenotyping study, we chose to use the grounded version of the Phenome model (GPhenome). 141

157 The specific observations that were automatically identified from the clinical ontologies as related to T2DM are displayed in Figure 6.7. These observations are weighted more heavily in the GPhenome model prior for the T2DM phenotype. Figure 6.7 The diabetes prior that was input to ground the Phenome model for T2DM. Billing codes are in blue, words are in purple, and medications are in grey. The GPhenome model was applied to the outpatient NYPH dataset described in section 5.4.1; each patient is represented by a recent outpatient time slice of their record. GPhenome was learned on the training set of 9,828 patients and tested on held-out test set of 2,457 patients. The GPhenome model was run with the same parameters as described in section (P=750, α =0.1, [µ, ν, ξ, π]=0.001). After the 750 phenotypes were learned, a clinical expert reviewed the phenotypes and identified two that represent T2DM (Figure 6.8). (a) The T2DM phenotype learned around the grounded priors for T2DM (b) The additional T2DM phenotype learned by the GPhenome model. Figure 6.8 The two T2DM phenotypes used for identifying T2DM case patients. Using the GPhenome model inference mechanism, we inferred a distribution over phenotypes for each patient in the test set. As the GPhenome model assigns a weight to each phenotype for each patient, we 142
158 were able to rank the patients identified by the weight of their T2DM phenotype. The T2DM weight of each patient was calculated as the sum of their weights for both of the T2DM phenotypes (Figure 6.8). This ranking provides a way to list patients by how prevalently the T2DM diagnosis is discussed in their record with respect to other diseases. Study 1: Precision-Recall of the GPhenome model Evaluation of the GPhenome model s ability to identify patients who are Type II diabetics included the calculation of a precision-recall curve for a random 10% subset of the the test patients (246 patients). Gold-standard labels were assigned based on a chart review. A clinician was given the patient MRN, the patient record-slice date range, and asked to answer the question: If all you have is the information contained in the EHR within this date range, do you think this patient has T2DM? Study 2: Direct comparison of GPhenome and emerge In order to directly compare the GPhenome model with a well-accepted algorithm for phenotyping, the emerge algorithm for T2DM was implemented. The emerge T2DM case algorithm presents five ways in which a patient can be classified as a T2DM patient; these five ways use four data types: medications, ICD-9 codes, laboratory tests, and problems lists. For example, one way that a patient can be classified as a T2DM case is by having no Type I diabetes mellitus (T1DM) diagnosis codes, at least one T2DM medication and at least one abnormal glucose or HbA1c laboratory test result. The full algorithm flowchart can be found at: The algorithm applies a set of strict criteria aiming to ensure that well-documented T2DM patients are captured and no T1DM patients are captured; the algorithm stipulates that if a patient has any T1DM diagnosis codes recorded, they cannot be considered at T2DM patient. Although the algorithm generally performs with a % positive predictive value, it has been demonstrated that the strict criteria for T2DM case definition may actually omit many true cases resulting in low sensitivity of 32% (Fort, Wilcox, and Weng 2014). To ensure proper comparison of the GPhenome model and emerge, both algorithms are applied on the held-out test set of 2,457 patients (the GPhenome model is learned on the training set of 9,828 patients). 143
159 To compare GPhenome to the emerge model (which outputs a cohort of patients), а probability threshold must be chosen. The GPhenome model assigns each patient a non-zero weight for every phenotype, therefore, a threshold was chosen to separate patients without T2DM from those with T2DM, we examined the distribution of T2DM weights visually (Figure 6.9) and chose a threshold of 0.01, excluding the patients at the head of the distribution. Figure 6.9 Distribution of T2DM phenotype weights. The dotted line represents the chosen threshold of 0.01, those patients with a weight at or over the threshold were chosen as T2DM case patients. Additional constraints were applied to GPhenome in order to match the emerge algorithm s removal of T1DM patients (to ensure that the T2DM cohort was not diluted by type I diabetics). The final selection criteria for a T2DM case patient was: Combined weight 0.01 for the T2DM phenotypes and Combined weight for the T1DM phenotypes (Figure 6.10) < combined weight for the T2DM phenotypes. 144
160 (a) The T1DM phenotype learned around the grounded priors T1DM. (a) The additional T1DM phenotype learned by the GPhenome model. Figure 6.10 The two T1DM phenotypes used for ruling out case patients that may have T1DM instead of T2DM. The evaluation of the patient cohorts selected by the two different models included calculation of sensitivity, specificity, positive predictive value, and F-measure. To estimate these metrics, a clinician conducted chart reviews of 50 random patients selected as cases by emerge, 50 random patients selected by GPhenome, and 50 patients that neither model selected. The clinician was given the patient MRN, the patient record-slice date range, and asked to answer the question: If all you have is the information contained in the EHR within this date range, do you think this patient has T2DM? The MRN list was randomly shuffled and the clinician was not told which algorithm selected which patient. As the GPhenome model assigns a weight to each phenotype for each patient, we are able to rank the patients identified by the weight of their T2DM phenotype. This ranking provides a way to list patients by how prevalently the T2DM diagnosis is discussed in their record in contrast to other diseases. We evaluated the GPhenome model ranking by using the precision at K metric, where K=50. To calculate the precision at K, the clinician was asked to also to do a chart review on the ranked top 50 patients (again, with no knowledge that these were derived from GPhenome). Finally, to assess the threshold of 0.01 as a phenotype weight for who a true T2DM patient is, a precision-recall curve was created on a subset of the 2457 test patients. A randomly selected 10% subset of all test patients was labeled as having T2DM or not having T2DM with the same question as before, If 145
161 all you have is the information contained in the EHR within this date range, do you think this patient has T2DM? Results of the Type II Diabetes Cohort Identification Study 1: Precision-Recall of the GPhenome model The 10% subset of test patients were ranked by their combined probabilities for the two T2DM phenotypes. Using the chart review results, a precision-recall curve was created (Figure 6.11); the associated area under the curve was Figure 6.11 Precision-Recall Curve for T2DM Cohort Selection. Study 2: Direct comparison of GPhenome and emerge Out of the 2457 test patients, the emerge algorithm identified 402 diabetic patients (16.4% of the total test patients). The GPhenome model algorithm identified 497 diabetic patients (20.2%). Overall, the probabilities of T2DM inferred for the test patients ranged from 1-12%. Although there was some 146
 were calculated by extrapolating from the randomly sampled patients evaluated by the clinician.")
162 overlap between the identified patients, almost 70% were only identified by one of the two algorithms (Figure 6.12). Figure 6.12 Overlap between cohorts identified by GPhenome and emerge cohorts. The performance measures (Table 6.1) were calculated by extrapolating from the randomly sampled patients evaluated by the clinician. A bootstrap procedure was used to estimate the 95% confidence intervals. Sensitivity Specificity PPV F-measure Grounded Phenome Model [95% CI: ] [95% CI: ] [95% CI: ] [95% CI: ] emerge algorithm [95% CI: ] [95% CI: ] [95% CI: ] [95% CI: ] Table 6.1 The statistical measures of performance for emerge and GPhenome. In addition to the measures of classification accuracy, the expert performed an evaluation of the GPhenome model ranking. The clinician found that 100% of the top 50 GPhenome-identified T2DM patients were true T2DM patients. 147
163 6.3.4 Discussion The results of cohort selection by the two models suggest that cohorts selected by emerge rulebased algorithms could be greatly augmented by the use of the GPhenome model. We discuss the benefits of using GPhenome for cohort selection below. The GPhenome model maintains the portability of other cohort selection tools. emerge algorithms are specifically constructed around widely-used terminologies for the purposes of portability; any institution can apply the emerge rules and gather a patient cohort. As the GPhenome model is an unsupervised algorithm that learns computational disease models specifically from input data and publically available clinical ontologies, it can also be implemented at any institution. As an inherent benefit of being a probabilistic graphical model, the GPhenome model assigns a weight to each phenotype, for each patient. In contrast to the emerge algorithms which present a binary result of a patient being a case or not a case, the GPhenome model has the ability to rank patients by their phenotype weight. This ranking enables researchers to set thresholds based on their desired cohort size, sensitivity/specificity constraints, and even the presence/absence of other diseases and comorbidities as we demonstrated by the T1DM weight constraint. To examine why some patients were captured by GPhenome and not by emerge, we conducted a small and an informal chart review. We found that in some cases, most of the diabetic evidence was in the clinical notes and therefore missed by the emerge algorithm. In many other cases, the reason for exclusion was the coding of T1DM diagnosis code. T1DM codes are often recorded by mistake for T2DM patients because of how similar the diagnosis code numbering is for the two diseases (250.0 vs ); the emerge algorithm filters these patients out by design. The GPhenome model, however, weighs the T1DM diagnosis code along with other T1DM evidence and assigns each patient a probability of being ill with T1DM. Unfortunately, it is more difficult to assess the reason that some patients were included by emerge but excluded by GPhenome given the probabilistic nature of the model and lack of 148
164 explicit rule sets. However, the results of the precision-recall curve demonstrate that reducing the current threshold of 0.01 could yield a larger set of true T2DM patients and have higher accuracy results. In future work we will continue to refine the grounding, as ideally the grounding regimen would provide one phenotype representing the T2DM disease. However, the current grounding mechanism employed in GPhenome already enables a smaller set of relevant disease models. In the UPhenome model, there exist seven phenotypes that represent T2DM, three phenotypes that represent T1DM, and one phenotype that is a mixture of both diabetes types. In contrast, the GPhenome model only has two phenotypes for T2DM and two phenotypes for T1DM. These experiments demonstrate that a probabilistic technique and model such as the GPhenome model provide a promising platform for high-throughput phenotyping. The results obtained by the GPhenome model are comparable to emerge results and carry the following additional benefits: (i) the unsupervised nature of the model learns directly from the data; (ii) the algorithm learns many computational models of disease at the same time, greatly reducing the amount of expert time needed; and (iii) the model enables ranking of patients by probability of having the phenotype. With further model refinements in areas such as data-type specific modeling, incorporation of new data, and grounding technique enhancements, we believe this model will provide a new platform for phenotyping across many different institutions. 149
165 Chapter 7: Conclusions and Future Work 7.1 Conclusion The concluding chapter of this thesis focuses on summarizing the research presented, highlighting the contributions of this work, detailing the limitations of the studies described, and the offering potential directions for future work. Chapter 2 outlined the research conducted in the field of clinical summarization and identified a set of gaps that remain in the published literature including methods for dealing with redundancy, methods for mitigating the biases caused by irregular sampling, and methods for automatically determining what pieces of a patient record should be highlighted and what pieces should be discarded from a summary. The first study (Chapter 3) dealt with the question of abundant textual redundancy in clinical text: the chapter presented a hybrid approach to identifying redundant concepts in patient records. The second study (Chapter 4) focused on irregular sampling in laboratory tests: the study demonstrated the importance of patterns of missingness in laboratory tests and displayed the benefit of including these patterns in clinical modeling. The third study (Chapter 5) focused on the question of saliency and featured a probabilistic graphical model created for summarizing EHR data. Finally, Chapter 6 described two separate studies: one which explored the patterns of missingness and temporal trends of 150
166 laboratory tests in the context of overutilization and guideline adherence, and another which examined the practicality of the using the probabilistic graphical model for automated high-throughput cohort selection. 7.2 Contributions The immense amount of EHR data collected as a byproduct of routine patient care provides a unique platform to perform large-scale research studies of human health. Through careful analysis of the variables in this vast dataset, researchers can conduct a variety of multifaceted studies such as prediction of future patient health state, evaluation of intervention effectiveness, computational disease modeling, and identification of dangerous drug-drug interactions (Prokosch and Ganslandt 2009; McCarty et al. 2011; Xiaoyan Wang et al. 2008). This dissertation contributes to the growing body of research on how to best use EHR data for a variety of tasks. The work described here specifically investigates the challenges in leveraging EHR data for automated patient record summarization. The specific contributions of this thesis are: Context-specific concept aggregation. Mapping clinical term mentions to semantic concepts in an ontology provides valuable abstraction from lexical variants present in text. But some concepts might need to be further aggregated in order to avoid problems of signal dilution. Our approach described in Aim I scores the similarity of two input concepts by combining complementary information derived from usage patterns of clinical documentation, accepted definitions, and position of the concepts in an ontology. Our experiments show that, given a homogeneous corpus of clinical notes, it is possible to determine automatically which concepts convey similar meaning in the context of the corpus with accuracy above that of previously proposed methods. Our work provides evidence to show that the similarity of clinical concepts depends on a patient s health history, an insight that can help guide future semantic similarity work for the clinical domain. Our method for identifying context-specific similar concept can be used as a pre-processing step in 151
167 many clinical NLP applications. In addition, we contribute a novel way of combining insights from text written by clinicians and from ontological concept definitions and locations. Demonstrating EHR biases in laboratory tests using missingness patterns. In Aim II, we show that surprisingly, there is often little shared information between laboratory test values and the laboratory test s rate of measurement in time. Furthermore, measurement patterns are useful features to use in disease modeling and they can result from a combination of hospital workflow practices and clinical states. When the clinical and documentation biases are not in concert (as is often the case with laboratory tests used for multiple purposes), EHR-driven association studies may produce biased results. We catalogued the measurement dynamics of laboratory tests into three motifs, one of which has mixed patterns of measurement and is prone to biases. For the re-use of clinical data to facilitate novel data-driven informatics research, understanding salient features and correcting for EHR biases is a necessary step. We demonstrate and present a method for how to control for the biases by disambiguating patient health states based on laboratory measurement frequency, using the laboratory test lipase and acute pancreatitis as an illustrative example. With this work we show that incorporating the temporality of laboratory tests, and specifically by capturing the phenomenon of irregular sampling and missing data, we can better understand the clinical state of a patient. Laboratory tests were used to demonstrate the usefulness of missingness patterns, however this intuition can be applied to other clinical data as well, such as diagnosis or procedure codes. Identifying HbA1c overutilization using temporal distribution analytics. With the growing interest in detecting redundant and inappropriate laboratory test utilization (Zhi et al. 2013; Bates et al. 1998), we apply the methodology and insight learned in Aim II to identify overutilization of HbA1c in a large academic medical center. The methods described in this study can easily be replicated to other high-volume tests. As more data-derived patterns of use are detected across labs, we can start to better understand key aspects of clinicians' workflow and what informatics solutions can be put in place to support clinicians for quality care all the while ensuring cost effectiveness. 152
168 Creating a probabilistic model to learn computational representations of disease across heterogeneous EHR data types. We show that latent variable models can be leveraged to handle some issues with EHR data. For instance, the model s probabilistic framework enables modeling and reasoning over uncertain data; they can handle sparse data; they come equipped with mechanisms for tractable and scalable computation, and many of them are able to produce interpretable results. Aim III details the creation of a new latent variable model that uses probabilistic graphical modeling techniques for identifying salient parts of patient records. We show that learning phenotypes directly from raw and heterogeneous patient records by separately but jointly modeling different EHR data types, is able to automatically derive coherent and useful computational models of disease. Display a methodology for combining data from different and disparate EHR systems. The methods used to create the Phenome model are capable of combining data from different EHR systems to create a unified patient summary. The input patient data to the Phenome model was derived from two different systems used by Columbia University physicians: SCM CROWN and Allscripts. This work demonstrates the potential for probabilistic graphical models to easily integrate and aggregate data from separate EHR systems which is an important contribution to the Health Information Exchange initiatives across the nation. Presenting a method to enhance computational models of disease with clinical knowledge. The informatics community has invested a lot of effort in creating large and comprehensive ontological repositories of clinical knowledge. We describe a method for automatically leveraging the relationships in these ontologies when phenotyping directly from EHR data. We show how providing informative priors derived from clinical ontologies can help guide unsupervised mixture models to identify more coherent and cohesive phenotypes. Identifying challenges in topic model evaluation for the clinical domain. The machine learning community has developed some algorithms for automatic evaluation of topic models and 153
169 demonstrated that they correlate with human judgment of coherence. In our work, we show that this result may not be applicable to clinical data. We find that clinical expert knowledge does not correlate with the automated measures of coherence and that healthcare process detritus that exists in patient records (formulaic note structure, copy and paste redundancy, etc) can create phenotypes that automated methods mark as highly coherent but are clinically irrelevant. Designing a new method for high-throughput cohort identification from EHR data. The Grounded Phenome model built and discussed in this thesis can provide a new avenue for phenotyping from EHR data. We show that the GPhenome model can identify cohorts as well as well-established rule-based algorithms but with additional benefits such as limited expert involvement, the ability to identify many cohorts at once, and the ranking of patients by disease probabilities. This new method can significantly augment results from rule-based methods for cohort identification. 7.3 Limitations We acknowledge that there exist many limitations to the studies explored in this thesis. The specific limitations are listed and described below: Ontology Usage. For many studies reported in this work, we rely on ontological knowledge to enhance our data-driven techniques. For the work on reducing textual redundancy, we depend on accurate relationships between concepts and up to date definitions for each SNOMED-CT concept. In the grounding of the Phenome model, we assume the links between diseases and observations (medications, laboratory tests, diagnosis codes), are current and comprehensive. Errors that may exist in the ontologies would propagate into our methods and potentially hurt the modeling results. Procedure Code Absence. The work in this thesis explores characteristics of four different EHR data types: clinical notes, ICD-9 codes, prescribed medications, and ordered laboratory tests. The thesis also presents a method for unsupervised grouping of these data. However, it is clear that 154
170 many important clinical events are encoded in procedure codes, most often using the Current Procedural Terminology (CPT). In our work, we did not include procedural data and this exclusion potentially limited our ability to learn cohesive and comprehensive phenotypes. The addition of procedure codes could be especially powerful for phenotypes that have well-defined procedures associated with them. Text Processing. The preprocessing of textual data and extraction of variables is crucial for much of the work in this thesis. We used HealthTermFinder as the clinical NLP software to perform processing such as chunking, parsing, and named-entity recognition. As clinical text is highly unstructured and has varied grammar, the software is imperfect. We recognize that the imperfection at the text processing phase is carried through the work and can account for errors and signal dilution in many of studies described. We also made two other modeling choices that affect the study results: a bag-of-words assumption and removal of modifers. We use the processed text in a bag-of-words fashion which does not preserve the word order and additionally, we chose not to capture concept modifiers that appear in the text. These design choices give us the ability to represent the frequency and co-occurrence of various medical concepts, however negation and subtle meaning may be lost due to these simplifying assumptions. Generalizability. Much of the work conducted in this thesis is carried out in a single institution. We applied some of our methods to another dataset (MIMIC ICU) and have presented institutionagnostic methods and workflows. However, we recognize that while the populations we study are large, our findings may be limited by the data within our data warehouse. Additionally, in the laboratory tests biases study, we acknowledge the limitation of using only one test to demonstrate the measurement gap biases. We only present the lipase and acute pancreatitis association study as a single proof-of-concept example to exhibit the potential importance of separating laboratory test values by measurement pattern. Finally, we recognize that using the Medical Entities Dictionary (MED) as the terminology for laboratory tests limits the generalizability of the GPhenome model. Known laboratory test to disease associations were easily available through the MED and although 155
171 there is an older version of the MED incorporated into UMLS, we recognize that using the more standard Logical Observation Identifiers Names and Codes (LOINC) vocabulary would increase the reproducibility of this work. Heuristics. Within some of the work in this thesis, we chose heuristic-based thresholds. In the concept aggregation research, we implemented a cutoff for note-based similarity at 75%. This threshold was set by looking at the curve of the similarity values and picking enough to demonstrate the methodology and provide the annotators with a manageable set of pairs to evaluate. Similarly, we chose the 3-day threshold for the laboratory test biases study by examining the histogram of days between consecutive measurements. Finally, in the cohort-identification study, the 1% threshold for choosing patients as diabetic cases was determined by inspecting the distribution of phenotype weights across the entire population. In future work, finding data-driven ways to substantiate these different thresholds will be important. Temporality. Although we demonstrate in Chapter 4 that temporal features are very important for modeling EHR data, the Phenome model is currently designed to work on slices of patient records when the patient is at a relatively stable health status. It is possible to simulate a changing patient phenotype by running the Phenome model on discrete time windows within a patient record, but ideally, the Phenome model would be augmented to fully understand the evolution of health states in a patient. We fully acknowledge that developing a model, which overlooks the temporal component present in EHR data, is a large limitation in our work. 7.4 Future Work The findings reported in this thesis along with the current methodological limitations point to many different directions for future research. We present a set of interesting problems for future examination below. Combining insights and methods from all three Aims. The goal of this thesis is to create different 156
172 methods for dealing with quirks and pathologies of EHR data, specifically in the context of EHR summarization. Combining the work from these different studies is an exciting arena for future research. The concept aggregation techniques can be applied as pre-processing for the Phenome model. Applying the redundancy removal technique to clinical notes and thereby reducing the dimensionality of the input text can help guide the Phenome model to produce more coherent and interpretable results. Additionally, as we have shown, laboratory tests contain significant information both in their numerical value and in their sampling frequency. Incorporating this insight in the Phenome model can be done in multiple ways. We can pre-process laboratory tests to separate them into different sampling frequencies or identify a way to model laboratory measurement patterns along with laboratory test values. The joint modeling proposal is both an interesting technical challenge that may reveal more latent structure and associations between measurement patterns and patient diseases. Finally, including other data (such as flowsheets, vital signs, demographics, procedure codes, etc.) into the Phenome model structure may yield different and exciting insights into disease pathologies and phenotype structure that exists in EHR patient populations. Beyond bi-directional, pairwise similarity. When examining the pairs of similar concepts produced by our method in Aim I, we noticed potential for expanding our method to higher dimensions of similarity and clustering concepts. The pairwise similarity often produced triangulated results, which suggest clustering could be carried out as an extension of the pairwise similarity methodology to identify groups of concepts that are semantically similar enough to be aggregated. For instance, we located multiple triplets (three concepts vaguely describing the same concept with each pair achieving high similarities) and one five-pair cluster with the five different concepts describing sputum of different colors (yellow, green, brown, clean, and white). We found each of the 10 combination pairs scoring similar. Extending the method to find clusters of similar concepts is exciting future work. In addition, considering defining a direction of similarity as discussed by Kotlerman et al. to incorporate more pairs and pairs with a non-symmetric similarity (Kotlerman, Dagan, and Szpektor 2010) is an attractive area for further research. 157
173 Increased Generalizability. Two large limitations to generalizability include (1) data-driven thresholding and (2) incorporation of more standard terminologies. Many of the studies described in this thesis relied on visual examination of different graphs to determine appropriate thresholding and filtering. Applying techniques for density estimation, change-point analysis, or appropriately fitting mixture models would result in more generalizable methodologies that can be applied in other institutions. Using more standard terminologies for data types will also result in the broader applicability of the work future work will focus on mapping laboratory tests to LOINC codes instead of MED codes. Temporality in the Phenome Model. In its current version, the Phenome model does not explicitly encode any temporality about given patient records. Because longitudinal records and diseases themselves are often not time invariant (Pivovarov et al. 2014), and progress at different time resolutions, it is a non-trivial task to model temporality across all diseases at once. A simple approach to further the Phenome model work would include experimenting with incorporating temporality by inferring phenotypes over time, much like the approach of dynamic topic models( Blei and Lafferty 2006). Data-type specific modeling. Each of the considered data types in the Phenome model has specific characteristics that can be exploited further. The EHR text, especially when learning from several notes for each patient, has much redundancy that can be accounted for (Cohen et al. 2014). Medications and diagnosis codes are hierarchical in nature, with evidence that incorporating that structure helps in modeling clinical information (Perotte et al. 2011). Finally, each laboratory test has associated values, and it is clear that different distributions of the same test can describe different diseases; for instance, glucose with a distribution biased towards high values would belong to a phenotype describing diabetes, while glucose with a distribution with mean towards low values would be probable in a hypoglycemia phenotype. Refinement of ontological grounding. In this thesis we show that unsupervised disease modeling can 158
174 be influenced to learn more coherent phenotypes by grounding with informative priors. The question of how best to employ grounding for this task remains future work. For example, it may be important to augment the priors differently for different data types; as there are many more words than laboratory tests, grounding both with the same weight may give too much weight to laboratory tests. In addition, questions remain about how best to chose words specific to each phenotype when performing grounding. 159
175 References Abdala OT, and Saeed M Estimation of Missing Values in Clinical Laboratory Measurements of ICU Patients Using a Weighted K-Nearest Neighbors Algorithm, Computers in Cardiology 31: Abraham J, Thomas KG, Almoosa KF, Patel B, and Patel VL Comparative Evaluation of the Content and Structure of Communication Using Two Handoff Tools: Implications for Patient Safety. Journal of Critical Care 29 (2): 311.e1 7. Abraham J, Nguyen V, Almoosa KF, Patel B, and Patel VL Falling through the Cracks: Information Breakdowns in Critical Care Handoff Communication. AMIA Annual Symposium Proceedings / AMIA Symposium AMIA Symposium 2011: Adler-Milstein J, Bates DW, and Jha AK A Survey of Health Information Exchange Organizations in the United States: Implications for Meaningful Use. Annals of Internal Medicine 154 (10): Afantenos, SD Automatic Text Summarization from Multiple Sources for Time Evolving Events. National and Kapodistrian University of Athens. Akan P, Cimrin D, Ormen M, Kume T, Ozkaya A, Ergor G, and Abacioglu H The Inappropriate Use of HbA1c Testing to Monitor Glycemia: Is There Evidence in Laboratory Data? Journal of Evaluation in Clinical Practice 13 (1): Albers DJ, and Hripcsak G A Statistical Dynamics Approach to the Study of Human Health Data: Resolving Population Scale Diurnal Variation in Laboratory Data. Physics Letters A 374 (9): Albers DJ, and Hripcsak G Estimation of Time-Delayed Mutual Information and Bias for Irregularly and Sparsely Sampled Time-Series. arxiv.org, October. Albers DJ, and Hripcsak G Using Time-Delayed Mutual Information to Discover and Interpret Temporal Correlation Structure in Complex Populations. CHAOS 22 (1): Albers DJ, Hripcsak G, and Schmidt M Population Physiology: Leveraging Electronic Health Record Data to Understand Human Endocrine Dynamics. PLoS ONE 7 (12): e
176 Allan J, Gupta R, and Khandelwal V Temporal Summaries of News Topics, In SIGIR Al-Mubaid H, and Nguyen HA A Cluster Based Approach for Semantic Similarity in the Biomedical Domain. IEEE Int. Conf. on Granular Computing, July, Alterman R Understanding and Summarization. Artificial Intelligence Review 5 (4): Alterovitz G, Xiang M, Hill DP, Lomax J, Liu J, Cherkassky M, Dreyfuss J, et al Ontology Engineering. Nature Biotechnology 28 (2): American Diabetes Association Diagnosis and Classification of Diabetes Mellitus. Diabetes Care 33(S62-S69). American Diabetes Association Standards of Medical Care in diabetes Diabetes Care 36:S Androutsopoulos I A Survey of Paraphrasing and Textual Entailment Methods. arxiv.org, May, Andrzejewski D, Zhu X, and Craven M Incorporating Domain Knowledge into Topic Modeling via Dirichlet Forest Priors. In ICML. Andrzejewski D, Zhu X, Craven M, and Recht B A Framework for Incorporating General Domain Knowledge into Latent Dirichlet Allocation Using First-Order Logic. In IJCAI. Arnold, CW, El-Saden SM, Bui AT, Taira R Clinical Case-Based Retrieval Using Latent Topic Analysis. AMIA 2010 Symposium Proceedings, July, 1 5. Arocha JF, Wang D, and Patel VL Identifying Reasoning Strategies in Medical Decision Making: A Methodological Guide. Journal of Biomedical Informatics 38 (2): Banerjee, S Adapting the Lesk Algorithm for Word Sense Disambiguation to WordNet, December, University of Minnesota. Banerjee S and Pederson T An Adapted Lesk Algorithm for Word Sense Disambiguation Using WordNet. Proc. of the 3rd International Conference on Intelligent Text Processing and Computational Linguistics (CICLing), November,
177 Banks PA, Freeman ML, and the Practice Parameters Committee of the American College of Gastroenterology Practice Guidelines in Acute Pancreatitis. The American Journal of Gastroenterology 101 (10): Baron JM, and Dighe AS The Role of Informatics and Decision Support in Utilization Management. Clinica Chimica Acta; International Journal of Clinical Chemistry 427 (January): Barzilay R, and Lee L Catching the Drift: Probabilistic Content Models, with Applications to Generation and Summarization., in ACL Bashyam V, Hsu W, Watt E, Bui AAT, Kangarloo H, and Taira RK Informatics in Radiology: Problem-Centric Organization and Visualization of Patient Imaging and Clinical Data1. Radiographics 29 (2): Bates DW, Boyle DL, Rittenberg E, Kuperman GJ, Ma luf N, Menkin V, Winkelman JW, and Tanasijevic MJ What Proportion of Common Diagnostic Tests Appear Redundant? The American Journal of Medicine 104 (4): Batet M, Sánchez D, and Valls A An Ontology-Based Measure to Compute Semantic Similarity in Biomedicine. Journal of Biomedical Informatics 44 (1): Benabderrahmane S, Smail-Tabbone M, Poch O, Napoli A, and Devignes M IntelliGO: A New Vector-Based Semantic Similarity Measure Including Annotation Origin. BMC Bioinformatics 11 (1): 588. Birman-Deych E, Waterman AD, Yan Y, Nilasena DS, Radford MJ, and Gage BF Accuracy of ICD-9-CM Codes for Identifying Cardiovascular and Stroke Risk Factors. Medical Care 43 (5): Blei DM, and Lafferty JD Dynamic Topic Models. In ICML. Blei DM, Ng NY, and Jordan MI Latent Dirichlet Allocation. The Journal of Machine Learning Research 3: Budanitsky A, and Hirst G Evaluating WordNet-Based Measures of Lexical Semantic Relatedness. Comput Linguist 32 (1): Bui, AAT, Aberle DR, and Kangarloo H TimeLine: Visualizing Integrated Patient Records. IEEE Transactions on Information Technology in Biomedicine 11 (4):
178 Cao H, Markatou M, Melton GB, Chiang MF, and Hripcsak G Mining a Clinical Data Warehouse to Discover Disease-Finding Associations Using Co-Occurrence Statistics. AMIA Annual Symposium Proceedings / AMIA Symposium AMIA Symposium, Friedman C, and Elhadad N Natural Language Processing in Health Care and Biomedicine. In Biomedical Informatics. Computer Applications in Healthcare, Springer Science & Business Media. Caviedes, JE, and Cimino JJ Towards the Development of a Conceptual Distance Metric for the UMLS. Journal of Biomedical Informatics 37 (2): Chang J, Boyd-Graber J, Gerrish S, Wang C, and Blei D Reading Tea Leaves: How Humans Interpret Topic Models. Neural Information Processing Systems. Chan KR, Lou X, Karaletsos T, Crosbie C, Gardos S, Artz D, and Ratsch G An Empirical Analysis of Topic Modeling for Mining Cancer Clinical Notes, In ICDMW Chen, DP, Dudley JT, and Butte AJ Latent Physiological Factors of Complex Human Diseases Revealed by Independent Component Analysis of Clinarrays. BMC Bioinformatics 11 (Suppl 9): S4. Chen Y, Carroll RJ, Hinz ERM, Shah A, Eyler AE, Denny JC, and Xu H Applying Active Learning to High-Throughput Phenotyping Algorithms for Electronic Health Records Data. Journal of the American Medical Informatics Association, 20(e2):e Chen Y, Ghosh J, Bejan CA, Gunter CA, Gupta S, Kho A, Liebovitz D, Sun J, Denny J, and Malin B Building Bridges across Electronic Health Record Systems through Inferred Phenotypic Topics. Journal of Biomedical Informatics, 55: Christensen T, and Grimsmo A Instant Availability of Patient Records, but Diminished Availability of Patient Information: A Multi-Method Study of GP s Use of Electronic Patient Records. BMC Medical Informatics and Decision Making 8 (1): 12. Cios KJ, and Moore GW Uniqueness of Medical Data Mining. Artificial Intelligence in Medicine 26 (1-2): Cohen J A Coefficient of Agreement for Nominal Scales. Educational and Psychological Measurement. 20(1):
179 Cohen R, Aviram I, Elhadad M, and Elhadad N Redundancy-Aware Topic Modeling for Patient Record Notes. PLoS ONE 9 (2): e doi: /journal.pone Cohen R, Elhadad M, and Elhadad N Redundancy in Electronic Health Record Corpora: Analysis, Impact on Text Mining Performance and Mitigation Strategies. BMC Bioinformatics 14 (1): 10. Cohen T, and Widdows D Empirical Distributional Semantics: Methods and Biomedical Applications. Journal of Biomedical Informatics 42 (2): Combi C, and Shahar Y Temporal Reasoning and Temporal Data Maintenance in Medicine: Issues and Challenges. Computers in Biology and Medicine 27 (5): International Expert Committee International Expert Committee Report on the Role of the A1C Assay in the Diagnosis of Diabetes. Diabetes Care 32 (7): Cordí V, Lombardi P, Martelli M, and Mascardi V An Ontology-Based Similarity between Sets of Concepts. In Proceedings of WOA, Cousins SB, and Kahn MG The Visual Display of Temporal Information. Artificial Intelligence in Medicine 3 (6): Dagan, I, Dolan B, Magnini B, and Roth D Recognizing Textual Entailment: Rational, Evaluation and Approaches. Natural Language Engineering 15 (4): de Estrada WD, Murphy S, and Barnett GO Puya: A Method of Attracting Attention to Relevant Physical Findings. Proceedings : AMIA Fall Symposium, Delort JY and Alfonseca E DualSum: A Topic-Model Based Approach for Update Summarization, In ACL Dong H, Hussain FK, and Chang E A Context-Aware Semantic Similarity Model for Ontology Environments. Concurrency and Computation: Practice and Experience 23 (5): Doshi-Velez F, Ge Y, and Kohane I Comorbidity Clusters in Autism Spectrum Disorders: An Electronic Health Record Time-Series Analysis. Pediatrics 133 (1): e Doshi-Velez F, Wallace B, and Adams R Graph-Sparse LDA: A Topic Model with Structured Sparsity. In Arxiv. October. 164
180 Driskell OJ, Holland D, Hanna FW, Jones PW, Pemberton RJ, Tran M, and Fryer AA Inappropriate Requesting of Glycated Hemoglobin (Hb A1c) Is Widespread: Assessment of Prevalence, Impact of National Guidance, and Practice-to-Practice Variability. Clinical Chemistry 58 (5): Edmundson, HP New Methods in Automatic Extracting. Journal of the ACM (JACM) 16 (2): Elhadad N, and Sutaria K Mining a Lexicon of Technical Terms and Lay Equivalents. In Proceedings of the ACL BioNLP Workshop, Enders CK A Primer on the Use of Modern Missing-Data Methods in Psychosomatic Medicine Research. Psychosomatic Medicine 68 (3): Erkan G, and Radev DR LexRank: Graph-Based Lexical Centrality as Salience in Text Summarization. J. Artif. Intell. Res. (JAIR) 22: Farhangfar A, Kurgan LA, and Pedrycz W A Novel Framework for Imputation of Missing Values in Databases. IEEE Transactions on Systems, Man, and Cybernetics - Part A: Systems and Humans 37 (5): Farri OF Understanding Clinician Information Demands and Synthesis of Clinical Documents in Electronic Health Record Systems. University of Minnesota. Farri O, Rahman A, Monsen KA, Zhang R, Pakhomov SV, Pieczkiewicz DS, Speedie SM, and Melton GB Impact of a Prototype Visualization Tool for New Information in EHR Clinical Documents. Applied Clinical Informatics 3 (4): Farzandipour M, Sheikhtaheri A, and Sadoughi F Effective Factors on Accuracy of Principal Diagnosis Coding Based on International Classification of Diseases, the 10th Revision (ICD- 10). International Journal of Information Management. 30(1): Feblowitz, JC, Wright A, Singh H, Samal L, and Sittig DF Summarization of Clinical Information: A Conceptual Model. Journal of Biomedical Informatics 44 (4): Fong A, and Ratwani R An Evaluation of Patient Safety Event Report Categories Using Unsupervised Topic Modeling. Methods of Information in Medicine 54 (3). Fort D, Wilcox AB, and Weng C Could Patient Self-Reported Health Data Complement EHR for Phenotyping? AMIA Annual Symposium Proceedings. 165
181 Friedman C, Alderson PO, Austin JH, Cimino JJ, and Johnson SB A General Natural-Language Text Processor for Clinical Radiology. AMIA 1 (2): Fries JF Alternatives in Medical Record Formats. Medical Care 12 (10): Ghassemi M, Naumann T, Doshi-Velez F, Brimmer N, Joshi R, Rumshisky A, and Szolovits P Unfolding Physiological State. In The 20th ACM SIGKDD International Conference, New York, New York, USA: ACM Press. Goldstein DE, Little RR, Lorenz RA, Malone JI, Nathan D, Peterson CM, and Sacks DB Tests of Glycemia in Diabetes. Diabetes Care 27 (7): Griffiths TL, and Steyvers M Finding Scientific Topics. Proceedings of the National Academy of Sciences of the United States of America 101 Suppl 1 (April): Grundy SM, Bilheimer D, Chait A, and Clark LT Report of the National Cholesterol Education Program (NCEP) Expert Panel on Detection, Evaluation, and Treatment of High Blood Cholesterol in Adults (Adult Treatment Panel III). JAMA. 269 (23): Savova S, Bethard S, and Styler W Towards Temporal Relation Discovery from the Clinical Narrative, Proceedings: AMIA, 568. Hallett C Multi-Modal Presentation of Medical Histories In ACM Hallett C, and Scott D Structural Variation in Generated Health Reports, In ACL 1 8. Halpern Y, Choi Y, Horng S, and Sontag D Using Anchors to Estimate Clinical State without Labeled Data. In AMIA. Washington, DC. Hamon T, and Grabar N How Can the Term Compositionality Be Useful for Acquiring Elementary Semantic Relations? Proceedings of the 6th International Conference on Advances in Natural Language Processing. Hanauer DA, Rhodes DR, and Chinnaiyan AM Exploring Clinical Associations Using `-Omics Based Enrichment Analyses. PLoS ONE 4 (4): e5203. Handelsman Y, Mechanick JI, Blonde L, Grunberger G, Bloomgarden ZT, Bray GA, Dagogo-Jack S, Davidson JA, Einhorn D, and Ganda O American Association of Clinical 166
182 Endocrinologists Medical Guidelines for Clinical Practice for Developing a Diabetes Mellitus Comprehensive Care Plan. Endocrine Practice 17: Hanley JA, and McNeil BJ A Method of Comparing the Areas under Receiver Operating Characteristic Curves Derived from the Same Cases. Radiology 148 (3): Harris ZS Mathematical Structures of Language. New York: Interscience Publishers John Wiley & Sons. Hersh WR, Weiner MG, Embi PJ, and Logan JR Caveats for the Use of Operational Electronic Health Record Data in Comparative Effectiveness Research. Medical Care. Hidalgo CA, Blumm N, Barabási AL, and Christakis NA A Dynamic Network Approach for the Study of Human Phenotypes. PLoS Computational Biology 5 (4): e Hirsch JS, Tanenbaum JS, Gorman SL, Liu C, Schmitz E, Hashorva D, Ervits A, Vawdrey D, Sturm M, and Elhadad N HARVEST, a Longitudinal Patient Record Summarizer. Journal of the American Medical Informatics Association : JAMIA, amiajnl Hirschtick RE Copy-and-Paste. JAMA: The Journal of the American Medical Association 295 (20): Ho JC, Ghosh J, and Sun J Marble: High-Throughput Phenotyping from Electronic Health Records via Sparse Nonnegative Tensor Factorization, In ACM Holden RJ Cognitive Performance-Altering Effects of Electronic Medical Records: An Application of the Human Factors Paradigm for Patient Safety. Cognition, Technology & Work (Online) 13 (1): Hripcsak G and Albers DJ Next-Generation Phenotyping of Electronic Health Records. Journal of the American Medical Informatics Association: JAMIA 20 (1): Hripcsak G, Albers DJ, and Perotte A Exploiting Time in Electronic Health Record Correlations. Journal of the American Medical Informatics Association : JAMIA 18 Suppl 1 (December): i Hripcsak G, Albers DJ, and Perotte A Parameterizing Time in Electronic Health Record Studies. Journal of the American Medical Informatics Association : JAMIA, 22(4):
183 Hripcsak, G, Elhadad N, Chen YH, Zhou L, and Morrison FP Using Empiric Semantic Correlation to Interpret Temporal Assertions in Clinical Texts. AMIA 16 (2): Hsu W, Taira RK, El-Saden S, Kangarloo H, and Bui AAT Context-Based Electronic Health Record: Toward Patient Specific Healthcare. IEEE Transactions on Information Technology in Biomedicine 16 (2): Huang ES, Basu A, O Grady M, and Capretta JC Projecting the Future Diabetes Population Size and Related Costs for the U.S. Diabetes Care 32 (12): Hug CW Predicting the Risk and Trajectory of Intensive Care Patients Using Survival Models. MIT. Hunter J, Freer Y, Gatt A, Logie R, Mcintosh N, van der Meulen M, Portet F, Reiter E, Sripada S, and Sykes C Summarising Complex ICU Data in Natural Language. AMIA Annual Symposium Proceedings / AMIA Symposium AMIA Symposium, Hu Y, Boyd-Graber J, and Satinoff B Interactive Topic Modeling. In Association for Computational Linguistics. Portland, Oregon. Jaakkola TS, and Jordan MI Variational Probabilistic Inference and the QMR-DT Network. Journal of Artificial Intelligence Research. Janowicz K Kinds of Contexts and Their Impact on Semantic Similarity Measurement. Sixth Annual IEEE International Conference on \ldots. Jaspers WM, Steen T, van den Bos C, and Geenen M The Think Aloud Method: A Guide to User Interface Design. International Journal of Medical Informatics 73 (11-12): Jiang JJ, and Conrath DW Semantic Similarity Based on Corpus Statistics and Lexical Taxonomy. Proc. of the International Conference on Research in Computational Linguistics, Jones KS A Statistical Interpretation of Term Specificity and Its Application in Retrieval. Journal of Documentation 28 (1): Jung H, Allen J, Blaylock N, de Beaumont W, Galescu L, and Swift M Building Timelines from Narrative Clinical Records: Initial Results Based-on Deep Natural Language Understanding, In ACL
184 Kessler C, Raubal M, and Janowicz K The Effect of Context on Semantic Similarity Measurement. On the Move to Meaningful Internet Systems: OTM 2007 Workshops. Klann JG, McCoy AB, Wright A, Wattanasin N, Sittig DF, and Murphy SN Health Care Transformation Through Collaboration on Open-Source Informatics Projects: Integrating a Medical Applications Platform, Research Data Repository, and Patient Summarization. Interactive Journal of Medical Research 2 (1): e11. Klann JG, and Schadow G Modeling the Information-Value Decay of Medical Problems for Problem List Maintenance, In ACM Klimov D, Shahar Y, and Taieb-Maimon M Intelligent Visualization and Exploration of Time- Oriented Data of Multiple Patients. Artificial Intelligence in Medicine 49 (1): Kotlerman L, Dagan I, and Szpektor I Directional Distributional Similarity for Lexical Inference. Natural Language Engineering. 16(4): Kushniruk KW Analysis of Complex Decision-Making Processes in Health Care: Cognitive Approaches to Health Informatics. Journal of Biomedical Informatics 34 (5): Landis RJ., and Koch GG Measurement of Observer Agreement for Categorical Data. Biometrics 33 (1): Lasko, TA, Denny JC, and Levy MA Computational Phenotype Discovery Using Unsupervised Feature Learning over Noisy, Sparse, and Irregular Clinical Data. PLoS ONE 8 (6): e Lau JH, Newman D, and Baldwin T Machine Reading Tea Leaves: Automatically Evaluating Topic Coherence and Topic Model Quality. In ACL Laxmisan A, Vaughan-Sarrazin M, and Cram P Repeated Hemoglobin A1C Ordering in the VA Health System. The American Journal of Medicine 124 (4): Laxmisan A, McCoy AB, Wright A, and Sittig DF Clinical Summarization Capabilities of Commercially-Available and Internally-Developed Electronic Health Records. Applied Clinical Informatics 3 (1): Leacock C, and Chodorow M Combining Local Context and WordNet Similarity for Word Sense Disambiguation. An Electronic Lexical Database. WordNet: An electronic lexical database. 169
185 Lesk M Automatic Sense Disambiguation Using Machine Readable Dictionaries: How to Tell a Pine Cone from an Ice Cream Cone. In Proceedings of the 5th Annual International Conference on Systems Documentation, Liao KP, Cai T, Savova GK, Murphy SN, Karlson EW, Ananthakrishnan AN, Gainer VS, et al Development of Phenotype Algorithms Using Electronic Medical Records and Incorporating Natural Language Processing. BMJ 350 (11): Lin D An Information-Theoretic Definition of Similarity. In Fifteenth International Conference on Machine Learning, ICML, Lindberg DA, Humphreys BL, and McCray AT The Unified Medical Language System. Methods of Information in Medicine 32 (4): Lin, JH, and Haug PJ Exploiting Missing Clinical Data in Bayesian Network Modeling for Predicting Medical Problems. Journal of Biomedical Informatics 41 (1): Lipsky-Gorman S, and Elhadad N ClinNote and HealthTermFinder: A Pipeline for Processing Clinical Notes. Technical Report. Columbia University Technical Report. Little RJA, and Rubin DB Statistical Analysis with Missing Data. John Wiley & Sons. Little RJA Pattern-Mixture Models for Multivariate Incomplete Data. Journal of the American Statistical Association 88 (421): Liu H, and Friedman C CliniViewer: A Tool for Viewing Electronic Medical Records Based on Natural Language Processing and XML. Studies in Health Technology and Informatics 107 (Pt 1): Li Y, Bandar ZA, and McLean D An Approach for Measuring Semantic Similarity between Words Using Multiple Information Sources. IEEE Transactions on Knowledge and Data Engineering 15 (4): Li Y, Gorman SL, and Elhadad N Section Classification in Clinical Notes Using Supervised Hidden Markov Model, In ACM Luhn HP The Automatic Creation of Literature Abstracts. IBM Journal of Research and Development 2 (2):
186 Lussier YA, and Liu Y Computational Approaches to Phenotyping: High-Throughput Phenomics. Proceedings of the American Thoracic Society 4 (1): Lyon AW, Higgins T, Wesenberg JC, Tran DV, and Cembrowski GS Variation in the Frequency of Hemoglobin A1c (HbA1c) Testing: Population Studies Used to Assess Compliance with Clinical Practice Guidelines and Use of HbA1c to Screen for Diabetes. Journal of Diabetes Science and Technology 3 (3): Manning CD, Raghavan P, and Schütze H Introduction to Information Retrieval. Cambridge University Press. Manning CD, and Schütze H Foundations of Statistical Natural Language Processing. MIT Press. Marcu D From Discourse Structures to Text Summaries In ACL Marlin, BM, Kale DC, Khemani RG, and Wetzel RC Unsupervised Pattern Discovery in Electronic Health Care Data Using Probabilistic Clustering Models, In ACM Massey FJ The Kolmogorov-Smirnov Test for Goodness of Fit. Journal of the American Statistical Association 46 (253): Matar Y, and Egyed-Zsigmond E KWSim: Concepts Similarity Measure. Proceedings of Conférence En Recherche d Information et Applications (CORIA08), August, McCallum, AK MALLET: A Machine Learning for Language Toolkit. McCarty, CA, Chisholm RL, Chute CG, Kullo IJ, Jarvik GP, Larson EB, Li R, et al The emerge Network: A Consortium of Biorepositories Linked to Electronic Medical Records Data for Conducting Genomic Studies. BMC Medical Genomics 4: 13. McCray AT, Burgun A, and Bodenreider Aggregating UMLS Semantic Types for Reducing Conceptual Complexity. Studies in Health Technology and Informatics, McDonald CJ, Callaghan FM, Weissman A, Goodwin RM, Mundkur M, and Kuhn T Use of Internist s Free Time by Ambulatory Care Electronic Medical Record Systems. JAMA Internal Medicine, September. doi: /jamainternmed
187 McDonald CJ Protocol-Based Computer Reminders, the Quality of Care and the Non- Perfectability of Man. New England Journal of Medicine 295 (24): McInnes BT, Pedersen T, and Pakhomov SVS UMLS-Interface and UMLS-Similarity: Open Source Software for Measuring Paths and Semantic Similarity. AMIA Annual Symposium Proceedings 2009: McPherson RA, and Pincus MR Henry s Clinical Diagnosis and Management by Laboratory Methods. Saunders. Militello LG, Arbuckle NB, Saleem JJ, Patterson E, Flanagan M, Haggstrom D, and Doebbeling BN Sources of Variation in Primary Care Clinical Workflow: Implications for the Design of Cognitive Support. Health Informatics Journal 20 (1): Miller RA, Pople HE, and Myers JD Internist-1, an Experimental Computer-Based Diagnostic Consultant for General Internal Medicine. The New England Journal of Medicine. Mishra R, Bian J, Fiszman M, Weir CR, Jonnalagadda S, Mostafa J, and Del Fiol G Text Summarization in the Biomedical Domain: A Systematic Review of Recent Research. Journal of Biomedical Informatics, 52: Mortensen JM, Horridge M, Musen MA, and Noy NF Applications of Ontology Design Patterns in Biomedical Ontologies. AMIA Annual Symposium Proceedings / AMIA Symposium. AMIA Symposium 2012: Murray I, and Salakhutdinov R Evaluating Probabilities under High-Dimensional Latent Variable Models. In Advances in Neural Information Processing Systems 21, Nenkova A, and McKeown K A Survey of Text Summarization Techniques, Mining Text Data Nenkova A, and Passonneau RJ Evaluating Content Selection in Summarization: The Pyramid Method. In HLT/NAACL 4: Newman D, Lau JH, and Grieser K Automatic Evaluation of Topic Coherence. In ACL Newton KM, Peissig PL, and Kho AN Validation of Electronic Medical Record-Based Phenotyping Algorithms: Results and Lessons Learned from the emerge Network. JAMIA 20(e1):e
188 Noy NF, Shah NH, Whetzel PL, Dai B, Dorf M, Griffith N, Jonquet C, et al BioPortal: Ontologies and Integrated Data Resources at the Click of a Mouse. Nucleic Acids Research 37 (Web Server issue): W O Keefe, QEW, and Simborg DW Summary Time Oriented Record (STOR) Proc. Annu Symp Comput Appl Med Care. 2: Pakhomov, S, McInnes, Adam T, Liu Y, Pedersen T, Melton GB Semantic Similarity and Relatedness between Clinical Terms: An Experimental Study. AMIA 2010 Annual Symposium, July, 1 6. Pakhomov, SVS, Pedersen T, McInnes B, GB, Ruggieri A, and Chute CG Towards a Framework for Developing Semantic Relatedness Reference Standards. Journal of Biomedical Informatics 44 (2): Patel VL, Arocha JF, and Kaufman DR A Primer on Aspects of Cognition for Medical Informatics. AMIA 8 (4): Patel VL, and Kushniruk AW Interface Design for Health Care Environments: The Role of Cognitive Science. AMIA Symposium, January, Pathak J, Kho AN, and Denny JC Electronic Health Records-Driven Phenotyping: Challenges, Recent Advances, and Perspectives. Journal of the American Medical Informatics Association: JAMIA 20 (e2): e Patwardhan S, and Pedersen T Using WordNet-Based Context Vectors to Estimate the Semantic Relatedness of Concepts. In EACL, 1-8. Payne, TH Computer Decision Support Systems. Chest 118 (2 Suppl): 47S 52S. Pedersen T, Pakhomov SVS, Patwardhan S, and Chute CG Measures of Semantic Similarity and Relatedness in the Biomedical Domain. Journal of Biomedical Informatics 40 (3): Perotte, AJ and Hripcsak G Temporal Properties of Diagnosis Code Time Series in Aggregate. IEEE J Biomed Health Inform. 17(2): Perotte, AJ, Wood F, Elhadad N, and Bartlett N Hierarchically Supervised Latent Dirichlet Allocation, In NIPS
189 Pesquita C, Faria D, Falcão AO, Lord P, and Couto FM Semantic Similarity in Biomedical Ontologies. PLoS Computational Biology 5 (7): e Peters AL, Davidson MB, Schriger DL, and Hasselblad V A Clinical Approach for the Diagnosis of Diabetes Mellitus: An Analysis Using Glycosylated Hemoglobin Levels. Meta-Analysis Research Group on the Diagnosis of Diabetes Using Glycated Hemoglobin Levels. JAMA: The Journal of the American Medical Association 276 (15): Petrakis EGM, Varelas G, Hiliaoutakis A, and Raftopoulou P Design and Evaluation of Semantic Similarity Measures for Concepts Stemming From the Same or Different Ontologies. 4th Workshop on Multimedia Semantics (WMS 06), Pirro G, and Seco N Design, Implementation and Evaluation of a New Semantic Similarity Metric Combining Features and Intrinsic Information Content. Proceedings of the OTM 2008 Confederated International Conferences, CoopIS, DOA, GADA, IS, and ODBASE Part II on On the Move to Meaningful Internet Systems, August, Pivovarov R, Albers DJ, Sepulveda JL, and Elhadad N Identifying and Mitigating Biases in EHR Laboratory Tests. Journal of Biomedical Informatics,51: Pivovarov R, and Elhadad N A Hybrid Knowledge-Based and Data-Driven Approach to Identifying Semantically Similar Concepts. Journal of Biomedical Informatics 45 (3): Plaisant C, Milash B, Rose A, Widoff S, and Shneiderman B LifeLines: Visualizing Personal Histories, In SIGCHI Plaisant C, Mushlin R, Snyder A, Li J, Heller D, and Shneiderman B LifeLines: Using Visualization to Enhance Navigation and Analysis of Patient Records. Proceedings of AMIA Annual Symposium. AMIA Symposium, Poh N, and de Lusignan S. 2011a. Data-Modelling and Visualisation in Chronic Kidney Disease (CKD): A Step towards Personalised Medicine. Informatics in Primary Care 19 (2): Poh N, and de Lusignan S. 2011b. Modeling Rate of Change in Renal Function for Individual Patients: A Longitudinal Model Based on Routinely Collected Data. NIPS, August. Popescu M, and Dong X Data Mining in Biomedicine Using Ontologies. Artech House Publishers. Powsner SM, and Tufte ER Graphical Summary of Patient Status. The Lancet 344 (8919):
190 Powsner SM, and Tufte ER Summarizing Clinical Psychiatric Data. Psychiatric Services (Washington, D.C.) 48 (11): Pradhan S, Elhadad N, South BR, Martinez D, Christensen L, Vogel A, Suominen H, Chapman WW, and Savova G Evaluating the State of the Art in Disorder Recognition and Normalization of the Clinical Narrative. Journal of the American Medical Informatics Association : JAMIA, August. Prokosch HU, and Ganslandt T Perspectives for Medical Informatics. Reusing the Electronic Medical Record for Clinical Research. Methods of Information in Medicine 48 (1): Rada R, Mili H, Bicknell E, and Blettner M Development and Application of a Metric on Semantic Nets. IEEE Transactions on Systems, Man and Cybernetics 19 (1): Radev DR, Hovy E, and McKeown K Introduction to the Special Issue on Summarization. Computational Linguistics 28 (4): Radev, DR, Jing H, and Budzikowska M Centroid-Based Summarization of Multiple Documents: Sentence Extraction, Utility-Based Evaluation, and User Studies, In NAACL-ANLP Raghavan P, Fosler-Lussier E, Elhadad N, and Lai A Cross-Narrative Temporal Ordering of Medical Events. In Proceedings of the 52nd Annual Meeting of the Association for Computational Linguistics (ACL), Reichert D, Kaufman D, Bloxham B, Chase H, and Elhadad N Cognitive Analysis of the Summarization of Longitudinal Patient Records. AMIA Annual Symposium Proceedings / AMIA Symposium AMIA Symposium 2010 (July): Resnik P Using Information Content to Evaluate Semantic Similarity in a Taxonomy. Proc. of the 14th International Joint Conference on Artificial Intelligence, Rind A, Wang TD, Aigner W, Miksh S, Wongsuphasawat K, Plaisant C, and Shneiderman B Interactive Information Visualization for Exploring and Querying Electronic Health Records: A Systematic Review. In HCIL Rogers JL, Haring OM, and Watson RA Automating the Medical Record: Emerging Issues, Proc Annu Symp Comput Appl Med Care Rogers J, Puleston C, and Rector A The CLEF Chronicle: Patient Histories Derived from Electronic Health Records, In ICDEW
191 Rogers JL, and Haring OM The Impact of a Computerized Medical Record Summary System on Incidence and Length of Hospitalization. Medical Care 17 (6): Roque, FS, Jensen PB, Schmock H, Dalgaard M, Andreatta M, Hansen T, Søeby K, et al Using Electronic Patient Records to Discover Disease Correlations and Stratify Patient Cohorts. PLoS Computational Biology 7 (8): e Roque FS, Slaughter L, and Tkatsenko A A Comparison of Several Key Information Visualization Systems for Secondary Use of Electronic Health Record Content, In NAACL HLT 1 8. Rosenbloom TS, and Shultz AW Managing the Flood of Codes: Maintaining Patient Problem Lists in the Era of Meaningful Use and ICD10 Proceedings of AMIA 2012: 8. Rubin DB Inference and Missing Data. Biometrika 63 (3): Sacks DB, Bruns DE, Goldstein DE, Maclaren NK, McDonald JM, and Parrott M Guidelines and Recommendations for Laboratory Analysis in the Diagnosis and Management of Diabetes Mellitus. Clinical Chemistry 48 (3): Saeed M, Villarroel M, Reisner AT, Clifford G, Lehman LW, Moody G, Heldt T, Kyaw TH, Moody B, and Mark RG Multiparameter Intelligent Monitoring in Intensive Care II: A Public- Access Intensive Care Unit Database. Critical Care Medicine 39 (5): Sagreiya H, and Altman RB The Utility of General Purpose versus Specialty Clinical Databases for Research: Warfarin Dose Estimation from Extracted Clinical Variables. Journal of Biomedical Informatics 43 (5): Salvagno GL, Lippi G, Targher G, Montagnana M, and Guidi GC Monitoring Glycaemic Control: Is There Evidence for Appropriate Use of Routine Measurement of Glycated Haemoglobin? Clinical Chemical Laboratory Medicine 45 (8). Samal L, Wright A, Wong BT, Linder JA, and Bates DW Leveraging Electronic Health Records to Support Chronic Disease Management: The Need for Temporal Data Views. Informatics in Primary Care 19 (2): Sammon, CJ, Miller A, Mahtani KR, Holt TA, McHugh NJ, Luqmani RA, and Nightingale AL Missing Laboratory Test Data in Electronic General Practice Records: Analysis of Rheumatoid Factor Recording in the Clinical Practice Research Datalink. Pharmacoepidemiology and Drug Safety 24 (5):
192 Saria S, Koller D, and Penn A Learning Individual and Population Level Traits from Clinical Temporal Data. In NIPS. Saxena S, Anderson DW, Kaufman RL, Hannah JA, and Wong ET Quality Assurance Study of Cardiac Isoenzyme Utilization in a Large Teaching Hospital. Archives of Pathology & Laboratory Medicine 117 (2): Schafer JL, and Graham JW Missing Data: Our View of the State of the Art. Psychological Methods 7 (2): Schiff GD, and Bates DW Can Electronic Clinical Documentation Help Prevent Diagnostic Errors? The New England Journal of Medicine 362 (12): Schulam P, Wigley F, and Saria S Clustering Longitudinal Clinical Marker Trajectories from Electronic Health Data: Applications to Phenotyping and Endotype Discovery. In AAAI. Selvin E, Steffes MW, Zhu H, Matsushita K, Wagenknecht L, Pankow J, Coresh J, and Brancati FL Glycated Hemoglobin, Diabetes, and Cardiovascular Risk in Nondiabetic Adults. The New England Journal of Medicine 362 (9): Semeval-2015 task 14: Analysis of clinical text Shahar Y, Goren-Bar D, Boaz D, and Tahan G Distributed, Intelligent, Interactive Visualization and Exploration of Time-Oriented Clinical Data and Their Abstractions. Artificial Intelligence in Medicine 38 (2): Shwe MA, Middleton B, Heckerman DE, Henrion M, Horvitz EJ, Lehmann HP, and Cooper GF Probabilistic Diagnosis Using a Reformulation of the INTERNIST-1/QMR Knowledge Base. Methods of Information in Medicine 30 (4): Singer DE, Coley CM, Samet JH, and Nathan DM Tests of Glycemia in Diabetes Mellitus. Their Use in Establishing a Diagnosis and in Treatment. Annals of Internal Medicine 110 (2): Singh S, and Vajirkar P Context-Aware Data Mining Using Ontologies. Proceedings of the 22nd International Conference on Conceptual Modeling, August, Smith M, Saunders R, Stuckhardt L, and McGinnis JM Best Care at Lower Cost: The Path to Continuously Learning Health Care in America. National Academic Press. 177
193 Sonnenberg FA, Liu B, Feinberg JE, Kulikowski CA, and Johnson S Clinical Threading: Problem-Oriented Visual Summaries of Clinical Data. AMIA 2012 Symposium 353 (23): Stead WW, and Lin HS Computational Technology for Effective Health Care: Immediate Steps and Strategic Directions. The National Academies Collection: Reports Funded by National Institutes of Health. Washington (DC): National Academies Press (US). Stewart BA, Fernandes S, Rodriguez-Huertas E, and Landzberg M A Preliminary Look at Duplicate Testing Associated with Lack of Electronic Health Record Interoperability for Transferred Patients. Journal of the American Medical Informatics Association : JAMIA 17 (3): Styler W, Bethard S, and Finan S Temporal Annotation in the Clinical Domain. In ACL. Suermondt HJ, Tang PC, Strong PC, Young CY, and Annevelink J Automated Identification of Relevant Patient Information in a Physician s Workstation. Symposium on Computer Applications in Medical Care, Sun W, Rumshisky A, and Uzuner Ö Temporal Reasoning over Clinical Text: The State of the Art. Journal of the American Medical Inform. Assoc. 20(5): Tao C, Song D, Sharma D, and Chute CG Semantator: Semantic Annotator for Converting Biomedical Text to Linked Data. Journal of Biomedical Informatics 46 (5): Thornton DJ, Schold JD, Venkateshaiah L, and Lander B Prevalence of Copied Information by Attendings and Residents in Critical Care Progress Notes. Critical Care Medicine 41 (2): Thyvalikakath TP, Dziabiak MP, Johnson R, Torres-Urquidy MH, Acharya A, Yabes J, and Schleyer TK Advancing Cognitive Engineering Methods to Support User Interface Design for Electronic Health Records. International Journal of Medical Informatics 83 (4): Tversky A Features of Similarity. Psychological Review 84 (4): Unertl KM, Weinger MB, Johnson KB, and Lorenzi NM Describing and Modeling Workflow and Information Flow in Chronic Disease Care. Journal of the American Medical Informatics Association 16 (6):
194 van der Meulen M, Logie RH, Freer Y, Sykes C, Mcintosh N, and Hunter J When a Graph Is Poorer than 100 Words: A Comparison of Computerised Natural Language Generation, Human Generated Descriptions and Graphical Displays in Neonatal Intensive Care. Applied Cognitive Psychology 24 (1): Van Vleck TT, and Elhadad N Corpus-Based Problem Selection for EHR Note Summarization. AMIA Annual Symposium Proceedings / AMIA Symposium AMIA Symposium 2010: Van Vleck TT, Wilcox A, Stetson PD, Johnson SB, and Elhadad N Content and Structure of Clinical Problem Lists: A Corpus Analysis. AMIA Annual Symposium Proceedings / AMIA Symposium AMIA Symposium, van Walraven, C Population-Based Study of Repeat Laboratory Testing. Clinical Chemistry 49 (12): Verspoor K, Dvorkin D, and Cohen KB Ontology Quality Assurance through Analysis of Term Transformations. Bioinformatics (Oxford, England) 25: Wallach HM, Murray I, Salakhutdinov R, and Mimno D Evaluation Methods for Topic Models, In ICML Wang X, Chused A, Elhadad N, Friedman C, and Markatou M Automated Knowledge Acquisition from Clinical Narrative Reports. AMIA Annual Symposium Proceedings / AMIA Symposium AMIA Symposium, Wang X, Sontag D, and Wang F Unsupervised Learning of Disease Progression Models. Knowledge Discovery and Data Mining. Warner JL, and Alterovitz G Phenome Based Analysis as a Means for Discovering Context Dependent Clinical Reference Ranges AMIA Symposium AMIA Symposium: Weber GM, and Kohane IS Extracting Physician Group Intelligence from Electronic Health Records to Support Evidence Based Medicine. PLoS ONE 8 (5): e Wei WQ, and Denny JC Extracting Research-Quality Phenotypes from Electronic Health Records to Support Precision Medicine. Genome Medicine 7 (1): 41. Wei WQ, Cui T, Jiang G, Chute CG A High Throughput Semantic Concept Frequency Based Approach for Patient Identification: A Case Study Using Type 2 Diabetes Mellitus Clinical Notes, AMIA Symposium AMIA Symposium,
195 Wei WQ, Teixeira PL, Mo H, Cronin RM, Warner JL, and Denny JC Combining Billing Codes, Clinical Notes, and Medications from Electronic Health Records Provides Superior Phenotyping Performance. Journal of the American Medical Informatics Association: JAMIA. Wells, BJ, Chagin KM, Nowacki AS, and Kattan MW Strategies for Handling Missing Data in Electronic Health Record Derived Data. In EGEMS (Washington, DC) 1 (3): Were MC, Shen C, Bwana M, Emenyonu N, Musinguzi N, Nkuyahaga F, Kembabazi A, and Tierney WM Creation and Evaluation of EMR-Based Paper Clinical Summaries to Support HIV- Care in Uganda, Africa. International Journal of Medical Informatics 79 (2): West VL, Borland D, and Hammond WE Innovative Information Visualization of Electronic Health Record Data: A Systematic Review. Journal of the American Medical Informatics Association : JAMIA, 22(2): Wilcox AB, Jones SS, Dorr DA, Cannon W, Burns L, Radican K, Christensen K, et al Use and Impact of a Computer-Generated Patient Summary Worksheet for Primary Care. AMIA Annual Symposium Proceedings / AMIA Symposium AMIA Symposium, Wrenn JO, Stein DM, Bakken S, and Stetson PD Quantifying Clinical Narrative Redundancy in an Electronic Health Record. Journal of the American Medical Informatics Association: JAMIA 17 (1): Wu G, Chang E, and Panda N Formulating Context-Dependent Similarity Functions. In Proc. 13th Ann. ACM Int l Conf. Multimedia (Multimedia 05). Wu ST, Juhn YJ, Sohn S, and Liu H Patient-Level Temporal Aggregation for Text-Based Asthma Status Ascertainment. Journal of the American Medical Informatics Association : JAMIA 21 (5): Wu Z, and Palmer M Verbs Semantics and Lexical Selection. In 32ndAnnual Meeting of the Association for Computational Linguistics, Yu S, Liao KP, Shaw SY, Gainer VS, Churchill SE, Szolovits P, Murphy SN, Kohane IS, and Cai T Toward High-Throughput Phenotyping: Unbiased Automated Feature Extraction and Selection from Knowledge Sources. Journal of the American Medical Informatics Association : JAMIA, April. Zhang R Longitudinal Analysis of New Information Types in Clinical Notes, AMIA Jt Summits Transl Sci Proc;
196 Zhang R, Pakhomov S, McInnes BT, and Melton GB Evaluating Measures of Redundancy in Clinical Texts. AMIA Annual Symposium Proceedings / AMIA Symposium AMIA Symposium 2011 (July): Zhang R, Pakhomov S, and Melton GB Automated Identification of Relevant New Information in Clinical Narrative, In ACM IHI Zhi M, Ding EL, Theisen-Toupal J, Whelan J, and Arnaout R The Landscape of Inappropriate Laboratory Testing: A 15-Year Meta-Analysis. PLoS ONE 8 (11): e Zhou L, and Hripcsak G Temporal Reasoning with Medical Data a Review with Emphasis on Medical Natural Language Processing. Journal of Biomedical Informatics 40 (2): Zhou L, Parsons S, and Hripcsak G The Evaluation of a Temporal Reasoning System in Processing Clinical Discharge Summaries. Journal of the American Medical Informatics Association 15 (1):

197 Appendix A: List of Correlations between Laboratory Value and Measurement Gap 182

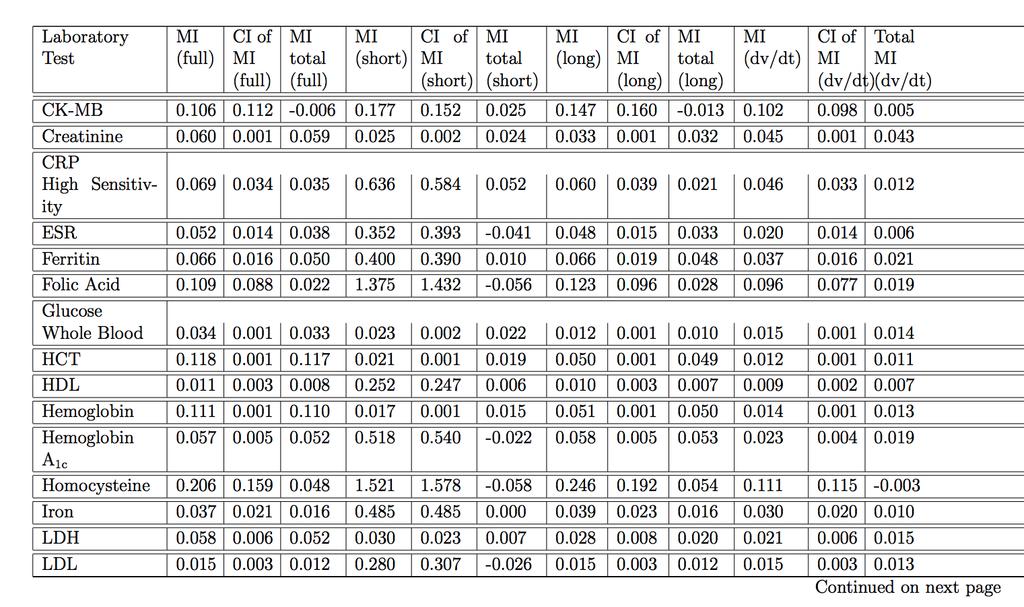
198 183
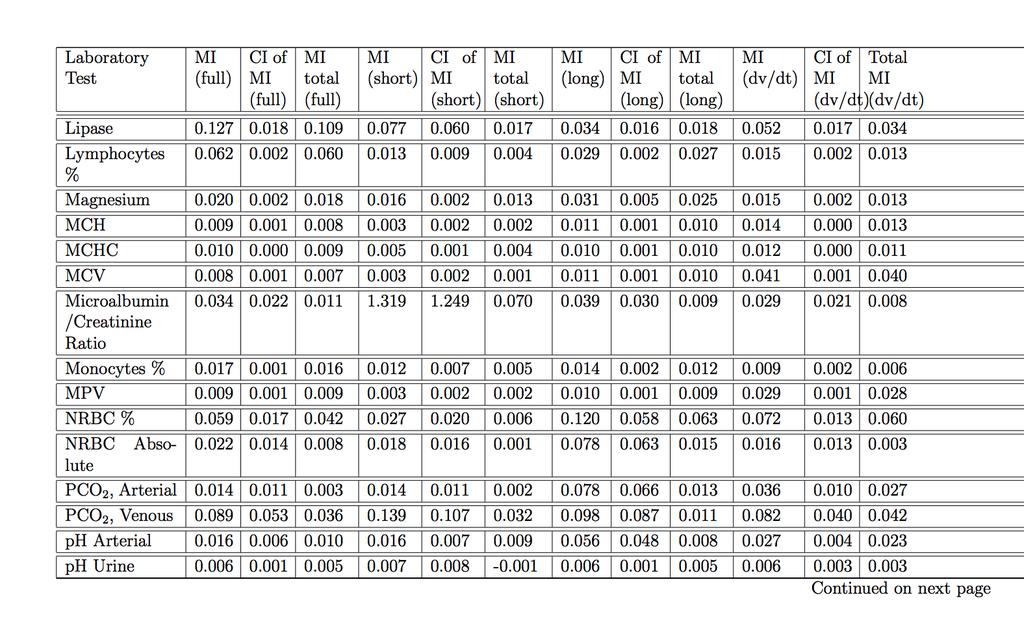
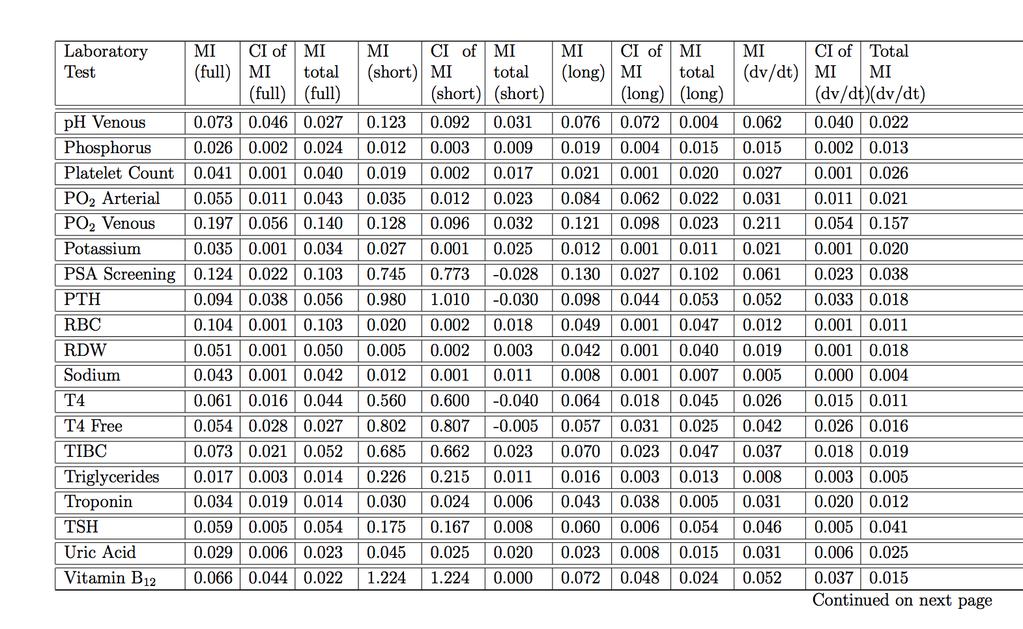
199 184
200 185
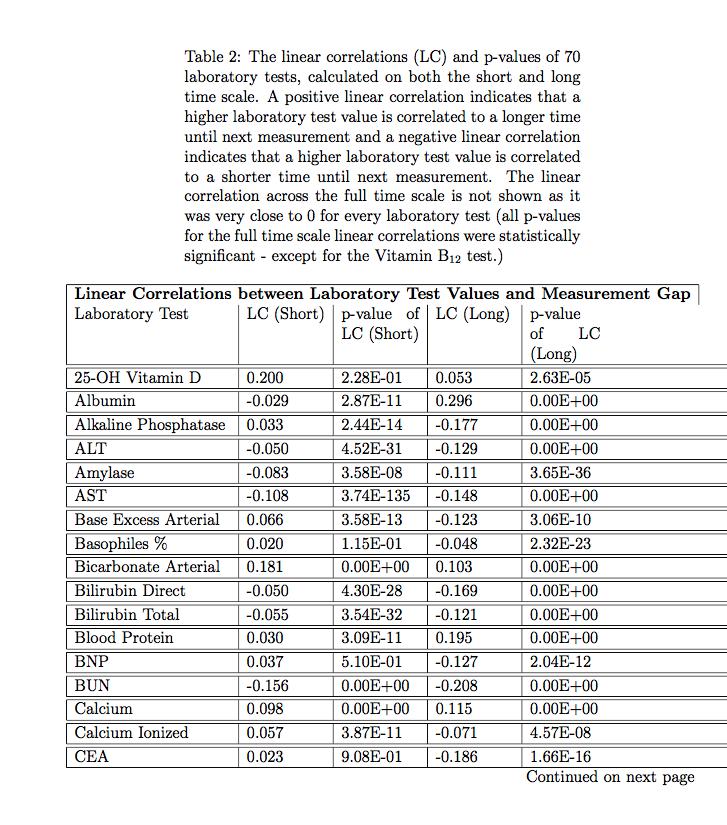
201 186
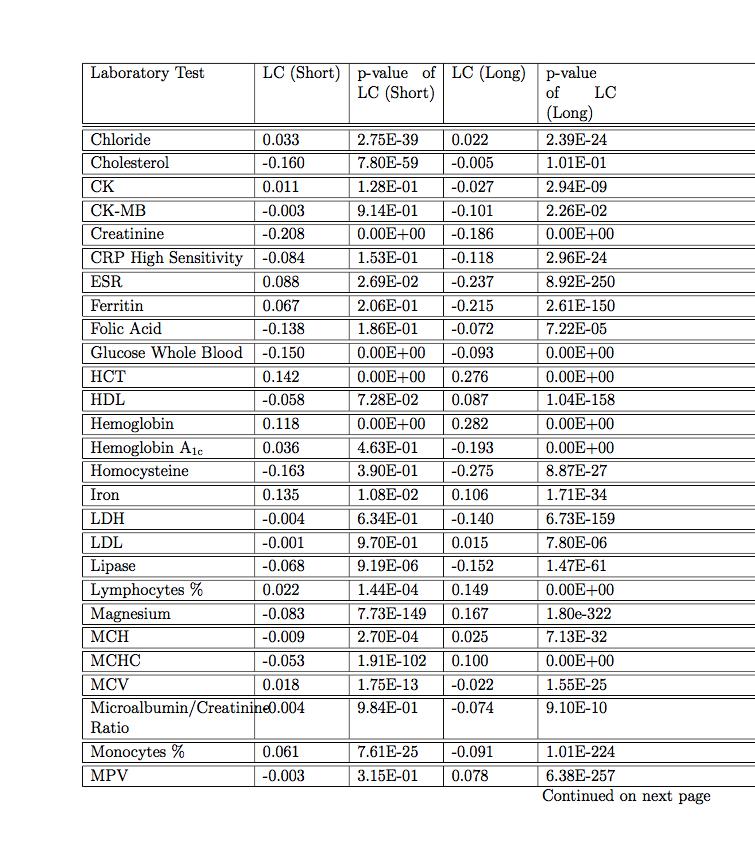
202 187

203 188
Case-based reasoning using electronic health records efficiently identifies eligible patients for clinical trials
 Case-based reasoning using electronic health records efficiently identifies eligible patients for clinical trials Riccardo Miotto and Chunhua Weng Department of Biomedical Informatics Columbia University,
A Predictive Chronological Model of Multiple Clinical Observations T R A V I S G O O D W I N A N D S A N D A M. H A R A B A G I U
 A Predictive Chronological Model of Multiple Clinical Observations T R A V I S G O O D W I N A N D S A N D A M. H A R A B A G I U T H E U N I V E R S I T Y O F T E X A S A T D A L L A S H U M A N L A N
Chapter 1. Introduction
 Chapter 1 Introduction 1.1 Motivation and Goals The increasing availability and decreasing cost of high-throughput (HT) technologies coupled with the availability of computational tools and data form a
Text mining for lung cancer cases over large patient admission data. David Martinez, Lawrence Cavedon, Zaf Alam, Christopher Bain, Karin Verspoor
 Text mining for lung cancer cases over large patient admission data David Martinez, Lawrence Cavedon, Zaf Alam, Christopher Bain, Karin Verspoor Opportunities for Biomedical Informatics Increasing roll-out
Understanding and Reducing Clinical Data Biases. Daniel Fort
 Understanding and Reducing Clinical Data Biases Daniel Fort Submitted in partial fulfillment of the requirements for the degree of Doctor of Philosophy under the Executive Committee of the Graduate School
TITLE: A Data-Driven Approach to Patient Risk Stratification for Acute Respiratory Distress Syndrome (ARDS)
") TITLE: A Data-Driven Approach to Patient Risk Stratification for Acute Respiratory Distress Syndrome (ARDS) AUTHORS: Tejas Prahlad INTRODUCTION Acute Respiratory Distress Syndrome (ARDS) is a condition
TITLE: A Data-Driven Approach to Patient Risk Stratification for Acute Respiratory Distress Syndrome (ARDS) AUTHORS: Tejas Prahlad INTRODUCTION Acute Respiratory Distress Syndrome (ARDS) is a condition
Statement of research interest
 Statement of research interest Milos Hauskrecht My primary field of research interest is Artificial Intelligence (AI). Within AI, I am interested in problems related to probabilistic modeling, machine
A Novel Temporal Similarity Measure for Patients Based on Irregularly Measured Data in Electronic Health Records
 ACM-BCB 2016 A Novel Temporal Similarity Measure for Patients Based on Irregularly Measured Data in Electronic Health Records Ying Sha, Janani Venugopalan, May D. Wang Georgia Institute of Technology Oct.
Semantic Alignment between ICD-11 and SNOMED-CT. By Marcie Wright RHIA, CHDA, CCS
 Semantic Alignment between ICD-11 and SNOMED-CT By Marcie Wright RHIA, CHDA, CCS World Health Organization (WHO) owns and publishes the International Classification of Diseases (ICD) WHO was entrusted
How Does Analysis of Competing Hypotheses (ACH) Improve Intelligence Analysis?
 Improve Intelligence Analysis?") How Does Analysis of Competing Hypotheses (ACH) Improve Intelligence Analysis? Richards J. Heuer, Jr. Version 1.2, October 16, 2005 This document is from a collection of works by Richards J. Heuer, Jr.
How Does Analysis of Competing Hypotheses (ACH) Improve Intelligence Analysis? Richards J. Heuer, Jr. Version 1.2, October 16, 2005 This document is from a collection of works by Richards J. Heuer, Jr.
Inferring Clinical Correlations from EEG Reports with Deep Neural Learning
 Inferring Clinical Correlations from EEG Reports with Deep Neural Learning Methods for Identification, Classification, and Association using EHR Data S23 Travis R. Goodwin (Presenter) & Sanda M. Harabagiu
Answers to end of chapter questions
 Answers to end of chapter questions Chapter 1 What are the three most important characteristics of QCA as a method of data analysis? QCA is (1) systematic, (2) flexible, and (3) it reduces data. What are
Predicting Breast Cancer Survivability Rates
 Predicting Breast Cancer Survivability Rates For data collected from Saudi Arabia Registries Ghofran Othoum 1 and Wadee Al-Halabi 2 1 Computer Science, Effat University, Jeddah, Saudi Arabia 2 Computer
CARE Cross-project Collectives Analysis: Technical Appendix
 CARE Cross-project Collectives Analysis: Technical Appendix The CARE approach to development support and women s economic empowerment is often based on the building blocks of collectives. Some of these
Chapter 12 Conclusions and Outlook
 Chapter 12 Conclusions and Outlook In this book research in clinical text mining from the early days in 1970 up to now (2017) has been compiled. This book provided information on paper based patient record
KNOWLEDGE VALORIZATION
 KNOWLEDGE VALORIZATION The goal of this valorisation chapter is to describe how the knowledge resulting from the research in this dissertation can be made valuable for clinical and social use. This dissertation
HHS Public Access Author manuscript Stud Health Technol Inform. Author manuscript; available in PMC 2015 July 08.
 Navigating Longitudinal Clinical Notes with an Automated Method for Detecting New Information Rui Zhang a, Serguei Pakhomov a,b, Janet T. Lee c, and Genevieve B. Melton a,c a Institute for Health Informatics,
Performance Dashboard for the Substance Abuse Treatment System in Los Angeles
 Performance Dashboard for the Substance Abuse Treatment System in Los Angeles Abdullah Alibrahim, Shinyi Wu, PhD and Erick Guerrero PhD Epstein Industrial and Systems Engineering University of Southern
A Comparison of Collaborative Filtering Methods for Medication Reconciliation
 A Comparison of Collaborative Filtering Methods for Medication Reconciliation Huanian Zheng, Rema Padman, Daniel B. Neill The H. John Heinz III College, Carnegie Mellon University, Pittsburgh, PA, 15213,
Memory-Augmented Active Deep Learning for Identifying Relations Between Distant Medical Concepts in Electroencephalography Reports
 Memory-Augmented Active Deep Learning for Identifying Relations Between Distant Medical Concepts in Electroencephalography Reports Ramon Maldonado, BS, Travis Goodwin, PhD Sanda M. Harabagiu, PhD The University
Expert System Profile
 Expert System Profile GENERAL Domain: Medical Main General Function: Diagnosis System Name: INTERNIST-I/ CADUCEUS (or INTERNIST-II) Dates: 1970 s 1980 s Researchers: Ph.D. Harry Pople, M.D. Jack D. Myers
Not all NLP is Created Equal:
 Not all NLP is Created Equal: CAC Technology Underpinnings that Drive Accuracy, Experience and Overall Revenue Performance Page 1 Performance Perspectives Health care financial leaders and health information
The use of Topic Modeling to Analyze Open-Ended Survey Items
 The use of Topic Modeling to Analyze Open-Ended Survey Items W. Holmes Finch Maria E. Hernández Finch Constance E. McIntosh Claire Braun Ball State University Open ended survey items Researchers making
The MetroHealth System. Creating the HIT Organizational Culture at MetroHealth. Creating the HIT Organizational Culture
 CASE STUDY CASE STUDY The MetroHealth System Optimizing Health Information Technology to Increase Vaccination Rates The MetroHealth System in Cleveland, Ohio, was the first safety-net health care system
Identifying Parkinson s Patients: A Functional Gradient Boosting Approach
 Identifying Parkinson s Patients: A Functional Gradient Boosting Approach Devendra Singh Dhami 1, Ameet Soni 2, David Page 3, and Sriraam Natarajan 1 1 Indiana University Bloomington 2 Swarthmore College
Recent developments for combining evidence within evidence streams: bias-adjusted meta-analysis
 EFSA/EBTC Colloquium, 25 October 2017 Recent developments for combining evidence within evidence streams: bias-adjusted meta-analysis Julian Higgins University of Bristol 1 Introduction to concepts Standard
Doing High Quality Field Research. Kim Elsbach University of California, Davis
 Doing High Quality Field Research Kim Elsbach University of California, Davis 1 1. What Does it Mean to do High Quality (Qualitative) Field Research? a) It plays to the strengths of the method for theory
IBM Research Report. Automated Problem List Generation from Electronic Medical Records in IBM Watson
 RC25496 (WAT1409-068) September 24, 2014 Computer Science IBM Research Report Automated Problem List Generation from Electronic Medical Records in IBM Watson Murthy Devarakonda, Ching-Huei Tsou IBM Research
extraction can take place. Another problem is that the treatment for chronic diseases is sequential based upon the progression of the disease.
 ix Preface The purpose of this text is to show how the investigation of healthcare databases can be used to examine physician decisions to develop evidence-based treatment guidelines that optimize patient
The openehr approach. Background. Approach. Heather Leslie, July 17, 2014
 Heather Leslie, July 17, 2014 The openehr approach Background The open source openehr 1 architecture specifications 2 have evolved as the result of over 20 years of research and international implementations,
Keeping Abreast of Breast Imagers: Radiology Pathology Correlation for the Rest of Us
 SIIM 2016 Scientific Session Quality and Safety Part 1 Thursday, June 30 8:00 am 9:30 am Keeping Abreast of Breast Imagers: Radiology Pathology Correlation for the Rest of Us Linda C. Kelahan, MD, Medstar
Visualizing Temporal Patterns by Clustering Patients
 Visualizing Temporal Patterns by Clustering Patients Grace Shin, MS 1 ; Samuel McLean, MD 2 ; June Hu, MS 2 ; David Gotz, PhD 1 1 School of Information and Library Science; 2 Department of Anesthesiology
CATALYSTS DRIVING SUCCESSFUL DECISIONS IN LIFE SCIENCES QUALITATIVE RESEARCH THROUGH A BEHAVIORAL ECONOMIC LENS
 CATALYSTS DRIVING SUCCESSFUL DECISIONS IN LIFE SCIENCES QUALITATIVE RESEARCH THROUGH A BEHAVIORAL ECONOMIC LENS JEANETTE HODGSON & SARAH SMITH DECEMBER 2017 QUALITATIVE RESEARCH THROUGH A BEHAVIORAL ECONOMIC
Predictive and Similarity Analytics for Healthcare
 Predictive and Similarity Analytics for Healthcare Paul Hake, MSPA IBM Smarter Care Analytics 1 Disease Progression & Cost of Care Health Status Health care spending Healthy / Low Risk At Risk High Risk
CHAPTER 4 THE QUESTIONNAIRE DESIGN /SOLUTION DESIGN. This chapter contains explanations that become a basic knowledge to create a good
 CHAPTER 4 THE QUESTIONNAIRE DESIGN /SOLUTION DESIGN This chapter contains explanations that become a basic knowledge to create a good questionnaire which is able to meet its objective. Just like the thesis
10.2 Summary of the Votes and Considerations for Policy
 CEPAC Voting and Policy Implications Summary Supplemental Screening for Women with Dense Breast Tissue December 13, 2013 The last CEPAC meeting addressed the comparative clinical effectiveness and value
PDRF About Propensity Weighting emma in Australia Adam Hodgson & Andrey Ponomarev Ipsos Connect Australia
 1. Introduction It is not news for the research industry that over time, we have to face lower response rates from consumer surveys (Cook, 2000, Holbrook, 2008). It is not infrequent these days, especially
Pilot Study: Clinical Trial Task Ontology Development. A prototype ontology of common participant-oriented clinical research tasks and
 Pilot Study: Clinical Trial Task Ontology Development Introduction A prototype ontology of common participant-oriented clinical research tasks and events was developed using a multi-step process as summarized
Formulating Emotion Perception as a Probabilistic Model with Application to Categorical Emotion Classification
 Formulating Emotion Perception as a Probabilistic Model with Application to Categorical Emotion Classification Reza Lotfian and Carlos Busso Multimodal Signal Processing (MSP) lab The University of Texas
BIOLOGY. The range and suitability of the work submitted
 Overall grade boundaries BIOLOGY Grade: E D C B A Mark range: 0-7 8-15 16-22 23-28 29-36 The range and suitability of the work submitted In this session essays were submitted in a wide range of appropriate
Data Sharing Consortiums and Large Datasets to Inform Cancer Diagnosis
 February, 13th 2018 Data Sharing Consortiums and Large Datasets to Inform Cancer Diagnosis Improving Cancer Diagnosis and Care: Patient Access to Oncologic Imaging and Pathology Expertise and Technologies:
Effect of (OHDSI) Vocabulary Mapping on Phenotype Cohorts
 Vocabulary Mapping on Phenotype Cohorts") Effect of (OHDSI) Vocabulary Mapping on Phenotype Cohorts Matthew Levine, Research Associate George Hripcsak, Professor Department of Biomedical Informatics, Columbia University Intro Reasons to map: International
Effect of (OHDSI) Vocabulary Mapping on Phenotype Cohorts Matthew Levine, Research Associate George Hripcsak, Professor Department of Biomedical Informatics, Columbia University Intro Reasons to map: International
Innovative Risk and Quality Solutions for Value-Based Care. Company Overview
 Innovative Risk and Quality Solutions for Value-Based Care Company Overview Meet Talix Talix provides risk and quality solutions to help providers, payers and accountable care organizations address the
PEER REVIEW HISTORY ARTICLE DETAILS TITLE (PROVISIONAL)
") PEER REVIEW HISTORY BMJ Open publishes all reviews undertaken for accepted manuscripts. Reviewers are asked to complete a checklist review form (http://bmjopen.bmj.com/site/about/resources/checklist.pdf)
PEER REVIEW HISTORY BMJ Open publishes all reviews undertaken for accepted manuscripts. Reviewers are asked to complete a checklist review form (http://bmjopen.bmj.com/site/about/resources/checklist.pdf)
Data Structures vs. Study Results:
 Data Structures vs. Study Results: Confessions of a failed epidemiologist who had an informatics epiphany CG Chute, MD DrPH, Bloomberg Distinguished Professor of Health Informatics April 7, 2015 1 Chris
FINAL REPORT Measuring Semantic Relatedness using a Medical Taxonomy. Siddharth Patwardhan. August 2003
 FINAL REPORT Measuring Semantic Relatedness using a Medical Taxonomy by Siddharth Patwardhan August 2003 A report describing the research work carried out at the Mayo Clinic in Rochester as part of an
Course summary, final remarks
 Course "Empirical Evaluation in Informatics" Prof. Dr. Lutz Prechelt Freie Universität Berlin, Institut für Informatik http://www.inf.fu-berlin.de/inst/ag-se/ Role of empiricism Generic method Concrete
Outlier Analysis. Lijun Zhang
 Outlier Analysis Lijun Zhang zlj@nju.edu.cn http://cs.nju.edu.cn/zlj Outline Introduction Extreme Value Analysis Probabilistic Models Clustering for Outlier Detection Distance-Based Outlier Detection Density-Based
OBSERVATIONAL MEDICAL OUTCOMES PARTNERSHIP
 OBSERVATIONAL Patient-centered observational analytics: New directions toward studying the effects of medical products Patrick Ryan on behalf of OMOP Research Team May 22, 2012 Observational Medical Outcomes
Incorporation of Imaging-Based Functional Assessment Procedures into the DICOM Standard Draft version 0.1 7/27/2011
 Incorporation of Imaging-Based Functional Assessment Procedures into the DICOM Standard Draft version 0.1 7/27/2011 I. Purpose Drawing from the profile development of the QIBA-fMRI Technical Committee,
Epidemiologic Methods I & II Epidem 201AB Winter & Spring 2002
 DETAILED COURSE OUTLINE Epidemiologic Methods I & II Epidem 201AB Winter & Spring 2002 Hal Morgenstern, Ph.D. Department of Epidemiology UCLA School of Public Health Page 1 I. THE NATURE OF EPIDEMIOLOGIC
Analysis A step in the research process that involves describing and then making inferences based on a set of data.
 1 Appendix 1:. Definitions of important terms. Additionality The difference between the value of an outcome after the implementation of a policy, and its value in a counterfactual scenario in which the
Sound Off DR. GOOGLE S ROLE IN PRE-DIAGNOSIS THROUGH TREATMENT. Ipsos SMX. June 2014
 Sound Off DR. GOOGLE S ROLE IN PRE-DIAGNOSIS THROUGH TREATMENT June 2014 Ipsos SMX : Sound bits (of advice) and bites (of research) from Ipsos SMX Ipsos social media research division, dedicated to providing
Psychology, 2010, 1: doi: /psych Published Online August 2010 (
 Psychology, 2010, 1: 194-198 doi:10.4236/psych.2010.13026 Published Online August 2010 (http://www.scirp.org/journal/psych) Using Generalizability Theory to Evaluate the Applicability of a Serial Bayes
Introduction to Machine Learning. Katherine Heller Deep Learning Summer School 2018
 Introduction to Machine Learning Katherine Heller Deep Learning Summer School 2018 Outline Kinds of machine learning Linear regression Regularization Bayesian methods Logistic Regression Why we do this
White Paper Estimating Complex Phenotype Prevalence Using Predictive Models
 White Paper 23-12 Estimating Complex Phenotype Prevalence Using Predictive Models Authors: Nicholas A. Furlotte Aaron Kleinman Robin Smith David Hinds Created: September 25 th, 2015 September 25th, 2015
Social Determinants of Health
 FORECAST HEALTH WHITE PAPER SERIES Social Determinants of Health And Predictive Modeling SOHAYLA PRUITT Director Product Management Health systems must devise new ways to adapt to an aggressively changing
Review of Veterinary Epidemiologic Research by Dohoo, Martin, and Stryhn
 The Stata Journal (2004) 4, Number 1, pp. 89 92 Review of Veterinary Epidemiologic Research by Dohoo, Martin, and Stryhn Laurent Audigé AO Foundation laurent.audige@aofoundation.org Abstract. The new book
An Intelligent Writing Assistant Module for Narrative Clinical Records based on Named Entity Recognition and Similarity Computation
 An Intelligent Writing Assistant Module for Narrative Clinical Records based on Named Entity Recognition and Similarity Computation 1,2,3 EMR and Intelligent Expert System Engineering Research Center of
Guidelines for Writing and Reviewing an Informed Consent Manuscript From the Editors of Clinical Research in Practice: The Journal of Team Hippocrates
 Guidelines for Writing and Reviewing an Informed Consent Manuscript From the Editors of Clinical Research in Practice: The Journal of Team Hippocrates 1. Title a. Emphasize the clinical utility of the
In this second module, we will focus on features that distinguish quantitative and qualitative research projects.
 Welcome to the second module in the Overview of Qualitative Research Methods series. My name is Julie Stoner and I am a Professor at the University of Oklahoma Health Sciences Center. This introductory
The Good News. More storage capacity allows information to be saved Economic and social forces creating more aggregation of data
 The Good News Capacity to gather medically significant data growing quickly Better instrumentation (e.g., MRI machines, ambulatory monitors, cameras) generates more information/patient More storage capacity
Causal Knowledge Modeling for Traditional Chinese Medicine using OWL 2
 Causal Knowledge Modeling for Traditional Chinese Medicine using OWL 2 Peiqin Gu College of Computer Science, Zhejiang University, P.R.China gupeiqin@zju.edu.cn Abstract. Unlike Western Medicine, those
Paul Bennett, Microsoft Research (CLUES) Joint work with Ben Carterette, Max Chickering, Susan Dumais, Eric Horvitz, Edith Law, and Anton Mityagin.
 Joint work with Ben Carterette, Max Chickering, Susan Dumais, Eric Horvitz, Edith Law, and Anton Mityagin.") Paul Bennett, Microsoft Research (CLUES) Joint work with Ben Carterette, Max Chickering, Susan Dumais, Eric Horvitz, Edith Law, and Anton Mityagin. Why Preferences? Learning Consensus from Preferences
Paul Bennett, Microsoft Research (CLUES) Joint work with Ben Carterette, Max Chickering, Susan Dumais, Eric Horvitz, Edith Law, and Anton Mityagin. Why Preferences? Learning Consensus from Preferences
Evidence Informed Practice Online Learning Module Glossary
 Term Abstract Associations Attrition Bias Background and Significance Baseline Basic Science Bias Blinding Definition An abstract is a summary of a research article. It usually includes the purpose, methods,
Rumor Detection on Twitter with Tree-structured Recursive Neural Networks
 1 Rumor Detection on Twitter with Tree-structured Recursive Neural Networks Jing Ma 1, Wei Gao 2, Kam-Fai Wong 1,3 1 The Chinese University of Hong Kong 2 Victoria University of Wellington, New Zealand
Some New Chapter FAQs:
 Some New Chapter FAQs: Why should I start a Holistic Moms Network chapter? Starting a new chapter within our organization is an exciting adventure! There are many fabulous rewards to creating a Holistic
Relationships Between the High Impact Indicators and Other Indicators
 Relationships Between the High Impact Indicators and Other Indicators The High Impact Indicators are a list of key skills assessed on the GED test that, if emphasized in instruction, can help instructors
Detecting and Disrupting Criminal Networks. A Data Driven Approach. P.A.C. Duijn
 Detecting and Disrupting Criminal Networks. A Data Driven Approach. P.A.C. Duijn Summary Detecting and Disrupting Criminal Networks A data-driven approach It is estimated that transnational organized crime
Is Leisure Theory Needed For Leisure Studies?
 Journal of Leisure Research Copyright 2000 2000, Vol. 32, No. 1, pp. 138-142 National Recreation and Park Association Is Leisure Theory Needed For Leisure Studies? KEYWORDS: Mark S. Searle College of Human
Stepwise Knowledge Acquisition in a Fuzzy Knowledge Representation Framework
 Stepwise Knowledge Acquisition in a Fuzzy Knowledge Representation Framework Thomas E. Rothenfluh 1, Karl Bögl 2, and Klaus-Peter Adlassnig 2 1 Department of Psychology University of Zurich, Zürichbergstraße
Reader s Emotion Prediction Based on Partitioned Latent Dirichlet Allocation Model
 Reader s Emotion Prediction Based on Partitioned Latent Dirichlet Allocation Model Ruifeng Xu, Chengtian Zou, Jun Xu Key Laboratory of Network Oriented Intelligent Computation, Shenzhen Graduate School,
ISPOR Task Force Report: ITC & NMA Study Questionnaire
 INDIRECT TREATMENT COMPARISON / NETWORK META-ANALYSIS STUDY QUESTIONNAIRE TO ASSESS RELEVANCE AND CREDIBILITY TO INFORM HEALTHCARE DECISION-MAKING: AN ISPOR-AMCP-NPC GOOD PRACTICE TASK FORCE REPORT DRAFT
Systems Theory: Should Information Researchers Even Care?
 Association for Information Systems AIS Electronic Library (AISeL) SAIS 2016 Proceedings Southern (SAIS) 2016 Systems Theory: Should Information Researchers Even Care? Kane J. Smith Virginia Commonwealth
Application of AI in Healthcare. Alistair Erskine MD MBA Chief Informatics Officer
 Application of AI in Healthcare Alistair Erskine MD MBA Chief Informatics Officer 1 Overview Why AI in Healthcare topic matters Is AI just another shiny objects? Geisinger AI collaborations Categories
Empirical Research Methods for Human-Computer Interaction. I. Scott MacKenzie Steven J. Castellucci
 Empirical Research Methods for Human-Computer Interaction I. Scott MacKenzie Steven J. Castellucci 1 Topics The what, why, and how of empirical research Group participation in a real experiment Observations
Potential Use of a Causal Bayesian Network to Support Both Clinical and Pathophysiology Tutoring in an Intelligent Tutoring System for Anemias
 Harvard-MIT Division of Health Sciences and Technology HST.947: Medical Artificial Intelligence Prof. Peter Szolovits Prof. Lucila Ohno-Machado Potential Use of a Causal Bayesian Network to Support Both
Mining Human-Place Interaction Patterns from Location-Based Social Networks to Enrich Place Categorization Systems
 Mining Human-Place Interaction Patterns from Location-Based Social Networks to Enrich Place Categorization Systems Yingjie Hu, Grant McKenzie, Krzysztof Janowicz, Song Gao STKO Lab, Department of Geography,
Propensity Score Methods for Estimating Causality in the Absence of Random Assignment: Applications for Child Care Policy Research
 2012 CCPRC Meeting Methodology Presession Workshop October 23, 2012, 2:00-5:00 p.m. Propensity Score Methods for Estimating Causality in the Absence of Random Assignment: Applications for Child Care Policy
Comparing ICD9-Encoded Diagnoses and NLP-Processed Discharge Summaries for Clinical Trials Pre-Screening: A Case Study
 Comparing ICD9-Encoded Diagnoses and NLP-Processed Discharge Summaries for Clinical Trials Pre-Screening: A Case Study Li Li, MS, Herbert S. Chase, MD, Chintan O. Patel, MS Carol Friedman, PhD, Chunhua
Real World Patients: The Intersection of Real World Evidence and Episode of Care Analytics
 PharmaSUG 2018 - Paper RW-05 Real World Patients: The Intersection of Real World Evidence and Episode of Care Analytics David Olaleye and Youngjin Park, SAS Institute Inc. ABSTRACT SAS Institute recently
Ability to link signs/symptoms of current patient to previous clinical encounters; allows filtering of info to produce broad. differential.
 Patient Care Novice Advanced Information gathering Organization of responsibilities Transfer of Care Physical Examination Decision Making Development and execution of plans Gathers too much/little info;
Leveraging Data for Targeted Patient Population Health Improvements
 Leveraging Data for Targeted Patient Population Health Improvements Diabetes Impact on Health in America Diabetes is a major health concern in the United States today. The Centers for Disease Control
Selecting a research method
 Selecting a research method Tomi Männistö 13.10.2005 Overview Theme Maturity of research (on a particular topic) and its reflection on appropriate method Validity level of research evidence Part I Story
Truth Versus Truthiness in Clinical Data
 Temple University Health System Truth Versus Truthiness in Clinical Data Mark Weiner, MD, FACP, FACMI Assistant Dean for Informatics, Temple University School of Medicine mark.weiner@tuhs.temple.edu 1
WikiWarsDE: A German Corpus of Narratives Annotated with Temporal Expressions
 WikiWarsDE: A German Corpus of Narratives Annotated with Temporal Expressions Jannik Strötgen, Michael Gertz Institute of Computer Science, Heidelberg University Im Neuenheimer Feld 348, 69120 Heidelberg,
Clinical decision support (CDS) and Arden Syntax
 and Arden Syntax") Clinical decision support (CDS) and Arden Syntax Educational material, part 1 Medexter Healthcare Borschkegasse 7/5 A-1090 Vienna www.medexter.com www.meduniwien.ac.at/kpa (academic) Better care, patient
Clinical decision support (CDS) and Arden Syntax Educational material, part 1 Medexter Healthcare Borschkegasse 7/5 A-1090 Vienna www.medexter.com www.meduniwien.ac.at/kpa (academic) Better care, patient
Objectives. Quantifying the quality of hypothesis tests. Type I and II errors. Power of a test. Cautions about significance tests
 Objectives Quantifying the quality of hypothesis tests Type I and II errors Power of a test Cautions about significance tests Designing Experiments based on power Evaluating a testing procedure The testing
The Standard Theory of Conscious Perception
 The Standard Theory of Conscious Perception C. D. Jennings Department of Philosophy Boston University Pacific APA 2012 Outline 1 Introduction Motivation Background 2 Setting up the Problem Working Definitions
Maximize the value of your diabetes population management program with advanced analytics PLAYBOOK
 Maximize the value of your diabetes population management program with advanced analytics PLAYBOOK STEP ONE: Analyze your patient population Bend the cost curve: Learning more about your patients can lead
Chapter 2: Identification and Care of Patients With CKD
 Chapter 2: Identification and Care of Patients With CKD Over half of patients in the Medicare 5% sample (aged 65 and older) had at least one of three diagnosed chronic conditions chronic kidney disease
Discovering Meaningful Cut-points to Predict High HbA1c Variation
 Proceedings of the 7th INFORMS Workshop on Data Mining and Health Informatics (DM-HI 202) H. Yang, D. Zeng, O. E. Kundakcioglu, eds. Discovering Meaningful Cut-points to Predict High HbAc Variation Si-Chi
The Journey towards Total Wellbeing A Health System s Innovative Approach
 The Journey towards Total Wellbeing A Health System s Innovative Approach Company Profile Wellness A state of complete physical, mental and social wellbeing and not merely the absence of disease or infirmity
Recent trends in health care legislation have led to a rise in
 Collaborative Filtering for Medical Conditions By Shea Parkes and Ben Copeland Recent trends in health care legislation have led to a rise in risk-bearing health care provider organizations, such as accountable
Unit 1 Exploring and Understanding Data
 Unit 1 Exploring and Understanding Data Area Principle Bar Chart Boxplot Conditional Distribution Dotplot Empirical Rule Five Number Summary Frequency Distribution Frequency Polygon Histogram Interquartile
Building Evaluation Scales for NLP using Item Response Theory
 Building Evaluation Scales for NLP using Item Response Theory John Lalor CICS, UMass Amherst Joint work with Hao Wu (BC) and Hong Yu (UMMS) Motivation Evaluation metrics for NLP have been mostly unchanged
DRAFT (Final) Concept Paper On choosing appropriate estimands and defining sensitivity analyses in confirmatory clinical trials
 Concept Paper On choosing appropriate estimands and defining sensitivity analyses in confirmatory clinical trials") DRAFT (Final) Concept Paper On choosing appropriate estimands and defining sensitivity analyses in confirmatory clinical trials EFSPI Comments Page General Priority (H/M/L) Comment The concept to develop
DRAFT (Final) Concept Paper On choosing appropriate estimands and defining sensitivity analyses in confirmatory clinical trials EFSPI Comments Page General Priority (H/M/L) Comment The concept to develop
Consulting Skills. Part 1: Critical assessment of Peter Block and Edgar Schein s frameworks
 Consulting Skills Part 1: Critical assessment of Peter Block and Edgar Schein s frameworks Anyone with their sights set on becoming a consultant or simply looking to improve their existing consulting skills
THE APPLICATION OF ORDINAL LOGISTIC HEIRARCHICAL LINEAR MODELING IN ITEM RESPONSE THEORY FOR THE PURPOSES OF DIFFERENTIAL ITEM FUNCTIONING DETECTION
 THE APPLICATION OF ORDINAL LOGISTIC HEIRARCHICAL LINEAR MODELING IN ITEM RESPONSE THEORY FOR THE PURPOSES OF DIFFERENTIAL ITEM FUNCTIONING DETECTION Timothy Olsen HLM II Dr. Gagne ABSTRACT Recent advances