Lecture Start
|
|
|
- Morgan Gregory
- 6 years ago
- Views:
Transcription
1 Lecture Start
2 Outline 1. Science, Method & Measurement 2. On Building An Index 3. Correlation & Causality 4. Probability & Statistics 5. Samples & Surveys 6. Experimental & Quasi-experimental Designs 7. Conceptual Models 8. Quantitative Models 9. Complexity & Chaos 10. Recapitulation - Envoi
3 Outline 1. Science, Method & Measurement 2. On Building An Index 3. Correlation & Causality 4. Probability & Statistics 5. Samples & Surveys 6. Experimental & Quasi-experimental Designs 7. Conceptual Models 8. Quantitative Models 9. Complexity & Chaos 10. Recapitulation - Envoi

4 Quantitative Techniques for Social Science Research Lecture # 10: Recapitulation Envoi Ismail Serageldin Alexandria 2012
5 Recapitulation

6 This Course Is About How to Think about Social Science Research
7 What is Social Science? Social science is the field of study concerned with society and human behaviors. "Social science" is commonly used as an umbrella term to refer to a plurality of fields outside of the natural sciences. These include: anthropology, archaeology, criminology, economics, education, history, linguistics, communication studies, political science and international relations, sociology, geography, law, and psychology.
8 Outline 1. Science, Method & Measurement 2. On Building An Index 3. Correlation & Causality 4. Probability & Statistics 5. Samples & Surveys 6. Experimental & Quasi-experimental Designs 7. Conceptual Models 8. Quantitative Models 9. Complexity & Chaos 10. Recapitulation - Envoi
9 The Method of Science OBSERVATION: Sense specific physical realities or events. HYPOTHESIS: Create a statement about the general nature of the phenomenon observed. REVISED HYPOTHESIS PREDICTION: Forecast a future occurrence consistent with the hypotheses. PREDICTION EXPERIMENT: Carry out a test to see if predicted event occurs. EXPERIMENT If results DO If results DO NOT match prediction, match prediction RECYCLE hypothesis is supported.
10 The Method of Science Observation Hypothesis Prediction Experiment Interpretation
11 % annual decline in poverty (Headcount index) Growth and Poverty Reduction Costa Rica Malaysia Indonesia Taiwan Thailand Singapore 4.0 Pakistan Brazil 2.0 Sri Lanka India Mexico Bangladesh 0.0 Jamaica % annual growth in GDP/person
12 Four Kinds (Types) of Scales Nominal Ordinal Interval Ratio
13 Average? Mean: usually add up the values for all the observations and divide them by the number of observations Median: the number at which half the observations are smaller and the other half are bigger Mode: the number that appears most frequently in the distribution of observations.
14 Mean, Median, Mode
15 Outline 1. Science, Method & Measurement 2. On Building An Index 3. Correlation & Causality 4. Probability & Statistics 5. Samples & Surveys 6. Experimental & Quasi-experimental Designs 7. Conceptual Models 8. Quantitative Models 9. Complexity & Chaos 10. Recapitulation - Envoi
16 An Index is A composite measure, usually involving ratio(s), intended to simplify the interpretation of a situation Examples: Price index, inflation rate, poverty index, success rate in an examination, etc.
17 An index should be Robust: not thrown off by random or partial variations Discriminating: distinguishes between different cases Efficient: reasonably easy to build and to measure Effective: captures what we want to measure
18 Ability Scores: Accountants Vs. Machinists
19 I.Q. measures I.Q. is an index constructed by dividing the score of an individual (child) of a certain age on a specific test over the average score that a person should have at that age. If the person matches that average score, the I.Q. = 100 It is sometimes expressed as mental age over biological age It says nothing more than what you would say of a child being somewhat tall or somewhat short, for his age,
20 The multiple intelligences 1. Logical-mathematical 2. Spatial 3. Linguistic 4. Bodily-kinesthetic 5. Musical 6. Interpersonal 7. Intrapersonal 8. Naturalistic 9. Existential
21 Misreading the index History is full of examples of people misreading the index Some even wanted to use it for racist purposes and argued for Eugenics In the USA, where race is a big issue, there was a recent case of the Book called The Bell Curve

22 IQ, Nature and Nurture
23 Many alternative theories of Intelligence Cattell Horn Carroll theory Fluid and crystallized intelligence Theory of multiple intelligences Three stratum theory Triarchic theory of intelligence PASS theory of intelligence

24
25 Understanding P α P 1 n q i 1 z z y i P α is the weighted mean over the poor population The measure = y 1 i for poor ( y z) z i = 0 for non poor ( y i z)
26 A better statement about P α If = 0 P 0 = Amount of poverty If = 1 P 1 = Depth of Poverty If = 2 P 2 = Severity of Poverty (usually associated with hunger)

27

28
29 Outline 1. Science, Method & Measurement 2. On Building An Index 3. Correlation & Causality 4. Probability & Statistics 5. Samples & Surveys 6. Experimental & Quasi-experimental Designs 7. Conceptual Models 8. Quantitative Models 9. Complexity & Chaos 10. Recapitulation - Envoi
30 Chi Square
31 Chi-Square Chi-square is a statistical test commonly used to compare observed data (o) with data we would expect (e) to obtain according to a specific hypothesis. For example, based on Mendel s laws, we expect that in a cross between pure green (dominant) and pure yellow (recessive) peas the proportion of green to yellow offspring would be 3:1
32 Example: Green and Yellow Peas + Theoretical Outcomes: 3 Green :1 Yellow
33 Correlation & Causation: Five Possibilities A may be the cause of B. B may be the cause of A. Some unknown third factor C may actually be the cause of both A and B. A B There may be a combination of the above three relationships.
34 Correlation & Causation: Five Possibilities A may be the cause of B. B may be the cause of A. Some unknown third factor C may actually be the cause of both A and B. A B There may be a combination of the above three relationships.
35 Correlation & Causation: Five Possibilities A may be the cause of B. B may be the cause of A. Some unknown third factor C may actually be the cause of both A and B. A B C There may be a combination of the above three relationships.
36 Correlation & Causation: Five Possibilities A may be the cause of B. B may be the cause of A. Some unknown third factor C may actually be the cause of both A and B. A B C There may be a combination of the above three relationships.
37 Correlation & Causation: Five Possibilities A may be the cause of B. B may be the cause of A. Some unknown third factor C may actually be the cause of both A and B. There may be a combination of the above three relationships. Fifth: It is just a coincidence!


38 Pirates and Global Warming
39 Interpreting Causality: Possible Explanations
40 Causation On the other hand, causation is a one-way direction, one is dependent and the other one is independent. A only goes to B. B cannot go to A. Therefore, the occurrence of B depends on A. A is a predictor to B. Every causation always has got a strong correlation, but not all strong correlation is a causation.
41 Life Expectancy 80 Life Expectancy versus Per Capita GNP Best Fit Relation by Decade Policy Counts! (Thousands) Per Capita GNP (1980 US$)
42 Outline 1. Science, Method & Measurement 2. On Building An Index 3. Correlation & Causality 4. Probability & Statistics 5. Samples & Surveys 6. Experimental & Quasi-experimental Designs 7. Conceptual Models 8. Quantitative Models 9. Complexity & Chaos 10. Recapitulation - Envoi
43 The Properties of the Gaussian Distribution 68% of the values lie within 1 standard deviation of the mean; 95% lie within 2 standard deviations; and 99.7% lie within 3 standard deviations.

44 Three Coins Problem
45 Three coins problem: Solution List all possible outcomes (call that A). Then ask: In how many ways can three heads appear? (call that B) Probability of that outcome is B/A Likewise: What is the probability of obtaining a head and two tails? Ask In how many ways can a head and two tails appear? (call that C) Probability of that outcome is C/A
46 Three coins solution (cont d) So : List all possible outcomes A = 8 hhh, thh, hth, hht, tth, tht, htt, ttt Only one possible way in which we get 3 heads. So B=1 So the probability that all three coins will come up heads is B/A = 1/8 In how many ways can a head and two tails appear? So C=3 So the probability of obtaining a head and two tails is C/A = 3/8

47 The Birthday problem
48 So The probability of having a match with someone s birthday in a group of : just 23 people is over 50%!!! For 57 people it is 99% There are variants to this problem statement. Let s discuss those
49 FYI The probability of large number of observations of independent events will generally map out as a normal distribution (the bell curve, the Gaussian distribution). The hump or high point will always be the mode If and only if the curve is symmetrical, that will also be the mean and the median.
50 The Gaussian Distribution As the figure above illustrates, 68% of the values lie within 1 standard deviation of the mean; 95% lie within 2 standard deviations; and 99.7% lie within 3 standard deviations.
51 Outline 1. Science, Method & Measurement 2. On Building An Index 3. Correlation & Causality 4. Probability & Statistics 5. Samples & Surveys 6. Experimental & Quasi-experimental Designs 7. Conceptual Models 8. Quantitative Models 9. Complexity & Chaos 10. Recapitulation - Envoi
52 We want to know something about the Population so we study a small sample of the Population (making sure that the sample is representative) Source: Statistics, Cliffs Quick Review, Wiley, NY, 2001

53 Transitions can be cut up in discrete states

54 But many transitions are really continuous
55 Example: Students leaving school and entering the Labor Market
56
57 Example Of Population Parameter vs. Sample Statistic Example. We want to know the percentage of voters that favor a new tax. The actual percentage of all the voters is a population parameter. The estimate of that percentage, based on sample data, is a sample statistic. The quality of a sample statistic (i.e., accuracy, precision, representativeness) is strongly affected by the way that sample observations are chosen; that is, by the sampling method. Source:
58 Bad Surveys make for bad estimates
59 Estimates of the front runners in the Egyptian Presidential Before the first Round: Election 2012 After the first Round: 1. Abdel Moneim Aboulfotouh 2. Amr Moussa 3. Mohamed Morsi 4. Hamdein Sabahi 5. Ahmed Shafik 1. Mohamed Morsi 2. Ahmed Shafik 3. Hamdein Sabahi 4. Abdel Moneim Aboulfotouh 5. Amr Moussa

60 The US 1948 Presidential Election: Truman vs. Dewey
61 Sampling Methods Non-probability samples. We do not know the probability that each population element will be chosen, and/or we cannot be sure that each population element has a non-zero chance of being chosen. Probability samples. Each population element has a known (non-zero) chance of being chosen for the sample. Source:
62 Two of the main types of nonprobability sampling methods Voluntary sample. People who self-select into the survey. Often, these folks have a strong interest in the main topic of the survey. E.g. those who call in to talk show, or participate in an on-line poll. This would be a volunteer sample. Convenience sample. A convenience sample is made up of people who are easy to reach. E.g. interviewing my students or my employees or shoppers at a local mall, If the group or the location was chosen because it was a convenient this would be a convenience sample. Note: Neither allows generalization to the population. Source:
63 Non-probability Sample Surveys Surveys that are not based on probability sampling have no way of measuring their bias or sampling error. Surveys based on non-probability samples are not externally valid. You cannot generalize from them to the general population. They can only be said to be representative of the people that have actually completed the survey.
64 Non-Probability Samples The relationship between the target population and the survey sample is immeasurable and potential bias is unknowable. Sophisticated users of non-probability survey samples tend to view the survey as an experimental condition, rather than a tool for population measurement Analysts examine the results for internally consistent relationships.
65 Examples Of Non-Probability Samples Judgment Samples: A researcher decides which population members to include in the sample based on his or her judgment. The researcher may provide some alternative justification for the representativeness of the sample. Snowball Samples: Often used when a target population is rare, members of the target population recruit other members of the population for the survey.
66 Examples Of Non-Probability Samples Quota Samples: The sample is designed to include a designated number of people with certain specified characteristics. For example, 100 coffee drinkers. This type of sampling is common in non-probability market research surveys. Convenience Samples: The sample is composed of whatever persons can be most easily accessed to fill out the survey.
67 Random Samples
68 Probability Samples are representative The key benefit of all these probability sampling methods is that they guarantee that the sample chosen is representative of the population. This ensures that the statistical conclusions will be valid. Hence the conclusions are generalizable Source:
69 Simple Random sampling The population consists of N objects. The sample consists of n objects. If all possible samples of n objects are equally likely to occur, the sampling method is called simple random sampling. Selection is done by a lottery method or using a table of random number or a computerized random number generator. Source:
70 Stratified Sampling Stratified sampling. The population is divided into groups, based on some characteristic. The groups are called strata. Then, within each group, a probability sample (often a simple random sample) is selected. As a example, suppose we conduct a national survey. We might divide the population into groups or strata, based on geography - north, east, south, and west. Then, within each stratum, we might randomly select survey respondents. Source:
71 Cluster sampling Cluster sampling. With cluster sampling, every member of the population is assigned to one, and only one, group. Each group is called a cluster. A sample of clusters is chosen, using a probability method (often simple random sampling). Only individuals within sampled clusters are surveyed. E.g. select a sample of BA units, survey all the staff in these units. Source:
72 Multistage sampling. Multistage sampling. With multistage sampling, we select a sample by using combinations of different sampling methods. For example, in Stage 1, we might use cluster sampling to choose clusters from a population. Then, in Stage 2, we might use simple random sampling to select a subset of elements from each chosen cluster for the final sample. Source:
73 Systematic random sampling. Systematic random sampling. With systematic random sampling, we create a list of every member of the population. From the list, we randomly select the first sample element from the first k elements on the population list. Thereafter, we select every kth element on the list. This method is different from simple random sampling since every possible sample of n elements is not equally likely. Source:
74 How to select a probability sample
75 Probability Sampling A probability-based survey sample is created by constructing a list of the target population, called the sample frame, a randomized process for selecting units from the sample frame, called a selection procedure, and a method of contacting selected units to and enabling them complete the survey, called a data collection method or mode.
76 Probability Sampling: Step 1 Construct a Sample frame: A probability-based survey sample is created by constructing a list of the target population, called the sample frame. For some target populations this process may be easy, for example, sampling the employees of a company by using payroll list. However, in large, disorganized populations simply constructing a suitable sample frame is often a complex and expensive task.
77 Probability Sampling: Step 2 Selecting a sample from within the Sample frame: a randomized process for selecting units from the sample frame, called a selection procedure. Common methods of conducting a probability sample of the household population in the United States are Area Probability Sampling, Random Digit Dial telephone sampling, and more recently Address-Based Sampling.
78 Specialized Techniques Of Probability Sampling Within probability sampling there are specialized techniques such as: stratified sampling & cluster sampling These techniques improve the precision or efficiency of the sampling process without altering the fundamental principles of probability sampling.
79 Probability Sampling: Step 3 Collecting the Data: There must be a method of contacting selected units to and enabling them complete the survey, called a data collection method or mode.
80 Major Types of Bias In Surveys Non-response bias Coverage bias Selection bias
81 But how you select your sample is only one of the issues in doing survey research
82 Bias Due to Measurement Error In survey research, the measurement process includes the environment in which the survey is conducted, the way that questions are asked, and the state of the survey respondent. Response bias refers to the bias that results from problems in the measurement process. Some examples of response bias: Source:
83 Examples of Response Bias (Due to error in the Measurement process) Leading questions. The wording of the question may be loaded in some way to unduly favor one response over another. For example, a satisfaction survey may ask the respondent to indicate where she is satisfied, dissatisfied, or very dissatisfied. By giving the respondent one response option to express satisfaction and two response options to express dissatisfaction, this survey question is biased toward getting a dissatisfied response. Source:
84 Examples of Response Bias Cont d (Due to error in the Measurement process) Social desirability. Most people like to present themselves in a favorable light, so they will be reluctant to admit to unsavory attitudes or illegal activities in a survey, particularly if survey results are not confidential. Instead, their responses may be biased toward what they believe is socially desirable. Source:
85 Sampling Statistic and Sampling Error A survey produces a sample statistic, which is used to estimate a population parameter. If you repeated a survey many times, using different samples each time, you might get a different sample statistic with each replication. And each of the different sample statistics would be an estimate for the same population parameter. If the statistic is unbiased, the average of all the statistics from all possible samples will equal the true population parameter; even though any individual statistic may differ from the population parameter. The variability among statistics from different samples is called sampling error. Source:
86 Increasing The Sample size: Reduces Sampling Error but NOT Survey Bias Increasing the sample size tends to reduce the sampling error; that is, it makes the sample statistic less variable. However, increasing sample size does not affect survey bias. A large sample size cannot correct for the methodological problems (undercoverage, nonresponse bias, etc.) that produce survey bias. Example: The Literary Digest Survey sample size was very large - over 2 million surveys were completed; but the large sample size could not overcome problems with the sample - undercoverage and nonresponse bias. Source:
87 One-tailed or Two-tailed Tests One-Tailed : Accept H 0 Reject H 0 Two Tailed: Reject H 0 Accept H 0 Reject H 0
88 Usually: No directionality: use two-tailed test Directionality: use one-tailed test
89 Type I & Type II Error Source: Statistics, Cliffs Quick Review, Wiley, NY, 2001

90 The standard deviation defines how spread out the distribution is:
91 Outline 1. Science, Method & Measurement 2. On Building An Index 3. Correlation & Causality 4. Probability & Statistics 5. Samples & Surveys 6. Experimental & Quasi-experimental Designs 7. Conceptual Models 8. Quantitative Models 9. Complexity & Chaos 10. Recapitulation - Envoi
92 Internal & External Validity Internal Validity question: Is the data I have collected interpretable? Can I say what I want to say about this data and my statement would be valid? External Validity question: Are these (valid) findings generalizable beyond this experiment? To what populations, settings, treatments, and measurable variables can the recorded effect be generalized?
93 So what affects Internal Validity?
94 Internal Sources of Invalidity History Maturation Testing Instrumentation Regression Selection Mortality Interaction of selection and others Source: Donald Campbell and Julian Stanley, Experimental and quasi-experimental designs for Research, Wadsworth Publishing; 1 edition (July 13, 1963)
95 And what affects External Validity?
96 External Sources of Invalidity Interaction of Testing and X Interaction of selection and X Reactive arrangements Multiple X interference Source: Donald Campbell and Julian Stanley, Experimental and quasi-experimental designs for Research, Wadsworth Publishing; 1 edition (July 13, 1963)
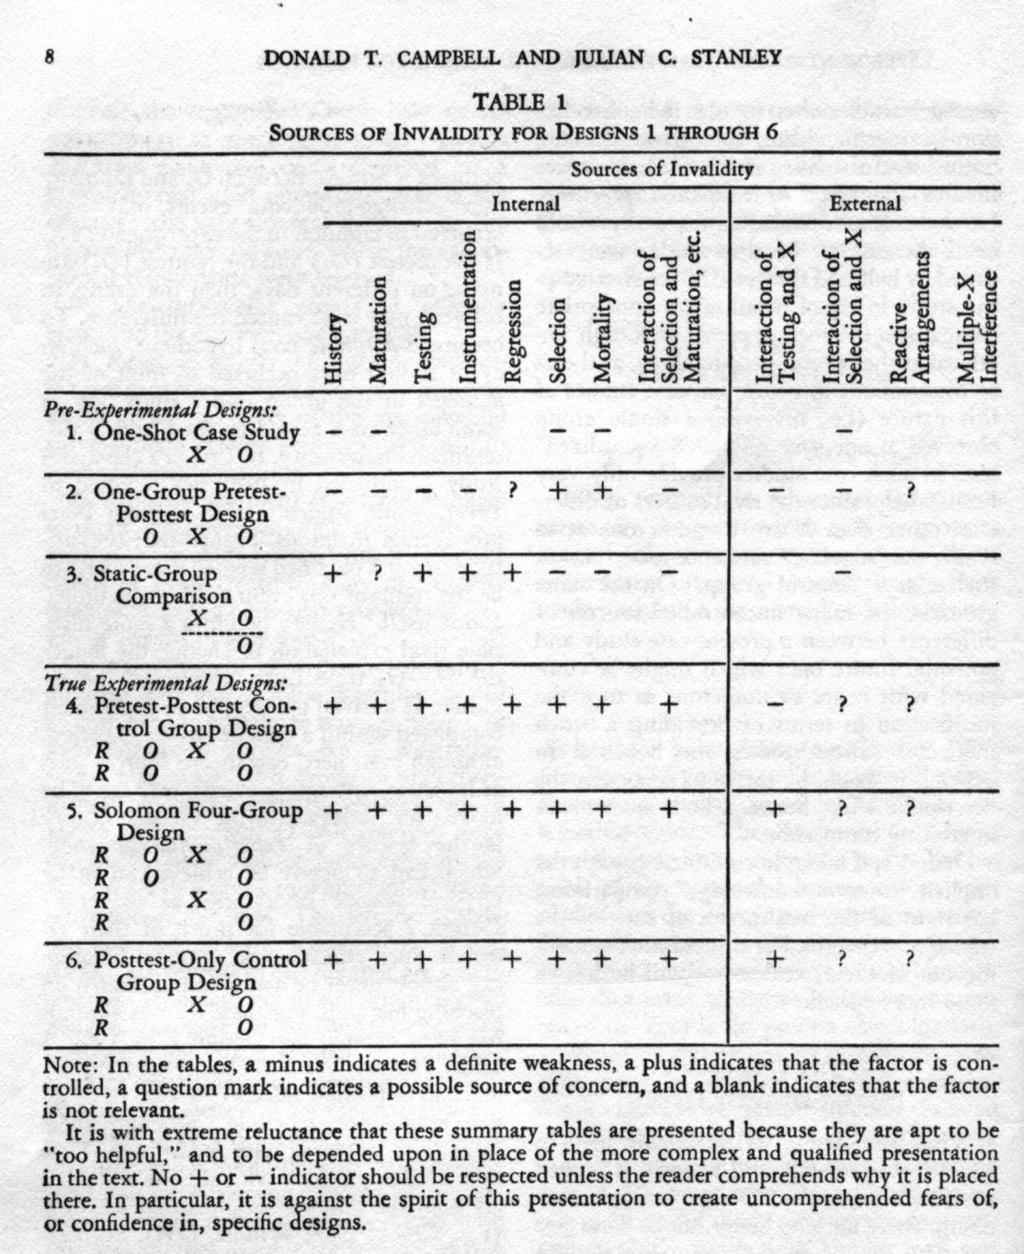
97

98

99
100 1. One Shot Case Study X O
101 2. One-Group Pretest-Posttest Design O X O
102 This is a really BAD design Internal invalidity that can explain O 1 O 2 difference: History: many other things could have happened between O 1 & O 2. In social science you cannot have experimental isolation as in the natural sciences labs. Maturation: between O 1 & O 2 students could have grown older, hungrier, more tired, etc. Testing: that is the effect is the effect of the pretest O 1 not the treatment X Instrumentation (decay) The observers themselves can get tired, etc. accounting for a part if not all of the O 1 O 2 change
103 Further problems with design 2 Again applies only to the group being tested (no generalizability), plus There is also regression towards the mean
104 Regression towards the mean


105 Prediction Prediction From Homogeneous Pretest Groups To Mean Posttest To Mean Posttest From Homogeneous Posttest Groups Fig. 1b. Fig. 1c. Fig. 1. Regression in the Prediction of Posttest Scores from Pretest, and Vice Versa
106 3. Static group Comparison X O O
107 4. Pretest-Posttest Control Group Design R O X O R O O
108 5. Solomon Four-Group Design R O 1 X O 2 R O 3 O 4 R X O 5 R O 6
109 6. Posttest-Only Control Group Design R X O R O
110 7. Time Series O O O O X O O O O
111 Introduction of an experimental variable at point X into a time series of measurements, O 1 O 8 Some possible outcome patterns Except for D, which is flat, the gain O 4 O 5 is the same in all the time series X A B C D E F G H Source: Donald Campbell and Julian Stanley, Experimental and quasi-experimental designs for Research, Wadsworth Publishing; 1 edition (July 13, 1963) X O 1 O 2 O 3 O 4 O 5 O 6 O 7 O 8
112 Introduction of an experimental variable at point X into a time series of measurements, O 1 O 8 Some possible outcome patterns Now Add Context: The legitimacy of inferring an effect varies widely: Strongest in A and B Possible in C, D and E Totally unjustified in F, G and H. X H A B C D E F G Source: Donald Campbell and Julian Stanley, Experimental and quasi-experimental designs for Research, Wadsworth Publishing; 1 edition (July 13, 1963) X O 1 O 2 O 3 O 4 O 5 O 6 O 7 O 8
113 8. Equivalent Time Samples Design X 1 O X 0 O X 1 O X 0 O, etc.
114 What is happening here This is repeated testing and observation of a group The real test X 1 is introduced intermittently followed by an observation, with other (non) tests X 0 being introduced before other observations This can work if the effect of the X is transient Example telling students that this is a test and then doing it every week, but not telling them which ones of these tests will count for the final grade! Controls factors such as anxiety of respondents (students).
115 9. Equivalent Materials Samples Design M a X 1 O M b X 0 O M c X 1 O M d X 0 O, etc. This design changes some things in the materials used for the test itself in addition to the previous design which is interwoven with it. Internally valid, but again externally not valid
116 10. Nonequivalent Control Group Design O X O O O
117 Why would we use this design? Because you frequently cannot randomize, and have to use equivalent convenience samples, e.g. class rooms in schools or schools in a district, or production units in an institution and test all the people in that class, school or production unit. Accordingly, we cannot control interaction of selection and maturation etc. Again, external validity (i.e. generalizability) is questionable.
118 11. Counterbalanced Designs X 1 O X 2 O X 3 O X 4 O X 2 O X 4 O X 1 O X 3 O X 3 O X 1 O X 4 O X 2 O X 4 O X 3 O X 2 O X 1 O
119 Why this complicated design? To enter each respondent (or respondent group) into each type of treatment once. The design is orthogonal (each combination of X i and O t occurs once). Good for multiple treatment testing. PS: the design is also called a Latinsquare design.
120 Orthogonal: you can change the columns and /or rows in the table(s) T 1 O T 2 O T 3 T 4 O A X 1 O X 2 O X 3 O X 4 O B X 2 O X 4 O X 1 O X 3 O C X 3 O X 1 O X 4 O X 2 O D X 4 O X 3 O X 2 O X 1 O X 1 O X 2 O X 3 O X 4 O T 1 O T 2 O T 3 O T 4 O T 2 O T 4 O T 1 O T 3 O T 3 O T 1 O T 4 O T 2 O T 4 O T 3 O T 2 O T 1 O

121 Which of these medicines is most effective?
122 12. Separate-Sample Pretest- Posttest Design R O (X) R X O
123 When to use this Design? When the X has to be administered to all, and we cannot control who gets it and who does not, but we want to test for its effect Thus we rely on the randomization to establish the representativity of the pretest and the post-test. It is much stronger than Design 2 and should not be confused with it.
124 12a. Separate-Sample Pretest- Posttest Design R O (X) R X O R O (X) R X O
125 12b. Separate-Sample Pretest- Posttest Design R O 1 (X) R O 2 (X) R X O 3
126 12c. Separate-Sample Pretest- Posttest Design R O 1 X O 2 R X O 3
127 13. Separate-Sample Pretest- Posttest Control Group Design R O (X) R X O R R O O
128 If we can add a control group where X is not given, then we can transform design 12 to Design 13.
129 R R R O (X) R X O R O (X) R X O R O (X) R X O R O R X O R O R X O R O R O 13a. Separate-Sample Pretest-Posttest Control Group Design
130 14. Multiple Time-Series O O O X O O O O O O X O O O
131 15. Institutional Cycle Design Class A X O 1 Class B 1 R O 2 X O 3 Class B 2 R X) O 4 Class C R O 5 X O 2 <O 1 O 5 <O 4 O 2 <O 3 O 2 <O 4 O 6 =O 7 O 2y =O 2o A complicated patch-up ex-post design. Let s just ignore it for now.
132 A complicated patch-up ex-post design. Let s just ignore it for now.
133 16. Regression It is used when experimental studies are impossible and only pre-existing data are available, (usually the case in economics). It relates independent variable(s) to a dependent variable and usually assumes causation by the independent variable(s). Regression analysis is widely used for prediction and forecasting, and fits in our discussion under quantitative models rather than here.
134 Typical linear regression
135 A famous Case Study: Hormone Replacement Therapy (HRT) and Heart Attacks in Women
136 Hormone Therapy and Heart Attacks In a widely studied example, numerous epidemiological studies showed that women who were taking combined hormone replacement therapy (HRT) also had a lower-than-average incidence of coronary heart disease (CHD), leading doctors to propose that HRT was protective against CHD. Source: Lawlor DA, Davey Smith G, Ebrahim S (June 2004). "Commentary: the hormone replacement-coronary heart disease conundrum: is this the death of observational epidemiology?". Int J Epidemiol 33 (3): doi: /ije/dyh124. PMID

137 So, Should I take HRT as a preventative against Heart Attacks?
138 BUT.
139 Hormone Therapy and Heart Attacks But randomized controlled trials showed that HRT caused a small but statistically significant increase in risk of CHD. So: How come? Source: Lawlor DA, Davey Smith G, Ebrahim S (June 2004). "Commentary: the hormone replacement-coronary heart disease conundrum: is this the death of observational epidemiology?". Int J Epidemiol 33 (3): doi: /ije/dyh124. PMID
140 Hormone Therapy and Heart Attacks Re-analysis of the data from the epidemiological studies showed that women undertaking HRT were more likely to be from higher socio-economic groups. These wealthier women also had better than average diet and exercise regimens. The use of HRT and decreased incidence of coronary heart disease were coincident effects of a third and separate cause (i.e. the benefits associated with a higher socioeconomic status). They were not cause and effect, as had been supposed. Source: Lawlor DA, Davey Smith G, Ebrahim S (June 2004). "Commentary: the hormone replacement-coronary heart disease conundrum: is this the death of observational epidemiology?". Int J Epidemiol 33 (3): doi: /ije/dyh124. PMID
141 Outline 1. Science, Method & Measurement 2. On Building An Index 3. Correlation & Causality 4. Probability & Statistics 5. Samples & Surveys 6. Experimental & Quasi-experimental Designs 7. Conceptual Models 8. Quantitative Models 9. Complexity & Chaos 10. Recapitulation - Envoi
142 EXTERNAL INFLUENCES EXTERNAL INFLUENCES START POSITION CULTURAL ASPECTS VALUES INSTITUTIONS SOCIAL STRUCTURE TRANSACTIONS ECONOMIC STRUCTURE SOCIAL CHANGE NEW SOCIAL POSITION PROGRESS STAGNATION BREAK DOWN
143 New Ideas Quran Sunna of the Prophet Greek and Latin influences Theoretical Ethics Local Influences Intellectual Domain Mass Media Education Practical Ethics Social Values Perceptual Domain Modernizing Influences Physical Change Social Praxis Individual Behavior Physical Domain
144 Exchange with Promise to Pay g + s A B Time 1 P a P a A B Time 2 g + s

145 Exchange with promise of a Central Bank E P a P a g + s g + s A Central Bank B P b P d D P a P a g + s g + s P a P a C

146 Role of Party Machine in Political Exchange Voters Votes for legislators Money and jobs Legislation Machine Legislation Business Money Votes for reelection Legislators

147 Transaction involving voters, TV, interest groups and legislative candidates Television Entertainment Performers Entertainment Attention of voters Money Attention of voters Money Voters Votes Promises Money Legislative candidates Access Promises Interest groups
148 Cultural Transactions
149

150

151
152
153

154
155 Outline 1. Science, Method & Measurement 2. On Building An Index 3. Correlation & Causality 4. Probability & Statistics 5. Samples & Surveys 6. Experimental & Quasi-experimental Designs 7. Conceptual Models 8. Quantitative Models 9. Complexity & Chaos 10. Recapitulation - Envoi
156 Physics Math Formulate Calculate
157 Physics Math Formulate Calculate Interpret
158 Physics Math Formulate Calculate Interpret
159 Example (Cont d) P 1 = (error term = 2%) P 2 = (error term = 2%) P 2 P 1 = (error term 2%) P 2 P 1 = 2 2 (error term 100%)
160 Errors in Models Error E E m E s Complexity of Model
161 Errors in Models Error E E* E m Better Data E* m E s Complexity of Model
162 Seven Rules for Building Models Avoid inter-correlated variables Add whenever possible If not possible then multiply or divide Avoid subtraction and exponentials Avoid models that proceed in chains Simpler partial models can be more robust than one complex models Always report predictable error (essential for cases of asymmetrical costs)
163 The steps to building a model: Simplification Building a decision model Testing the model (calibration on historical data) Using the model to find the solution: A good Model can be used again and again for similar problems or can be modified. Source: Source:
164 Why the Modeling exercise is useful It is a simplified representation of the actual situation It need not be complete or exact in all respects It concentrates on the most essential relationships and ignores the less essential ones. It is more easily understood than the empirical (i.e., observed) situation, and hence permits the problem to be solved more readily with minimum time and effort. Source:
165 Examples of Applications of Modeling in Business & Management An auditor can use random sampling techniques to audit the accounts receivable for clients. A plant manager can use statistical quality control techniques to assure the quality of his production with a minimum of testing or inspection. A financial analyst may use regression and correlation to help understand the relationship of a financial ratio to a set of other variables in business. A market researcher may use test of significance to accept or reject the hypotheses about a group of buyers to which the firm wishes to sell a particular product. A sales manager may use statistical techniques to forecast sales for the coming year. Source:
166
167
168
169
170

171

172 ACE Modeling: The Culture Dish Analogy Source:
173 Good at: Conventional (von Neumann) Computers are Fast arithmetic Doing precisely what the programmer programs them to do Not so good at: Interacting with noisy data or data from the environment Massive parallelism Fault tolerance Adapting to circumstances
174 Neural Networks Based on the parallel architecture of animal brains. A form of multiprocessor computer system, with Simple processing elements A high degree of interconnection Simple (scalar) messages Adaptive interaction between elements

175 Neurons can have 10,000 connections providing inputs and send signals to 1000s of other neurons. Neurons are wired up in a 3-dimensional pattern.
176 Outline 1. Science, Method & Measurement 2. On Building An Index 3. Correlation & Causality 4. Probability & Statistics 5. Samples & Surveys 6. Experimental & Quasi-experimental Designs 7. Conceptual Models 8. Quantitative Models 9. Complexity & Chaos 10. Recapitulation - Envoi

177 Weather Phenomena
178 Does the Flutter of a Butterfly s Wings in Rio Cause a Hurricane in Texas?
179 Minute Initial Differences Make Large Variations in Forecast

180 Minute Initial Differences Make Large Variations in Forecast
181 next For a = t

182

183

184

185

186
187 Outline 1. Science, Method & Measurement 2. On Building An Index 3. Correlation & Causality 4. Probability & Statistics 5. Samples & Surveys 6. Experimental & Quasi-experimental Designs 7. Conceptual Models 8. Quantitative Models 9. Complexity & Chaos 10. Recapitulation - Envoi
188 Which is where we now are
189 I hope that this course made you


190 THINK
191 Now let s see how we present findings to the public
192 Table Chi-Square Distribution Source: R.A. Fisher and F. Yates, Statistical Tables for Biological Agricultural and Medical Research, 6th ed., Table IV, Oliver & Boyd, Ltd., Edinburgh Degrees of Freedo m Probability (p) (df) Nonsignificant Significant
193 Mean, Median, Mode

194 Equations 194

195 Pie Charts Usage of BA websites by Country April 2010 March 2011 Sales Saudi Arabia Egypt 44.5% United States 23.5%
196 Graphs

197 Now get set to fly with the masters
198 Start Gapminder 1
199 Start Gapminder 2
200 That was just great
201 Now, you too shall go and do quantitative research AND present your findings as beautifully as that

202 Go Soar Like An Eagle
203 Envoi
204 Research Studies can have major impacts on the life of a nation and a society
205 Example: Race, Education and the USA: The Coleman Report and its aftermath

206 James Samuel Coleman (May 12, 1926 March 25, 1995)


207
208 So, your studies could one day have a major impact Now think: whether it is through modeling, or surveys, or through experimental designs to test new treatments What could you do to make this a better world?
209 Now each group shall prepare a study proposal and submit it in one week.
210 How can you produce useful, international publication-level studies?
211 Questions you must ask as you start preparing for a study What? (subject matter) Where? (location, scale in both space and time) Why? (purpose of the study: establish, explain, refute ) For Whom? (decision-maker, scientists) How? (methodology) How much? (effort, money, time, detail, etc.) When? How much time? (when start, when end?) How? (presentation of findings: book, report, article, presentation at seminar, etc.) So What?
212 Let s review the steps for a Study
213 1. Objectives or Hypotheses: What are the objectives of the study or the questions to be answered? What is the population to which the investigators intend to refer their findings? Source: Source:
214 2. Research Design: Is the study a planned experiment (i.e., primary data), or an analysis of records ( i.e., secondary data)? How is the sample to be selected? Are there possible sources of selection, which would make the sample atypical or non-representative? If so, what provision is to be made to deal with this bias? What is the nature of the control group, standard of comparison, or cost? Remember that research design or statistical modeling means thinking first: reflections before actions. Source: Source:
215 3. Observations: Are there clear definitions of variables, including classifications, measurements (and/or counting), and the outcomes? Is the method of classification or of measurement consistent for all the subjects and relevant to the problem being studied? Are there possible biases in measurement (and/or counting)? If so, what provisions must be made to deal with them? Are the observations reliable and replicable (to defend your finding)? Source: Source:
216 4. Analysis & Conclusions: Are the data sufficient and worthy of statistical analysis? If so, are the necessary conditions of the methods of statistical analysis appropriate to the source and nature of the data? (The analysis must be correctly performed and interpreted). Which conclusions are justifiable by the findings? Which are not? Are the conclusions relevant to the questions posed at the start of the study? Source: Source:
217 5. Presenting the Findings: The findings must be represented clearly, objectively, in sufficient but non-technical terms and detail to enable the decisionmaker (e.g., a manager) to understand and judge them for himself. How do we do that? Are the findings internally consistent; i.e., do the numbers added up properly? Can the different results be reconciled? What is the significance of your findings? Source: Source:
218 6. Final (Summary) Presentation of Findings Who is the target audience now? General public? Manager at BA? Political decisionmaker? Scientific colleagues? Format of presentations (more than one is possible): book? Article? PowerPoint presentation? Technical report? Publication ina scientific journal? Especially when addressing decision-makers, make sure that your findings and recommendation(s) are clearly put, Otherwise, you will have wasted the time, money, etc. for nothing. Source: Source:
219 Now each group shall prepare a study proposal and submit it in one week.
220 Envoi ## 220
221 Sound Development Policies Need Thoughtful Social Research Inputs
222 In a time of remarkable dynamic change, volatility and instability, some new tools may be needed
223 Natural and social scientists Of the developing world must master the quantitative techniques that have become essential parts of contemporary research
224 YOU Have to rise to the challenge!
225 Thus it is not just a matter of publishing learned papers or recognizing past individual achievements it is very much a matter of incubating a revolution!
226 Thus it is not just a matter of publishing learned papers or recognizing past individual achievements it is very much a matter of incubating a revolution!
227 I know that this is very challenging
228 But I have confidence in you

229 We may be small Limited size, limited resources

230 The Competition Large size, unlimited resources

231 But we will surprise the World!

232 Thank You
233 The images used in this presentation are strictly for the educational purpose of this lecture. Any use by anyone for any other purpose should be after consulting the copyright owners of these pictures
Lecture Start
 Lecture -- 5 -- Start Outline 1. Science, Method & Measurement 2. On Building An Index 3. Correlation & Causality 4. Probability & Statistics 5. Samples & Surveys 6. Experimental & Quasi-experimental Designs
Lecture Start
 Lecture -- 7 -- Start Outline 1. Science, Method & Measurement 2. On Building An Index 3. Correlation & Causality 4. Probability & Statistics 5. Samples & Surveys 6. Experimental & Quasi-experimental Designs
Unit 1 Exploring and Understanding Data
 Unit 1 Exploring and Understanding Data Area Principle Bar Chart Boxplot Conditional Distribution Dotplot Empirical Rule Five Number Summary Frequency Distribution Frequency Polygon Histogram Interquartile
Vocabulary. Bias. Blinding. Block. Cluster sample
 Bias Blinding Block Census Cluster sample Confounding Control group Convenience sample Designs Experiment Experimental units Factor Level Any systematic failure of a sampling method to represent its population
Empirical Knowledge: based on observations. Answer questions why, whom, how, and when.
 INTRO TO RESEARCH METHODS: Empirical Knowledge: based on observations. Answer questions why, whom, how, and when. Experimental research: treatments are given for the purpose of research. Experimental group
Describe what is meant by a placebo Contrast the double-blind procedure with the single-blind procedure Review the structure for organizing a memo
 Business Statistics The following was provided by Dr. Suzanne Delaney, and is a comprehensive review of Business Statistics. The workshop instructor will provide relevant examples during the Skills Assessment
Chapter 5: Producing Data
 Chapter 5: Producing Data Key Vocabulary: observational study vs. experiment confounded variables population vs. sample sampling vs. census sample design voluntary response sampling convenience sampling
In this chapter we discuss validity issues for quantitative research and for qualitative research.
 Chapter 8 Validity of Research Results (Reminder: Don t forget to utilize the concept maps and study questions as you study this and the other chapters.) In this chapter we discuss validity issues for
Describe what is meant by a placebo Contrast the double-blind procedure with the single-blind procedure Review the structure for organizing a memo
 Please note the page numbers listed for the Lind book may vary by a page or two depending on which version of the textbook you have. Readings: Lind 1 11 (with emphasis on chapters 10, 11) Please note chapter
Still important ideas
 Readings: OpenStax - Chapters 1 13 & Appendix D & E (online) Plous Chapters 17 & 18 - Chapter 17: Social Influences - Chapter 18: Group Judgments and Decisions Still important ideas Contrast the measurement
CHAPTER 5: PRODUCING DATA
 CHAPTER 5: PRODUCING DATA 5.1: Designing Samples Exploratory data analysis seeks to what data say by using: These conclusions apply only to the we examine. To answer questions about some of individuals
Business Statistics Probability
 Business Statistics The following was provided by Dr. Suzanne Delaney, and is a comprehensive review of Business Statistics. The workshop instructor will provide relevant examples during the Skills Assessment
Chapter 3. Producing Data
 Chapter 3. Producing Data Introduction Mostly data are collected for a specific purpose of answering certain questions. For example, Is smoking related to lung cancer? Is use of hand-held cell phones associated
Still important ideas
 Readings: OpenStax - Chapters 1 11 + 13 & Appendix D & E (online) Plous - Chapters 2, 3, and 4 Chapter 2: Cognitive Dissonance, Chapter 3: Memory and Hindsight Bias, Chapter 4: Context Dependence Still
Political Science 15, Winter 2014 Final Review
 Political Science 15, Winter 2014 Final Review The major topics covered in class are listed below. You should also take a look at the readings listed on the class website. Studying Politics Scientifically
Data = collections of observations, measurements, gender, survey responses etc. Sample = collection of some members (a subset) of the population
 of the population") Chapter 1: Basic Ideas 1.1 Sampling Statistics = the Science of Data By collecting a limited amount of data, we want to say something about the whole group that we want to study, i.e. we want to say something
Chapter 1: Basic Ideas 1.1 Sampling Statistics = the Science of Data By collecting a limited amount of data, we want to say something about the whole group that we want to study, i.e. we want to say something
Lecture (chapter 1): Introduction
: Introduction") Lecture (chapter 1): Introduction Ernesto F. L. Amaral January 17, 2018 Advanced Methods of Social Research (SOCI 420) Source: Healey, Joseph F. 2015. Statistics: A Tool for Social Research. Stamford:
Lecture (chapter 1): Introduction Ernesto F. L. Amaral January 17, 2018 Advanced Methods of Social Research (SOCI 420) Source: Healey, Joseph F. 2015. Statistics: A Tool for Social Research. Stamford:
Readings: Textbook readings: OpenStax - Chapters 1 13 (emphasis on Chapter 12) Online readings: Appendix D, E & F
 Online readings: Appendix D, E & F") Readings: Textbook readings: OpenStax - Chapters 1 13 (emphasis on Chapter 12) Online readings: Appendix D, E & F Plous Chapters 17 & 18 Chapter 17: Social Influences Chapter 18: Group Judgments and Decisions
Readings: Textbook readings: OpenStax - Chapters 1 13 (emphasis on Chapter 12) Online readings: Appendix D, E & F Plous Chapters 17 & 18 Chapter 17: Social Influences Chapter 18: Group Judgments and Decisions
Clever Hans the horse could do simple math and spell out the answers to simple questions. He wasn t always correct, but he was most of the time.
 Clever Hans the horse could do simple math and spell out the answers to simple questions. He wasn t always correct, but he was most of the time. While a team of scientists, veterinarians, zoologists and
(CORRELATIONAL DESIGN AND COMPARATIVE DESIGN)
") UNIT 4 OTHER DESIGNS (CORRELATIONAL DESIGN AND COMPARATIVE DESIGN) Quasi Experimental Design Structure 4.0 Introduction 4.1 Objectives 4.2 Definition of Correlational Research Design 4.3 Types of Correlational
UNIT 4 OTHER DESIGNS (CORRELATIONAL DESIGN AND COMPARATIVE DESIGN) Quasi Experimental Design Structure 4.0 Introduction 4.1 Objectives 4.2 Definition of Correlational Research Design 4.3 Types of Correlational
Results & Statistics: Description and Correlation. I. Scales of Measurement A Review
 Results & Statistics: Description and Correlation The description and presentation of results involves a number of topics. These include scales of measurement, descriptive statistics used to summarize
Chapter 7: Descriptive Statistics
 Chapter Overview Chapter 7 provides an introduction to basic strategies for describing groups statistically. Statistical concepts around normal distributions are discussed. The statistical procedures of
Chapter 1 Data Collection
 Chapter 1 Data Collection OUTLINE 1.1 Introduction to the Practice of Statistics 1.2 Observational Studies versus Designed Experiments 1.3 Simple Random Sampling 1.4 Other Effective Sampling Methods 1.5
Ch. 1 Collecting and Displaying Data
 Ch. 1 Collecting and Displaying Data In the first two sections of this chapter you will learn about sampling techniques and the different levels of measurement for a variable. It is important that you
Problems for Chapter 8: Producing Data: Sampling. STAT Fall 2015.
 Population and Sample Researchers often want to answer questions about some large group of individuals (this group is called the population). Often the researchers cannot measure (or survey) all individuals
BIAS: The design of a statistical study shows bias if it systematically favors certain outcomes.
 Bad Sampling SRS Non-biased SAMPLE SURVEYS Biased Voluntary Bad Sampling Stratified Convenience Cluster Systematic BIAS: The design of a statistical study shows bias if it systematically favors certain
Readings: Textbook readings: OpenStax - Chapters 1 11 Online readings: Appendix D, E & F Plous Chapters 10, 11, 12 and 14
 Readings: Textbook readings: OpenStax - Chapters 1 11 Online readings: Appendix D, E & F Plous Chapters 10, 11, 12 and 14 Still important ideas Contrast the measurement of observable actions (and/or characteristics)
Chapter 9 Experimental Research (Reminder: Don t forget to utilize the concept maps and study questions as you study this and the other chapters.
 Chapter 9 Experimental Research (Reminder: Don t forget to utilize the concept maps and study questions as you study this and the other chapters.) In this chapter we talk about what experiments are, we
INTRODUCTION TO STATISTICS SORANA D. BOLBOACĂ
 INTRODUCTION TO STATISTICS SORANA D. BOLBOACĂ OBJECTIVES Definitions Stages of Scientific Knowledge Quantification and Accuracy Types of Medical Data Population and sample Sampling methods DEFINITIONS
Sampling for Success. Dr. Jim Mirabella President, Mirabella Research Services, Inc. Professor of Research & Statistics
 Sampling for Success Dr. Jim Mirabella President, Mirabella Research Services, Inc. Professor of Research & Statistics Session Objectives Upon completion of this workshop, participants will be able to:
I. Introduction and Data Collection B. Sampling. 1. Bias. In this section Bias Random Sampling Sampling Error
 I. Introduction and Data Collection B. Sampling In this section Bias Random Sampling Sampling Error 1. Bias Bias a prejudice in one direction (this occurs when the sample is selected in such a way that
Unit 3: Collecting Data. Observational Study Experimental Study Sampling Bias Types of Sampling
 Unit 3: Collecting Data Observational Study Experimental Study Sampling Bias Types of Sampling Feb 7 10:12 AM The step of data collection is critical to obtain reliable information for your study. 2 Types
3 CONCEPTUAL FOUNDATIONS OF STATISTICS
 3 CONCEPTUAL FOUNDATIONS OF STATISTICS In this chapter, we examine the conceptual foundations of statistics. The goal is to give you an appreciation and conceptual understanding of some basic statistical
Math 140 Introductory Statistics
 Math 140 Introductory Statistics Professor Silvia Fernández Sample surveys and experiments Most of what we ve done so far is data exploration ways to uncover, display, and describe patterns in data. Unfortunately,
Describe what is meant by a placebo Contrast the double-blind procedure with the single-blind procedure Review the structure for organizing a memo
 Please note the page numbers listed for the Lind book may vary by a page or two depending on which version of the textbook you have. Readings: Lind 1 11 (with emphasis on chapters 5, 6, 7, 8, 9 10 & 11)
Define the population Determine appropriate sample size Choose a sampling design Choose an appropriate research design
 Numbers! Observation Study: observing individuals and measuring variables of interest without attempting to influence the responses Correlational Research: examining the relationship between two variables
CHAPTER LEARNING OUTCOMES
 EXPERIIMENTAL METHODOLOGY CHAPTER LEARNING OUTCOMES When you have completed reading this article you will be able to: Define what is an experiment Explain the role of theory in educational research Justify
Statistics is the science of collecting, organizing, presenting, analyzing, and interpreting data to assist in making effective decisions
 Readings: OpenStax Textbook - Chapters 1 5 (online) Appendix D & E (online) Plous - Chapters 1, 5, 6, 13 (online) Introductory comments Describe how familiarity with statistical methods can - be associated
REVIEW FOR THE PREVIOUS LECTURE
 Slide 2-1 Calculator: The same calculator policies as for the ACT hold for STT 315: http://www.actstudent.org/faq/answers/calculator.html. It is highly recommended that you have a TI-84, as this is the
Doctoral Dissertation Boot Camp Quantitative Methods Kamiar Kouzekanani, PhD January 27, The Scientific Method of Problem Solving
 Doctoral Dissertation Boot Camp Quantitative Methods Kamiar Kouzekanani, PhD January 27, 2018 The Scientific Method of Problem Solving The conceptual phase Reviewing the literature, stating the problem,
Survey Research Methodology
 Survey Research Methodology Prepared by: Praveen Sapkota IAAS, TU, Rampur Chitwan, Nepal Social research Meaning of social research A social research is a systematic method of exploring, analyzing and
Section 6.1 Sampling. Population each element (or person) from the set of observations that can be made (entire group)
 from the set of observations that can be made (entire group)") Section 6.1 Sampling Population each element (or person) from the set of observations that can be made (entire group) Sample a subset of the population Census systematically getting information about an
Section 6.1 Sampling Population each element (or person) from the set of observations that can be made (entire group) Sample a subset of the population Census systematically getting information about an
MATH-134. Experimental Design
 Experimental Design Controlled Experiment: Researchers assign treatment and control groups and examine any resulting changes in the response variable. (cause-and-effect conclusion) Observational Study:
MBACATÓLICA JAN/APRIL Marketing Research. Fernando S. Machado. Experimentation
 MBACATÓLICA JAN/APRIL 2006 Marketing Research Fernando S. Machado Week 5 Experimentation 1 Experimentation Experimental Research and Causality Experimental Designs Lab versus Field Experiments Test Marketing
Chapter 1: Exploring Data
 Chapter 1: Exploring Data Key Vocabulary:! individual! variable! frequency table! relative frequency table! distribution! pie chart! bar graph! two-way table! marginal distributions! conditional distributions!
A Probability Puzzler. Statistics, Data and Statistical Thinking. A Probability Puzzler. A Probability Puzzler. Statistics.
 Statistics, Data and Statistical Thinking FREC 408 Dr. Tom Ilvento 213 Townsend Hall Ilvento@udel.edu A Probability Puzzler Pick a number from 2 to 9. It can be 2 or it can be 9, or any number in between.
1. The Role of Sample Survey Design
 Vista's Approach to Sample Survey Design 1978, 1988, 2006, 2007, 2009 Joseph George Caldwell. All Rights Reserved. Posted at Internet website http://www.foundationwebsite.org. Updated 20 March 2009 (two
Psychology 205, Revelle, Fall 2014 Research Methods in Psychology Mid-Term. Name:
 Name: 1. (2 points) What is the primary advantage of using the median instead of the mean as a measure of central tendency? It is less affected by outliers. 2. (2 points) Why is counterbalancing important
BIOSTATISTICS. Dr. Hamza Aduraidi
 BIOSTATISTICS Dr. Hamza Aduraidi Unit One INTRODUCTION Biostatistics It can be defined as the application of the mathematical tools used in statistics to the fields of biological sciences and medicine.
Math 124: Module 3 and Module 4
 Experimental Math 124: Module 3 and Module 4 David Meredith Department of Mathematics San Francisco State University September 24, 2009 What we will do today Experimental 1 What we will do today Experimental
Sampling Controlled experiments Summary. Study design. Patrick Breheny. January 22. Patrick Breheny Introduction to Biostatistics (BIOS 4120) 1/34
 1/34") Sampling Study design Patrick Breheny January 22 Patrick Breheny to Biostatistics (BIOS 4120) 1/34 Sampling Sampling in the ideal world The 1936 Presidential Election Pharmaceutical trials and children
Sampling Study design Patrick Breheny January 22 Patrick Breheny to Biostatistics (BIOS 4120) 1/34 Sampling Sampling in the ideal world The 1936 Presidential Election Pharmaceutical trials and children
Lecture 4: Research Approaches
 Lecture 4: Research Approaches Lecture Objectives Theories in research Research design approaches ú Experimental vs. non-experimental ú Cross-sectional and longitudinal ú Descriptive approaches How to
Statistical Techniques. Masoud Mansoury and Anas Abulfaraj
 Statistical Techniques Masoud Mansoury and Anas Abulfaraj What is Statistics? https://www.youtube.com/watch?v=lmmzj7599pw The definition of Statistics The practice or science of collecting and analyzing
P. 266 #9, 11. p. 289 # 4, 6 11, 14, 17
 P. 266 #9, 11 9. Election. a) Answers will vary. A component is one voter voting. An outcome is a vote for our candidate. Using two random digits, 00-99, let 01-55 represent a vote for your candidate,
Sta 309 (Statistics And Probability for Engineers)
") Instructor: Prof. Mike Nasab Sta 309 (Statistics And Probability for Engineers) Chapter (1) 1. Statistics: The science of collecting, organizing, summarizing, analyzing numerical information called data
Instructor: Prof. Mike Nasab Sta 309 (Statistics And Probability for Engineers) Chapter (1) 1. Statistics: The science of collecting, organizing, summarizing, analyzing numerical information called data
Conducting Survey Research. John C. Ricketts
 + Conducting Survey Research John C. Ricketts + What is survey research? + Question When is survey research the best method available? A. when collecting original data B. when describing a population too
Experimental Design. Dewayne E Perry ENS C Empirical Studies in Software Engineering Lecture 8
 Experimental Design Dewayne E Perry ENS 623 Perry@ece.utexas.edu 1 Problems in Experimental Design 2 True Experimental Design Goal: uncover causal mechanisms Primary characteristic: random assignment to
ISC- GRADE XI HUMANITIES ( ) PSYCHOLOGY. Chapter 2- Methods of Psychology
 PSYCHOLOGY. Chapter 2- Methods of Psychology") ISC- GRADE XI HUMANITIES (2018-19) PSYCHOLOGY Chapter 2- Methods of Psychology OUTLINE OF THE CHAPTER (i) Scientific Methods in Psychology -observation, case study, surveys, psychological tests, experimentation
ISC- GRADE XI HUMANITIES (2018-19) PSYCHOLOGY Chapter 2- Methods of Psychology OUTLINE OF THE CHAPTER (i) Scientific Methods in Psychology -observation, case study, surveys, psychological tests, experimentation
The Logic of Data Analysis Using Statistical Techniques M. E. Swisher, 2016
 The Logic of Data Analysis Using Statistical Techniques M. E. Swisher, 2016 This course does not cover how to perform statistical tests on SPSS or any other computer program. There are several courses
Study Design. Study design. Patrick Breheny. January 23. Patrick Breheny Introduction to Biostatistics (171:161) 1/34
 1/34") Study design Patrick Breheny January 23 Patrick Breheny Introduction to Biostatistics (171:161) 1/34 in the ideal world In an ideal world, We have a list of everyone in the population of interest We randomly
Study design Patrick Breheny January 23 Patrick Breheny Introduction to Biostatistics (171:161) 1/34 in the ideal world In an ideal world, We have a list of everyone in the population of interest We randomly
Chapter Three: Sampling Methods
 Chapter Three: Sampling Methods The idea of this chapter is to make sure that you address sampling issues - even though you may be conducting an action research project and your sample is "defined" by
CAUTIONS ABOUT THE PRACTICE EXAM
 Dr. Michael Passer Psych 209, U. of Washington CAUTIONS ABOUT THE PRACTICE EXAM DEAR STUDENT: This practice tests consists of questions from past exams. By taking this practice test, you should gain an
9 research designs likely for PSYC 2100
 9 research designs likely for PSYC 2100 1) 1 factor, 2 levels, 1 group (one group gets both treatment levels) related samples t-test (compare means of 2 levels only) 2) 1 factor, 2 levels, 2 groups (one
UNIT I SAMPLING AND EXPERIMENTATION: PLANNING AND CONDUCTING A STUDY (Chapter 4)
") UNIT I SAMPLING AND EXPERIMENTATION: PLANNING AND CONDUCTING A STUDY (Chapter 4) A DATA COLLECTION (Overview) When researchers want to make conclusions/inferences about an entire population, they often
UNIT I SAMPLING AND EXPERIMENTATION: PLANNING AND CONDUCTING A STUDY (Chapter 4) A DATA COLLECTION (Overview) When researchers want to make conclusions/inferences about an entire population, they often
Chapter-2 RESEARCH DESIGN
 Chapter-2 RESEARCH DESIGN 33 2.1 Introduction to Research Methodology: The general meaning of research is the search for knowledge. Research is also defined as a careful investigation or inquiry, especially
EXPERIMENTAL RESEARCH DESIGNS
 ARTHUR PSYC 204 (EXPERIMENTAL PSYCHOLOGY) 14A LECTURE NOTES [02/28/14] EXPERIMENTAL RESEARCH DESIGNS PAGE 1 Topic #5 EXPERIMENTAL RESEARCH DESIGNS As a strict technical definition, an experiment is a study
Statistics Mathematics 243
 Statistics Mathematics 243 Michael Stob February 2, 2005 These notes are supplementary material for Mathematics 243 and are not intended to stand alone. They should be used in conjunction with the textbook
Psychology Research Process
 Psychology Research Process Logical Processes Induction Observation/Association/Using Correlation Trying to assess, through observation of a large group/sample, what is associated with what? Examples:
Communication Research Practice Questions
 Communication Research Practice Questions For each of the following questions, select the best answer from the given alternative choices. Additional instructions are given as necessary. Read each question
Research Questions, Variables, and Hypotheses: Part 2. Review. Hypotheses RCS /7/04. What are research questions? What are variables?
 Research Questions, Variables, and Hypotheses: Part 2 RCS 6740 6/7/04 1 Review What are research questions? What are variables? Definition Function Measurement Scale 2 Hypotheses OK, now that we know how
AP Psychology -- Chapter 02 Review Research Methods in Psychology
 AP Psychology -- Chapter 02 Review Research Methods in Psychology 1. In the opening vignette, to what was Alicia's condition linked? The death of her parents and only brother 2. What did Pennebaker s study
Sociological Research Methods and Techniques Alan S.Berger 1
 Sociological Research Methods and Techniques 2010 Alan S.Berger 1 Sociological Research Topics Sociologists: Study the influence that society has on people s attitudes and behavior Seek to understand ways
Basic Concepts in Research and DATA Analysis
 Basic Concepts in Research and DATA Analysis 1 Introduction: A Common Language for Researchers...2 Steps to Follow When Conducting Research...2 The Research Question...3 The Hypothesis...3 Defining the
TRACER STUDIES ASSESSMENTS AND EVALUATIONS
 TRACER STUDIES ASSESSMENTS AND EVALUATIONS 1 INTRODUCTION This note introduces the reader to tracer studies. For the Let s Work initiative, tracer studies are proposed to track and record or evaluate the
PLANNING THE RESEARCH PROJECT
 Van Der Velde / Guide to Business Research Methods First Proof 6.11.2003 4:53pm page 1 Part I PLANNING THE RESEARCH PROJECT Van Der Velde / Guide to Business Research Methods First Proof 6.11.2003 4:53pm
VALIDITY OF QUANTITATIVE RESEARCH
 Validity 1 VALIDITY OF QUANTITATIVE RESEARCH Recall the basic aim of science is to explain natural phenomena. Such explanations are called theories (Kerlinger, 1986, p. 8). Theories have varying degrees
26:010:557 / 26:620:557 Social Science Research Methods
 26:010:557 / 26:620:557 Social Science Research Methods Dr. Peter R. Gillett Associate Professor Department of Accounting & Information Systems Rutgers Business School Newark & New Brunswick 1 Overview
Statistics is the science of collecting, organizing, presenting, analyzing, and interpreting data to assist in making effective decisions
 Readings: OpenStax Textbook - Chapters 1 5 (online) Appendix D & E (online) Plous - Chapters 1, 5, 6, 13 (online) Introductory comments Describe how familiarity with statistical methods can - be associated
Chapter 2 Survey Research Design and Quantitative Methods of Analysis for Cross-Sectional Data
 SSRIC Teaching Resources Depository Public Opinion on Social Issues -- 1975-2010 Elizabeth N. Nelson and Edward E. Nelson, California State University, Fresno Chapter 2 Survey Research Design and Quantitative
Abdul Latif Jameel Poverty Action Lab Executive Training: Evaluating Social Programs Spring 2009
 MIT OpenCourseWare http://ocw.mit.edu Abdul Latif Jameel Poverty Action Lab Executive Training: Evaluating Social Programs Spring 2009 For information about citing these materials or our Terms of Use,
Sampling. (James Madison University) January 9, / 13
 January 9, / 13") Sampling The population is the entire group of individuals about which we want information. A sample is a part of the population from which we actually collect information. A sampling design describes
Sampling The population is the entire group of individuals about which we want information. A sample is a part of the population from which we actually collect information. A sampling design describes
CHAPTER 3 METHOD AND PROCEDURE
 CHAPTER 3 METHOD AND PROCEDURE Previous chapter namely Review of the Literature was concerned with the review of the research studies conducted in the field of teacher education, with special reference
The Regression-Discontinuity Design
 Page 1 of 10 Home» Design» Quasi-Experimental Design» The Regression-Discontinuity Design The regression-discontinuity design. What a terrible name! In everyday language both parts of the term have connotations
t-test for r Copyright 2000 Tom Malloy. All rights reserved
 t-test for r Copyright 2000 Tom Malloy. All rights reserved This is the text of the in-class lecture which accompanied the Authorware visual graphics on this topic. You may print this text out and use
STA630 Research Methods Solved MCQs By
 STA630 Research Methods Solved MCQs By http://vustudents.ning.com 31-07-2010 Quiz # 1: Question # 1 of 10: A one tailed hypothesis predicts----------- The future The lottery result The frequency of the
Statistical Sampling: An Overview for Criminal Justice Researchers April 28, 2016
 Good afternoon everyone. My name is Stan Orchowsky, I'm the research director for the Justice Research and Statistics Association. It's my pleasure to welcome you this afternoon to the next in our Training
Enumerative and Analytic Studies. Description versus prediction
 Quality Digest, July 9, 2018 Manuscript 334 Description versus prediction The ultimate purpose for collecting data is to take action. In some cases the action taken will depend upon a description of what
Lecture Slides. Elementary Statistics Eleventh Edition. by Mario F. Triola. and the Triola Statistics Series 1.1-1
 Lecture Slides Elementary Statistics Eleventh Edition and the Triola Statistics Series by Mario F. Triola 1.1-1 Chapter 1 Introduction to Statistics 1-1 Review and Preview 1-2 Statistical Thinking 1-3
Introduction to Research Methods
 Introduction to Research Methods Updated August 08, 2016 1 The Three Types of Psychology Research Psychology research can usually be classified as one of three major types: 1. Causal Research When most
TECH 646 Analysis of Research in Industry and Technology
 TECH 646 Analysis of Research in Industry and Technology Ch 6. Research Design: An Overview Based on the text book and supplemental materials from the text book: Cooper, D.R., & Schindler, P.S., Business
PLS 506 Mark T. Imperial, Ph.D. Lecture Notes: Reliability & Validity
 PLS 506 Mark T. Imperial, Ph.D. Lecture Notes: Reliability & Validity Measurement & Variables - Initial step is to conceptualize and clarify the concepts embedded in a hypothesis or research question with
Lesson 9: Two Factor ANOVAS
 Published on Agron 513 (https://courses.agron.iastate.edu/agron513) Home > Lesson 9 Lesson 9: Two Factor ANOVAS Developed by: Ron Mowers, Marin Harbur, and Ken Moore Completion Time: 1 week Introduction
Why do Psychologists Perform Research?
 PSY 102 1 PSY 102 Understanding and Thinking Critically About Psychological Research Thinking critically about research means knowing the right questions to ask to assess the validity or accuracy of a
Sampling Reminders about content and communications:
 Sampling A free response question dealing with sampling or experimental design has appeared on every AP Statistics exam. The question is designed to assess your understanding of fundamental concepts such
Psych 1Chapter 2 Overview
 Psych 1Chapter 2 Overview After studying this chapter, you should be able to answer the following questions: 1) What are five characteristics of an ideal scientist? 2) What are the defining elements of
Lecturer: Dr. Emmanuel Adjei Department of Information Studies Contact Information:
 Lecturer: Dr. Emmanuel Adjei Department of Information Studies Contact Information: eadjei@ug.edu.gh College of Education School of Continuing and Distance Education 2014/2015 2016/2017 Session Overview
2.75: 84% 2.5: 80% 2.25: 78% 2: 74% 1.75: 70% 1.5: 66% 1.25: 64% 1.0: 60% 0.5: 50% 0.25: 25% 0: 0%
 Capstone Test (will consist of FOUR quizzes and the FINAL test grade will be an average of the four quizzes). Capstone #1: Review of Chapters 1-3 Capstone #2: Review of Chapter 4 Capstone #3: Review of
Measurement and meaningfulness in Decision Modeling
 Measurement and meaningfulness in Decision Modeling Brice Mayag University Paris Dauphine LAMSADE FRANCE Chapter 2 Brice Mayag (LAMSADE) Measurement theory and meaningfulness Chapter 2 1 / 47 Outline 1
Math 124: Modules 3 and 4. Sampling. Designing. Studies. Studies. Experimental Studies Surveys. Math 124: Modules 3 and 4. Sampling.
 What we will do today Five Experimental Module 3 and Module 4 David Meredith Department of Mathematics San Francisco State University September 24, 2008 Five Experimental 1 Five 2 Experimental Terminology
You can t fix by analysis what you bungled by design. Fancy analysis can t fix a poorly designed study.
 You can t fix by analysis what you bungled by design. Light, Singer and Willett Or, not as catchy but perhaps more accurate: Fancy analysis can t fix a poorly designed study. Producing Data The Role of