CS Information Visualization Sep. 10, 2012 John Stasko. General representation techniques for multivariate (>3) variables per data case
|
|
|
- Willis Blair
- 5 years ago
- Views:
Transcription
1 Topic Notes Multivariate Visual Representations 1 CS Information Visualization Sep. 10, 2012 John Stasko Agenda General representation techniques for multivariate (>3) variables per data case But not lots of variables yet Fall 2012 CS
2 How Many Variables? Revisit Data sets of dimensions 1, 2, 3 are common Number of variables per class 1 - Univariate data 2 - Bivariate data 3 - Trivariate data >3 - Hypervariate data Focus Today Fall 2012 CS Earlier We examined a number of tried-and-true techniques/visualizations for presenting multivariate (typically <=3) data sets Hinted at how to go above 3 dimensions Fall 2012 CS
3 Representations Some standard ways for low-d data low Tukey box plot Middle 50% high Mean Fall 2012 CS Hypervariate Data How about 4 to 20 or so variables (for instance)? Lower-dimensional hypervariate data Many data sets fall into this category Fall 2012 CS
4 More Dimensions Fundamentally, we have 2 geometric (position) display dimensions For data sets with >2 variables, we must project data down to 2D Come up with visual mapping that locates each dimension into 2D plane Computer graphics: 3D->2D projections Fall 2012 CS Wait a Second A spreadsheet already does that Each variable is positioned into a column Data cases in rows This is a projection (mapping) What about some other techniques? Already seen a couple Fall 2012 CS

5 Multiple Views Revisit Give each variable its own display A B C D E A B C D E Fall 2012 CS Scatterplot Matrix Revisit Represent each possible pair of variables in their own 2-D scatterplot Fall 2012 CS


6 Chernoff Faces Encode different variables values in characteristics of human face length cylinders MPG width horsepower weight year Fall 2012 CS Examples Cute applets: Fall 2012 CS

7 Table Lens Spreadsheet is certainly one hypervariate data presentation Idea: Make the text more visual and symbolic Just leverage basic bar chart idea Rao & Card CHI 94 Fall 2012 CS Visual Mapping Change quantitative values to bars Fall 2012 CS


8 Tricky Part What do you do for nominal data? Fall 2012 CS Instantiation Fall 2012 CS


9 Details Focus on item(s) while showing the context Fall 2012 CS See It Video Fall 2012 CS

10 FOCUS Feature-Oriented Catalog User Interface Leverages spreadsheet metaphor again Items in columns, attributes in rows Uses bars and other representations for attribute values Spenke, Beilken, & Berlage UIST 96 Fall 2012 CS Fall 2012 CS

11 Characteristics Can sort on any attribute (row) Focus on an attribute value (show only cases having that value) by doubleclicking on it Can type in queries on different attributes to limit what is presented too Fall 2012 CS Limit by Query Fall 2012 CS

12 Manifestation InfoZoom Commercial product to be demo ed coming up Fall 2012 CS Categorical data? How about multivariate categorical data? Students Gender: Female, male Eye color: Brown, blue, green, hazel Hair color: Black, red, brown, blonde, gray Home country: USA, China, Italy, India, Fall 2012 CS
13 Mosaic Plot Fall 2012 CS Mosaic Plot Women Men Fall 2012 CS
14 Mosaic Plot Brown Hazel Green Blue Women Men Fall 2012 CS Mosaic Plot Black Red Brown Blond Brown Hazel Green Blue Women Men Fall 2012 CS
15 Attribute Explorer General hypervariate data representation combined with flexible interaction Spence & Tweedie Inter w Computers 98 Fall 2012 CS Characteristics Multiple histogram views, one per attribute (like trellis) Each data case represented by a square Square is positioned relative to that case s value on that attribute Selecting case in one view lights it up in others Query sliders for narrowing Use shading to indicate level of query match (darkest for full match) Fall 2012 CS


16 Features Cost Attribute histogram All objects on all attribute scales 30K 100K Cost Interaction with attributes limits 30K 100K Fall 2012 CS Features Inter-relations between attributes brushing Cost Bedroom 30K Journey time 100K 1 5 1h 30h Fall 2012 CS


17 Features Color-encoded sensitivity Cost Bedroom 30K Journey time 100K 1 5 1h 30h Fall 2012 CS Attribute Explorer Video Fall 2012 CS
18 Summary Summary Attribute histogram Attribute relationship Sensitivity information Especially useful in zero-hits situations or when you are not familiar with the data at all Limitations Limits on the number of attributes Fall 2012 CS MultiNav Each different attribute is placed in a different row Sort the values of each row Thus, a particular item is not just in one column Want to support browsing Lanning et al AVI 00 Fall 2012 CS

19 Interface Fall 2012 CS Alternate UI Can slide the values in a row horizontally A particular data case then can be lined up in one column, but the rows are pushed unequally left and right Fall 2012 CS


20 Attributes as Sliding Rods Fall 2012 CS Information-Seeking Dialog Fall 2012 CS
 Nominal & textual attributes don t work quite as well Fall 2012 CS 7450 42")
21 Instantiation Demo Fall 2012 CS Limitations Number of cases (horizontal space) Nominal & textual attributes don t work quite as well Fall 2012 CS
22 Parallel Coordinates What are they? Explain Fall 2012 CS Parallel Coordinates V1 V2 V3 V4 V5 D1 D D Fall 2012 CS
23 Parallel Coordinates V1 V2 V3 V4 V5 D Fall 2012 CS Parallel Coordinates V1 V2 V3 V4 V5 D Fall 2012 CS
24 Parallel Coordinates V1 V2 V3 V4 V5 D Fall 2012 CS Parallel Coordinates Encode variables along a horizontal row Vertical line specifies different values that variable can take V1 V2 V3 V4 V5 Data point represented as a polyline Fall 2012 CS


25 Parallel Coords Example Basic Grayscale Color Fall 2012 CS Issue Different variables can have values taking on quite different ranges Must normalize all down (e.g., 0->1) Fall 2012 CS
26 Application System that uses parallel coordinates for information analysis and discovery Interactive tool Can focus on certain data items Color Taken from: A. Inselberg, Multidimensional Detective InfoVis 97, Fall 2012 CS Discuss What was their domain? What was their problem? What were their data sets? Fall 2012 CS
27 The Problem VLSI chip manufacture Want high quality chips (high speed) and a high yield batch (% of useful chips) Able to track defects Hypothesis: No defects gives desired chip types 473 batches of data Fall 2012 CS The Data 16 variables X1 - yield X2 - quality X3-X12 - # defects (inverted) X13-X16 - physical parameters Fall 2012 CS


28 Parallel Coordinate Display yield & quality defects parameters Yikes! But not that bad Distributions x1 - normal x2 - bipolar Fall 2012 CS Top Yield & Quality defects split Have some defects Fall 2012 CS
29 Minimal Defects Not the highest yields and quality Fall 2012 CS Best Yields Appears that some defects are necessary to produce the best chips Non-intuitive! Fall 2012 CS


30 XmdvTool Toolsuite created by Matthew Ward of WPI Includes parallel coordinate views Fall 2012 CS ParVis System Demo Fall 2012 CS
 (courtesy of J.")


31 Challenges Too much data Out5d dataset (5 dimensions, data items) (courtesy of J. Yang) Fall 2012 CS Dimensional Reordering Which dimensions are most like each other? Same dimensions ordered according to similarity Yang et al InfoVis 03 Fall 2012 CS


32 Dimensional Reordering Can you reduce clutter and highlight other interesting features in data by changing order of dimensions? Peng et al InfoVis 04 Fall 2012 CS Reducing Density Jerding and Stasko, 95, 98 Wegman & Luo, 96 Artero et al, 04 Johansson et al, 05 Fall 2012 CS

33 Improved Interaction How do we let the user select items of interest? Obvious notion of clicking on one of the polylines, but how about something more than that Fall 2012 CS Attribute Ratios Angular Brushing Select subsets which exhibit a correlation along 2 axes by specifying angle of interest Hauser, Ledermann, & Doleisch InfoVis 02 (earlier demo) Fall 2012 CS


34 Range Focus Smooth Brushing Specify a region of interest along one axis Fall 2012 CS Combining Composite Brushing Combine brushes and DOI functions using logical operators Fall 2012 CS


35 Video Fall 2012 CS Application Fall 2012 CS

36 Application Fall 2012 CS Different Kinds of Data How about categorical data? Can parallel coordinates handle that well? Fall 2012 CS

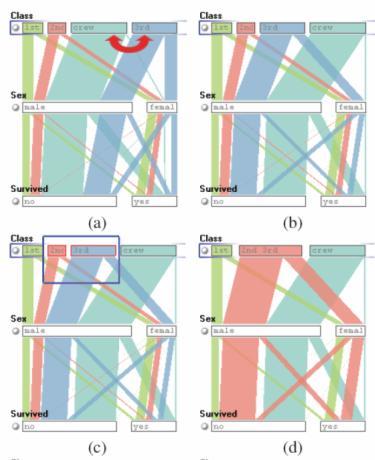
37 Parallel Sets Visualization method adopting parallel coordinates layout but uses frequencybased representation Visual metaphor Layout similar to parallel coordinates Continuous axes replaced with boxes Interaction User-driven: User can create new classifications Kosara, Bendix, & Hauser TVCG 05 Fall 2012 CS Representation Color used for different categories Those values flow into the other variables Fall 2012 CS


38 Example Titanic passengers data set Fall 2012 CS Titanic Data Set Fall 2012 CS


39 Interactions Fall 2012 CS Video InfoVis 05 Fall 2012 CS

40 Star Plots Var 5 Var 1 Var 2 Space out the n variables at equal angles around a circle Value Each spoke encodes a variable s value Var 4 Var 3 Alternative Rep. Data point is now a shape Fall 2012 CS Star Plot examples Fall 2012 CS
41 Star Coordinates Same ideas as star plot Rather than represent point as polyline, just accumulate values along a vector parallel to particular axis Data case then becomes a point Fall 2012 CS Star Coordinates E. Kandogan, Star Coordinates: A Multi-dimensional Visualization Technique with Uniform Treatment of Dimensions, InfoVis 2000 Late-Breaking Hot Topics, Oct Demo Fall 2012 CS
42 Star Coordinates Data cases with similar values will lead to clusters of points (What s the problem though?) Multi-dimensional scaling or projection down to 2D Fall 2012 CS Generalizing the Principles General & flexible framework for axisbased visualizations Scatterplots, par coords, etc. User can position, orient, and stretch axes Axes can be linked Claessen & van Wijk TVCG (InfoVis) 11 Fall 2012 CS


43 FLINA View Video Fall 2012 CS Parallel Coordinates Technique Strengths? Weaknesses? Fall 2012 CS
44 HW 3 Static visualization design Multivariate data set Ozone experiments Due next Monday Fall 2012 CS Project Teams & Topics due Monday Bring 2 copies More topic ideas Fall 2012 CS
45 Upcoming Multivariate Visual Representations 2 Reading: Keim et al, 02 Tufte s Design Principles Reading Tufte, Envisioning Information (if you have it) Read ahead S. Few book chapters 5-12 Fall 2012 CS
VISUAL PERCEPTION & COGNITIVE PROCESSES
 VISUAL PERCEPTION & COGNITIVE PROCESSES Prof. Rahul C. Basole CS4460 > March 31, 2016 How Are Graphics Used? Larkin & Simon (1987) investigated usefulness of graphical displays Graphical visualization
CS Information Visualization September 5, 2012 John Stasko
 Topic Notes Cognitive Issues & User Tasks CS 7450 - Information Visualization September 5, 2012 John Stasko Outline Overview 1. Role How visualizations aid cognition? 2. Tasks What does the visualization
bivariate analysis: The statistical analysis of the relationship between two variables.
 bivariate analysis: The statistical analysis of the relationship between two variables. cell frequency: The number of cases in a cell of a cross-tabulation (contingency table). chi-square (χ 2 ) test for
Section 6: Analysing Relationships Between Variables
 6. 1 Analysing Relationships Between Variables Section 6: Analysing Relationships Between Variables Choosing a Technique The Crosstabs Procedure The Chi Square Test The Means Procedure The Correlations
IAT 355 Visual Analytics. Encoding Information: Design. Lyn Bartram
 IAT 355 Visual Analytics Encoding Information: Design Lyn Bartram 4 stages of visualization design 2 Recall: Data Abstraction Tables Data item (row) with attributes (columns) : row=key, cells = values
Visual Perception. Agenda. Visual perception. CS Information Visualization January 20, 2011 John Stasko. Pre-attentive processing Color Etc.
 Topic Notes Visual Perception CS 7450 - Information Visualization January 20, 2011 John Stasko Agenda Visual perception Pre-attentive processing Color Etc. Spring 2011 CS 7450 2 1 Semiotics The study of
Plotting multivariate data
 Plotting multivariate data Statistics 7 ISU Multivariate data and graphics With multivariate data we want to understand the associations between multiple s, which might be considered to be understanding
User Tasks & Analysis. CS Information Visualization October 3, 2016 John Stasko
 User Tasks & Analysis CS 7450 - Information Visualization October 3, 2016 John Stasko Learning Objectives Understand the importance of tasks, goals, and objectives for visualization Identify the common
COGS 121 HCI Programming Studio. Week 03
 COGS 121 HCI Programming Studio Week 03 Direct Manipulation Principles of Direct Manipulation 1. Continuous representations of the objects and actions of interest with meaningful visual metaphors. 2. Physical
Frequency Distributions
 Frequency Distributions In this section, we look at ways to organize data in order to make it more user friendly. It is difficult to obtain any meaningful information from the data as presented in the
From Biostatistics Using JMP: A Practical Guide. Full book available for purchase here. Chapter 1: Introduction... 1
 From Biostatistics Using JMP: A Practical Guide. Full book available for purchase here. Contents Dedication... iii Acknowledgments... xi About This Book... xiii About the Author... xvii Chapter 1: Introduction...
CS Information Visualization September 7, 2016 John Stasko. Identify visual features that are and are not pre-attentive
 Visual Perception CS 7450 - Information Visualization September 7, 2016 John Stasko Learning Objectives Describe the visual processing pipeline Define pre-attentive processing Identify visual features
Visual Perception. Agenda. Visual perception. CS Information Visualization August 26, 2013 John Stasko. Pre-attentive processing Color Etc.
 Topic Notes Visual Perception CS 7450 - Information Visualization August 26, 2013 John Stasko Agenda Visual perception Pre-attentive processing Color Etc. Fall 2013 CS 7450 2 1 Semiotics The study of symbols
How to interpret scientific & statistical graphs
 How to interpret scientific & statistical graphs Theresa A Scott, MS Department of Biostatistics theresa.scott@vanderbilt.edu http://biostat.mc.vanderbilt.edu/theresascott 1 A brief introduction Graphics:
IAT 355 Perception 1. Or What You See is Maybe Not What You Were Supposed to Get
 IAT 355 Perception 1 Or What You See is Maybe Not What You Were Supposed to Get Why we need to understand perception The ability of viewers to interpret visual (graphical) encodings of information and
Nature Neuroscience: doi: /nn Supplementary Figure 1. Behavioral training.
 Supplementary Figure 1 Behavioral training. a, Mazes used for behavioral training. Asterisks indicate reward location. Only some example mazes are shown (for example, right choice and not left choice maze
Making charts in Excel
 Making charts in Excel Use Excel file MakingChartsInExcel_data We ll start with the worksheet called treatment This shows the number of admissions (not necessarily people) to Twin Cities treatment programs
Lesson 9 Presentation and Display of Quantitative Data
 Lesson 9 Presentation and Display of Quantitative Data Learning Objectives All students will identify and present data using appropriate graphs, charts and tables. All students should be able to justify
Frequency Distributions
 Frequency Distributions In this section, we look at ways to organize data in order to make it user friendly. We begin by presenting two data sets, from which, because of how the data is presented, it is
Designing Psychology Experiments: Data Analysis and Presentation
 Data Analysis and Presentation Review of Chapter 4: Designing Experiments Develop Hypothesis (or Hypotheses) from Theory Independent Variable(s) and Dependent Variable(s) Operational Definitions of each
Measuring the User Experience
 Measuring the User Experience Collecting, Analyzing, and Presenting Usability Metrics Chapter 2 Background Tom Tullis and Bill Albert Morgan Kaufmann, 2008 ISBN 978-0123735584 Introduction Purpose Provide
The Strucplot Framework for Visualizing Categorical Data
 The Strucplot Framework for Visualizing Categorical Data David Meyer 1, Achim Zeileis 2 and Kurt Hornik 2 1 Department of Information Systems and Operations 2 Department of Statistics and Mathematics Wirtschaftsuniversität
What is Data? Part 2: Patterns & Associations. INFO-1301, Quantitative Reasoning 1 University of Colorado Boulder
 What is Data? Part 2: Patterns & Associations INFO-1301, Quantitative Reasoning 1 University of Colorado Boulder August 29, 2016 Prof. Michael Paul Prof. William Aspray Overview This lecture will look
The North Carolina Health Data Explorer
 The North Carolina Health Data Explorer The Health Data Explorer provides access to health data for North Carolina counties in an interactive, user-friendly atlas of maps, tables, and charts. It allows
Charts Worksheet using Excel Obesity Can a New Drug Help?
 Worksheet using Excel 2000 Obesity Can a New Drug Help? Introduction Obesity is known to be a major health risk. The data here arise from a study which aimed to investigate whether or not a new drug, used
MA 151: Using Minitab to Visualize and Explore Data The Low Fat vs. Low Carb Debate
 MA 151: Using Minitab to Visualize and Explore Data The Low Fat vs. Low Carb Debate September 5, 2018 1 Introduction to the Data We will be working with a synthetic data set meant to resemble the weight
Theta sequences are essential for internally generated hippocampal firing fields.
 Theta sequences are essential for internally generated hippocampal firing fields. Yingxue Wang, Sandro Romani, Brian Lustig, Anthony Leonardo, Eva Pastalkova Supplementary Materials Supplementary Modeling
Framework for Comparative Research on Relational Information Displays
 Framework for Comparative Research on Relational Information Displays Sung Park and Richard Catrambone 2 School of Psychology & Graphics, Visualization, and Usability Center (GVU) Georgia Institute of
Supplementary materials for: Executive control processes underlying multi- item working memory
 Supplementary materials for: Executive control processes underlying multi- item working memory Antonio H. Lara & Jonathan D. Wallis Supplementary Figure 1 Supplementary Figure 1. Behavioral measures of
List of Figures. List of Tables. Preface to the Second Edition. Preface to the First Edition
 List of Figures List of Tables Preface to the Second Edition Preface to the First Edition xv xxv xxix xxxi 1 What Is R? 1 1.1 Introduction to R................................ 1 1.2 Downloading and Installing
Z-Glyph: Visualizing outliers in multivariate data
 Original Article Z-Glyph: Visualizing outliers in multivariate data Information Visualization 1 19 Ó The Author(s) 2017 Reprints and permissions: sagepub.co.uk/journalspermissions.nav DOI: 10.1177/1473871616686635
General recognition theory of categorization: A MATLAB toolbox
 ehavior Research Methods 26, 38 (4), 579-583 General recognition theory of categorization: MTL toolbox LEOL. LFONSO-REESE San Diego State University, San Diego, California General recognition theory (GRT)
Animated Scatterplot Analysis of Time- Oriented Data of Diabetes Patients
 Animated Scatterplot Analysis of Time- Oriented Data of Diabetes Patients First AUTHOR a,1, Second AUTHOR b and Third Author b ; (Blinded review process please leave this part as it is; authors names will
HARRISON ASSESSMENTS DEBRIEF GUIDE 1. OVERVIEW OF HARRISON ASSESSMENT
 HARRISON ASSESSMENTS HARRISON ASSESSMENTS DEBRIEF GUIDE 1. OVERVIEW OF HARRISON ASSESSMENT Have you put aside an hour and do you have a hard copy of your report? Get a quick take on their initial reactions
CHAPTER ONE CORRELATION
 CHAPTER ONE CORRELATION 1.0 Introduction The first chapter focuses on the nature of statistical data of correlation. The aim of the series of exercises is to ensure the students are able to use SPSS to
Understandable Statistics
 Understandable Statistics correlated to the Advanced Placement Program Course Description for Statistics Prepared for Alabama CC2 6/2003 2003 Understandable Statistics 2003 correlated to the Advanced Placement
CHAPTER 3 Describing Relationships
 CHAPTER 3 Describing Relationships 3.1 Scatterplots and Correlation The Practice of Statistics, 5th Edition Starnes, Tabor, Yates, Moore Bedford Freeman Worth Publishers Reading Quiz 3.1 True/False 1.
Unit 7 Comparisons and Relationships
 Unit 7 Comparisons and Relationships Objectives: To understand the distinction between making a comparison and describing a relationship To select appropriate graphical displays for making comparisons
Here are the various choices. All of them are found in the Analyze menu in SPSS, under the sub-menu for Descriptive Statistics :
 Descriptive Statistics in SPSS When first looking at a dataset, it is wise to use descriptive statistics to get some idea of what your data look like. Here is a simple dataset, showing three different
Annotated example of good writing
 19. Speaking about Multivariate Analyses SOLUTIONS 1. Figures 19A 19G are slides for a presentation about the physical impact of the planes on the Twin Towers (box 20.3 and figure 20.5). Annotated example
Visual Exploration of Classification Models for Risk Assessment
 Visual Exploration of Classification Models for Risk Assessment M.A. Migut M. Worring Intelligent Systems Lab Amsterdam, University of Amsterdam, Amsterdam, The Netherlands M.A.Migut@uva.nl M.Worring@uva.nl
Identification of Tissue Independent Cancer Driver Genes
 Identification of Tissue Independent Cancer Driver Genes Alexandros Manolakos, Idoia Ochoa, Kartik Venkat Supervisor: Olivier Gevaert Abstract Identification of genomic patterns in tumors is an important
Probability and Statistics. Chapter 1
 Probability and Statistics Chapter 1 Individuals and Variables Individuals and Variables Individuals are objects described by data. Individuals and Variables Individuals are objects described by data.
How to describe bivariate data
 Statistics Corner How to describe bivariate data Alessandro Bertani 1, Gioacchino Di Paola 2, Emanuele Russo 1, Fabio Tuzzolino 2 1 Department for the Treatment and Study of Cardiothoracic Diseases and
Chapter 16: Multivariate analysis of variance (MANOVA)
") Chapter 16: Multivariate analysis of variance (MANOVA) Labcoat Leni s Real Research A lot of hot air Problem Marzillier, S. L., & Davey, G. C. L. (2005). Cognition and Emotion, 19, 729 750. Have you ever
Chapter 16: Multivariate analysis of variance (MANOVA) Labcoat Leni s Real Research A lot of hot air Problem Marzillier, S. L., & Davey, G. C. L. (2005). Cognition and Emotion, 19, 729 750. Have you ever
Chapter 7: Descriptive Statistics
 Chapter Overview Chapter 7 provides an introduction to basic strategies for describing groups statistically. Statistical concepts around normal distributions are discussed. The statistical procedures of
Visualizing Clinical Trial Data Using Pluggable Components
 Visualizing Clinical Trial Data Using Pluggable Components Jonas Sjöbergh, Micke Kuwahara, and Yuzuru Tanaka Meme Media Lab Hokkaido University Sapporo, Japan {js, mkuwahara, tanaka}@meme.hokudai.ac.jp
User Interface. Colors, Icons, Text, and Presentation SWEN-444
 User Interface Colors, Icons, Text, and Presentation SWEN-444 Color Psychology Color can evoke: Emotion aesthetic appeal warm versus cold colors Colors can be used for Clarification, Relation, and Differentiation.
Information Visualization. Pictures worth 1000 words...
 Information Visualization Pictures worth 1000 words... Agenda ØInformation Visualization overview v Definition v Principles v Examples v Techniques Fall 2018 PSYCH / CS 6755 2 Data, Data Everywhere ØOur
ANOVA in SPSS (Practical)
") ANOVA in SPSS (Practical) Analysis of Variance practical In this practical we will investigate how we model the influence of a categorical predictor on a continuous response. Centre for Multilevel Modelling
ANOVA in SPSS (Practical) Analysis of Variance practical In this practical we will investigate how we model the influence of a categorical predictor on a continuous response. Centre for Multilevel Modelling
Unit 1 Exploring and Understanding Data
 Unit 1 Exploring and Understanding Data Area Principle Bar Chart Boxplot Conditional Distribution Dotplot Empirical Rule Five Number Summary Frequency Distribution Frequency Polygon Histogram Interquartile
Application of Local Control Strategy in analyses of the effects of Radon on Lung Cancer Mortality for 2,881 US Counties
 Application of Local Control Strategy in analyses of the effects of Radon on Lung Cancer Mortality for 2,881 US Counties Bob Obenchain, Risk Benefit Statistics, August 2015 Our motivation for using a Cut-Point
Day 11: Measures of Association and ANOVA
 Day 11: Measures of Association and ANOVA Daniel J. Mallinson School of Public Affairs Penn State Harrisburg mallinson@psu.edu PADM-HADM 503 Mallinson Day 11 November 2, 2017 1 / 45 Road map Measures of
When Projects go Splat: Introducing Splatter Plots. 17 February 2001 Delaware Chapter of the ASA Dennis Sweitzer
 When Projects go Splat: Introducing Splatter Plots 17 February 2001 Delaware Chapter of the ASA Dennis Sweitzer Introduction There is always a need for better ways to present data The key bottle neck is
4Stat Wk 10: Regression
 4Stat 342 - Wk 10: Regression Loading data with datalines Regression (Proc glm) - with interactions - with polynomial terms - with categorical variables (Proc glmselect) - with model selection (this is
Before we get started:
 Before we get started: http://arievaluation.org/projects-3/ AEA 2018 R-Commander 1 Antonio Olmos Kai Schramm Priyalathta Govindasamy Antonio.Olmos@du.edu AntonioOlmos@aumhc.org AEA 2018 R-Commander 2 Plan
Knowledge Discovery and Data Mining I
 Ludwig-Maximilians-Universität München Lehrstuhl für Datenbanksysteme und Data Mining Prof. Dr. Thomas Seidl Knowledge Discovery and Data Mining I Winter Semester 2018/19 Introduction What is an outlier?
COMP 3020: Human-Computer Interaction I Fall 2017
 COMP 3020: Human-Computer Interaction I Fall 2017 Layout James Young, with acknowledgements to Anthony Tang, Andrea Bunt, Pourang Irani, Julie Kientz, Saul Greenberg, Ehud Sharlin, Jake Wobbrock, Dave
Humerus. Ulna. Radius. Carpals
 Posture Analysis Exercise T. Armstrong M. Ebersole 1.0 Objectives: 1. Improve skill for rating over all job and identifying specific force and posture problems 2. Learn how to characterize posture 3. Learn
Reveal Relationships in Categorical Data
 SPSS Categories 15.0 Specifications Reveal Relationships in Categorical Data Unleash the full potential of your data through perceptual mapping, optimal scaling, preference scaling, and dimension reduction
EBCC Data Analysis Tool (EBCC DAT) Introduction
 Introduction") Instructor: Paul Wolfgang Faculty sponsor: Yuan Shi, Ph.D. Andrey Mavrichev CIS 4339 Project in Computer Science May 7, 2009 Research work was completed in collaboration with Michael Tobia, Kevin L. Brown,
Instructor: Paul Wolfgang Faculty sponsor: Yuan Shi, Ph.D. Andrey Mavrichev CIS 4339 Project in Computer Science May 7, 2009 Research work was completed in collaboration with Michael Tobia, Kevin L. Brown,
Intro to HCI / Why is Design Hard?
 Intro to HCI / Why is Design Hard? September 11, 2017 Fall 2017 COMP 3020 1 Fall 2017 COMP 3020 2 Announcements Assignment 1 is posted Due Sept 22 by 5:00pm on UMLearn Individual assignment Buying Pop
Section 3 Correlation and Regression - Teachers Notes
 The data are from the paper: Exploring Relationships in Body Dimensions Grete Heinz and Louis J. Peterson San José State University Roger W. Johnson and Carter J. Kerk South Dakota School of Mines and
Problem #1 Neurological signs and symptoms of ciguatera poisoning as the start of treatment and 2.5 hours after treatment with mannitol.
 Ho (null hypothesis) Ha (alternative hypothesis) Problem #1 Neurological signs and symptoms of ciguatera poisoning as the start of treatment and 2.5 hours after treatment with mannitol. Hypothesis: Ho:
Chapter 1: Managing workbooks
 Chapter 1: Managing workbooks Module A: Managing worksheets You use the Insert tab on the ribbon to insert new worksheets. True or False? Which of the following are options for moving or copying a worksheet?
Chapter 3: Describing Relationships
 Chapter 3: Describing Relationships Objectives: Students will: Construct and interpret a scatterplot for a set of bivariate data. Compute and interpret the correlation, r, between two variables. Demonstrate
Chapter 3. Information Input and Processing Part II* Prepared by: Ahmed M. El-Sherbeeny, PhD *(Adapted from Slides by: Dr.
 Chapter 3. Information Input and Processing Part II* Prepared by: Ahmed M. El-Sherbeeny, PhD *(Adapted from Slides by: Dr. Khaled Al-Saleh) 1 Information: How it can be measured (part I) How it can be
Multidimensional Scaling
 LEARNING OBJECTIVES Upon completing this chapter, you should be able to do the following: Define multidimensional scaling and describe how it is performed. Understand the differences between similarity
v Feature Stamping SMS 13.0 Tutorial Prerequisites Requirements Map Module Mesh Module Scatter Module Time minutes
 v. 13.0 SMS 13.0 Tutorial Objectives Learn how to use conceptual modeling techniques to create numerical models which incorporate flow control structures into existing bathymetry. The flow control structures
Application Project for CMSC734: Information Visualization
 Application Project for CMSC734: Information Visualization Tibco s Spotfire software was used to analyze Prof. Vaughn-Cooke s survey data on diabetes treatment [1]. The dataset consist of diabetes blood-glucose
Biopac Student Lab Lesson 6 ELECTROCARDIOGRAPHY (ECG) II Analysis Procedure. Rev
 II Analysis Procedure. Rev") 42 Aero Camino, Goleta, CA 93117 www.biopac.com Biopac Student Lab Lesson 6 ELECTROCARDIOGRAPHY (ECG) II Analysis Procedure Rev. 12292017 Richard Pflanzer, Ph.D. Associate Professor Emeritus Indiana University
42 Aero Camino, Goleta, CA 93117 www.biopac.com Biopac Student Lab Lesson 6 ELECTROCARDIOGRAPHY (ECG) II Analysis Procedure Rev. 12292017 Richard Pflanzer, Ph.D. Associate Professor Emeritus Indiana University
AN INFORMATION VISUALIZATION APPROACH TO CLASSIFICATION AND ASSESSMENT OF DIABETES RISK IN PRIMARY CARE
 Proceedings of the 3rd INFORMS Workshop on Data Mining and Health Informatics (DM-HI 2008) J. Li, D. Aleman, R. Sikora, eds. AN INFORMATION VISUALIZATION APPROACH TO CLASSIFICATION AND ASSESSMENT OF DIABETES
Designing Psychology Experiments: Data Analysis and Presentation
 Data Analysis and Presentation Review of Chapter 4: Designing Experiments Develop Hypothesis (or Hypotheses) from Theory Independent Variable(s) and Dependent Variable(s) Operational Definitions of each
Human Abilities 1. Understanding the user
 Human Abilities 1 Understanding the user Human Capabilities Ø Ø Ø Why do we care? (better design!) Want to improve user performance and preferences Knowing the user informs the design 1. Senses 2. Information
Voxar 3D CardiaMetrix. Reference Guide
 Voxar 3D CardiaMetrix Reference Guide The software described in this document is furnished under a license, and may be used or copied only according to the terms of such license. Toshiba means, Toshiba
Interpretability of Sudden Concept Drift in Medical Informatics Domain
 Interpretability of Sudden Concept Drift in Medical Informatics Domain Gregor Stiglic, Peter Kokol Faculty of Health Sciences University of Maribor Slovenia Presentation Outline Visualization of Concept
LOTS of NEW stuff right away 2. The book has calculator commands 3. About 90% of technology by week 5
 1.1 1. LOTS of NEW stuff right away 2. The book has calculator commands 3. About 90% of technology by week 5 1 Three adventurers are in a hot air balloon. Soon, they find themselves lost in a canyon in
BIOLOGY 3A LABORATORY Morphology and the shape and form of biological structures
 BIOLOGY 3A LABORATORY Morphology and the shape and form of biological structures For the harmony of the world is made manifest in form and number, and the heart and soul and all the poetry of Natural philosophy
DEPARTMENT OF POLITICAL SCIENCE AND INTERNATIONAL RELATIONS Research Methods Posc 302 ANALYSIS OF SURVEY DATA
 DEPARTMENT OF POLITICAL SCIENCE AND INTERNATIONAL RELATIONS Research Methods Posc 302 ANALYSIS OF SURVEY DATA I. TODAY S SESSION: A. Second steps in data analysis and interpretation 1. Examples and explanation
On Shape And the Computability of Emotions X. Lu, et al.
 On Shape And the Computability of Emotions X. Lu, et al. MICC Reading group 10.07.2013 1 On Shape and the Computability of Emotion X. Lu, P. Suryanarayan, R. B. Adams Jr., J. Li, M. G. Newman, J. Z. Wang
FaceReview: Supporting Interactive Exploration of Linked Heterogeneous Datasets for Unilateral Cleft Lip and Palate
 FaceReview: Supporting Interactive Exploration of Linked Heterogeneous Datasets for Unilateral Cleft Lip and Palate Sungwon Lee, BS 1, Boeun Kim, MS 1, Bongshin Lee, PhD 2, Bohyoung Kim, PhD 2, Bohyung
The Influence of Contour on Similarity Perception of Star Glyphs
 IEEE TRANSACTIONS ON VISUALIZATION AND COMPUTER GRAPHICS, VOL. 20, NO. 12, DECEMBER 2014 2251 The Influence of Contour on Similarity Perception of Star Glyphs Johannes Fuchs, Petra Isenberg, Anastasia
Chapter 3: Examining Relationships
 Name Date Per Key Vocabulary: response variable explanatory variable independent variable dependent variable scatterplot positive association negative association linear correlation r-value regression
CHAPTER VI RESEARCH METHODOLOGY
 CHAPTER VI RESEARCH METHODOLOGY 6.1 Research Design Research is an organized, systematic, data based, critical, objective, scientific inquiry or investigation into a specific problem, undertaken with the
Knowledge discovery tools 381
 Knowledge discovery tools 381 hours, and prime time is prime time precisely because more people tend to watch television at that time.. Compare histograms from di erent periods of time. Changes in histogram
Background Information. Instructions. Problem Statement. HOMEWORK INSTRUCTIONS Homework #2 HIV Statistics Problem
 Background Information HOMEWORK INSTRUCTIONS The scourge of HIV/AIDS has had an extraordinary impact on the entire world. The spread of the disease has been closely tracked since the discovery of the HIV
Statistical Methods and Reasoning for the Clinical Sciences
 Statistical Methods and Reasoning for the Clinical Sciences Evidence-Based Practice Eiki B. Satake, PhD Contents Preface Introduction to Evidence-Based Statistics: Philosophical Foundation and Preliminaries
Content Scope & Sequence
 Content Scope & Sequence GRADE 2 scottforesman.com (800) 552-2259 Copyright Pearson Education, Inc. 0606443 1 Counting, Coins, and Combinations Counting, Coins, and Combinations (Addition, Subtraction,
STAT 113: PAIRED SAMPLES (MEAN OF DIFFERENCES)
") STAT 113: PAIRED SAMPLES (MEAN OF DIFFERENCES) In baseball after a player gets a hit, they need to decide whether to stop at first base, or try to stretch their hit from a single to a double. Does the
STAT 113: PAIRED SAMPLES (MEAN OF DIFFERENCES) In baseball after a player gets a hit, they need to decide whether to stop at first base, or try to stretch their hit from a single to a double. Does the
Relational methodology
 Relational methodology Ulisse Di Corpo and Antonella Vannini 1 The discovery of attractors has widened science to the study of phenomena which cannot be caused, phenomena which we can observe, but not
Support for Cognitive Science Experiments
 Support for Cognitive Science Experiments CogSketch as Research Instrument Corpus of stimuli for people Corpus of formally represented stimuli Cognitive Simulation Compare results on variety of tasks Gathering
A Workflow for Visual Diagnostics of Binary Classifiers using Instance-Level Explanations
 A Workflow for Visual Diagnostics of Binary Classifiers using Instance-Level Explanations Josua Krause* NYU Tandon School of Engineering Aritra Dasgupta Pacific Northwest National Laboratory Jordan Swartz
QPM Lab 9: Contingency Tables and Bivariate Displays in R
 QPM Lab 9: Contingency Tables and Bivariate Displays in R Department of Political Science Washington University, St. Louis November 3-4, 2016 QPM Lab 9: Contingency Tables and Bivariate Displays in R 1
STAT 503X Case Study 1: Restaurant Tipping
 STAT 503X Case Study 1: Restaurant Tipping 1 Description Food server s tips in restaurants may be influenced by many factors including the nature of the restaurant, size of the party, table locations in
Filling the Bins - or - Turning Numerical Data into Histograms. ISC1057 Janet Peterson and John Burkardt Computational Thinking Fall Semester 2016
 * Filling the Bins - or - Turning Numerical Data into Histograms ISC1057 Janet Peterson and John Burkardt Computational Thinking Fall Semester 2016 A histogram is a kind of chart which shows patterns in
Statistics is the science of collecting, organizing, presenting, analyzing, and interpreting data to assist in making effective decisions
 Readings: OpenStax Textbook - Chapters 1 5 (online) Appendix D & E (online) Plous - Chapters 1, 5, 6, 13 (online) Introductory comments Describe how familiarity with statistical methods can - be associated
Titrations in Cytobank
 The Premier Platform for Single Cell Analysis (1) Titrations in Cytobank To analyze data from a titration in Cytobank, the first step is to upload your own FCS files or clone an experiment you already
CMSC434 Intro to Human-Computer Interaction
 CMSC434 Intro to Human-Computer Interaction Representation and Human Information Processing Monday, March 12th, 2012 Instructor: Jon Froehlich TA: Kotaro Hara Team Project #2 User Research, Task Analysis,
The Use of Unidimensional Parameter Estimates of Multidimensional Items in Adaptive Testing
 The Use of Unidimensional Parameter Estimates of Multidimensional Items in Adaptive Testing Terry A. Ackerman University of Illinois This study investigated the effect of using multidimensional items in