Measurement and Descriptive Statistics. Katie Rommel-Esham Education 604
|
|
|
- Cora Riley
- 5 years ago
- Views:
Transcription
1 Measurement and Descriptive Statistics Katie Rommel-Esham Education 604
2 Frequency Distributions Frequency table # grad courses taken f 3 or fewer or more 4

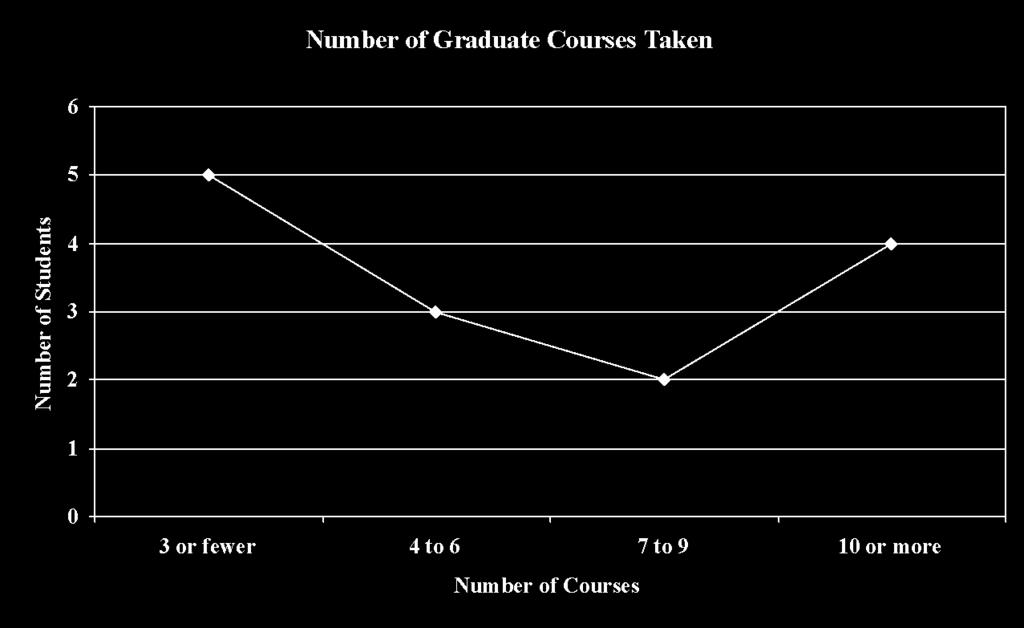
3 Pictorial Representations Frequency polygon
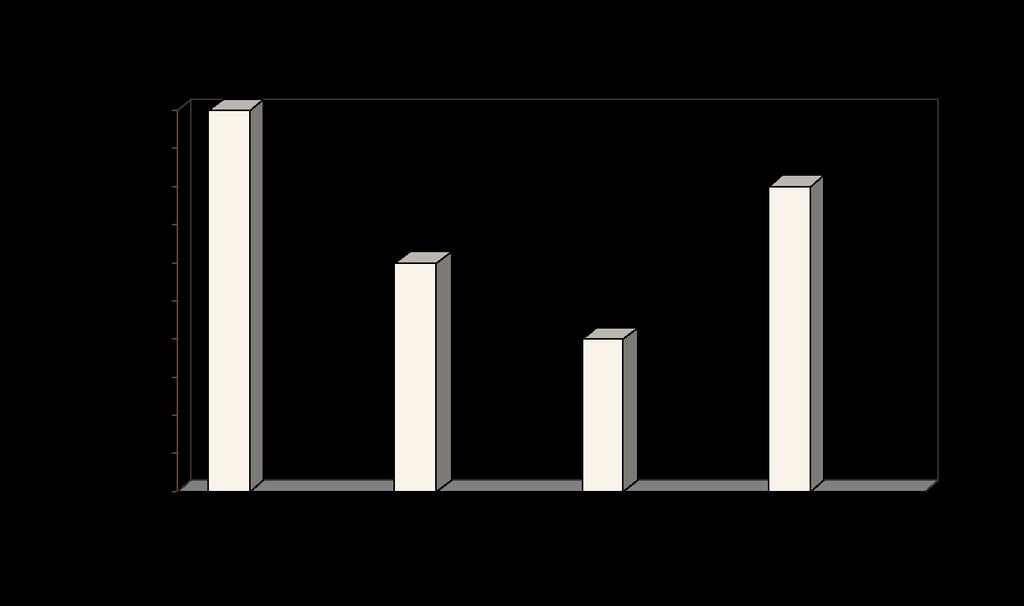
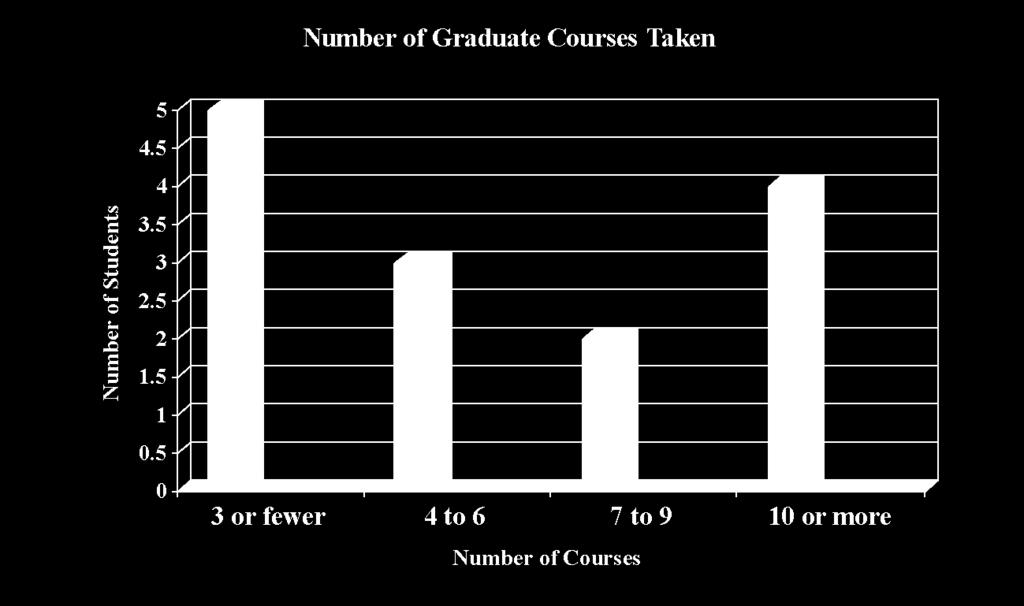
4 Pictorial Representations Bar graph/histogram
5 Measures of Central Tendency Mean The arithmetic mean or average of the data Found by adding all data values and dividing by the number of data points Extremely sensitive to outliers May be misleading if used alone
6 Measures of Central Tendency Median The physical center of the data Literally the value in the middle of the data set when it is ordered from lowest value to highest value Not affected by outliers May be misleading if used alone
7 Measures of Central Tendency Mode The most frequently occurring value in the data set Data may be multi-modal if it has more than one value that occurs multiple times Data may have no mode if each data value occurs only once
8 Normal Daily Temperatures for San Francisco, CA and Wichita, KS Jan Feb Mar Apr May June July Aug Sept Oct Nov Dec San Fran Wich KS
9 Temperature Data San Francisco Mean = Median = 56.5 Mode = 49, 61 Wichita Mean = Median = 57.5 Mode = 44

10 Beware (note title and labels on axes)

11 Is it the same? (note title and labels on axes)
12 Side by Side


13 Even Pictures Can Be Misleading Both graphs show the same data sets. In the first, the vertical scale runs from 4.4 to 5.0. In the second, the vertical scale runs from 0.0 to 5.0, providing a more accurate picture of the data.
14 Measures of Variability Range The mathematical difference between the maximum value and the minimum value of the data set Of limited usefulness unless used in conjunction with other data
15 Measures of Variability Variance Measure that provides an indication of the spread of the data set The average squared deviation from the mean Describes how closely the data are clustered about the mean
16 Measures of Variability Standard deviation Derived from the variance by taking its square root Commonly reported statistic The greater the data spread from the mean, the larger the standard deviation
17 Temperature Data, Revisited San Francisco Range = 15 Variance = Standard Deviation = 5.43 Wichita Range = 51 Variance = Standard Deviation = 18.64
18 Measures of Variability Percentile rank The percent of values below a specified value If a score of 65 is at the 87th percentile, then 87% of the scores are less than 65. There is no 100th percentile (Why?)
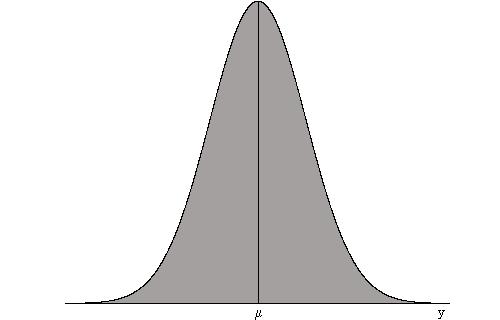
19 The Normal Distribution
20
21 The Normal Distribution Properties Mean = median = mode (at the peak of the graph) Graph is symmetric about the mean Approaches, but never touches, the x-axis (its asymptote)
22 The Normal Distribution Relevance The normal distribution is a statistical or theoretical entity. When we extrapolate from a sample to a population, we are assuming that the data are normally distributed. Height and IQ are examples of data sets that are normally distributed, yet weight is not. Why?

23 Distribution of Scores Under the Normal Curve
24 Correlation and the Correlation Coefficient Relationship may be positive, negative, curvilinear, or non-existent Correlation coefficient (r) lies between -1 and +1 and indicates the strength of the relationship r = -1 is a perfect negative relationship, r = +1 is a perfect positive relationship Correlation does not imply causation!!
25 Validity of Measurement Validity The extent to which inferences are appropriate and meaningful
26 Types of Validity Evidence Evidence based on test content Extent to which the measure is representative of a broader domain of content Often judged by expert opinion Deals with representation per se as well as degree of representation
27 Types of Validity Evidence Evidence based on test structure Deals with the relationship among items on the instrument Most all of the items will be related statistically, however all those related to trait X should have a statistically stronger relationship with one another than they do with the other items.
28 Types of Validity Evidence Evidence based on relations to other variables Convergent evidence is provided when scores on one instrument correlate with those from another instrument measuring the same thing Divergent evidence is provided when there is not a correlation among measures of different traits
29 Types of Validity Evidence Test-criterion relationship deals with the extent to which the measures predict performance Predictive evidence indicates whether the measure can predict criterion performance. Concurrent evidence indicates whether the measure correlates with criteria that predict the same thing when the two are measured at the same time.
30 Reliability of Measurement The degree to which scores are free from error
31 Types of Reliability Stability Also known as test-retest reliability or consistency Deals with the consistency of the instrument over time i.e. scores for an individual should not vary wildly from one sitting to the next (without an outside intervention)
32 Types of Reliability Equivalence (of multiple forms) Although the items may be different, the content, mean, and standard deviation should be the same for all forms of the instrument (e.g. Form A and Form B ).
33 Types of Reliability Stability and Equivalence Provides information on stability over time and the equivalence of forms concurrently. For example, Form A is administered at the first sitting, while Form B is administered at the second sitting.
34 Types of Reliability Internal Consistency Deals with the degree of homogeneity of items within the instrument Does not indicate anything about the consistency of performance Split-half reliability matches one half of the instrument against the other A Kuder-Richardson formula is used for response that are scored as either correct or incorrect Cronbach s α is used for range-type responses ( such as agree disagree)
35 Types of Reliability Agreement The extent to which two or more persons agree about what they have seen, heard, or rated Reported as either inter-rater reliability or scorer agreement Expressed either as a correlation coefficient or as percentage of agreement Does not indicate anything about the consistency of performance (for example, although inter-rater reliability is high, ratings are not consistent)
36 Notes on Reliability Coefficients The more heterogeneous the group is on the trait being measured, the higher the reliability. The more items there are in the instrument, the higher the reliability. The greater the range of scores, the higher the reliability. Medium difficulty tests will exhibit higher reliability than either very easy or very difficult tests. Reliability is demonstrated only for subjects whose characteristics are similar to those of the norming group. The more discriminatory the items, the higher the reliability.
Lesson 9 Presentation and Display of Quantitative Data
 Lesson 9 Presentation and Display of Quantitative Data Learning Objectives All students will identify and present data using appropriate graphs, charts and tables. All students should be able to justify
Variable Measurement, Norms & Differences
 Variable Measurement, Norms & Differences 1 Expectations Begins with hypothesis (general concept) or question Create specific, testable prediction Prediction can specify relation or group differences Different
VARIABLES AND MEASUREMENT
 ARTHUR SYC 204 (EXERIMENTAL SYCHOLOGY) 16A LECTURE NOTES [01/29/16] VARIABLES AND MEASUREMENT AGE 1 Topic #3 VARIABLES AND MEASUREMENT VARIABLES Some definitions of variables include the following: 1.
On the purpose of testing:
 Why Evaluation & Assessment is Important Feedback to students Feedback to teachers Information to parents Information for selection and certification Information for accountability Incentives to increase
Results & Statistics: Description and Correlation. I. Scales of Measurement A Review
 Results & Statistics: Description and Correlation The description and presentation of results involves a number of topics. These include scales of measurement, descriptive statistics used to summarize
 alternate-form reliability The degree to which two or more versions of the same test correlate with one another. In clinical studies in which a given function is going to be tested more than once over
Descriptive Statistics Lecture
 Definitions: Lecture Psychology 280 Orange Coast College 2/1/2006 Statistics have been defined as a collection of methods for planning experiments, obtaining data, and then analyzing, interpreting and
 Page 1 of 11 Glossary of Terms Terms Clinical Cut-off Score: A test score that is used to classify test-takers who are likely to possess the attribute being measured to a clinically significant degree
ADMS Sampling Technique and Survey Studies
 Principles of Measurement Measurement As a way of understanding, evaluating, and differentiating characteristics Provides a mechanism to achieve precision in this understanding, the extent or quality As
Using Analytical and Psychometric Tools in Medium- and High-Stakes Environments
 Using Analytical and Psychometric Tools in Medium- and High-Stakes Environments Greg Pope, Analytics and Psychometrics Manager 2008 Users Conference San Antonio Introduction and purpose of this session
Chapter 2 Norms and Basic Statistics for Testing MULTIPLE CHOICE
 Chapter 2 Norms and Basic Statistics for Testing MULTIPLE CHOICE 1. When you assert that it is improbable that the mean intelligence test score of a particular group is 100, you are using. a. descriptive
copyright D. McCann, 2006) PSYCHOLOGY is
 PSYCHOLOGY is") UNIT I(slides copyright D. McCann, 2006) PSYCHOLOGY is PSYCHOLOGY is the scientific study of behavior and mental processes SCOPE OF THE SUBJECT Blowfly Wilder Penfield Attitude change Mob Violence (deindividuation)
UNIT I(slides copyright D. McCann, 2006) PSYCHOLOGY is PSYCHOLOGY is the scientific study of behavior and mental processes SCOPE OF THE SUBJECT Blowfly Wilder Penfield Attitude change Mob Violence (deindividuation)
Population. Sample. AP Statistics Notes for Chapter 1 Section 1.0 Making Sense of Data. Statistics: Data Analysis:
 Section 1.0 Making Sense of Data Statistics: Data Analysis: Individuals objects described by a set of data Variable any characteristic of an individual Categorical Variable places an individual into one
Appendix B Statistical Methods
 Appendix B Statistical Methods Figure B. Graphing data. (a) The raw data are tallied into a frequency distribution. (b) The same data are portrayed in a bar graph called a histogram. (c) A frequency polygon
Chapter 2--Norms and Basic Statistics for Testing
 Chapter 2--Norms and Basic Statistics for Testing Student: 1. Statistical procedures that summarize and describe a series of observations are called A. inferential statistics. B. descriptive statistics.
11/18/2013. Correlational Research. Correlational Designs. Why Use a Correlational Design? CORRELATIONAL RESEARCH STUDIES
 Correlational Research Correlational Designs Correlational research is used to describe the relationship between two or more naturally occurring variables. Is age related to political conservativism? Are
Biostatistics. Donna Kritz-Silverstein, Ph.D. Professor Department of Family & Preventive Medicine University of California, San Diego
 Biostatistics Donna Kritz-Silverstein, Ph.D. Professor Department of Family & Preventive Medicine University of California, San Diego (858) 534-1818 dsilverstein@ucsd.edu Introduction Overview of statistical
Introduction to Statistical Data Analysis I
 Introduction to Statistical Data Analysis I JULY 2011 Afsaneh Yazdani Preface What is Statistics? Preface What is Statistics? Science of: designing studies or experiments, collecting data Summarizing/modeling/analyzing
11-3. Learning Objectives
 11-1 Measurement Learning Objectives 11-3 Understand... The distinction between measuring objects, properties, and indicants of properties. The similarities and differences between the four scale types
Chapter 20: Test Administration and Interpretation
 Chapter 20: Test Administration and Interpretation Thought Questions Why should a needs analysis consider both the individual and the demands of the sport? Should test scores be shared with a team, or
Introduction to Reliability
 Reliability Thought Questions: How does/will reliability affect what you do/will do in your future job? Which method of reliability analysis do you find most confusing? Introduction to Reliability What
Medical Statistics 1. Basic Concepts Farhad Pishgar. Defining the data. Alive after 6 months?
 Medical Statistics 1 Basic Concepts Farhad Pishgar Defining the data Population and samples Except when a full census is taken, we collect data on a sample from a much larger group called the population.
Stats 95. Statistical analysis without compelling presentation is annoying at best and catastrophic at worst. From raw numbers to meaningful pictures
 Stats 95 Statistical analysis without compelling presentation is annoying at best and catastrophic at worst. From raw numbers to meaningful pictures Stats 95 Why Stats? 200 countries over 200 years http://www.youtube.com/watch?v=jbksrlysojo
Statistics is the science of collecting, organizing, presenting, analyzing, and interpreting data to assist in making effective decisions
 Readings: OpenStax Textbook - Chapters 1 5 (online) Appendix D & E (online) Plous - Chapters 1, 5, 6, 13 (online) Introductory comments Describe how familiarity with statistical methods can - be associated
Empowered by Psychometrics The Fundamentals of Psychometrics. Jim Wollack University of Wisconsin Madison
 Empowered by Psychometrics The Fundamentals of Psychometrics Jim Wollack University of Wisconsin Madison Psycho-what? Psychometrics is the field of study concerned with the measurement of mental and psychological
Lauren DiBiase, MS, CIC Associate Director Public Health Epidemiologist Hospital Epidemiology UNC Hospitals
 Lauren DiBiase, MS, CIC Associate Director Public Health Epidemiologist Hospital Epidemiology UNC Hospitals Statistics Numbers that describe the health of the population The science used to interpret these
Unit 1 Exploring and Understanding Data
 Unit 1 Exploring and Understanding Data Area Principle Bar Chart Boxplot Conditional Distribution Dotplot Empirical Rule Five Number Summary Frequency Distribution Frequency Polygon Histogram Interquartile
Construct Reliability and Validity Update Report
 Assessments 24x7 LLC DISC Assessment 2013 2014 Construct Reliability and Validity Update Report Executive Summary We provide this document as a tool for end-users of the Assessments 24x7 LLC (A24x7) Online
Standard Scores. Richard S. Balkin, Ph.D., LPC-S, NCC
 Standard Scores Richard S. Balkin, Ph.D., LPC-S, NCC 1 Normal Distributions While Best and Kahn (2003) indicated that the normal curve does not actually exist, measures of populations tend to demonstrate
Quantitative Methods in Computing Education Research (A brief overview tips and techniques)
") Quantitative Methods in Computing Education Research (A brief overview tips and techniques) Dr Judy Sheard Senior Lecturer Co-Director, Computing Education Research Group Monash University judy.sheard@monash.edu
Quantitative Methods in Computing Education Research (A brief overview tips and techniques) Dr Judy Sheard Senior Lecturer Co-Director, Computing Education Research Group Monash University judy.sheard@monash.edu
Interpreting the Item Analysis Score Report Statistical Information
 Interpreting the Item Analysis Score Report Statistical Information This guide will provide information that will help you interpret the statistical information relating to the Item Analysis Report generated
Still important ideas
 Readings: OpenStax - Chapters 1 11 + 13 & Appendix D & E (online) Plous - Chapters 2, 3, and 4 Chapter 2: Cognitive Dissonance, Chapter 3: Memory and Hindsight Bias, Chapter 4: Context Dependence Still
Welcome to OSA Training Statistics Part II
 Welcome to OSA Training Statistics Part II Course Summary Using data about a population to draw graphs Frequency distribution and variability within populations Bell Curves: What are they and where do
PRINCIPLES OF STATISTICS
 PRINCIPLES OF STATISTICS STA-201-TE This TECEP is an introduction to descriptive and inferential statistics. Topics include: measures of central tendency, variability, correlation, regression, hypothesis
STATISTICS AND RESEARCH DESIGN
 Statistics 1 STATISTICS AND RESEARCH DESIGN These are subjects that are frequently confused. Both subjects often evoke student anxiety and avoidance. To further complicate matters, both areas appear have
Business Statistics Probability
 Business Statistics The following was provided by Dr. Suzanne Delaney, and is a comprehensive review of Business Statistics. The workshop instructor will provide relevant examples during the Skills Assessment
DATA GATHERING. Define : Is a process of collecting data from sample, so as for testing & analyzing before reporting research findings.
 DATA GATHERING Define : Is a process of collecting data from sample, so as for testing & analyzing before reporting research findings. 2012 John Wiley & Sons Ltd. Measurement Measurement: the assignment
LANGUAGE TEST RELIABILITY On defining reliability Sources of unreliability Methods of estimating reliability Standard error of measurement Factors
 LANGUAGE TEST RELIABILITY On defining reliability Sources of unreliability Methods of estimating reliability Standard error of measurement Factors affecting reliability ON DEFINING RELIABILITY Non-technical
Probability and Statistics. Chapter 1
 Probability and Statistics Chapter 1 Individuals and Variables Individuals and Variables Individuals are objects described by data. Individuals and Variables Individuals are objects described by data.
Still important ideas
 Readings: OpenStax - Chapters 1 13 & Appendix D & E (online) Plous Chapters 17 & 18 - Chapter 17: Social Influences - Chapter 18: Group Judgments and Decisions Still important ideas Contrast the measurement
Psychologist use statistics for 2 things
 Psychologist use statistics for 2 things O Summarize the information from the study/experiment O Measures of central tendency O Mean O Median O Mode O Make judgements and decisions about the data O See
investigate. educate. inform.
 investigate. educate. inform. Research Design What drives your research design? The battle between Qualitative and Quantitative is over Think before you leap What SHOULD drive your research design. Advanced
Chapter 3: Describing Relationships
 Chapter 3: Describing Relationships Objectives: Students will: Construct and interpret a scatterplot for a set of bivariate data. Compute and interpret the correlation, r, between two variables. Demonstrate
Undertaking statistical analysis of
 Descriptive statistics: Simply telling a story Laura Delaney introduces the principles of descriptive statistical analysis and presents an overview of the various ways in which data can be presented by
Statistics is the science of collecting, organizing, presenting, analyzing, and interpreting data to assist in making effective decisions
 Readings: OpenStax Textbook - Chapters 1 5 (online) Appendix D & E (online) Plous - Chapters 1, 5, 6, 13 (online) Introductory comments Describe how familiarity with statistical methods can - be associated
CURRICULUM PACING CHART ACES Subject: Science-Second Grade
 SCIENCE EXPERIMENTS DONE DURING EACH UNIT COVER THE FOLLOWING SOL DURING EACH NINE WEEKS: SOL # Unit Bloom s Objective 2.1 Scientific Investigation, Reasoning, and Logic Synthesis The student will demonstrate
Readings: Textbook readings: OpenStax - Chapters 1 13 (emphasis on Chapter 12) Online readings: Appendix D, E & F
 Online readings: Appendix D, E & F") Readings: Textbook readings: OpenStax - Chapters 1 13 (emphasis on Chapter 12) Online readings: Appendix D, E & F Plous Chapters 17 & 18 Chapter 17: Social Influences Chapter 18: Group Judgments and Decisions
Readings: Textbook readings: OpenStax - Chapters 1 13 (emphasis on Chapter 12) Online readings: Appendix D, E & F Plous Chapters 17 & 18 Chapter 17: Social Influences Chapter 18: Group Judgments and Decisions
Table of Contents. Plots. Essential Statistics for Nursing Research 1/12/2017
 Essential Statistics for Nursing Research Kristen Carlin, MPH Seattle Nursing Research Workshop January 30, 2017 Table of Contents Plots Descriptive statistics Sample size/power Correlations Hypothesis
Describe what is meant by a placebo Contrast the double-blind procedure with the single-blind procedure Review the structure for organizing a memo
 Business Statistics The following was provided by Dr. Suzanne Delaney, and is a comprehensive review of Business Statistics. The workshop instructor will provide relevant examples during the Skills Assessment
Basic Statistics 01. Describing Data. Special Program: Pre-training 1
 Basic Statistics 01 Describing Data Special Program: Pre-training 1 Describing Data 1. Numerical Measures Measures of Location Measures of Dispersion Correlation Analysis 2. Frequency Distributions (Relative)
3 CONCEPTUAL FOUNDATIONS OF STATISTICS
 3 CONCEPTUAL FOUNDATIONS OF STATISTICS In this chapter, we examine the conceptual foundations of statistics. The goal is to give you an appreciation and conceptual understanding of some basic statistical
Describe what is meant by a placebo Contrast the double-blind procedure with the single-blind procedure Review the structure for organizing a memo
 Please note the page numbers listed for the Lind book may vary by a page or two depending on which version of the textbook you have. Readings: Lind 1 11 (with emphasis on chapters 10, 11) Please note chapter
CHAPTER 3 DATA ANALYSIS: DESCRIBING DATA
 Data Analysis: Describing Data CHAPTER 3 DATA ANALYSIS: DESCRIBING DATA In the analysis process, the researcher tries to evaluate the data collected both from written documents and from other sources such
Chapter 1: Exploring Data
 Chapter 1: Exploring Data Key Vocabulary:! individual! variable! frequency table! relative frequency table! distribution! pie chart! bar graph! two-way table! marginal distributions! conditional distributions!
2.4.1 STA-O Assessment 2
 2.4.1 STA-O Assessment 2 Work all the problems and determine the correct answers. When you have completed the assessment, open the Assessment 2 activity and input your responses into the online grading
Statistical Techniques. Masoud Mansoury and Anas Abulfaraj
 Statistical Techniques Masoud Mansoury and Anas Abulfaraj What is Statistics? https://www.youtube.com/watch?v=lmmzj7599pw The definition of Statistics The practice or science of collecting and analyzing
Basic concepts and principles of classical test theory
 Basic concepts and principles of classical test theory Jan-Eric Gustafsson What is measurement? Assignment of numbers to aspects of individuals according to some rule. The aspect which is measured must
HPS301 Exam Notes- Contents
 HPS301 Exam Notes- Contents Week 1 Research Design: What characterises different approaches 1 Experimental Design 1 Key Features 1 Criteria for establishing causality 2 Validity Internal Validity 2 Threats
Distributions and Samples. Clicker Question. Review
 Distributions and Samples Clicker Question The major difference between an observational study and an experiment is that A. An experiment manipulates features of the situation B. An experiment does not
Readings: Textbook readings: OpenStax - Chapters 1 11 Online readings: Appendix D, E & F Plous Chapters 10, 11, 12 and 14
 Readings: Textbook readings: OpenStax - Chapters 1 11 Online readings: Appendix D, E & F Plous Chapters 10, 11, 12 and 14 Still important ideas Contrast the measurement of observable actions (and/or characteristics)
Theory. = an explanation using an integrated set of principles that organizes observations and predicts behaviors or events.
 Definition Slides Hindsight Bias = the tendency to believe, after learning an outcome, that one would have foreseen it. Also known as the I knew it all along phenomenon. Critical Thinking = thinking that
Chapter 1. Picturing Distributions with Graphs
 Chapter 1 Picturing Distributions with Graphs Statistics Statistics is a science that involves the extraction of information from numerical data obtained during an experiment or from a sample. It involves
Ch. 11 Measurement. Paul I-Hai Lin, Professor A Core Course for M.S. Technology Purdue University Fort Wayne Campus
 TECH 646 Analysis of Research in Industry and Technology PART III The Sources and Collection of data: Measurement, Measurement Scales, Questionnaires & Instruments, Sampling Ch. 11 Measurement Lecture
MBA 605 Business Analytics Don Conant, PhD. GETTING TO THE STANDARD NORMAL DISTRIBUTION
 MBA 605 Business Analytics Don Conant, PhD. GETTING TO THE STANDARD NORMAL DISTRIBUTION Variables In the social sciences data are the observed and/or measured characteristics of individuals and groups
AP Psych - Stat 1 Name Period Date. MULTIPLE CHOICE. Choose the one alternative that best completes the statement or answers the question.
 AP Psych - Stat 1 Name Period Date MULTIPLE CHOICE. Choose the one alternative that best completes the statement or answers the question. 1) In a set of incomes in which most people are in the $15,000
Data, frequencies, and distributions. Martin Bland. Types of data. Types of data. Clinical Biostatistics
 Clinical Biostatistics Data, frequencies, and distributions Martin Bland Professor of Health Statistics University of York http://martinbland.co.uk/ Types of data Qualitative data arise when individuals
AP Psych - Stat 2 Name Period Date. MULTIPLE CHOICE. Choose the one alternative that best completes the statement or answers the question.
 AP Psych - Stat 2 Name Period Date MULTIPLE CHOICE. Choose the one alternative that best completes the statement or answers the question. 1) In a set of incomes in which most people are in the $15,000
Lesson 11 Correlations
 Lesson 11 Correlations Lesson Objectives All students will define key terms and explain the difference between correlations and experiments. All students should be able to analyse scattergrams using knowledge
Statistics: Interpreting Data and Making Predictions. Interpreting Data 1/50
 Statistics: Interpreting Data and Making Predictions Interpreting Data 1/50 Last Time Last time we discussed central tendency; that is, notions of the middle of data. More specifically we discussed the
Importance of Good Measurement
 Importance of Good Measurement Technical Adequacy of Assessments: Validity and Reliability Dr. K. A. Korb University of Jos The conclusions in a study are only as good as the data that is collected. The
Readings: Textbook readings: OpenStax - Chapters 1 4 Online readings: Appendix D, E & F Online readings: Plous - Chapters 1, 5, 6, 13
 Readings: Textbook readings: OpenStax - Chapters 1 4 Online readings: Appendix D, E & F Online readings: Plous - Chapters 1, 5, 6, 13 Introductory comments Describe how familiarity with statistical methods
Types of Tests. Measurement Reliability. Most self-report tests used in Psychology and Education are objective tests :
 Measurement Reliability Objective & Subjective tests Standardization & Inter-rater reliability Properties of a good item Item Analysis Internal Reliability Spearman-Brown Prophesy Formla -- α & # items
Ch. 11 Measurement. Measurement
 TECH 646 Analysis of Research in Industry and Technology PART III The Sources and Collection of data: Measurement, Measurement Scales, Questionnaires & Instruments, Sampling Ch. 11 Measurement Lecture
THE TEST STATISTICS REPORT provides a synopsis of the test attributes and some important statistics. A sample is shown here to the right.
 THE TEST STATISTICS REPORT provides a synopsis of the test attributes and some important statistics. A sample is shown here to the right. The Test reliability indicators are measures of how well the questions
Announcement. Homework #2 due next Friday at 5pm. Midterm is in 2 weeks. It will cover everything through the end of next week (week 5).
.") Announcement Homework #2 due next Friday at 5pm. Midterm is in 2 weeks. It will cover everything through the end of next week (week 5). Political Science 15 Lecture 8: Descriptive Statistics (Part 1) Data
Announcement Homework #2 due next Friday at 5pm. Midterm is in 2 weeks. It will cover everything through the end of next week (week 5). Political Science 15 Lecture 8: Descriptive Statistics (Part 1) Data
STATISTICS & PROBABILITY
 STATISTICS & PROBABILITY LAWRENCE HIGH SCHOOL STATISTICS & PROBABILITY CURRICULUM MAP 2015-2016 Quarter 1 Unit 1 Collecting Data and Drawing Conclusions Unit 2 Summarizing Data Quarter 2 Unit 3 Randomness
Reliability. Internal Reliability
 32 Reliability T he reliability of assessments like the DECA-I/T is defined as, the consistency of scores obtained by the same person when reexamined with the same test on different occasions, or with
2.75: 84% 2.5: 80% 2.25: 78% 2: 74% 1.75: 70% 1.5: 66% 1.25: 64% 1.0: 60% 0.5: 50% 0.25: 25% 0: 0%
 Capstone Test (will consist of FOUR quizzes and the FINAL test grade will be an average of the four quizzes). Capstone #1: Review of Chapters 1-3 Capstone #2: Review of Chapter 4 Capstone #3: Review of
11/24/2017. Do not imply a cause-and-effect relationship
 Correlational research is used to describe the relationship between two or more naturally occurring variables. Is age related to political conservativism? Are highly extraverted people less afraid of rejection
Students will understand the definition of mean, median, mode and standard deviation and be able to calculate these functions with given set of
 Students will understand the definition of mean, median, mode and standard deviation and be able to calculate these functions with given set of numbers. Also, students will understand why some measures
PÄIVI KARHU THE THEORY OF MEASUREMENT
 PÄIVI KARHU THE THEORY OF MEASUREMENT AGENDA 1. Quality of Measurement a) Validity Definition and Types of validity Assessment of validity Threats of Validity b) Reliability True Score Theory Definition
PTHP 7101 Research 1 Chapter Assignments
 PTHP 7101 Research 1 Chapter Assignments INSTRUCTIONS: Go over the questions/pointers pertaining to the chapters and turn in a hard copy of your answers at the beginning of class (on the day that it is
32.5. percent of U.S. manufacturers experiencing unfair currency manipulation in the trade practices of other countries.
 TECH 646 Analysis of Research in Industry and Technology PART III The Sources and Collection of data: Measurement, Measurement Scales, Questionnaires & Instruments, Sampling Ch. 11 Measurement Lecture
Six Sigma Glossary Lean 6 Society
 Six Sigma Glossary Lean 6 Society ABSCISSA ACCEPTANCE REGION ALPHA RISK ALTERNATIVE HYPOTHESIS ASSIGNABLE CAUSE ASSIGNABLE VARIATIONS The horizontal axis of a graph The region of values for which the null
Overview of Non-Parametric Statistics
 Overview of Non-Parametric Statistics LISA Short Course Series Mark Seiss, Dept. of Statistics April 7, 2009 Presentation Outline 1. Homework 2. Review of Parametric Statistics 3. Overview Non-Parametric
MTH 225: Introductory Statistics
 Marshall University College of Science Mathematics Department MTH 225: Introductory Statistics Course catalog description Basic probability, descriptive statistics, fundamental statistical inference procedures
Chapter 3: Examining Relationships
 Name Date Per Key Vocabulary: response variable explanatory variable independent variable dependent variable scatterplot positive association negative association linear correlation r-value regression
Saville Consulting Wave Professional Styles Handbook
 Saville Consulting Wave Professional Styles Handbook PART 4: TECHNICAL Chapter 19: Reliability This manual has been generated electronically. Saville Consulting do not guarantee that it has not been changed
Making a psychometric. Dr Benjamin Cowan- Lecture 9
 Making a psychometric Dr Benjamin Cowan- Lecture 9 What this lecture will cover What is a questionnaire? Development of questionnaires Item development Scale options Scale reliability & validity Factor
Empirical Knowledge: based on observations. Answer questions why, whom, how, and when.
 INTRO TO RESEARCH METHODS: Empirical Knowledge: based on observations. Answer questions why, whom, how, and when. Experimental research: treatments are given for the purpose of research. Experimental group
Lesson 8 Descriptive Statistics: Measures of Central Tendency and Dispersion
 Lesson 8 Descriptive Statistics: Measures of Central Tendency and Dispersion Learning Objectives All students will define key terms and calculate different descriptive statistics. All students should be
Validity and reliability of measurements
 Validity and reliability of measurements 2 3 Request: Intention to treat Intention to treat and per protocol dealing with cross-overs (ref Hulley 2013) For example: Patients who did not take/get the medication
bivariate analysis: The statistical analysis of the relationship between two variables.
 bivariate analysis: The statistical analysis of the relationship between two variables. cell frequency: The number of cases in a cell of a cross-tabulation (contingency table). chi-square (χ 2 ) test for
Psychology Research Process
 Psychology Research Process Logical Processes Induction Observation/Association/Using Correlation Trying to assess, through observation of a large group/sample, what is associated with what? Examples:
Bijay Lal Pradhan, M Sc Statistics, FDPM (IIMA) 2
 2") Bijay Lal Pradhan Measurement and Scaling 1) Definition of measurement and scale 2) Type of Physical scale i. Nominal Scale iii. Interval scale ii. Ordinal Scale iv. Ratio Scale 3) Need of scaling 4) Criteria
Bijay Lal Pradhan Measurement and Scaling 1) Definition of measurement and scale 2) Type of Physical scale i. Nominal Scale iii. Interval scale ii. Ordinal Scale iv. Ratio Scale 3) Need of scaling 4) Criteria
Lecture Week 3 Quality of Measurement Instruments; Introduction SPSS
 Lecture Week 3 Quality of Measurement Instruments; Introduction SPSS Introduction to Research Methods & Statistics 2013 2014 Hemmo Smit Overview Quality of Measurement Instruments Introduction SPSS Read:
Describe what is meant by a placebo Contrast the double-blind procedure with the single-blind procedure Review the structure for organizing a memo
 Please note the page numbers listed for the Lind book may vary by a page or two depending on which version of the textbook you have. Readings: Lind 1 11 (with emphasis on chapters 5, 6, 7, 8, 9 10 & 11)
Measuring the User Experience
 Measuring the User Experience Collecting, Analyzing, and Presenting Usability Metrics Chapter 2 Background Tom Tullis and Bill Albert Morgan Kaufmann, 2008 ISBN 978-0123735584 Introduction Purpose Provide
Reliability & Validity Dr. Sudip Chaudhuri
 Reliability & Validity Dr. Sudip Chaudhuri M. Sc., M. Tech., Ph.D., M. Ed. Assistant Professor, G.C.B.T. College, Habra, India, Honorary Researcher, Saha Institute of Nuclear Physics, Life Member, Indian