F-actin VWF Vinculin. F-actin. Vinculin VWF
|
|
|
- Lorraine Cole
- 6 years ago
- Views:
Transcription

 Immunofluorescence images of f-actin (cyan), VWF (yellow),")
 and below are the")
")

1 a F-actin VWF Vinculin b F-actin VWF Vinculin Supplementary Fig. 1. WPBs in HUVECs are located along stress fibers and at focal adhesions. (a) Immunofluorescence images of f-actin (cyan), VWF (yellow), and vinculin (magenta) by confocal microscope. The magnified insets on the right (merged) and below are the separated mono-color images, which show WPBs are located along with actin stress fibers (as indicated by red dash lines) connected to focal adhesions. (b) Statistic graph shows the percentage of WPBs along stress fiber (within 0.5 µm) in the peri-membrane and the peri-nuclear region. All error bars represent s.d.. Scale bars, 5 μm.

 expression detected by immunostaining with an anti-zyxin antibody (green). Nuclei were labeled with DAPI (blue).")
. The images were acquired under a confocal microscope.")
.")
2 Average number of cytoplasmic WPBs in each cell a * * * b Merge Basal Dsred- KD Forskolin 15 min Forskolin 30 min Control WT sh Z y KD ** ** Basal Forskolin FSK 15' FSK Forskolin 30' 15 min 30 min Supplementary Fig. 2. Visualization of the effect of zyxin knockdown on WPB release of HUVECs in response to forskolin stimulation. HUVECs were infected with Dsred-labeled retrovirus delivering sh (the abbreviation of sh-1, which is used thereafter). (a) expression detected by immunostaining with an anti-zyxin antibody (green). Nuclei were labeled with DAPI (blue). -knockdown cells expressed Dsred (red). (b) WPBs stained with an anti-vwf antibody (green) and nuclei co-stained with DAPI (blue). -knockdown cells expressed Dsred (red). The images were acquired under a confocal microscope. The dash lines indicate the outline of the cells. Scale bars, 5 μm. The bar graph shows the average number of cytoplasmic WPBs per cell (n = 16, **P < 0.01, 4 independent experiments). All error bars represent s.d.. Student s t-test was used for statistical analysis.
3 a sec PSL-lum VWF Merged b Lifeact sec PSL-lum Merged c PSL-lum sec Lifeact Merged Supplementary Fig. 3. Visualization of WPB exocytosis and actin framework formation. (a) A HUVEC co-expressing a fusion protein of the luminal part of P-selectin with mcherry at the C-terminus (magenta) and GFP-VWF (green) was imaged with high NA TIRF-SIM. The cells were incubated in medium with forskolin. (b, c) A HUVEC co-expressing mcherry-psl-lum (magenta) and GFP-Lifeact (green) in the presence of epinephrine (b) or phorbol-12-myristate-13-acetate (c) was imaged using TIRF-SIM. Images were acquired every 3 sec for 10 min. Arrowheads indicate actin framework. Time 0 is defined as fusion point. Scale bars, 500 nm.
4 sec Lifeact VWF ~ Merged Supplementary Fig. 4. Visualization of WPB exocytosis and actin framework formation in VWF-GFP and Lifeact-mcherry expressing HUVECs. Time-lapse series showing the exocytosis of an individual WPB in a HUVEC expressing GFP-VWF (green) and mcherry-lifeact (magenta). Arrowheads indicate actin filaments recruited to form the actin framework. Time 0 is defined as the fusion point. Scale bar, 500 nm.
5 Normalized distance between vesicle and membrane (%) a -2.4 y x-y x sec z x-z x b sec s ec Supplementary Fig. 5. Variable-angle TIRF imaging of a WPB for 3D trajectory measurement during exocytosis. A HUVEC expressing VWF-GFP (green) was stimulated with forskolin. Images were acquired every 0.8 sec at 10 different angles for 15 min. The raw images were reconstructed using a custom program 17. (a) Time-lapse series of x-y and x-z images of an individual exocytosis event. The x-z images represent the maximum intensity projections along the y axis. The red dashed line indicates the membrane-facing edge of the WPB (defined as the last pixel with a signal) and the white dashed line indicates the membrane plane (defined as the plane of clear diffusion). (b) The graph shows the normalized distance between the edge of the WPB plane and the membrane (defined as the ratio of their separation at each time point to that at the first time point). The dash line indicates the fusion point. The statistic analysis was performed in ImageJ. Scale bar, 500 nm.
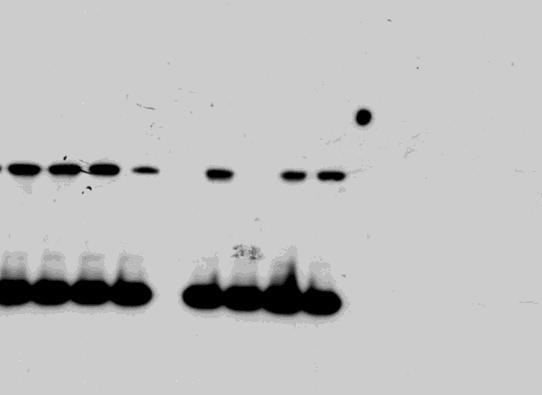
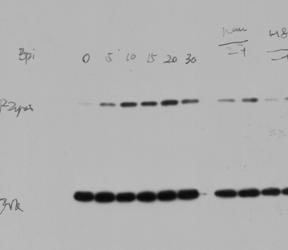
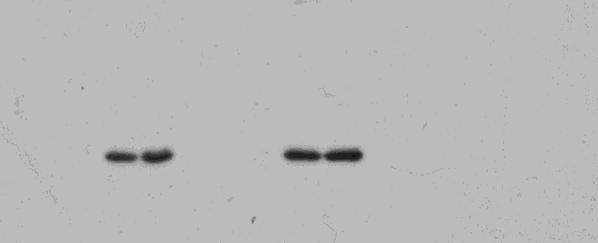
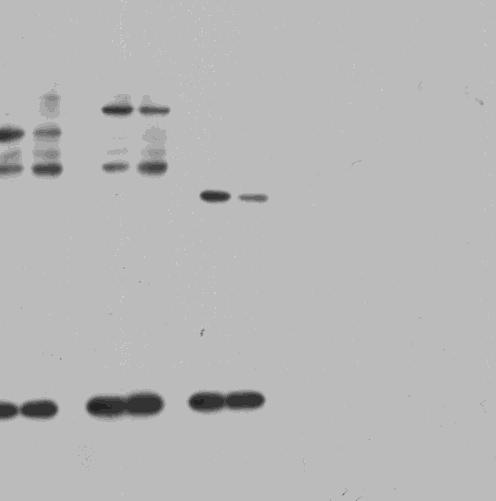
6 Secreted VWF (% of total VWF) Secreted VWF (% of total VWF) Secreted VWF (% of total VWF) a Epinephrine min p- b DMSO Basal FSK Forskolin ** PKI c DMSO Basal FSK Forskolin ** Brefeldin H89 A d α-actinin VASP e ** N.S. ** Basal FSK Forskolin 20 0 Supplementary Fig. 6. -mediated VWF secretion depends on the PKA activity and the interaction with α-actinin. (a) Western-blot of phospho-zyxin (S142/143) (p-) in HUVECs stimulated with epineprine for different time points. (b, c) ELISA of VWF secreted from HUVECs with forskolin stimulation in the presence of PKI (a PKA-specific inhibitor) or Brefeldin A (an EPAC-specific inhibitor). The cells were treated with (PKI) or (Brefeldin A) for 20 min or with DMSO as control, and stimulated with or without forskolin for 1 h. Bar graphs show the percentage of secreted VWF relative to cytoplasmic VWF (n = 15, **P < 0.01 versus DMSO-treated cells, 4 independent experiments). (d) Expression levels of zyxin, α-actinin, and VASP in cells expressing scrambled or targeted shrnas. Cells were infected with lentiviruses delivering scrambled shrna (), or shrnas targeting zyxin (sh), α-actinin 1 (shα-actinin 1), or VASP (shvasp). The cells were collected 48 h later. Western-blot analysis was used to determine the zyxin, α-actinin, and VASP expression levels. (e) ELISA of VWF secreted from HUVECs expressing scrambled () or targeted shrnas (sh, shα-actinin or shvasp) with forskolin stimulation (n = 12, **P < 0.01, N.S. P > 0.05, 3 independent experiments). All error bars represent s.d.. Student s t-test was used for statistical analysis.
7 FSC-A WT 97.6 KO 0.29 BC 81.4 EC 2.38 Supplementary Fig. 7. Assessment of reconstitution efficiency in cross marrow transplanted mice. knockout bone marrow cells were transplanted in the WT recipient mice, establishing the EC mice model (EC Zyx+ /BC Zyx- ). Meanwhile, WT bone marrow cells were transplanted into the KO recipient to establish the BC model (EC Zyx- /BC Zyx+ ). Representative FACS profiles of freshly isolated peripheral blood cells from WT, KO, BC and EC mice at day 10 post-transplantation are shown. Cells were labeled with zyxin antibody followed by AF488-conjungated second antibody. The region indicates the class of the zyxin positive cells and the proportions were shown respectively.

 and GFP-Lifeact")


8 sec Lifeact PSL-lum Merged Supplementary Fig. 8. Live imaging of the dynamics of actin and WPB exocytosis with spinning disk confocal microscopy. HUVECs co-expressing mcherry-psl-lum (magenta) and GFP-Lifeact (green) in the presence of forskolin were imaged with a spinning-disk confocal microscope. Images were acquired every 5 sec for 10 min. Z-stacks were acquired for 5 planes at steps of 500 nm. The time-lapse series shows the maximum intensity projection at each time point (n = 7, 3 independent experiments). Scale bar, 500 nm.


9 sh-1 sh-2 sh-1 sh-2 Fig.1 b Fig. 4b sh SH Fig.4 a FSK P- S142/ (min) Fig. S6a FSK (min) Epinephrin P- S142/143 e (min) FSK (min)


10 SH SHα-actinin 1 SH SHVASP SHα-actinin 1 Fig. 4c left Fig. 4c right DMSO PKI DMSO Brefeldin A P- S142/143 P- S142/143 DMSO Brefeldin A DMSO PKI DMSO PKI DMSO Brefeldin A Fig. S6d α-actinin KDa VASP 55 KDa


11 Fig. 5a Fig. 5c sh WT S142/143A 55 KDa α-actinin 130 KDa WT S142/143A Long exposure Long exposure SH WT S142/143A Short exposure Short exposure Supplementary Fig.9. The uncropped scans of western blots.
Supplemental Figures:
 Supplemental Figures: Figure 1: Intracellular distribution of VWF by electron microscopy in human endothelial cells. a) Immunogold labeling of LC3 demonstrating an LC3-positive autophagosome (white arrow)
SUPPLEMENTARY FIGURES
 SUPPLEMENTARY FIGURES Supplementary Figure S1: Fibroblast-induced elongation of cancer cells requires direct contact with living fibroblasts. A. Representative images of HT29-GFP cultured in the presence
El Azzouzi et al., http ://www.jcb.org /cgi /content /full /jcb /DC1
 Supplemental material JCB El Azzouzi et al., http ://www.jcb.org /cgi /content /full /jcb.201510043 /DC1 THE JOURNAL OF CELL BIOLOGY Figure S1. Acquisition of -phluorin correlates negatively with podosome
(a) Significant biological processes (upper panel) and disease biomarkers (lower panel)
 Significant biological processes (upper panel) and disease biomarkers (lower panel)") Supplementary Figure 1. Functional enrichment analyses of secretomic proteins. (a) Significant biological processes (upper panel) and disease biomarkers (lower panel) 2 involved by hrab37-mediated secretory
Supplementary Figure 1. Functional enrichment analyses of secretomic proteins. (a) Significant biological processes (upper panel) and disease biomarkers (lower panel) 2 involved by hrab37-mediated secretory
Supplementary Figure 1 Expression of Crb3 in mouse sciatic nerve: biochemical analysis (a) Schematic of Crb3 isoforms, ERLI and CLPI, indicating the
 Schematic of Crb3 isoforms, ERLI and CLPI, indicating the") Supplementary Figure 1 Expression of Crb3 in mouse sciatic nerve: biochemical analysis (a) Schematic of Crb3 isoforms, ERLI and CLPI, indicating the location of the transmembrane (TM), FRM binding (FB)
Supplementary Figure 1 Expression of Crb3 in mouse sciatic nerve: biochemical analysis (a) Schematic of Crb3 isoforms, ERLI and CLPI, indicating the location of the transmembrane (TM), FRM binding (FB)
Cells and reagents. Synaptopodin knockdown (1) and dynamin knockdown (2)
 and dynamin knockdown (2)") Supplemental Methods Cells and reagents. Synaptopodin knockdown (1) and dynamin knockdown (2) podocytes were cultured as described previously. Staurosporine, angiotensin II and actinomycin D were all obtained
Supplemental Methods Cells and reagents. Synaptopodin knockdown (1) and dynamin knockdown (2) podocytes were cultured as described previously. Staurosporine, angiotensin II and actinomycin D were all obtained
T H E J O U R N A L O F C E L L B I O L O G Y
 Supplemental material Edens and Levy, http://www.jcb.org/cgi/content/full/jcb.201406004/dc1 T H E J O U R N A L O F C E L L B I O L O G Y Figure S1. Nuclear shrinking does not depend on the cytoskeleton
Supplementary information. The Light Intermediate Chain 2 Subpopulation of Dynein Regulates Mitotic. Spindle Orientation
 Supplementary information The Light Intermediate Chain 2 Subpopulation of Dynein Regulates Mitotic Spindle Orientation Running title: Dynein LICs distribute mitotic functions. Sagar Mahale a, d, *, Megha
T H E J O U R N A L O F C E L L B I O L O G Y
 T H E J O U R N A L O F C E L L B I O L O G Y Supplemental material Lu et al., http://www.jcb.org/cgi/content/full/jcb.201012063/dc1 Figure S1. Kinetics of nuclear envelope assembly, recruitment of Nup133
Supplementary Figure S1 (a) (b)
 (b)") Supplementary Figure S1: IC87114 does not affect basal Ca 2+ level nor nicotineinduced Ca 2+ influx. (a) Bovine chromaffin cells were loaded with Fluo-4AM (1 μm) in buffer A containing 0.02% of pluronic
Supplementary Figure S1: IC87114 does not affect basal Ca 2+ level nor nicotineinduced Ca 2+ influx. (a) Bovine chromaffin cells were loaded with Fluo-4AM (1 μm) in buffer A containing 0.02% of pluronic
SUPPLEMENTARY INFORMATION
 DOI: 10.1038/ncb2988 Supplementary Figure 1 Kif7 L130P encodes a stable protein that does not localize to cilia tips. (a) Immunoblot with KIF7 antibody in cell lysates of wild-type, Kif7 L130P and Kif7
Santulli G. et al. A microrna-based strategy to suppress restenosis while preserving endothelial function
 ONLINE DATA SUPPLEMENTS Santulli G. et al. A microrna-based strategy to suppress restenosis while preserving endothelial function Supplementary Figures Figure S1 Effect of Ad-p27-126TS on the expression
Supplementary Figure S1. Distinct compartmentalization of proinsulin in obese db/db mouse islet ß- cells.
 Supplementary Figure S1. Distinct compartmentalization of proinsulin in obese db/db mouse islet ß- cells. Pancreata from 16-weeks-old 6J +/+, 6J db/db, KS +/+ and KS db/db mice were harvested, fixed with
SUPPLEMENTARY LEGENDS...
 TABLE OF CONTENTS SUPPLEMENTARY LEGENDS... 2 11 MOVIE S1... 2 FIGURE S1 LEGEND... 3 FIGURE S2 LEGEND... 4 FIGURE S3 LEGEND... 5 FIGURE S4 LEGEND... 6 FIGURE S5 LEGEND... 7 FIGURE S6 LEGEND... 8 FIGURE
Supplementary Figure 1. Rab27a-KD inhibits speed and persistence of HEp3 cells migrating in the chick CAM. (a) Western blot analysis of Rab27a
 Western blot analysis of Rab27a") Supplementary Figure 1. Rab27a-KD inhibits speed and persistence of HEp3 cells migrating in the chick CAM. (a) Western blot analysis of Rab27a expression in GFP-expressing HEp3 cells. (b) Representative
Supplementary Figure 1. Rab27a-KD inhibits speed and persistence of HEp3 cells migrating in the chick CAM. (a) Western blot analysis of Rab27a expression in GFP-expressing HEp3 cells. (b) Representative
SUPPLEMENTARY INFORMATION
 DOI:.38/ncb3399 a b c d FSP DAPI 5mm mm 5mm 5mm e Correspond to melanoma in-situ Figure a DCT FSP- f MITF mm mm MlanaA melanoma in-situ DCT 5mm FSP- mm mm mm mm mm g melanoma in-situ MITF MlanaA mm mm
Supplementary Figure 1. Normal T lymphocyte populations in Dapk -/- mice. (a) Normal thymic development in Dapk -/- mice. Thymocytes from WT and Dapk
 Normal thymic development in Dapk -/- mice. Thymocytes from WT and Dapk") Supplementary Figure 1. Normal T lymphocyte populations in Dapk -/- mice. (a) Normal thymic development in Dapk -/- mice. Thymocytes from WT and Dapk -/- mice were stained for expression of CD4 and CD8.
Supplementary Figure 1. Normal T lymphocyte populations in Dapk -/- mice. (a) Normal thymic development in Dapk -/- mice. Thymocytes from WT and Dapk -/- mice were stained for expression of CD4 and CD8.
Supplemental Materials Molecular Biology of the Cell
 Supplemental Materials Molecular Biology of the Cell Garcia-Alvarez et al. Supplementary Figure Legends Figure S1.Expression and RNAi-mediated silencing of STIM1 in hippocampal neurons (DIV, days in vitro).
SUPPLEMENTARY INFORMATION
 SUPPLEMENTARY INFORMATION Nanoneedle-Mediated Stimulation of Cell Mechanotransduction Machinery Catherine S Hansel, Spencer W Crowder, Samuel Cooper, Sahana Gopal, Maria João Pardelha da Cruz, Leonardo
MII. Supplement Figure 1. CapZ β2. Merge. 250ng. 500ng DIC. Merge. Journal of Cell Science Supplementary Material. GFP-CapZ β2 DNA
 A GV GVBD MI DNA CapZ β2 CapZ β2 Merge B DIC GFP-CapZ β2 Merge CapZ β2-gfp 250ng 500ng Supplement Figure 1. MII A early MI late MI Control RNAi CapZαβ DNA Actin Tubulin B Phalloidin Intensity(A.U.) n=10
Rescue of mutant rhodopsin traffic by metformin-induced AMPK activation accelerates photoreceptor degeneration Athanasiou et al
 Supplementary Material Rescue of mutant rhodopsin traffic by metformin-induced AMPK activation accelerates photoreceptor degeneration Athanasiou et al Supplementary Figure 1. AICAR improves P23H rod opsin
Type of file: PDF Title of file for HTML: Supplementary Information Description: Supplementary Figures
 Type of file: PDF Title of file for HTML: Supplementary Information Description: Supplementary Figures Type of file: MOV Title of file for HTML: Supplementary Movie 1 Description: NLRP3 is moving along
SUPPLEMENTARY INFORMATION
 doi: 10.1038/nature06994 A phosphatase cascade by which rewarding stimuli control nucleosomal response A. Stipanovich*, E. Valjent*, M. Matamales*, A. Nishi, J.H. Ahn, M. Maroteaux, J. Bertran-Gonzalez,
X P. Supplementary Figure 1. Nature Medicine: doi: /nm Nilotinib LSK LT-HSC. Cytoplasm. Cytoplasm. Nucleus. Nucleus
 a b c Supplementary Figure 1 c-kit-apc-eflu780 Lin-FITC Flt3-Linc-Kit-APC-eflu780 LSK Sca-1-PE-Cy7 d e f CD48-APC LT-HSC CD150-PerCP-cy5.5 g h i j Cytoplasm RCC1 X Exp 5 mir 126 SPRED1 SPRED1 RAN P SPRED1
Supplementary Figure 1. Characterization of NMuMG-ErbB2 and NIC breast cancer cells expressing shrnas targeting LPP. NMuMG-ErbB2 cells (a) and NIC
 and NIC") Supplementary Figure 1. Characterization of NMuMG-ErbB2 and NIC breast cancer cells expressing shrnas targeting LPP. NMuMG-ErbB2 cells (a) and NIC cells (b) were engineered to stably express either a LucA-shRNA
Supplementary Figure 1. Characterization of NMuMG-ErbB2 and NIC breast cancer cells expressing shrnas targeting LPP. NMuMG-ErbB2 cells (a) and NIC cells (b) were engineered to stably express either a LucA-shRNA
Supplemental Information. Autophagy in Oncogenic K-Ras. Promotes Basal Extrusion. of Epithelial Cells by Degrading S1P. Current Biology, Volume 24
 Current Biology, Volume 24 Supplemental Information Autophagy in Oncogenic K-Ras Promotes Basal Extrusion of Epithelial Cells by Degrading S1P Gloria Slattum, Yapeng Gu, Roger Sabbadini, and Jody Rosenblatt
Supplementary Figure 1.
 Supplementary Figure 1. Increased β cell mass and islet diameter in βtsc2 -/- mice up to 35 weeks A: Reconstruction of multiple anti-insulin immunofluorescence images showing differences in β cell mass
JCB. Supplemental material. Gu et al.,
 Supplemental material Gu et al., http://www.jcb.org/cgi/content/full/jcb.201010075/dc1 T H E J O U R N A L O F C E L L B I O L O G Y Figure S1. S1P directly induces actin assembly. Actin assembly at the
Supplementary Materials for
 www.sciencetranslationalmedicine.org/cgi/content/full/4/117/117ra8/dc1 Supplementary Materials for Notch4 Normalization Reduces Blood Vessel Size in Arteriovenous Malformations Patrick A. Murphy, Tyson
SUPPLEMENTARY INFORMATION
 DOI: 10.1038/ncb2607 Figure S1 Elf5 loss promotes EMT in mammary epithelium while Elf5 overexpression inhibits TGFβ induced EMT. (a, c) Different confocal slices through the Z stack image. (b, d) 3D rendering
Supplemental Figure 1. Quantification of proliferation in thyroid of WT, Ctns -/- and grafted
 Supplemental Figure 1. Quantification of proliferation in thyroid of WT, Ctns -/- and grafted Ctns -/- mice. Cells immunolabeled for the proliferation marker (Ki-67) were counted in sections (n=3 WT, n=4
Title of file for HTML: Supplementary Information Description: Supplementary Figures and Supplementary Table
 Title of file for HTML: Supplementary Information Description: Supplementary Figures and Supplementary Table Title of file for HTML: Peer Review File Description: Innate Scavenger Receptor-A regulates
T H E J O U R N A L O F C E L L B I O L O G Y
 T H E J O U R N A L O F C E L L B I O L O G Y Supplemental material Dunsch et al., http://www.jcb.org/cgi/content/full/jcb.201202112/dc1 Figure S1. Characterization of HMMR and CHICA antibodies. (A) HeLa
Supplementary Figure 1
 Supplementary Figure 1 Kif1a RNAi effect on basal progenitor differentiation Related to Figure 2. Representative confocal images of the VZ and SVZ of rat cortices transfected at E16 with scrambled or Kif1a
SUPPLEMENTARY INFORMATION
 DOI: 10.1038/ncb3021 Supplementary figure 1 Characterisation of TIMPless fibroblasts. a) Relative gene expression of TIMPs1-4 by real time quantitative PCR (RT-qPCR) in WT or ΔTimp fibroblasts (mean ±
Programmed necrosis, not apoptosis, is a key mediator of cell loss and DAMP-mediated inflammation in dsrna-induced retinal degeneration
 Programmed necrosis, not apoptosis, is a key mediator of cell loss and DAMP-mediated inflammation in dsrna-induced retinal degeneration The Harvard community has made this article openly available. Please
T H E J O U R N A L O F C E L L B I O L O G Y
 Supplemental material Chen et al., http://www.jcb.org/cgi/content/full/jcb.201210119/dc1 T H E J O U R N A L O F C E L L B I O L O G Y Figure S1. Lack of fast reversibility of UVR8 dissociation. (A) HEK293T
T H E J O U R N A L O F C E L L B I O L O G Y
 T H E J O U R N A L O F C E L L B I O L O G Y Supplemental material Amelio et al., http://www.jcb.org/cgi/content/full/jcb.201203134/dc1 Figure S1. mir-24 regulates proliferation and by itself induces
Supplemental information contains 7 movies and 4 supplemental Figures
 1 2 3 4 5 6 7 8 9 10 11 12 13 14 15 16 17 18 19 20 21 22 23 24 25 26 27 Supplemental information contains 7 movies and 4 supplemental Figures Movies: Movie 1. Single virus tracking of A4-mCherry-WR MV
Supplementary Figure 1. Mother centrioles can reduplicate while in the close association
 C1-GFP distance (nm) C1-GFP distance (nm) a arrested HeLa cell expressing C1-GFP and Plk1TD-RFP -3 s 1 2 3 4 5 6 7 8 9 11 12 13 14 16 17 18 19 2 21 22 23 24 26 27 28 29 3 b 9 8 7 6 5 4 3 2 arrested HeLa
Nature Neuroscience: doi: /nn Supplementary Figure 1
 Supplementary Figure 1 Subcellular segregation of VGluT2-IR and TH-IR within the same VGluT2-TH axon (wild type rats). (a-e) Serial sections of a dual VGluT2-TH labeled axon. This axon (blue outline) has
SUPPLEMENTARY INFORMATION
 DOI: 10.1038/ncb2535 Figure S1 SOX10 is expressed in human giant congenital nevi and its expression in human melanoma samples suggests that SOX10 functions in a MITF-independent manner. a, b, Representative
Nature Structural and Molecular Biology: doi: /nsmb Supplementary Figure 1
 Supplementary Figure 1 Mutational analysis of the SA2-Scc1 interaction in vitro and in human cells. (a) Autoradiograph (top) and Coomassie stained gel (bottom) of 35 S-labeled Myc-SA2 proteins (input)
SUPPLEMENTARY INFORMATION
 doi:10.1038/nature12652 Supplementary Figure 1. PRDM16 interacts with endogenous EHMT1 in brown adipocytes. Immunoprecipitation of PRDM16 complex by flag antibody (M2) followed by Western blot analysis
Supplementary Figure 1. Confocal immunofluorescence showing mitochondrial translocation of Drp1. Cardiomyocytes treated with H 2 O 2 were prestained
 Supplementary Figure 1. Confocal immunofluorescence showing mitochondrial translocation of Drp1. Cardiomyocytes treated with H 2 O 2 were prestained with MitoTracker (red), then were immunostained with
SUPPLEMENTARY INFORMATION
 DOI: 1.138/ncb3355 a S1A8 + cells/ total.1.8.6.4.2 b S1A8/?-Actin c % T-cell proliferation 3 25 2 15 1 5 T cells Supplementary Figure 1 Inter-tumoral heterogeneity of MDSC accumulation in mammary tumor
Downregulation of the small GTPase SAR1A: a key event underlying alcohol-induced Golgi fragmentation in hepatocytes
 Downregulation of the small GTPase SAR1A: a key event underlying alcohol-induced Golgi fragmentation in hepatocytes Armen Petrosyan 1*, Pi-Wan Cheng 1,3, Dahn L. Clemens 2,3 & Carol A. Casey 2,3 1 Department
Supplemental Materials. STK16 regulates actin dynamics to control Golgi organization and cell cycle
 Supplemental Materials STK16 regulates actin dynamics to control Golgi organization and cell cycle Juanjuan Liu 1,2,3, Xingxing Yang 1,3, Binhua Li 1, Junjun Wang 1,2, Wenchao Wang 1, Jing Liu 1, Qingsong
J. Cell Sci. 129: doi: /jcs : Supplementary information
 Movie 1. AgLDL is contained in small sub-regions of the lysosomal synapse that are acidic. J774 cells were incubated with agldl dual labeled with a ph sensitive and a ph insensitive fluorophore for 1 hr.
Supplementary Figure 1. SA-β-Gal positive senescent cells in various cancer tissues. Representative frozen sections of breast, thyroid, colon and
 Supplementary Figure 1. SA-β-Gal positive senescent cells in various cancer tissues. Representative frozen sections of breast, thyroid, colon and stomach cancer were stained with SA-β-Gal and nuclear fast
Supplementary Figure 1
 Supplementary Figure 1 AAV-GFP injection in the MEC of the mouse brain C57Bl/6 mice at 4 months of age were injected with AAV-GFP into the MEC and sacrificed at 7 days post injection (dpi). (a) Brains
Supplementary Figure 1. Validation of astrocytes. Primary astrocytes were
 Supplementary Figure 1. Validation of astrocytes. Primary astrocytes were separated from the glial cultures using a mild trypsinization protocol. Anti-glial fibrillary acidic protein (GFAP) immunofluorescent
Supplementary Figure 1
 Supplementary Figure 1 a γ-h2ax MDC1 RNF8 FK2 BRCA1 U2OS Cells sgrna-1 ** 60 sgrna 40 20 0 % positive Cells (>5 foci per cell) b ** 80 sgrna sgrna γ-h2ax MDC1 γ-h2ax RNF8 FK2 MDC1 BRCA1 RNF8 FK2 BRCA1
GFP/Iba1/GFAP. Brain. Liver. Kidney. Lung. Hoechst/Iba1/TLR9!
 Supplementary information a +KA Relative expression d! Tlr9 5!! 5! NSC Neuron Astrocyte Microglia! 5! Tlr7!!!! NSC Neuron Astrocyte! GFP/Sβ/! Iba/Hoechst Microglia e Hoechst/Iba/TLR9! GFP/Iba/GFAP f Brain
Supplementary Materials for
 www.sciencesignaling.org/cgi/content/full/6/283/ra57/dc1 Supplementary Materials for JNK3 Couples the Neuronal Stress Response to Inhibition of Secretory Trafficking Guang Yang,* Xun Zhou, Jingyan Zhu,
Tanimoto et al., http ://www.jcb.org /cgi /content /full /jcb /DC1
 Supplemental material JCB Tanimoto et al., http ://www.jcb.org /cgi /content /full /jcb.201510064 /DC1 THE JOURNAL OF CELL BIOLOGY Figure S1. Method for aster 3D tracking, extended characterization of
Nature Neuroscience: doi: /nn Supplementary Figure 1. PICALM expression in brain capillary endothelium in human brain and in mouse brain.
 Supplementary Figure 1 PICALM expression in brain capillary endothelium in human brain and in mouse brain. a, Double immunostaining for PICALM (red, left) and lectin positive endothelial profiles (blue,
Supplementary Figure 1. Nature Neuroscience: doi: /nn.4547
 Supplementary Figure 1 Characterization of the Microfetti mouse model. (a) Gating strategy for 8-color flow analysis of peripheral Ly-6C + monocytes from Microfetti mice 5-7 days after TAM treatment. Living
Supplementary Information. Cofilin Regulates Nuclear Architecture through a Myosin-II Dependent Mechanotransduction Module
 Supplementary Information Cofilin Regulates Nuclear Architecture through a Myosin-II Dependent Mechanotransduction Module O Neil Wiggan, Bryce Schroder, Diego Krapf, James R. Bamurg and Jennifer G. DeLuca
Prolonged mitotic arrest induces a caspase-dependent DNA damage
 SUPPLEMENTARY INFORMATION Prolonged mitotic arrest induces a caspase-dependent DNA damage response at telomeres that determines cell survival Karolina O. Hain, Didier J. Colin, Shubhra Rastogi, Lindsey
T H E J O U R N A L O F C E L L B I O L O G Y
 Supplemental material Brooks and Wallingford, http://www.jcb.org/cgi/content/full/jcb.201204072/dc1 T H E J O U R N A L O F C E L L B I O L O G Y Figure S1. Quantification of ciliary compartments in control
Supplementary Material
 Supplementary Material accompanying the manuscript Interleukin 37 is a fundamental inhibitor of innate immunity Marcel F Nold, Claudia A Nold-Petry, Jarod A Zepp, Brent E Palmer, Philip Bufler & Charles
Supplementary Figure 1. PD-L1 is glycosylated in cancer cells. (a) Western blot analysis of PD-L1 in breast cancer cells. (b) Western blot analysis
 Western blot analysis of PD-L1 in breast cancer cells. (b) Western blot analysis") Supplementary Figure 1. PD-L1 is glycosylated in cancer cells. (a) Western blot analysis of PD-L1 in breast cancer cells. (b) Western blot analysis of PD-L1 in ovarian cancer cells. (c) Western blot analysis
Supplementary Figure 1. PD-L1 is glycosylated in cancer cells. (a) Western blot analysis of PD-L1 in breast cancer cells. (b) Western blot analysis of PD-L1 in ovarian cancer cells. (c) Western blot analysis
Endogenous TNFα orchestrates the trafficking of neutrophils into and within lymphatic vessels during acute inflammation
 SUPPLEMENTARY INFORMATION Endogenous TNFα orchestrates the trafficking of neutrophils into and within lymphatic vessels during acute inflammation Samantha Arokiasamy 1,2, Christian Zakian 1, Jessica Dilliway
genome edited transient transfection, CMV promoter
 Supplementary Figure 1. In the absence of new protein translation, overexpressed caveolin-1-gfp is degraded faster than caveolin-1-gfp expressed from the endogenous caveolin 1 locus % loss of total caveolin-1-gfp
Supplements. Figure S1. B Phalloidin Alexa488
 Supplements A, DMSO, PP2, PP3 Crk-myc Figure S1. (A) Src kinase activity is necessary for recruitment of Crk to Nephrin cytoplasmic domain. Human podocytes expressing /7-NephrinCD () were treated with
Supplementary Figure 1. Establishment of prostacyclin-secreting hmscs. (a) PCR showed the integration of the COX-1-10aa-PGIS transgene into the
 PCR showed the integration of the COX-1-10aa-PGIS transgene into the") Supplementary Figure 1. Establishment of prostacyclin-secreting hmscs. (a) PCR showed the integration of the COX-1-10aa-PGIS transgene into the genomic DNA of hmscs (PGI2- hmscs). Native hmscs and plasmid
Supplementary Figure 1. Establishment of prostacyclin-secreting hmscs. (a) PCR showed the integration of the COX-1-10aa-PGIS transgene into the genomic DNA of hmscs (PGI2- hmscs). Native hmscs and plasmid
SUPPLEMENTARY INFORMATION
 SUPPLEMENTARY INFORMATION doi:1.138/nature9814 a A SHARPIN FL B SHARPIN ΔNZF C SHARPIN T38L, F39V b His-SHARPIN FL -1xUb -2xUb -4xUb α-his c Linear 4xUb -SHARPIN FL -SHARPIN TF_LV -SHARPINΔNZF -SHARPIN
Ahtiainen et al., http :// /cgi /content /full /jcb /DC1
 Supplemental material JCB Ahtiainen et al., http ://www.jcb.org /cgi /content /full /jcb.201512074 /DC1 THE JOURNAL OF CELL BIOLOGY Figure S1. Distinct distribution of different cell cycle phases in the
Supplementary Materials. for Garmy-Susini, et al, Integrin 4 1 signaling is required for lymphangiogenesis and tumor metastasis
 Supplementary Materials for Garmy-Susini, et al, Integrin 4 1 signaling is required for lymphangiogenesis and tumor metastasis 1 Supplementary Figure Legends Supplementary Figure 1: Integrin expression
Supplementary Information. Tissue-wide immunity against Leishmania. through collective production of nitric oxide
 Supplementary Information Tissue-wide immunity against Leishmania through collective production of nitric oxide Romain Olekhnovitch, Bernhard Ryffel, Andreas J. Müller and Philippe Bousso Supplementary
Fang et al. NMuMG. PyVmT unstained Anti-CCR2-PE MDA-MB MCF MCF10A
 A NMuMG PyVmT 16.5+.5 47.+7.2 Fang et al. unstained Anti-CCR2-PE 4T1 Control 37.6+6.3 56.1+.65 MCF1A 16.1+3. MCF-7 3.1+5.4 MDA-M-231 42.1+5.5 unstained Secondary antibody only Anti-CCR2 SUPPLEMENTAL FIGURE
Influenza virus exploits tunneling nanotubes for cell-to-cell spread
 Supplementary Information Influenza virus exploits tunneling nanotubes for cell-to-cell spread Amrita Kumar 1, Jin Hyang Kim 1, Priya Ranjan 1, Maureen G. Metcalfe 2, Weiping Cao 1, Margarita Mishina 1,
Nature Structural & Molecular Biology: doi: /nsmb Supplementary Figure 1. Differential expression of mirnas from the pri-mir-17-92a locus.
 Supplementary Figure 1 Differential expression of mirnas from the pri-mir-17-92a locus. (a) The mir-17-92a expression unit in the third intron of the host mir-17hg transcript. (b,c) Impact of knockdown
Supplementary Figure 1. Properties of various IZUMO1 monoclonal antibodies and behavior of SPACA6. (a) (b) (c) (d) (e) (f) (g) .
 (b) (c) (d) (e) (f) (g) .") Supplementary Figure 1. Properties of various IZUMO1 monoclonal antibodies and behavior of SPACA6. (a) The inhibitory effects of new antibodies (Mab17 and Mab18). They were investigated in in vitro fertilization
Supplementary Figure 1. Properties of various IZUMO1 monoclonal antibodies and behavior of SPACA6. (a) The inhibitory effects of new antibodies (Mab17 and Mab18). They were investigated in in vitro fertilization
ROCK/Cdc42-mediated microglial motility and gliapse formation lead to phagocytosis of degenerating dopaminergic neurons in vivo
 Supplementary Information ROCK/Cdc42-mediated microglial motility and gliapse formation lead to phagocytosis of degenerating dopaminergic neurons in vivo Carlos Barcia* 1,2, Carmen M Ros 1,2, Valentina
Supplementary Fig. S1. Schematic diagram of minigenome segments.
 open reading frame 1565 (segment 5) 47 (-) 3 5 (+) 76 101 125 149 173 197 221 246 287 open reading frame 890 (segment 8) 60 (-) 3 5 (+) 172 Supplementary Fig. S1. Schematic diagram of minigenome segments.
SUPPLEMENTARY FIGURES
 SUPPLEMENTARY FIGURES Supplementary Figure 1. (A) Left, western blot analysis of ISGylated proteins in Jurkat T cells treated with 1000U ml -1 IFN for 16h (IFN) or left untreated (CONT); right, western
mm Distance (mm)
") b a Magnet Illumination Coverslips MPs Objective 2575 µm 1875 µm 1575 µm 1075 µm 875 µm 545 µm 20µm 2 3 0.5 0.3mm 1 1000 100 10 1 0.1 1000 100 10 1 0.1 Field Induction (Gauss) 1.5 0 5 10 15 20 Distance
b a Magnet Illumination Coverslips MPs Objective 2575 µm 1875 µm 1575 µm 1075 µm 875 µm 545 µm 20µm 2 3 0.5 0.3mm 1 1000 100 10 1 0.1 1000 100 10 1 0.1 Field Induction (Gauss) 1.5 0 5 10 15 20 Distance
Nature Immunology: doi: /ni eee Supplementary Figure 1
 eee Supplementary Figure 1 Hyphae induce NET release, but yeast do not. (a) NET release by human peripheral neutrophils stimulated with a hgc1 yeast-locked C. albicans mutant (yeast) or pre-formed WT C.
Relative SOD1 activity. Relative SOD2 activity. Relative SOD activity (Infected:Mock) + CP + DDC
 + CP + DDC") Supplementary Figure 1. SOD1 activity is significantly increased relative to SOD1 levels. SOD1 and SOD2 activities in the infected mork13 cells are shown normalised to their corresponding levels and relative
Supplementary Figure 1. SOD1 activity is significantly increased relative to SOD1 levels. SOD1 and SOD2 activities in the infected mork13 cells are shown normalised to their corresponding levels and relative
Macrophages form functional vascular mimicry channels in vivo. SI Figures and Legend
 Macrophages form functional vascular mimicry channels in vivo Authors: *Faith H. Barnett, *Mauricio Rosenfeld, Malcolm Wood, William Kiosses, Yoshihiko Usui, Valentina Marchetti, Edith Aguilar, and Martin
293T cells were transfected with indicated expression vectors and the whole-cell extracts were subjected
 SUPPLEMENTARY INFORMATION Supplementary Figure 1. Formation of a complex between Slo1 and CRL4A CRBN E3 ligase. (a) HEK 293T cells were transfected with indicated expression vectors and the whole-cell
Nature Immunology: doi: /ni.3631
 Supplementary Figure 1 SPT analyses of Zap70 at the T cell plasma membrane. (a) Total internal reflection fluorescent (TIRF) excitation at 64-68 degrees limits single molecule detection to 100-150 nm above
Supplementary Figures
 Supplementary Figures Supplementary Fig. 1. Galectin-3 is present within tumors. (A) mrna expression levels of Lgals3 (galectin-3) and Lgals8 (galectin-8) in the four classes of cell lines as determined
SUPPLEMENTARY INFORMATION
 SUPPLEMENTARY INFORMATION Supplementary Figure 1. The expression of ephrin-b2 H2BGFP persists in the post-hearingonset organ of Corti and is specifically restricted to supporting cells. Sox2 immunolabeling
Supplementary Information
 Nature Immunology doi:1.138/ni.2477 Supplementary Information Capillary and arteriolar pericytes attract innate leukocytes exiting through venules and instruct them with pattern recognition and motility
T H E J O U R N A L O F C E L L B I O L O G Y
 Supplemental material Beck et al., http://www.jcb.org/cgi/content/full/jcb.201011027/dc1 T H E J O U R N A L O F C E L L B I O L O G Y Figure S1. Membrane binding of His-tagged proteins to Ni-liposomes.
Tbk1-TKO! DN cells (%)! 15! 10!
! 15! 10!") a! T Cells! TKO! B Cells! TKO! b! CD4! 8.9 85.2 3.4 2.88 CD8! Tbk1-TKO! 1.1 84.8 2.51 2.54 c! DN cells (%)! 4 3 2 1 DP cells (%)! 9 8 7 6 CD4 + SP cells (%)! 5 4 3 2 1 5 TKO! TKO! TKO! TKO! 15 1 5 CD8
a! T Cells! TKO! B Cells! TKO! b! CD4! 8.9 85.2 3.4 2.88 CD8! Tbk1-TKO! 1.1 84.8 2.51 2.54 c! DN cells (%)! 4 3 2 1 DP cells (%)! 9 8 7 6 CD4 + SP cells (%)! 5 4 3 2 1 5 TKO! TKO! TKO! TKO! 15 1 5 CD8
SUPPLEMENTARY INFORMATION
 doi:10.1038/nature11095 Supplementary Table 1. Summary of the binding between Angptls and various Igdomain containing receptors as determined by flow cytometry analysis. The results were summarized from
SUPPLEMENTARY INFORMATION
 Supplemental Figure 1. Furin is efficiently deleted in CD4 + and CD8 + T cells. a, Western blot for furin and actin proteins in CD4cre-fur f/f and fur f/f Th1 cells. Wild-type and furin-deficient CD4 +
Supplementary Materials for
 advances.sciencemag.org/cgi/content/full/3/8/e1700521/dc1 Supplementary Materials for Functional vascularized lung grafts for lung bioengineering N. Valerio Dorrello, Brandon A. Guenthart, John D. O Neill,
Supplementary Data Dll4-containing exosomes induce capillary sprout retraction ina 3D microenvironment
 Supplementary Data Dll4-containing exosomes induce capillary sprout retraction ina 3D microenvironment Soheila Sharghi-Namini 1, Evan Tan 1,2, Lee-Ling Sharon Ong 1, Ruowen Ge 2 * and H. Harry Asada 1,3
Supplementary Figure S1
 Supplementary Figure S1 Supplementary Figure S1. PARP localization patterns using GFP-PARP and PARP-specific antibody libraries GFP-PARP localization in non-fixed (A) and formaldehyde fixed (B) GFP-PARPx
 Supplementary Figure Legends Supplementary Figure S1. Aurora-A is essential for SAC establishment in early mitosis. (a-c) RPE cells were treated with DMSO (a), MLN8237 (b) or BI2536 (c) for Two hours.
SUPPLEMENTARY FIGURES
 SUPPLEMENTARY FIGURES 1 Supplementary Figure 1, Adult hippocampal QNPs and TAPs uniformly express REST a-b) Confocal images of adult hippocampal mouse sections showing GFAP (green), Sox2 (red), and REST
Exosomes function in antigen presentation during an in vivo Mycobacterium tuberculosis infection
 Exosomes function in antigen presentation during an in vivo Mycobacterium tuberculosis infection Victoria L. Smith, Yong Cheng, Barry R. Bryant and Jeffrey S. Schorey Supplementary Figure 1: Unprocessed
Supplementary Figure 1. mir124 does not change neuron morphology and synaptic
 Supplementary Figure 1. mir124 does not change neuron morphology and synaptic density. Hippocampal neurons were transfected with mir124 (containing DsRed) or DsRed as a control. 2 d after transfection,
TEB. Id4 p63 DAPI Merge. Id4 CK8 DAPI Merge
 a Duct TEB b Id4 p63 DAPI Merge Id4 CK8 DAPI Merge c d e Supplementary Figure 1. Identification of Id4-positive MECs and characterization of the Comma-D model. (a) IHC analysis of ID4 expression in the
Live cell imaging of trafficking of the chaperone complex vaccine to the ER. BMDCs were incubated with ER-Tracker Red (1 M) in staining solution for
 in staining solution for") Live cell imaging of trafficking of the chaperone complex vaccine to the ER. BMDCs were incubated with ER-Tracker Red (1 M) in staining solution for 15 min at 37 C and replaced with fresh complete medium.
Live cell imaging of trafficking of the chaperone complex vaccine to the ER. BMDCs were incubated with ER-Tracker Red (1 M) in staining solution for 15 min at 37 C and replaced with fresh complete medium.