Supplementary Figure 1 Validation of Per2 deletion in neuronal cells in N Per2 -/- mice. (a) Western blot from liver extracts of mice held under ad
|
|
|
- Colin Lynch
- 6 years ago
- Views:
Transcription

 Western blot from liver extracts of")


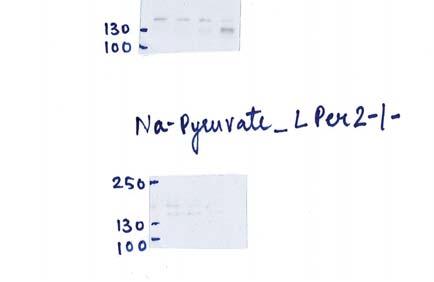
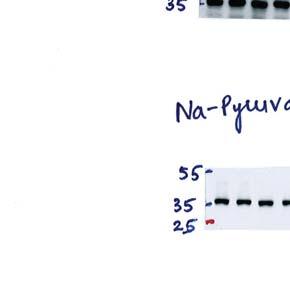
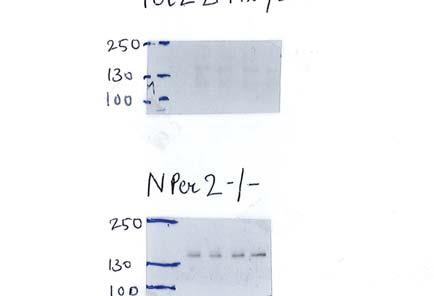
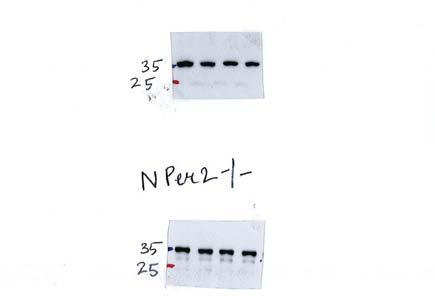
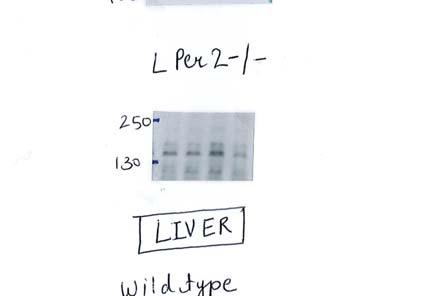
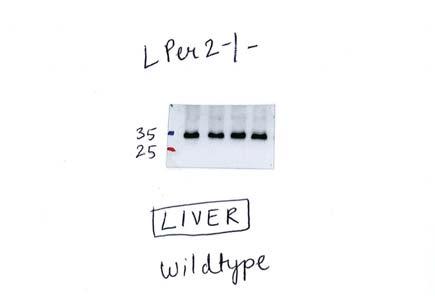
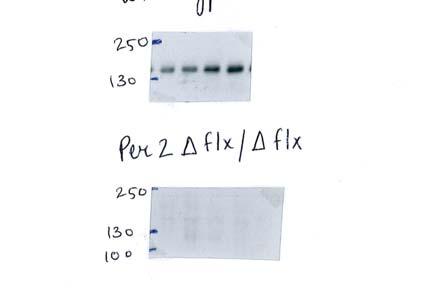
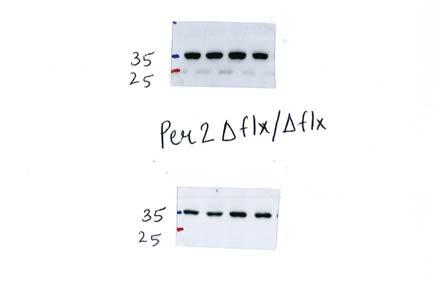
1 Supplementary Figure 1 Validation of Per2 deletion in neuronal cells in N Per2 -/- mice. (a) Western blot from liver extracts of mice held under ad libitum conditions detecting PER2 protein in brain and liver tissue of the investigated genotypes. GAPDH as control for each genotype is shown in the panels to the right. (b)
2 Immunohistochemistry in the Suprachiasmatic nucleus (SCN), Dorsomedial hypothalamus (DMH), Ventromedial hypothalamus (VMH) and Lateral hypothalamus (LH) of wild type, T Per2 -/- and N Per2 -/- mice at ZT12. Antibodies recognizing NeuN (marker for differentiated neurons) and Per2 are in red and green, respectively. A white rectangle indicates enlarged part of merged image. Scale bar: 200 μm (black), 50 μm (blue). (c) Double-plotted (Mean + SEM, n =3-4) mrna levels of circadian oscillator components Per2, Bmal1,Clock, Per1, Per2, RORα, Rev-erbα, Cry1 and Dbp in liver of N Per2 -/- mice under ad libitum condition at different times of the day. Transcript levels were measured by quantitative PCR and normalized to Gapdh.
 Total daily wheel-running activity under constant")

 T Per2 -/- animals become arrhythmic under prolonged")
 General activity and body temperature in DD")
 Quantification of general activity and change in body")
3 Supplementary Figure 2 Characterization of mice. (a) Total daily wheel-running activity under constant darkness (DD) and 12 h/12 hours dark (LD) conditions of wild-type, T Per2 -/-, N Per2 -/-, and L Per2 -/- mice (n = 5). Top bar indicates feeding schedule. (b) T Per2 -/- animals become arrhythmic under prolonged DD conditions. (c) General activity and body temperature in DD conditions under AL and RF of all genotypes. (d) Quantification of general activity and change in body temperature in DD under RF conditions (n = 5). (e) Plasma glucose at ZT4 and ZT16 under AL and
4 RF conditions (n = 4-6). (f) Circadian period of all genotypes determined by χ 2 - periodogram analysis (n = 6). (g) Quantification of phase shifts observed after a light pulse at CT14 and CT22 (n = 6). All values are mean ± SEM. One-way ANOVA with Tukey s multiple comparison test, *p < 0.05, **p < 0.01, ***p <
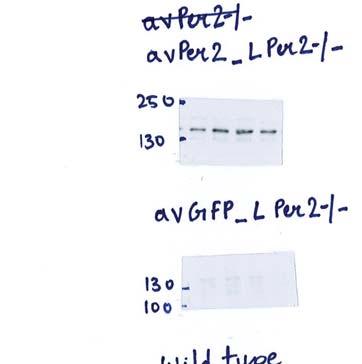
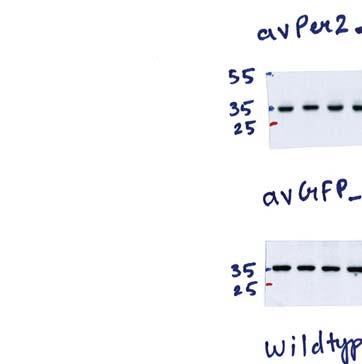
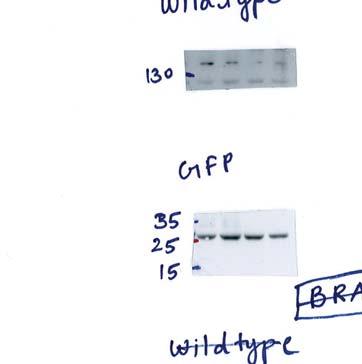
 PER2 protein in avper2 infected L Per2 -/- mice in various tissues. GAPDH as control for each genotype and treatment (right).")

5 Supplementary Figure 3 Lack of rescue of food anticipation in T Per2 -/- mice by adenoviral overexpression of Per2 in the liver. (a) PER2 protein in avper2 infected L Per2 -/- mice in various tissues. GAPDH as control for each genotype and treatment (right). (b) Examples of double plotted wheel-running actograms under ad libitum (AL) and restricted feeding (RF) conditions. The black arrow and blue line delineate daily access to food. The blue arrow indicates start of RF. avgfp = control adenovirus expressing green fluorescent protein (GFP). avper2 = adenovirus
6 expressing Per2. (c) Quantification of wheel-running activity of n = 6 animals for each genotype. Right panel shows quantification of data from ZT2-ZT4 (yellow area, left panel). (d) Corticosterone levels in plasma (n = 4). All values are mean ± SEM. One-way ANOVA with Tukey s multiple comparison test, *p < 0.05, **p < 0.01, ***p <
 and (b) Double plotted temporal expression profile of carnitin-palmitoyl transferase a (Cpt1a) and hydroxymethylglutaryl CoA synthase 2 (Hmgcs2) in liver tissue under ad libitum condition,")
7 Supplementary Figure 4 βohb and acetyl-coa levels after adenoviral Per2 and GFP expression in L Per2 -/- and T Per2 -/- mice. (a) and (b) Double plotted temporal expression profile of carnitin-palmitoyl transferase a (Cpt1a) and hydroxymethylglutaryl CoA synthase 2 (Hmgcs2) in liver tissue under ad libitum condition, respectively. Two-way ANOVA with Bonferroni multiple comparison test (n = 4-6) *p < 0.05, **p < 0.01 (c) βohb plasma levels in L Per2 +/+ (black), avgfp_l Per2 -/- (white) and avper2_l Per2 -/- mice (pink). (d) βohb plasma levels in T Per2 +/+
8 (black), avgfp_t Per2 -/- (white) and avper2_t Per2 -/- mice (red). (e) Acetyl-CoA levels in liver of L Per2 +/+ (black), avgfp_l Per2 -/- (white) and avper2_l Per2 -/- mice (pink). (f) Acetyl-CoA levels in liver of T Per2 +/+ (black), avgfp_t Per2 -/- (white) and avper2_t Per2 -/- mice (red). All values are mean ± SEM. One-way ANOVA with Tukey s multiple comparison test (n = 4), *p < 0.05, **p < 0.01.

 in wild type mice under ad libitum (AL) and")


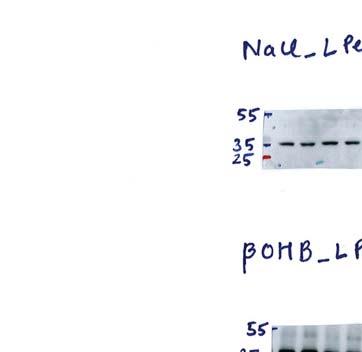
9 Supplementary Figure 5 Temporal profile of βohb in plasma and timed coconut oil application to mice. (a) Double-plotted plasma β-hydroxybutyrate (βohb) levels (n = 5-8) in wild type mice under ad libitum (AL) and restricted feeding (RF) condition at different times of the day. Arrows indicate food access. (b) Timed release of βohb (green) but not NaCl (white) in L Per2 -/- mice mimics the βohb levels in plasma of L Per2 +/+ control animals (black). Measured after 15 days
10 of infusion. (c) Top: Example of double plotted activity and body temperature actograms of coconut oil infused L Per2 -/- mice under ad libitum (AL) and restricted feeding (RF) conditions. Arrows indicate food access. Bottom: quantification of the activity profile (n = 4-6), yellow rectangle represents ZT2-4 time before food access (food anticipatory activity; FAA), and quantification of activity and body temperature, before food access (n = 4). Serum free fatty acid levels at ZT22 and ZT3 in wild type and coconut oil infused L Per2 -/- mice. All values are mean ± SEM. One-way ANOVA with Tukey s post test. *p < (d) Western blot showing PER2 levels in the liver after application of NaCl, βohb, and Sodium pyruvate respectively. GAPDH was used as control for each genotype and treatment.
 mrna levels of circadian oscillator components Bmal1 and Per1 in liver of")

11 Supplementary Figure 6 Overexpression of Per2 in the liver does not alter Bmal1 and Per1 expression. Double-plotted (Mean + SEM, n = 3-4) mrna levels of circadian oscillator components Bmal1 and Per1 in liver of wild-type, avgfp_l Per2 - /- and avper2_l Per2 -/- mice under restricted feeding conditions at different times of the day. Transcript levels were measured by quantitative PCR and normalized to Gapdh. Arrows indicate the time when food access started.

, yellow rectangle represents ZT2-4")
12 Supplementary Figure 7 Mistimed βohb release does not restore FAA in L Per2 -/- mice. Top: Example of double plotted activity and body temperature actograms of mistimed release of βohb (ZT4-ZT8) in L Per2 -/- mice. Arrows indicate the start of food access. Bottom: quantification of the activity profile (Mean + SEM, n = 4-6), yellow rectangle represents ZT2-4 time before food access (food anticipatory activity; FAA).

 mice and was")

13 Supplementary Figure 8 Liver-specific deletion of exon 6 from Per2. Deletion was obtained by crossing Per2 fl /Per2 fl and livercre + (Alb1-cre) mice and was verified by Illumina ultra-deep sequencing. Read height was adjusted to 25 for all four tracks. A red box indicates deletion of exon 6.
14 a
15 b
16 c
17 d
, corresponding to Fig.")
18 e Supplementary Figure 9 Original blots corresponding to Fig. 2a and Supplementary Figure 3a (a-b), corresponding to Fig. 4b and Supplementary Figure 5d (c), and corresponding to Fig. 1c and Supplementary Figure 1a (d-e).
19 Supplementary Table 1 Sample ID Number of sequences (fastq file) Percentage of mapped sequences The table shows the detailed characterization of the files. All files have been analyzed with FastQC (Andrews S. 2012) in order to demonstrate the quality of the data.
20 Supplementary Table 2 Gene Sense primer Anti-sense primer TM probe (5` FAM: BHQ1 3`) Gapdh CATGGCCTTCCGTGTTCC TA CCTGCTTCACCACCTTCT TGA CCGCCTGGAGAAACCTGCCA AGTAA Per2 TCCACAGCTACACCA CCCCTTA TTTCTCCTCCATGCA CTCCTGA CCGCTGCACACACTCCAGGGC G Hmgcs2 TGCCCTGGTGGTCTGTGG TG GCCTTGGGCCCGATCAGC AT CCCGAGTGGTAACGCCCGCCC C Cpt1a CCAGGCTACAGTGGGAC A GCCAAAGGTGTCAAATG GG CATCCCTAAGCAGTGCCAGTT Bmal1 CCAAGAAAGTATGGACA CAGACAAA GCATTCTTGATCCTTCCTT GGT TGACCCTCATGGAAGGTTAGA ATATGCAGAA Clock TTGCTCCACGGGAATCCT T GGAGGGAAAGTGCTC TGTTGTAG ACACAGCTCATCCTCTCTGCT GCCTTTC Per1 GGCATGATGCTGCTG ACCACG GGTGGGGATGGGCTC TGTGA TGGCCCTCCCTCACCTTAGCC TGTTCCT RORα CCTTCACCAACGGAG AGACT CCAGGT GGGATTTGG ATATG TCCCCAACCGTGTCCATGGC Rev-erbα GAAGTGTCTCTCCGTTGG CATGTCT CGCTCTGCATCTCGG CAAGCAT CTGTGCGTTTTGGGCGCATCC CCAAG Cry1 CTGGCGTGGAAGTCA TCGT CTGTCCGCCGAGTTCTAT G CGCATTTCACATACACTGTAT GACCTGGACA The table enlists the primers and TaqMan probes used for quantitative PCR analysis.
SOM Husse et al. Supplementary online material. Synaptotagmin10-Cre, a driver to disrupt clock genes in the SCN
 SOM Husse et al. Supplementary online material Synaptotagmin10-Cre, a driver to disrupt clock genes in the SCN Jana Husse, Xunlei Zhou, Anton Shostak, Henrik Oster and Gregor Eichele SOM Husse et al.,
Zhu et al, page 1. Supplementary Figures
 Zhu et al, page 1 Supplementary Figures Supplementary Figure 1: Visual behavior and avoidance behavioral response in EPM trials. (a) Measures of visual behavior that performed the light avoidance behavior
Supplementary Information for
 Supplementary Information for Involvement of urinary bladder Connexin43 and the circadian clock in the coordination of diurnal micturition rhythm Hiromitsu Negoro, 1,2 Akihiro Kanematsu, 1,3 Masao Doi,
ACC ELOVL MCAD. CPT1α 1.5 *** 0.5. Reverbα *** *** 0.5. Fasted. Refed
 Supplementary Figure A 8 SREBPc 6 5 FASN ELOVL6.5.5.5 ACC.5.5 CLOCK.5.5 CRY.5.5 PPARα.5.5 ACSL CPTα.5.5.5.5 MCAD.5.5 PEPCK.5.5 G6Pase 5.5.5.5 BMAL.5.5 Reverbα.5.5 Reverbβ.5.5 PER.5.5 PER B Fasted Refed
SUPPLEMENTARY INFORMATION
 DOI: 10.1038/ncb3461 In the format provided by the authors and unedited. Supplementary Figure 1 (associated to Figure 1). Cpeb4 gene-targeted mice develop liver steatosis. a, Immunoblot displaying CPEB4
Nature Genetics: doi: /ng.3731
 Supplementary Figure 1 Circadian profiles of Adarb1 transcript and ADARB1 protein in mouse tissues. (a) Overlap of rhythmic transcripts identified in the previous transcriptome analyses. The mouse liver
Entrainment of the mouse circadian clock by sub-acute physical and psychological
 Supplementary Information Entrainment of the mouse circadian clock by sub-acute physical and psychological Yu Tahara 1, Takuya Shiraishi 1, Yosuke Kikuchi 1, Atsushi Haraguchi 1, Daisuke Kuriki 1, Hiroyuki
a Supplementary Figure 1 Celastrol Withaferin A Individual drugs
 Supplementary Figure 1 a 17 27 HSPA1A SLC7A11 HMOX1 GSTA1 DUSP4 GML CHAC1 CDKN1A GSTA4 CA6 BHLHE41 NR1D1 HSPB1 PTX3 HP NFKBIA VDR MVD HAS2 ANGPT1 WDR6 TGFB3 IDI1 VCAM1 H1F HMGCS1 CXCL5 STEAP4 NOS2 b Enrichment
Title. Author(s)Ono, Daisuke; Honma, Ken-Ichi; Honma, Sato. CitationScientific reports, 5: Issue Date Doc URL
Ono, Daisuke; Honma, Ken-Ichi; Honma, Sato. CitationScientific reports, 5: Issue Date Doc URL") Title Circadian and ultradian rhythms of clock gene expres Author(s)Ono, Daisuke; Honma, Ken-Ichi; Honma, Sato CitationScientific reports, 5: 31 Issue Date 215-7-21 Doc URL http://hdl.handle.net/2115/59574
Title Circadian and ultradian rhythms of clock gene expres Author(s)Ono, Daisuke; Honma, Ken-Ichi; Honma, Sato CitationScientific reports, 5: 31 Issue Date 215-7-21 Doc URL http://hdl.handle.net/2115/59574
marker. DAPI labels nuclei. Flies were 20 days old. Scale bar is 5 µm. Ctrl is
 Supplementary Figure 1. (a) Nos is detected in glial cells in both control and GFAP R79H transgenic flies (arrows), but not in deletion mutant Nos Δ15 animals. Repo is a glial cell marker. DAPI labels
Targeting of the circadian clock via CK1δ/ε to improve glucose homeostasis in obesity
 Targeting of the circadian clock via CK1δ/ε to improve glucose homeostasis in obesity Peter S. Cunningham, Siobhán A. Ahern, Laura C. Smith, Carla S. da Silva Santos, Travis T. Wager and David A. Bechtold
Supplementary Figure 1.
 Supplementary Figure 1. FGF21 does not exert direct effects on hepatic glucose production. The liver explants from C57BL/6J mice (A, B) or primary rat hepatocytes (C, D) were incubated with rmfgf21 (2
Food Intake Regulation & the Clock. Mary ET Boyle, Ph. D. Department of Cognitive Science UCSD
 Food Intake Regulation & the Clock Mary ET Boyle, Ph. D. Department of Cognitive Science UCSD Circadian disruption affect multiple organ systems: The diagram provides examples of how circadian disruption
Supplementary Figures
 Supplementary Figures Supplementary Figure 1 Characterization of stable expression of GlucB and sshbira in the CT26 cell line (a) Live cell imaging of stable CT26 cells expressing green fluorescent protein
Transcription Regulation And Gene Expression in Eukaryotes (Cycle G2 # )
") Transcription Regulation And Gene Expression in Eukaryotes (Cycle G2 #13709-01) CIRCADIAN SIGNALING NETWORKS RG. Clerc May 19. 2010 www.fmi.ch/training/teaching Circadian rythms : most physiological processes
Transcription Regulation And Gene Expression in Eukaryotes (Cycle G2 #13709-01) CIRCADIAN SIGNALING NETWORKS RG. Clerc May 19. 2010 www.fmi.ch/training/teaching Circadian rythms : most physiological processes
CIRCADIAN SIGNALING NETWORKS
 Transcription Regulation And Gene Expression in Eukaryotes Cycle G2 (lecture 13709) FS 2014 P. Matthias and RG Clerc Roger G. Clerc 07.05.2014 CIRCADIAN SIGNALING NETWORKS Master pacemaker SCN «Slave clocks»
Supplementary Fig. 1: TBR2+ cells in different brain regions.
 Hip SVZ OB Cere Hypo Supplementary Fig. 1: TBR2 + cells in different brain regions. Three weeks after the last tamoxifen injection, TBR2 immunostaining images reveal a large reduction of TBR2 + cells in
SUPPLEMENTARY INFORMATION
 doi:10.1038/nature12652 Supplementary Figure 1. PRDM16 interacts with endogenous EHMT1 in brown adipocytes. Immunoprecipitation of PRDM16 complex by flag antibody (M2) followed by Western blot analysis
An epithelial circadian clock controls pulmonary inflammation and glucocorticoid action
 An epithelial circadian clock controls pulmonary inflammation and glucocorticoid action Supplementary Figure : Expression levels of toll-like receptor 4 (Tlr4) in muse lung does not change throughout the
Supplementary Table 1. List of primers used in this study
 Supplementary Table 1. List of primers used in this study Gene Forward primer Reverse primer Rat Met 5 -aggtcgcttcatgcaggt-3 5 -tccggagacacaggatgg-3 Rat Runx1 5 -cctccttgaaccactccact-3 5 -ctggatctgcctggcatc-3
Supplementary Information
 Supplementary Information Overexpression of Fto leads to increased food intake and results in obesity Chris Church, Lee Moir, Fiona McMurray, Christophe Girard, Gareth T Banks, Lydia Teboul, Sara Wells,
Title: Obesity in mice with adipocyte-specific deletion of clock component Bmal1
 Title: Obesity in mice with adipocyte-specific deletion of clock component Bmal1 Authors: Georgios K. Paschos, Salam Ibrahim, Wen-Liang Song, Takeshige Kunieda, Gregory Grant, Teresa M. Reyes, Christopher
Supplementary Table 1. The primers used for quantitative RT-PCR. Gene name Forward (5 > 3 ) Reverse (5 > 3 )
 Reverse (5 > 3 )") 770 771 Supplementary Table 1. The primers used for quantitative RT-PCR. Gene name Forward (5 > 3 ) Reverse (5 > 3 ) Human CXCL1 GCGCCCAAACCGAAGTCATA ATGGGGGATGCAGGATTGAG PF4 CCCCACTGCCCAACTGATAG TTCTTGTACAGCGGGGCTTG
770 771 Supplementary Table 1. The primers used for quantitative RT-PCR. Gene name Forward (5 > 3 ) Reverse (5 > 3 ) Human CXCL1 GCGCCCAAACCGAAGTCATA ATGGGGGATGCAGGATTGAG PF4 CCCCACTGCCCAACTGATAG TTCTTGTACAGCGGGGCTTG
Targeting of the attenuated diphtheria toxin (adta) into the melanopsin locus. a,
 into the melanopsin locus. a,") doi: 1.138/nature6829 a DTA HSV- TK PGK-Neo Targeting construct b kb.85.65 L WT adta/+ adta/ adta Melanopsin (Opn 4) Genomic Locus 1 kb.4 Supplementary Figure 1: Targeting of the attenuated diphtheria
doi: 1.138/nature6829 a DTA HSV- TK PGK-Neo Targeting construct b kb.85.65 L WT adta/+ adta/ adta Melanopsin (Opn 4) Genomic Locus 1 kb.4 Supplementary Figure 1: Targeting of the attenuated diphtheria
Supplemental Information. Menin Deficiency Leads to Depressive-like. Behaviors in Mice by Modulating. Astrocyte-Mediated Neuroinflammation
 Neuron, Volume 100 Supplemental Information Menin Deficiency Leads to Depressive-like Behaviors in Mice by Modulating Astrocyte-Mediated Neuroinflammation Lige Leng, Kai Zhuang, Zeyue Liu, Changquan Huang,
Supplementary Figures
 Supplementary Figures Supplementary Figure 1. Confirmation of Dnmt1 conditional knockout out mice. a, Representative images of sorted stem (Lin - CD49f high CD24 + ), luminal (Lin - CD49f low CD24 + )
Kidney. Heart. Lung. Sirt1. Gapdh. Mouse IgG DAPI. Rabbit IgG DAPI
 a e Na V 1.5 Ad-LacZ Ad- 110KD b Scn5a/ (relative to Ad-LacZ) f 150 100 50 0 p = 0.65 Ad-LacZ Ad- c Heart Lung Kidney Spleen 110KD d fl/fl c -/- DAPI 20 µm Na v 1.5 250KD fl/fl Rabbit IgG DAPI fl/fl Mouse
Supplementary Figure 1. Expression of the inducible tper2 is proportional to Dox/Tet concentration in Rosa-DTG/Per2 Per2-luc/wt MEFs.
 Supplementary Figure 1. Expression of the inducible tper2 is proportional to Dox/Tet concentration in Rosa-DTG/Per2 Per2-luc/wt MEFs. (a) Dose-responsive expression of tper2 by Dox. Note that there are
Supplementary Figure 1) GABAergic enhancement by leptin hyperpolarizes POMC neurons A) Representative recording samples showing the membrane
 GABAergic enhancement by leptin hyperpolarizes POMC neurons A) Representative recording samples showing the membrane") Supplementary Figure 1) GABAergic enhancement by leptin hyperpolarizes POMC neurons A) Representative recording samples showing the membrane potential recorded from POMC neurons following treatment with
Supplementary Figure 1) GABAergic enhancement by leptin hyperpolarizes POMC neurons A) Representative recording samples showing the membrane potential recorded from POMC neurons following treatment with
T. WU 1, Y. NI 1, F. ZHUGE 1, Z. FU 1. Introduction
 Physiol. Res. 59: 581-590, 2010 Resetting Process of Peripheral Circadian Gene Expression after the Combined Reversal of Feeding Schedule and Light/Dark Cycle Via a 24-h Light Period Transition in Rats
Transcription Regulation And Gene Expression in Eukaryotes FS 2016 Graduate Course G2
 Transcription Regulation And Gene Expression in Eukaryotes FS 2016 Graduate Course G2 P. Matthias and RG Clerc Pharmazentrum Hörsaal 2 16h15-18h00 CIRCADIAN SIGNALING NETWORKS Master pacemaker SCN «slave
SUPPLEMENTARY INFORMATION
 DOI: 10.1038/ncb2988 Supplementary Figure 1 Kif7 L130P encodes a stable protein that does not localize to cilia tips. (a) Immunoblot with KIF7 antibody in cell lysates of wild-type, Kif7 L130P and Kif7
KSRP is critical in governing hepatic lipid metabolism
 KSRP is critical in governing hepatic lipid metabolism through controlling Per2 expression Chu-Fang Chou, 1, * Xiaolin Zhu, 1, Yi-Yu Lin, * Karen L. Gamble, W. Timothy Garvey, and Ching-Yi Chen 2, * Department
Supplementary Materials for
 www.sciencesignaling.org/cgi/content/full/8/407/ra127/dc1 Supplementary Materials for Loss of FTO in adipose tissue decreases Angptl4 translation and alters triglyceride metabolism Chao-Yung Wang,* Shian-Sen
Supplementary Figure 1
 Combination index (CI) Supplementary Figure 1 2. 1.5 1. Ishikawa AN3CA Nou-1 Hec-18.5...2.4.6.8 1. Fraction affected (Fa) Supplementary Figure 1. The synergistic effect of PARP inhibitor and PI3K inhibitor
INVOLVEMENT OF TISSUE-TYPE PLASMINOGEN ACTIVATOR IN THE REGULATION OF CIRCADIAN RHYTHMS. A thesis submitted. to Kent State University in partial
 INVOLVEMENT OF TISSUE-TYPE PLASMINOGEN ACTIVATOR IN THE REGULATION OF CIRCADIAN RHYTHMS A thesis submitted to Kent State University in partial fulfillment of the requirements for the degree of Master of
Nature Neuroscience: doi: /nn Supplementary Figure 1
 Supplementary Figure 1 Bidirectional optogenetic modulation of the tonic activity of CEA PKCδ + neurons in vitro. a, Top, Cell-attached voltage recording illustrating the blue light-induced increase in
nature methods Organelle-specific, rapid induction of molecular activities and membrane tethering
 nature methods Organelle-specific, rapid induction of molecular activities and membrane tethering Toru Komatsu, Igor Kukelyansky, J Michael McCaffery, Tasuku Ueno, Lidenys C Varela & Takanari Inoue Supplementary
Nature Neuroscience: doi: /nn Supplementary Figure 1
 Supplementary Figure 1 Quantification of myelin fragments in the aging brain (a) Electron microscopy on corpus callosum is shown for a 18-month-old wild type mice. Myelin fragments (arrows) were detected
Fig. S1. Dose-response effects of acute administration of the β3 adrenoceptor agonists CL316243, BRL37344, ICI215,001, ZD7114, ZD2079 and CGP12177 at
 Fig. S1. Dose-response effects of acute administration of the β3 adrenoceptor agonists CL316243, BRL37344, ICI215,001, ZD7114, ZD2079 and CGP12177 at doses of 0.1, 0.5 and 1 mg/kg on cumulative food intake
effects on organ development. a-f, Eye and wing discs with clones of ε j2b10 show no
 Supplementary Figure 1. Loss of function clones of 14-3-3 or 14-3-3 show no significant effects on organ development. a-f, Eye and wing discs with clones of 14-3-3ε j2b10 show no obvious defects in Elav
Supplementary Figure 1
 Supplementary Figure 1 Arcuate ChIEF-tdTomato neurons expressed TH These micrographs show that TH-Cre-ChIEF-tdTomato (magenta), expressed by AAV in a TH-Cre mouse, were immunostained with TH (green) in
SUPPLEMENTARY INFORMATION
 Supplementary Figure 1. Behavioural effects of ketamine in non-stressed and stressed mice. Naive C57BL/6 adult male mice (n=10/group) were given a single dose of saline vehicle or ketamine (3.0 mg/kg,
fl/+ KRas;Atg5 fl/+ KRas;Atg5 fl/fl KRas;Atg5 fl/fl KRas;Atg5 Supplementary Figure 1. Gene set enrichment analyses. (a) (b)
 (b)") KRas;At KRas;At KRas;At KRas;At a b Supplementary Figure 1. Gene set enrichment analyses. (a) GO gene sets (MSigDB v3. c5) enriched in KRas;Atg5 fl/+ as compared to KRas;Atg5 fl/fl tumors using gene set
KRas;At KRas;At KRas;At KRas;At a b Supplementary Figure 1. Gene set enrichment analyses. (a) GO gene sets (MSigDB v3. c5) enriched in KRas;Atg5 fl/+ as compared to KRas;Atg5 fl/fl tumors using gene set
SUPPLEMENTAL DATA. Lumen area ( m 2 )
") Elastin Lumen area ( m 2 ) Media to lumen ratio (x1) H.E. Medium thickness ( m) Medium area ( m 2 ) SUPPLEMENTAL DATA A (Bmal1 flox/flox ) (SM-Bmal1 -/- ) B 1 8 8 6 6 4 4 2 2 1µm 5 8 4 6 3 2 4 1 2 Supplemental
Elastin Lumen area ( m 2 ) Media to lumen ratio (x1) H.E. Medium thickness ( m) Medium area ( m 2 ) SUPPLEMENTAL DATA A (Bmal1 flox/flox ) (SM-Bmal1 -/- ) B 1 8 8 6 6 4 4 2 2 1µm 5 8 4 6 3 2 4 1 2 Supplemental
SUPPLEMENTARY INFORMATION
 Haematopoietic stem cell release is regulated by circadian oscillations Simón Méndez-Ferrer *, Daniel Lucas *, Michela Battista * and Paul S. Frenette * Mount Sinai School of Medicine, *Departments of
Supplementary Figures
 Supplementary Figures Supplementary Fig. 1. Galectin-3 is present within tumors. (A) mrna expression levels of Lgals3 (galectin-3) and Lgals8 (galectin-8) in the four classes of cell lines as determined
1.5 ASK1KO fed. fasted 16 hrs w/o water. Fed. 4th. 4th WT ASK1KO N=29, 11(WT), ,5(ASK1KO) ASK1KO ASK1KO **** Time [h]
![1.5 ASK1KO fed. fasted 16 hrs w/o water. Fed. 4th. 4th WT ASK1KO N=29, 11(WT), ,5(ASK1KO) ASK1KO ASK1KO **** Time [h]](/thumbs/87/97258189.jpg "1.5 ASK1KO fed. fasted 16 hrs w/o water. Fed. 4th. 4th WT ASK1KO N=29, 11(WT), ,5(ASK1KO) ASK1KO ASK1KO **** Time [h]") 7: 13: 19: 1: 7: 151117 a 151117 4th 4th b c RQ.95 KO.9.85.8.75.7 light dark light dark.65 7: 19: 7: 19: 7: Means ± SEM, N=6 RQ 1..9.8.7.6.6 KO CL (-) CL (+) ibat weight ratio (/body weight) [%].5.4.3.2.1
7: 13: 19: 1: 7: 151117 a 151117 4th 4th b c RQ.95 KO.9.85.8.75.7 light dark light dark.65 7: 19: 7: 19: 7: Means ± SEM, N=6 RQ 1..9.8.7.6.6 KO CL (-) CL (+) ibat weight ratio (/body weight) [%].5.4.3.2.1
293T cells were transfected with indicated expression vectors and the whole-cell extracts were subjected
 SUPPLEMENTARY INFORMATION Supplementary Figure 1. Formation of a complex between Slo1 and CRL4A CRBN E3 ligase. (a) HEK 293T cells were transfected with indicated expression vectors and the whole-cell
Supplementary Figure S1. Effect of Glucose on Energy Balance in WT and KHK A/C KO
 Supplementary Figure S1. Effect of Glucose on Energy Balance in WT and KHK A/C KO Mice. WT mice and KHK-A/C KO mice were provided drinking water containing 10% glucose or tap water with normal chow ad
control kda ATGL ATGLi HSL 82 GAPDH * ** *** WT/cTg WT/cTg ATGLi AKO/cTg AKO/cTg ATGLi WT/cTg WT/cTg ATGLi AKO/cTg AKO/cTg ATGLi iwat gwat ibat
 body weight (g) tissue weights (mg) ATGL protein expression (relative to GAPDH) HSL protein expression (relative to GAPDH) ### # # kda ATGL 55 HSL 82 GAPDH 37 2.5 2. 1.5 1..5 2. 1.5 1..5.. Supplementary
GPR120 *** * * Liver BAT iwat ewat mwat Ileum Colon. UCP1 mrna ***
 a GPR120 GPR120 mrna/ppia mrna Arbitrary Units 150 100 50 Liver BAT iwat ewat mwat Ileum Colon b UCP1 mrna Fold induction 20 15 10 5 - camp camp SB202190 - - - H89 - - - - - GW7647 Supplementary Figure
Supplementary Figure 1. Deletion of Smad3 prevents B16F10 melanoma invasion and metastasis in a mouse s.c. tumor model.
 A B16F1 s.c. Lung LN Distant lymph nodes Colon B B16F1 s.c. Supplementary Figure 1. Deletion of Smad3 prevents B16F1 melanoma invasion and metastasis in a mouse s.c. tumor model. Highly invasive growth
SUPPLEMENTARY INFORMATION
 SUPPLEMENTARY INFORMATION Supplementary Figure 1. Generation of a conditional allele of the Kindlin-2 gene. (A) A restriction map of the relevant genomic region of Kindlin-2 (top), the targeting construct
Relative activity (%) SC35M
 SC35M") a 125 Bat (H17N) b 125 A/WSN (H1N1) Relative activity (%) 0 75 50 25 Relative activity (%) 0 75 50 25 0 Pos. Neg. PA PB1 Pos. Neg. NP PA PB1 PB2 0 Pos. Neg. NP PA PB1 PB2 SC35M Bat Supplementary Figure
a 125 Bat (H17N) b 125 A/WSN (H1N1) Relative activity (%) 0 75 50 25 Relative activity (%) 0 75 50 25 0 Pos. Neg. PA PB1 Pos. Neg. NP PA PB1 PB2 0 Pos. Neg. NP PA PB1 PB2 SC35M Bat Supplementary Figure
Supporting Online Material for
 www.sciencemag.org/cgi/content/full/1171320/dc1 Supporting Online Material for A Frazzled/DCC-Dependent Transcriptional Switch Regulates Midline Axon Guidance Long Yang, David S. Garbe, Greg J. Bashaw*
Supplementary Figure S1: Defective heterochromatin repair in HGPS progeroid cells
 Supplementary Figure S1: Defective heterochromatin repair in HGPS progeroid cells Immunofluorescence staining of H3K9me3 and 53BP1 in PH and HGADFN003 (HG003) cells at 24 h after γ-irradiation. Scale bar,
Supplementary Figure 1
 Supplementary Figure 1 3 3 3 1 1 Bregma -1.6mm 3 : Bregma Ref) Http://www.mbl.org/atlas165/atlas165_start.html Bregma -.18mm Supplementary Figure 1 Schematic representation of the utilized brain slice
(a) Significant biological processes (upper panel) and disease biomarkers (lower panel)
 Significant biological processes (upper panel) and disease biomarkers (lower panel)") Supplementary Figure 1. Functional enrichment analyses of secretomic proteins. (a) Significant biological processes (upper panel) and disease biomarkers (lower panel) 2 involved by hrab37-mediated secretory
Supplementary Figure 1. Functional enrichment analyses of secretomic proteins. (a) Significant biological processes (upper panel) and disease biomarkers (lower panel) 2 involved by hrab37-mediated secretory
Postn MCM Smad2 fl/fl Postn MCM Smad3 fl/fl Postn MCM Smad2/3 fl/fl. Postn MCM. Tgfbr1/2 fl/fl TAC
 A Smad2 fl/fl Smad3 fl/fl Smad2/3 fl/fl Tgfbr1/2 fl/fl 1. mm B Tcf21 MCM Tcf21 MCM Smad3 fl/fl Tcf21 MCM Smad2/3 fl/fl Tcf21 MCM Tgfbr1/2 fl/fl αmhc MCM C 1. mm 1. mm D Smad2 fl/fl Smad3 fl/fl Smad2/3
Supplementary Figure 1
 Supplementary Figure 1 how HFD how HFD Epi WT p p Hypothalamus p p Inguinal WT T Liver Lean mouse adipocytes p p p p p p Obese mouse adipocytes Kidney Muscle Spleen Heart p p p p p p p p Extracellular
SUPPLEMENTARY DATA. Supplementary Table 1. Primers used in qpcr
 Supplementary Table 1. Primers used in qpcr Gene forward primer (5'-3') reverse primer (5'-3') β-actin AGAGGGAAATCGTGCGTGAC CAATAGTGATGACCTGGCCGT Hif-p4h-2 CTGGGCAACTACAGGATAAAC GCGTCCCAGTCTTTATTTAGATA
Supplementary Table 1. Metabolic parameters in GFP and OGT-treated mice
 Supplementary Table 1. Metabolic parameters in GFP and OGT-treated mice Fasted Refed GFP OGT GFP OGT Liver G6P (mmol/g) 0.03±0.01 0.04±0.02 0.60±0.04 0.42±0.10 A TGs (mg/g of liver) 20.08±5.17 16.29±0.8
Supplementary Figure 1
 Supplementary Figure 1 Supplementary Figure 1 Schematic depiction of the tandem Fc GDF15. Supplementary Figure 2 Supplementary Figure 2 Gfral mrna levels in the brains of both wild-type and knockout Gfral
Nature Neuroscience: doi: /nn Supplementary Figure 1. Diverse anorexigenic signals induce c-fos expression in CEl PKC-δ + neurons
 Supplementary Figure 1 Diverse anorexigenic signals induce c-fos expression in CEl PKC-δ + neurons a-c. Quantification of CEl c-fos expression in mice intraperitoneal injected with anorexigenic drugs (a),
Supplementary Figure 1
 VO (ml kg - min - ) VCO (ml kg - min - ) Respiratory exchange ratio Energy expenditure (cal kg - min - ) Locomotor activity (x count) Body temperature ( C) Relative mrna expression TA Sol EDL PT Heart
SUPPLEMENTARY INFORMATION
 doi: 10.1038/nature06994 A phosphatase cascade by which rewarding stimuli control nucleosomal response A. Stipanovich*, E. Valjent*, M. Matamales*, A. Nishi, J.H. Ahn, M. Maroteaux, J. Bertran-Gonzalez,
Supplementary Materials for. c-abl Activation Plays a Role in α-synucleinopathy Induced Neurodegeneration
 Supplementary Materials for c-abl Activation Plays a Role in α-synucleinopathy Induced Neurodegeneration Saurav Brahmachari, Preston Ge, Su Hyun Lee, Donghoon Kim, Senthilkumar S. Karuppagounder, Manoj
SUPPLEMENTARY INFORMATION. Rett Syndrome Mutation MeCP2 T158A Disrupts DNA Binding, Protein Stability and ERP Responses
 SUPPLEMENTARY INFORMATION Rett Syndrome Mutation T158A Disrupts DNA Binding, Protein Stability and ERP Responses Darren Goffin, Megan Allen, Le Zhang, Maria Amorim, I-Ting Judy Wang, Arith-Ruth S. Reyes,
SUPPLEMENTARY INFORMATION
 doi: 10.1038/nature06310 SUPPLEMENTARY INFORMATION www.nature.com/nature 1 www.nature.com/nature 2 www.nature.com/nature 3 Supplementary Figure S1 Spontaneous duration of wake, SWS and REM sleep (expressed
Supplementary Figure 1 Information on transgenic mouse models and their recording and optogenetic equipment. (a) 108 (b-c) (d) (e) (f) (g)
 108 (b-c) (d) (e) (f) (g)") Supplementary Figure 1 Information on transgenic mouse models and their recording and optogenetic equipment. (a) In four mice, cre-dependent expression of the hyperpolarizing opsin Arch in pyramidal cells
Supplementary Figure 1 Information on transgenic mouse models and their recording and optogenetic equipment. (a) In four mice, cre-dependent expression of the hyperpolarizing opsin Arch in pyramidal cells
SUPPLEMENTARY FIGURES
 SUPPLEMENTARY FIGURES 1 Supplementary Figure 1, Adult hippocampal QNPs and TAPs uniformly express REST a-b) Confocal images of adult hippocampal mouse sections showing GFAP (green), Sox2 (red), and REST
1,8 1,6 1,4 1,2 1. EE/g lean mass 0,8 0,6 0,4 0,2. Ambulatory locomotor activity. (beam brakes/48h) V MCH MCHpf 0,86 0,85 0,84 0,83 0,82 0,81 0,8
 V MCH MCHpf 0,86 0,85 0,84 0,83 0,82 0,81 0,8") Supplementary figure 1 vehicle A -pf Energy expenditure (kcal/kg/48h) 25 2 15 1 5 V pf EE/g lean mass 1,8 1,6 1,4 1,2 1,8,6,4,2 Total locomotor activity (beam brakes/48h) C D E 7 6 5 4 3 2 1 V pf Ambulatory
Supplementary figure 1 vehicle A -pf Energy expenditure (kcal/kg/48h) 25 2 15 1 5 V pf EE/g lean mass 1,8 1,6 1,4 1,2 1,8,6,4,2 Total locomotor activity (beam brakes/48h) C D E 7 6 5 4 3 2 1 V pf Ambulatory
Supplemental Figure 1. Intracranial transduction of a modified ptomo lentiviral vector in the mouse
 Supplemental figure legends Supplemental Figure 1. Intracranial transduction of a modified ptomo lentiviral vector in the mouse hippocampus targets GFAP-positive but not NeuN-positive cells. (A) Stereotaxic
Supplementary Materials for
 www.sciencesignaling.org/cgi/content/full/6/283/ra57/dc1 Supplementary Materials for JNK3 Couples the Neuronal Stress Response to Inhibition of Secretory Trafficking Guang Yang,* Xun Zhou, Jingyan Zhu,
SUPPLEMENTARY INFORMATION
 Supplementary Figure 1. Histogram showing hybridization signals for chicken (left) and quail (right) genomic DNA analyzed by Chicken GeneChip (n=3). www.nature.com/nature 1 Supplementary Figure 2. Independent
Disrupting GluA2-GAPDH Interaction Affects Axon and Dendrite Development
 Disrupting GluA2-GAPDH Interaction Affects Axon and Dendrite Development 1 Frankie Hang Fung Lee, 1 Ping Su, 1 Yu Feng Xie, 1 Kyle Ethan Wang, 2 Qi Wan and 1,3 Fang Liu 1 Campbell Research Institute, Centre
Supplementary Figure 1. Western blot of hippocampal lysates from WT and Adcy1 KO mice demonstrates the specificity of the ADCY1 antibody.
 ADCY1 13 kda β-actin 45 kda Supplementary Figure 1. Western blot of hippocampal lysates from and mice demonstrates the specificity of the ADCY1 antibody. a DHPG perk1/2 ERK1/2 Relative level min 1.6 *
Supplementary Figure 1 Expression of Crb3 in mouse sciatic nerve: biochemical analysis (a) Schematic of Crb3 isoforms, ERLI and CLPI, indicating the
 Schematic of Crb3 isoforms, ERLI and CLPI, indicating the") Supplementary Figure 1 Expression of Crb3 in mouse sciatic nerve: biochemical analysis (a) Schematic of Crb3 isoforms, ERLI and CLPI, indicating the location of the transmembrane (TM), FRM binding (FB)
Supplementary Figure 1 Expression of Crb3 in mouse sciatic nerve: biochemical analysis (a) Schematic of Crb3 isoforms, ERLI and CLPI, indicating the location of the transmembrane (TM), FRM binding (FB)
Supplementary Figure 1. Nature Neuroscience: doi: /nn.4547
 Supplementary Figure 1 Characterization of the Microfetti mouse model. (a) Gating strategy for 8-color flow analysis of peripheral Ly-6C + monocytes from Microfetti mice 5-7 days after TAM treatment. Living
Nature Biotechnology: doi: /nbt Supplementary Figure 1. Analysis of hair bundle morphology in Ush1c c.216g>a mice at P18 by SEM.
 Supplementary Figure 1 Analysis of hair bundle morphology in Ush1c c.216g>a mice at P18 by SEM. (a-c) Heterozygous c.216ga mice displayed normal hair bundle morphology at P18. (d-i) Disorganized hair bundles
Supplementary Table 2. Plasma lipid profiles in wild type and mutant female mice submitted to a HFD for 12 weeks wt ERα -/- AF-1 0 AF-2 0
 Supplementary Table 1. List of specific primers used for gene expression analysis. Genes Primer forward Primer reverse Hprt GCAGTACAGCCCCAAAATGG AACAAAGTCTGGCCTGTATCCA Srebp-1c GGAAGCTGTCGGGGTAGCGTC CATGTCTTCAAATGTGCAATCCAT
Supplementary Figure 1. Repression of hepcidin expression in the liver of mice treated with
 Supplementary Figure 1. Repression of hepcidin expression in the liver of mice treated with DMN Immunohistochemistry for hepcidin and H&E staining (left). qrt-pcr assays for hepcidin in the liver (right).
Supplementary Figure 1. AdipoR1 silencing and overexpression controls. (a) Representative blots (upper and lower panels) showing the AdipoR1 protein
 Representative blots (upper and lower panels) showing the AdipoR1 protein") Supplementary Figure 1. AdipoR1 silencing and overexpression controls. (a) Representative blots (upper and lower panels) showing the AdipoR1 protein content relative to GAPDH in two independent experiments.
Supplementary Figure 1. AdipoR1 silencing and overexpression controls. (a) Representative blots (upper and lower panels) showing the AdipoR1 protein content relative to GAPDH in two independent experiments.
SUPPLEMENTARY INFORMATION
 DOI:.38/ncb3399 a b c d FSP DAPI 5mm mm 5mm 5mm e Correspond to melanoma in-situ Figure a DCT FSP- f MITF mm mm MlanaA melanoma in-situ DCT 5mm FSP- mm mm mm mm mm g melanoma in-situ MITF MlanaA mm mm
Supplementary Figure S1: Tanycytes are restricted to the central/posterior hypothalamus
 Supplementary Figure S1: Tanycytes are restricted to the central/posterior hypothalamus a: Expression of Vimentin, GFAP, Sox2 and Nestin in anterior, central and posterior hypothalamus. In the anterior
Supplementary Figure 1. Expression of phospho-sik3 in normal and osteoarthritic articular cartilage in the knee. (a) Semiserial histological sections
 Semiserial histological sections") Supplementary Figure 1. Expression of phospho-sik3 in normal and osteoarthritic articular cartilage in the knee. (a) Semiserial histological sections of normal cartilage were stained with safranin O-fast
Supplementary Figure 1. Expression of phospho-sik3 in normal and osteoarthritic articular cartilage in the knee. (a) Semiserial histological sections of normal cartilage were stained with safranin O-fast
18s AAACGGCTACCACATCCAAG CCTCCAATGGATCCTCGTTA. 36b4 GTTCTTGCCCATCAGCACC AGATGCAGCAGATCCGCAT. Acc1 AGCAGATCCGCAGCTTG ACCTCTGCTCGCTGAGTGC
 Supplementary Table 1. Quantitative PCR primer sequences Gene symbol Sequences (5 to 3 ) Forward Reverse 18s AAACGGCTACCACATCCAAG CCTCCAATGGATCCTCGTTA 36b4 GTTCTTGCCCATCAGCACC AGATGCAGCAGATCCGCAT Acc1
Supplementary Figure 1. EC-specific Deletion of Snail1 Does Not Affect EC Apoptosis. (a,b) Cryo-sections of WT (a) and Snail1 LOF (b) embryos at
 Cryo-sections of WT (a) and Snail1 LOF (b) embryos at") Supplementary Figure 1. EC-specific Deletion of Snail1 Does Not Affect EC Apoptosis. (a,b) Cryo-sections of WT (a) and Snail1 LOF (b) embryos at E10.5 were double-stained for TUNEL (red) and PECAM-1 (green).
Supplementary Figure 1. EC-specific Deletion of Snail1 Does Not Affect EC Apoptosis. (a,b) Cryo-sections of WT (a) and Snail1 LOF (b) embryos at E10.5 were double-stained for TUNEL (red) and PECAM-1 (green).
TIMED RESTRICTED FEEDING RESTORES THE RHYTHMS OF EXPRESSION OF THE CLOCK PROTEIN, PER2, IN THE OVAL NUCLEUS OF
 * - Manuscript Click here to view linked References 1 1 1 1 1 0 1 0 TIMED RESTRICTED FEEDING RESTORES THE RHYTHMS OF EXPRESSION OF THE CLOCK PROTEIN, PER, IN THE OVAL NUCLEUS OF THE BED NUCLEUS OF THE
Neurons and Hormones 1. How do animals perform the right behaviors at the right time? In the right context?
 Neurons and Hormones 1 How do animals perform the right behaviors at the right time? In the right context? Active at night only What if conflicting signals? Magnetic cues are always present But migrate
Supplementary Figure 1. A. Bar graph representing the expression levels of the 19 indicated genes in the microarrays analyses comparing human lung
 Supplementary Figure 1. A. Bar graph representing the expression levels of the 19 indicated genes in the microarrays analyses comparing human lung immortalized broncho-epithelial cells (AALE cells) expressing
Supplemental Figure 1. Western blot analysis indicated that MIF was detected in the fractions of
 Supplemental Figure Legends Supplemental Figure 1. Western blot analysis indicated that was detected in the fractions of plasma membrane and cytosol but not in nuclear fraction isolated from Pkd1 null
Nature Neuroscience: doi: /nn Supplementary Figure 1. Large-scale calcium imaging in vivo.
 Supplementary Figure 1 Large-scale calcium imaging in vivo. (a) Schematic illustration of the in vivo camera imaging set-up for large-scale calcium imaging. (b) High-magnification two-photon image from
Supplementary Figure 1. IDH1 and IDH2 mutation site sequences on WHO grade III
 Supplementary Materials: Supplementary Figure 1. IDH1 and IDH2 mutation site sequences on WHO grade III patient samples. Genomic DNA samples extracted from punch biopsies from either FFPE or frozen tumor
Nature Neuroscience: doi: /nn Supplementary Figure 1
 Supplementary Figure 1 Drd1a-Cre driven ChR2 expression in the SCN. (a) Low-magnification image of a representative Drd1a-ChR2 coronal brain section (n = 2) showing endogenous tdtomato fluorescence (magenta).
a) Primary cultures derived from the pancreas of an 11-week-old Pdx1-Cre; K-MADM-p53
 Primary cultures derived from the pancreas of an 11-week-old Pdx1-Cre; K-MADM-p53") 1 2 3 4 5 6 7 8 9 10 Supplementary Figure 1. Induction of p53 LOH by MADM. a) Primary cultures derived from the pancreas of an 11-week-old Pdx1-Cre; K-MADM-p53 mouse revealed increased p53 KO/KO (green,
1 2 3 4 5 6 7 8 9 10 Supplementary Figure 1. Induction of p53 LOH by MADM. a) Primary cultures derived from the pancreas of an 11-week-old Pdx1-Cre; K-MADM-p53 mouse revealed increased p53 KO/KO (green,
Supplementary Information
 Supplementary Information Title Degeneration and impaired regeneration of gray matter oligodendrocytes in amyotrophic lateral sclerosis Authors Shin H. Kang, Ying Li, Masahiro Fukaya, Ileana Lorenzini,
Supplemental data Supplemental Figure Legends Supplemental Figure 1. Supplemental Figure 2.
 Supplemental data Supplemental Figure Legends Supplemental Figure 1. Analysis of deletion of AMPK!2 in POMC and AgRP neurons in control and POMC!2KO and AgRP!2KO mice. (A) mmunofluorescence analysis for
Supplementary Figures
 Supplementary Figures a miel1-2 (SALK_41369).1kb miel1-1 (SALK_978) b TUB MIEL1 Supplementary Figure 1. MIEL1 expression in miel1 mutant and S:MIEL1-MYC transgenic plants. (a) Mapping of the T-DNA insertion