a b c Supplementary Figure 1 R Shrm4 0 -/- -/- GABA B1b Wild type GABA B1a GABA B1a -GABA B1b mean intensity (a.u) Ponceau GABA B
|
|
|
- Vivien Little
- 6 years ago
- Views:
Transcription


 5 μm 10 μm 20 μm I A I A I A")
1 a b c H S1 P1 S2 P2 SYN TIF PSD Shrm PSD Synaptophysin Wil type GABA B1a -/- GABA B1b -/- -GABA B1a -GABA B1b e f 5 μm 10 μm 20 μm GABA B1a Ponceau GABA B Shrm4 0 I A I A I A GABA B1a mean intensity (a.u) 5 μm 10 μm 20 μm I A I A I A Supplementary Figure 1
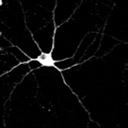
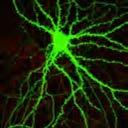
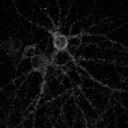
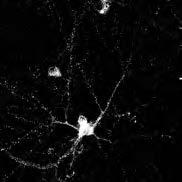
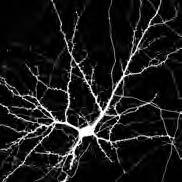
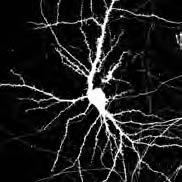
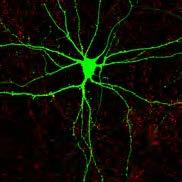
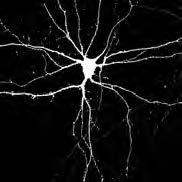
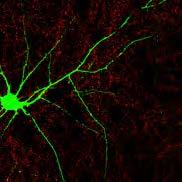
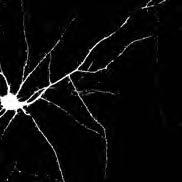
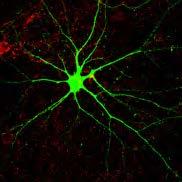
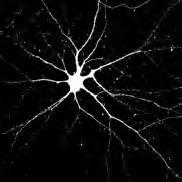
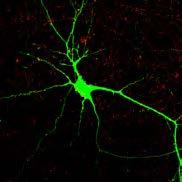
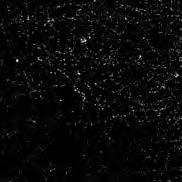
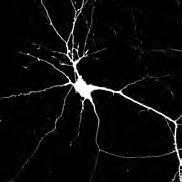
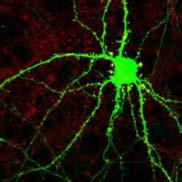
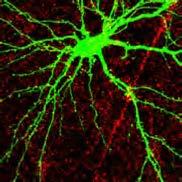
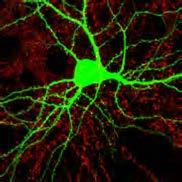
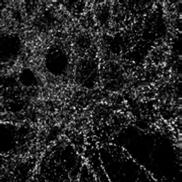
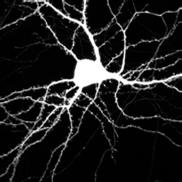
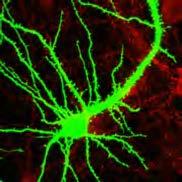
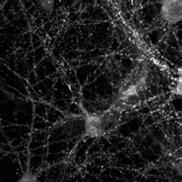
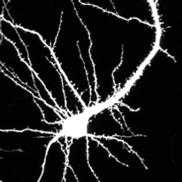
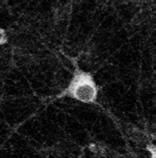
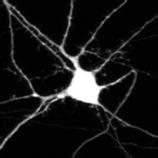
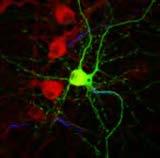
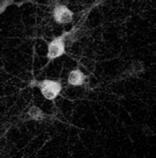
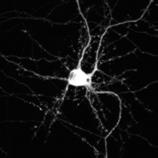
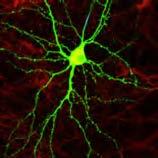
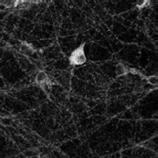
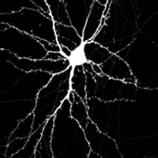
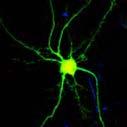
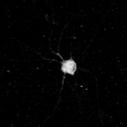
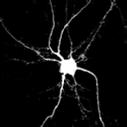
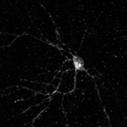
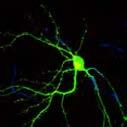
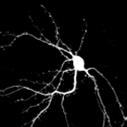
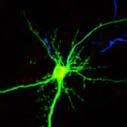
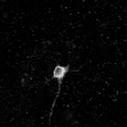
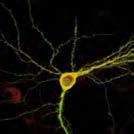
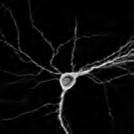
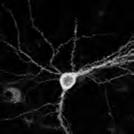
2 Supplementary Figure 1. Shrm4 is localize in the pre- an postsynaptic compartments of neurons. (a) (Top) Images an (Bottom) histogram showing quantitative co-localization of enogenous Shrm4 staining with presynaptic (Bassoon) as well as with postsynaptic markers of both excitatory (PSD-95) an inhibitory (GABA A β3) synapses in 18DIV (ays in vitro) culture hippocampal neurons. n= 15, Scale bar: 10 µm (b) Electron micrographs of culture cortical neurons at 20DIV immunolabele with anti-shrm4 an seconary antiboy conjugate with Nanogol particles, showing gol particles in enrites an synaptic boutons. Sv: synaptic vesicles; MT: microtubules; m: mitochonria. Scale bar: 200 nm. The histograms show that in Shrm4-staine neurons, gol particles were significantly enriche (*p <0.0001, see Table 1) in enrites an presynaptic terminals (synaptic boutons) an also tene to accumulate at the postsynaptic compartments. (c) Western blot analyses of postsynaptic ensity (PSD) subcellular fractionation from rat brain. H, total homogenate; S1, P1, Whole-brain postnuclear supernatant an membrane fractions, respectively; S2, cytosolic proteins; P2, crue synaptosomal fraction; SYN, synaptosomes; TIF, Triton X-100 insoluble fraction; PSD, Triton X-100-extracte PSD. () Western blot of wil-type, GABA B1a -/- an GABA B1b -/- mouse brain lysates using anti-gaba B1 for immunoblotting. The blot shows that anti- GABA B1 antiboy recognizes both GABA B1a an GABA B1b isoforms. (e) Full image of irect stochastic optical reconstruction microscopy (STOM) imaging of GABA B -ATTO 488 (shown in re) an Shrm4-Alexa 647 (shown in green) on 14DIV culture hippocampal neurons. Scale bar: 0.4 µm. (f) (Left) GST pull-own experiments using GST-PDZ on lysates of cells overexpressing GABA B1a -GFP with increasing concentrations (5, 10 an 20 µm) of Tat-control (I) or Tat (A) peptie. (ight) Histogram showing the GABA B1a mean intensity compare to the Tat-control peptie. Incubation with the Tat at 10 an 20 µm showe a reuction in Shrm4/GABA B1 bining compare to the Tat control peptie.


3 a b c scramble/#2 Surface GABA B p150-cc1 Surface GABA B Control sina Shrm3 sina GABA B GABA B scramble/#2 shna shna Surface GABA B Surface GABA B Surface GABA B p150-cc1 rescue rescue Surface GABA B Surface GABA B Surface GABA B Normalize GABA B1 Surface signal intensity * * * scramble/#2 shna shna#2 p150-cc1 rescue Normalize GABA B1 signal intensity 2 1,8 1,6 1,4 1,2 1 0,8 0,6 0,4 0,2 0 Normalize spine ensity 2 1,8 1,6 1,4 1,2 1 0,8 0,6 0,4 0,2 0 control sina shrm3 sina shna#2 Surface GABA B shna#2 Surface GABA B Supplementary Figure 2
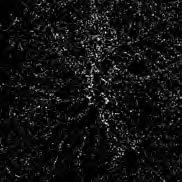
4 Supplementary Figure 2. Valiation of knockown an rescue constructs. (a) Western blots of lysates from transfecte an non-transfecte (NT) HEK293 cells emonstrating the effectiveness of the two knockown constructs (shna an shna#2). HA-tagge Shrm4 (HA-Shrm4) was use to overexpress Shrm4 in these cells. Transfecte constructs were HA-Shrm4, shna with HA-Shrm4 (rescue) or HA-Shrm4 with shna#2. α-tubulin serve as loaing reference an polyclonal anti-ha antiboy was use to reveal Shrm4 expression. The blot shows that HA-Shrm4 is resistant to shna but not to shna#2. (b) (Left) epresentative images of hippocampal neurons transfecte at 8DIV an immunostaine at 18DIV with polyclonal anti-shrm4 antiboy to reveal enogenous Shrm4 expression an monoclonal anti-ha to reveal overexpresse Shrm4. Transfections were scramble, shna, shna#2, shna plus HA-Shrm4, an shna#2 plus HA-Shrm4. Scale bar: 10 µm. (ight) Quantification of enritic Shrm4 expression normalize to scramble transfecte neurons. Both shna (**p < 0.01; one-way ANOVA, n = 10) an shna#2 (**p < 0.01; one-way ANOVA, n = 10) reuces enogenous Shrm4 expression an expression of HA-Shrm4 (resistant) with shna rescues Shrm4 expression whereas it oes not with shna#2. (c) Full representative images an histogram showing surface immunostaining for GABA B in culture hippocampal neurons at 18DIV after transfection with scramble, shna, shna#2, p150-cc1 or rescue constructs at 8DIV. Scale bar: 15 µm. Histograms show mean ± SEM; n = 5-15, *P < 0.05, One-way ANOVA. () epresentative images of hippocampal neurons transfecte at 8DIV with GFP coexpressingcontrol sina or Shrm3 sina an immunostaine at 18DIV for surface GABA B1. No significant changes in GABA B1 intensity or spine ensity were observe from Shrm3-siNA expressing neurons compare to controls. Histograms show mean ± SEM; n = 10.


5 scramble shna escue EGFP PSD95 merge EGFP PSD95 merge EGFP PSD95 merge EGFP Bassoon merge EGFP Bassoon merge EGFP Bassoon merge EGFP GluA2 merge EGFP GluA2 merge EGFP GluA2 merge EGFP Synapsin merge EGFP Synapsin merge EGFP Synapsin merge Supplementary Figure 3
6 Supplementary Figure 3. Shrm4 regulates synaptic protein composition. Full representative images of rat hippocampal neurons transfecte at 8DIV with Shrm4 scramble or shna with or without rescue constructs an immunostaine for PSD95, Bassoon, GluA2 an Synapsin post-synaptogenesis at 18DIV. Scale bars: 10 µm.

7 a b 12 DIV Supplementary Figure 4
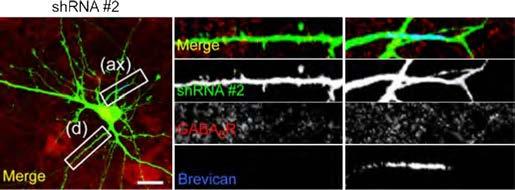
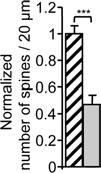
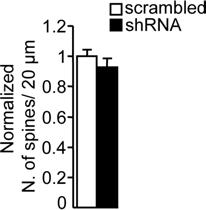
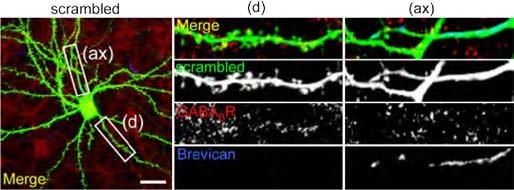
8 Supplementary Figure 4. Shrm4 regulates enritic spine ensity an GABA B transport before synaptogenesis. (a) epresentative images an histograms of enrites () an axons (ax) at 14DIV from hippocampal neurons transfecte before synaptogenesis at 8DIV with control (scramble#2) or knockown (shna#2) shnas. The enritic spine ensity an GABA B expression levels were measure in enrites an axon by co-staining for brevican to localize axons. The histograms compare mean (± SEM) spine ensity (normalize number of spines/20 µm; 20 neurons examine per construct) an polarity inex (PI) of GABA B expression. Spine ensity (***p < 0.001; t-test, n = 15) is significantly lower in Shrm4-silence neurons than scramble controls. In aition, the PI of Shrm4 knockown neurons is significantly lower than scramble (*p < 0.05; t-test, n = 10). Scale bar: 20 µm. (b) epresentative images with histograms comparing spine ensity of rat hippocampal neurons transfecte at 12DIV with knockown shna or scramble shna. Spine ensity oes not iffer between Shrm4- silence an control neurons when transfecte post synaptogenesis at 12DIV (normalize number of spines/ 20 µm) Histogram mean ± SEM, n=20.

 Decay (ms)")
 300 200 100 0")
9 a b scramble shna GABA B1 Average F/F shna + 1 ΔCT 2 shna Time (ms) Decay (ms) Mean ise Time (ms) Supplementary Figure 5
10 Supplementary Figure 5. (a) Valiation of GABA B1 shna. epresentative images (Left) an histogram (ight) of hippocampal neurons transfecte at 8DIV with scramble (control) or knockown shna that specifically target GABA B1. The neurons were transfecte at 8DIV an analyze by confocal microscopy at 18DIV for GABA B expression. Normalize GABA B fluorescence intensity is significantly lower in shna-transfecte neurons than scramble controls. The histograms compare mean (±SEM); n=20; ***p < 0.001, t-test. Scale bar: 20 µm. (b) Calcium ynamics in neurons expressing 1ΔCT. (Left) Time course of average ΔF/F 0 values an single exponential fits of Ca 2+ signals in control neurons expressing shna an neurons expressing 1b subunits with a eletion of the C-terminus tail (1ΔCT) co-expresse with 2 an shna. e lines show exponential fits of the ecays. (ight) Mean rise times an ecay τ of Ca 2+ signals for control an 1ΔCT. Histograms show mean ±SEM; n =


")

11 a b c f e Input (5%) IgG ip Shrm4 Shrm4 KIF5B Input (5%) IgG ip Shrm4 Shrm4 KIF5C 1a Decay τ (min) g I II h III Supplementary Figure 6
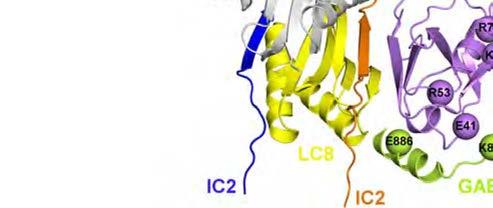
12 Supplementary Figure 6. Shrm4 an ynein/ynactin regulate GABA B transport to enrites. (a) Schematic showing a GABA B heteroimer with an α-bungarotoxin (BgTx) bining site (BBS) in the N-terminus of 1a (1a BBS ). (b) Live cell surface fluorescence monitore over 60 min at C, in hippocampal neurons at 14DIV, expressing 1a BBS 2 with BgTx couple to Alexa-fluor 555 (BgTx-AF555), with either Shrm4 knockown (shna) or scramble constructs (scramble). (c) ates of constitutive internalization for BgTx- AF555-tagge GABA B s in Shrm4 knockown ( ) an scramble controls ( ). () Exponential ecay time constants for membrane fluorescence for GABA B s in knockown an control cells. (e) Membrane fluorescence of GABA B s after 1 hr in knockown an scramble control cells. Histograms show mean ±SEM; n = 6-8. Scale bar 10 µm. (f) Blots of Shrm4 immunoprecipitation experiments on rat brain lysates, which emonstrate the absence of interaction with the subunit B an C of KIF5. (g) Supramolecular complex between the Shrm4 PDZ omain, GABA B1b, GABA B2 an the filaments of ynein IC2 interacting with imeric ynein LC8. (I) The GABA B1b (green) an GABA B2 (aquamarine) moele heteroimer comprises the seven-helices bunle, the intracellular an extracellular loops, an the C-terminus up to the en of the coil-coil region. The Shrm4 PDZ is violet. The filament of ynein IC2C is orange. (II) A sie view of the complex in (I) is shown. In this panel imeric LC8 (gray an yellow protomers) an an aitional filament of IC2C (blue) of ynein are shown as well. The spheres centere on the Cα-atoms of GABA B1b an PDZ mark a selection of salt briges at the interface between the two proteins. (III) A zoom on the GABA B1b /PDZ/IC2/LC8 interfaces is shown. The C-terminal amino aci segment of GABA B1b makes contacts with PDZ. The selecte salt briges marke by spheres at the GABA B1b -PDZ interface inclue: 1) E869 from the receptor an both K26 an 70 from β2 an α2 of PDZ, respectively; 2) K875 from the receptor an E41 from the β2-α1 loop of PDZ;
13 an 3) E886 from the coil-coil helix of the receptor an 53 from the α1-β4 loop of PDZ. The β1 stran of PDZ forms an antiparallel β-sheet with the stran of IC2 (orange). The latter in turn forms an antiparallel β-sheet with the yellow protomer of LC8. A secon segment of IC2 (blue) forms an antiparallel β-sheet with the gray protomer of LC8. For both IC2C filaments of ynein the segment is not shown. (h) epresentative Western blots of Shrm4, α-tubulin an GFP from hippocampal brain extracts prepare three weeks after injection of AAV5-scramble or AAV5-shNA (knockown) into opposing hippocampi of rats. Hippocampi infecte with AAV5-shNA show robust reuction in Shrm4 expression (Histograms show mean ±SEM; n = 3; **p < 0.01; t-test).

")
")


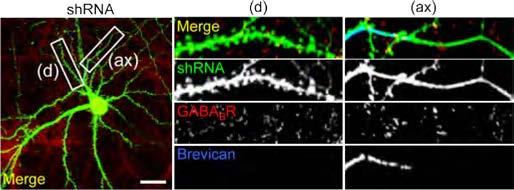
14 a ax ax GFP GABA B escue GABA B () () (ax) GFP GABA B (ax) escue GABA B ax ax shna GABA B GFP-p150-cc1 c1 GABA B () () (ax) shna GABA B (ax) GFP-p150-cc1 GABA B b Supplementary Figure 7
15 Supplementary Figure 7. Shrm4 an ynein/ynactin regulate GABA B transport to enrites. (a) Full representative images of immunostaining of enogenous GABA B on enrites () an axons (ax) in 18DIV neurons transfecte at 7DIV with Scramble, shna, escue or p150-cc1 construct. Scale bar 10 µm. (b) epresentative images of enrites () an axons (ax) of 18DIV hippocampal neurons transfecte after synaptogenesis at 12DIV with knockown or scramble controls. Neurons were immunostaine to reveal enogenous GABA B s an brevican to localize axons. Histogram showing that PI of knockown shnaexpressing neurons is lower than that of scramble-expressing neurons (Histograms show mean ±SEM; n = 10; **p < 0.01; t-test,). Scale bar: 20 µm.
")


16 GFP () (ax) 1A-myc GFP ax shna () (ax) 1A-myc shna 1A-myc 1A-myc ax GFP-p150-cc1 () (ax) 1A-myc GFP-p150-cc1 1A-myc ax GFP () (ax) 1B-myc GFP 1B-myc ax shna () (ax) 1B-myc shna 1B-myc ax () (ax) 1B-myc GFP-p150-cc1 1B-myc GFP-p150-cc1 ax GABA B1 GABA B2 0 0,5 1 1,5 Correlation coefficient (Pearson r) scramble shna a b Supplementary Figure 8
17 Supplementary Figure 8. Shrm4 an ynein/ynactin regulate overexpresse GABA B transport to enrites. (a) Full representative immunostaining images of overexpresse myc-tagge GABA B -1a (left) an -1b (right) on enrites () an axons (ax) at 18DIV neurons, transfecte at 7DIV together with GABA B2 an either scramble, shna, escue or p150-cc1 construct (b) epresentative images (top) an histogram (bottom) of 18DIV culture hippocampal neurons transfecte at 8DIV with GABA B1 -myc an GABA B2 -flag with either knockown shna or its scramble control an immunostaine using the anti-tag antiboies. A high egree of co-localization is seen for both knockown an scramble shna-expressing neurons.
 10 µm Baclofen -2.0-1.5-1.0-0.")

18 a b shna rescue 10 μm baclofen 100pA 1s Current Density (pa/pf) 10 µm Baclofen * 100 μm baclofen 100pA 1s Current Density (pa/pf) 100 µm Baclofen -3.0 * c Supplementary Figure 9
19 Supplementary Figure 9. Changes in electrophysiological properties in vitro upon Shrm4 silencing. (a) Whole-cell GIK currents, recore in response to GABA B activation by 10 or 100 µm baclofen, from rat hippocampal neurons at 14DIV, transfecte with knockown shna with or without the rescue construct (HA-Shrm4). Peak K + current ensity in Shrm4-silence neurons was significantly lower than in the presence of the rescue construct for both oses of baclofen. Histograms show mean ±SEM; *P<0.05, t-test, n = (b) Whole-cell GIK currents recore from culture rat hippocampal neurons at 14DIV in response to glutamate o not iffer between neurons expressing knockown (shna), those expressing scramble, or those expressing the coile-coil omain of ynactin (GFP-p150-cc1). GIK currents were inuce by mglu activation with 10 µm glutamate in the presence of 2 mm kynurenic aci an 20 µm bicuculline. (c) Amplitue, ecay time, area an frequency of mipscs recore from 14DIV hippocampal neurons transfecte (8DIV) with knockown shna or scramble, measure in the presence of kynurenic aci (3 mm) an liocaine (500 µm) Histograms show mean ±SEM; n=12-17.

")

20 a b c scramble shna Slope (% of maximum response) scramble shna Current (ma) fepsp slope (% change) mv 10 ms AAV5-scramble AAV5-shNA Time (min) fepsps slope (last 10 minutes) (% of control) pre LFS post LFS e scramble shna PSD95 Mean intensity (a.u) Supplementary Figure 10
21 Supplementary Figure 10. Changes in electrophysiological properties in vivo upon Shrm4 silencing. (a) Input-output curves measure in vitro for fiel excitatory postsynaptic potential (fepsp) in hippocampal slices from rat injecte with AAV5-shNA compare to AAV5- scramble controls. n = 6 (b) Iniviual traces of fiel excitatory postsynaptic potentials (fepsps) at baseline (grey) an after high frequency stimulation (black) of acute hippocampal slices of ault rats previously injecte with either knockown AAV5-shNA (right hemisphere) or AAV5-scramble (left hemisphere) (n = 9 animals). (Bottom) epresentative traces an bar chart of changes in fepsps. Baseline fepsps were recore from the apical enritic layer of CA1. LTP was inuce by high frequency stimulation (100 stimuli at 250 Hz) of Schaffer collaterals. The traces show no ifferences in LTP inuction or maintenance between Shrm4-silence hippocampal slices an scramble controls. (c) Iniviual representative traces of fepsps at baseline (line) an after low frequency stimulation (otte line) of acute hippocampal slices of ault rats previously injecte with either knockown AAV5-shNA (right hemisphere) or AAV5-scramble (left hemisphere) (n = 6 animals). (Bottom) epresentative traces an bar chart of changes in fepsps. Baseline fepsps were recore from the apical enritic layer of CA1. LTD was inuce by low frequency stimulation (900 stimuli at 1 Hz) of Schaffer collaterals. The traces show no ifferences in LTD inuction or maintenance between Shrm4-silence hippocampal slices an scramble controls. () epresentative images (top) an histogram (bottom) of the mean intensity of PSD-95 positive puncta (excitatory synapses) immunolabele in the CA1 region of the hippocampus of rats previously injecte with either knockown AAV5-shNA (right hemisphere) or AAV5-scramble (left hemisphere). The results show no ifferences in PSD95 mean intensity between Shrm4-silence hippocampal slices an scramble slices (n= 3 animals).
22 Scale bar: 20 µm (e) (Left) epresentative traces an (ight) histograms of amplitue, ecay time, area an frequency of mipscs recore from DGGCs of ault rats previously injecte with either knockown AAV5-shNA (right hemisphere) or AAV5-scramble (left hemisphere) (n= 3 animals). Amplitue, ecay time, area an frequency of mipscs o not iffer significantly between Shrm4-silence hippocampal slices an scramble controls. mipscs were measure in the presence of kynurenic aci (3 mm) an liocaine (500 µm).
 IgG ip")
 fig.")
 -PDZ(Mut")


")


23 fig.1b Input (5%) IgG ip Shrm4 fig.1 (1) fig.1 (2) fig.1 (3) -PDZ(Mut AA) fig.1e 200- Shrm GABA B1 fig.1f fig.1g NT Input (2%) Tat control Tat GST-PDZ mutaa GST-PDZ Input (2%) GST-PDZ mutaa GST-PDZ GABA B1b fig.1i fig.3b fig.3c(top) fig.3c(bottom) Ponceau fig.3 fig.5f fig.3f Input GST GST-PDZ GST-PDZ (Mut AA) His-IC-2C 100- GABA B2 fig.3e Input (10%) GST GST-PDZΔ14 GST-PDZ DIC e Ponceau e Ponceau Supplementary Figure 11
24 Supplementary figure 11. Full versions of the western blots presente in the stuy. The blots have been labelle with figure panels where they have appeare.
25 Supplementary Table 1: Distribution of gol nanoparticles in culture rat cortical neurons immunolabele with (Shrm4) or without (Control) primary antiboies against Shrm4 Compartments Χ 2 Values Observe Gol, No Observe Points (P) LD Values (No/P*a p) Expecte Gol, Ne LI Values (No/Ne) Shrm4 Synaptic bouton * Post-synaptic terminal Thin enrites * Other un-etermine structures Cell structure absent Total $ Control Synaptic bouton Post-synaptic terminal Thin enrites Other un-etermine structures Cell structure absent Total
26 Supplementary Table 2: Statistical analysis parameters for Fig. 2 Figure panel Statistical test n Conitions p value F 2c (Left) PSD95 Orinary one-way ANOVA 15, 14, 11 Scramble, shna, rescue p=0,0011 F(2,32)=8,191 2c (Left) Bassoon Orinary one-way ANOVA 10, 10, 15 Scramble, shna, rescue p=0,0002 F(2,32)= c (Left) GluA2 Orinary one-way ANOVA 10, 10, 15 Scramble, shna, rescue p<0,0001 F(2,32)= c (Left) Synapsin Orinary one-way ANOVA 10, 10, 15 Scramble, shna, rescue p=0,0002 F(2,32)= c (ight) PSD95 Orinary one-way ANOVA 15, 14, 11 Scramble, shna, rescue p=0,0011 F(2,37)=2,37 2c (ight) Bassoon Orinary one-way ANOVA 15, 20, 15 Scramble, shna, rescue p=0,0148 F(2,32)=4,615 2c (ight) GluA2 Orinary one-way ANOVA 17, 20, 15 Scramble, shna, rescue p=0,0069 F(2,32)=5,592 2c (ight) Synapsin Orinary one-way ANOVA 10, 10, 15 Scramble, shna, rescue p=0,0174 F(2,32)=5,592 2 Orinary one-way ANOVA 15, 15, 20 Scramble, shna, rescue p=0,0029 F(2,47)=6,641 2f Orinary one-way ANOVA 15, 15, 20 Scramble, shna, rescue p<0,0001 F(2,42)= g Orinary one-way ANOVA 15, 15, 20 Scramble, shna, rescue p<0,0001 F(2,47)=28.23
SUPPLEMENTARY INFORMATION
 Supplementary Figure 1. Normal AMPAR-mediated fepsp input-output curve in CA3-Psen cdko mice. Input-output curves, which are plotted initial slopes of the evoked fepsp as function of the amplitude of the
Epilepsy and intellectual disability linked protein Shrm4 interaction with GABA B Rs shapes inhibitory neurotransmission
 Received May 6 Accepted 9 Jan 7 Published 6 Mar 7 DOI:.3/ncomms4536 OPEN Epilepsy and intellectual disability linked protein Shrm4 interaction with GABA B Rs shapes inhibitory neurotransmission Jonathan
SUPPLEMENTARY INFORMATION
 DOI: 10.1038/ncb2566 Figure S1 CDKL5 protein expression pattern and localization in mouse brain. (a) Multiple-tissue western blot from a postnatal day (P) 21 mouse probed with an antibody against CDKL5.
Nature Neuroscience: doi: /nn Supplementary Figure 1
 Supplementary Figure 1 Subcellular segregation of VGluT2-IR and TH-IR within the same VGluT2-TH axon (wild type rats). (a-e) Serial sections of a dual VGluT2-TH labeled axon. This axon (blue outline) has
Authors: K. L. Arendt, M. Royo, M. Fernández-Monreal, S. Knafo, C. N. Petrok, J.
 SUPPLEMENTARY INFORMATION Title: PIP 3 controls synaptic function by maintaining AMPA receptor clustering at the postsynaptic membrane Authors: K. L. Arendt, M. Royo, M. Fernández-Monreal, S. Knafo, C.
Supplementary Figure 1. mir124 does not change neuron morphology and synaptic
 Supplementary Figure 1. mir124 does not change neuron morphology and synaptic density. Hippocampal neurons were transfected with mir124 (containing DsRed) or DsRed as a control. 2 d after transfection,
SUPPLEMENTARY FIGURE LEGENDS
 SUPPLEMENTARY FIGURE LEGENDS Supplemental FIG. 1. Localization of myosin Vb in cultured neurons varies with maturation stage. A and B, localization of myosin Vb in cultured hippocampal neurons. A, in DIV
Disrupting GluA2-GAPDH Interaction Affects Axon and Dendrite Development
 Disrupting GluA2-GAPDH Interaction Affects Axon and Dendrite Development 1 Frankie Hang Fung Lee, 1 Ping Su, 1 Yu Feng Xie, 1 Kyle Ethan Wang, 2 Qi Wan and 1,3 Fang Liu 1 Campbell Research Institute, Centre
Supplementary Figure 1
 Supplementary Figure 1 Supplementary Figure 1 SNARE Probes for FRET/2pFLIM Analysis Used in the Present Study. mturquoise (mtq) and Venus (Ven) are in blue and yellow, respectively. The soluble N-ethylmaleimide-sensitive
Structural basis for the role of inhibition in facilitating adult brain plasticity
 Structural basis for the role of inhibition in facilitating adult brain plasticity Jerry L. Chen, Walter C. Lin, Jae Won Cha, Peter T. So, Yoshiyuki Kubota & Elly Nedivi SUPPLEMENTARY FIGURES 1-6 a b M
Supplementary Figure 1. SDS-FRL localization of CB 1 in the distal CA3 area of the rat hippocampus. (a-d) Axon terminals (t) in stratum pyramidale
 Axon terminals (t) in stratum pyramidale") Supplementary Figure 1. SDS-FRL localization of CB 1 in the distal CA3 area of the rat hippocampus. (a-d) Axon terminals (t) in stratum pyramidale (b) show stronger immunolabeling for CB 1 than those in
Supplementary Figure 1. SDS-FRL localization of CB 1 in the distal CA3 area of the rat hippocampus. (a-d) Axon terminals (t) in stratum pyramidale (b) show stronger immunolabeling for CB 1 than those in
Supplemental Materials Molecular Biology of the Cell
 Supplemental Materials Molecular Biology of the Cell Garcia-Alvarez et al. Supplementary Figure Legends Figure S1.Expression and RNAi-mediated silencing of STIM1 in hippocampal neurons (DIV, days in vitro).
Supplemental information Acid-sensing ion channel 1a contributes to hippocampal LTP inducibility through multiple mechanisms
 Supplemental information Acid-sensing ion channel 1a contributes to hippocampal LTP inducibility through multiple mechanisms Ming-Gang Liu, Hu-Song Li, Wei-Guang Li, Yan-Jiao Wu, Shi-Ning Deng, Chen Huang,
SUPPLEMENTARY INFORMATION
 SUPPLEMENTARY INFORMATION doi:10.1038/nature11306 Supplementary Figures Supplementary Figure 1. Basic characterization of GFP+ RGLs in the dentate gyrus of adult nestin-gfp mice. a, Sample confocal images
Figure S1. (A) SDS-PAGE separation of GST-fusion proteins purified from E.coli BL21 strain is shown. An equal amount of GST-tag control, LRRK2 LRR
 SDS-PAGE separation of GST-fusion proteins purified from E.coli BL21 strain is shown. An equal amount of GST-tag control, LRRK2 LRR") Figure S1. (A) SDS-PAGE separation of GST-fusion proteins purified from E.coli BL21 strain is shown. An equal amount of GST-tag control, LRRK2 LRR and LRRK2 WD40 GST fusion proteins (5 µg) were loaded
Figure S1. (A) SDS-PAGE separation of GST-fusion proteins purified from E.coli BL21 strain is shown. An equal amount of GST-tag control, LRRK2 LRR and LRRK2 WD40 GST fusion proteins (5 µg) were loaded
Supplementary Materials for
 www.sciencesignaling.org/cgi/content/full/6/283/ra57/dc1 Supplementary Materials for JNK3 Couples the Neuronal Stress Response to Inhibition of Secretory Trafficking Guang Yang,* Xun Zhou, Jingyan Zhu,
mm Distance (mm)
") b a Magnet Illumination Coverslips MPs Objective 2575 µm 1875 µm 1575 µm 1075 µm 875 µm 545 µm 20µm 2 3 0.5 0.3mm 1 1000 100 10 1 0.1 1000 100 10 1 0.1 Field Induction (Gauss) 1.5 0 5 10 15 20 Distance
b a Magnet Illumination Coverslips MPs Objective 2575 µm 1875 µm 1575 µm 1075 µm 875 µm 545 µm 20µm 2 3 0.5 0.3mm 1 1000 100 10 1 0.1 1000 100 10 1 0.1 Field Induction (Gauss) 1.5 0 5 10 15 20 Distance
Supplementary Figure 1.TRIM33 binds β-catenin in the nucleus. a & b, Co-IP of endogenous TRIM33 with β-catenin in HT-29 cells (a) and HEK 293T cells
 and HEK 293T cells") Supplementary Figure 1.TRIM33 binds β-catenin in the nucleus. a & b, Co-IP of endogenous TRIM33 with β-catenin in HT-29 cells (a) and HEK 293T cells (b). TRIM33 was immunoprecipitated, and the amount of
Supplementary Figure 1.TRIM33 binds β-catenin in the nucleus. a & b, Co-IP of endogenous TRIM33 with β-catenin in HT-29 cells (a) and HEK 293T cells (b). TRIM33 was immunoprecipitated, and the amount of
File name: Supplementary Information Description: Supplementary Figures, Supplementary Table and Supplementary References
 File name: Supplementary Information Description: Supplementary Figures, Supplementary Table and Supplementary References File name: Supplementary Data 1 Description: Summary datasheets showing the spatial
SUPPLEMENTARY INFORMATION
 DOI: 10.1038/ncb2988 Supplementary Figure 1 Kif7 L130P encodes a stable protein that does not localize to cilia tips. (a) Immunoblot with KIF7 antibody in cell lysates of wild-type, Kif7 L130P and Kif7
Supplementary Figure 1. Properties of various IZUMO1 monoclonal antibodies and behavior of SPACA6. (a) (b) (c) (d) (e) (f) (g) .
 (b) (c) (d) (e) (f) (g) .") Supplementary Figure 1. Properties of various IZUMO1 monoclonal antibodies and behavior of SPACA6. (a) The inhibitory effects of new antibodies (Mab17 and Mab18). They were investigated in in vitro fertilization
Supplementary Figure 1. Properties of various IZUMO1 monoclonal antibodies and behavior of SPACA6. (a) The inhibitory effects of new antibodies (Mab17 and Mab18). They were investigated in in vitro fertilization
293T cells were transfected with indicated expression vectors and the whole-cell extracts were subjected
 SUPPLEMENTARY INFORMATION Supplementary Figure 1. Formation of a complex between Slo1 and CRL4A CRBN E3 ligase. (a) HEK 293T cells were transfected with indicated expression vectors and the whole-cell
Nature Neuroscience: doi: /nn Supplementary Figure 1
 Supplementary Figure 1 Bidirectional optogenetic modulation of the tonic activity of CEA PKCδ + neurons in vitro. a, Top, Cell-attached voltage recording illustrating the blue light-induced increase in
Nature Neuroscience: doi: /nn Supplementary Figure 1. ACx plasticity is required for fear conditioning.
 Supplementary Figure 1 ACx plasticity is required for fear conditioning. (a) Freezing time of conditioned and control mice before CS presentation and during CS presentation in a new context. Student s
Supplementary Figure 1
 Supplementary Figure 1 Arcuate ChIEF-tdTomato neurons expressed TH These micrographs show that TH-Cre-ChIEF-tdTomato (magenta), expressed by AAV in a TH-Cre mouse, were immunostained with TH (green) in
Dep. Control Time (min)
") aa Control Dep. RP 1s 1 mv 2s 1 mv b % potentiation of IPSP 2 15 1 5 Dep. * 1 2 3 4 Time (min) Supplementary Figure 1. Rebound potentiation of IPSPs in PCs. a, IPSPs recorded with a K + gluconate pipette
aa Control Dep. RP 1s 1 mv 2s 1 mv b % potentiation of IPSP 2 15 1 5 Dep. * 1 2 3 4 Time (min) Supplementary Figure 1. Rebound potentiation of IPSPs in PCs. a, IPSPs recorded with a K + gluconate pipette
Type of file: PDF Title of file for HTML: Supplementary Information Description: Supplementary Figures
 Type of file: PDF Title of file for HTML: Supplementary Information Description: Supplementary Figures Type of file: MOV Title of file for HTML: Supplementary Movie 1 Description: NLRP3 is moving along
SUPPLEMENTARY INFORMATION
 doi: 10.1038/nature06994 A phosphatase cascade by which rewarding stimuli control nucleosomal response A. Stipanovich*, E. Valjent*, M. Matamales*, A. Nishi, J.H. Ahn, M. Maroteaux, J. Bertran-Gonzalez,
Nature Neuroscience: doi: /nn Supplementary Figure 1. PICALM expression in brain capillary endothelium in human brain and in mouse brain.
 Supplementary Figure 1 PICALM expression in brain capillary endothelium in human brain and in mouse brain. a, Double immunostaining for PICALM (red, left) and lectin positive endothelial profiles (blue,
Zhu et al, page 1. Supplementary Figures
 Zhu et al, page 1 Supplementary Figures Supplementary Figure 1: Visual behavior and avoidance behavioral response in EPM trials. (a) Measures of visual behavior that performed the light avoidance behavior
Ube3a is required for experience-dependent maturation of the neocortex
 Ube3a is required for experience-dependent maturation of the neocortex Koji Yashiro, Thorfinn T. Riday, Kathryn H. Condon, Adam C. Roberts, Danilo R. Bernardo, Rohit Prakash, Richard J. Weinberg, Michael
Nature Neuroscience: doi: /nn Supplementary Figure 1. Trial structure for go/no-go behavior
 Supplementary Figure 1 Trial structure for go/no-go behavior a, Overall timeline of experiments. Day 1: A1 mapping, injection of AAV1-SYN-GCAMP6s, cranial window and headpost implantation. Water restriction
SUPPLEMENTARY INFORMATION
 doi: 1.138/nature6416 Supplementary Notes Spine Ca 2+ signals produced by glutamate uncaging We imaged uncaging-evoked [Ca 2+ ] transients in neurons loaded with a green Ca 2+ - sensitive indicator (G;
SUPPLEMENTARY INFORMATION
 Figure S1. Loss of Ena/VASP proteins inhibits filopodia and neuritogenesis. (a) Bar graph of filopodia number per stage 1 control and mmvvee (Mena/ VASP/EVL-null) neurons at 40hrs in culture. Loss of all
The Nogo Receptor Family Restricts Synapse Number in the Developing Hippocampus
 Article The Nogo Receptor Family Restricts Synapse Number in the Developing Hippocampus Zachary P. Wills,, Caleigh Mandel-Brehm, Alan R. Mardinly, Alejandra E. McCord, Roman J. Giger, 3,4 and Michael E.
Palmitoylation regulates glutamate receptor distributions in postsynaptic densities through control of PSD95 conformation and orientation
 Palmitoylation regulates glutamate receptor distributions in postsynaptic densities through control of PSD95 conformation and orientation Okunola Jeyifous a,b,1, Eric I. Lin a,b,1, Xiaobing Chen b,c, Sarah
Supplementary Materials for. c-abl Activation Plays a Role in α-synucleinopathy Induced Neurodegeneration
 Supplementary Materials for c-abl Activation Plays a Role in α-synucleinopathy Induced Neurodegeneration Saurav Brahmachari, Preston Ge, Su Hyun Lee, Donghoon Kim, Senthilkumar S. Karuppagounder, Manoj
Supplementary Materials for VAMP4 directs synaptic vesicles to a pool that selectively maintains asynchronous neurotransmission
 Supplementary Materials for VAMP4 directs synaptic vesicles to a pool that selectively maintains asynchronous neurotransmission Jesica Raingo, Mikhail Khvotchev, Pei Liu, Frederic Darios, Ying C. Li, Denise
Nature Structural and Molecular Biology: doi: /nsmb Supplementary Figure 1
 Supplementary Figure 1 Mutational analysis of the SA2-Scc1 interaction in vitro and in human cells. (a) Autoradiograph (top) and Coomassie stained gel (bottom) of 35 S-labeled Myc-SA2 proteins (input)
Supplementary Information
 Supplementary Information D-Serine regulates cerebellar LTD and motor coordination through the 2 glutamate receptor Wataru Kakegawa, Yurika Miyoshi, Kenji Hamase, Shinji Matsuda, Keiko Matsuda, Kazuhisa
TGF-β Signaling Regulates Neuronal C1q Expression and Developmental Synaptic Refinement
 Supplementary Information Title: TGF-β Signaling Regulates Neuronal C1q Expression and Developmental Synaptic Refinement Authors: Allison R. Bialas and Beth Stevens Supplemental Figure 1. In vitro characterization
Supplementary figure 1: LII/III GIN-cells show morphological characteristics of MC
 1 2 1 3 Supplementary figure 1: LII/III GIN-cells show morphological characteristics of MC 4 5 6 7 (a) Reconstructions of LII/III GIN-cells with somato-dendritic compartments in orange and axonal arborizations
Supporting Online Material for
 www.sciencemag.org/cgi/content/full/312/5779/1533/dc1 Supporting Online Material for Long-Term Potentiation of Neuron-Glia Synapses Mediated by Ca 2+ - Permeable AMPA Receptors Woo-Ping Ge, Xiu-Juan Yang,
Supplementary Figure 1. SybII and Ceb are sorted to distinct vesicle populations in astrocytes. Nature Neuroscience: doi: /nn.
 Supplementary Figure 1 SybII and Ceb are sorted to distinct vesicle populations in astrocytes. (a) Exemplary images for cultured astrocytes co-immunolabeled with SybII and Ceb antibodies. SybII accumulates
Supplementary Figure 1: Validation of labeling specificity of immature OSNs and presynaptic terminals. (A) (B) (C) (D) (E)
 (B) (C) (D) (E)") Supplementary Figure 1: Validation of labeling specificity of immature OSNs and presynaptic terminals. (A) Confocal images of septal olfactory epithelium of an adult Gγ8-sypGFP-tdTom mouse showing colocalization
Supplementary Figure 1: Validation of labeling specificity of immature OSNs and presynaptic terminals. (A) Confocal images of septal olfactory epithelium of an adult Gγ8-sypGFP-tdTom mouse showing colocalization
Supplementary Figure S1. Venn diagram analysis of mrna microarray data and mirna target analysis. (a) Western blot analysis of T lymphoblasts (CLS)
 Western blot analysis of T lymphoblasts (CLS)") Supplementary Figure S1. Venn diagram analysis of mrna microarray data and mirna target analysis. (a) Western blot analysis of T lymphoblasts (CLS) and their exosomes (EXO) in resting (REST) and activated
Supplementary Figure S1. Venn diagram analysis of mrna microarray data and mirna target analysis. (a) Western blot analysis of T lymphoblasts (CLS) and their exosomes (EXO) in resting (REST) and activated
Supplementary Figure 1) GABAergic enhancement by leptin hyperpolarizes POMC neurons A) Representative recording samples showing the membrane
 GABAergic enhancement by leptin hyperpolarizes POMC neurons A) Representative recording samples showing the membrane") Supplementary Figure 1) GABAergic enhancement by leptin hyperpolarizes POMC neurons A) Representative recording samples showing the membrane potential recorded from POMC neurons following treatment with
Supplementary Figure 1) GABAergic enhancement by leptin hyperpolarizes POMC neurons A) Representative recording samples showing the membrane potential recorded from POMC neurons following treatment with
Nature Immunology: doi: /ni.3866
 Nature Immunology: doi:10.1038/ni.3866 Supplementary Figure 1 The effect of TIPE2 on chemotaxis. a, The expression of TIPE2 in dhl-60c, dhl-60t, TIPE2-expressing and 15/16Q-expressing dhl-60t neutrophils
Supplementary Table I Blood pressure and heart rate measurements pre- and post-stroke
 SUPPLEMENTARY INFORMATION doi:10.1038/nature09511 Supplementary Table I Blood pressure and heart rate measurements pre- and post-stroke Pre Post 7-days Systolic Diastolic BPM Systolic Diastolic BPM Systolic
(a) Significant biological processes (upper panel) and disease biomarkers (lower panel)
 Significant biological processes (upper panel) and disease biomarkers (lower panel)") Supplementary Figure 1. Functional enrichment analyses of secretomic proteins. (a) Significant biological processes (upper panel) and disease biomarkers (lower panel) 2 involved by hrab37-mediated secretory
Supplementary Figure 1. Functional enrichment analyses of secretomic proteins. (a) Significant biological processes (upper panel) and disease biomarkers (lower panel) 2 involved by hrab37-mediated secretory
Supplementary Figure 1
 Supplementary Figure 1 Localization of virus injections. (a) Schematic showing the approximate center of AAV-DIO-ChR2-YFP injection sites in the NAc of Dyn-cre mice (n=8 mice, 16 injections; caudate/putamen,
Nature Neuroscience: doi: /nn.2275
 Supplementary Figure S1. The presence of MeCP2 in enriched primary glial cultures from rat or mouse brains is not neuronal. Western blot analysis of protein extracts from (a) rat glial and neuronal cultures.
Supplementary Figures
 Supplementary Figures Supplementary Figure 1 Characterization of stable expression of GlucB and sshbira in the CT26 cell line (a) Live cell imaging of stable CT26 cells expressing green fluorescent protein
Nature Neuroscience: doi: /nn Supplementary Figure 1. Iliopsoas and quadratus lumborum motor neurons in the L2 spinal segment.
 Supplementary Figure 1 Iliopsoas and quadratus lumborum motor neurons in the L2 spinal segment. (A) IL and QL motor neurons were labeled after CTb-488 (green) muscle injections at birth. At P4, the L2
Rescue of mutant rhodopsin traffic by metformin-induced AMPK activation accelerates photoreceptor degeneration Athanasiou et al
 Supplementary Material Rescue of mutant rhodopsin traffic by metformin-induced AMPK activation accelerates photoreceptor degeneration Athanasiou et al Supplementary Figure 1. AICAR improves P23H rod opsin
Nature Neuroscience: doi: /nn Supplementary Figure 1. Diverse anorexigenic signals induce c-fos expression in CEl PKC-δ + neurons
 Supplementary Figure 1 Diverse anorexigenic signals induce c-fos expression in CEl PKC-δ + neurons a-c. Quantification of CEl c-fos expression in mice intraperitoneal injected with anorexigenic drugs (a),
04_polarity. The formation of synaptic vesicles
 Brefeldin prevents assembly of the coats required for budding Nocodazole disrupts microtubules Constitutive: coatomer-coated Selected: clathrin-coated The formation of synaptic vesicles Nerve cells (and
Supplementary Figure 1. Basic properties of compound EPSPs at
 Supplementary Figure 1. Basic properties of compound EPSPs at hippocampal CA3 CA3 cell synapses. (a) EPSPs were evoked by extracellular stimulation of the recurrent collaterals and pharmacologically isolated
(B D) Three views of the final refined 2Fo-Fc electron density map of the Vpr (red)-ung2 (green) interacting region, contoured at 1.4σ.
 Three views of the final refined 2Fo-Fc electron density map of the Vpr (red)-ung2 (green) interacting region, contoured at 1.4σ.") Supplementary Figure 1 Overall structure of the DDB1 DCAF1 Vpr UNG2 complex. (A) The final refined 2Fo-Fc electron density map, contoured at 1.4σ of Vpr, illustrating well-defined side chains. (B D) Three
Supplementary Figure 1 Overall structure of the DDB1 DCAF1 Vpr UNG2 complex. (A) The final refined 2Fo-Fc electron density map, contoured at 1.4σ of Vpr, illustrating well-defined side chains. (B D) Three
SUPPLEMENTARY INFORMATION
 a c e doi:10.1038/nature10407 b d f Supplementary Figure 1. SERCA2a complex analysis. (a) Two-dimensional SDS-PAGE gels of SERCA2a complexes. A silver-stained SDSPAGE gel is shown, which reveals a 12 kda
Supplementary Figure 1. Microglia do not show signs of classical immune activation following MD a-b. Images showing immunoreactivity for MHCII (a)
") 1 Supplementary Figure 1. Microglia do not show signs of classical immune activation following MD a-b. Images showing immunoreactivity for MHCII (a) and CD45 (b) in fixed sections of binocular visual cortex
1 Supplementary Figure 1. Microglia do not show signs of classical immune activation following MD a-b. Images showing immunoreactivity for MHCII (a) and CD45 (b) in fixed sections of binocular visual cortex
Supplementary Figure 1
 Supplementary Figure 1 AAV-GFP injection in the MEC of the mouse brain C57Bl/6 mice at 4 months of age were injected with AAV-GFP into the MEC and sacrificed at 7 days post injection (dpi). (a) Brains
Supplementary Materials for
 www.sciencesignaling.org/cgi/content/full/8/358/ra2/dc1 Supplementary Materials for Localized TRPA1 channel Ca 2+ signals stimulated by reactive oxygen species promote cerebral artery dilation Michelle
Supplementary Figure 1
 Supplementary Figure 1 a γ-h2ax MDC1 RNF8 FK2 BRCA1 U2OS Cells sgrna-1 ** 60 sgrna 40 20 0 % positive Cells (>5 foci per cell) b ** 80 sgrna sgrna γ-h2ax MDC1 γ-h2ax RNF8 FK2 MDC1 BRCA1 RNF8 FK2 BRCA1
SUPPLEMENTARY INFORMATION. Supplementary Figure 1
 SUPPLEMENTARY INFORMATION Supplementary Figure 1 The supralinear events evoked in CA3 pyramidal cells fulfill the criteria for NMDA spikes, exhibiting a threshold, sensitivity to NMDAR blockade, and all-or-none
Nature Methods: doi: /nmeth Supplementary Figure 1. Activity in turtle dorsal cortex is sparse.
 Supplementary Figure 1 Activity in turtle dorsal cortex is sparse. a. Probability distribution of firing rates across the population (notice log scale) in our data. The range of firing rates is wide but
Downregulation of the small GTPase SAR1A: a key event underlying alcohol-induced Golgi fragmentation in hepatocytes
 Downregulation of the small GTPase SAR1A: a key event underlying alcohol-induced Golgi fragmentation in hepatocytes Armen Petrosyan 1*, Pi-Wan Cheng 1,3, Dahn L. Clemens 2,3 & Carol A. Casey 2,3 1 Department
SUPPLEMENTARY INFORMATION
 Supplementary Figures Supplementary Figure S1. Binding of full-length OGT and deletion mutants to PIP strips (Echelon Biosciences). Supplementary Figure S2. Binding of the OGT (919-1036) fragments with
Anatomy of a Neuron. Copyright 2000 by BSCS and Videodiscovery, Inc. Permission granted for classroom use. Master 2.1
 Anatomy of a Neuron Master 2.1 Neurons Interact With Other Neurons Through Synapses Master 2.2 How Do Neurons Communicate? 1 2 3 4 5 6 Master 2.3 Neurons Communicate by Neurotransmission Neurons communicate
SUPPLEMENTARY FIGURES
 SUPPLEMENTARY FIGURES Supplementary Figure 1. (A) Left, western blot analysis of ISGylated proteins in Jurkat T cells treated with 1000U ml -1 IFN for 16h (IFN) or left untreated (CONT); right, western
Wenqin Hu, Cuiping Tian, Tun Li, Mingpo Yang, Han Hou & Yousheng Shu
 Distinct contributions of Na v 1.6 and Na v 1.2 in action potential initiation and backpropagation Wenqin Hu, Cuiping Tian, Tun Li, Mingpo Yang, Han Hou & Yousheng Shu Supplementary figure and legend Supplementary
Astrocyte signaling controls spike timing-dependent depression at neocortical synapses
 Supplementary Information Astrocyte signaling controls spike timing-dependent depression at neocortical synapses Rogier Min and Thomas Nevian Department of Physiology, University of Berne, Bern, Switzerland
BIPN 140 Problem Set 6
 BIPN 140 Problem Set 6 1) The hippocampus is a cortical structure in the medial portion of the temporal lobe (medial temporal lobe in primates. a) What is the main function of the hippocampus? The hippocampus
How Nicotinic Signaling Shapes Neural Networks
 How Nicotinic Signaling Shapes Neural Networks Darwin K. Berg Division of Biological Sciences University of California, San Diego Nicotinic Cholinergic Signaling Uses the transmitter ACh to activate cation-selective
Nature Neuroscience: doi: /nn Supplementary Figure 1. Distribution of starter cells for RV-mediated retrograde tracing.
 Supplementary Figure 1 Distribution of starter cells for RV-mediated retrograde tracing. Parcellation of cortical areas is based on Allen Mouse Brain Atlas and drawn to scale. Thick white curves, outlines
BIPN 140 Problem Set 6
 BIPN 140 Problem Set 6 1) Hippocampus is a cortical structure in the medial portion of the temporal lobe (medial temporal lobe in primates. a) What is the main function of the hippocampus? The hippocampus
Ontogeny of biochemical, morphological and functional parameters of synaptogenesis in primary cultures of rat hippocampal and cortical neurons
 Harrill et al. Molecular Brain (2015) 8:10 DOI 10.1186/s13041-015-0099-9 RESEARCH Open Access Ontogeny of biochemical, morphological and functional parameters of synaptogenesis in primary cultures of rat
SUPPLEMENTARY INFORMATION
 DOI:.38/ncb2822 a MTC02 FAO cells EEA1 b +/+ MEFs /DAPI -/- MEFs /DAPI -/- MEFs //DAPI c HEK 293 cells WCE N M C P AKT TBC1D7 Lamin A/C EEA1 VDAC d HeLa cells WCE N M C P AKT Lamin A/C EEA1 VDAC Figure
genome edited transient transfection, CMV promoter
 Supplementary Figure 1. In the absence of new protein translation, overexpressed caveolin-1-gfp is degraded faster than caveolin-1-gfp expressed from the endogenous caveolin 1 locus % loss of total caveolin-1-gfp
Supplementary Figure 1 Expression of Crb3 in mouse sciatic nerve: biochemical analysis (a) Schematic of Crb3 isoforms, ERLI and CLPI, indicating the
 Schematic of Crb3 isoforms, ERLI and CLPI, indicating the") Supplementary Figure 1 Expression of Crb3 in mouse sciatic nerve: biochemical analysis (a) Schematic of Crb3 isoforms, ERLI and CLPI, indicating the location of the transmembrane (TM), FRM binding (FB)
Supplementary Figure 1 Expression of Crb3 in mouse sciatic nerve: biochemical analysis (a) Schematic of Crb3 isoforms, ERLI and CLPI, indicating the location of the transmembrane (TM), FRM binding (FB)
Supplementary Materials
 Supplementary Materials Figure S1. MTT Cell viability assay. To measure the cytotoxic potential of the oxidative treatment, the MTT [3-(4,5-dimethylthiazol- 2-yl)-2,5-diphenyl tetrazolium bromide] assay
What Cell Make Up the Brain and Spinal Cord
 What Cell Make Up the Brain and Spinal Cord Jennifer LaVail, Ph.D. (http://anatomy.ucsf.edu/pages/lavaillab/index.html) What kinds of cells are these?" Neuron?" Epithelial cell?" Glial cell?" What makes
Supplementary Figure 1. GABA depolarizes the majority of immature neurons in the
 Supplementary Figure 1. GABA depolarizes the majority of immature neurons in the upper cortical layers at P3 4 in vivo. (a b) Cell-attached current-clamp recordings illustrate responses to puff-applied
SUPPLEMENTARY LEGENDS...
 TABLE OF CONTENTS SUPPLEMENTARY LEGENDS... 2 11 MOVIE S1... 2 FIGURE S1 LEGEND... 3 FIGURE S2 LEGEND... 4 FIGURE S3 LEGEND... 5 FIGURE S4 LEGEND... 6 FIGURE S5 LEGEND... 7 FIGURE S6 LEGEND... 8 FIGURE
Supplementary Figure 1 Information on transgenic mouse models and their recording and optogenetic equipment. (a) 108 (b-c) (d) (e) (f) (g)
 108 (b-c) (d) (e) (f) (g)") Supplementary Figure 1 Information on transgenic mouse models and their recording and optogenetic equipment. (a) In four mice, cre-dependent expression of the hyperpolarizing opsin Arch in pyramidal cells
Supplementary Figure 1 Information on transgenic mouse models and their recording and optogenetic equipment. (a) In four mice, cre-dependent expression of the hyperpolarizing opsin Arch in pyramidal cells
SUPPLEMENTARY INFORMATION
 Figure S1 Treatment with both Sema6D and Plexin-A1 sirnas induces the phenotype essentially identical to that induced by treatment with Sema6D sirna alone or Plexin-A1 sirna alone. (a,b) The cardiac tube
mtorc2 controls actin polymerization required for consolidation of long-term memory
 CORRECTION NOTICE Nat. Neurosci.; doi:1.138/nn.3351 mtorc2 controls actin polymerization required for consolidation of long-term memory Wei Huang, Ping Jun Zhu, Shixing Zhang, Hongyi Zhou, Loredana Stoica,
SUPPLEMENTARY INFORMATION
 doi:10.1038/nature12652 Supplementary Figure 1. PRDM16 interacts with endogenous EHMT1 in brown adipocytes. Immunoprecipitation of PRDM16 complex by flag antibody (M2) followed by Western blot analysis
Unique functional properties of somatostatin-expressing GABAergic neurons in mouse barrel cortex
 Supplementary Information Unique functional properties of somatostatin-expressing GABAergic neurons in mouse barrel cortex Luc Gentet, Yves Kremer, Hiroki Taniguchi, Josh Huang, Jochen Staiger and Carl
Supplementary Figure 1. Normal T lymphocyte populations in Dapk -/- mice. (a) Normal thymic development in Dapk -/- mice. Thymocytes from WT and Dapk
 Normal thymic development in Dapk -/- mice. Thymocytes from WT and Dapk") Supplementary Figure 1. Normal T lymphocyte populations in Dapk -/- mice. (a) Normal thymic development in Dapk -/- mice. Thymocytes from WT and Dapk -/- mice were stained for expression of CD4 and CD8.
Supplementary Figure 1. Normal T lymphocyte populations in Dapk -/- mice. (a) Normal thymic development in Dapk -/- mice. Thymocytes from WT and Dapk -/- mice were stained for expression of CD4 and CD8.
Supporting Information
 ATP from synaptic terminals and astrocytes regulates NMDA receptors and synaptic plasticity through PSD- 95 multi- protein complex U.Lalo, O.Palygin, A.Verkhratsky, S.G.N. Grant and Y. Pankratov Supporting
LPS LPS P6 - + Supplementary Fig. 1.
 P6 LPS - - - + + + - LPS + + - - P6 + Supplementary Fig. 1. Pharmacological inhibition of the JAK/STAT blocks LPS-induced HMGB1 nuclear translocation. RAW 267.4 cells were stimulated with LPS in the absence
BMI risk SNPs associate with increased CADM1 and CADM2 expression in the cerebellum of human subjects.
 Supplementary Figure 1 BMI risk SNPs associate with increased CADM1 and CADM2 expression in the cerebellum of human subjects. Boxplots show the 25% and 75% quantiles of normalized mrna expression levels
Supplementary Figure 1. Spatial distribution of LRP5 and β-catenin in intact cardiomyocytes. (a) and (b) Immunofluorescence staining of endogenous
 and (b) Immunofluorescence staining of endogenous") Supplementary Figure 1. Spatial distribution of LRP5 and β-catenin in intact cardiomyocytes. (a) and (b) Immunofluorescence staining of endogenous LRP5 in intact adult mouse ventricular myocytes (AMVMs)
Supplementary Figure 1. Spatial distribution of LRP5 and β-catenin in intact cardiomyocytes. (a) and (b) Immunofluorescence staining of endogenous LRP5 in intact adult mouse ventricular myocytes (AMVMs)
SUPPLEMENTARY INFORMATION
 SUPPLEMENTARY INFORMATION Human cerebral cortex development from pluripotent stem cells to functional excitatory synapses Yichen Shi 1,2, Peter Kirwan 1,2, James Smith 1,2, Hugh P.C. Robinson 3 and Frederick
Supplementary figure 1
 Supplementary figure 1 (A) Quantitative analysis of F-actin signal intensity in NIH3T3 cells treated with PTD4-myc- RBD. NIH3T3 cells were treated with PTD4-myc-RBD as described. Please note the increase
Tyrodes solution in a custom-built imaging chamber as described previously. Images were acquired
 Supplemental Material Supplemental Methods Electrical stimulation of CX-G3-labeled hippocampal neurons Following 5 min incubation in 0.5 µm CX-G3 and washes, 18-20 DIV neurons were imaged in normal Tyrodes
Synaptic plasticityhippocampus. Neur 8790 Topics in Neuroscience: Neuroplasticity. Outline. Synaptic plasticity hypothesis
 Synaptic plasticityhippocampus Neur 8790 Topics in Neuroscience: Neuroplasticity Outline Synaptic plasticity hypothesis Long term potentiation in the hippocampus How it s measured What it looks like Mechanisms
Dynamic mechanisms of neuroligin-dependent presynaptic terminal assembly in living cortical neurons
 Bury and Sabo Neural Development 2014, 9:13 RESEARCH ARTICLE Open Access Dynamic mechanisms of neuroligin-dependent presynaptic terminal assembly in living cortical neurons Luke AD Bury 1 and Shasta L
Nature Neuroscience: doi: /nn Supplementary Figure 1
 Supplementary Figure 1 Quantification of myelin fragments in the aging brain (a) Electron microscopy on corpus callosum is shown for a 18-month-old wild type mice. Myelin fragments (arrows) were detected