Long term Efficacy of a Pre-erythrocytic malaria vaccine and correlates of. protection in children residing in a malaria endemic country
|
|
|
- Arline Owens
- 5 years ago
- Views:
Transcription

1 Long term Efficacy of a Pre-erythrocytic malaria vaccine and correlates of protection in children residing in a malaria endemic country A thesis submitted for degree of Doctor of Philosophy. Ally Olotu Kellogg College, University of Oxford May 2013 (Trinity Term)
2 Table of contents i. List of Tables... i ii. List of Figures... ii iii. Acknowledgements... vi iv. Author s contribution... viii v. Abstract... xi 1 Introduction Burden of malaria Current malaria interventions Insecticide treated bed nets (ITNs) Antimalarial drugs Intermittent presumptive treatment Indoor residual spraying Changing malaria epidemiology Role of malaria vaccines Pre-erythrocytic vaccines Blood stage vaccines Transmission blocking vaccines (TBV) Introduction to RTS,S: a candidate pre-erythrocytic malaria vaccine Circumsporozoite protein (CS protein) Natural anti-cs protein antibodies RTS,S antigen RTS,S development: Initial proof of concept Phase 1 and 2a trials Phase 2b trials Paediatric vaccine development Long term efficacy Vaccine-induced immune responses Vaccine-induced antibody responses Vaccine-induced T cell responses Measuring vaccine-induced responses... 23
3 Measuring antibody levels Measuring cellular responses RTS,S-induced anti-cs protein antibodies Anti-CS protein antibody function Anti-CS protein antibody subtypes Anti-CS protein antibody affinity RTS,S-induced cell mediated immune response Studies in adults Studies in children Malaria surveillance Methods of analysing malaria vaccine efficacy Parameters used in vaccine efficacy analysis Measures of vaccine impact Decision making on vaccine introduction Challenges in estimating efficacy of malaria vaccines Vaccine efficacy from time to first event analysis Heterogeneity in malaria exposure Effect on time to event analysis Measuring individual malaria exposure Frailty model Multiple episode analysis Poisson regression Generalized estimating equation models Modified Cox regression models Duration of protective efficacy Measurement of duration of vaccine efficacy Potential for rebound malaria in RTS,S vaccinees Summary Objectives Comparison of Surveillance methodologies Background Methods Study cohorts and surveillance... 60
4 2.2.2 Ethics statement Laboratory investigations Calculation of Malaria Attributable Fraction Calculation of Incidence rate Results MAFs of clinical malaria with objective or subjective fever Parasite densities Comparison of active and passive surveillance Discussion Conclusion Malaria exposure index Background Methods Cohort population and data Relationship between malaria infection and proximity to infected case Calculation of weighted local prevalence of malaria infection Selection of best radius Univariate analysis Multivariable analysis and model calibration Ethical considerations Results Risk of malaria as a function of proximity to the infected case Risk of malaria as a function of the weighted local malaria prevalence within a 1 km radius Effect of malaria hotspot and age on the risk of malaria infection Multivariable models for predicting risk of malaria infection Local malaria prevalence and Merozoite antibodies based models in predicting malaria risk Discussion Conclusion Long term efficacy of RTS,S/AS01E Introduction Methodology Study design
5 4.2.2 Participants Study procedure Randomization and masking Vaccination Surveillance of clinical malaria cases Cross sectional bleeds Malaria Exposure Statistical analysis Analysis of efficacy against first episode Analysis of efficacy against all episodes Assessment of waning in vaccine efficacy Assessment of cases of malaria averted Results Trial profile Efficacy against the first or only malaria episode Efficacy against all episodes Efficacy and interactions with time and malaria exposure Clinical malaria episodes averted Cross sectional survey analysis Discussion Conclusion Correlates of protection: Anti-CS protein antibodies Introduction Methodology Study design CS antibody measurement Statistical analysis Analysis of combined data Analysis of Kilifi data Results Combined data Anti-CS protein decay overtime Association between anti-cs protein titres and protection
6 5.3.2 Kilifi data Anti-CS protein titres during four years of follow-up Association between anti-cs protein titres and protection Discussion Conclusion Correlates of protection: T cell immune responses in adults Introduction Methods Results Discussion Correlates of protection: T cell immune responses in children Introduction Methods CS protein antibody measurement and peptide used Statistical analysis Results Vaccine induced anti-cs protein T cell responses: ICS assays ELISPOT assays Time course of responses (ICS assays) Inter assay correlations Correlates of immunity Discussion Surrogates of protection Conclusion Anti-CS protein antibody avidity and protection Introduction Materials and Methodology Vaccine and subjects Study design IgG antibody concentrations TNF-α CD4 T cell immune responses Anti-CS protein avidity assay Statistical analysis
7 8.3 Results Anti-CS protein avidity Avidity and protection from clinical malaria Avidity and malaria exposure Discussion Conclusion Concluding remarks Introduction Theoretical Implications Potential policy implications Recommendations for future research References Appendices Appendix A Peptides used in cellular assays ELISPOT assays ELISPOT analysis Whole blood ICS assay Appendix B
8 i. List of Tables Table 2-1 Baseline characteristics of cohort used in the analysis Table 2-2 Malaria attributable fractions of malaria case definitions for any parasitaemia and >2500/uL in the four cohorts Table 2-3 Comparison between passive surveillance and active surveillance during follow-up from May 2007 to May 2008 in a subset of children aged 5-17 months Table 3-1 Demographic and parasitological characteristic of the cohort used in the analysis Table 3-2 Effect of weighted local prevalence of malaria infection from four annuli around each individual on risk of malaria infection Table 3-3 Weighted local prevalence of malaria infection for four monthly follow-up data Table 3-4 Univariate and multivariable analysis of predictors of malaria infections Table 3-5 Merozoite antibody versus weighted local prevalence models in predicting malaria infection in Junju sub-cohort Table 4-1 Baseline characteristics and follow-up time summary (per protocol cohort). 118 Table 4-2 Efficacy of RTS,S/AS01E against Plasmodium falciparum clinical malaria and asymptomatic parasitaemia Table 4-3 Selection of working correlation structure Table 4-4 Model selection for analysis of efficacy against all clinical malaria using negative binomial model through GEE Table 4-5 Interaction analyses between vaccination, malaria exposure index and year of follow-up (According to protocol cohort) Table 4-6 Interactions analysis between vaccination, malaria exposure index and year of follow-up by binomial regression through GEE (According to protocol cohort) Table 4-7 Stratified adjusted vaccine efficacy against all clinical malaria by malaria exposure index and year of follow-up by negative binomial regression (According to protocol cohort) i
9 Table 4-8 Asymptomatic parasitaemia at cross-sectional bleed in the per protocol cohort Table 5-1 Comparison of cubic spline models Table 6-1 : Multiple regression analysis for the first and second definition of protection Table 7-1: Geometric means of ICS assays by clinic visit and by vaccination group Table 7-2: Geometric means of cultured ELISPOT assays by clinic visit and by vaccination group Table 7-3: Geometric means of ex vivo ELISPOT assays by clinic visit and by vaccination group Table 7-4: Inter-assay Correlation coefficients of CMI assays at 1 month post vaccination with RTS,S/AS01E Table 7-5: The hazard ratio from Cox regression models (with 95% CI) for the outcome clinical malaria by CMI assays Table 8-1: Multivariable logistic regression analysis for the effect avidity on clinical malaria Table 11-1 Peptide pools used in ELISPOT assays ii. List of Figures Figure 1:1: RTS,S particles; Source (GSK Biologicals RTS,S power point 2012) Figure 1:2: Simulation data showing effect of heterogeneity in malaria exposure on efficacy estimates Figure 1:3: Proportion of different presentations of malaria by age (from Langhorne et al [224] ) Figure 2:1: Location of cohorts used in the study Figure 2:2 Variation of geometric parasite density mean with distance from Pingilikani dispensary ii
10 3:1 Annuli around index child Figure 3:2 Rate of change in the risk of malaria infection over distance to infected and uninfected case within first kilometer Figure 3:3 Local distance-weighted malaria prevalences in Junju cohort Figure 3:4 Local distance-weighted malaria prevalences in Chonyi cohort Figure 3:5 Local distance-weighted malaria prevalences in Ngerenya cohort Figure 3:6 Mi Multivariable fractional polynomial plots of effect of age on the risk of malaria infection Figure 3:7 Causal directed acyclic graphs (DAG) Figure 3:8 Area under the ROC curves for the multivariable weighted local prevalence based models Figure 4:1 Consort diagram Figure 4:2 Kaplan-Meier curves and vaccine efficacy over time (According to protocol cohort) Figure 4:3 Comparison of Negative binomial and Poisson distribution fit of data (According to protocol cohort) Figure 4:4 Malaria incidences by exposure group and Vaccine-attributable reduction (Intention to treat cohort) Figure 4:5 Histogram showing frequency of clinical malaria episodes (primary case definition) by vaccine group Figure 5:1 Anti-CS protein antibody titres in RTS,S/AS01E vaccinees (Kilifi and Korogwe combined data) Figure 5:2 KM plots for the risk of clinical malaria based on the anti-cs protein titres at 1 month post dose Figure 5:3 KM plots for the risk of clinical malaria based on anti-cs protein titres at 6.5 month Figure 5:4 Linear decay of anti-cs protein titres in selected RTS,S vaccinees (combined data) iii
11 Figure 5:5 Log likelihood ratio graph for the optimal dichotomization level of anti-cs protein titres (combined data) Figure 5:6 Cumulative distribution curve for association between anti-cs protein titres and protection (combined data) Figure 5:7: Anti-CS protein antibody titres over time (Kilifi data) Figure 5:8: Imputed individual anti-cs protein antibody titres (Kilifi data) Figure 5:9 Imputed individual anti-cs protein antibody titres by malaria exposure Figure 5:10 Anti-CS protein titres by malaria exposure group and follow-up (Kilifi data) Figure 5:11 Non-linear association between protection and anti-cs protein titres based on cubic spline model (Kilifi data) Figure 5:12 Log likelihood ratio for the optimal dichotomization level of anti-cs protein titres (Kilifi data) Figure 6:1 CS protein specific CD4+ T cell and antibody responses and their relation to protection against malaria-infected mosquito challenge (Modified from Kester et al JID 2009[131]) Figure 7:1: An example plot of FACS data acquired following intra-cellular cytokine staining is shown for negative control (medium only), positive control (i.e. staphylococcal enterotoxin B, SEB) and CS peptides Figure 7:2: The time course of anti-cs protein CD4+ ICS responses and summed ELISPOT responses is shown per time point for RTS,S/AS01E and control vaccination groups Figure 7:3: ELISPOT responses are shown for the individual stimulating peptide pools at 1 month post vaccination with RTS,S/AS01E Figure 7:4 Survival plots with time to first episode of clinical malaria plotted for RTS,S/AS01E (left columns) and control vaccinees (left and right columns) according to tertile of CD4+, TNF-α responses (top row), CD4+ IFNγ responses (middle row) and IFN-γ ex vivo ELISPOT responses to TH3R/CS.T3T peptides pool (lower row) Figure 8:1: Anti-CS protein titres in cases and controls during 15 months of follow-up 189 iv
12 Figure 8:2: Matrix diagram showing correlation between antibody avidity measured at three time points during the follow up Figure 8:3: Panel A: correlation between anti-cs protein antibody avidity at 1 month post dose 3 and age; Panel B: correlation between anti-cs protein antibody avidity and anti- CS protein antibody titres at 1 month post dose Figure 8:4: Box plot of anti-cs protein antibody avidity in cases, controls and 19 protected children with low antibodies titre and high malaria exposure at 1, ~8 and 12 months post dose Figure 8:5: Box plot of anti-cs protein antibody avidity by level of malaria exposure (based on malaria exposure index) at 1, ~8 and 12 months post dose v
13 iii. Acknowledgements I would like to first and foremost thank God for his blessings which has made my achievements possible. However, it would not have been possible to complete my thesis without the support and well wishes from so many people of whom only a few I can acknowledge here. My wife Saumu stands out above all for her personal support and immense patience and sacrifice during my entire period of training. Despite difficult moments we went through, she was a source of constant encouragement and mere expression of thanks does not suffice to express my deepest gratitude to her. My two sons Imran and Iman were my inspiration and I thank them dearly for bringing me joy during frustrating times. I would also like thank my parents who have always given me their unequivocal support for which I offer my sincere appreciation. I would like to sincerely thank my principal supervisor Dr Philip Bejon for his help, support and patience. It has been an honour to be his first DPhil student. His enthusiasm and excellence in what he does has been most valuable lesson for me. I have learnt great deal of skills from him and I appreciate both his academic support and personal friendship. I would also like to sincerely thank my other two supervisors Prof. Kevin Marsh and Gregory Fegan for their support and guidance. I would like to acknowledge the financial, academic and technical support of KEMRI- Wellcome Trust Research programme and its Training department particularly for the strategic award that provided the necessary financial support during my training. In the vi
14 same breath I would like thank Malaria Vaccine Initiative for the financial support to conduct the study which provided platform for my work. I would also like to extend my appreciation to the laboratory staff from KEMRI Wellcome Trust programme especially to Francis Ndungu, Jedidah Mwachiro, Jeniffer Musyoki, Oscar Kai, and Domtila Kimani who were extremely supportive during my laboratory training and sample processing. Other project personnel who were instrumental to my work and who I feel indebted to, include Juliana Wambua (project manager), George Nyangweso (data manager) and community field workers whose professionalism was key in providing credible data for my research. I would also like to thank the Centre for vaccinology at University of Ghent for their support and assistance while I was attached to their laboratory, especially the head of department, Prof. Geert Leroux-Roels and Frederic Clement. I am most grateful to GSK Biologicals for providing access to the study blood samples for my research. Last, but by no means least, I thank my friends in KEMRI-WT, GSK Biologicals and elsewhere for their support and encouragement throughout my research. vii
15 iv. Author s contribution Prior to my D. Phil studies, I participated as a Co-principal investigator, in setting up the original randomized controlled trial to assess the safety and efficacy of RTS,S/AS01E against clinical malaria by P. falciparum in young children aged 5-17 months residing in Kilifi, Kenya, and in Korogwe, Tanzania. This trial was sponsored by GlaxoSmithKline Biologicals (GSK Biologicals) and ended in November I then led an investigatorled extension of follow-up beyond November 2008, which was completed in November I registered in October 2009 for my D Phil. The extended follow up in the field conducted between October 2009 and November 2012, in conjunction with a series of epidemiological analyses form the basis of this D Phil thesis. I detail my exact contributions by chapter below. Chapter 2: Comparison of Active and Passive Surveillance Methods Data were provided from active surveillance of the RTS,S cohort (for which I supervised the field work), and from passive surveillance at Pingilikani dispensary (which I was not involved in). I planned and conducted the analysis that I present below. Chapter 3: Exposure Index. Data were provided from longitudinal surveillance of three cohorts (Junju, Chonyi and Ngerenya) over a 12 year period. I planned and conducted the analysis presented below. viii
16 Chapter 4: Long term efficacy of RTS,S/AS01 I participated in the protocol writing, training study staff and supervising research assistants and project manager in the field. I also supervised all the field work activities. I wrote the statistical analysis plan, and conducted the analysis including further exploratory analysis which I present below. Chapter 5: Correlate of protection: Anti-CS protein antibody I wrote the statistical analysis plan and conducted the analysis of the data. I designed and supervised collection and shipment samples from the field. Measurement of antibody titres was done by research scientists at GSK Biologicals Laboratory. Chapter 6: Correlate of protection: T cell immune responses I supervised collection of the samples from the field and participated in the separation of peripheral blood mononuclear cells from the whole blood, but I did not conduct the CMI assays. I conducted the analysis that I present below. Chapter 7: Anti-CS protein antibody avidity and protection I conducted the avidity assays at Centre for Vaccinology (CEVAC), Ghent University and analysed the data. The literature review presented in chapter 1, presentation of results and interpretation, and concluding remarks in chapter 8 are my own work. ix
17 Some of the work presented in this thesis has also been published in peer review journals as follows: 1. Chapter 2: Olotu A, Fegan G, Williams TN et al. Defining clinical malaria: the specificity and incidence of endpoints from active and passive surveillance of children in rural Kenya. PLoS One Dec 16;5(12) 2. Chapter 3: Olotu A, Fegan G, Wambua J, Nyangweso G, Ogada E, Drakeley C, Marsh K, Bejon P. Estimating individual exposure to malaria using local prevalence of malaria infection in the field. PLoS One. 2012;7(3) 3. Chapter 4: Olotu A et al, Four-year efficacy of RTS,S/AS01E and its interaction with malaria exposure, NEJM Mar Chapter 5: Olotu A, Lusingu J, Leach A et al. Efficacy of RTS,S/AS01E malaria vaccine and exploratory analysis on anti-cs protein antibody titres and protection in children aged 5-17 months in Kenya and Tanzania: a randomised controlled trial. Lancet Infect Dis Feb;11(2): Chapter 6: Olotu AI, Fegan G, Bejon P. Further analysis of correlates of protection from a phase 2a trial of the falciparum malaria vaccines RTS,S/AS01B and RTS,S/AS02A in malaria-naive adults. J Infect Dis Mar 15;201(6): Chapter 7: Olotu A, Moris P, Mwacharo J, et al. Circumsporozoite-specific T cell responses in children vaccinated with RTS,S/AS01E and protection against P falciparum clinical malaria. PLoS One. 2011;6(10) x
18 Long term Efficacy of a Pre-erythrocytic malaria vaccine and correlates of protection in children residing in a malaria endemic country Ally Olotu Kellogg College, University of Oxford A thesis submitted for degree of Doctor of Philosophy May 2013 (Trinity Term) v. Abstract Malaria remains an important cause of morbidity and mortality among children in sub- Saharan Africa despite recent reductions in malaria incidence in some parts of Africa. Current control tools face threats such as the emergence of drug resistant parasites and insecticide resistant mosquitoes. A malaria vaccine is needed to complement and/or replace existing tools in order to achieve better malaria control and eventually eliminate the disease. RTS,S/AS01E is the most clinically advanced pre-erythrocytic malaria vaccine candidate and is currently being tested in a phase III trial. The short-term efficacy of RTS,S/AS01E is known but the duration of protection is unknown. Furthermore, although RTS,S is protective, it is unclear which immunological assays predict efficacy: hence there are no known correlates of vaccine-induced protection against clinical malaria. xi
19 In a randomized controlled trial, I assessed the efficacy of RTS,S/AS01E in children (5-17 months old) residing in Kilifi, Kenya, over 4 years of follow-up and determined the correlates of protection against clinical malaria. In order to examine the effect of variations in malaria exposure on vaccine efficacy, I developed an individual marker of malaria exposure calculated as distance-weighted prevalence of malaria infection within 1 km radius of every child. Over 4 years of follow-up, RTS,S/AS01E had an efficacy of 29.9% (95%CI: 10.3% to 45.3%, p=0.005) and 16.8% (95%CI: -8.6% to 36.3% p=0.18) against first and all malaria episodes, respectively (by intention to treat analysis). Vaccine efficacy waned over time and with increasing malaria exposure. RTS,S/AS01E efficacy was 43.6% (95% CI, 15.5 to 62.3) in the first year but was -0.4% (95% CI, to 45.3) in the fourth year. Vaccine efficacy was 45.1% (95%CI 11.3% to 66.0%) among children with lower than average malaria exposure index, but 15.9% (95%CI to 36.4%) among children with higher than average malaria exposure index. Despite waning in efficacy, RTS,S/AS01E averted 65 cases of malaria per 100 vaccinated children, with more cases averted among the children in the higher malaria-exposure cohort (78 cases per 100 vaccinated children) than those the low exposure cohort (62 cases per 100 vaccinated children). RTS,S/AS01E induced high titres of anti-cs protein antibodies and CD4+ T cell but not CD8+ T cell responses. Anti-CS antibody titres and the frequency of TNF-α producing CD4+ T cell responses were independently associated with protection from clinical malaria, and the combination of both anti-cs titers and TNF-α producing CD4+ T cell response satisfied the Prentice criteria for surrogate markers of protection. xii
20 There was no association between avidity of RTS,S-induced anti-cs protein antibodies and protection from clinical malaria. Conclusions: RTS,S/AS01E efficacy against all episodes is 16.8% over the 4 years of follow-up. The vaccine efficacy wanes over time and with increasing malaria exposure. RTS,S/AS01Einduced TNF- producing CD4 T cell and anti-cs protein antibody responses were independently associated with protection from clinical malaria. Anti-CS avidity did not predict protection from clinical malaria. Long-term follow-ups of malaria vaccine trials are essential in the evaluation of the longevity of vaccine efficacy. xiii
21 1 Introduction 1.1 Burden of malaria Malaria is one of the most important causes of mortality and morbidity in the developing world. Estimates from the World Health Organization are 261 million cases in the year 2010, with 650,000 cases resulting in death [1]. Other estimates suggest more than 1,000,000 deaths in 2010 [2]. The estimates are highly influenced by the surveillance methods used [3]. The highest burden is in children below the age of five years (>85% of the burden). In addition to the immediate morbidity and mortality risk, malaria may inflict long-term effects with negative consequences on the health and quality of life. For instance, children who suffer from severe malaria are at increased risk of epilepsy [4,5], chronic neurological and cognitive impairments [6]. Malaria causes significant economic hardships and disproportionately affects the poor [7]. In endemic countries, more than 1% loss in gross domestic product is attributable to malaria [8] [9]. 1
22 1.2 Current malaria interventions The main interventions for malaria control include insecticide treated bed-nets (ITNs), treatment with artemisinin based combination therapies (ACTs), intermittent presumptive treatment (IPT) and indoor residual spraying (IRS) Insecticide treated bed nets (ITNs) ITNs are effective in reducing malaria transmission [10] and their use is associated with up to a 40% reduction in all-cause child mortality [11,12]. Their use has increased over the years in line with the Roll Back Malaria and UN Millennium development goals programmes [13,14,15]. In Kenya, bed net usage in children has increased from 7.1% in 2004 to more than 65% in 2006 [16]. The increase in use among the poor has largely been attributed to the free bed net distribution programme [16,17]. The emergence of mosquitoes that are resistant to pyrethroids and others with altered biting behaviour (towards outdoor biting) is of concern, since these developments could undermine ITN effectiveness [18,19] Antimalarial drugs Artemisinin based combination therapies (ACTs) are the recommended first line treatment for clinical malaria. They include combinations such as artemetherlumefantrine, artesunate-amodiaquine, and dihydroartemisinin-piperaquine. ACTs are effective against both mild and severe forms of malaria [20,21], and have a good safety profile [22,23]. In addition, they inhibit gametocytes [24] and therefore may play a role 2
23 in protecting the community against further transmission [25]. The development of drug resistance in the parasite threatens their effectiveness [26,27,28] Intermittent presumptive treatment Intermittent presumptive treatment (IPT) involves administration of a full therapeutic course of antimalarial to individuals who are at risk regardless of their malaria status at the time of administration. The aim of the IPT is to reduce subsequent episodes of clinical malaria. It is a recommended approach to the prevention of malaria in pregnancy (IPTp) and infant (IPTi). IPTp protects pregnant women from malaria infection and anaemia [29] and when given in the background of ITN use, leads to substantial reductions in neonatal mortality and low birth weight outcomes [30,31]. IPTi is safe and provide significant protection against clinical malaria and all-cause mortality in infants [32]. Intermittent presumptive treatment in children (IPTc) is a recent IPT strategy which has also shown promising results, with efficacy of 82% (95%CI 75%- 87%) against clinical malaria in children during the immediate malaria transmission season and 57% reduction in all-cause mortality in children[33]. Malaria rebound as the result of delayed immunity acquisition appears to be a risk in chemoprophylaxis, but has not been consistently identified following IPT [33]. The development of antimalarial drug resistance poses a challenge to the IPT strategy [34,35]. 3
24 1.2.4 Indoor residual spraying Indoor residual spraying (IRS) has been shown to be effective in reducing malaria transmission in areas of different malaria transmission intensities [36]. Since the World Health Organization (WHO) reaffirmed the importance of IRS in the fight against malaria, several countries have reintroduced it in their malaria control armoury [37]. It is however more effective against endophilic than exophilic vectors [38]. Like ITNs, changes in the vector s behaviour and the development of resistance against insecticides are imminent challenges facing its effectiveness [39,40]. Hence the development of resistance in either the vector or parasite threatens current control measures and might lead to the resurgence of malaria in areas where malaria has been controlled. 1.3 Changing malaria epidemiology There are encouraging reports showing a decline in malaria from several parts of Africa [41,42,43,44]. In Kenya, malaria admissions in children in the three major district hospitals in the coast have dropped significantly between 1999 and 2007 [45]. Timeseries models suggested that the observed decline in malaria admissions correlated with malaria-specific control efforts in the hospital catchment s areas. However, this trend is not consistent everywhere. Some areas have reported sustained or even an increase in the burden of malaria [46,47]. Temporal relationships with the control interventions described above are seen in some cases [42] but are not so clear in other cases [45]. Some changes in transmission intensity may be attributed to improved living standards and/or be part of natural variations [48]. 4
25 Hence, while progress has been made in controlling malaria using the interventions described above, this progress may be threatened by resistance in the parasite and in the vector, and in any case these interventions do not appear sufficient to eliminate malaria in high transmission settings in Africa [49]. 1.4 Role of malaria vaccines Childhood immunization against communicable diseases is one of the most cost-effective public health interventions [50,51]. The global health success of eradicating smallpox was the result of a widespread deployment of smallpox vaccine [52]. Furthermore, significant inroads have been made in the fight against other major childhood infectious diseases such as polio, Haemophilus influenzae and measles through immunization [53,54,55]. The success of vaccines is based not only on their ability to offer protection to the individual recipients, but also to the community by reducing the transmission through herd immunity [56,57]. Given the challenges facing current interventions and healthcare systems with limited provision for prompt diagnosis and treatment [58], a vaccine would be an important addition to the existing control methods in the fight against malaria. There are three types of malaria vaccines based on the stages of the Plasmodium life cycle at which they act. They include pre-erythrocytic, blood stage and transmissionblocking vaccines. They are further described below. 5
26 1.4.1 Pre-erythrocytic vaccines Pre-erythrocytic vaccines target sporozoites and liver-stage parasites, before they infect erythrocytes. They are based on the parasite antigens present on either the surface of the sporozoite or expressed on the surface of infected hepatocytes. They work by inducing antibodies that neutralize sporozoites, block sporozoite invasion of hepatocytes, or by provoking cytotoxic cellular responses against infected hepatocytes. The most clinically advanced pre-erythrocytic candidate vaccine is RTS,S which is based on Circumsporozoite protein (CSP)[59]. The candidate vaccine has demonstrated a partial protection against clinical malaria in children residing in a malaria endemic country over a short period of follow-up and the long term outcome of RTS,S vaccination is the subject of this thesis. The clinical development of RTS,S is reviewed in greater detail in section 1.5 below. Thrombospondin-related adhesion protein (TRAP) fused to a multi-epitope (ME) is another candidate pre-erythrocytic vaccines currently in phase II trials. This antigen is delivered using a prime-boost strategy where Fowlpox strain 9 virus or a chimpanzee adenovirus expressing the ME-TRAP construct is used to prime the immune system and modified vaccinia virus Ankara (MVA) expressing ME-TRAP is used to boost the responses. However, despite encouraging protection against experimental malaria challenge in malaria naïve adults [60] the approach of priming with the Fowlpox strain FP9 then boosting with MVA was not protective in malaria endemic areas [61]. Recent studies using the chimpanzee adenovirus ChAd63 as the priming vector in place of FP9 have shown superior immunogenicity both in malaria naive and semi-immune adults [62,63]. 6
27 Sanaria is developing a live irradiated whole sporozoite vaccine for human immunization [64]. The candidate irradiated sporozoite vaccine is in early development but preliminary data have shown inadequate levels of cellular immune responses in malaria naïve adults who received the vaccine by the subcutaneous route [65]. Studies are ongoing to optimize the dose and route of inoculation to facilitate adequate delivery of attenuated sporozoites to the hepatocytes, which is required to provoke a protective immunological response. It has also been shown that immunisation using multiple bites of infected mosquitoes under cover of simultaneous chloroquine prophylaxis to prevent blood-stage infection confers sterile protection against homologous malaria challenge [66,67,68]. This strategy provides a platform for studying the pre-erythrocytic and erythrocytic mechanisms of malaria protective immunity [69] and open new avenues for the development of nextgeneration vaccination strategies that completely prevent malaria Blood stage vaccines Most blood stage vaccines in development aim at mimicking and improving the natural immunity to blood stage parasites. Rationale for the development of blood stage vaccines came from two sources; a) natural immunity to clinical malaria develops after repeated attacks of malaria and adults are relatively resistant to severe forms of disease compared to young children and b) in 1961 it was shown that passive transfer of immunoglobulin from immune African adults to young children can control parasite growth and malaria symptoms [70]. In 1991 it was shown that passive transfer of immunoglobulin from African adults cleared malaria parasitaemia and clinical symptoms in acutely infected Thai adults [71]. Most of the research on blood stage vaccines has focused on the 7
28 antigens which are critical in the host-parasite interactions and expressed on the merozoite. There are many blood stage antigens expressed on the merozoites which have been intensively investigated as potential malaria vaccine candidates. They include merozoite surface protein 1 (MSP-1)[72], MSP-2 [73], MSP-3 [74,75], apical membrane antigen 1 (AMA-1)[76], erythrocyte-binding antigen 175 (EBA-175) [77], glutamate-rich protein (GLURP) [75,78]), and serine repeat antigen 5 (SERA5)[79]. None of these candidate vaccines have been progressed to phase III trials because of limited efficacy. Although the safety and immunogenicity of many blood stage candidate vaccines have been promising, the efficacy has not been. For example, a three-component blood stage vaccine consisting of MSP-1, (MSP-2) and ring-infected erythrocytic surface antigen (RESA) showed modest strain-specific reduction of parasite density in Papua New Guinea but had no effect on clinical malaria episodes [73]. Similarly, (AMA-1) failed to provide protection against clinical malaria in Malian children. However, the authors showed strain-specific protection against clinical malaria caused by parasites with AMA- 1 genotypes similar to that used in the vaccine [80]. High rates of genetic polymorphism among blood stage antigens presents a major challenge for the development of blood stage vaccines [81]. This implies that a combination of multiple antigens in one construct is necessary to achieve significant protection. Recently P. falciparum reticulocyte-binding protein homologue 5 (PfRH5) has been identified as potential erythrocytic candidate malaria antigen with less polymorphisms 8
29 and the ability to induce cross neutralizing antibodies against heterologous parasite strains [82]. The antigen is still in pre-clinical stages of development Transmission blocking vaccines (TBV) A transmission blocking vaccine targets the sexual stages of parasite growth, preventing fertilization and the development of malaria parasites in the mosquito midgut. When deployed in a sufficient proportion of population, it can reduce the intensity of malaria transmission. Transmission blocking vaccines will not protect individual vaccinees, but will protect the community from malaria. Therefore to achieve significant impact they need to be given to a high proportion of the population. The target antigens under development include those expressed by the gametocytes within the human host such as Pfs45/48 and Pfs230 and those expressed in the zygote and ookinete within the mosquito gut such as Pfs25 and Pfs28. Antibodies to these antigens can completely block transmission of P falciparum to mosquitoes [83,84], and early phase I trials with Pfs25 and Pvs25 have demonstrated a correlation between levels of anti-pfs25 and Pvs28 and transmission blocking activity [85,86]. By preventing transmission of breakthrough infections in individuals who have received other types of malaria vaccines or antimalarial drugs, it is proposed that TBVs can be used to prolong the protective efficacy of other malaria vaccines and antimalarial drugs respectively [87]. Challenges facing development of TBVs include a) high antibody levels required for inhibition of transmission as predicted from mathematical models [88] b) Poor immunogenicity of the antigens; c) lack of natural boosting for antigens 9
30 expressed by the ookinete [89]. Transmission blocking vaccines are still in early stages of development with no field trials yet and only a handful of phase I trials in preparation. An alternative vaccine strategy for transmission blocking involves targeting mosquito s proteins for immunization to induce transmission blocking immune responses that would affect the mosquito s gut susceptibility to ookinete invasion [90]. Studies have shown the ability of monoclonal antibodies to several midgut molecules to block the development of plasmodium parasite (including P. falciparum and P. vivax) in multiple species of Anopheles mosquitoes [91,92,93]. This is an ongoing field of research. 1.5 Introduction to RTS,S: a candidate pre-erythrocytic malaria vaccine Circumsporozoite protein (CS protein) CS protein (CSP) is the major component of the surface of the plasmodium sporozoite. It is also located intracellularly within vesicular structures resembling micronemes within the sporozoites [94]. Its expression starts at the oocyst stage in the mosquito and persists throughout intra-hepatic stages of plasmodium development, but declines as hepatic schizonts mature[94,95]. A single copy of P. falciparum CS gene encodes 412 amino acids and has a similar molecular structure to CS gene of other Plasmodium species. The protein contain 41 10
31 tandem repeat amino acids of which 37 are NANP (N, Asparagine; A, Alanine; P, Proline) and 4 are NVDP (N; Asparagine, V; Valine, D; Aspartic acid, P; Proline)[96]. The protein has a molecular size of 58 kd. CS protein contain three main regions a) polymorphic N terminus that binds heparin sulfate proteoglycans b) a conserved central region consisting of tetrapeptide repeats (NANP), and c) a polymorphic C terminus that contains a thrombospondin-like type I repeat (TSR) domain[97]. The central conserved region is termed the R region while the polymorphic N and C termini are referred to as RI and RII-plus respectively. The R region is considered a dominant B cell epitope while RI and RII contain both B and T cell epitopes. The CS protein plays an important role in the motility of the sporozoites and their interaction with the sulphated glycoconjugate receptors on the hepatocyte surface, which is crucial for the invasion process. The N-terminus region is believed to be important for the sporozoite invasion of mosquito salivary glands [98,99] while the C-terminus region is involved in motility of sporozoites and their invasion of the mosquito salivary gland and human hepatocytes [100]. Expression of CS peptides on the surface of the infected hepatocyte can initiate Major Histocompatibility Complex (MHC) restricted, and antigen specific killing of the P. falciparum infected hepatocyte following recognition by the T- cells [101]. 11
32 1.5.2 Natural anti-cs protein antibodies Natural exposure to malaria induces detectable antibodies to CS protein albeit at relatively lower levels compared to those induced by inoculation by irradiated sporozoites or CS based subunit vaccines. Their level reflects the magnitude of exposure to P. falciparum sporozoites providing a useful measure of malaria transmission [102]. No consistent correlation has been found between anti-cs protein occurring under natural condition and immunity to infections [103,104] although antibodies against multiple preerythrocytic antigens may be a correlate of protection [105]. Given the protection that can be achieved with CSP based vaccination regimens (see below), the lack of protection with naturally acquired anti-csp antibodies is likely to reflect the low titre of these antibodies RTS,S antigen RTS,S is a recombinant protein produced in Saccharomyces cerevisiae (yeast) cells by GlaxoSmithKline Biologicals (GSKBiologicals). It is a 51 kda (kilodalton) hybrid protein which consists of central repeat and C-terminal flanking regions of CS protein (CSP) from the NF54 strain of P. falciparum fused with the hepatitis B surface (S) antigen (HBsAg). The antigen is co-expressed with unfused 24 kda native Hepatitis B surface antigen (HBsAg). When produced, the proteins spontaneously assemble into virus like particle (Figure 1:1: RTS,S particles). Each particle is estimated to contain 100 polypeptides. 12
33 RTS,S has been given with either of two different proprietary adjuvants to boost its immunogenicity; AS02 (an oil-in-water emulsion formulated with MPL and Stimulon QS21 immunostimulants) or AS01 (a liposomal formulation of the same immunostimulants, MPL and QS21). Monophosphoryl lipid A (MPL) molecule is a detoxified version of the parent highly toxin lipopolysaccharide from Gram-negative bacterium Salmonella minnesota. MPL is a strong stimulant of both humoral and cellular immune responses. QS21 is a natural saponin purified from the bark of the tree Quillaja saponaria which induces strong Th1 type and cytotoxic T lymphocyte cell-mediated immune responses. The nomenclature for the various formulations of RTS,S is as follows; a) "RTS,S" describes the protein as described above, "AS01" or AS02 after a / indicates the Adjuvant System that is combined with the particle, and a letter suffix "A" or B indicates an adult dose formulation (i.e. 50 µg of lyophilized RTS,S reconstituted with 500 µl of either AS02 or AS01, respectively) and D or E indicates a paediatric dose formulation (i.e. 25 μg of RTS,S with 500 ul of either AS02 or AS01, respectively). Hence, for example, RTS,S/AS01E indicates the RTS,S protein, formulated with AS01 as a paediatric dose. 13

34 Figure 1:1: RTS,S particles; Source (GSK Biologicals RTS,S power point 2012) RTS,S development: Initial proof of concept The demonstration that immunization with radiation-attenuated sporozoites confers sterile protection against experimental malaria challenge in mice and humans was an important milestone in the quest for a malaria vaccine [106,107]. Irradiated sporozoites induced anti-cs protein antibodies a thousand-fold higher than those induced from natural exposure, and those antibodies correlated with protection from malaria challenge [108]. However, unavailability of purified aseptic sporozoites and safety and logistical challenges complicated the development of whole sporozoites as a deployable vaccine. 14
35 The discovery that CS is the major component of P falciparum sporozoite surface [109] and that monoclonal antibodies against this particular protein correlated with the protection against malaria challenge [110] [111] paved the way for subunit vaccine development. DNA recombinant technology revolutionized the development of subunit malaria vaccine and enabled the expression of CS protein in a prokaryotic system [112]. It was later demonstrated that several CS repeat constructs expressed in Escherichia coli were highly immunogenic in mice, reacted with CS protein on live sporozoite and blocked the sporozoite invasion of human hepatoma cells [112]. R32tet 32 which consisted of 30 (Asn-Ala-Asn-Pro) tetrapeptide repeats and 2 (Asn-Val-Asp-Pro) tetrapeptide repeats fused to 32 amino acids derived from the tetracycline resistance gene was found to be the most immunogenic construct producing sustained level of antibody levels when given with alum[113]. In the early 1980 s the Walter Reed Army Institute of Research (WRAIR) and GSK Biologicals initiated a collaboration to develop a malaria vaccine based on this CS protein construct after evidence supported their role as target for functional antibodies [114]. The original objective for WRAIR was to develop a malaria vaccine for USA military while GSK Biologicals aimed to develop a vaccine for tourists Phase 1 and 2a trials Early phase I trials in malaria naïve adults showed that immunization with the CS repeat antigen combined with the first 32 amino acids from a tetracycline resistance gene (R32tet 32 ) produced detectable antibody responses to CS protein repeat region and the antibody levels correlated with protection from homologous experimental malaria 15
36 challenge [115]. However, subsequent trials showed minimal protection (0-20%) and low antibody titres [116,117,118]. Two modifications were then done on the CS repeat antigen a) Inclusion of T cell epitopes in the C terminus part to include more potent T cell epitopes and b) utilize hepatitis B surface antigen as the carrier matrix to improve antigen presentation. This resulted into RTS,S which consisted of 19 NANP repeats and the carboxy terminus (amino acids ) of the circumsporozoite (CS) antigen co-expressed in yeast with hepatitis B surface antigen. The result was improved cellular and humoral immunogenicity in malaria naive adults [119]. However protection against experimental malaria challenges was still limited (6 out of 8 vaccinated-individuals got malaria after challenge). It was hypothesized that use of more potent adjuvant could improve efficacy of RTS,S. Through series of studies conducted in non-human primates, two potent adjuvant systems developed by GSK Biologicals were selected to be tested with RTS,S in humans [120,121]. In a landmark study involving malaria naive adults from United States three formulations of RTST,S were assessed for safety, immunogenicity and efficacy against experimental challenge. RTS,S given with AS02 provided an efficacy of 85% against homologous experimental challenge. [122]. This was the initial proof of concept for RTS,S and prompted further clinical development of this antigen as a candidate malaria vaccine. 16
37 1.5.6 Phase 2b trials Following the success of the RTS,S/AS02 in malaria naïve adults [122] a small phase I study was undertaken to assess the safety and immunogenicity of RTS,S/AS02 in semiimmune adults in Gambia. The results showed that RTS,S/AS02 vaccination had good safety profile and induced higher antibody titres against CS protein than normally acquired from natural exposure to infected mosquito bites [123]. Later, a larger phase IIb trial of RTS,S/AS02 in the same population demonstrated 71% efficacy against malaria infection during the first nine weeks of follow-up, but efficacy declined to 0% in the last 6 weeks of follow-up [124]. Booster RTS,S doses given 1 year later induced even higher antibody responses than acquired after the primary schedule and individuals were further protected against infection in the subsequent malaria season with vaccine efficacy of 47% (95%CI: 4% to 71%, p=0.037). Although the results were considered promising, the partial protection meant that the vaccine could not qualify as a vaccine for the USA military or for tourists Paediatric vaccine development Paediatric development of RTS,S was undertaken despite short term efficacy. The following were the justifications for the paediatric development of RTS,S; a) although the efficacy against infection in Gambian adults was partial and short-lived, [125], it was anticipated that vaccination of children who suffer the most from malaria would result in a significant reduction in frequency and severity of clinical malaria and; b) because other 17
38 vaccines had raised better immunological responses in children compared with adults [126,127]. The first proof of concept study of RTS,S given with adjuvant AS02 was conducted in Mozambican children following a series of age de-escalation and dose finding studies. The study consisted of two cohorts. In the first larger cohort, older children (1-4 years) were recruited to assess efficacy against mild and severe clinical malaria. In the second smaller cohort, young infants (6-12 weeks) were recruited to assess safety, immunogenicity and efficacy of RTS,S against malaria infection. In the smaller cohort the adjusted efficacy against infection was 35.4% (95% CI 4.5% to 56.3%; p = 0.029) over 6 months and 9.0% (95% Confidence Interval (CI) -30.6% to 36.6%; p = 0.609) over subsequent 12 months showing evidence of waning over time[128]. In the larger cohort adjusted efficacy was at 32 9% (95% CI 11 0% to 44 8%; p=0 004) and 57 7% (95% CI 16 2% to 80 6%; p=0 019) against clinical episodes and severe malaria, respectively, over eight months of surveillance [129]. These first trials in children used the AS02 adjuvant, but parallel preclinical and clinical trials in animals and naive adults had demonstrated higher immunogenicity and similar safety profile for the adjuvant AS01 [130,131]. Subsequently the focus shifted to AS01 as a more promising adjuvant for consideration in clinical development of RTS,S. The first evidence of field efficacy for RTS,S given with AS01 was obtained in Kilifi, Kenya, and Korogwe, Tanzania in children aged 5-17months. The estimated efficacy against clinical episodes of malaria was 53 % (95% CI 28% to 69%) over 8 months follow up [132]. In a separate study, co-administration of RTS,S/AS01E with Extended 18
39 Program of Immunization (EPI) vaccines was safe and did not reduce the frequency of protective immune responses to the other EPI vaccines [133] Long term efficacy The long-term efficacy of RTS,S/AS01E is not known. Only one study in Mozambican children has documented the long-term efficacy of RTS,S given with a less immunogenic adjuvant, AS02. Over four years of follow-up adjusted efficacy of RTS,S/AS02 against clinical malaria was 25.6% (95% CI, 13.4% to 36.0%; P<0.001) with no evidence of waning and adjusted efficacy against severe malaria was 38.3% (95% CI: 3.4% to 61.3%; P<0.045)[134]. However the long term follow-up study in Mozambique used passive surveillance to identify cases of clinical malaria and observed relatively few clinical episodes of malaria during the last two years of follow-up (230 episodes compared to 664 episodes in the first two years). This reduced the power of the study to identify waning during the later years of follow-up. Furthermore, since efficacy was relatively modest initially (32.9%), the power to detect variation over time was reduced further. 1.6 Vaccine-induced immune responses Vaccines are designed to induce protective long-term immunological memory capable of clearing infection or minimizing the severity of the disease once a recipient encounters the pathogen. Effector mechanisms include antibodies, cytotoxic CD8+ T lymphocytes (CTL) and CD4+ T helper cells. 19
40 1.6.1 Vaccine-induced antibody responses Following vaccination, inflammatory cells such as local monocytes, immature dendritic cells and neutrophils are recruited to the site of inoculation. Vaccine antigens are then phagocytosed by immature dendritic cells which undergo activation and migration to the nearby draining lymph node. At the same time, antigens which are not phagocytosed may also find their way to the local lymph nodes through the lymphatic system. At the local lymph node, naive B lymphocytes in extra-follicular zones recognize these vaccine antigens and in the absence of CD4 T helper cells undergo differentiation and proliferation into short-lived plasma cells which produce antigen-specific antibodies. These antibodies which appear within a few days following (primary immune response) vaccination are mainly of IgM isotype and of low affinity and titre. It is the interaction between activated dendritic cells and antigen-specific T lymphocytes that stimulate B cells to produce higher avidity antibody. The interaction between dendritic cells and T cells activates antigen-specific T lymphocytes which in turn triggers antigen-specific B lymphocytes to migrate to the follicular zone and initiate germinal centre reaction (GC). Within GCs, B lymphocytes receive activation from follicular T lymphocytes resulting in massive clonal proliferation, hypermutation of their immunoglobulin genes, isotype switching (from IgM to IgG isotypes) and differentiation into plasma secreting cells. Plasma cells producing antibodies of low affinity undergo apoptosis while those producing high affinity differentiate further into memory B cells and long-lived plasma cells producing antibody of increasing affinity (affinity maturation) [135,136,137]. 20
41 Long-lived plasma cells then migrate to the bone marrow niches where they can survive for a long time [138]. Upon re-encounter with the pathogen, memory B cells are activated and differentiate into more antibody-secreting plasma cells that may deploy protective antibodies in time to provide immediate protection from disease. Additionally, memory B cells are replenished following re-activation. Short-lived plasma cells are responsible for the immediate antibody responses that occur within few days after vaccination while long-lived plasma cells (located in the bone marrow) mediate long-term maintenance of antibody levels. The maintenance of longlived plasma cells is thought to be through stimulation of memory B cells to differentiate into long-lived plasma cells [139] while recurrent or chronic encounter with antigens and continuous polyclonal activation play a role in maintaining memory B cells [140] Vaccine-induced T cell responses Within the local lymph node, activated mature dendritic cells present the processed vaccine antigens to T lymphocytes in association with major histocompatibility complex (MHC) molecules. MHC molecules are glycoproteins encoded by a large gene family that is represented in all vertebrates. They are responsible for the appropriate lymphocyte recognition and subsequent "antigen presentation". Classically, there are two types of MHC molecules; MCH class I and MCH class II. MCH class I molecules display antigens that are processed within infected cells while MHC class II molecules display antigens that have been processed within antigen-presenting cells such as dendritic cells. Antigen-specific CD4+ T cells recognize vaccine peptides displayed by class II MHC molecules whereas CD8+ T cells recognize peptides displayed by class I MHC-peptide 21
42 complexes. The activated antigen-specific CD4+ T cells then differentiate into two distinct cell types; Th1 or Th2 cytokine-producing CD4 T cells. The Th1 CD4 T cells produce cytokines such as IL-2, IL-5, IFN-γ and TNF-α while Th2 CD4+ T cells produce cytokines such as IL-4, IL-6 and IL-10. Th2 CD4+ T cell supports the differentiation of antigen-specific B lymphocytes into antibody-producing cells and are also directly involved in protection against extracellular pathogens through production of IL-4, IL-5 and IL-13 [141]. Th1 CD4+ T cells are responsible for destruction of intracellular pathogens either directly or through the release of cytokines such as IFN-γ and TNF-α [142]. Furthermore Th1 CD4+ T cells induce the differentiation of CD8+ T cells to cytotoxic T lymphocytes capable of destroying infected cells [143]. Activation of antigen-specific CD8+ T cells causes them to differentiate into cytotoxic effector cells capable of killing infected cells or pathogens. Live attenuated viral or bacterial vaccines are strong inducers of CD8+ T cell responses since they present the vaccine antigens within cells facilitating interaction through MCH class I molecules [144,145]. Effector T cell responses last for a short time (i.e. a few days) and are replaced by memory T cells. Two types of memory T cells are generated, namely effector memory T cells (Tem) and central memory T cells (Tcm) [146]. Effector memory T cells circulate through non-lymphoid tissues and once they encounter pathogens, they are quickly stimulated to kill invading pathogen through their powerful cytotoxic armament. Central memory T cells on the other hand patrol the lymph nodes and bone marrow, and despite 22
43 their low cytotoxic capacity they can undergo dramatic proliferation and produce massive numbers of effector T cells upon re-encounter with dendritic cells presenting respective specific antigens [147]. The persistence of antigen appears to be a key determinant of effector T cells responses while early antigen clearance skew the response towards central memory T cells [148]. For non-replicating vaccines, use of adjuvants such as Alum provides a platform for the slow release of antigen to favour development of effector memory T cell response. Lifetime persistence of memory T cells may not require persistent exposure to antigen and is mediated by cytokines such as IL-15 and Il-17 [149,150]. In addition to the CD4 and CD8 T cells responses, the antigen encounter leads to the production of antigen-specific regulatory T cells such as CD4+CD25+ Treg cells and type 1 regulatory T (Tr1) cells [151]. These cells selectively inhibit the proliferation of IFNγ-producing CD4+ and CD8+ T cells through inhibition of IL-2 production ensuring protection from excessive detrimental effects of immune responses Measuring vaccine-induced responses Some of the vaccine-induced immune responses may be correlates of protection and as such could be useful tools in the development of new vaccines or optimization of immunization strategies[152]. 23
44 Measuring antibody levels Measurement of antibody levels is usually done by Enzyme-linked immunosorbent assay (ELISA). The assay employs an antigen molecule, specific to the antibody to be measured, which is immobilised on the bottom of the wells of a microtitre plate, before the sample containing the antibodies of interest is added. Anti-human antibodies labelled with an enzyme which bind the test-antibodies fixed on the immobilised antigen are subsequently added. Thereafter, the wells are washed and incubated with chromogen/substrate solution, which in a presence of the enzyme (e.g. peroxidases) conjugated anti-human antibody produces colouration whose intensity is proportional to the amount of antibody in the test sample. ELISA techniques can be easily standardized and used to assess the concentrations of vaccine-induced antibodies. ELISA can also be modified to assess the avidity (i.e. the average binding strength ) of polyclonal antibodies to their respective epitopes. To determine the avidity two sets of ELISA test are conducted in parallel. In one set the ELISA is carried out in the usual way, while in the other a chaotropic agent is added after incubation with the test serum and before peroxidise-labelled anti-human IgG is added. The chaotropic agent causes dissociation of the antibodies from their epitopes immobilised on the bottom of the microtitre plate-well. The amount of antibody dissociated is proportional to the strength of the interactions between antibodies and their respective epitopes (measure of avidity). A relative avidity index is then calculated from the measured values with and without chaotropic incubation. 24
45 Measuring cellular responses Measuring T cell responses is complicated by the need to use live cells and lack of standardization across different quantitative assays for T cell function[153]. Enzyme-linked immunospot assay (ELISPOT) and polychromatic flow cytometry technology are among the techniques which measure the ex vivo frequencies of cytokinesecreting cells following short or long term in vitro stimulation of peripheral blood mononuclear cells (PBMC) or isolated cell-phenotypes with the peptides (antigen) of interest. An ELISPOT assay is an adaption of ELISA. Specific monoclonal or polyclonal antibodies, which bind the cytokine of interest, are immobilised on a membrane at the bottom of the wells of a filtration microplate. The stimulated PBMC containing cytokinesecreting cells are then added and incubated for a specified period of time. The cytokine of interest is captured by the anti-cytokine (e.g. IFN-γ or IL-2) capture antibody immobilised on the bottom of the microplate. After washing the plate, a biotinylated polyclonal antibody specific for the captured cytokine is added to the wells. Streptavidin conjugated to an enzyme (eg alkalinephosphatase) is then added, which binds to biotin. The detected cytokine is visualized following incubation with a substrate, which produces coloured spots in the presence of the enzyme conjugating the detection antibody (e.g. alkaline-phosphatase). Coloured spots representing individual cytokine producing cells are then counted using an automated ELISPOT reader or manually, using a stereomicroscope. 25
46 Polychromatic flow cytometry is a more robust technique with the ability to study several subpopulations of T cells, revealing their stage of activation and proliferation, effector function (cytokine production, degranulation and lytic potential) as well as their homing potential simultaneously. Intra-cellular cytokine staining (ICS) is a flow cytometry based assay that can be used to examine the cytokine-producing functional properties of T cells. After a brief period of exposure to the peptides (antigen) of interest, the specific T-cells are activated and begin to synthesize cytokines. The cytokines are then trapped inside the cells following addition of brefeldin A which blocks protein secretory pathways. Specific anti-cytokine fluorescent antibody conjugates are then added following permeabilization of the cell membrane allowing specific interactions with the immobilised intracellular cytokines. Additionally, extracellular surface receptors that identify the cell phenotypes of interest are stained for by adding specific fluorescent monoclonal antibodies. Data acquisition is performed by multi-parameter Flow Assisted Cell Sorting (FACS). Unlike ICS, ELISPOT assays such as IFN-γ ELISPOT are validated and have been used widely in vaccine trials [148]. Despite challenges facing these cell mediated immunity (CMI) assays, their use in measuring the T cell responses in vaccine trials is important in order to ascertain the role of different vaccine-induced T cells effectors in protection RTS,S-induced anti-cs protein antibodies RTS,S with AS01 and AS02 administration induces high levels of antibodies to CS protein in both adults and children [123,124,154] with mean titres higher in children than in adults [59]. Although lower titres have recently been reported when RTS,S is co- 26
47 administered with EPI vaccines, the titres were significantly higher than in those who received the control vaccine [133]. These antibodies, measurable by standardized ELISA, peak after the last dose of vaccination and decline over time with exponential decay. In experimental challenge studies, anti-cs protein titres correlate with protection [131] but no protective threshold titres have been established [155]. In infected individuals anti- CS protein titre is associated with delayed time to infection. The anti-cs protein titres in children and adults residing in malaria endemic countries correlate with protection from malaria infection but not clinical disease [156,157] Anti-CS protein antibody function Most of the information on anti-cs protein function comes from animal studies and challenge studies in malaria naïve adults after immunization with CS protein. The ability of anti-cs protein antibodies to opsonise CSP has been demonstrated in sera of malaria naïve adults immunized with RTS,S/AS02. The human monocyte-like cells from premonocyte THP-1 cell-line (TIB 202, American Type Culture Collection, Rockville, MD) expressing receptors recognizing N and C termini of CS protein were able to phagocytose fluorescent anti-cs protein complexes [158]. In a subset of sera the authors also demonstrated the ability of these monocyte-like cells to phagocytise live sporozoites in the presence of sera from individuals immunized with RTS,S/AS02. This opsonisation may play an important role in preventing subsequent invasion of the hepatocyte. The sera 27
48 used were those taken on the day of challenge and the duration of this effect was not described. Anti-CS protein antibodies produced following immunization with irradiated sporozoites and CS protein based subunit vaccines can inhibit hepatocyte invasion by sporozoites [159,160]. The hepatocyte migration assay offers an alternative way of studying the effects of anti-cs protein. This assay is based on the fact that sporozoites traverse through various hepatocytes before establishing infection in the final hepatocyte, causing membrane damage that can be detected by the membrane non-permeable florescent molecular tracer dextran in the process [161]. In a study of virosomal CS protein malaria peptide vaccine, it was shown that anti-cs protein antibodies inhibited sporozoite migration through hepatocytes [160]. The inhibition of sporozoite migration correlated well with hepatocyte invasion assays. Anti-CS protein antibodies can also disrupt the sporozoite surface structure and block posterior translocation of the CS protein [162] leading to the immobilization of sporozoites and inhibition of hepatocyte infection [163] Anti-CS protein antibody subtypes In endemic areas, IgG1 and IgG3 are the more predominant anti-cs protein antibody isotypes [105,164]. In malaria naive adults, RTS,S induces predominantly IgG1 and IgG2 with minor levels of IgG3 and IgG4 isotypes [160]. Antibody isotypes are important determinants of protection against malaria infection [165]. For instance IgG3 antibodies are thought to be the most important in the protection against erythrocytic stages of 28
49 malaria [166]. In mice immunized with CS protein DNA vaccine, the protection against sporozoite challenge is associated with higher IgG1:IgG2b ratio than lower IgG1:IgG2b ratio [167]. However other studies have shown antibody isotype to be less important in mediating the protection conferred by CS subunit vaccines [168] Anti-CS protein antibody affinity In addition to the quantity of antibody, quality of antibodies also plays an important role in the protection conferred by vaccination against infectious diseases [169]. Early antibody secreting cells usually produce antibodies of low affinity. These cells then proliferate within germinal centres where somatic hypermutation of V(D)J immunoglobulin gene and antigen-driven selection of high affinity antibody-producing B cells occurs. Affinity is the strength of the interaction between a single antigen-binding site on the antibody and its specific antigen epitope. Antibody affinity is difficult to measure since it requires monoclonal antibodies, their specific purified epitopes and must be carried out under strict chemical conditions. However antibody avidity can be used as the surrogate marker for affinity following vaccination [170]. Avidity is defined as the antigen binding capacity resulting from the addition of all epitope specific affinities antibodies in a serum. High avidity antibodies appear important in the protection conferred by Haemophilus influenza type b vaccine, Hepatitis B vaccine and Pneumococcal conjugate vaccine [171,172,173]. The avidity of anti-cs protein antibody may determine protection against malaria in a mouse model [174]. To date, no study has 29
50 investigated the role of avidity of RTS,S-induced anti-cs protein antibodies in protection against malaria infection among RTS,S vaccinees in the field RTS,S-induced cell mediated immune response RTS,S-induced cell mediated immune responses have been assessed using proliferation assays, cytokine production on cell culture, intracellular cytokine staining and flowcytometry, and ex-vivo and cultured ELISPOT assays [175,176] Studies in adults RTS,S/AS02 immunization induces a CD4 + T cell response but little or no detectable CD8 + T cell response [131,155,177,178,179]. Sun et al observed IFNγ-producing CD8+ T cells, but only after cells were stimulated for days in vitro [180]. The frequency of poly-functional CD4+ T cells identified by intracellular cytokine staining (ICS) correlate with protection from P. falciparum infection after experimental challenge in adults [131,181]. In a field study, Reece et al reported a correlation between protection against re-infection and cultured IFNγ ELISPOT assays using a single conserved T cell epitope from the CS protein [178]. However, this analysis was not adjusted for anti-cs protein antibody titres, and did not include ICS studies. 30
51 Studies in children Few studies have studied the cell mediated immune responses elicited by RTS,S in young children. Barbosa et al reported vaccine-specific CD8+ T cell responses among RTS,S/AS02 vaccinees after 42 hours of in vitro stimulation of PBMC at 10 but not at 4 weeks post immunization in children less than one year old [182]. They also reported low but significant frequencies of CS protein specific CD4 T cell responses among the vaccinees. Both single ICS cytokine CD4+ T cell and CD8+ T cell responses showed borderline correlation with protection from P. falciparum infection [182]. The relative contribution of cell mediated immune responses and anti-cs protein antibody titres in mediating pre-erythrocytic immunity following vaccination with RTS,S/AS01E in young children is unclear. This means there are no defined correlates of protection. This lack of established RTS,S/AS01E induced correlates of protection has meant the candidate had to be empirically tested for its clinical efficacy. Furthermore, efficacy must be confirmed in a variety of different transmission settings and populations to be sure it is a generalizable observation. 1.7 Malaria surveillance Malaria vaccine trials normally use passive case detection, active case detection or a combination of the two for surveillance of clinical episodes or infections. In active case detection, participants are followed once every specified period of time (daily, monthly, weekly or fortnight) and assessed for the presence of malaria parasites associated with 31
52 axillary fever, or a history of fever in the last 24 hours. But it is argued that active case surveillance is likely to misclassify the occurrence coincidental parasitaemia in subjects with fever of other causes as if it represented a true malaria case [183]. A modification of this method involves taking blood slides only if the child has documented fever (defined as axillary temperature 37.5 C). A child with a history of fever but no confirmed fever (temperature 37.5 C) is followed up in the next specified hours (6-12 hours) to confirm or exclude an objective fever [61]. Applying a parasite threshold may further improve the specificity of the case definition. [184]. Studies assessing children with high vulnerability to malaria[185], genetic and environmental risk factors of malaria [186] and correlates of malaria immunity [187] have successfully used this form of active surveillance. Conventional passive case surveillance involves health facilities where study participants attend when ill. This method measures public health burden in a real life situation and is believed to be less prone to misclassification of coincidental parasitaemia with fever as true malaria cases [188]. Although the public health burden of malaria is felt in terms of presentations to routine health facilities, the attendance to these facilities during passive surveillance depends on economical geographical and social factors [189,190,191] which may in turn reduce the number episodes identified through this method. An alternative form of passive case detection involves trained resident field workers or community health workers. These workers act as points of contact in the community, perform malaria tests and offer antimalarial medication after consultation with the clinicians. Referral to the health facility is done when necessary. This form of passive 32
53 case surveillance differs from the conventional passive case surveillance at health facilities and it is not clear how the combination of the two may affect the quality and frequency of clinical malaria episodes compared to passive case surveillance at health facilities alone. Combination of passive and active surveillance can also be deployed in a study in order to improve the identification of cases especially when both infection and clinical disease are the main endpoints of the study. 1.8 Methods of analysing malaria vaccine efficacy In the context of a randomized controlled trial, vaccine efficacy is defined as the reduction in the risk of disease among vaccinated individuals compared with unvaccinated individuals. It is expressed as percentage efficacy using the formula 1-RR, where RR is the relative risk of the disease in vaccinated compared to unvaccinated group. Vaccination can have different effects both at individual and population levels. Consequentially the choice of analysis method will depend on what effect one is interested in and the kind of data available. At an individual level, vaccination reduces one s susceptibility to infection or reduces the degree or duration of infectiousness to others. The assessment of the effect of vaccination is therefore conditional on the knowledge of level of exposure (or whether an individual is exposed or not). In other words we can only assess the effect on susceptibility to infection when exposure has occurred. Similarly we can only assess the effect on infectiousness when optimal contact between infectious and susceptible individuals has 33
54 occurred. The efficacy is therefore estimated from transmission probabilities or secondary attack rates. To accurately calculate these parameters, data on infection status, degree of exposure and types and frequency of infectious contacts is required. Early phase 1b malaria vaccine trials which use experimental challenge with infected mosquitoes fall under this category since the amount of malaria exposure can be accurately or reasonably quantified to assess the transmission probabilities. Vaccine trials which use disease as the primary endpoint or infection without knowledge of malaria exposure usually estimate unconditional estimates of vaccine efficacy since they do not take into account either exposure to infection or type of infectious contact for each individual. In a randomized controlled trial the assumption is that the number of potential infective contacts is the same between the two groups and the vaccine efficacy estimated from relative risk measures will be similar to the efficacy estimated from transmission probabilities. Phase 2 and 3 malaria vaccine trials fall under this category. They generally provide an estimate of the average direct effect of the vaccine. At the population level, vaccination can have an indirect effect on unvaccinated individuals through its action of reducing infectiousness. Historically, the primary interest in phase 1 and 2 vaccine trials has been to assess the direct individual effect of the vaccines in protection against infection or disease with indirect effects considered of secondary interest, and may be estimated in Phase 4 studies. 34
55 1.8.1 Parameters used in vaccine efficacy analysis Halloran et al. have reviewed various hierarchies of vaccine efficacy parameters depending on the level of information required to estimate them [192]. Parameters that estimate biological effects of vaccines are at the highest level since they require more information (conditional estimates) (Level I). Such parameters include transmission probability and secondary attack rate. Phase II and III malaria vaccine trials provide unconditional estimates of malaria vaccine efficacy and fall under Hallorans Levels II, III and IV. The parameters used under these levels include cumulative incidence rate, incidence rate and hazard rate ratios. Cumulative incidence rate ratios require the least information (Level IV). Only information on whether individuals have experienced the endpoint of interest is required. The method assumes all individuals were at risk during the entire follow-up of the study and produces crude estimates of malaria efficacy. It does not allow for adjustment of covariates. Vaccine efficacy for the direct effect of vaccine is given by: VE = 1 Cumulative incidence rate in vaccinated group Cumulative incidence rate in unvaccinated group Incidence rate ratios are considered to be at Level II and require knowledge of the frequency of endpoint in each group and individual times at risk. Clinical trials of candidate malaria vaccine SPf66 used this method to determine the efficacy [193,194]. The method is applicable in vaccine trials where there is staggered recruitment and/or 35
56 loss of follow-up during the study. Like the previous method, it does not allow for the adjustment of covariates and only produces crude estimates of malaria vaccine efficacy. Incidence rates can alternatively be modelled using Poisson distributions. The Poisson regression models scale incidence rates by person-time at risk. The number of cases is given as: log(μ) = β 0 + β i X i + log (follow up time) where µ is mean number of cases, β i is the estimated coefficients and i=1.. p for the p number of covariates considered, β 0 is the mean number of cases when all the covariate values are zero and X is the value of the covariate. The advantage of this method is that it allows one to adjust for covariates of interest. Several clinical trials evaluating the efficacy of candidate malaria vaccine against multiple episodes have used this method [61,194]. The third approach uses the hazard rate ratio as the relative risk measure (Level III). Information required is similar to that of incidence rate. This is the most common method used to evaluated efficacy of candidate malaria vaccines. The hazard rate is defined as an instantaneous risk of having an outcome of interest at specified time t given that the subject has not suffered from the outcome up to time t. The hazard rate ratio describes how likely will the vaccinated subject suffer from outcome of interest [195]. The hazard rate (ht) is modelled by Cox regression as: 36
57 h(t; x) = λ 0 (t) exp(xβ) where Xβ = X 1 β 1 + X 2 β X p β p. The function λ 0 (t) is called the baseline hazard rate and refers to the hazard when all X p s are 0. This method allows for adjustment of covariates. Although the model allows for the variation in the baseline hazard rate, it assumes that the hazard rate ratio is constant throughout the follow-up Measures of vaccine impact Vaccine efficacy estimated in terms of relative risk (also known as relative risk reduction) provides information on the proportional reduction of malaria events by a vaccine. In randomized controlled trials vaccine efficacy from relative risk reduction provides estimates similar to those from transmission probabilities [196,197]. All evaluations of biological effect of the vaccine and their licensure are based on relative risk reduction. In addition, the uptake of the vaccine in the community is highly influenced by its perceived risk and beneficial effect to the individual which can be inferred from relative risk reduction [198]. From a public health point of view, the absolute effect of the vaccine is however more important. When a vaccine introduction results in a reduction of malaria events in the population, it may be more intuitive to determine the absolute risk reduction due to vaccination. This is usually estimated as the difference between malaria events rate in the control and vaccine group. When there are more malaria events in the control than 37
58 vaccine group, we have a positive absolute risk reduction implying the vaccine is beneficial. Conversely, a negative absolute risk reduction means there are more malaria events in the vaccine than control group and vaccine is harmful. Absolute risk reduction is also referred to as number of cases averted or vaccine-attributable reduction. Such information provides a measure of impact if such a vaccine were to be introduced in the population taking into account the baseline risk. It allows analysis of cost-effectiveness of the vaccine and can help inform decisions on efficient allocation of resources to achieve maximum public health benefit. In many instances the benefit of an intervention as measured by the relative risk reduction is relatively constant over a wide range of baseline risk. In such a situation the relative risk reduction has an advantage in that a single measure can be used to describe the benefit of the intervention under variable levels of risk to the disease. However the risk of malaria varies depending on the malaria transmission and studies have shown that malaria transmission can vary widely over short distances and even within a single settlement [199,200]. Therefore it is important to consider the baseline risk in control groups in the assessment of the malaria vaccine benefit since for a given relative risk reduction, the expected absolute risk reduction could vary considerably as the transmission changes. Both relative risk and vaccine-attributable reductions are important measures of vaccine effect. The former reflects its biological effect which is critical for licensure, whereas the later provides a measure of its public health utility. The choice of the measure needs to consider the stage of clinical development (early versus later development) and the objective of the study. In early stages of development (phase 1 and 2) the relative risk 38
59 measure is usually preferred. It is recommended that both measures be evaluated especially in phase 3 trials to facilitate assessment of a public health utility of candidate malaria vaccines which is critical in informing decision on their introduction Decision making on vaccine introduction Both the effectiveness (number of malaria cases or death averted) and cost effectiveness of vaccination are important factors to inform policy makers on the introduction of a vaccine. Cost effectiveness of the vaccine is normally estimated from Cost Effectiveness Analysis (CEA) which is an economic evaluation that assesses both the cost and health outcomes of alternative intervention strategies. Comparison is then made by using expected incremental cost effectiveness ratio (ICER) which measures additional cost per additional unit of health gain produced by one intervention relative to the other intervention. This can be expressed as cost per QALY (Quality Adjusted Life Years) or DALY (Disability Adjusted Life Years) gained. The ICER is subsequently compared to the cost effectiveness threshold which represents society s willingness to pay for an additional unit of health gain (e.g. QALY). This implies if ICER for a new malaria vaccine is less than cost effectiveness threshold, then the society will be ready to fund its introduction. On other hand if ICER is more than cost-effectiveness threshold, the society is likely not to accept the new intervention[201]. The cost-effectiveness threshold is expressed as the opportunity cost of current intervention(s) as the result of displacement by new intervention. However the selection of the threshold is not completely objective and is a subject of contention [202]. The cost of RTS,S is currently not known. 39
60 1.9 Challenges in estimating efficacy of malaria vaccines Estimating accurate malaria vaccine efficacy is essential in order to inform policy decisions on introduction of a malaria vaccine. There are numerous challenges in estimating the efficacy estimates in malaria vaccine trial and the following sections describe main key areas where statistical issues arise Vaccine efficacy from time to first event analysis The majority of malaria vaccine trials have used time to first event as the primary analysis for the estimation of malaria vaccine efficacy [124,129,203]. They use proportional Cox regression models to estimate the hazard rate ratio for clinical malaria between vaccinees and controls. However, such analysis precludes the contribution of subsequent episodes in estimating efficacy. Malaria is a complex disease in which immunity takes time to develop and individuals can experience repeated infections during follow-up. Analysis of all events gives a better insight of the public health utility of the vaccine. Furthermore including all events provides more power to the analysis of efficacy estimates and allows analysis to explore interactions between vaccination and other covariates of public health importance. At the time of commencing my DPhil work, only two clinical trials on RTS,S had reported efficacy against multiple episodes i.e. a phase 2b trial on RTS,S/AS02 in Mozambican 40
61 children and a phase 2b trial on RTS,S/AS01 in Tanzanian and Kenyan children [132,157] Heterogeneity in malaria exposure Spatial heterogeneity in malaria exposure has been described at a micro-epidemiological level at varying transmission settings [200,204] and accounts for substantial variation in the degree of exposure to malaria from person to person. It is responsible for variations in disease risk within a small area and is evidenced by geographical clustering of malaria infections. Smith et al showed that approximately 80% of transmission occurs within 20% of the population [205,206]. It has been attributed to factors such as varying local density of malaria vectors [207], the pattern of contact between human host and vectors and intrinsic human host factors [208,209]. Heterogeneity in malaria exposure can give rise to variable pre-erythrocytic vaccine efficacies as a result of a) its true biological effect and b) as an artefact of statistical analysis in the time to event analysis. In the former, high malaria exposure may overcome the vaccine-induced protection and produce lower efficacy estimates or differential acquisition of natural immunity to blood stage parasite between the control and vaccinated group during the follow-up can lead to higher risk of clinical malaria in vaccinated group over time. In the later case underestimation of vaccine efficacy occur as the result of differential removal of susceptible in the control versus vaccinated group in the time to event analysis 41
62 Effect on time to event analysis Heterogeneity in malaria exposure may bias estimates of malaria vaccine efficacy over time in longitudinal studies [210,211]. This is predicted by simulations of populations under heterogeneous malaria exposure, where vaccine efficacy is underestimated as a consequence of heterogeneity and apparent waning of efficacy over time is seen even if vaccine protection is maintained [134]. This phenomenon, well known to demographers was first described by Vaupel et al. who sought to explain the apparent but counterintuitive deceleration in human mortality rates in old age [212]. Although a randomized controlled trial may ensure equal distributions of malaria exposure between vaccine and control group at the start of the trial, unequal rates of depletion of susceptible individuals between the two groups in the presence of an effective vaccine will upset this balance over time. In any cohort consisting of individuals with variable levels of susceptibility to clinical malaria, the more highly susceptible individuals will experience earlier clinical malaria episodes. In time to first event analysis, individuals are removed from the at risk set once they suffer from infection. Subsequently, the malaria incidence will decline over time as less susceptible individuals remain. In a randomized controlled trial, this phenomenon occurs in both vaccine and control group. However the depletion of susceptible individuals will be more rapid in the control group (assuming the vaccine is protective). As the result, the vaccine group will be compared with a control group consisting of progressively less susceptible individuals as more time since vaccination elapses. The vaccine efficacy against first event will 42
63 therefore appear to wane overtime despite sustained biological protection of the vaccine (Figure 1:2) [210,211]. This effect is more marked as time since randomization increases and more events occur Measuring individual malaria exposure Knowledge of the individual malaria exposure status would allow one to estimate vaccine efficacy stratified by level of exposure or adjust for the individual level of malaria exposure in the analysis. It is however not clear how to estimate an individual s level of exposure in the field. Entomological Inoculations Rates, parasite rates and infant conversion rates have frequently been used to describe exposure at the level of population, but are not readily applied to individuals. Some studies have used individual antibodies to schizonts extracts as a marker of exposure [187,213] or other recombinant malaria antigens[214]. This approach is validated as a marker of exposure at a population level [215], but at an individual level is complicated by variations in an individual s capacity to make antibodies to specific antigens and saturation effects of antibody responses [216,217]. Individuals who develop neither a febrile episode nor asymptomatic parasitaemia during follow up might be considered as unexposed. Exclusion of these unexposed individuals from the analysis strengthens the ascertainment of the effects of immunity, transmission intensity and age [218]. However the choice of an individual marker of exposure remains a challenge. Using cross-sectional surveys for parasitaemia could misclassify those whose parasitaemia had been cleared by anti-malaria drugs or immunity. Furthermore this approach could only categorize individuals into 2 groups (exposed and non-exposed) 43
64 and doesn t take into account the underlying variability in level of malaria exposure at an individual level. There are several statistical approaches that have been proposed to address heterogeneity of exposure [211,219], but most are difficult to implement and interpret, and make assumptions on the distribution of the malaria exposure within the population. 44
.")
65 Figure 1:2: Simulation data showing effect of heterogeneity in malaria exposure on efficacy estimates The Figure shows deterministic simulation data depicting two groups in a randomized controlled trial (Vaccine versus control). As time progresses more children in the susceptible group will get malaria than in less susceptible group and subsequently will be removed from the pool of susceptible individual. Because the susceptible group contributes the most to the overall incidence and as the pool of susceptible is depleted, the incidence will decline with time, and this will occur faster in control than in RTS,S group. Consequently the vaccine efficacy will appear to wane as time progresses because the difference in incidence between the two groups becomes smaller with time. The simulation was conducted in excel assuming a constant efficacy of 50% with the control group having a 6 monthly malaria risk of 0.05 and 0.03 for the high and low risk individual respectively. Both vaccine and control group started with 1000 individuals 500 in each high and low risk group. Incidence C=malaria incidence in control group and Incidence V=Malaria incidence in vaccinated group 45
66 Frailty model In a frailty model, the observed variability in survival times is assumed to be a result of systematic selection of individuals who are less frail from a heterogeneous population. This heterogeneity is therefore an unobserved variable which can explain some of the variability in survival times. The frailty model modifies the Cox proportional hazard model such that the hazard of each individual depends in addition to unobservable variable Z which has multiplicative effect on baseline hazard function µ. μ(t, Z, X) = Zμ 0 (t)exp(β T X) where µ 0 (t) is the baseline hazard function, β the vector of regression coefficients, X is the vector of observed covariates and Z now is the frailty variable. The frailty Z is a random variable varying over the population and can either reduce (Z<1) or increase (Z<1) individual hazard rate. However, the estimates by frailty model depend heavily on the assumptions made on the distribution of Z and therefore the accuracy of the results is heavily dependent on how realistic the chosen distribution is. 46
67 1.9.3 Multiple episode analysis Multiple event analysis takes into account all events in an individual. The event can either be of the same type (recurrent clinical malaria episodes) or different type (type of fractures). The strength of multiple event analysis lies in its greater efficiency in estimating the effect of covariates compared to time to event analysis [220] Poisson regression Poisson regression models are normally used to report the efficacy of malaria vaccine against all clinical malaria episodes. They model the number of events per unit time of follow-up using a Poisson distribution. The log of the incidence rate is expressed as a linear function of covariates of interest allowing one to adjust for multiple covariates. The limiting factor of Poisson distribution is its assumption of equality of the mean and variance which limits it ability to model wider range of event data. For instance clinical malaria events do not always fit Poisson distributions, as demonstrated in the field [185]. Alternatively, a negative binomial distribution model can be used when the Poisson assumptions are not meet. In the negative binomial distribution, the mean and variance are independent of each other making it more flexible in modelling frequency patterns of observed event data. Poisson regression assumes that observed events within individuals are independent. However, prior malaria episodes may negatively or positively influence the risk to subsequent episodes. On the one hand frequency of previous malaria episodes may be a marker of increased exposure to malaria and could predict more subsequent malaria 47
68 episodes. On the other hand with each clinical malaria episode a child develops a natural immunity which reduces the risk of subsequent malaria episodes. This implies that multiple events within the same individual are unlikely to be independent Generalized estimating equation models Generalized Estimating Equation (GEE) models can be used to account for lack of independence of events within individuals. They are an extension of generalized linear models (GLM) which estimate the population averaged estimates. GEE is used for data within individuals in longitudinal studies where there are repeated measures on the same individual over time. The GEE model incorporates a robust estimation of the variance in order to adjust for the dependency between events. To further improve efficiency, the method also allows for incorporation of a correlation structure describing the type of correlation between observations within the same individual. There are four types of commonly used working correlations namely independent, exchangeable, autoregressive and unstructured working correlations[221]. With independent working correlation, one assumes correlation between events is zero. An exchangeable working correlation assumes uniform correlations across time and one can swap the order of two observations without affecting correlating structure. Autoregressive working correlation assumes that correlations between observations decrease with time with closer events being more correlated than distant events. An unstructured working correlation does not assume any particular form of correlation between events and is the most general form of correlation structure. However even if the 48
69 assumed working correlation is mis-specified, GEE can still provide consistent estimators of the regression coefficients and of their robust variances[222] Modified Cox regression models There are various modifications of Cox regression models which are available for analyzing multiple/recurrent events data in which events may not be independent. These models use different approaches to account for the within-individual correlation between events. The first is the conditional approach which introduces a time-varying covariate in the model such as number of previous events which captures dependence structure among recurrence times. The second is the marginal approach which uses sandwich robust standard error to take into account multiple events within individuals. Lastly is the random effect approach (frailty) which introduces a random covariate in the model in order to induce dependence among recurrent event times. The Andersen and Gill (AG) model is one form of modified Cox regression model which uses a counting process as the risk interval and restrictive risk set (individuals are considered for the k th event only if they have experienced (k-1) events). All events are assumed to have the same underlying baseline hazard. It uses robust sandwich standard errors to take into account correlation of multiple events within individuals. 49
70 1.9.4 Duration of protective efficacy Duration of efficacy is an important determinant of a vaccine s public health utility. A vaccine with long duration of protection would avert more malaria cases and deaths especially when given before the age at peak incidence of severe malaria. The malaria vaccine technology roadmap has set a strategic goal of having a malaria vaccine whose efficacy lasts for more than four years. For young infants in an endemic area, this represents the period of maximum risk of severe malaria and death (Figure 1:3). Reduction in malaria transmission is associated with changes in the mean age for severe malaria [223]. Therefore understanding the duration of vaccine efficacy and its interaction with the level of malaria transmission is important in order to inform public health policymakers on the expected utility of a vaccine under different transmission settings. 50
![Figure 1:3: Proportion of different presentations of malaria by age (from Langhorne et al [224] ) Knowledge of the duration of protection is also important in order to determine the need and if](/docs-images/92/109643499/images/71-0.jpg "required, timing of a booster dose.")
71 Figure 1:3: Proportion of different presentations of malaria by age (from Langhorne et al [224] ) Knowledge of the duration of protection is also important in order to determine the need and if required, timing of a booster dose. In the presence of reliable immunological correlates or surrogate markers of protection, the duration of vaccine efficacy can be inferred from the variation of correlates of protection over time and hence the best time at which a booster dose should be given can be determined. However in absence of such markers, long term empirical estimation of clinical efficacy of vaccine is the only available method. 51
72 Measurement of duration of vaccine efficacy Assessment of proportionality of hazard rate over time using Schoenfeld s residuals and models with time-dependent covariates has been used to infer sustained vaccine efficacy over time and/or lack of waning. However, if there is heterogeneity in vaccine action within individuals, even if the true vaccine efficacy wanes, it can appear from an analysis of incidence of first event, that efficacy is sustained or even increasing over time[225]. Furthermore, as explained in section 1.9.2, time to first event analysis can give misleading results in terms of waning of vaccine efficacy given its inherent characteristics of removing infected individuals from the at risk set during the followup. Dividing the follow-up time into number of equally spaced periods and performing time to event analysis is another alternative approach of determining the duration of vaccine efficacy [134]. This is called resetting the clock as everyone regardless of whether they had a malaria episode is considered at risk at the start of every new period. For a disease which confers some immunity after exposure, a vaccine which reduces exposure to malaria will result in differential acquisition of blood stage immunity between vaccinees and controls. Therefore the control groups at each time period will be acquiring immunity at different rates. This will complicate the interpretation of efficacy estimates at each time period [226]. Data on all malaria events in a person reflects the entire clinical malaria experience of an individual and if measured over many time intervals may give a better insight about changes of vaccine efficacy over time. Poisson and/or negative binomial regression can 52
73 therefore be used to determine the duration of vaccine efficacy. Analysis stratified by year of follow-up can give an insight into the variation of efficacy over time. The dependence of events within individuals can be accounted by use of GEE models. Alternatively the Andersen Gill Cox regression model which takes into account all malaria episodes can be used to assess duration of efficacy by assessing proportionality of hazard rate over time Potential for rebound malaria in RTS,S vaccinees RTS,S is a pre-erythrocytic vaccine, and so it s mechanism of protection may be similar in some respects to using an insecticide treated net (ITN). Both interventions reduce exposure to pre-erythrocytic stages of malaria parasites and as such RTS,S may be thought of as a biological bed net. Fears of potential for rebound malaria were expressed with Insecticide Treated Nets (ITN s) [227,228]. ITN s exert their protective effect by several mechanisms. First, ITN s use prevents mosquito bites by acting as a physical barrier between the mosquitoes and humans. Secondly, the impregnated insecticide also repels and kills mosquitoes before they have time to bite. This leads to fewer bites and subsequently reduction of the load of infectious sporozoites invading hepatocytes. This protection against pre-erythrocytic stages of the malaria might modulate the development of malaria-specific immunity and as such may potentially lead to decreased immunity later in life. Therefore fewer infections in early life might be followed by more infections in later life (rebound). This is different from resurgence of malaria which is 53
74 modulated by the increase in the overall transmission following a period of low transmission that leads to a highly vulnerable population with low malaria immunity. However no evidence of rebound malaria in later life has been reported on prolonged use of ITN s [229,230,231]. One possible explanation for absence of rebound may be due to reduction of mosquito s survival and overall transmission with widespread use of ITN s. When used by a majority of the population, ITN s not only protect the individual users but the community at large including those not sleeping under the ITN s [12,232]. This indirect effect of ITN may offset the reductions in immunity and thus lead to positive public health benefits for long-term ITN use [233]. RTS,S on the other hand does not affect mosquitoes survival, and is unlikely to significantly reduce transmission unless given to the entire population (including adults) for a sustained period [234]. It not is clear what will be the consequence of waning vaccine efficacy on the life time experience of malaria in vaccinees. By blocking infection by sporozoites, RTS,S may prevent exposure to blood stage antigens and delay acquisition of natural immunity. Declining efficacy may subsequently predispose vaccinees to rebound malaria. Alternatively RTS,S may have the opposite effect. Rather than an all or nothing prevention of exposure, it may partially reduce the number of infected hepatocytes resulting in lower inoculums of blood stage parasites [235]. This exposure to lower numbers of parasites might actually enhance blood stage immunity, avoiding potential for rebound malaria in the long run [236]. This underlines the importance of longer followup of RTS,S children in order to identify possible rebound malaria. 54
75 1.11 Summary The above literature review highlights three major areas for further research that I address in my thesis. The first area pertains to the duration of malaria vaccine efficacy. The most clinically advanced candidate malaria vaccine RTS,S has entered phase III and although data on the short term efficacy against clinical malaria in young children exist, the duration of efficacy is still unknown. Informed decisions on vaccine introduction cannot be taken without this data. The second area relates to the challenges facing the evaluation of a malaria vaccine candidate. Time to event analysis ignores the subsequent malaria episodes and can underestimate vaccine efficacy due to the effect of heterogeneity in malaria exposure. Furthermore, there may be genuine biological variation in efficacy due to heterogeneity in malaria exposure, apart from the artifactual variation described above. In my thesis, I consider a means of estimating individual variation in exposure so it can be included directly in models of vaccine efficacy. It has been perceived that active surveillance and passive surveillance may give distinct malaria case definitions and hence different estimates of malaria vaccine efficacy from the same population. My thesis investigates this possibility by comparative analysis of active and passive surveillance of malaria in the field. The third area relates to the lack of reliable correlates of vaccine protection. This has meant experimental approaches to vaccine development have been mostly empirical slowing the progress of vaccine development significantly. RTS,S induced antibodies correlated with protection from malaria infection but not disease. In addition quality of antibodies induced by RTS,S has not been investigated in the field and therefore its role in the protection against clinical malaria is not known. 55
76 My thesis is therefore an attempt to address these gaps in knowledge as far as RTS,S is concerned and provide solutions to some methodological challenges in the evaluation of malaria vaccine candidates Objectives The main objective of my thesis work was to determine the duration of protection of RTS,S/AS01E candidate pre-erythrocytic vaccine and identify its immunological correlates of protection in young children residing in a country endemic to malaria. Specific objectives were: 1. To determine whether there was a difference between active and passive malaria surveillance regarding specificity and sensitivity of malaria case definitions. (This was relevant since I rely on active case detection in my trial, but much of the literature describes passive case detection). 2. To examine a means of measuring individual malaria exposure in the field in order to account for the effect of heterogeneity in malaria exposure on efficacy estimates. 3. To determine four-year efficacy of RTS,S/AS01E against P. falciparum clinical malaria episodes in young children aged 5-17 months residing in a country endemic to malaria, and to describe variations in efficacy over time and by intensity of malaria exposure. 56
77 4. To describe the dynamics of humoral and cellular immunogenicity of RTS,S/AS01E in young children aged 5-17 months residing in a malaria endemic country. 5. To assess the correlations between RTS,S-induced anti-cs protein antibodies and/or RTS,S-induced T cell responses and protection from P. falciparum clinical malaria in young children aged 5-17 months residing in a malaria endemic country. 6. To determine if RTS,S-induced anti-cs protein antibodies and T cell immune responses meet Prentice criteria for surrogate marker of protection from P. falciparum clinical malaria in young children aged 5-17 months residing in a malaria endemic country. 7. To determine the avidity of RTS,S/AS01E induced anti-cs protein IgG antibodies in sera of children immunized with RTS,S and their association with protection from clinical malaria by P. falciparum in young children aged 5-17 months residing in a malaria endemic country. 57
78 2 Comparison of Surveillance methodologies 2.1 Background In this chapter I describe work conducted to determine if malaria case definitions derived from active and passive surveillance differ in their specificity and compare the sensitivity of each method in identifying malaria cases. Defining clinical malaria in endemic countries is difficult because individuals may carry parasites without symptoms, and coincidental febrile episodes may have etiologies other than malaria. The malaria-attributable fraction method uses population data to estimate the frequency of true febrile malaria among all febrile cases by fitting the risk of fever as a function of parasite density using a logistic regression model[237]. This method has been widely used under different malaria transmission intensities, and has become a standard approach for deriving parasite density thresholds to optimize sensitivity and specificity [184,238,239,240,241,242]. So which type of the surveillance is most appropriate in a malaria clinical trial? The choice of the surveillance method in malaria vaccine trials is dependent on the type of the endpoint (infection versus disease), objective of the study (effectiveness versus efficacy), sensitivity and specificity of each method in identifying most relevant clinical malaria cases and the proportion of total number of cases identified by each methods. The selected surveillance method should produce case definitions with high specificity and sensitivity. However there has been no attempt to assess if there is any difference 58
79 between active and passive surveillances in terms of sensitivity and specificity of clinical malaria case definitions. Comparison of the two methodologies of surveillance and their variations and/or combinations would provide supportive evidence for the choice of more appropriate surveillance method in malaria vaccine trials. Both active case detection and passive case detection using trained fieldworkers alters the dynamics of the health seeking behaviour by providing easier access to healthcare than would have normally been the case. Studies combining both active and passive surveillance may therefore report less severe forms malaria [243]. Regardless of the surveillance method used, cases are often defined by malaria parasitaemia in association with either an objective fever (i.e. temperature 37.5 C) or a subjective fever. Use of subjective fever in the case definition may lack specificity, and has been avoided in some studies [238], but the specificity of this endpoint has not been formally calculated. There are no analyses that examine the sensitivity and specificity of febrile malaria case definitions identified by passive case detection alone, yet this is critical to the accuracy of clinical trials and public health surveillance. When both active and passive surveillance are combined, the likelihood of presentation between active visits rises as results of frequent contacts [244]. For this reason, and also to avoid confusion, I have described the use of the combination of methods as active surveillance. The alternative, which I refer to as passive surveillance, relies only on individuals visiting at health care facilities where malaria is identified. 59
80 2.2 Methods Study cohorts and surveillance I analyzed data from four cohorts which underwent different surveillance methods for mild P. falciparum malaria, in order to describe the sensitivity and specificity of case definitions within cohorts and compare the specificity and incidences of the endpoints from active and passive surveillance. The cohorts were located in Chonyi, Ngerenya, Junju and Pingilikani sub-locations of Kilifi District, on the coast of Kenya between January 1998 and June 2009 (Figure 2:1). The Junju cohort included children located both in Junju and Pingilikani sub-locations. All cohorts were nested within the wider demographic surveillance system (DSS) which covers an area of about 891 km 2 around Kilifi District Hospital and involves at least every six monthly re-enumeration visits to about 25,000 households. Junju and Pingilikani have generally been high transmission areas, with moderate transmission in Chonyi, and low transmission in Ngerenya, as evidenced by entomological studies [245] and parasite rates [184,238]. However, transmission has been falling throughout the period of study [223,246]. For the purpose of this study I categorized the transmission intensity based on the concurrent parasite prevalence in each cohort. Different follow up and blood slide evaluation protocols were used in each cohort. In the Chonyi and Ngerenya cohorts, clinical malaria episodes were detected using weekly active surveillance implemented over the entire study period [184]. Children with subjective or objective fever (axillary temperature 37.5 C) had blood samples taken to estimate the parasite density from blood smears. In contrast, in Junju blood smears were 60
81 only done in children with an objective fever (axillary temp 37.5ºC) and children with subjective fever without elevated temperature were followed 6-12 hours later, and the temperature measurement repeated. Blood smears were made if objective fever was confirmed at this measurement. Clinicians reviewed all children who were unwell but without objective fever. In addition while the parents of the children in Chonyi and Ngerenya were instructed to report to Kilifi District Hospital (20 km away) whenever the child was sick, in Junju, dispensaries were located within 5 km and trained field workers were available at all times in the villages for passive surveillance. The Pingilikani cohort was monitored purely by passive surveillance at the Pingilikani dispensary, where blood smears were done for all children presenting with a complaint of fever (both objective and subjective fever). A cross sectional blood smear was done before long rains in all individuals within Junju, Chonyi and Ngerenya cohorts regardless of the fever. Sulfadoxine-pyrimethamine was the first line anti-malarial drug used until early 2006 when the artemisinin-based combination therapy (artemether-lumefantrine) was introduced throughout Kenya. 61

82 Figure 2:1: Location of cohorts used in the study The map shows the location of the cohorts used in the analysis. Coloured regions represent the locations where the cohorts were located. The sub-locations within each location are also shown, some of which have the same name as the cohort Ethics statement The details of consent procedures have been published elsewhere [61,184]. Briefly, in Chonyi and Ngerenya, written informed consent was obtained from parents/guardians of young children and adults from randomly selected homesteads using an approved consent form. In Junju written informed consent was obtained from parents/guardians of children 62
83 who earlier participated in a malaria vaccine trial that was non-efficacious. Subsequently the consent was sought for all the newborns from these homesteads. The Pingilikani dispensary cohort is nested within the wider Demographic Surveillance system with established recruitment process. The clinical records of children in the cohort were obtained by matching their personal identification numbers from anonymised Demographic Surveillance System and dispensary database. The approval for human participation in these cohorts was given by the Kenya Medical Research Institute Scientific Committee and National Review and the Ethical Committee of the Kenya Medical Research Institute Laboratory investigations Malaria parasitaemia was determined by examination of blood smears stained with 2% Giemsa solution. For Junju, Pingilikani dispensary, Chonyi and Ngerenya cohorts, the number of asexual-stage parasites/200 leukocytes was counted, and parasitaemia was estimated on the basis of an assumed uniform white cell count; 8,000 leukocytes/µl. For members of the Junju cohort located in the Pingilikani sub-location, parasitaemia was estimated on the basis of actual leukocyte count measured for each blood smear. Regression models for the determination of Malaria Attributable Fraction used parasite densities calculated from a single method. Only Plasmodium falciparum parasitaemia was included in the analysis. 63
84 2.2.4 Calculation of Malaria Attributable Fraction I used the Malaria Attributable Fractions to estimate the specificity of the malaria endpoints detected by different surveillance methods. Cases were febrile children at the time of surveillance visit. Control cases were afebrile healthy children seen at the cross sectional bleeds during the follow up period. For the Pingilikani dispensary cohort, I used controls from Junju cross sectional bleed. Junju is contiguous with and immediately next to the south of Pingilikani. The Malaria Attributable Fraction was determined by using logistic regression to model the risk of fever as a continuous function of parasite density as developed by Smith et al [237]. p Log = α + βx 1 p π In the above equation, p is the probability that a subject with x parasite density has fever and π is the power function of parasite density. The power function maximizes likelihood estimation for the different age groups, cohorts and surveillance methods and was used to model the relationship between fever and parasite density as a continuous function. The power function was re-optimized for each fit of the model; hence the shape of the curve relating parasite density to the probability of fever was allowed to vary for different populations. Confidence intervals were calculated by the bootstrap method using 1000 repeat samplings. Analysis was performed using Stata software (version 9.0; Stata Corp). Only children aged 0-5 years old were included in the analysis of general MAF. Age specific MAF were estimated to investigate variation of MAF with age for each cohort. 64
85 Children who had objective fever and also were reported to have subjective fever were included in the sub-analysis of objective fever but not subjective fever Calculation of Incidence rate Active surveillance in the Junju cohort located in Pingilikani sub-location overlapped with passive surveillance at Pingilikani dispensary. This overlap applied to the 105 children aged 5-17 months who were under active surveillance between May 2007 and April In order to define a comparable cohort under passive surveillance at Pingilikani dispensary, I used the demographic surveillance system to identify age- and location-matched children during the same period. However, I did not include children sharing a homestead with a child under active surveillance in this matched cohort, to avoid a possible contaminating effect of the homestead being visited. Incidence rates of malaria clinical episodes were calculated by counting the number of clinical episodes of malaria divided by the total time at risk expressed as total person years at risk. 2.3 Results The detailed characteristics of each cohort are shown in Table 2-1. In total there were 7,606 children and 299,189 surveillance visits across all four cohorts. Fever was documented in 19,462 surveillance visits and clinical malaria was diagnosed in 9,219 surveillance visits. 65
86 Table 2-1 Baseline characteristics of cohort used in the analysis Chonyi cohort Ngerenya cohort Pingilikani cohort Junju cohort Number of children Follow up period analyzed Median age in years (IQR) at the start of follow up* June June March (3.3) 0.5(2.5) 1.6 (2.1) 2.5 (2.3) Female % 153 (49%) 292 (51%) 2760 (45%) 202 (41%) Transmission intensity High Low Moderate Moderate Time at risk (years) , Incidence rate 1.16[ ] 0.63[ ] 0.16[ ] 0.93 [ ] Parasite prevalence# 30.8% 8.8% 18.7% 18.7% Surveillance methods Weekly active surveillance by field worker Weekly active surveillance by field worker Passive visits at dispensary Weekly active surveillance by field worker Passive surveillance at district hospital Passive surveillance at district hospital Passive surveillance by field workers and at dispensary Indication for blood smear Axillary temperature 37.5 or history of fever in the last 24 hours. Axillary temperature 37.5 or history of fever in the last 24 hours. Axillary temperature 37.5 or history of fever in the last 24 hours. Axillary temperature 37.5 only Number of total contact 29, ,292 28,384 59,604 # =Parasitaemia prevalence for all cohorts is summed up across the entire follow up period. *= Only children less than 5 years old are included in the analysis 66
87 2.3.1 MAFs of clinical malaria with objective or subjective fever Using a subjective history i.e. reported by mother or guardian, of fever in the case definition was associated with a consistently lower MAF than objectively elevated temperature (axillary temperature 37.5 C) independent of age. This difference was more marked in the higher transmission cohorts (Chonyi and Pingilikani) Table 2-2. As expected, using a threshold of >2500 parasite/μl increased the MAF for all case definitions. However, among children with subjective fever in Chonyi the MAF was 59% even after applying this threshold (Table 2-2). In the Junju cohort, where blood smears were only made on objectively febrile children, on only 8 out of 532 occasions (0.02%) were children with a history of fever but no elevated temperature found to have febrile malaria on a return visit conducted 6-12 hours later. The children who had no objective fever at 6-12 hours follow-up had a similar risk of a subsequent malaria episode as the children (matched by season and age group) who had no history of fever (HR: %CI , p value=0.9). Older children (2.5-5 years) had lower MAF than younger children (0-2.5 years) which increased after using a parasite threshold of >2500/µL (data not shown). However this difference was less marked in a low transmission cohort (Ngerenya). 67
88 Table 2-2 Malaria attributable fractions of malaria case definitions for any parasitaemia and >2500/uL in the four cohorts Chonyi cohort; active surveillance cohort Using objective fever(temp 37.5 C) Using subjective but not objective fever (temp<37.5 C) Using both case definitions MAF for density >0/µL (95%CI) 68% (63%-71%) 44% (38%-50%) 56% (52%-61%) Number of cases MAF for density>2500/µl(95%ci) 81% (78%-84%) 59% (53%-64%) 70% (66%-74%) Number of cases Ngerenya cohort ; active surveillance cohort MAF for density >0/µL (95%CI) 76% (73%-78%) 67% (65%-69%) 74% (72%-76%) Number of cases MAF for density>2500/µl(95%ci) 83% (81%-85%) 81% (79%-83%) 83% (81%-85%) Number of cases Pingilikani cohort; passive surveillance only cohort MAF for density >0/µL (95%CI) 75% (74%-76%) 40% (39%-41%) 61% (60%-61%) Number of cases MAF for density>2500/µl(95%ci) 85% (84%-86%) 54% (53%-55%) 73% (72%-74%) Number of cases Junju cohort; active surveillance package cohort MAF for density >0/µL (95%CI) 72% (69%-76%) NA NA Number of cases 809 NA NA MAF for density>2500/µl(95%ci) 85% (83%-88%) NA NA Number of cases
89 2.3.2 Parasite densities Children under passive surveillance in Pingilikani had a significantly higher geometric mean parasite density than children under active surveillance in Junju [10,300/µL:95% CI: 9,800-10,800 versus 4,775/µL:95%CI: 3,900-5,800]. Furthermore, there was no variation in geometric mean parasite density with distance from dispensary for the Pingilikani dispensary cohort within 10 kilometres of the dispensary suggesting that distance to healthcare was not a factor that determined the severity of disease at presentation (Figure 2:2). Figure 2:2 Variation of geometric parasite density mean with distance from Pingilikani dispensary Variation of geometric mean parasite densities with distance from Pingilikani dispensary. Parasite densities have been converted into log10 scale. 69
90 2.3.3 Comparison of active and passive surveillance Part of the Junju active cohort and the Pingilikani dispensary-based cohort overlapped geographically (Figure 1). Among an age-, time- and location-matched subgroups of these cohorts the Malaria Attributable Fractions were similar (Table 2-3). However, the incidence of clinical malaria identified by active surveillance was over three times the incidence by passive surveillance. The mean febrile temperature for passive surveillance at dispensary cohort was 38.6 C [95%CI: ] compared with 38.3 C [95%CI: ] on active surveillance, although the geometric mean parasitaemia were not statistically significantly different (Table 2-3). 70
91 Table 2-3 Comparison between passive surveillance and active surveillance during follow-up from May 2007 to May 2008 in a subset of children aged 5-17 months Passive surveillance# Active surveillance package* Cohort location Pingilikani Junju-Pingilikani Total number of children Total number of contacts Total time at risk (person years) Total malaria episodes θ Median contacts (Range) 1.6 (1-9) 32 ( 2-48) Geometric mean parasite density (/µl) (95% CI) Children with at least one malaria episode 14,700(8,700-24,900) 41,000(18,300-92,000) Incidence of clinical malaria θ 0.10 [95%CI: ] 0.37 [95% CI: ] Malaria Attributable Fraction >0/µL 92% (89%-95%) 88% (81%-96%) Malaria Attributable Fraction >2500/µL 98% (95%-100%) 94% (87%-100%) *= The active surveillance package consisted of passive surveillance at dispensary, passive surveillance at community by trained field worker with supervision from study clinician and active weekly surveillance by trained field workers. θ= Clinical malaria defined as fever (axillary temperature 37.5ºC plus parasitaemia of any density. #= Passive surveillance package consisted of Passive surveillance at dispensary only. Numbers in brackets are 95% confidence interval unless indicated otherwise. 71
92 2.4 Discussion In a subset of concurrent location- and age-matched cohorts, I found that purely passive surveillance without specific prompts for visits detected about one third of the episodes that would have been identified by active surveillance yet MAFs were similar. Furthermore, cases with subjective fever but no objective evidence (temperature < 37.5 C) had persistently lower Malaria Attributable Fractions, even when a parasite density threshold was used. It was surprising that the difference between rates for active and passive case detection in matched subset of children was not larger. Pingilikani dispensary serves a population of 4000 children under 5, and there had been no contact at the homestead or village level to encourage attendance. In contrast, active surveillance required one local fieldworker per children monitored with frequent contact at the homestead level (compared to 1 field worker per >1,000 children in passive surveillance). The large numbers of children using Pingilikani dispensary could be attributed to the availability of adequate staff seven days a week, good malaria diagnostic facilities and a constant antimalarial drug supply in contrast to frequent supply problems reported elsewhere in Kenya [247]. Nevertheless, I identified fewer cases of malaria at the dispensary than would have been seen on active surveillance, and in comparison children brought to the dispensary had significantly higher mean temperatures when they were febrile but similar symptomatic blood stage parasitaemia. This suggests that parents were inclined to postpone presentation at the dispensary until more acute overt illness. This was not simply the parents inability to identify illness, since when field workers were made highly 72
93 accessible in the subset of Junju cohort children located in Pingilikani sub-location, the majority of malaria episodes were identified by assessments initiated by the mothers between regular weekly visits. There was no gradient of increasing parasite density with distance from the dispensary, suggesting that the distance parents had to travel with their children did not delay their treatment seeking. I conclude that, in our setting, there is a barrier to approaching medical staff in a health facility that does not exist with more familiar, local field workers. Cases of febrile malaria not presenting to the local dispensary may resolve without treatment or be treated by anti-malarials bought by the parents from shops[248]. Passive surveillance in health care facilities has been reported to be insensitive outside Africa [249,250] and globally [3]. As malaria incidence falls it becomes increasingly important to identify the majority of infections to sustain progress in control [251]. Novel approaches, for instance passive surveillance operated by fieldworkers stationed locally, deserve further consideration and evaluation. The proportion of fevers attributable to malaria was persistently lower in children with subjective fever than in children with objective fever. Fever diagnosis by parents is unreliable [252,253]. Almost half of the cases with reported but not objective fever were classified as not true malaria (i.e. they represented asymptomatic parasitaemia in febrile patients with other aetiologies). Based on my results, the inclusion of reported fever cases in the endpoint of a clinical trial, or in measuring the public health burden of malaria is questionable. 73
94 Other factors may be relevant in defining the endpoint of a study. Although the main outcome for most Phase IIb vaccine trials in children would be clinical malaria, cluster randomized trials of transmission blocking vaccines might appropriately include all parasitaemic cases identified regardless of the definition of clinical malaria. However, approximately half of all cases presenting had only subjective fever, and so the loss in power of the study must be balanced against the need to include endpoints of high specificity. As an illustration, consider a hypothetical example where the incidences of subjective and objective febrile malaria were both 10 per 100 children, and the respective MAFs were 54% and 85% (using a threshold of 2500 parasites/μl). A study would have 90% power to detect 50% vaccine efficacy on including 1800 children using objective fever alone as the endpoint, falling to 1300 children using objective plus subjective fever. However, the estimate of efficacy would be 43% using objective fever, but 35% using objective fever plus subjective fever. When I looked at 532 children with subjective fever in Junju cohort who were followed 6-12 hours later, I found only 4% (19/532) developed an objective fever despite not receiving treatment and only 8 (0.02%) had parasitaemia. Furthermore, children who remained afebrile at 6-12 hours of follow-up had a similar risk of subsequent malaria episodes and other adverse events as other children matched by age and time of follow up. This was done in a clinical trial where we carefully monitored children and ensured 24 hour access to health care, and would not be practical for routine healthcare or larger studies, but demonstrates that subjective fever alone does not identify children at a high risk of serious disease. 74
95 When estimating MAFs in the Pingilikani cohort, cross-sectional surveys from neighbouring Junju were used. Since malaria transmission can vary significantly within short distances [204] using controls from a different area could have biased our MAF estimates. Furthermore controls were from a closely monitored cohort which could underestimate the true population prevalence of asymptomatic parasitaemia. However, these two directly adjacent areas are similar in soil-type, housing and Entomological Inoculation Rate (EIR) [245]. A potential estimation error is likely to non-differentially affect both MAF estimates, and thus, is expected not to bias incidence estimates. My results of the comparative analysis between passive surveillance and active surveillance apply in the context of our transmission patterns (seasonal/low to moderate) and age group compared, and extrapolation to other transmission patterns and age groups must be done with caution. Ngerenya and Chonyi cohorts operated identical surveillance methods, but the difference between objective fever and subjective fever was greater in Chonyi (at moderate transmission intensity) than in Ngerenya (at low transmission intensity). I have avoided comparisons between surveillance in Junju and Ngerenya/Chonyi because both the surveillance methodology and transmission intensity are different. Another limitation of our study is its retrospective nature which is prone to unmeasured confounding and bias. 2.5 Conclusion In conclusion, the Malaria Attributable Fractions are similar between active and passive surveillance, and passive surveillance at the dispensary underestimates malaria occurrence substantially. Using passive case detection at dispensaries alone in a phase II 75
96 trial would have only picked a small proportion of clinical malaria cases and undermined the efficacy estimates. Cases of malaria identified on the basis of reported fever alone should not be included in the primary endpoint of a clinical trial since the specificity of the endpoint is low. 76
97 3 Malaria exposure index 3.1 Background Heterogeneity in malaria exposure can bias the estimates of malaria vaccine efficacy, as reviewed in detail in Chapter 1 section Furthermore vaccine efficacy may vary according to the intensity of exposure [254] and therefore the utility of a malaria vaccine can be different in different transmission settings. Knowledge of individual malaria exposure would allow analysis of vaccine efficacy to take into account the intensity of malaria exposure. Adjusting for the individual malaria exposure would a) minimize the bias of heterogeneity in malaria exposure on efficacy estimates b) allow one to disentangle the effects of acquisition of blood stage immunity from the effect of malaria vaccine and c) allow study of interaction between vaccination and malaria exposure. I therefore conducted an analysis to develop an individual marker of malaria exposure in the field. 77
98 3.2 Methods Cohort population and data I used cohort data from Chonyi, Junju and Ngerenya sub-locations located within Kilifi Health and Demographic Surveillance System (HDSS) [55]. The data were prospectively collected between 1999 and 2001 for Chonyi, 1998 and 2010 for Ngerenya and 2006 and 2010 for the Junju cohort. Surveillance methods and detailed information on the cohorts have been described in section 2:2:1 and previously published [184,255]. In 291 children aged 5 to 17 months from the Junju cohort, a venous blood sample was obtained at a single cross sectional bleed and tested for anti-merozoite surface protein-1 (MSP-1 42 ) and anti-apical membrane antigen-1 (AMA-1) human immunoglobulin G (IgG) antibodies by enzymelinked immunosorbent assay as described previously[256]. Additional data collected included individual homestead locations (latitude and longitude coordinates). For the purpose of this study, malaria infection was defined as any P. falciparum positive blood smears (i.e. either asymptomatic parasitaemia or an episode of febrile malaria). I also determined if each individual was living within a malaria hotspot [257]. A malaria hotspot was defined, independent of this current work, as an area where the observed incidence of febrile malaria or asymptomatic parasitaemia was higher than would be expected if cases were evenly distributed, as defined using the spatial scan statistic at p<0.05, including a maximum of 30% of the population in a hotspot[258]. Chonyi has 78
99 been considered as a relatively high malaria transmission area with Junju and Ngerenya regarded as moderate and low malaria transmission areas respectively [245]. However since 1999 malaria has been declining in the overall study area [259] Relationship between malaria infection and proximity to infected case I computed distances (in Kilometres) from each individual to all others in each of the cohorts. The proximity of the index child to the next nearest infected child and next nearest uninfected child was calculated. This was done separately for two time windows; four months and one year time intervals. To derive the best powers for transforming distances, we fitted a set of power functions of distance as a function of malaria infection status in logistic regression models to optimize the log likelihood. This allowed for a nonlinear relationship to be fitted. The power functions that maximized the log likelihood fit were then used to transform absolute distances, and subsequently used in modified Poisson regression models to assess the effect of proximity to infected/uninfected children on the risk of malaria infection in the index child Calculation of weighted local prevalence of malaria infection The weighted local prevalence was calculated as distance-weighted proportions of malaria infected children within an area of specified radius and over specified time intervals. Two time intervals were used with the fourth month interval reflecting three distinct seasons with varying malaria transmission [260] whilst the one year time interval 79
100 was selected as a convenient annual summary. I used inverse distance weighting to give the children nearest to the index more weight in determining the local prevalence [261]. x N i= 1 = N ( 1 Di) i= 1 Zi Di (Where x is the interpolated weighted local malaria prevalence for the index individual, Zi is the known infection status of the surrounding child (0: for uninfected and 1: for infected), Di is the distance from the index individual to the surrounding child. The weighted local prevalence was expressed as a proportion with values between 0 and 1. I also calculated an unweighted local malaria prevalence as the simple proportion of infected children within 1 km Selection of best radius To determine the best radius over which the weighted local prevalence should be calculated, I grouped children around each index child in the cohort into annuli at 0.2 km, > 0.2km to 0.5km, > 0.5km to 1km and >1km to 2km (Figure 3:1). I then determined how well the calculated weighted local prevalence from these annuli predicted the risk of individual malaria infection. The annuli analyses allowed me to determine if the individuals in the outer zones had any additional impact in the risk prediction. The cut-off point for the radius was based on the last distance beyond which the weighted local prevalence didn t predict risk of infection. 80
101 3:1 Annuli around index child Univariate analysis The outcome measure was binary; malaria infection (i.e. either asymptomatic parasitaemia or at least one febrile malaria episode) or no malaria infection (i.e. no asymptomatic parasitaemia and no febrile malaria episodes) within four months or within one year time intervals. I investigated the effect of the following variables; weighted local malaria prevalence, distance to the next nearest infected and uninfected children and age. Residence in malaria hotspot as a binary variable was also included in the analysis because of prior report of its effect on risk of malaria infection [257]. In 291 children 81
102 from Junju, the effect of log transformed AMA1 and MSP1 antibody levels on malaria infection were also assessed. The effect of each variable was assessed by modified Poisson regression analyses with a robust error variance [262]. Multiplicative interaction models were used to assess interactions between proximity to the infected and uninfected children on the risk of malaria infection in the index child. Adjustments were made for the multiple observations per individual with a fixed effect for the time period and random effect term for individual. Risk Ratios (RR) and 95% confidence intervals (95% CIs) were estimated. To visualize the relationship between risk of malaria infection in the index child and proximity to other infected and uninfected children I differentiated the modified Poisson equation for the effect of distance and plotted the rate of change in risk over the first 1 km Multivariable analysis and model calibration A multivariable modified Poisson regression model was used to evaluate the independent role of each variable to predict malaria infection in the index child by including all significant variables (p<0.05) from the univariate analysis. I also used causal directed acyclic graph (DAG) as described before [263] to assess the suitability of our covariates for use in the final multivariable model. The aim was to minimize the magnitude of bias for the estimates of local malaria prevalence on the risk of malaria infection. I determined the area under the receiver operating characteristic (ROC) curve in order to evaluate the discriminatory ability of weighted local malaria prevalence and log 82
103 transformed AMA1 and MSP1 antibody levels for malaria infection in the index child [264]. I then compared the discriminatory power of individual models with the model consisting of both anti-merozoite antibody levels and weighted local prevalence. Analyses were done using STATA version 11 software (Stata Corp., College Station, TX) Ethical considerations Written informed consent was obtained from the adults enrolled and from parents/guardians of the children enrolled using an approved consent form. The approval for human participation in three cohorts was given by the Kenya Medical Research Institute (KEMRI) National Ethical Review committee [61,184]. 3.3 Results A total of 2,425 participants were included in the final analysis constituting 7,166 person years of follow up. The age of participants ranged between 0 to 81 years (median 15, IQR; ). There were 10,304 confirmed malaria infections of which 6,377 (62%) were asymptomatic. The demographic, parasitological characteristics and duration of follow-up for the three cohorts is shown in Table
104 Table 3-1 Demographic and parasitological characteristic of the cohort used in the analysis Cohorts Junju Chonyi Ngerenya Follow up period 2006 to Age (median, IQR) 3.1( ) 15.6 ( ) 14.5 (0-80) Number of all participants 620 (100) 874 (61.6) 931(66.9) (Percentage below 10 years) Female % 48.4% 58.7% 56% Total number of malaria infections Asymptomatic infection Total surveillance visits 83,566 90, ,074 Mode of surveillance Active surveillance Active surveillance Active surveillance Risk of malaria as a function of proximity to the infected case Increasing distance to the next nearest infected child was associated with a reduced risk of malaria infection in the index child in all three cohorts (Risk ratio (RR) = 0.37, 95%CI: for Junju, RR=0.18, 95%CI for Chonyi and RR=0.52, 95%CI for Ngerenya). The rate of change in risk was highest within 1 km (Figure 3:2). In contrast increasing distance to the next nearest uninfected child was associated with an increased risk of malaria infection in the index child; RR of 1.88 (95%CI: ), 1.72 (95%CI: ) and 1.49 (95%CI: ) in Chonyi, Junju and Ngerenya respectively. The rate of change in risk was similarly highest within the first 1km (Figure 3:2). I identified no interaction between the effects of distance to infected and uninfected children on the risk of malaria infection in the index child. 84
.")
105 Figure 3:2 Rate of change in the risk of malaria infection over distance to infected and uninfected case within first kilometer Y axis represents a change in risk coefficient per unit increase in kilometer from infected or uninfected case (Only the first 1km is included). As the distance from both infected and uninfected case increases, the marginal change in risk (increase or decrease in risk) to infection decreases. The marginal changes in risk are minimal beyond 1km. 85
106 3.3.2 Risk of malaria as a function of the weighted local malaria prevalence within a 1 km radius The values of weighted local prevalence range between 0 and 1 and their distributions are shown in Figure 3:3, Figure 3:4 and Figure 3:5. The distributions of weighted local prevalence were related to the malaria transmission intensity and the trend in mean weighted local prevalence over time in years mirrors the changes in transmission (see box 1). In Junju and Chonyi, weighted local malaria prevalence estimated from participants within 0.2 km, >0.2km to 0.5km, >0.5km to 1km but not those within > 1km to 2km zones were predictive of malaria infection in the index child. In Ngerenya weighted local malaria prevalence estimated from participants within all four annuli were predictive of malaria infection in the index child). I reasoned that because there was an inconsistent effect on the risk of malaria infection by the weighted local malaria prevalence beyond 1km, but a consistent effect for the three zones examined within 1km, that the optimal measure of exposure would be the distanceweighted proportion of malaria infections within 1 km radius. Consistently the plots of rate of change in risk of malaria infection versus proximity to infected case showed only a marginal effect beyond 1km in all three cohorts (Figure 3:2). In univariate analysis, weighted local malaria prevalence within 1 km was a strong predictor of risk of malaria infection in the index child in all three cohorts. An increase of 10% in weighted local malaria prevalence resulted in malaria infection RR of 86
107 1.99(95%CI: ), 2.19(95%CI: ) and 2.25 (95%CI: ) in Junju, Chonyi and Ngerenya cohort respectively. Areas under the ROC curve for the univariate weighted local malaria prevalence models were 0.72(95%CI: ), 0.71(95%CI: ), and 0.82 (95%CI: ) for Chonyi, Junju, and Ngerenya respectively. The effect of unweighted local malaria prevalence was similar to weighted local prevalence with a tendency towards higher areas under ROC curve for distance-weighted than unweighted local malaria prevalence). I also examined the effects of weighted local malaria prevalence estimated from four monthly follow up data. These did not differ significantly from those estimated from yearly follow up data in Junju and Chonyi but was significantly higher in Ngerenya cohort (Table 3-3). The Areas under ROC curve were similar to those of yearly follow up in all the cohorts. 87
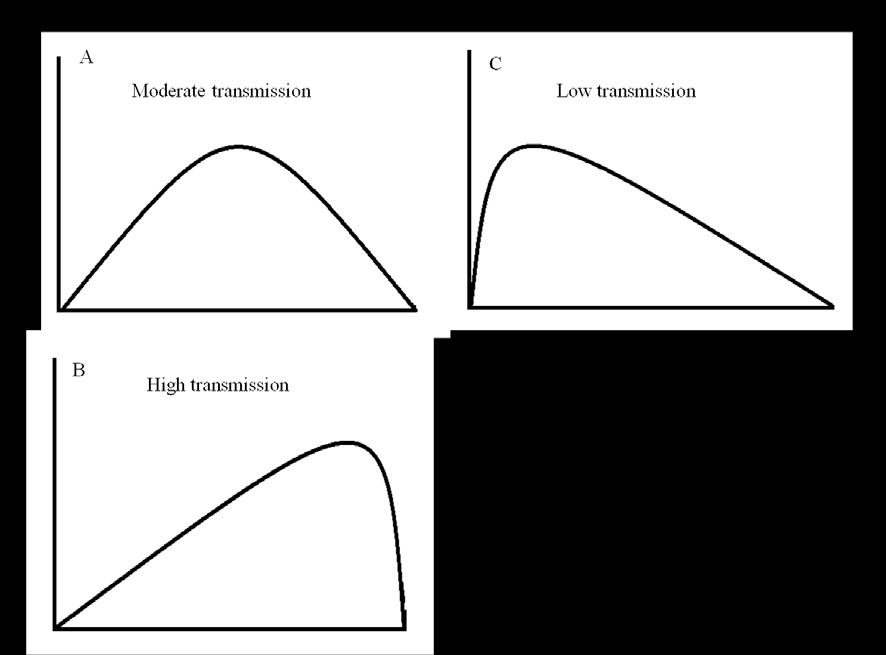

108 88

109 Figure 3:3 Local distance-weighted malaria prevalences in Junju cohort 89
110 Figure 3:4 Local distance-weighted malaria prevalences in Chonyi cohort 90
111 Figure 3:5 Local distance-weighted malaria prevalences in Ngerenya cohort 91
112 Table 3-2 Effect of weighted local prevalence of malaria infection from four annuli around each individual on risk of malaria infection Chonyi cohort RR(95%CI) P value AUC Weighted local malaria prevalence(<0.2km) 2.19( ) < Weighted local malaria prevalence (> km) 2.23 ( ) < Weighted local malaria prevalence (>0.5-1km) 1.80 ( ) Weighted local malaria prevalence (>1-2km) 1.49 ( ) NA Unweighted local malaria prevalence<1km 3.36 ( ) Weighted local malaria prevalence <1km 2.19 ( ) < Junju cohort Weighted local malaria prevalence(<0.2km) 1.95 ( ) < Weighted local malaria prevalence (> km) 1.42 ( ) Weighted local malaria prevalence (>0.5-1km) 1.99 ( ) Weighted local malaria prevalence (>1-2km) 0.71 ( ) NA Unweighted local malaria prevalence<1km 1.54 ( ) Weighted local malaria prevalence <1km 1.99 ( ) < Ngerenya cohort Weighted local malaria prevalence(<0.2km) 2.25 ( ) < Weighted local malaria prevalence (> km) 0.97 ( ) NA Weighted local malaria prevalence (>0.5-1km) 1.81 ( ) < Weighted local malaria prevalence (>1-2km) 1.52 ( ) Unweighted local malaria prevalence<1km 3.38 ( ) < Weighted local malaria prevalence <1km 2.25 ( ) < AUC: Area under the curve, RR: Risk Ratio 92
113 Table 3-3 Weighted local prevalence of malaria infection for four monthly follow-up data Univariate analysis Multivariable analysis RR (95%CI) P value RR (95%CI) P value Ngerenya cohort Weighted mean incidence (radius 1km) 4.55( ) < ( ) <0.001 Distance to nearest infected case 0.46( ) < ( ) Distance to the nearest uninfected case 2.19( ) < ( ) Residence in malaria hotspot 1.89( ) < ( ) <0.001 Age* NA <0.001 NA <0.001 Chonyi cohort Weighted mean incidence (radius 1km) 2.48( ) < ( ) <0.001 Distance to nearest infected case 0.20( ) < ( ) <0.001 Distance to the nearest uninfected case 2.54( ) < ( ) <0.001 Residence in malaria hotspot 1.47( ) < ( ) <0.001 Age* NA <0.001 NA <0.001 Junju cohort Weighted mean incidence (radius 1km) 2.09( ) < ( <0.001 Distance to nearest infected case 0.43( ) < ( ) Distance to the nearest uninfected case 1.5( ) < ( ) Residence in malaria hotspot 1.37( ) < ( ) <0.001 Age* NA 0.37 NA 0.39 * Age has non-linear association with risk of clinical malaria (see Figure 3:6), RR: Risk ratio Effect of malaria hotspot and age on the risk of malaria infection Residence in a malaria hotspot was associated with an increased risk of malaria infection in the index child. The effect was more pronounced in the lowest transmission area; Ngerenya (RR: 1.45, 95%CI: ) than in areas of moderate to high malaria 93
114 transmission; Junju (RR; 1.29, 95%CI: ) and Chonyi (RR: 1.23, 95%CI: ) respectively. Age had a statistically significant non-linear effect on malaria infection in the index child. In all three cohorts risk of malaria infection increased with age and peaked at 5 years before starting a slow decline (Figure 3:6) Multivariable models for predicting risk of malaria infection Multivariable models were separately developed for the three cohorts to assess the independent role of predictors of malaria infection in the index child and to determine the overall discrimination achieved with the multivariable model. The final multivariable model incorporated the weighted local malaria prevalence within a 1 km radius, distance to the next nearest infected child, distance to the next nearest uninfected child, age and whether resident in a malaria hotspot. Using the DAG approach we confirmed that all selected covariates were plausible confounders and their inclusion in the final model would minimize the magnitude of the bias in the estimate of effect of local malaria prevalence on the risk of malaria infection (Figure 3:7). Weighted local malaria prevalence, location within a malaria hotspot and age remained significant predictors of malaria infection in the multivariable model (Table 3-4). Proximity to the nearest infected child was predictive in Chonyi but not in Junju and Ngerenya. The areas under the ROC curve for the multivariable prediction models were 0.74 (95%CI: ) 0.72 (95%CI: ), and 0.84 (95%CI: ) for the Chonyi, Junju, and Ngerenya cohorts, respectively (Figure 3:8). 94
115 Table 3-4 Univariate and multivariable analysis of predictors of malaria infections Univariate analysis Multivariable analysis RR(95% CI P value RR (95% CI P value Chonyi cohort Weighted local prevalence (1km radius) 2.19( ) < ( ) <0.001 Proximity to nearest infected case 0.18 ( ) ( ) Proximity to the second nearest case 1.07( ) NA# Proximity to the nearest uninfected case 1.88( ) ( ) Proximity to the second nearest uninfected case 0.93( ) NA# - Residence in malaria hotspot 1.23( ) < ( ) <0.001 Age (years)* NA <0.001 NA <0.001 Junju cohort Weighted local prevalence (1km radius) 1.99( ) < ( ) <0.001 Proximity to nearest infected case 0.37( ) < ( ) Proximity to the second nearest case 0.74( ) <0.001 NA# - Proximity to the nearest uninfected case 1.72( ) < ( ) Proximity to the second nearest uninfected case 1.63( ) <0.001 NA# - Residence in malaria hotspot 1.29( ) < ( ) <0.001 Age (years)* NA <0.001 NA <0.001 Ngerenya cohort Weighted local prevalence (1km radius) 2.25 ( ) < ( ) <0.001 Proximity to nearest infected case 0.52( ) < ( ) <0.001 Proximity to the second nearest case 0.77( ) NA# Proximity to the nearest uninfected case 1.49( ) < ( ) Proximity to the second nearest uninfected case 1.42( ) < ( ) Residence in malaria hotspot 1.45( ) < ( ) <0.001 Age (years)* NA <0.001 NA <0.001 * Multivariable polynomial fraction showed age has a non-linear effect in all the cohorts (see Figure 3:6, #: The best fit model was obtained with only first nearest distances in the model, : Risk ratios are for each step increase in 0.35 and 0.45 power function of distance to the infected and uninfected child respectively 95
116 3.3.5 Local malaria prevalence and Merozoite antibodies based models in predicting malaria risk Merozoite antibody levels were assessed in 291 children in the Junju cohort (median age 20.5 months, IQR: ) at a cross sectional bleed. Merozoite antibodies levels were associated with increase in prospective risk of malaria infection in the index child ( Table 3-5). Univariate predictive models for AMA-1 and MSP-1 42 antibodies produced areas under the ROC curve of 0.75 and 0.76 respectively. In the same group of children weighted local malaria prevalence within 1km radius was associated with the risk of malaria in the index child in the univariate model providing area under ROC curve of 0.69 (95%CI: ). A multivariable model incorporating weighted local malaria prevalence, distance to the next nearest infected child, distance to the next nearest uninfected child and residence in a malaria hotspot had an area under the ROC curve of 0.72 (95%CI: ) which was not markedly different from either weighted local malaria prevalence or antibody level specific univariate models. The area under the ROC curve for the multivariable model incorporating weighted local malaria prevalence and antibodies to AMA1 and MSP 142 was 0.83 (95%CI: ) (Table 3-5). 96
117 Table 3-5 Merozoite antibody versus weighted local prevalence models in predicting malaria infection in Junju sub-cohort Univariate specific antibody-based model RR [95% CI] P value AUC (95%CI) AMA < ( ) MSP < ( ) Multivariable weighted local prevalence-based model Weighted local prevalence ( ) Malaria hotspot Proximity to the nearest infected case Proximity to the nearest uninfected case Univariate weighted local prevalence-based model Weighted local prevalence < ( ) Combined weighted local prevalence and anti-merozoite antibody Weighted local prevalence (1 km) 2.14 ( ) < ( ) AMA ( ) MSP ( ) <0.001 AUC: Area under the curve, RR: Risk Ratio 97
118 Figure 3:6 Mi Multivariable fractional polynomial plots of effect of age on the risk of malaria infection 98
 and blood stage antibodies (dashed boxes). Dotted lines represent conditional associations.")
119 Figure 3:7 Causal directed acyclic graphs (DAG) Panel A represents the causal diagram for the data; Panel B represent causal diagram after 6 step DAG approach and if one conditions on Age, malaria hotspot, spatial transmission factors (distance from infected and uninfected children) and blood stage antibodies (dashed boxes). Dotted lines represent conditional associations. 99
120 Figure 3:8 Area under the ROC curves for the multivariable weighted local prevalence based models 100
121 3.4 Discussion Based on this study I proposed a measure of individual malaria exposure that uses the distance-weighted local prevalence of malaria infection (composite endpoint including asymptomatic infection or febrile malaria) within a 1 km radius. The measure is empirical, being derived from active malaria surveillance and location data, and not based on any assumed distribution of exposure. The weighted local malaria prevalence demonstrated moderate to good discriminatory ability for malaria infection in the index child (ROC of 0.71, 0.72 and 0.82 in Junju, Chonyi and Ngerenya respectively). The discriminatory ability of a multivariable model incorporating the distance-weighted local malaria prevalence (within a 1 km radius), age, distance to the next nearest infected, distance to the next nearest uninfected children and the presence or absence of a malaria hotspot was not statistically different from that of distance-weighted local prevalence within a 1 km radius alone ( Table 3-5). In 291 children in Junju who had antibody levels measured, merozoite surface protein-1 (MSP ) and apical membrane antigen-1 (AMA-1) antibody levels were also good predictors of the individual prospective risk of malaria infection as described before [256,265] and their discriminatory ability for malaria infection was comparable to that of weighted local malaria prevalence. The combined model incorporating both of the antibodies data as well as and the weighted local malaria prevalence had slightly higher discriminatory ability than either alone (ROC of 0.83). Weighted local malaria prevalence captures exposure related to the spatial distribution of local infections. However antibody responses likely reflects both geographical variations in exposure and 101
122 individual variations resulting from factors such as bed net use, individual attractiveness to mosquitoes [208] or genetic variation in susceptibility[186]. This could explain the improved predictive power of the model incorporating the two measures. However, using antibody levels as marker of exposure could be circular in observational studies of natural immunity, particularly when one intends to assess the potential protective value of the same antibody response or a closely correlated antibody response. Under such circumstances adjusting for weighted local malaria prevalence as a marker of exposure may improve the estimates of antibody effect. Furthermore, antibody levels to blood stage antigens may be misleading if half the cohort has been randomized to a preerythrocytic vaccine that prevents exposure to blood stage parasites. On the other hand, provided a standardized assay is used, antibody levels will be more readily generalized between cohorts, and give an indication of the average transmission intensity of the cohort that can be compared with other cohorts. Heterogeneous exposure to malaria complicates the analysis of efficacy of candidate malaria vaccines [134]. Calculating the weighted local prevalence of malaria infection for each child will allow for more sophisticated analyses, such as dividing the cohort into high exposure and low exposure groups, and examining interactions between intensity of malaria exposure and vaccination. Other indirect measures of exposure such as entomological inoculation rate and parasite prevalence may also be used at a larger scale in large multi-centre studies involving sites with known transmission intensities. However for a single site such measures will provide only the average exposure for the population and not reflect the underlying variability of exposure at homestead or individual level. 102
123 To avoid circular reasoning I avoided using the index child s own malaria infection status to calculate the individual weighted local malaria prevalence. A causal diagram suggests that geographical heterogeneity in malaria risk is caused by unmeasured environmental factors. Therefore, although both local malaria prevalence and malaria hotspot shared spatial transmission factors as common ancestor, they represented two different causal pathways to exposure to sporozoites. This could explain why both the effect of malaria hotspot and local malaria prevalence remained significant in the multivariable model. The risk of malaria infection (i.e. the composite endpoint of asymptomatic and symptomatic parasitaemia) increased with age early on in life and decreased with age later in life consistent with findings from previous studies [266]. Lower exposure to mosquito bites due to small body surface area in children could explain the early trend [267], and the apparent observed decline in the risk of malaria infection later in life could be attributed to the development of effective pre-erythrocytic immunity or of blood stage immunity which suppresses asymptomatic parasitaemia below the level of detection [268]. My study has limitations. The surveillance approach identifies acute clinical malaria by weekly surveillance and asymptomatic parasitaemia on yearly cross-sectional blood films. I would therefore miss brief asymptomatic infections, asymptomatic infections below the level of detection by microscopy, and exposure that does not result in a blood stage infection because of pre-erythrocytic immunity. I have assumed that individuals remained in the same location. Although most infections are likely to be acquired in the evening or night when individuals are at the homestead, it is possible that some few infections were acquired during travel and this cannot be captured in the calculation of 103
124 the weighted local malaria prevalence. Nevertheless I have identified empiric evidence that weighted local malaria prevalence predicts the risk of malaria infection in the index child with reasonable accuracy. I conclude that any bias resulting from the limitations described do not preclude the utility of the approach. Furthermore, these limitations may result in an under-estimate of the local prevalence of infection, but in the absence of a geographical bias, the local prevalence will still reflect the intensity of exposure relative to the rest of the cohort. My findings may not be directly applicable to other settings where the transmitting vectors and human behaviour patterns vary. The optimal radius for calculating local prevalence may be different, and the relative predictive power of malaria hotspots, weighted local malaria prevalence and antibody levels may reflect the local setting. However, heterogeneity on a fine-scale is observed in many different settings [204,269,270] and it is likely that this approach to determining weighted local malaria prevalence could be adapted to these settings given adequate data. 3.5 Conclusion In conclusion I have used a conceptually straightforward approach to generate weighted local malaria prevalence as an estimate of individual s intensity of exposure to malaria. I have demonstrated that the weighted local malaria prevalence has satisfactory discriminatory ability, particularly when combined with anti-merozoite antibody levels. I propose that it could be used as general marker of exposure to malaria and used as a 104
125 covariate in models assessing the efficacy of potential malaria vaccines or immune correlates of protection to adjust for the heterogeneity in malaria exposure. 105
126 4 Long term efficacy of RTS,S/AS01E Four-year efficacy of RTS,S/AS01E against clinical malaria and its interaction with malaria exposure in children aged 5-17 months in Kilifi, Kenya. 4.1 Introduction RTS,S/AS01E is the candidate pre-erythrocytic malaria vaccine developed by GSK Biologicals, currently under clinical development. The introduction on RTS,S/AS01E antigen and its clinical development history has been described in section 1.6. The results from early phase II studies in malaria endemic countries have shown promising results. The objective of this work was to determine the duration of protection of RTS,S/AS01E against clinical malaria in children aged 5-17 months in Kilifi, Kenya during 4 years of follow-up. The duration of vaccine efficacy will be critical to public health policy decisions on vaccine introduction. Reductions in estimated vaccine efficacy over time may reflect; a) waning in the vaccine-induced protective immune responses to sporozoites b) delayed acquisition of natural immunity to blood-stage parasites in the RTS,S/AS01E group because of reduced exposure to blood-stage parasites in the presence of vaccine-induced immunity to sporozoites c) an artefact in survival analysis produced by microheterogeneity in malaria exposure within the cohort [210]. In order to adjust for 106
127 variations in malaria exposure within our cohort, I used the distance-weighted local malaria prevalence as a marker of individual malaria exposure, which I will subsequently refer to as the malaria exposure index [271]. The methodology of developing this measure of individual malaria exposure has been described in chapter 3. Malaria exposure index is a relative measure of the intensity of malaria exposure, as distinct from absolute measures such as the prevalence of asymptomatic parasitaemia or the entomological inoculation rate (EIR). These absolute measures are frequently used to compare different populations, but would be very labour intensive if used to accurately measure the individual variation within a population. 4.2 Methodology Study design The original study was a double blind randomized controlled trial at two sites; Korogwe, Tanzania and Kilifi, Kenya to evaluate the efficacy and safety of RTS,S/AS01E between March 2007 and November 2008[132]. The double blind phase lasted for an average of 8 months (range: 4.5 to 10.5 months). Follow-up in Korogwe stopped at 12 months but was extended in Kilifi, Kenya. Therefore only children from Kilifi, Kenya who were recruited in the original double blind control trial were recruited in the extended follow-up to assess the longevity of the vaccine efficacy against clinical malaria. As part of thisthe work for this thesis I analysed data from Kilifi, Kenya from randomization to 48 months post dose 3. During the single blind phase, principal investigators were unblinded to 107
128 allow analysis of the data at 8 months, but parents/guardians of participants, project manager, laboratory staff and healthcare workers in the community who performed active and passive surveillance remained blinded. The original study was sponsored by GlaxoSmithKline Biologicals. Extended follow-up beyond 12 months was investigator-led, and sponsored by the KEMRI-Wellcome Trust Research Programme and which I supervised. Both original and extended follow-up studies were registered with ClinicalTrials.gov, number NCT and NCT respectively Participants The study population comprised healthy children between the ages of 5 and 17 months from Junju and Pingilikani sub-locations in Kilifi, Kenya. The local residents are Mijikenda and their main activity is subsistence farming. The long rainy season is between March and May while the short rainy season is during November-December. Malaria transmission follows the rainy seasons. The main mosquito vector is Anopheles gambiae s.l. and the entomological inoculation rate (EIR) is reported between 4 and 60 per year [272]. The areas are served by two dispensaries namely Junju and Pingilikani. The roads are rough and difficult to pass during rainy season. Kilifi District Hospital is the main referral hospital and is located approximately 35 kilometres to the North. The original study and its extensions were approved by the Kenya Medical Research Institute National Ethics Committee, Western Institution Review Board in USA and Oxford Tropical Research Ethics Committee. Written informed consent for the extension was obtained from all children s parents/guardians using approved Swahili or Giriama 108
129 consent forms. Illiterate parents thumb printed the forms with independent literate witness countersigning. The study was overseen by an Independent data monitoring committee and local safety monitors, and conducted in accordance with the Helsinki Declaration of 1964 (revised 1996)[273] and Good Clinical Practice guidelines[274] Study procedure At screening, medical history and physical examination were done and blood samples were taken for haematological and biochemical tests. Participants were excluded from the trial if they had acute diseases with our without fever at the time of enrolment, serious acute or chronic disease at enrolment, a history of severe allergic reactions, a history of a previous blood transfusion, or a medical disorder not permitted by the protocol (eg, a weight-for-age Z score of less than 3 or other clinical signs of malnutrition at screening, major congenital defects, or a confirmed or suspected immunosuppressive or immunodeficient disorder). However no HIV test was conducted at the time of enrolment to exclude children with HIV infection. Children with haemoglobin level below 8g/dL, total while cell count < 4.0 x 10 3 /µl or >17 x 10 3 /µl, platelets of <100 x 10 3 /µl, alanine aminotransferase (ALT) > 60IU/L and creatinine>60µmol/l were also excluded at enrolment. Other exclusion criteria included the following; a) Planned administration/administration of a vaccine not foreseen by the study protocol within 30 days of the first dose of vaccine(s) with the exception of tetanus toxoid or scheduled diphtheria, pertussis or measles vaccine; b) Use of any investigational or non-registered drug or vaccine within 30 days preceding the first dose of study vaccine, or planned use during the study period; 109
130 c) Administration of immunoglobulins, blood transfusions or other blood products within the three months preceding the first dose of study vaccine or planned administration during the study period; d) Chronic administration (defined as more than 14 days) of immune-suppressants or other immune-modifying drugs within six months prior to the first vaccine dose (for corticosteroids, this will mean prednisone, or equivalent, 0.5 mg/kg/day. Inhaled and topical steroids are allowed); e) Previous participation in any other malaria vaccine trial; f) Simultaneous participation in any other clinical trial; g) Same sex twin; h) Any other findings that the investigator feels would increase the risk of having an adverse outcome from participation in the trial. All recruited children who presented with the fever or severe illness on the day of vaccination were deferred to another day within the time window for vaccination. However children with minor illnesses such as diarrhoea or mild upper respiratory infection without fever (axillary temperature < 37.5 C) were vaccinated. The absolute contraindication for vaccination was appearance of acute allergic reaction, significant IgE-mediated event or anaphylactic shock following the administration of vaccine investigational product and any confirmed or suspected immunosuppressive or immunodeficient condition, including human immunodeficiency virus (HIV) infection Randomization and masking RTS,S/AS01E and Rabies vaccines were packed in the identical boxes labelled with the treatment numbers. Treatment numbers were supplied in a separate randomization list generated by GSK Biologicals. Participants were assigned treatment numbers on attendance to the dispensary 110
131 4.2.5 Vaccination 447 children aged 5-17 months old from Kilifi, Kenya were randomized and received either RTS,S/AS01E or human diploid-cell rabies vaccine (Sanofi Pasteur, Swiftwater, PA, USA) intramuscularly at the left deltoid in a 1:1 ratio according to 0, 1, 2 month schedule. Participants were vaccinated between March, 2007, and August, Participants received three doses of vaccine: dose one at enrolment, dose two 1 month after enrolment, and dose three 2 months after enrolment. Children were observed for one hour after each vaccination for acute adverse events. All vaccinations took place at Junju dispensary and were administered by a study nurse who did not take part in any other study activity. Resuscitation facilities and qualified personnel were available in case of anaphylactic reaction following administration of vaccines Surveillance of clinical malaria cases Weekly active surveillances for clinical malaria were conducted by trained fieldworkers and clinicians provided passive surveillance at local dispensaries [132]. Under active surveillance, study participants were visited weekly by trained field workers and had their temperature measured. Only if the child had documented fever (axillary temperature 37.5 C) was a blood slide prepared. A rapid malaria test wasalso taken and formed the basis of prompt management of malaria cases. Blood slides were not read in real time. If the parent complained that the child had fever but axillary temperature was 111
132 <37.5 C, the child was revisited between 6-12 hours later to recheck the temperature. If fever was confirmed at the revisit the child was managed as above. If on the other hand fever was not present at the revisit, the study clinician was informed and appropriate to the clinical features, the child was either seen at the field health facility, transferred to Kilifi District Hospital or the parents were reassured that no further action was required. If no fever was present then the child was seen the following week. Parents/guardians were always encouraged to bring their children to the dispensary if they were concerned about their health. In case of positive rapid malaria test children were treated with Artemisinin combined treatment (AL) as recommended by Kenya national malaria guideline[275]. Under passive surveillance all children who presented at the dispensary had their temperature measured and only if they were febrile (axillary temperature 37.5 C) was a malaria blood slide prepared. If the child s temperature was less than 37.5 C they were revisited 6-12 hours later by trained field worker and re-examined. All children with severe illness which required admission to hospital were referred to Kilifi District Hospital Cross sectional bleeds In addition blood samples were obtained from all study participants regardless of their axillary temperature to study antibodies to Plasmodium falciparum CS protein repeat region (anti-cs protein antibodies) and/or asymptomatic parasitaemia from every child; before vaccination at 1 month, ~8 months (range 4 10 months), 12 months, ~15 months 112
133 (range months), ~25 months (range months), ~38 months (range months) and ~49 months (range months) Malaria Exposure The malaria exposure index was calculated as the distance-weighted proportion of asymptomatic or symptomatic malaria infected cases within a 1km radius of each individual over a 6-month interval, using data from 870 children under active surveillance in the same study area as the vaccinated cohort as described in chapter 3. Children were categorized into lower and higher exposure groups if they were below or above the cohort mean during the four years of follow-up, respectively Statistical analysis The primary study endpoint was clinical malaria defined as axillary temperature 37.5 C and P. falciparum parasitaemia of more than 2500/uL. The secondary study endpoint was clinical malaria defined as axillary temperature 37.5 C and P. falciparum parasitaemia of any level. The according to protocol (ATP) cohort included all children who received three doses of vaccine according to protocol and for whom surveillance data from 2 weeks post dose three were available. Each participant s data were censored at four years of follow-up. The intention to treat (ITT) cohort included all randomized children. The sample size for extended follow-up was limited by the number of children randomized in Kilifi at the start of the trial. Based on the observed clinical malaria 113
134 cumulative incidence of 60% over 4 years, this study had 85% power to detect a vaccine efficacy of 30% at the 5% significance level Analysis of efficacy against first episode First malaria episodes were evaluated by Cox proportional hazards models. Vaccine efficacy was defined as 1 minus the hazard (HR) Analysis of efficacy against all episodes Multiple episodes were analyzed a) by ordinary negative binomial regression with clustering to adjust for repeated measures (NB) and b) by Andersen and Gill Cox regression (AG) for multiple event analysis[276]. Multiple episodes were also analyzed by negative binomial regression (NB) through generalized estimating equations (GEE) [211] with specified working correlation structure in the model and robust SE estimates taking into account multiple outcomes per participants. To select the best working correlation structure I determined quasilikelihood under the independence model criterion or QIC. Initially I estimated the dispersion parameter α by running an ordinary negative binomial regression without considering the repeated nature of data [277,278]. Then using STATA package the full model with all covariates was run and QIC values obtained for several correlation structures. The correlation structure with the lowest QIC was selected. The results of the three models estimating vaccine efficacy against all clinical malaria episodes (Ordinary NB clustering to adjust for repeated measures, NB using GEE and AG models) were then compared. 114
135 Vaccine efficacy was defined as 1 minus the hazard (HR) or incidence rate ratio (IRR). Vaccine efficacy was adjusted for age at first vaccination, village, exposure index (as a time-varying covariate), use of insecticide treated bed net (as a time varying covariate) and distance to the health facility Assessment of waning in vaccine efficacy Waning of vaccine efficacy was assessed by time-dependent interactions between logarithm of failure time (or year of follow-up) and RTS,S/AS01E vaccination. Plots of adjusted vaccine efficacy over time were produced from the regression coefficients from Cox and AG regression models. I also conducted yearly stratified analysis of efficacy against all episodes by NB and NB (GEE) in order to inspect for evidence of waning in efficacy over time Assessment of cases of malaria averted Vaccine-attributable reduction was calculated as a difference between malaria incidence in control and RTS,S/AS01E groups in the ITT cohort and expressed as number of cases averted per 100 children per year of follow-up. The cumulative averted cases were calculated by summing the yearly averted cases. Differences in prevalence of asymptomatic P. falciparum parasitaemia were assessed by use of Fishers exact test. Data were analyzed using STATA Version 12.0 (StataCorp LP, College Station, TX, USA). 115
136 4.3 Results Trial profile Of the 447 children eligible for randomization in Kilifi, 223 were randomized to RTS,S/AS01E and 224 to the Rabies vaccine. 320 (72%) children completed 4 years of follow-up (Figure 4:1). 415 children (209 RTS,S/AS01E vaccinees and 206 rabies vaccinees) received all 3 planned doses of vaccines according to the study protocol (ATP) and were included in the ATP analysis. 169 and 151 children from RTS,S/AS01E and Rabies group respectively completed four years of follow-up. Baseline characteristics were similar in the two groups. The median duration of follow-up was 47.5 months (47.7 in RTS,S/AS01E group and 47.1 in rabies group), with no significant difference between the groups (Table 4-1). 116
137 Figure 4:1 Consort diagram 117
138 Table 4-1 Baseline characteristics and follow-up time summary (per protocol cohort) RTSS/AS01 E N =209 Rabies N = 206 Total N = 415 Characteristics Parameters or Categories Value or n % Value or n % Value or n % Follow-up time (Months) Median (5 th -95 th Centile) 47.7( ) ( ) ( ) - Age (months)at vaccination Median (SD#) 10(3.6) - 11(3.4) - 11(3.5) - Minimum/Maximum 5/17-5/17-5/17 - Gender Female/Male 106/ / / / / /49.9 Geographical Area Distance from Heath Centre (Km) Exposure index$ Area Area Area Area Median (SD#) (0.24) (0.23) - (0.21) Unknown Bed net use year Yes 154/ / / * Bed net use year Yes 94/ / / Bed net use year Yes 47/ / / Bed net use year 4 Yes 46/ / / * Bed net was used as time varying covariate in the statistical models (the denominator was the number of children with available data on bed net use), # SD: standard deviation, $: mean exposure over the entire follow up period. Area 1=Bodoi, Bomani and Junju villages, Area 2= Gongoni, Kolewa, Mapawa and Mwembe-tsungu villages, Area 3= Chodari, Kadzinuni, Kapecha and Pingilikani villages, Area 4=Bokini, Dindiri, Makata and Ng ombeni villages Efficacy against the first or only malaria episode In the ITT cohort, 118 first or only clinical malaria episodes meeting the primary case definition were documented in the RTS,S/AS01E group compared with 138 episodes in the control group, giving an unadjusted efficacy of 29.9% (95%CI: 10.3%-45.3%, p=0.005) by Cox regression. 118
139 In the ATP cohort (Table 4-2 and Figure 4:2), 111 and 130 first or only clinical malaria episodes were documented in the RTS,S/AS01E and control group, respectively, giving an adjusted vaccine efficacy of 32.1% (95% CI: 11.6% to 47.8%, p=0.004) by Cox regression. There was weak evidence of non-proportionality of the hazard associated with vaccination by time-dependent Cox regression model; HR=1.33 (95%CI: 0.98 to 1.81, p=0.07). A plot of adjusted vaccine efficacy over time showed statistically nonsignificant waning in efficacy over time (Figure 4:2). 119
140 Table 4-2 Efficacy of RTS,S/AS01E against Plasmodium falciparum clinical malaria and asymptomatic parasitaemia Subjects (N) Intension to Treat analysis RTS,S/AS01E Rabies Vaccine efficacy* No. of events First episodes (Cox regression model) PYAR Rate Subjects (N) No. of events PYAR Rate (95%CI) P value 2500 parasites (10.3 to 45.3) per μl >0 parasite per µl (6.8 to 42.3) 0.01 All episodes (Andersen and Gill Cox regression) 2500 parasites (-8.6 to 36.3) 0.18 per μl >0 parasite per µl (-8.8 to 36.2) 0.18 All episodes (Negative binomial regression) 2500 parasites (-7.2 to 38.3) 0.14 per μl >0 parasite per µl (-6.8 to 36.9) 0.14 All episodes (Negative binomial regression through GEE) 2500 parasites (-11.9 to 35.4) 0.25 per μl >0 parasites per μl (-11.7 to 33.6) 0.26 According to protocol cohort First episodes (Cox regression model) 2500 parasites (11.6 to 47.8) per μl >0 parasites per μl (15 to 48.7) All episodes (Andersen and Gill Cox regression) 2500 parasites (1.9 to 41.6) 0.04 per μl >0 parasites per μl (1.6 to 41.5) 0.04 All episodes (Negative binomial regression) 2500 parasites (-0.7 to 41.9) 0.06 per μl >0 parasites per μl (0.9 to 41.3) 0.04 All episodes (Negative binomial regression through GEE) 2500 parasites (-1 to 41.8) 0.06 per μl >0 parasites per μl (1.5 to 41.6) 0.04 PYAR: Episodes/Person Years at Risk; VE: Vaccine Efficacy (1-HR or 1-IRR); CI: Confidence Interval; *: Efficacy is adjusted for age, bed net use, area, malaria exposure index and distance from health center in classical Cox model. In negative binomial and Andersen and Gill Cox models malaria exposure index was excluded from adjusting covariates because of its interaction effect with vaccine efficacy. For Intention to treat analysis efficacy estimates are unadjusted. 120
 and for the cohorts with low and high malaria exposure indexes (Panels B and C, respectively).")
141 Figure 4:2 Kaplan-Meier curves and vaccine efficacy over time (According to protocol cohort) Kaplan Meier plots of the cumulative incidence of malaria and corresponding vaccine efficacy over time are shown for the entire cohort (Panel A) and for the cohorts with low and high malaria exposure indexes (Panels B and C, respectively). Clinical falciparum malaria was defined as the presence of fever (temperature 37.5 C) and a Plasmodium falciparum density of more than 2500 parasites per cubic millimeter. A log (time) interaction model was used to produce the fit for the vaccine-efficacy plots. In these plots, the solid line indicates the point estimates of efficacy and the dotted lines indicate 95% confidence intervals. Vaccine efficacy was truncated at 0% as the lower limit; hence, the lower limit of the confidence interval is visible only at the start of monitoring. The lower limit of the 95% confidence interval for vaccine efficacy against the first or only episode in the cohort with a low exposure index is not visible because it is below 0 and has been truncated 121
142 4.3.3 Efficacy against all episodes The histogram showing the distribution of malaria episodes in the RTS,S/AS01E and Rabies group is shown in Figure 4:5. I used two different analyses to examine efficacy against all episodes, both allowing for possible variations in efficacy and the malaria exposure index over time; a) a modified Cox-regression model, namely the Anderson- Gill model (AG) and b) a negative binomial regression model (NB), which fitted the data significantly better than the Poisson model (Likelihood ratio test of over-dispersion, Chisquare=504.21, df=1, p value<0.001, Figure 4:3). Independent working structure was the best correlation structure for the events within subject as indicated by the lowest QIC (Table 4-3). Furthermore a model with vaccine, distance to dispensary, area and bed net use covariate was the model with lowest QIC (Table 4-4). However I included age of participant at the time of vaccination in the final model. This is because age is known to be an important predictor of malaria risk. The efficacy estimate was similar whether or not I adjusted by age. In the ITT cohort, there were 551 and 618 clinical malaria episodes among 223 RTS,S/AS01E and 224 control vaccinees respectively, giving an unadjusted efficacy against multiple episodes of 16.8% (95%CI: -8.6% to 36.3% p=0.18), 18.6% (95%CI: to 38.3, p=0.14) and 14.9% (95%CI:-11.9% to 35.4%, p=0.25) by AG, NB and NB(GEE), respectively. In the ATP cohort, there were 475 and 518 episodes of clinical malaria among 209 RTS,S/AS01E and 206 control vaccinees, giving an adjusted vaccine efficacy against all 122
 as shown in Table 4-2.")
143 episodes of 24.3% (95%CI: 1.9% to 41.6%, p value=0.04) by AG, 23.5% (95%CI: -0.7% to 41.9%, p=0.06) by NB and 23.4% (96%CI: -1% to 41.8%, p value=0.06 by NB (GEE) as shown in Table 4-2. Figure 4:3 Comparison of Negative binomial and Poisson distribution fit of data (According to protocol cohort) 123
144 Table 4-3 Selection of working correlation structure Correlation P QIC Unstructured Exchangeable Independent Autoregressive Static Table 4-4 Model selection for analysis of efficacy against all clinical malaria using negative binomial model through GEE Correlation Covariates p QIC Independent Vaccine, Bed net, Area, distance, age Independent Vaccine, bed net, area, distance Independent Vaccine, area, distance, age Independent Vaccine, bed net, area Independent Vaccine, distance, age Independent Vaccine, bed net Independent Distance, age Independent Vaccine Independent Distance Independent Age Independent Bed net Independent Area
145 4.3.4 Efficacy and interactions with time and malaria exposure As shown in Table 4-5, vaccine efficacy was lower at later time points as indicated by significant interaction between vaccine efficacy and follow-up time (HR=1.28 versus 1, p=0.004) by AG and (IRR=1.65 versus 1, 95%CI: 1.03 to 2.63, p=0.04 in 4 th year) by NB. Efficacy was lower in children with high than low malaria exposure index as shown by the interaction between vaccination and malaria exposure index (HR=5.17 versus 1, p =0.001 by AG) and (IRR=2.48 versus 1, p= 0.02 by NB). Over time, the effect of malaria exposure on clinical malaria risk decline as indicated by interaction between malaria exposure index and follow-up time (HR=0.71 versus 1, p=0.04) by AG and (IRR=0.35 versus 1, p=0.02 and IRR=0.35 versus 1, p=0.01 in the 3 rd and 4 th year, respectively) by NB. There was no interaction between bed net use and vaccination (HR=0.95, 95%CI 0.64 to 1.4, p=0.78). Based on the NB model, stratified efficacy estimates by year of follow-up were 46 (95%CI: 21 to 63, p=0.001), 25 (95%CI: -19 to 52, p=0.23), 22 (95%CI: -17 to 48, p=0.23) and -1 (95%CI: -47 to 31, p=0.95) during the four years of follow-up as shown in Table 4-7. Based on the AG model, vaccine efficacy was 43.6% (95%CI 15.5% to 62.3 %) in the first year and -0.4% (95%CI to 45.3%) in the fourth year after vaccination (Figure 4.2). The decline in estimated vaccine efficacy was more rapid among children with a higher malaria exposure index (Figure 4:2) although terms for 3-way interactions between vaccination, malaria exposure index and time (to examine if vaccine efficacy declined more rapidly at high exposure than low exposure) were not statistically significant (HR= 125
146 1.56 versus 1, 95%CI 0.81 to 2.99, p value=0.18 and IRR= %CI: 0.76 to 2.14, p value=0.35 for AG and NB respectively). Interactions between vaccination and malaria exposure index, vaccination and time of follow-up and malaria exposure index and time of follow-up were also demonstrated by the negative binomial regression model through GEE as shown in Table 4-6. Table 4-5 Interaction analyses between vaccination, malaria exposure index and year of follow-up (According to protocol cohort) Negative binomial regression Andersen and Gill Cox regression RTS,S/AS01E N=209 Rabies N=206 RTS,S/AS01E N=209 Rabies N=206 Covariate IRR 95% P value HR 95% P value Confidence interval Confidence interval RTS,S/AS01E < <0.001 EI < <0.001 RTS,S/AS01E*EI Area Area Area < Area < Bed net Distance to dispensary Age (months) RTS,S/AS01E* year RTS,S/AS01E*year RTS,S/AS01E* year RTS,S/AS01E* year EI*year 1 1 EI*year EI*year EI*year Year NA - - Year NA - - Year NA - - Year NA - - : interaction between vaccination and time as continuous variable, : interaction between exposure index and time as continuous variable, EI: Malaria exposure index,; IRR: Incidence rate ratio; The models with three-way interactions (vaccination, year and exposure) didn t fit the data well; N=Number of children 126
147 Table 4-6 Interactions analysis between vaccination, malaria exposure index and year of follow-up by binomial regression through GEE (According to protocol cohort) Covariate IRR 95% Confidence Interval P value RTS,S/AS01E to 0.61 <0.001 EI to <0.001 RTS,S/AS01E*EI to Year Year to Year to Year to RTS,S/AS01E*Year RTS,S/AS01E*Year to RTS,S/AS01E*Year to RTS,S/AS01E*Year to EI*Year EI*Year to EI*Year to EI*Year to Age to Area Area to Area to Area to Distance to dispensary to Bed net to
148 Table 4-7 Stratified adjusted vaccine efficacy against all clinical malaria by malaria exposure index and year of follow-up by negative binomial regression (According to protocol cohort) Total cohort RTS,S/AS01E (N)=209 Rabies (N)=206 Low exposure group RTS,S/AS01E (N)=98 Rabies (N)=104 High exposure group RTS,S/AS01E (N)=99 Rabies (N)=96 VE (%) 95% CI P value VE (%) 95% CI P value VE (%) 95% CI P All years to to to Year to to to Year to to to Year to to to Year to to to VE: Adjusted vaccine efficacy estimates, CI: 95% Confidence Interval, NB: Negative Binomial, (N) Number of children Clinical malaria episodes averted Incidence of clinical malaria episodes increased in both groups during follow-up (Figure 4.4A). On analysis of the ITT cohort, it was estimated that the number of malaria cases per 100 children averted in each year of the four-year follow-up period were 26, 22, 18 and -1, respectively giving a total of 65 cases averted over 4 years, out of a total of 618 cases per 100 children in the control group (Figure 4:4 D). The number of cases averted over the 4 years of follow-up in low and high exposed children was 62 and 78 per 100 children respectively (Figure 4:4 B and Figure 4:4 C). 128
149 4.3.6 Cross sectional survey analysis Prevalences of asymptomatic P. falciparum parasitaemia among RTS,S/AS01E vaccinees were lower compared to the control group at all cross sectional surveys except at 49 months (range: months) post-vaccination (Table 4-8 ). There were no significant differences in mean haemoglobin concentration between the groups. Table 4-8 Asymptomatic parasitaemia at cross-sectional bleed in the per protocol cohort Mean RTS,S/AS01E Vaccine Rabies Vaccine Efficacy (95% CI) P Value month (range) Participants Participants Participants Participants Tested (N) with Positive Tested (N) with Positive Slides (N (%)) Slides (N (%)) 8 (4-10) (1) (4) 76.9 (-17.9 to 97.6) (5) (14) 67.8 (25.4 to 87.2) (12-18) (1) (6) 81.5 (8.3 to 98.1) (21-27) (4) (7) 50.1 (-56.8 to 85.5) (34-40) (9) (20) 60.4 (17.5 to 81.6) (45-51) (7) (5) (49.5 to -27.5) 0.47 Efficacy against asymptomatic parasitaemia calculated from Odds Ratios and p value based on Fisher s exact test. 129

150 Figure 4:4 Malaria incidences by exposure group and Vaccine-attributable reduction (Intention to treat cohort) Panel A shows the incidence of malaria according to year of follow-up in the entire cohort, Panel B shows the incidence in the cohort with a high exposure index, and Panel C shows the incidence in the cohort with a low exposure index. Panel D shows the cumulative number of malaria cases averted in the entire cohort and in the high-exposure and low-exposure cohorts. 130

151 Figure 4:5 Histogram showing frequency of clinical malaria episodes (primary case definition) by vaccine group 4.4 Discussion During four years of follow-up, RTS,S/AS01E was associated with 29.9% and 16.8% efficacy against first and all P. falciparum clinical malaria episodes, respectively, for children vaccinated at 5-17 months of age in a malaria endemic country. All three models of efficacy against all malaria episodes gave similar results for the ATP cohort analysis. NB using GEE gave slightly lower point estimates in the ITT cohort compared to AG and NB. All models (NB, NB using GEE, and AG) demonstrated significant variations in vaccine efficacy over time and by intensity of malaria exposure (as measured by our malaria 131
152 exposure index). The efficacy estimate during follow-up is surrounded by considerable uncertainty implying possible sustained efficacy at later time points. However, significant interaction between time and vaccination confidently rejected the null hypothesis that efficacy is constant over time. Furthermore, the upper confidence limits for efficacy in the 4 th year exclude greater than 31% efficacy overall, and exclude greater than 15% efficacy in the high exposure group. Waning in vaccine efficacy observed in our data is unlikely to be the consequence of heterogeneity in malaria exposure because reductions in efficacy over time were similar whether first or all episodes were analyzed, and also because they persisted even after including the exposure index in the model. I identified significant interactions between time since vaccination and vaccine efficacy, and between exposure to malaria and vaccine efficacy. These interactions indicate how vaccine efficacy varies in the presence of other covariates. For instance, in the NB model the theoretical efficacy of vaccination at an exposure index of 0 and in the first year is given by IRR=0.37 (i.e. 63% efficacy). As exposure index rises to 1, vaccine efficacy can be calculated by multiplying the IRR=0.37 by the interaction term of IRR=2.48 (i.e or 9% efficacy). These variations in efficacy may be more intuitively appreciated on the graphs shown in Figure 4:2 and Figure 4:4. The efficacy estimates of RTS,S/AS01E were similar to previously described estimates in older Mozambican children (1-4 years) who received RTS,S/AS02 and followed for 4 years using passive surveillance at health facilities. The efficacy against first or only clinical malaria episode in my study was 29.9% (95% confidence interval [CI]: 10.3% to 132
153 45.3%, p=0.005) compared to 30.5% (95% CI 18.9% to 40.4%; p < 0.001) in Mozambican children. The efficacy against all malaria episodes in my study was 24.3% (95%CI 1.9% to 41.6%, p=0.035) compared to 25.6% (95%CI, 11.9% to 37.1%; p < 0.001) in Mozambican children. In contrast, a long term follow-up study evaluating efficacy of RTS,S/AS02 in Mozambican children found no evidence of waning efficacy against first episode over time[134]. The difference in our respective findings may be because a) in our study waning in efficacy was more readily apparent on analysis of all episodes in Anderson- Gill survival models rather than first or only episodes in Cox regression, and the former analysis was not examined in Mozambique; b) whereas the incidence of clinical malaria was sustained (and in fact increased) during follow-up of our cohort, it fell over time in Mozambique, reducing the power to identify waning efficacy. AG regression includes all malaria episodes (n=243 first episodes versus n=1169 all episodes in our trial), and in particular includes all the 2 nd, 3 rd and 4 th episodes (Figure 4:5) that occur later during follow up but would be censored in Cox regression. In addition, AG estimates total effect, a sum of direct and indirect effect as a result of event dependency. Such estimates are more relevant from public health perspective than time to first event only. Other differences between the two cohorts were; higher transmission in Mozambique compared with Kilifi (EIR of 38 versus 22 and parasite prevalence of 20% versus 15%), higher median age at vaccination in Mozambique compared with Kilifi (35.9 months versus 10.8 months) and different adjuvants (AS02 in Mozambique versus AS01 in Kilifi, Kenya). However in an exploratory analysis of time to first event resetting the clock after each year of follow-up, the Mozambican study showed a trend towards reduced efficacy 133
154 against first episode over time but the authors could not rule out the effect of heterogeneity of malaria exposure. Increases in malaria incidence over the follow-up period reflect an increase in transmission in our study area (i.e. Junju/Pingilikani). The mean exposure index increased from 0.27 (95%CI: 0.26 to 0.28) in first year to 0.43 (95%CI: 0.42 to 0.44) in the fourth year. This increase in Junju/Pingilikani sub-locations contrasts overall declines in malaria transmission in Kilifi [45], suggesting marked local heterogeneity in transmission within the district [199,204]. I found significantly lower vaccine efficacy estimates in children with a higher malaria exposure index, suggesting that vaccine efficacy may appear to wane because of slower acquisition of natural immunity to blood-stage parasites among RTS,S/AS01E vaccinees, due to reduced exposure to blood-stage parasites. Alternatively, vaccine efficacy may wane because anti-cs protein antibody levels fell with time. Anti-CS protein antibodies may mediate protection, and were associated with reduced risk of clinical malaria in this study. The details of the anti-cs protein antibody analysis are given in chapter 5. Lower efficacy estimates immediately following vaccination at high malaria exposure could be due to a heavy sporozoite challenge that overcomes the vaccine-induced immunity [279,280]. Despite waning efficacy over time and with increasing transmission intensity, vaccination with RTS,S/AS01E resulted in an overall reduction of clinical malaria episodes over four years of follow-up (65 cases averted in total per 100 vaccinated children, from the estimated 618 cases per 100 children in the control group). Whereas vaccine efficacy 134
155 determined from survival models provides a useful estimate of the biologic effect of vaccination[197], there is concern that such estimates may be misleading in public health terms[281]. The vaccine-attributable reductions provide a further metric in evaluating possible public health impacts[282]. Although the confidence intervals are wide, efficacy against asymptomatic parasitaemia may persist longer than efficacy against clinical malaria. A similar pattern has been noted by others [134]. A pre-erythrocytic vaccine might, in theory, achieve such an effect if blood-stage immunity was lower among vaccinees, thus resulting in a greater likelihood of clinical disease resulting from any given infection. 4.5 Conclusion In conclusion, RTS,S/AS01E was associated with reduction in first and in all P. falciparum clinical episodes, but vaccine efficacy waned during four years of follow-up. Vaccine efficacy against all episodes was 46% (95%CI 21% to 63%) in the first year but -1% (95%CI -47 to 31%) in ATP cohort. Waning in vaccine-induced immunity and more rapid acquisition of blood stage immunity in the controls may both contribute to waning efficacy over time, and the latter may explain variations in efficacy according to malaria exposure. 135
156 5 Correlates of protection: Anti-CS protein antibodies 5.1 Introduction RTS,S immunization induces high levels of anti-cs protein antibodies. Although the peak anti-cs protein antibody response correlates with protection from malaria infection in challenge studies [131], no correlation with clinical malaria has been described in the field [129,157]. Identification of such a marker would aid selection of the best candidate malaria vaccines and facilitate determination of the duration of protection and timing for booster dose. Using data from a randomized controlled trial in Kilifi, Kenya I conducted an analysis to describe the dynamics of anti-cs protein antibodies in RTS,S/AS01E immunized children and determine their association with protection from clinical malaria. 5.2 Methodology Study design The samples came from children who received RTS,S/AS01E in Kilifi, Kenya and Korogwe, Tanzania in a randomized trial as described in chapter 4. Children were vaccinated between March and August Blood was taken for serological studies before vaccination at 1 month, ~8 months (range 4 10 months) and 12 months from 136
157 Korogwe, Tanzania and Kilifi, Kenya. In addition serum samples at ~15 months (range months), ~25 months (range months), ~38 months (range months) and ~49 months (range months) were obtained from Kilifi, Kenya only CS antibody measurement Measurement of vaccine-induced CS repeat region antibodies was conducted at CEVAC laboratory in University of Ghent, Belgium and results reported in EU/mL. The method is described in detail in Appendix B. I did not conduct the laboratory work to measure antibody levels to CS protein Statistical analysis I conducted two analyses; a) the first analysis was on data from Korogwe, Tanzania and Kilifi, Kenya from 2 weeks to 12 months post dose 3 (combined data). In this data set I used first or only clinical malaria episodes as my endpoint to assess the relationship between anti-cs protein titres and protection from clinical malaria and b) the second analysis was on data from Kilifi, Kenya only from 2 weeks to 38 months post dose 3 where my endpoint was all clinical malaria episodes 137
158 Analysis of combined data I conducted exploratory post hoc analyses of log-transformed anti-cs protein antibody titres on the According-To-Protocol RTS,S/AS01E vaccinees. I first calculated the predicted anti-cs protein antibody titres per week per child by fitting an exponential decay model using linear regression of log-transformed anti-cs protein titre as a function of time of follow-up. I then used the Cox regression model to evaluate the relationship between anti-cs protein antibody titres and protection from first clinical malaria episode with anti-cs protein antibody titres as a time-varying covariate. The optimal two-group model was selected by varying the dichotomization point to maximize the log-likelihood, and bootstrapping was used to calculate confidence intervals. A step function was then approximated using a cumulative normal distribution. I also explored other non-linear fits with power functions and fractional polynomials using the multiple fractional polynomial function on STATA version 12, with p<0 1 to retain additional power functions Analysis of Kilifi data I made two changes in the analysis of these data; a) First I did not assume exponential decay in anti-cs protein antibodies and b) secondly I included all clinical malaria episodes in assessment of the relationship between anti-cs protein antibody titres and protection. I calculated imputed weekly anti-cs protein titers by fitting fractional polynomial of time and log transformed anti-cs protein titers to allow for non exponential decay of anti-cs protein. The Cox regression model with spline functions was used to assess the relationship between imputed anti-cs protein antibodies as time- 138
159 varying covariate and protection. Linear and spline model fit were compared by log likelihood ratio test whereas Akaike information criterion (AIC) was used to compare step function and linear model given the non-nested nature of models in the latter comparison. Optimal threshold anti-cs protein titer was determined in the Cox regression model by dichotomizing imputed anti-cs protein titers at different points to maximize log likelihood ratio and using bootstrapping with 1000 iterations for 95 CI s. Data were analyzed using STATA Version 12.0 (StataCorp LP, College Station, TX, USA). 5.3 Results Combined data A total of 447 children, who had received RTS,S/AS01E had their anti-cs protein titres available for analysis Anti-CS protein decay overtime Box plots showing the distribution of anti-cs protein (CS) antibody titres after vaccination for RTS,S/AS01E group are shown (Figure 5:1). There was a significant increase in anti-cs protein titres one month post dose three in the RTS,S/AS01E group to a peak geometric mean titre of 540 EU/mL (95% CI ). Over time, the titres declined to a geometric mean of 41.6 EU/mL (95% CI 38-46) at 12 months and then to 31.3 EU/mL (95% CI 26-38) at 15 months. 139
 compared to the rabies vaccine group; 91 6% (95%CI 88 3% to94 2%).")
160 Baseline anti-hepatitis B surface antigen (HBsAg) seroprotection rates ( 10 miu/ml) were similar in RTS,S/AS01E and rabies group (approximately 95% of the participants). At 12 months, the seroprotection rates were higher in the RTS,S/AS01E group;99 7% (95%CI: 98.4 % to 100%) compared to the rabies vaccine group; 91 6% (95%CI 88 3% to94 2%). Mean geometric titres of HBsAg antibodies were mIU/mL (95%CI to ) in RTS,S/AS01Evaccinees compared to miu/ml (95% CI ) in rabies vaccinees. Figure 5:1 Anti-CS protein antibody titres in RTS,S/AS01E vaccinees (Kilifi and Korogwe combined data) Figure shows anti-circumsporozoite antibody titres during follow-up in children who received the RTS,S/AS01 E vaccine. Anti-circumsporozoite antibody titres in the control group were consistently low or undetectable throughout follow-up and are not shown. The horizontal line within each box represents the median, the top and bottom of each box represent the 25th and 75 th percentiles, respectively, and the I bars represent the highest and lowest values within 1.5 times the Interquartile range. The circles denote outliers. The horizontal line under the baseline values indicates that the values for the median and interquartile range were identical 140
161 Association between anti-cs protein titres and protection Among RTS,S/AS01E vaccinees, there was no correlation between anti-cs protein titres one month post dose three and protection from clinical malaria over 12 months monitoring. (Hazard Ratio for log increase in anti-cs protein titre=0 87 [95% CI ], p=0 7). However titres at month 6 5 showed a correlation with protection over 12 months (HR for log increase in anti-cs protein titre=0 43 [95% CI ], p=0 006). On examining the survival function by tertile of anti-cs protein titre, it appeared that the lower tertile of responders were at increased risk compared with the upper two tertiles 6 5 months after vaccination. Figure 5:2 shows the KM plots of anti-cs antibody tertiles measured at one month post dose three and Figure 5:3 shows the KM plots for the anti-cs antibody tertiles measured ~8 months post dose 3). The mean response in the lower tertile at 8 month post dose 3 was 26 EU/mL, compared with 225 EU/mL in the lower tertile one month after dose three. 141


162 Figure 5:2 KM plots for the risk of clinical malaria based on the anti-cs protein titres at 1 month post dose 3 Figure 5:3 KM plots for the risk of clinical malaria based on anti-cs protein titres at 6.5 month 142
163 In order to analyze the outcomes related to concurrent anti-cs protein titres throughout the study (rather than at a single time-point), I used an exponential model of antibody decay, which fitted the anti-cs protein titres data well (Figure 5:4 for examples of selected individual fits). I then used the calculated weekly anti-cs protein titre as a timevarying covariate in a survival model. A linear fit between antibody titres and risk of clinical malaria was of marginal significance (HR=0 68, 95% CI , p=0 07). As described above, the survival function plots by anti-cs protein tertiles showed that the increase in risk of clinical malaria was specific to the lower tertile of anti-cs protein titres at month 6 5. I therefore reasoned that models dividing anti-cs protein titres into groups might fit the data better than a linear model. I examined two-level models, dichotomizing at a range of titres from 10 to 350 EU/mL (Figure 5:5). An optimal fit (as measured by the log likelihood) was produced when the calculated anti-cs protein titres were dichotomized at 40 EU/mL (95% CI by bootstrap), with a hazard ratio of 0 52 (95%CI , p=0 001) for the high titre group. 143
164 Figure 5:4 Linear decay of anti-cs protein titres in selected RTS,S vaccinees (combined data) 144
165 Figure 5:5 Log likelihood ratio graph for the optimal dichotomization level of anti-cs protein titres (combined data) A two-level model implies an immediate change in risk of clinical malaria at a particular titre, and may be an over-simplification. To estimate how abrupt the change in risk was around 40 EU/mL, I fitted a cumulative normal distribution of anti-cs protein titre and protection. The cumulative normal distribution model may approximate a two level model with an abrupt change, but can also model more gradual rates of change in protection between the two groups. The cumulative normal distribution that fit the data had a standard deviation of 0 1 on a log scale (95% CI ). This meant that 70% of the change in level of protection occurred between 30 and 50 EU/mL (i.e. the transition between groups is quite sudden, as plotted in Figure 5:6). I calculated the uncertainty around this estimate by bootstrap. The 5 th centile indicates the most abrupt transition with 70% of the change in level of protection occurring between 35 and 45 EU/mL, and the 145
")
166 95th centile indicates a more gradual transition with 70% of the change occurring between16 and 100 EU/mL (Figure 5:6). Figure 5:6 Cumulative distribution curve for association between anti-cs protein titres and protection (combined data) 146
167 5.3.2 Kilifi data Anti-CS protein titres during four years of follow-up The Kilifi dataset showed similar trends with peak anti-cs protein mean of 543 EU/mL (95% CI: 479 to 614) and declining to 77EU/mL (95%CI: 68 to 87), 44 (95% CI: 38 to 50), 32(95%CI: 26 to 38), 26(95%CI: 22 to 30) and 17(95%CI: 15 to 20) at 6, 14, 18, 25 and 36 months post vaccination. However, titres remained higher in RTS,S/AS01E vaccinees compared to control vaccinees who had undetectable anti-cs protein antibodies titres throughout the study (Figure 5:7). Imputed anti-cs protein antibody titres dynamic is shown in Figure 5:8. The decay of anti-cs protein titre demonstrated biphasic kinetics with earlier faster decay followed by a more subtle decay beyond about one year since the last dose of vaccination. There was no difference in the geometric mean peak titres or decay kinetics of anti-cs protein by malaria exposure level (p value=0.66) as shown in Figure 5:9 and Figure 5:

168 Figure 5:7: Anti-CS protein antibody titres over time (Kilifi data) Figure shows anti-circumsporozoite antibody titres during follow-up in children who received the RTS,S/AS01 E vaccine. Anti-circumsporozoite antibody titres in the control group were consistently low or undetectable throughout follow-up and are not shown. The horizontal line within each box represents the median, the top and bottom of each box represent the 25th and 75 th percentiles, respectively, and the I bars represent the highest and lowest values within 1.5 times the Interquartile range. The circles denote outliers. The horizontal line under the baseline values indicates that the values for the median and interquartile range were identical 148

 Figure 5:9 Imputed")

169 Figure 5:8: Imputed individual anti-cs protein antibody titres (Kilifi data) Figure 5:9 Imputed individual anti-cs protein antibody titres by malaria exposure 149
170 Figure 5:10 Anti-CS protein titres by malaria exposure group and follow-up (Kilifi data) Association between anti-cs protein titres and protection As in the combined dataset I found no linear association between imputed anti-cs protein titre and protection from clinical malaria (HR 0.91; 95%CI: 0.76 to 1.08, p value=0.286). I demonstrated a non linear relationship between anti-cs protein titres and protection from clinical malaria by cubic spline Cox regression model and step function model. The cubic spline model with 3 knots was selected for the best fit (Table 5-1). Graphical representation of hazard rate ratio from cubic spline Cox regression model showed no significant variation in risk between 1 and 100 EU/ml (i.e. the confidence intervals include HR=1), but above 100 EU/ml there was a reduced risk of clinical malaria with increasing antibody levels (Figure 5:11). 150
171 The best categorization level which given maximum log likelihood ratio was 85 EU/mL (Figure 5:12). Hence using step function model levels above 85EU/mL (95%CI: ) were associated with protection from all clinical malaria (HR=0.55 (95%CI: 0.36 to 0.85; p=0.007). Both cubic spline Cox regression and step function models were a better fit for the data than the linear model (Likelihood-ratio test p value= for comparison with the linear model and AIC= versus for the step model and linear model respectively). Table 5-1 Comparison of cubic spline models Model Observation Log likelihood Log likelihood df BIC for null for model Model with 3 knobs Model with 4 knobs Model with 5 knobs
172 Figure 5:11 Non-linear association between protection and anti-cs protein titres based on cubic spline model (Kilifi data) Figure shows the association between imputed anti-circumsporozoite antibody titres and the hazard ratio for clinical malaria episodes among children who received the RTS,S/AS01E vaccine, according to a Cox regression model with cubic splines and with a baseline titre of 1.0 enzyme-linked immunosorbent assay unit (EU) per milliliter as the reference. The dotted lines indicate the 95% confidence interval. There was no significant variation in risk between 1 EU per milliliter and 100 EU per milliliter (i.e., the confidence intervals include a hazard ratio of 1.0); at values above 100 EU per milliliter, however, there was a reduced risk of clinical malaria with increasing antibody titres. 152

173 Figure 5:12 Log likelihood ratio for the optimal dichotomization level of anti-cs protein titres (Kilifi data) Discussion I demonstrated a non linear association between anti-cs protein titres and protection from clinical malaria in children aged 5-17 month at first dose of vaccination residing in malaria endemic countries who were vaccinated with RTS,S/A01E. The relationship was apparent when current anti-cs protein rather than peak titres were used in the model. This is probably because there is insufficient time for an anamnestic response during the brief time that sporozoites spend in the peripheral tissues and circulation before invading hepatocytes. 153
174 Better fit models were obtained by dichotomizing at 40 EU/mL (95%CI: 32-59) and 85EU/mL (95%CI: ) in short-term combined data and long-term Kilifi data respectively. The linear model fitted the data more poorly than step-function model. The difference in time of follow-up, number of participants included in the analysis as well as the difference in endpoints (first or only clinical malaria versus all clinical malaria episodes) may have been responsible for the difference in dichotomizing point in the two analyses. A linear association between anti-cs protein titre and protection from malaria infection was found in Mozambican young infants [156]. In my study, the linear association albeit was of marginal significance between anti-cs protein titre and clinical malaria. However, the mean peak levels were much lower in Mozambican infants (peak mean 199EU/mL) compared to level in my study (543EU/mL versus 274EU/mL). In contrast to my findings, Mozambican children were protected from clinical malaria at a mean level of 8.8EU/mL [134] and experimental malaria challenge studies reported linear association between protection and anti-cs protein well above the dichotomization points observed in my analyses [131]. My step-function would have predicted no protection with levels in Mozambican children at 4 years and very little or no protection in experimental malaria challenge studies. However protection from malaria is the function of many factors such as age, acquisition of natural immunity to malaria and exposure, and these factors differ from one study to another. 154
175 However in the Kilifi-only dataset, the best fit model supported a more progressive increase in protection with increasing anti-cs protein titres above a certain cut-off (i.e. 105EU/mL), without a plateau as described in the combined data set. How biologically plausible is the step function model compared to a curve relationship? A curve relationship argues for the situation where rising antibody titres would steadily inhibit more sporozoites until near to 100% efficacy is reached, rather than reach a plateau at 50% efficacy (Figure 5:6). However, there may be sub-populations of sporozoite that reach the liver through different routes and after spending different periods of time in the skin [283,284]. A given anti-cs protein titre might inhibit only a sub-population of sporozoites that take a particular route [285]. In order to resolve this question and given the large 95% intervals surrounding the dichotomizing points there is a need to combine large numbers of studies to obtain an accurate representation of the relationship between anti-cs protein titres and protection from clinical malaria. In theory, a partially effective pre-erythrocytic vaccine might either positively [286] or negatively [287] impact naturally acquired immunity to blood-stage parasites. Until further data are available, using a single correlate to predict clinical outcomes may not be appropriate. Furthermore, antibody may be a non-causal correlate. For instance, sustained antibody titres might closely correlate with an additional mechanism such as a cellular response [131,178]. Alternatively, other properties of the antibody response may be more accurate correlates, such as isotype, avidity, functional properties or binding to intact sporozoites. 155
176 5.4 Conclusion In conclusion I showed the relationship between RTS,S/AS01E-induced anti-cs protein antibodies and protection from clinical malaria is non linear. The model is based on a single dataset and needs to be validated using other data sets. The current vaccine development process is empiric, and requires costly and time-consuming clinical studies. Models that predict efficacy from immunological studies will greatly accelerate malaria vaccine development. 156
177 6 Correlates of protection: T cell immune responses in adults (A re- analysis of correlates of protection from a phase 2a trial of the falciparum malaria vaccines RTS,S/AS01B and RTS,S/AS02A in malarianaive adults.) 6.1 Introduction Cell mediated immune responses are important vaccine effectors. RTS,S/AS01E candidate vaccine is believed to work through both anti-cs protein antibodies and cell mediated immune responses in preventing infection of the hepatocyte (chapter 1). In the publication by Kester et al, both anti-cs protein antibody titres and CD4 cell responses were suggested to be important correlates of protection against experimental challenge in malaria naive adults [131]. In figure 7 of their article, the authors presented a scatter plot of antibody titres and CD4 cell responses for 73 individuals, using symbols to show outcome (Figure 6:1). The authors suggested that both antibody and CD4 cell responses may be independently protective against malaria challenge, based on the observation that, on the scatter plot, individuals with both high CD4 cell responses and high antibody titres were more likely to be protected than individuals with only high CD4 cells or only high antibody titres. In this chapter, I conducted multiple regression analysis 157
178 using the presented data to test this hypothesis, quantify the effect size, and test the significance of the associations. Figure 6:1 CS protein specific CD4+ T cell and antibody responses and their relation to protection against malaria-infected mosquito challenge (Modified from Kester et al JID 2009[131]) Red diamond=not protected; Yellow triangle=delayed time to infection; Green circle=protected from challenge 158
179 6.2 Methods I used the coordinates from the scatter plot to deduce the values of the antibody titres and CD4 cell responses by individual. In the plot individuals were classified as either fully protected, partially protected (i.e. a delay to appearance of parasites in the blood) or not protected. For our analysis, we used two definitions of protection; the first definition included only fully protected individuals, the second included both fully protected and partially protected individuals. I reasoned that time to event models did not match the biology of the situation, and logistic models to calculate odds ratios as the measure of effect were not appropriate given the high frequency of the outcome. I therefore used a modified Poisson regression model [262] with a robust error variance to determine the relative risk of infection after malaria challenge as a function of log transformed antibody titres and CD4 cell responses using Stata version 9, StataCorp, Texas. I investigated possible interactions between CD4 cell responses and antibody titres by comparing the fit of models with and without interaction terms. 6.3 Results Antibody titres and CD4 cell responses were both independently associated with protection from malaria challenge (Table 6-1). Increasing antibody titre was associated with reductions in relative risk (RR) of infection following malaria challenge corresponding to an efficacy of 65% (95%CI: 41-80%) for each 10-fold rise in antibody titre for the first definition of protection, and an efficacy of 91% (95%CI 71-97%) for the 159
180 second definition. Increasing CD4 cell responses were associated with more modest reductions in risk, corresponding to efficacies of 13% (95%CI 3-21%) and 11% (95%CI %) for each 10-fold rise in cellular responses, but were of marginal statistical significance. There was no significant difference between the models with and without an interaction term; LR χ 2 test= 2.09; P value=0.15 and LR χ 2 test= 0.34; P value=0.56 for the first and second definition, respectively. Terms for the interaction between antibody titre and CD4 cell count gave relative risk estimates of 0.46 (CI ) and 1.54 (CI ) for the first and second definitions of protection, respectively. These relative risks suggest non-significant tendencies towards synergistic and antagonistic interactions, respectively; assessments that are limited by a modest sample size to examine interactions. Table 6-1 : Multiple regression analysis for the first and second definition of protection First definition of protection* Covariates Adjusted RR 95% CI P value Antibody 0.35 ( ) < titres CD4 cell responses 0.87 ( ) Second definition of protection Antibody 0.09 ( ) < titres CD4 cell responses 0.89 ( ) * Protection defined as full protection from infection after malaria challenge Protection defined as full protection plus delayed time to infection RR: Relative risk 160
181 6.4 Discussion In adults, the findings from further analyses of data published by Kester et al [131] suggest that anti-cs protein antibody titres are strongly associated with vaccine efficacy, and suggest that CD4 cell responses are less strongly associated with protection. Despite the lack of evidence for interactions in these data, there is evidence for synergy between antibody and cellular responses in mouse challenge models [288], and interactions between antibody and cellular responses in humans need to be examined further with larger sample sizes from field studies. 161
182 7 Correlates of protection: T cell immune responses in children 7.1 Introduction Having quantified the relative importance of cell mediated immune responses in adults vaccinated with RTS,S/AS01E, I now describe the T cell immune responses in the 447 children aged 5-17 month old who were vaccinated with RTS,S/AS01E and assess if these responses predicted protection from clinical malaria. The blood volumes sampled in children prevented us from using an ICS assay previously reported in adult studies [131], but a whole blood ICS assay requiring smaller blood volumes has been developed and used in two phase II trials in Ghana [289] and Gabon [290]. These studies showed that the vaccine induced CD4+ IL2, TNFα or IFNγ producing cells, but CD40L was not detectable using the whole blood assay for children in Sub-Saharan Africa. Therefore CD40L staining was not included in this study. The assays were conducted partly in Kilifi, Kenya and at GSK Biologicals laboratory in Belgium. The qualification of correlates of immunity and surrogates of protection has been recently reviewed [291,292]. One of the proposed methods of identifying a surrogate marker of protection is application of the Prentice criteria which I used to assess if anti-cs protein titres and T cell immune responses were surrogates of protection[293]. The Prentice criteria require that: a) vaccination predicts protection; b) vaccination predicts the potential surrogate; c) the surrogate predicts protection among vaccinees and d) that the 162
183 surrogate accounts for all the effect of vaccination. If vaccination is an independent predictor of outcome after including the potential surrogate in the analysis, this suggests that other mechanisms are involved. On the other hand, if including the potential surrogate in analysis removes vaccination as a predictor, this is consistent with the effect of vaccination being mediated by the surrogate marker. 7.2 Methods The details of the study design and blood sample collection are described in chapter 4. Briefly this was a randomized controlled trial to evaluate the efficacy and safety of RTS,S/AS01E against clinical malaria episodes due to P. falciparum infection in Kilifi, Kenya and Korogwe, Tanzania. The primary end point was clinical malaria, defined as the presence of fever (axillary temperature 37.5 C) and P. falciparum parasitaemia of more than 2500/µL. Active and passive surveillance for malaria was conducted by field workers and study personnel at local dispensaries. There were 894 children between the two sites, of which the 447 children enrolled in Kilifi were assessed for vaccine induced cellular immunity using ICS and ELISPOT. Blood was taken for immunological studies before vaccination, one month post dose 3, then on March 2008 irrespective of the time of recruitment (i.e. between 4 and 10 months post dose 3, mean 8 months), 12 months post dose 3 and in October 2008 irrespective of time of recruitment, (i.e. between 12 and 18 months post dose 3, mean 15 months). Peak malaria transmission was between May and August
184 CS protein antibody measurement and peptide used Antibodies to the P. falciparum CS protein protein (CS) tandem repeat epitope were assessed by ELISA at the Center for Vaccinology, Ghent University Hospital in Belgium as described in Results were reported in EU/mL. Laboratory immunological methods including ELISPOT and whole intracellular staining assays are explained in appendix A Statistical analysis All T cell responses were log transformed before analysis. I calculated geometric mean responses and used Student s T test on log-transformed values to compare between vaccination groups. I used a paired T test on log-transformed values to compare timecourses and used Pearson s product moment calculation on log-transformed values to examine the correlations between assays. I used Cox regression to assess the association between cellular responses and first or only clinical malaria (axillary temperature 37.5 C with P. falciparum density of more than 2500/µL). The adjustments were made for age at first vaccination, village, distance to the health facility, bed net use and anti-cs protein (CS) antibody levels by dichotomizing concurrent anti-cs protein titres at 40 EU/mL. Cellular responses were analyzed as time-varying covariates, applying the result from the time of the most recent clinic visit. I applied a Bonferroni correction for all the independently significant explanatory variables to adjust for the multiple comparisons. Responses were log 164
185 transformed to produce normal distributions before inclusion in the Cox regression models. Analysis was conducted on the According To Protocol vaccinees. STATA version 10 was used. 7.3 Results Blood samples were processed from 407 children. Data were acquired from 1,066 ICS assays (from three different clinic visits), 660 cultured ELISPOTs (from four different clinic visits), 780 ex vivo ELISPOTs for IFNγ (from three clinic visits) and 453 ex vivo ELISPOTs for IL2 production (from 3 clinic visits). 56 (8%), 12 (2%) and 21 (5%) assays failed quality control criteria for positive and negative controls for cultured, and ex vivo IFNγ and ex vivo IL2 ELISPOTs, respectively. For ICS assay, the results from the positive control were at least 100 cells per million above the negative control for 1045 (98.0%), 1057 (99.1%) and 1055 (99.0%) for IFNγ, IL2 and TNFα, respectively. The geometric mean responses to the negative control were 75, 165 and 159 cells per million for IFNγ, IL2 and TNFα ICS results respectively, and average responses to positive control were 3,768, 18,895 and 3,454 cells per million. The mean responses to CS antigen vary by time point and by vaccination group, but the ranges were 11 to 25, 10 to 681 and 8 to 426 for IFNγ, IL2 and TNFα, respectively. There was no variation in responses to control by time point (p=0.15, p=0.15, p=0.6) or by vaccination group at the first time point post vaccination (p=0.4, p=0.36 and p=0.39) for IFN-γ, IL-2 and TNF-α respectively. An example of the flow cytometry analysis is shown in Figure 7:1. 165

, 166")
186 Figure 7:1: An example plot of FACS data acquired following intra-cellular cytokine staining is shown for negative control (medium only), positive control (i.e. staphylococcal enterotoxin B, SEB) and CS peptides Vaccine induced anti-cs protein T cell responses: ICS assays CD4+ and CD8+ anti-cs protein T cell responses were detected in both vaccination groups using ICS. There were no significant differences between the groups prevaccination. Vaccination with RTS,S/AS01E induced CD4+ but no CD8+ anti-cs protein T cell responses. The strongest responses were seen for IL2 producing CD4 T cells at one-month post vaccination (a mean of 681 cells per million, 95%CI ), 166
 Table 7-1 and Figure 7:2. These levels corresponded to 3.2 fold, 2.3 fold and 1.")

187 followed by TNF-α (426 cells per million, 95%CI ), and weak IFN-γ responses (25 cells per million, 95%CI 18-34) Table 7-1 and Figure 7:2. These levels corresponded to 3.2 fold, 2.3 fold and 1.9 fold increases for IL2, TNF-α and IFN-γ, respectively. Figure 7:2: The time course of anti-cs protein CD4+ ICS responses and summed ELISPOT responses is shown per time point for RTS,S/AS01E and control vaccination groups. 167
188 Table 7-1: Geometric means of ICS assays by clinic visit and by vaccination group. Visit Rabies RTS,S/AS01E Mean (95%CI) N Mean (95%CI) N p ICS: CD4+ve cells: IFNg Screen 11(8-14) (9-16) Vac + 1 mth 13(10-18) (18-34) * Vac + 12 mths 11(7-15) (14-29) ** ICS: CD4+ve cells: IL2 Screen 103(84-127) (76-117) Vac + 1 mth 212( ) ( ) 170 2x10-13** Vac + 12 mths 10(7-14) (73-142) 168 9x10-19** ICS: CD4+ve cells: TNFa Screen 86(69-108) (64-102) Vac + 1 mth 182( ) ( ) 170 1x10-08** Vac + 12 mths 8(6-11) (34-68) 168 6x10-12** ICS: CD8+ve cells: IFNg Screen 12(9-17) 178 7(5-10) # Vac + 1 mth 19(12-28) (12-28) Vac + 12 mths 10(6-15) (7-17) ICS: CD8+ve cells: IL2 Screen 156( ) ( ) Vac + 1 mth 200( ) ( ) Vac + 12 mths 9(6-13) (13-32) ** ICS: CD8+ve cells: TNFa Screen 49(36-68) (43-81) Vac + 1 mth 133( ) ( ) Vac + 12 mths 15(10-24) (10-25) * for p<0.05 or ** for p<0.005 where Mean for Rabies group < Mean for RTS,S/AS01E group. # for p<0.05 or ## for p<0.005 where Mean for Rabies group > Mean for RTS,S/AS01E group. 168
189 ELISPOT assays Three different peptide pools namely; a) the conserved region including the NANP repeats, b) the variant TH2R region and c) the variant TH3R region and conserved CS.T3T region were used for the ELISPOT assays, allowing a more detailed analysis of immunogenicity. Cultured ELISPOT results were higher among RTS,S/AS01E vaccinees than among rabies vaccinees at 1 month and 6.5 months post vaccination, but not at 12 months (Table 7-2). IFNγ ex vivo ELISPOT results did not vary by vaccination group at any time point. IL2 ex vivo ELISPOT responses were significantly higher in RTS,S/AS01E vaccinees at 1 month post vaccination, but not at 6.5 months (Table 7-3) compared with rabies vaccinees. For both the cultured IFNγ ELISPOT and ex vivo IL2 ELISPOT, the vaccine induced cellular responses were limited to two peptide pools (i.e. TH2R and TH3R/CS.T3T pools) Table 7-2. No responses were detected to the third peptide pool (NANP and conserved region peptides; Figure 7:3). 169

190 Figure 7:3: ELISPOT responses are shown for the individual stimulating peptide pools at 1 month post vaccination with RTS,S/AS01E. 170
191 Table 7-2: Geometric means of cultured ELISPOT assays by clinic visit and by vaccination group. Visit Rabies RTS,S/AS01E Mean (95%CI) N Mean (95%CI) N p IFNg cultured ELISPOT: NANP and conserved region Screen 27(21-35) 72 33(26-43) Vac + 1 mth 32(27-38) 86 28(24-32) Vac mths 29(25-35) 82 26(22-30) Vac + 12 mths 31(23-42) 55 27(21-36) IFNg cultured ELISPOT: TH2R region Screen 33 (26-43) (28-48) Vac + 1 mth 34(25-47) 86 66(50-88) 109 3x10⁻⁴** Vac mths 30(22-41) 83 60(47-78) 122 2x10⁻⁴** Vac + 12 mths 26(20-34) 55 39(30-51) * IFNg cultured ELISPOT: TH3R/ CS.T3T region Screen 31 (23-41) (28-48) Vac + 1 mth 30(23-40) 86 55(43-70) 109 3x10⁻⁴** Vac mths 32(23-44) 83 58(45-76) ** Vac + 12 mths 33(24-46) 55 36(26-48) IFNg cultured ELISPOT: All CS peptides summed Screen 75 (58-97) (69-117) Vac + 1 mth 88(66-117) ( ) ** Vac mths 81(59-110) ( ) ** Vac + 12 mths 83(59-115) (76-141) * for p<0.05 or ** for p<0.005 where Mean for Rabies group < Mean for RTS,S/AS01E group. # for p<0.05 or ## for p<0.005 where Mean for Rabies group > Mean for RTS,S/AS01E group. 171
192 Table 7-3: Geometric means of ex vivo ELISPOT assays by clinic visit and by vaccination group. Visit Rabies RTS,S/AS01E Mean (95%CI) N Mean (95%CI) N p IFNg ex vivo ELISPOT: NANP and conserved region Screen 15(13-17) (12-16) Vac + 1 mth 15(13-18) (13-19) Vac mths 13(12-14) (11-13) IFNg ex vivo ELISPOT: TH2R region Screen 15(13-17) (12-16) Vac + 1 mth 16(13-19) (15-22) Vac mths 14(13-16) (13-17) IFNg ex vivo ELISPOT: TH3R/ CS.T3T region Screen 18(15-20) (15-20) Vac + 1 mth 19(15-23) (17-25) Vac mths 13(11-15) (13-17) IFNg ex vivo ELISPOT: All CS peptides summed Screen 40(35-46) (34-45) Vac + 1 mth 44(36-54) (40-59) Vac mths 35(31-40) (31-40) IL2 ex vivo ELISPOT: NANP and conserved region Screen 15(13-18) (12-18) Vac + 1 mth 12(10-14) 62 14(12-17) Vac mths 15(12-20) 76 15(11-21) IL2 ex vivo ELISPOT: TH2R region Screen 16(13-19) (13-20) Vac + 1 mth 13(10-17) 62 21(16-28) ** Vac mths 18(14-23) 76 17(13-22) IL2 ex vivo ELISPOT: TH3R/ CS.T3T region Screen 17(15-21) (14-21) Vac + 1 mth 15(12-19) 62 24(19-31) ** Vac mths 18(13-24) 76 29(20-41) * IL2 ex vivo ELISPOT: All peptides summed Screen 44(37-53) (34-51) Vac + 1 mth 35(27-45) 62 56(44-73) ** Vac mths 45(34-60) 76 53(39-72) * for p<0.05 or ** for p<0.005 where Mean for Rabies group < Mean for RTS,S/AS01E group. # for p<0.05 or ## for p<0.005 where Mean for Rabies group > Mean for RTS,S/AS01E group. 172
193 Time course of responses (ICS assays) The frequencies of IL2, TNFα and IFNγ producing CD4+ T cells by ICS was significantly higher at one month after the final vaccination with RTS,S/AS01E compared with pre-vaccination levels (p<0.0001, p<0.0001, p=0.0006, respectively). There was then a fall in responses between 1 month and 12 months post vaccination, falling to pre-vaccination levels for IL2 (p<0.0001) and TNFα (p<0.0001). IFNγ producing CD4+ T cells remained above pre-vaccination levels, albeit at low frequency throughout. However, there was an even more pronounced fall in CD4+ T cell responses among control vaccinees (Table 7-1), and so RTS,S/AS01E vaccinees had substantially higher T cell responses than control vaccinees at 12 months post vaccination (p< for TNFα and IL2, p=0.009 for IFNγ) Inter assay correlations There were strong correlations between the different cytokines detected by ICS, and also between IL2/IFNγ ELISPOT results one month after vaccination with RTS,S/AS01E (Table 7-4). Cultured ELISPOTs were significantly associated with ICS results, but not with ex vivo ELISPOT results (IFNγ or IL2). Antibody titres were associated with all the cellular assays except ex vivo IFNγ ELISPOTs (Table 7-4). 173
194 Table 7-4: Inter-assay Correlation coefficients of CMI assays at 1 month post vaccination with RTS,S/AS01E. CD4+ IFNγ CD4+ IL2 CD4+ TNFα Antibody (CS) Cultured IFNγ IFNγ ELISPOT IL2 ELISPOT CD4+ IFNγ 1 CD4+ IL2 0.38*** 1 CD4+ TNFα 0.32*** 0.66*** 1 Antibody (CS) 0.14*** 0.35*** 0.26*** 1 Cultured IFNγ 0.14** 0.15** 0.18*** 0.22*** 1 IFNγ ELISPOT IL2 ELISPOT * 0.11* *** 1 *=p<0.05, **=p<0.001, ***=p< Correlates of immunity After vaccination with RTS,S/AS01E, an increasing frequency of TNFα producing, CSspecific CD4+ cells detected using ICS was associated with a reduced risk of clinical malaria (HR=0.64 for each 10 fold increase in the frequency of CD4+ TNFα+ T cells, 95%CI , p=0.002). On ICS, IFNγ production by CS-specific CD4+ T cells was associated with a weak evidence for reduced risk of clinical malaria (p=0.07) ( Table 7-5). TNFα and IFNγ producing CS-specific CD4+ T cells were at much lower frequencies among control vaccinees, but nevertheless were associated with reduced risks of clinical malaria of borderline significance. When data from both RTS,S/AS01E vaccinees and control vaccinees were combined (with adjusting for vaccination group), the overall hazard ratios were 0.74 (95%CI , p=0.001) and 0.79 (95%CI , p=0.007) for TNFα and IFNγ, respectively. On Bonferroni adjustment, these p 174
195 values were and 0.13, respectively. Similar results were observed when adjusting for anti-cs protein antibody titres as a continuous variable (HR=0.75, 95%CI , p=0.003 with p=0.054 after Bonferroni adjustment, and HR=0.81, 95%CI , p=0.01 with p=0.13 after Bonferroni adjustment for TNFα CD4+ T cells and IFNγ CD4+ T cells, respectively). In order to display the effect graphically, the cellular responses were split by tertile (Figure 7:4). The middle tertiles for TNFα are at intermediate risk, suggesting a continuous change in risk as the frequency of TNFα cells increases rather than a threshold effect. When the frequencies of TNFα producing CD4+ T cells and IFNγ producing CD4+ T cells were combined in the same model, TNFα CD4+ T cell frequency was an independent factor (i.e. HR=0.76, 95%CI , p=0.001 compared with HR=0.84, 95%CI , p=0.050 for the frequency of IFNγ producing CD4+ T cells). An interaction term generated by multiplying the frequency of TNFα CD4+ T cells by antibody concentrations was not significant in determining risk (HR=0.79, 95%CI , p=0.29). On applying the fourth of the Prentice criteria, we found that vaccination group was still an independent predictor of clinical malaria risk in a multivariable model including CD4+ TNFα+ cells (HR=0.69, 95%CI , p=0.036). In other words, only 42% of the effect of vaccination could be accounted for by CD4+ TNFα+ cells. However, when anti- CS protein titres were added to the model the effect of vaccine became non-significant 175
196 (HR=0.93, 95%CI , p=0.76, i.e. 87% of the effect of vaccination was accounted for). Hence, while neither CD4+ TNFα+ cells nor anti- CS protein antibodies alone accounted for all of the effect of vaccination with RTS,S/AS01E on clinical malaria risk, the combination of CD4+ TNFα+ T cells and anti-cs protein antibodies together could account for all of the statistical effect of vaccination. Table 7-5: The hazard ratio from Cox regression models (with 95% CI) for the outcome clinical malaria by CMI assays. Both datasets Rabies Vaccinees RTS,S/AS01E Vaccinees Assay HR (95%CI) p HR (95%CI) p HR (95%CI) p ICS: CD4 cells IFN-γ 0.79( ) ( ) ( ) 0.07 IL2 0.9( ) ( ) ( ) 0.13 TNF-α 0.74( ) ( ) ( ) ICS: CD8 cells IFN-γ 1.07( ) ( ) ( ) 0.65 IL2 0.85( ) ( ) ( ) 0.19 TNF-α 0.87( ) ( ) ( ) 0.66 IFNγ cultured ELISPOT NANP 1.01( ) ( ) ( ) 0.87 TH2R 0.76( ) ( ) ( ) 0.33 TH3R 0.94( ) ( ) ( ) 0.54 Sum 0.95( ) ( ) ( ) 0.73 IFN-γ ex vivo ELISPOT NANP 1.61( ) ( ) ( ) 0.44 TH2R 1( ) 1 0.9( ) ( ) 0.81 TH3R 1.62( ) ( ) ( ) 0.29 Sum 1.35( ) ( ) ( ) 0.57 IL2 ex vivo ELISPOT NANP 1.18( ) ( ) ( ) 0.57 TH2R 0.57( ) ( ) ( ) 0.76 TH3R 0.94( ) ( ) ( ) 0.94 Sum 0.83( ) ( ) ( ) 0.69 HR= Hazard Ratio for each log (i.e. ten-fold) increase in frequency of T cells. Confidence intervals are 5-95%. HRs are adjusted by anti-cs antibody titre (in 2 groups), age, area of residence, ITN use and distance from the dispensary. NANP=NANP and conserved region peptides pool, TH2R=TH2R region peptides pool, TH3R=TH3R and CS.T3T region peptide pool, Sum= all three peptide pools summed. 176
197 Figure 7:4 Survival plots with time to first episode of clinical malaria plotted for RTS,S/AS01E (left columns) and control vaccinees (left and right columns) according to tertile of CD4+, TNF-α responses (top row), CD4+ IFNγ responses (middle row) and IFN-γ ex vivo ELISPOT responses to TH3R/CS.T3T peptides pool (lower row) Where more than one third of responses were at the lower limit of detection, the lower two tertiles are combined (and hence only 2 tertiles are displayed on some plots). For CD4+ TNF-α+ responses, the tertiles were 1 to 154 (lower), 155 to 407 (middle) and 408 to 28,840 (upper) cells per million for RTS,S/AS01E vaccinees, and 1 to 26 (lower), 27 to 165 (middle) and 166 to 10,000 (upper) cells per million for control vaccinees. For CD+ IFN-γ+ responses the tertiles were 1 to 12 (lower), 13 to 66 (middle) and 67 to 8,320 (upper) cells per million for RTS,S/AS01E vaccinees, and 1 to 40 (lower) and 41 to 5,980 (upper) cells per million for rabies vaccinees. The time point 0 months refers to the time of a blood draw. Cellular responses were analyzed as time-varying covariates, where the effect of cellular responses from all available blood draws was related to clinical malaria episodes during the period of monitoring after each measurement. Therefore, each RTS,S vaccinee could contribute to 2 periods of monitoring. These three assays were selected for the figure because significant associations on Cox regression were seen 177
198 7.4 Discussion I have shown that RTS,S/AS01E vaccination induced significant CS protein specific T cell responses in 5-17 month-old children living in a malaria endemic area. The frequency of CD4+ TNF-α+ T cells on ICS was associated with protection from clinical malaria. The strength of association between TNF-α producing CD4+ T cells and protection was lower (HR=0.7) than that between anti-cs protein antibody titres and protection (HR=0.5) confirming the results in adults which demonstrated anti-cs protein antibody titres to be a stronger predictor of protection than T cell responses. Although the use of 15-mer peptides may have been sub-optimal to demonstrate CD8+ T cell responses, I identified both CD4+ and CD8+ responses above negative control conditions for both RTS,S/AS01E and control vaccinees. However, the CD8+ responses were apparently not induced by vaccination, and presumably were the result of exposure to malaria parasites [294]. If TNF-α producing CD4+ T cells are causally related to protection, they should be associated with protection whether they are acquired by vaccination or by natural exposure to malaria parasites. Indeed, there was weak evidence for a correlation between TNF-α CD4+ T cells and a reduced risk of clinical malaria among control vaccinees. However, the overall level of protection afforded by T cells among RTS,S/AS01E vaccinees was greater, since the vaccinated children had 2-3 fold more TNF-α CD4+ T cells at 1 month and 8-10 fold more at 12 months post vaccination. The frequency of TNF-α CD4+ T cells at 12 months post vaccination was below screening (i.e. prevaccination) levels, despite the fact that clinical protection was sustained at 15 months 178
199 [295]. Since clinical protection is determined by contemporaneous comparison with control vaccinees, it is therefore theoretically possible that the relative difference between RTS,S/AS01E vaccinees and control vaccines is relevant despite this fall. T cell responses to CSP rose between screening and 1 month post-vaccination, and then fell to lower levels at 12 months post vaccination. This was seen in both ELISPOT and ICS studies, and could not be explained by greater background responses (which did not change over time and were subtracted from antigen-specific responses), or by nonspecific responses detected in changing positive controls over time. The temporary increase in CSP specific T cell responses parallels the increase and decrease in antibodies to blood stage antigens seen in the same children [256]. Antibody responses made by young children to blood stage antigens are often short-lived [296], and may reflect shortterm changes in exposure [297]. I therefore concluded that T cell responses rise as a result of increase in malaria exposure during transmission season. However this rise is short-lived and levels decline once the malaria exposure falls. I did not identify an association between protection and T cell responses detected by the cultured IFN-γ assay, as previously reported [178]. However, we tested pools of peptides rather than individual peptides, and the previously reported association was specific to the CS.T3T peptide. The CS.T3T peptide was contained in a pool of TH3R/CS.T3T peptides. In other studies, the CS.T3T peptide accounted for more than half of the overall response seen in the TH3R/CS.T3T peptide pool [298]. Furthermore, very little IFN-γ production was identified in this study. Previous studies showing marked IFN-γ production were done in adults [155], and IFN-γ production may be suppressed in children in malaria endemic areas [299]. 179
200 Ex vivo ELISPOT studies did not correlate with ICS studies for the same cytokines, even though both use overnight stimulations, and ICS results were 10-fold higher than ELISPOT results. This may be partially explained by measuring ELISPOT assays per million PBMC, whereas ICS is measured per million CD4+ T cells. However, ex vivo and cultured ELISPOTs identify different cell populations, the latter more closely reflecting a central memory phenotype [300,301,302]. Hence it is possible that ICS and cultured ELISPOT identify central memory cells, but ex vivo ELISPOTs identify effector phenotypes. ELISPOT assays failing internal control standards were excluded, but similar control standards were not pre-defined for ICS data. However, this applied to a minority of assays (2% and 5%, respectively for ex vivo IFN-γ and IL2 ELISPOTS) which did not correlate with ICS data, and 8% for cultured ELISPOTS, which did correlate. Hence it seems unlikely that lack of quality control standards for ICS explained the lack of correlation. The CD4+ T cell response associated with protection in my analysis (i.e. TNF-α production) was at a low frequency (mean 426 cells per million CD4 cells at peak). Higher frequency responses have been required to achieve protection in sporozoite challenge studies [131]. However, the antibody concentrations associated with protection are also higher in sporozoite challenge studies [131,295,303]. These differences in outcome may be explained by the greater sporozoite inoculum used in challenge studies compared with exposure in the field [235]. The IFN-γ response that was apparently associated with protection in this study was very low and barely above the limit of detection (25 cells per million), and the apparent association is likely to reflect the association between IFN-γ and TNF-α rather than an independent effect. 180
201 Multiple comparisons (i.e. 18) have been undertaken to identify the association between TNF-α producing CD4+ T cells and protection from clinical malaria. However, the association was highly significant (p=0.001) and remains significant after the statistically conservative Bonferroni correction (p=0.018) Surrogates of protection The Prentice criteria have been proposed as a way of qualifying surrogate endpoints [304,305] and include four criteria [293]. I found that the combination of anti-cs protein titres and TNF-α producing CD4+ T cells met all the criteria (i.e. vaccination was associated with protection; anti-cs protein titres and CD4+ TNF-α+ T cells were both independently associated with vaccination; were both independently associated with protection; and the combination of anti-cs protein titres and CD4+ TNF-α+ T cells, but not either alone, could account for the effect of vaccination in multi-variable Cox regression analysis). I found no significant interaction between anti-cs protein titres and TNFα+ T cells. Micro-heterogeneity of malaria exposure has been observed in Kilifi [257], and may confound the association between antibodies to blood stage malaria antigens and the risk of malaria [256]. However, this is unlikely to explain the association between CD4+ TNFα+ T cells and protection from clinical malaria for two reasons: The direction of confounding was in the opposite direction in this cohort (i.e. micro-heterogeneity led to a strengthening of the association between increasing antibody levels and increasing risk of 181
202 malaria rather than protection), and the association with protection is more marked in RTS,S/AS01E vaccinees rather than control vaccinees. There is strong evidence that anti-cs protein antibodies inhibit sporozoite invasion [159], supporting a causal relationship and TNF-α may reduce the parasite s intrahepatocytic development [306,307]. However, it is possible that the frequency of CD4+ TNF-α producing T cells is associated with another causal mediator of immunity (for instance better quality antibody responses, enhanced T cell memory or polyfunctionality). These further characterizations of the immune response should now be a priority, since establishing an immunological surrogate endpoint will accelerate the development of candidate malaria vaccines, inform monitoring the persistence of immune responses and inform the timing of a booster dose. 7.5 Conclusion In conclusion RTS,S/A01E vaccination in young children induced significantly higher levels of CD4+ T cell responses but no CD8 T cell responses. The TNF-α producing CD4+ T cells response were independently associated with protection from clinical malaria. The combination of TNF-α producing CD4+ T cells and anti-cs protein antibody levels accounted for the protection conferred by the RTS,S/AS01E vaccination. Anti-CS protein antibody titres are a stronger predictor of protection than TNF-α CD4+ T cell response and which is in agreement with the studies in malaria naive adults. 182
203 8 Anti-CS protein antibody avidity and protection 8.1 Introduction RTS,S/AS01E is highly immunogenic [123,131,132,308], inducing both high titres of CS protein specific antibodies and CD4 T cell responses. There is evidence that anti-cs protein antibody titres correlate with protection against infection in experimental malaria challenge studies in malaria naïve adults, [131,181] and natural malaria infection in adults and children in malaria endemic regions [124,156]. In chapter 5, I demonstrated a non-linear association between anti-cs protein titres and protection from clinical malaria in children 5-17 months residing in malaria endemic country [295]. Recent studies in infants 6-10 weeks of age have also shown correlation between anti- CS protein titres and protection from clinical malaria [309]. In contrast no such association was present in older children in Mozambique [129]. In chapter 7, I described the induction of CS protein-specific CD4 T cell responses by RTS,S/AS01E in young children in Kilifi, Kenya and showed that these responses correlate with protection from clinical malaria. However, substantial variability in protection remains unexplained even after accounting for anti- CS antibodies and CD4 T cell responses (i.e. one frequently observes unprotected children with high titre antibodies and strong CD4 T cell responses). In addition to antibody levels and cellular immune responses avidity could also play an important role in mediating protection conferred by RTS,S/AS01E. However, no study has reported the role of avidity in RTS,S/AS01E-induced protection in the field. I 183
204 therefore undertook the analysis to assess the RTS,S/AS01E-induced anti-cs protein antibody avidity in children 5-17 month residing in Kilifi, Kenya who were immunized with RTS,S/AS01E. 8.2 Materials and Methodology Vaccine and subjects Serum samples were obtained as described in chapter 4. Briefly the serum samples were collected at screening, 1 month, March 2008 (range 4 10 months) and at 12 months post dose 3 for the assessment of antibodies to P. falciparum CS protein repeat region (anti- CS protein antibodies) Study design I conducted a nested case-control study to investigate the association between vaccineinduced anti-cs protein antibody avidity and protection from clinical malaria. Cases were defined as children who had at least one episode of clinical malaria (axillary temperature 37.5 C and P falciparum parasitaemia >2500/µL) during the 15 months of follow-up beginning 2 weeks after the 3 rd dose of vaccine while controls were children who did not suffer from clinical malaria during this period. 184
205 Malaria exposure was measured as the weighted local prevalence of malaria cases within a 1 km radius of each index child, or exposure index, as previously described in chapter 3[271]. Malaria exposure was considered high if the exposure index was above the cohort mean and low if the exposure index was below the cohort mean. I selected 19 cases and 19 controls among RTS,S/AS01E vaccinees frequency matched for similar peak anti-cs protein levels. I also studied avidity in a further 19 children with low anti-cs protein antibody levels, who appeared to be protected despite having a relatively high malaria exposure, in order to determine whether high avidity was the explanation for protection despite low anti-cs protein levels. All selected cases and controls had their samples assessed for the anti-cs protein avidity at three time points i.e. 1 month, March 2008 (range 4 10 months) and at 12 months post dose three. Screening samples were not analyzed because anti-cs protein titres were undetectable before vaccination IgG antibody concentrations Anti-CS protein antibody concentrations were determined by standard enzyme-linked immunosorbent assay (ELISA) developed by GSK Biologicals A cut-off point for positive titres was 0.5 EU/mL. 185
206 8.2.4 TNF-α CD4 T cell immune responses Whole blood intracellular staining assay was used to determine the frequency of CD4 T cells producing TNF-α as previous described in [310]. Stimulation of blood was done within 3 hours after blood withdrawal and samples were stored 3 to 4 months before staining Anti-CS protein avidity assay I used a single concentration ammonium thiocyanate (NH 4 SCN) elution ELISA to determine the avidity of the polyclonal anti-cs protein antibodies (defined as the antigen binding capacity resulting from the addition of all epitope-specific affinities of CSspecific IgG antibodies). Polystyrene microtiter plates were coated overnight at 4 C with R32LR (3.2mg/ml) protein diluted to 2.5µg/ml in coating buffer. Following washing, the plates were blocked with 200µl PBS-5% skim milk per well for 1 hour at 25 C in a horizontal orbital shaker (Skatron 300). I conducted 8-fold serial dilutions in duplicate. A pre-dilution at 1:100 was done for all serum samples with anti-cs protein titer above 200 EU/mL before the beginning of serial dilutions. Serum samples with anti-cs protein titer below 200 EU/mL were not prediluted. Standard (serum from malaria naïve adult vaccinated with R32LR attributed an arbitrary value of 109EU/mL kindly provided by GSK Biologicals), negative control (i.e. anti-cs protein negative serum from malaria naïve adult kindly provided by GSK 186
207 Biologicals) and positive control (i.e. a pool of anti-cs protein human sera approximately at 100 EU/ml that demonstrated an avidity index (AI) of 43.1±3.8, kindly provided by GSK Biologicals) and were added in each plate and serially diluted like samples. The plates were then incubated for 2 hour at 37 C. Each serum sample was processed in two different plates; one treated with NH 4 SCN, and one untreated plate. Both plates were washed twice with PBS in 0.05% tween. A 1M solution of NH 4 SCN in laboratory grade water was added in the treatment plate while PBS in 0.05% Tween was added in the control plate and both were incubated for 30 min at 25 C. After a third wash, anti-human IgG conjugated to HRP was added and incubated for 30 min at 25 C before washing. After 30 min incubation with chromogen substrate 3, 3',5,5' tetramethylbenzidine (TMB) and Hydrogen peroxide (H 2 O 2 ) at 25 C (yielding a blue colour), the reaction was stopped with 50µl of 1N sulphuric acid changing the colour to yellow. The intensity of the colour was proportional to the titer of the anti-cs protein IgG antibodies contained in the sample. Absorbance at 450 nm was read by use of an automatic microtiter plate reader. Samples OD s were converted into EU/ml using a standard curve at the linear portion of the curve and mean values used to estimate avidity index. Linearity of the assay was demonstrated by the observation that for a high concentration sample, serially diluted sample was able to reproduce the same AI over the entire anti-cs antibodies analytical range. The Avidity Index (AI) is the ratio of the quantity of anti-cs protein antibodies (in EU/ml) that remained bound to the coated antigen after treatment with NH 4 SCN divided by the quantity of antibodies (in EU/ml) that remained bound to the coated antigen in the control plate. 187
208 8.2.6 Statistical analysis Anti-CS protein avidity measures were not transformed in the analysis. The anti-cs protein titres and avidity indices were presented for each group as arithmetic mean± 95% confidence interval per group. Student T-test was used to compare the avidity indices and antibody titres between groups. A one-way analysis of variance (ANOVA) was used to test for the difference in antibody avidity during follow up (1 month, ~8 and 12 months post dose three). I used unconditional logistic regression analysis to estimate odds ratios (ORs) and 95% Confidence intervals adjusting for TNFα-producing CD4 T cells, bed net usage and malaria exposure (high or low) clustering on multiple entries per child. All analyses were done in Stata (version 12; Stata Corp). 8.3 Results A total of 183 sera (61 sera obtained 1 month post dose 3, 61 sera obtained on March 2008 (~8 months post dose 3) and 61 sera obtained 12 month post dose 3) from 61 study participants (age range, 5 to 17months) were available for the analysis. Anti-CS protein titres declined over time in all groups but remained significantly higher compared to the pre-vaccination levels (Figure 8:1). 188
209 Figure 8:1: Anti-CS protein titres in cases and controls during 15 months of follow-up Anti-CS protein avidity The arithmetic mean avidity index (AI) of polyclonal anti-cs protein antibodies at 1 month, ~8 months and 12 months post dose 3 was 45.2 (95%CI: 42.4 to 48.1), 45.3 (95%CI: 41.4 to 49.1) and 46.2 (95%CI; 43.2 to 49.3), respectively. The AI did not differ between the three time points (F test=0.12 p=0.9 by ANOVA test). 189

210 I observed correlations between the AI at 1 month post-dose 3 and at ~8 months postdose 3 (r=0.33, p=0.0111), as well as AI at 1 month and 12 months post-dose 3 (r=0.48, p= ) (Figure 8:2). There was no correlation between AI and anti-cs protein titres at all three-time points (r=-0.03; p= 0.859, r=0.05; p= and r= 0.16; p=0.220 respectively) or between AI and age at vaccination (r=0.003, p=0.656) (Figure 8:3). Figure 8:2: Matrix diagram showing correlation between antibody avidity measured at three time points during the follow up 190
 versus 44.6 (95%CI: 38.6 to 50.6) p= 0.503, 48.")
, 45.2 (95%CI: 37.5 to 52.9) and 46.3 (95%CI: 40.1 to 52.")
211 Figure 8:3: Panel A: correlation between anti-cs protein antibody avidity at 1 month post dose 3 and age; Panel B: correlation between anti-cs protein antibody avidity and anti-cs protein antibody titres at 1 month post dose Avidity and protection from clinical malaria The AI in cases and controls was 47.1 (95%CI: 42.8 to 51.4) versus 44.6 (95%CI: 38.6 to 50.6) p= 0.503, 48.4 (95%CI: 43.8 to 52.9) versus 42.2 (95%CI: 33.9 to 50.4) p= and 48 (95%CI: 43 to 53) versus 44.7 (95%CI: 39.2 to 50.1) p= at 1, ~8 and 12 months post dose three, respectively. In 19 protected children with relatively high malaria exposure and low anti-cs protein titres, the avidity was 44.4 (95%CI: 39.4 to 49.4), 45.2 (95%CI: 37.5 to 52.9) and 46.3 (95%CI: 40.1 to 52.4) at 1, 8 and 12 months respectively. The avidity at all time points were not different from those recorded in cases and controls (F test=2.69, p= by ANOVA) (Figure 8:4). 191
Malaria parasite vaccine development Strategies & Targets
 Malaria parasite vaccine development Strategies & Targets Tulane University Ahmed Aly Most malaria disease deaths are among children and pregnant women A child or a pregnant woman dies of malaria nearly
Development of a Malaria Vaccine for Sub-Saharan African Children December 3, 2009 Lode Schuerman
 Development of a Malaria Vaccine for Sub-Saharan African Children December 3, 2009 Lode Schuerman Copyright John-Michael Maas, Darby Communications Agenda Malaria Disease burden Prevention and vaccine
Ad35.CS.01 RTS,S/AS01 prime boost second generation malaria vaccine candidate
 Ad35.CS.01 /AS01 prime boost second generation malaria vaccine candidate Johan Vekemans MD, PhD Malaria vaccines Global Vaccine Development GSK Biologicals NIH 2012 1 The need for a malaria vaccine: targets
Progress and Challenges in Malaria Vaccines
 Progress and Challenges in Malaria Vaccines Vasee Moorthy MD PhD Initiative for Vaccine Research, WHO Geneva 1 SKIN STAGE VIDEOS 1 Hour: IgG 2 1 Hour: IgG 6 Days: CD8 7 Days: IgG Passive: IgG NATURAL IMMUNITY
Malaria vaccines where are we now?
 Malaria vaccines where are we now? Lars Hviid (lhviid@sund.ku.dk) Centre for Medical Parasitology Department of Immunology and Microbiology Slide 1 Background: A very interested but disinterested real
Enhancing Immunogenicity of Recombinant Vaccines: Chemical Conjugation
 Enhancing Immunogenicity of Recombinant Vaccines: Chemical Conjugation Malaria vaccine development and a role for conjugates Ashley J Birkett, PhD Director, Research & Development New Cells, New Vaccines
BRIEFING ON RTS,S/AS01 MALARIA VACCINE FOR THE SEPTEMBER 2012 MEETING OF MPAC
 BRIEFING ON RTS,S/AS01 MALARIA VACCINE FOR THE SEPTEMBER 2012 MEETING OF MPAC Introduction Date: 12 August 2012. Author: WHO Secretariat with input from JTEG Chair The most advanced vaccine candidate against
abstract n engl j med 374;26 nejm.org June 30,
 The new england journal of medicine established in 1812 June 30, 2016 vol. 374 no. 26 Seven-Year Efficacy of RTS,S/AS01 Malaria Vaccine among Young African Children Ally Olotu, Ph.D., Gregory Fegan, Ph.D.,
Four-Year Efficacy of RTS,S/AS01E and Its Interaction with Malaria Exposure
 T h e n e w e ngl a nd j o u r na l o f m e dic i n e original article Four- Efficacy of RTS,S/AS1E and Its Interaction with Malaria Exposure Ally Olotu, M.B., Ch.B., Gregory Fegan, Ph.D., Juliana Wambua,
INTERVENTION MODEL OF MALARIA
 INTERVENTION MODEL OF MALARIA TAYLOR MCCLANAHAN Abstract. Every year up to about 300 million people are infected by malaria, an infectious disease caused by Plasmodium species parasites. Consequently,
Ph.D. Thesis: Protective immune response in P.falciparum malaria 2011 CHAPTER I: Introduction. S.D. Lourembam 16
 CHAPTER I: Introduction S.D. Lourembam 16 1. INTRODUCTION Malaria remains a major global health problem with 300 to 500 million clinical infections and more than a million deaths reported each year. In
Challenging the Current Malaria Vaccine Pipeline. Dr Odile LEROY Basel 6th December 2016
 Challenging the Current Malaria Vaccine Pipeline Dr Odile LEROY Basel 6th December 2016 1 Malaria Burden Notable progresses but still major public health issue 214 million new cases 18% decline in 15 years
JTEG s Summary of RTS,S/ AS01 Clinical Trial Data
 JTEG s Summary of RTS,S/ AS01 Clinical Trial Data Peter Smith On behalf of the Joint Technical Expert Group (JTEG) based on Cohen et al 2010 RTS,S/AS01 Malaria Vaccine l Based on large segment of P. falciparum
ASSESSMENT OF HUMORAL AND CELLULAR IMMUNE RESPONSES OF THE RTS,S/AS02D MALARIA VACCINE CANDIDATE ADMINISTERED TO
 ASSESSMENT OF HUMORAL AND CELLULAR IMMUNE RESPONSES OF THE RTS,S/AS02D MALARIA VACCINE CANDIDATE ADMINISTERED TO INFANTS LIVING IN A MALARIA ENDEMIC AREA IN MOZAMBIQUE Pedro Carlos Paulino Aide A research
Malaria DR. AFNAN YOUNIS
 Malaria DR. AFNAN YOUNIS Objectives: Epidemiology of malaria Clinical picture Mode of transmission Risk factors Prevention and control Malaria is a life-threatening disease caused by Plasmodium parasites
Malaria. Edwin J. Asturias, MD
 Malaria Edwin J. Asturias, MD Associate Professor of Pediatrics and Epidemiology Director for Latin America Center for Global Health, Colorado School of Public Health Global Health and Disasters Course
RTS,S/AS01 Candidate Malaria vaccine Summary for the SAGE meeting
 RTS,S/AS01 Candidate Malaria vaccine Summary for the SAGE meeting October 2009 This document is submitted to SAGE upon request from WHO for the sole purpose of publication in the Yellow book in preparation
Malaria. Dr. Salim Abdulla, Director Ifakara Health Institute, Dar-es-salaam, Tanzania
 Malaria Dr. Salim Abdulla, Director Ifakara Health Institute, Dar-es-salaam, Tanzania Despite 42% reduction since 2000, a child dies every minute in Africa from malaria 207 million malaria cases in 2012,
HVTN P5 Vaccine Trials
 HVTN P5 Vaccine Trials Erica Andersen-Nissen, PhD Director, Cape Town HVTN Immunology Laboratory Considerations for a Pan-African HIV Vaccine Development Agenda Kigali, Rwanda 16-17 March 2015 HVTN Mission
Summary World Malaria Report 2010
 Summary The summarizes information received from 106 malaria-endemic countries and other partners and updates the analyses presented in the 2009 Report. It highlights continued progress made towards meeting
Ultrastructural Studies on Plasmodium vivax
 Characterization of Human Malaria Parasites Ultrastructural Studies on Plasmodium vivax For the first time a detailed ultrastructural study was carried out on P. vivax. Fine structural analysis of growth
Overview of the Malaria Vaccine Implementation Programme (MVIP) Prof. Fred Were SAGE meeting 17 April, 2018
 Prof. Fred Were SAGE meeting 17 April, 2018") Overview of the Malaria Vaccine Implementation Programme (MVIP) Prof. Fred Were SAGE meeting 17 April, 2018 1 Objectives Brief review Background EMA positive opinion and WHO recommendations Funding Description
Overview of the Malaria Vaccine Implementation Programme (MVIP) Prof. Fred Were SAGE meeting 17 April, 2018 1 Objectives Brief review Background EMA positive opinion and WHO recommendations Funding Description
Ending Malaria in Nigeria: The WHO Agenda
 Nigeria Institute of Medical Research 2016 World Malaria Day Lecture 27 April, 2016 Ending Malaria in Nigeria: The WHO Agenda Dr Tolu Arowolo Malaria Containment Programme, WHO, Nigeria arowolot@who.int
Status of RTS,S/AS01 malaria vaccine candidate
 Status of RTS,S/AS01 malaria vaccine candidate Multi-center RTS,S malaria vaccine efficacy trial Phase 3, randomized, controlled, double-blind trial conducted in 11 centers in 7 African countries 15,460
Copenhagen, Denmark, September August Malaria
 Regional Committee for Europe 64th session EUR/RC64/Inf.Doc./5 Copenhagen, Denmark, 15 18 September 2014 21 August 2014 140602 Provisional agenda item 3 ORIGINAL: ENGLISH Malaria Following the support
Malaria and vaccination: an update. Robert Sauerwein Dept. of Medical Microbiology Radboud University Medical Center, Nijmegen, the Netherlands
 Malaria and vaccination: an update ) Robert Sauerwein Dept. of Medical Microbiology Radboud University Medical Center, Nijmegen, the Netherlands Malaria Control Drugs for treatment and/or prophylaxis Artemisinin-based
Invest in the future, defeat malaria
 Invest in the future, defeat malaria Malaria is caused by parasites from the genus Plasmodium, which are spread to people by infected mosquitoes. There are five species of Plasmodium that can infect humans.
Media centre Malaria. Key facts. Symptoms
 Media centre Malaria Fact sheet Updated November 2017 Key facts Malaria is a life-threatening disease caused by parasites that are transmitted to people through the bites of infected female Anopheles mosquitoes.
MALARIA CONTROL FROM THE INDIVIDUAL TO THE COMMUNITY
 MALARIA CONTROL FROM THE INDIVIDUAL TO THE COMMUNITY Calvin L. Wilson MD Clinical Professor of Family Medicine and Public Health University of Colorado Anschutz OBJECTIVES 1. Understand the unique characteristics
Malaria Vaccine Pipeline
 Malaria Vaccine Pipeline Perspectives and Challenges Carla Botting World Vaccine Congress Asia 2008 3 June 2008 Discussion Points Scope of the problem: the burden and challenge of malaria Malaria vaccine
WHO Consultation on universal access to core malaria interventions in high burden countries: main conclusions and recommendations
 WHO Consultation on universal access to core malaria interventions in high burden countries: main conclusions and recommendations 12-15 February 2018 Salle XI, ILO Building, Geneva, Switzerland Country
Malaria. Population at Risk. Infectious Disease epidemiology BMTRY 713 (Lecture 23) Epidemiology of Malaria. April 6, Selassie AW (DPHS) 1
 Epidemiology of Malaria. April 6, Selassie AW (DPHS) 1") Infectious Disease Epidemiology BMTRY 713 (A. Selassie, DrPH) Lecture 23 Vector-Borne Disease (Part II) Epidemiology of Malaria Learning Objectives 1. Overview of malaria Global perspectives 2. Identify
Infectious Disease Epidemiology BMTRY 713 (A. Selassie, DrPH) Lecture 23 Vector-Borne Disease (Part II) Epidemiology of Malaria Learning Objectives 1. Overview of malaria Global perspectives 2. Identify
Journal of Infectious Diseases Advance Access published June 15, Safety and High Level Efficacy of the Combination Malaria Vaccine Regimen of
 Journal of Infectious Diseases Advance Access published June 15, 2016 1 Safety and High Level Efficacy of the Combination Malaria Vaccine Regimen of RTS,S/AS01 B with ChAd-MVA Vectored Vaccines Expressing
Protocol. This trial protocol has been provided by the authors to give readers additional information about their work.
 Protocol This trial protocol has been provided by the authors to give readers additional information about their work. Protocol for: Olotu A, Fegan G, Wambua J, et al. Seven-year efficacy of RTS,S/AS01
Malaria. An Overview of Life-cycle, Morphology and Clinical Picture
 Malaria An Overview of Life-cycle, Morphology and Clinical Picture Malaria Malaria is the most important of all tropical parasitic disease,causes death and debility and is endemic throughout the tropics
WHO Global Malaria Programme. February 2009
 WHO Global Malaria Programme February 2009 Table of Contents 1. The world malaria situation 2. The critical role of WHO's Global Malaria Programme 3. Our programme of work explained 4. Situation analysis
Protocol Synopsis. Administrative information
 Protocol Synopsis Item (SPIRIT item no.) Administrative information Title (1) Introduction Description of research question (6a) Description An optimal schedule for the post-polio eradication era: multicentre
Roadmaps as a Vehicle for Addressing Large- Scale Public Health Challenges: Lessons from the Malaria Vaccine Technology Roadmap
 Background to development of vaccine roadmaps, to include priority areas for research, product development, capacities, and policy and commercialization Roadmaps as a Vehicle for Addressing Large- Scale
Third line of Defense
 Chapter 15 Specific Immunity and Immunization Topics -3 rd of Defense - B cells - T cells - Specific Immunities Third line of Defense Specific immunity is a complex interaction of immune cells (leukocytes)
Perspective in novel TB vaccine development Mohamed Ridha BARBOUCHE M.D., Ph.D. Department of Immunology Institut Pasteur de Tunis
 Perspective in novel TB vaccine development Mohamed Ridha BARBOUCHE M.D., Ph.D. Department of Immunology Institut Pasteur de Tunis Existing TB Vaccine is not effective for global TB epidemic control BCG
Study No.: Title: Rationale: Phase: Study Period: Study Design: Centres: Indication: Treatment: Objectives: Primary Outcome/Efficacy Variable:
 The study listed may include approved and non-approved uses, formulations or treatment regimens. The results reported in any single study may not reflect the overall results obtained on studies of a product.
9/10/2018. Principles of Vaccination. Immunity. Antigen. September 2018
 Centers for Disease Control and Prevention National Center for Immunization and Respiratory Diseases Principles of Vaccination September 2018 Chapter 1 September 2018 Photographs and images included in
Resource Allocation for Malaria Prevention. Bahar Yetis Kara
 Resource Allocation for Malaria Prevention Bahar Yetis Kara Malaria Video 1: JumboJets (0.50 min) 10 Facts about Malaria (WHO) Fact 1: can be transmitted to people of all ages. bites of infected mosquitoes.
Counting Malaria Out: Progress of Efforts in the Americas and More Stories of Innovations. Counting Malaria Out in the Americas
 Counting Malaria Out: Progress of Efforts in the Americas and More Stories of Innovations Malaria: A Review Malaria is a disease caused by a parasite of the genus Plasmodium. More than 150 species of Plasmodium
Updated WHO position paper on pertussis vaccines. Geneva, Switzerland October 2010
 Updated WHO position paper on pertussis vaccines Geneva, Switzerland October 2010 Introduction Replaces the position paper on pertussis vaccines published in the Weekly Epidemiological Record in January
Malaria vaccines and the new malaria agenda
 REVIEW 10.1111/j.1469-0691.2011.03612.x Malaria vaccines and the new malaria agenda B. M. Greenwood and G. A. T. Targett Faculty of Infectious and Tropical Diseases, London School of Hygiene & Tropical
Hepatitis B vaccination: a completed schedule enough to control HBV lifelong? MILAN, ITALY November 2011
 Viral Hepatitis Prevention Board Hepatitis B vaccination: a completed schedule enough to control HBV lifelong? MILAN, ITALY 17-18 November 2011 Objectives To review long-term efficacy of hepatitis B vaccine
BK-SE36 malaria vaccine candidate for young children
 BK-SE36 malaria vaccine candidate for young children Toshihiro Horii, Ph.D RIMD, Osaka University 26 June. 2015, Save the date,tokyo, Japan Structure of SERA5 protein and SE36 recombinant molecule 23 Serine
Against intervention No recommendation Strong Conditional Conditional Strong. For intervention. High Moderate Low Very low
 Draft recommendation: Consider using MDA as an additional tool for the elimination of malaria in low prevalence island or nonisland settings where the risk of imported malaria is low Balance of desirable
GOVX-B11: A Clade B HIV Vaccine for the Developed World
 GeoVax Labs, Inc. 19 Lake Park Drive Suite 3 Atlanta, GA 3 (678) 384-72 GOVX-B11: A Clade B HIV Vaccine for the Developed World Executive summary: GOVX-B11 is a Clade B HIV vaccine targeted for use in
Implementing the Abuja Declaration and Plan of Action: the journey so far
 Implementing the Abuja Declaration and Plan of Action: the journey so far The Abuja Declaration African leaders who met on 25 April 2000 in Abuja, Nigeria, laid out the foundation for a sustained battle
Interpretation of the World Malaria Report Country Profile
 Interpretation of the World Malaria Report Country Profile Acknowledgements This presentation was developed to help explain the components of the World Malaria Report Country Profile. The 2017 World Malaria
Chemoprophylaxis and intermittent treatment for preventing malaria in children (Review)
") Chemoprophylaxis and intermittent treatment for preventing malaria in children (Review) Meremikwu MM, Donegan S, Esu E This is a reprint of a Cochrane review, prepared and maintained by The Cochrane Collaboration
Chemoprophylaxis and intermittent treatment for preventing malaria in children (Review) Meremikwu MM, Donegan S, Esu E This is a reprint of a Cochrane review, prepared and maintained by The Cochrane Collaboration
Case Definitions of Clinical Malaria under Different Transmission Conditions in Kilifi District, Kenya
 MAJOR ARTICLE Case Definitions of Clinical Malaria under Different Transmission Conditions in Kilifi District, Kenya Tabitha W. Mwangi, 1 Amanda Ross, 1,2,a Robert W. Snow, 1,2 and Kevin Marsh 2 1 Kenya
Statistical Analysis Plan (SAP)
") Statistical Analysis Plan (SAP) Comparison of artemether-lumefantrine and chloroquine with and without primaquine for the treatment of Plasmodium vivax in Ethiopia: a randomized controlled trial Contents
Statistical Analysis Plan (SAP) Comparison of artemether-lumefantrine and chloroquine with and without primaquine for the treatment of Plasmodium vivax in Ethiopia: a randomized controlled trial Contents
Downloaded from:
 Bejon, P; Mwacharo, J; Kai, O; Mwangi, T; Milligan, P; Todryk, S; Keating, S; Lang, T; Lowe, B; Gikonyo, C; Molyneux, C; Fegan, G; Gilbert, SC; Peshu, N; Marsh, K; Hill, AV (2006) A Phase 2b Randomised
Repellent Soap. The Jojoo Mosquito. Africa s innovative solution to Malaria prevention. Sapphire Trading Company Ltd
 The Jojoo Mosquito Repellent Soap Africa s innovative solution to Malaria prevention Sapphire Trading Company Ltd P.O.Box: 45938-00100 Nairobi, Kenya. Tel: +254 735 397 267 +254 733 540 868 +254 700 550
Tanzania s Progress in Combating Malaria: Achievement and Challenges
 Tanzania s Progress in Combating Malaria: Achievement and Challenges DR RENATA A MANDIKE DEPUTY PROGRAMME MANAGER NATIONAL MALARIA CONTROL PROGRAMME, MINISTRY OF HEALTH, COMMUNITY DEVELOPMENT, GENDER,
Introduction. In the past 15 years, several technological advancements have open new perspectives and applications in the field of vaccinology.
 Introduction In the past 15 years, several technological advancements have open new perspectives and applications in the field of vaccinology. - Genomics: fasten antigen discovery for complex pathogens
Hepatitis B vaccine: long-term efficacy, booster policy, and impact of HBV mutants on hepatitis B vaccination programmes
 Hepatitis B vaccine: long-term efficacy, booster policy, and impact of HBV mutants on hepatitis B vaccination programmes VHPB meeting, Seville, 11-12 March 2004 Immunization programmes Programmes protect
Moderate efficacy malaria vaccines as part of comprehensive malaria control and elimination
 Moderate efficacy malaria vaccines as part of comprehensive malaria control and elimination Progress and Limitation of Existing Vector Control Tools Draper & Smith 1960 TRSTMH 54: 342 Cannot afford to
Overview of Malaria Epidemiology in Ethiopia
 Overview of Malaria Epidemiology in Ethiopia Wakgari Deressa, PhD School of Public Health Addis Ababa University Symposium on Neuro-infectious Disease United Nations Conference Center, AA February 28,
Malaria Vaccine: Candidate Antigens, Mechanisms, Constraints and Prospects
 Scand. J. Immunol. 56, 327±343, 2002 REVIEW Malaria Vaccine: Candidate Antigens, Mechanisms, Constraints and Prospects L. J. M. CARVALHO,*C. T. DANIEL-RIBEIRO*& H. GOTOy *Laboratory of Malaria Research,
Vaccines Against Malaria
 VACCINES INVITED ARTICLE Stanley A. Plotkin, Section Editor Vaccines Against Malaria Amed Ouattara 1 and Matthew B. Laurens 2 1 Department of Medicine, Center for Vaccine Development, and 2 Departments
HCV Vaccine where do we stand? U. Spengler University of Bonn
 HCV Vaccine where do we stand? U. Spengler University of Bonn THE IDEAL GOAL: The vaccine should induce sterilizing immunity A MORE REALISTIC GOAL: Prevention of chronic persistent infection Feinstone
The President s Malaria Initiative (PMI) Indoor Residual Spraying (IRS) in Motion: Malaria Stories from the Field
 Indoor Residual Spraying (IRS) in Motion: Malaria Stories from the Field") The President s Malaria Initiative (PMI) Indoor Residual Spraying (IRS) in Motion: Malaria Stories from the Field Presenters: Allison Belemvire, Christen Fornadel & Kristen George Presentation Outline
The President s Malaria Initiative (PMI) Indoor Residual Spraying (IRS) in Motion: Malaria Stories from the Field Presenters: Allison Belemvire, Christen Fornadel & Kristen George Presentation Outline
Third line of Defense. Topic 8 Specific Immunity (adaptive) (18) 3 rd Line = Prophylaxis via Immunization!
 (18) 3 rd Line = Prophylaxis via Immunization!") Topic 8 Specific Immunity (adaptive) (18) Topics - 3 rd Line of Defense - B cells - T cells - Specific Immunities 1 3 rd Line = Prophylaxis via Immunization! (a) A painting of Edward Jenner depicts a cow
Topic 8 Specific Immunity (adaptive) (18) Topics - 3 rd Line of Defense - B cells - T cells - Specific Immunities 1 3 rd Line = Prophylaxis via Immunization! (a) A painting of Edward Jenner depicts a cow
3. Lymphocyte proliferation (fig. 15.4): Clones of responder cells and memory cells are derived from B cells and T cells.
: Clones of responder cells and memory cells are derived from B cells and T cells.") Chapter 15 Adaptive, Specific Immunity and Immunization* *Lecture notes are to be used as a study guide only and do not represent the comprehensive information you will need to know for the exams. Specific
Chapter 15 Adaptive, Specific Immunity and Immunization* *Lecture notes are to be used as a study guide only and do not represent the comprehensive information you will need to know for the exams. Specific
Fighting Harder and Smarter Against Malaria. Dr.Bernard Nahlen Deputy US Global Malaria Coordinator University of Georgia, February 23, 2010
 Fighting Harder and Smarter Against Malaria Dr.Bernard Nahlen Deputy US Global Malaria Coordinator University of Georgia, February 23, 2010 Outline Burden of malaria Global support for rolling back malaria
A MATHEMATICAL MODEL FOR THE SPREAD OF MALARIA CASE STUDY: CHORKOR-ACCRA. AVORDEH, TIMOTHY KING BEd (MATHEMATICS)
") A MATHEMATICAL MODEL FOR THE SPREAD OF MALARIA CASE STUDY: CHORKOR-ACCRA BY AVORDEH, TIMOTHY KING BEd (MATHEMATICS) A Thesis Submitted to the Department of Mathematics, Kwame Nkrumah University of Science
A MATHEMATICAL MODEL FOR THE SPREAD OF MALARIA CASE STUDY: CHORKOR-ACCRA BY AVORDEH, TIMOTHY KING BEd (MATHEMATICS) A Thesis Submitted to the Department of Mathematics, Kwame Nkrumah University of Science
Economics of Vaccine Development A Vaccine Manufacturer s Perspective
 Economics of Vaccine Development A Vaccine Manufacturer s Perspective Gerald Voss The Value of Vaccines 2 29 diseases are currently preventable by vaccination Global public health Cervical cancer 1 Diphtheria
24 26 January 2013, Hong Kong SAR, CHINA. TITLE from VIEW and SLIDE MASTER February 27, 2013
 The first WHO integrated meeting on development and clinical trials of influenza vaccines that induce broadly protective and long-lasting immune responses 24 26 January 2013, Hong Kong SAR, CHINA 1 TITLE
Study No.: Title: Rationale: Phase: Study Period: Study Design: Centers: Indication: Treatment: Objectives: Primary Outcome/Efficacy Variable:
 The study listed may include approved and non-approved uses, formulations or treatment regimens. The results reported in any single study may not reflect the overall results obtained on studies of a product.
Is vaccination the only option for possible global malaria eradication?
 Review Article Is vaccination the only option for possible global malaria eradication? Ivan Tonna In the last century, vaccines, together with the discovery of antibiotics have been powerful tools in the
A Hopeful Beginning for Malaria Vaccines
 Transcript Details This is a transcript of an educational program accessible on the ReachMD network. Details about the program and additional media formats for the program are accessible by visiting: https://reachmd.com/programs/focus-on-global-medicine/a-hopeful-beginning-for-malariavaccines/4043/
ESCMID Online Lecture Library. by author
 4-8 June 2012 T. van Gool, MD, PhD A. Bart, PhD Academic Medical Center Amsterdam F. Derouin, MD, PhD Hôpital Saint Louis Paris T. Kortbeek, MD RIVM, Bilthoven How good is training in Clinical Parasitology?
Driving access to medicine
 Driving access to medicine An example from the Novartis Malaria Initiative Hans Rietveld Director, Market Access & Capacity Building Novartis Malaria Initiative Social Forum - Geneva February 20, 2015
Kath Maitland Imperial College London & KEMRI / Wellcome Trust Programme, Kilifi, Kenya
 Severe malaria: management with few resources Kath Maitland Imperial College London & KEMRI / Wellcome Trust Programme, Kilifi, Kenya Plasmodium falciparum malaria In African children
Key Messages for World Malaria Day 2009
 INFORMATION RBM/WG/2009/INF.12 10 APR 2009 Draft document General distribution English Only Key Messages for World Malaria Day 2009 Counting Malaria Out to Reaching the 2010 Targets On the occasion of
CD4 + T-cell-inducing HIV vaccines may have an impact on viral control
 CD4 + T-cell-inducing HIV vaccines may have an impact on viral control Clues from cytokines produced by CD4 + T-cells from HIVinfected patients and vaccinated seronegative volunteers Eva Van Braeckel 1,
Where are we with Malaria in Africa?
 Where are we with Malaria in Africa? P.Olliaro WHO/TDR (Geneva, CH) U. Oxford (UK) Firenze 19Dec2012 1. Malaria receding focally Elimination (?) Consequences: Risks Syndromic approach to case-management
Sponsor / Company: Sanofi Drug substance(s): artesunate plus amodiaquine Title of the study:
: artesunate plus amodiaquine Title of the study:") These results are supplied for informational purposes only. Prescribing decisions should be made based on the approved package insert in the country of prescription. Sponsor / Company: Sanofi Drug substance(s):
These results are supplied for informational purposes only. Prescribing decisions should be made based on the approved package insert in the country of prescription. Sponsor / Company: Sanofi Drug substance(s):
in control group 7, , , ,
 Q1 Rotavirus is a major cause of severe gastroenteritis among young children. Each year, rotavirus causes >500,000 deaths worldwide among infants and very young children, with 90% of these deaths occurring
A Research Agenda for Malaria Eradication: Vaccines
 Review A Research Agenda for Malaria Eradication: Vaccines The malera Consultative Group on Vaccines " * Abstract: Vaccines could be a crucial component of efforts to eradicate malaria. Current attempts
Principles of Vaccination
 Immunology and Vaccine-Preventable Diseases Immunology is a complicated subject, and a detailed discussion of it is beyond the scope of this text. However, an understanding of the basic function of the
Antimalarials in the WHO Essential Drugs List for Children Reviewer No.1
 Antimalarials in the WHO Essential Drugs List for Children Reviewer No.1 Part I: Evaluation of the current list Proposed grouping from the March 2007 meeting 6.5.3 Antimalarial medicines 6.5.3.1 For curative
Average Household Size and the Eradication of Malaria
 For General Release Summary of: Average Household Size and the Eradication of Malaria By Lena Huldén, Ross McKitrick and Larry Huldén Journal of the Royal Statistical Society Series A, October 2013 Online
Sponsor / Company: Sanofi Drug substance(s): SSR103371
: SSR103371") These results are supplied for informational purposes only. Prescribing decisions should be made based on the approved package insert in the country of prescription. Sponsor / Company: Sanofi Drug substance(s):
These results are supplied for informational purposes only. Prescribing decisions should be made based on the approved package insert in the country of prescription. Sponsor / Company: Sanofi Drug substance(s):
EPIDEMIOLOGICAL SURVEILLANCE REPORT Malaria in Greece, 2018, up to 22/10/2018
 Page 1 EPIDEMIOLOGICAL SURVEILLANCE REPORT Malaria in Greece, 2018, up to 22/10/2018 Introduction Greece was declared free from malaria in 1974, following an intense control program (1946-1960). Since
Antimalarial drug resistance
 Antimalarial drug resistance Md Mushfiqur Rahman*, Leonard Ortega**, R M Rastogi* and Krongthong Thimasarn* Abstract Antimalarial drug resistance is of great concern in the WHO South-East Asia (SEA) Region.
The RTS,S Clinical Trials Partnership " * Abstract
 Efficacy and Safety of the RTS,S/AS01 Malaria Vaccine during 18 Months after Vaccination: A Phase 3 Randomized, Controlled Trial in Children and Young Infants at 11 African Sites The RTS,S Clinical Trials
answer Marks Guidance 1 (a) 2 max Mark the first answer on each prompt line. ACCEPT ora throughout nucleus / nuclei ; 1 ACCEPT DNA not free
 2 max Mark the first answer on each prompt line. ACCEPT ora throughout nucleus / nuclei ; 1 ACCEPT DNA not free") Question answer Marks Guidance 1 (a) max Mark the first answer on each prompt line. ACCEPT ora throughout 1 6 7 nucleus / nuclei ; other named organelle / membrane bound organelles ; linear chromosomes
Question answer Marks Guidance 1 (a) max Mark the first answer on each prompt line. ACCEPT ora throughout 1 6 7 nucleus / nuclei ; other named organelle / membrane bound organelles ; linear chromosomes
Transmission network dynamics of Plasmodium Vivax Malaria
 Transmission network dynamics of Plasmodium Vivax Malaria P. Pongsumpun, and I.M.Tang Abstract One of the top ten killer diseases in the world is Malaria. In each year, there are between 3 to 5 million
Trends in vaccinology
 Trends in vaccinology Mathieu Peeters, MD Joint Conference of European Human Pharmacological Societies and Joint Conference of European Human Pharmacological Societies and 20th Anniversary of AGAH March
GSK s Adjuvanted Influenza Vaccines The Taming of the Flu
 GSK s Adjuvanted Influenza Vaccines The Taming of the Flu JITMM, Bangkok, October 2008 Bruce L. Innis, MD Global Clinical Research and Development GlaxoSmithKline Biologicals 1 Annual Burden of Influenza
Efficacy of RTS,S malaria vaccines: individual-participant pooled analysis of phase 2 data
 Efficacy of malaria vaccines: individual-participant pooled analysis of phase 2 data Philip Bejon, Michael T White, Ally Olotu, Kalifa Bojang, John P A Lusingu, Nahya Salim, Nekoye N Otsyula, Selidji T
Immunity & How Vaccines Work
 Immunity & How Vaccines Work Immunisation Study Day 30 th November 2016 Talk given today by Dr. Mary Fitzgerald Learning outcome To be able to describe in outline the immune system and how vaccines work
Malaria Life Cycle Life Cycle
 Malaria Malaria Life Cycle Life Cycle Oocyst Zygote Sporogony Sporozoites Mosquito Salivary Gland Gametocytes Exoerythrocytic (hepatic) cycle Hypnozoites (for P. vivax and P. ovale) Erythrocytic Cycle
Running head: VECTOR-BORNE DISEASES: MALARIA IN SUB-SAHARAN AFRICA 1
 Running head: VECTOR-BORNE DISEASES: MALARIA IN SUB-SAHARAN AFRICA 1 Vector-Borne Diseases: Malaria in Sub-Saharan Africa Andrea Person George Mason University GCH 360-002 Health and Environment Due: April
IOM Immunization Safety Review 11/12/2001. Immunological Competition and the Infant Immune Response to Vaccines
 IOM Immunization Safety Review 11/12/2001 Immunological Competition and the Infant Immune Response to Vaccines Richard Insel University of Rochester Goals Neonatal and Infant Immune System Broad Effects