Mathematical Microbiologists: Why we have to return to our square roots to uncover uncertainty (of measurement) in Quantitative PCR (qpcr)
|
|
|
- Nigel French
- 5 years ago
- Views:
Transcription
1 Mathematical Microbiologists: Why we have to return to our square roots to uncover uncertainty (of measurement) in Quantitative PCR (qpcr) J. Ian Stuart George Zahariadis Marina Salvadori
2 Objectives 1. Identify why Uncertainty of Measurement is required for qpcr and why it is important clinically 2. Demonstrate why you may be understating your uncertainty if you use a black box approach 3. Present appropriate methods for UOM calculation in qpcr 4. For discussion: A) The need for universal standards, B) Why clinical samples maybe better for UOM determination
3 Uses of viral load qpcr As surrogates for viral resistance For diagnosis of infection/disease As a trigger to start pre emptive therapy in order to prevent development of disease For treatment monitoring or safety monitoring Clearly a qpcr result has clinically important implications
4 What is our certainty in qpcr? Experience has taught us there can be a lot variability in measurements of any analyte This can occur both within a laboratory and between laboratories Clinicians use laboratory results as the foundation to implement treatment How can a laboratory handle this uncertainty when reporting a measured value?
5 Next 4 slides are a summary of a study by Dr. J Preiksaitis on CMV proficiency panels tested at international laboratories that highlight points regarding uncertainty of measurement(1) CMV DNA Copies/ml (log10) Clinical sample CMV viral panel sample Expected result based on stock quantified by reference laboratories Positive but not quantifiable (assigned lowest detectable value) CMV Sample Number
6 Summary of CMV Qualitative Results (constructed samples) 35 panels/33 labs Sample No EM based expected result copies/ml (log10) Reference lab expected result copies/ml (log10) Negative (%) Number of panels Positive-NQ (%) Positive-Q (%) (97) 0 1 (3) (94) 0 1 (3) (74) 6 (17) 3 (9) (11) 4 (11) 27 (77) (3) 34 (97) (6) 33 (94) (100) (100) (100) One test was invalid Pos-NQ: positive but not quantifiable Pos-Q: positive with quantifiable results
7 Summary of CMV Quantitative results (constructed samples) 35 panels/33 labs Sample No EM based expected result copies/ml (log10) Reference lab expected result copies/ml (log10) Number positive GM ±SD copies/ml (log10) Median (range) copies/ml (log10) ± (0-2.78) ± (0-4.32) ± ( ) ± ( ) ± ( ) ± ( ) ± ( ) Geometric mean; negative results were excluded
8 CMV Qualitative and Quantitative results (clinical samples) Clinical Sample Number #10 #05 #01 Qualitative Result Negative (%) 13 (37) 0 0 Pos-NQ (%) 9 (26) 1 (3) 0 Pos-Q (%) 13 (37) 34 (97) 35 (100) Quantitative Result copies/ml (log10) GM±SD 2.78 ± ± ± 0.47 Median (range) 2.24 (0-4.18) 3.87 ( ) 3.99 ( ) GM=Geometric mean; negative results were excluded
9 Ground Rules The methods in the following presentation are based on fictionalized data for CMV quantitative PCR. While some of the methods presented are sound, the results and error limits presented ARE NOT APPLICABLE TO ANY PATIENT POPULATION. Please consult your own laboratory for appropriate guidance on the significance of a result in quantitative PCR. Please reserve questions until the end of the presentation.


10 No! This is not Driver s Ed_ despite the figures to the right!


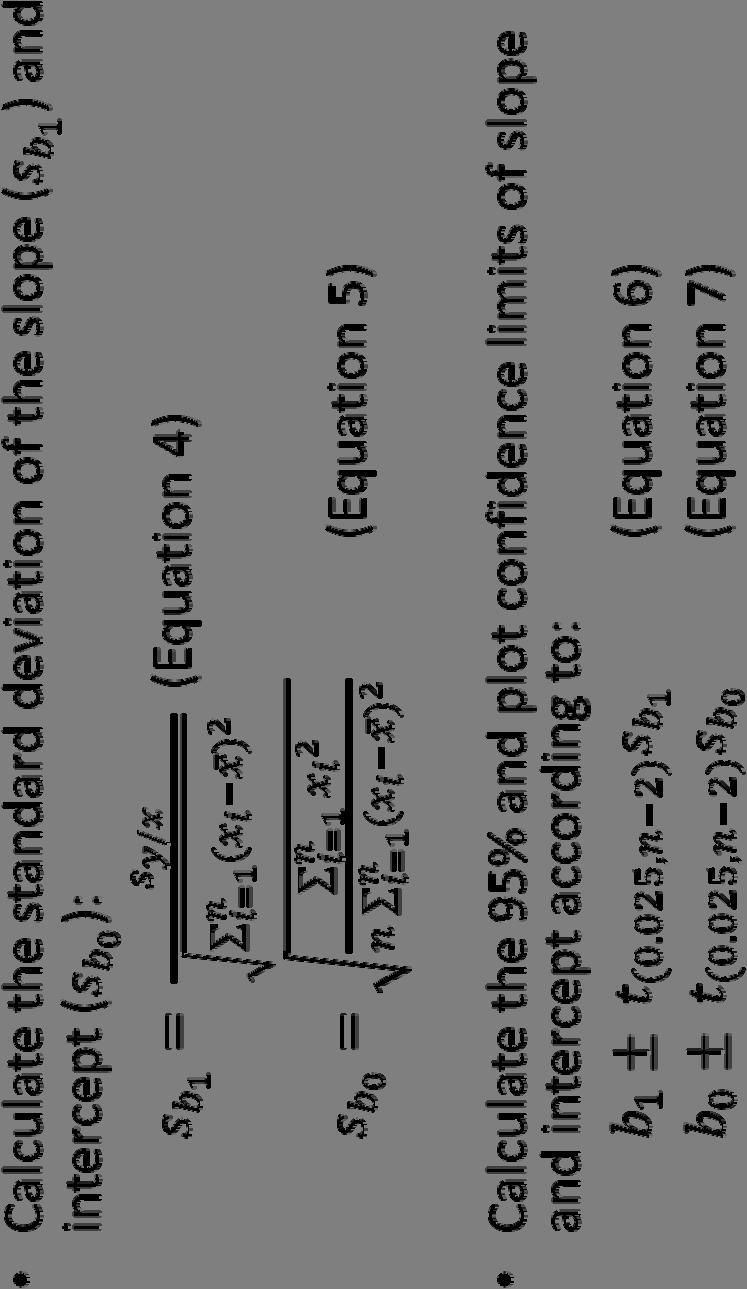
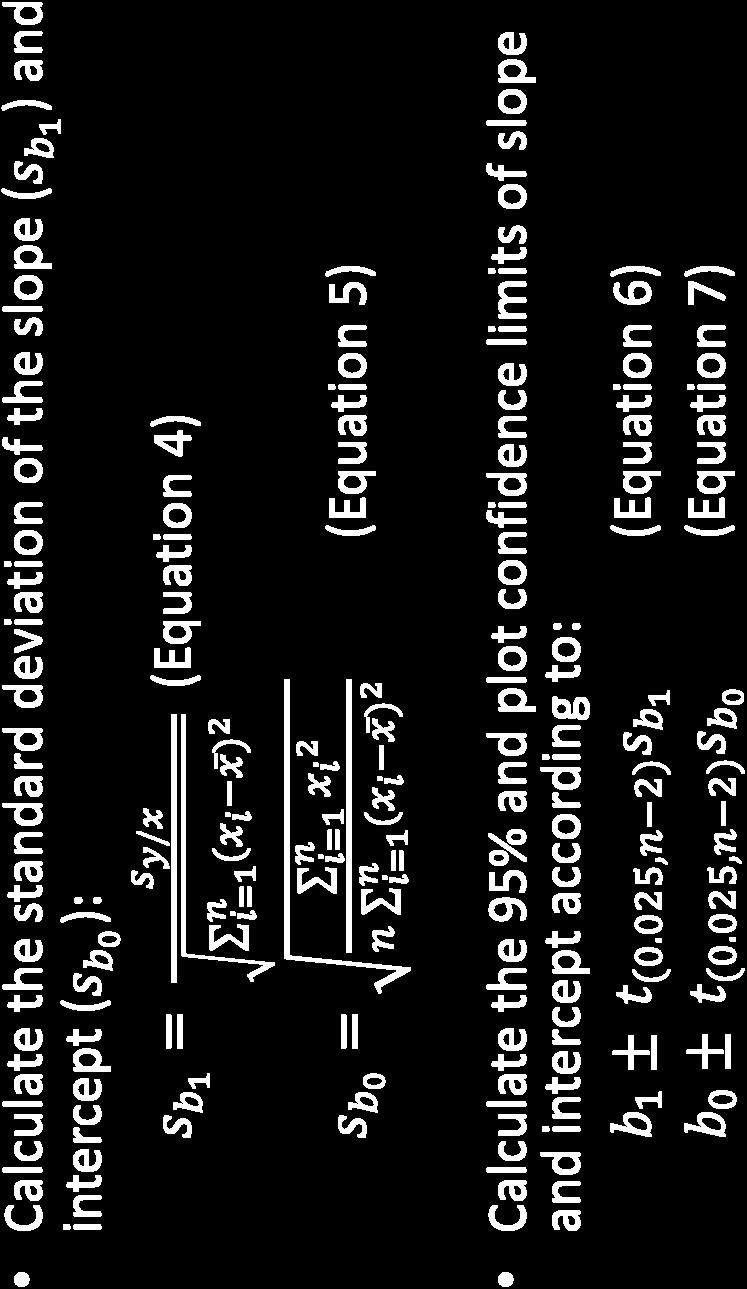
11 Some equations


12 The Problem with Inverse Regression

13 Another way to view this: From Miller 2006 (2)

14 The Wrong Way to do UOM

15
16 About ½ log difference over the entire range
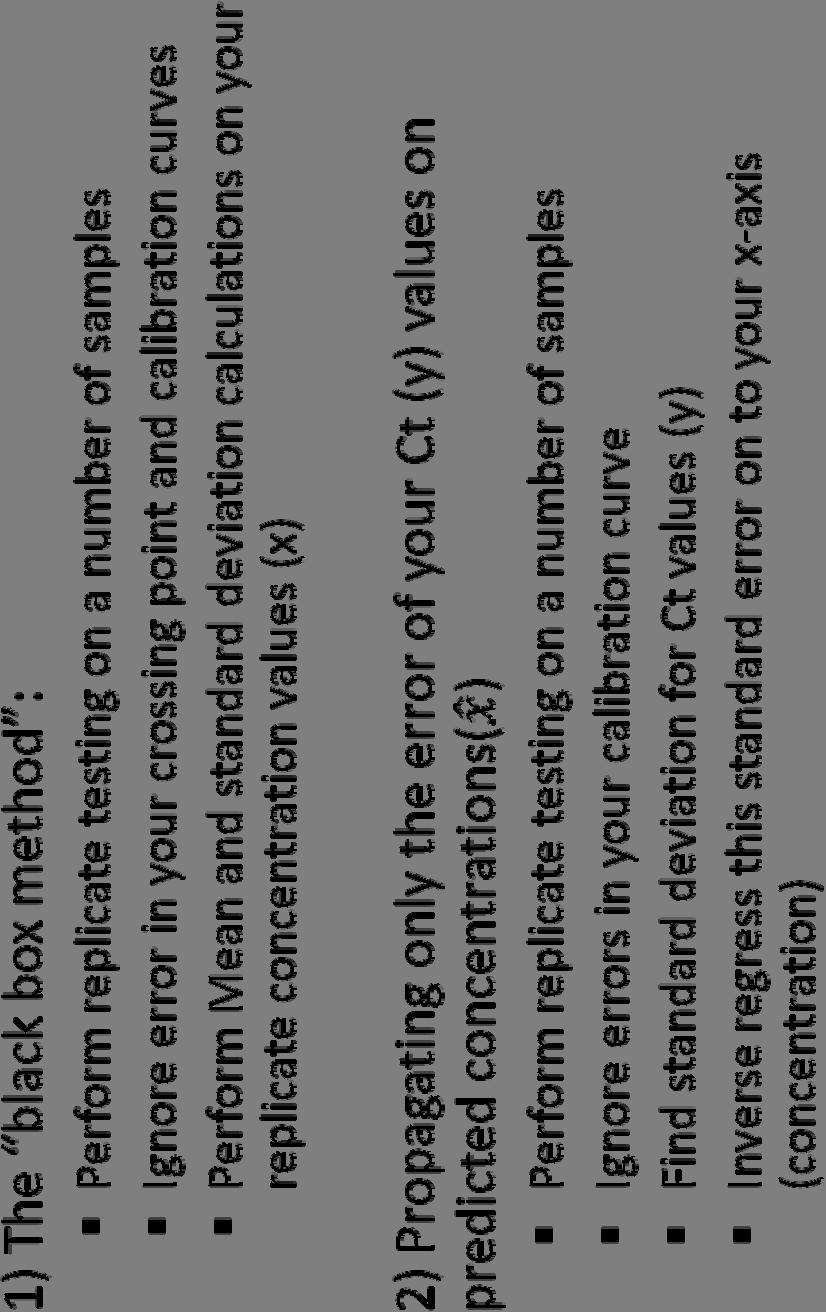
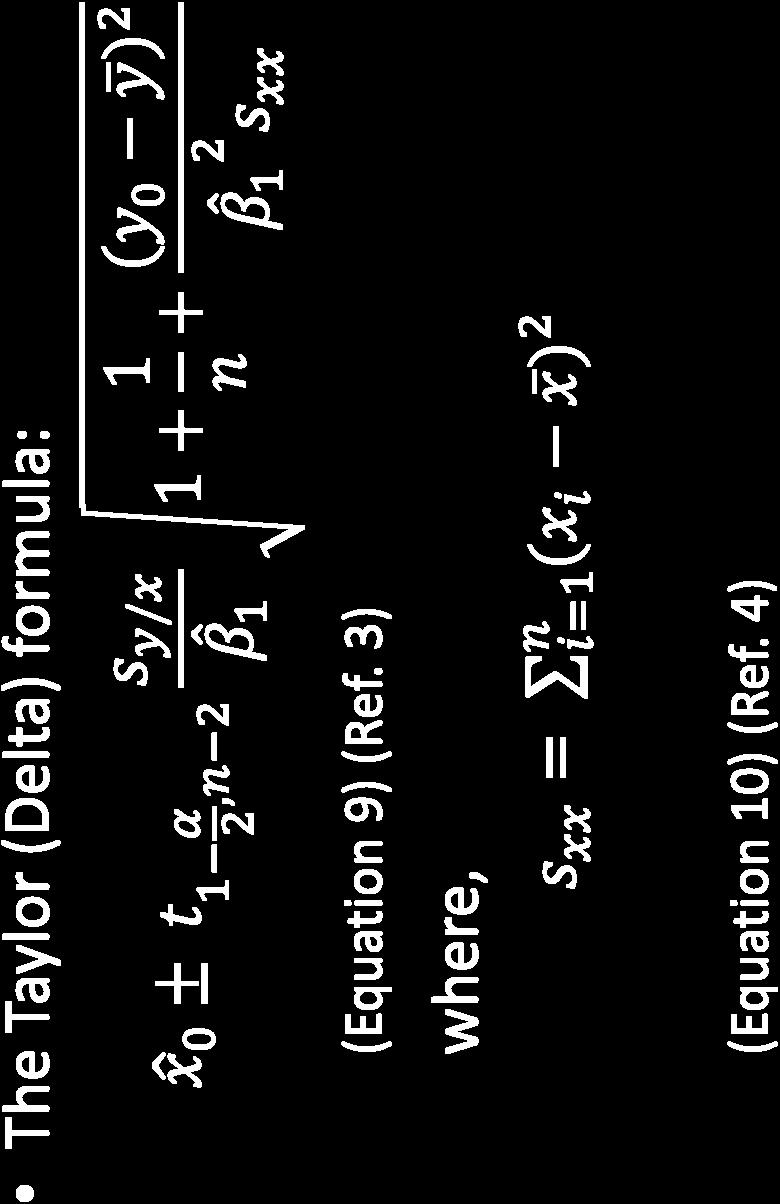
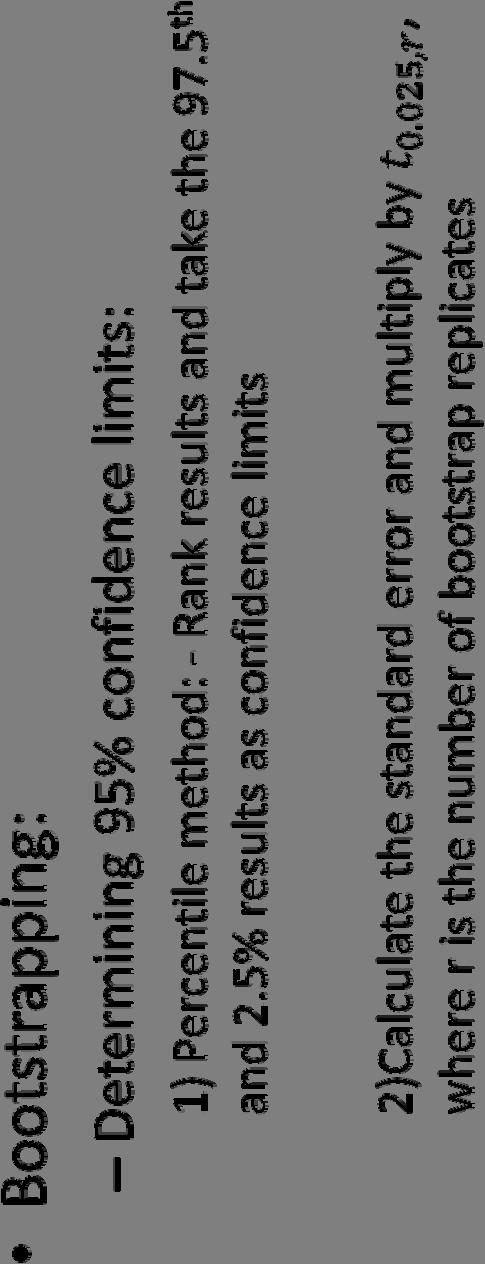
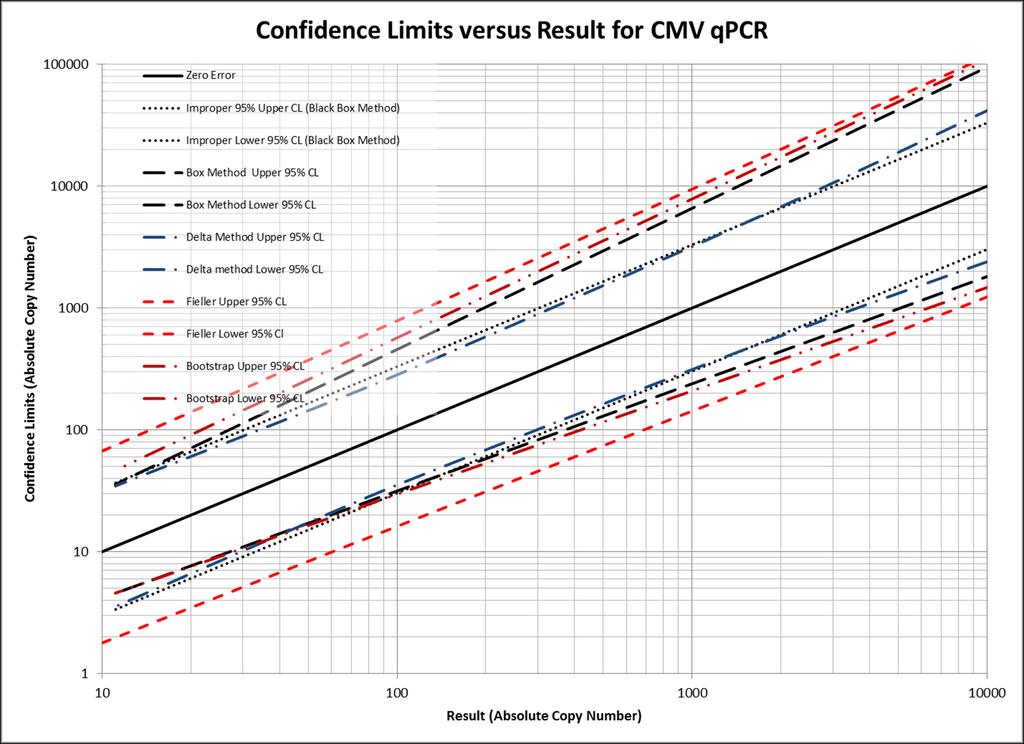
17 Proper ways to Calculate UOM 1) The Box Method (note that the box is no longer black) 2) Taylor (Delta) Method 3) Bootstrapping 4) According to Fieller s Theorem

18 A graphical Approach


19
20
21
22 Problems with the box: Assumes normal distribution and homoscedastic data Only gives an approximation of UOM May underreport uncertainty Lacks mathematical proofs Advantages: Easy to use: Linest function in Excel Can be done manually for quick evaluations
23 About 0.7 to 0.95 log difference throughout the range

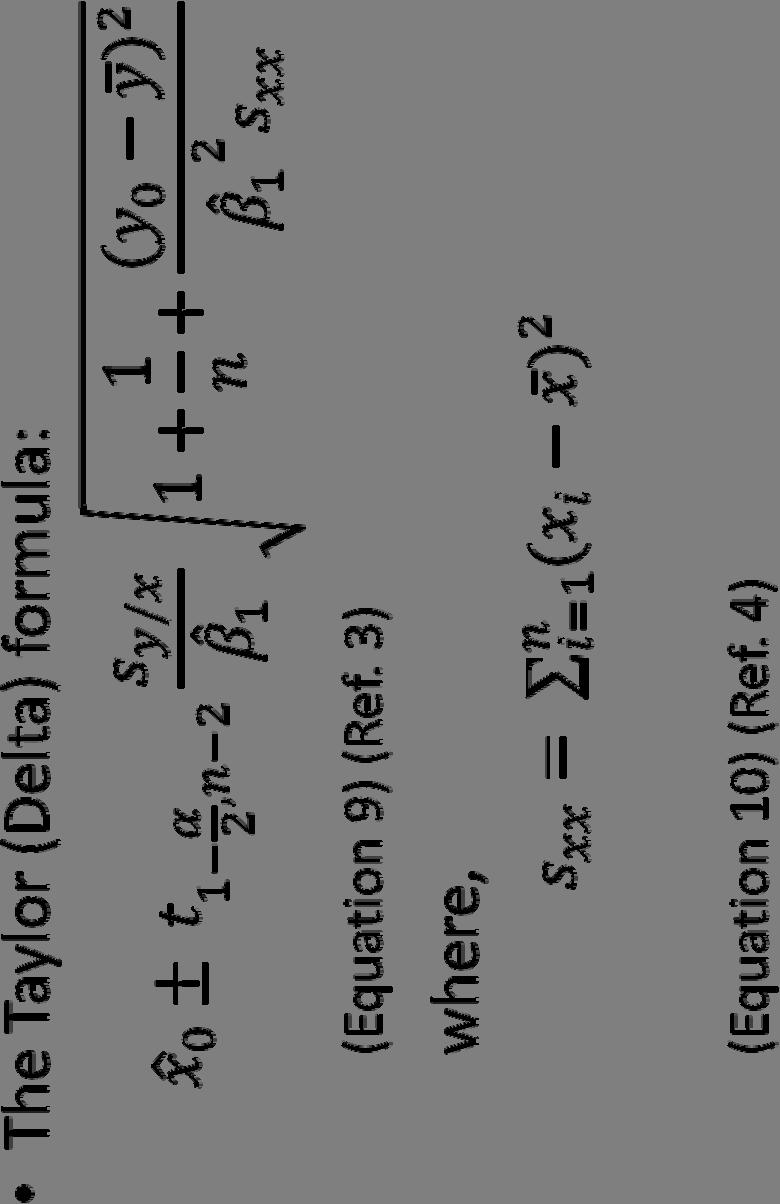
24 And you thought that you were done with calculus after your undergraduate courses!


25
26
27 About ½ log difference through the entire range. Note Convergence of the error bars around the mean Ct value (17)
28 Advantages: Mathematically more intuitive than other methods Easier to compute Disadvantages: Only gives an approximation of UOM Falls apart when the denominator of the ratio has a mean that approaches zero Assumes normal distributions and homoscedastic data


29


30 Fieller s method: Developed for The Biological Standardization of Insulin The Delta method only considers positive ratios: In Fieller s method, a negative ratio is considered and permits a quadratic solution for variance: Proof of Fieller s theorem is widely available and is beyond the scope of this discussion.? Could Fieller s conviction that a Ratio is a Ratio have been borrowed by a certain Canadian Politician who stated No, a proof is a proof. What kind of a proof? It's a proof. A proof is a proof, and when you have a good...?
31 About 1 log difference over the entire range
32 Advantages: Conservative estimates of error Quadratic formula permits easy computation One of the best recognized methods for evaluating error in ratios Disadvantages: Assumes normal distributions and homoscedastic data

33 THE MANHATTAN PROJECT? Now how can that apply to uncertainty of measurement for qpcr?
34 Bootstrapping (a special case of Monte Carlo Sampling) Resample the original sample with replacement k times k usually equals 1000 or greater Quote (Fox 2008): The population is to the sample as as the sample is to the bootstrap sample. So: 1)The bootstrap observations are analogous to the original observations 2)The bootstrap mean is analogous to the sample mean which is analogous to the population mean 3)The distribution of the bootstrap sample means is analogous to the distribution of means (n) drawn from the original sample

35 How to bootstrap
")
36 From (Ref. 6)
")
37 From (Ref. 7)
38
39

40
41 Advantages of Bootstrap: Relatively easy to perform Data does not have to be normally distributed or homoscedastic Mathematically simple Disadvantages of Bootstrap: May be computationally intensive (i.e plus loop commands creating a matrix of plus elements)
42 About 0.7 to 1 log difference over the entire range
43
44
45 For Discussion 1) The Need for standardized universal samples (such as those currently available for HIV, Hepatitis C and CMV): Healthcare portability Standardized reporting Inter laboratory comparisons 2) Standardized samples vs. patient samples for UOM determination: Precision vs. Accuracy
46 References 1) Preiksaitis, J. Hayden, R., Tong, Y. et al. Assessing the Impact of the 1rst WHO International Standard for Human Cytomegalovirus (HCMV) DNA on Result Harmonization. World Congress of Transplantation conference ) Miller, J. N. Uncertainties in concentrations estimated from calibrations experiments. calibrationexperiments technical brief 22_tcm pdf ) Parker, P., Vining, G., Szarka III, J., Johnson, N. The Prediction Properties of Inverse and Reverse Regression for the Simple Linear Calibration Problem ) Beyene, J. and Moineddin, R. Methods for confidence interval estimation of a ratio parameter with application to location quotients. BMC Medical Research Methodology : ) Fox, F. and Weisberg, S. Bootstrapping Regression Models in R. An Appendix to An R Companion to Applied Regression, Second Edition. Bootstrapping.pdf ) resampling/ 7)
CMV Diagnostic Strategies: Current and Future
 CMV Diagnostic Strategies: Current and Future Tony Mazzulli, MD, FRCPC, FACP Microbiologist-in-Chief Mount Sinai Hospital & University Health Network, Toronto Faculty/Presenter Disclosure Relationships
Appendix 1. Sensitivity analysis for ACQ: missing value analysis by multiple imputation
 Appendix 1 Sensitivity analysis for ACQ: missing value analysis by multiple imputation A sensitivity analysis was carried out on the primary outcome measure (ACQ) using multiple imputation (MI). MI is
VARIATION IN MEASUREMENT OF HIV RNA VIRAL LOAD
 VARIATION IN MEASUREMENT OF HIV RNA VIRAL LOAD SOURCES OF VARIATION (RANDOM VS SYSTEMATIC) MAGNITUDE OF EACH SOURCE CONSEQUENCES FOR CONFIDENCE LIMITS AROUND MEASUREMENTS AND CHANGES DATA FROM ROCHE HIV
Chapter 11: Advanced Remedial Measures. Weighted Least Squares (WLS)
") Chapter : Advanced Remedial Measures Weighted Least Squares (WLS) When the error variance appears nonconstant, a transformation (of Y and/or X) is a quick remedy. But it may not solve the problem, or it
Chapter : Advanced Remedial Measures Weighted Least Squares (WLS) When the error variance appears nonconstant, a transformation (of Y and/or X) is a quick remedy. But it may not solve the problem, or it
Practical Aspects of Standardisation for a Global Controls Manufacturer
 Practical Aspects of Standardisation for a Global Controls Manufacturer MRSA SoGAT Clinical Diagnostic Meeting NIBSC, UK June 25, 2008 Frank Opdam PhD, AcroMetrix Standardisation A fundamental goal of
The use of QCMD proficiency testing panels in clinical virology.
 The use of QCMD proficiency testing panels in clinical virology. Prof.dr. Bert Niesters Department of Medical Microbiology Division of Clinical Virology UMC Groningen Disease Disease Management Viral Load
Political Science 15, Winter 2014 Final Review
 Political Science 15, Winter 2014 Final Review The major topics covered in class are listed below. You should also take a look at the readings listed on the class website. Studying Politics Scientifically
State Estimation: Particle Filter
 State Estimation: Particle Filter Daniel Seliger HAUPT-/ BACHELOR- SEMINAR ADAPTIVE 28.06.2012 SYSTEME PST PROF. DR. WIRSING 14. JUNI 2009 VORNAME NAME Overview 1. Repitition: Bayesian Filtering 2. Particle
Measurement Error in Nonlinear Models
 Measurement Error in Nonlinear Models R.J. CARROLL Professor of Statistics Texas A&M University, USA D. RUPPERT Professor of Operations Research and Industrial Engineering Cornell University, USA and L.A.
CMV DNA Quantification Using an Automated Platform for Nucleic Acid Extraction and Real- time PCR Assay Set-up
 JCM Accepts, published online ahead of print on 11 May 2011 J. Clin. Microbiol. doi:10.1128/jcm.00721-11 Copyright 2011, American Society for Microbiology and/or the Listed Authors/Institutions. All Rights
The Koester Equation: The Quantification of. Progress Lost in a Data Set. By Stefan Wolfgang Koester.
 The Koester Equation: The Quantification of Progress Lost in a Data Set By Stefan Wolfgang Koester stefanwkoester@gmail.com ORCID #: 0000-0003-1156-4090 1. Introduction According to Samprit Chatterjee
INTRODUCTION TO ECONOMETRICS (EC212)
") INTRODUCTION TO ECONOMETRICS (EC212) Course duration: 54 hours lecture and class time (Over three weeks) LSE Teaching Department: Department of Economics Lead Faculty (session two): Dr Taisuke Otsu and
INTRODUCTION TO ECONOMETRICS (EC212) Course duration: 54 hours lecture and class time (Over three weeks) LSE Teaching Department: Department of Economics Lead Faculty (session two): Dr Taisuke Otsu and
BRONX COMMUNITY COLLEGE LIBRARY SUGGESTED FOR MTH 01 FUNDAMENTAL CONCEPTS & SKILLS IN ARITHMETIC & ALGEBRA
 BRONX COMMUNITY COLLEGE LIBRARY SUGGESTED FOR MTH 01 FUNDAMENTAL CONCEPTS & SKILLS IN ARITHMETIC & ALGEBRA Textbook: Publisher: Developmental Mathematics, 4th edition by Johnson, Willis, and Hughes Addison
External Quality Assessment Programmes (EQAPs) for blood-borne viruses: the Italian experience
 for blood-borne viruses: the Italian experience") External Quality Assessment Programmes (EQAPs) for blood-borne viruses: the Italian experience Giulio Pisani Biologicals Unit CRIVIB, ISS, Rome SOGAT XXII 14 th 15 th April 2011 - Istituto Superiore di
External Quality Assessment Programmes (EQAPs) for blood-borne viruses: the Italian experience Giulio Pisani Biologicals Unit CRIVIB, ISS, Rome SOGAT XXII 14 th 15 th April 2011 - Istituto Superiore di
HIV Viral Load Quality Assessment Program Summary for Panel HIVVL 2018Oct26
 1 National Laboratory for HIV Reference Services National HIV and Retrovirology Laboratories National Microbiology Laboratory Public Health Agency of Canada HIV Viral Load Quality Assessment Program Summary
Lab 2: Investigating Variation Across Spatial Scales
 Lab 2: Investigating Variation Across Spatial Scales What are scales and variation in a biological context? The world around us displays incredible diversity across many scales. Today s lab investigates
4. Model evaluation & selection
 Foundations of Machine Learning CentraleSupélec Fall 2017 4. Model evaluation & selection Chloé-Agathe Azencot Centre for Computational Biology, Mines ParisTech chloe-agathe.azencott@mines-paristech.fr
Introduction: Table/Figure Descriptions:
 Introduction: We have completed the analysis of your HIV RNA Validation Study. The validation plan was designed to verify the installation of an unmodified FDA-approved HIV RNA assay into your laboratory.
BOOTSTRAPPING CONFIDENCE LEVELS FOR HYPOTHESES ABOUT REGRESSION MODELS
 BOOTSTRAPPING CONFIDENCE LEVELS FOR HYPOTHESES ABOUT REGRESSION MODELS 17 December 2009 Michael Wood University of Portsmouth Business School SBS Department, Richmond Building Portland Street, Portsmouth
CRITERIA FOR USE. A GRAPHICAL EXPLANATION OF BI-VARIATE (2 VARIABLE) REGRESSION ANALYSISSys
 REGRESSION ANALYSISSys") Multiple Regression Analysis 1 CRITERIA FOR USE Multiple regression analysis is used to test the effects of n independent (predictor) variables on a single dependent (criterion) variable. Regression tests
Multiple Regression Analysis 1 CRITERIA FOR USE Multiple regression analysis is used to test the effects of n independent (predictor) variables on a single dependent (criterion) variable. Regression tests
Results & Statistics: Description and Correlation. I. Scales of Measurement A Review
 Results & Statistics: Description and Correlation The description and presentation of results involves a number of topics. These include scales of measurement, descriptive statistics used to summarize
HIV Viral Load Quality Assessment Program Summary for Panel HIVVL 2017Oct27
 1 The National Laboratory for HIV Reference Services is Accredited to ISO 15189 and ISO 17043 National Laboratory for HIV Reference Services National HIV and Retrovirology Laboratories National Microbiology
Score Tests of Normality in Bivariate Probit Models
 Score Tests of Normality in Bivariate Probit Models Anthony Murphy Nuffield College, Oxford OX1 1NF, UK Abstract: A relatively simple and convenient score test of normality in the bivariate probit model
Mathematical-Statistical Modeling to Inform the Design of HIV Treatment Strategies and Clinical Trials
 Mathematical-Statistical Modeling to Inform the Design of HIV Treatment Strategies and Clinical Trials Marie Davidian and H.T. Banks North Carolina State University Eric S. Rosenberg Massachusetts General
Reading Questions. ChE 436
 Reading Questions ChE 436 PPC, Ch. 1 Competencies - What are the 2 level-three competencies listed for the Process Control class? (These are also on the ChE 436 web page). 1.1 Many of the products from
Combining Risks from Several Tumors Using Markov Chain Monte Carlo
 University of Nebraska - Lincoln DigitalCommons@University of Nebraska - Lincoln U.S. Environmental Protection Agency Papers U.S. Environmental Protection Agency 2009 Combining Risks from Several Tumors
In this module I provide a few illustrations of options within lavaan for handling various situations.
 In this module I provide a few illustrations of options within lavaan for handling various situations. An appropriate citation for this material is Yves Rosseel (2012). lavaan: An R Package for Structural
Kidane Tesfu Habtemariam, MASTAT, Principle of Stat Data Analysis Project work
 1 1. INTRODUCTION Food label tells the extent of calories contained in the food package. The number tells you the amount of energy in the food. People pay attention to calories because if you eat more
Numerical Integration of Bivariate Gaussian Distribution
 Numerical Integration of Bivariate Gaussian Distribution S. H. Derakhshan and C. V. Deutsch The bivariate normal distribution arises in many geostatistical applications as most geostatistical techniques
Development of a NIST Standard Reference Material for Cytomegalovirus
 Development of a NIST Standard Reference Material for Cytomegalovirus Marcia Holden, Ross Haynes, Margaret Kline, John Butler (with help from David Duewer (NIST) and Steve Ellison (LGC)) Group, Biochemical
Fifteen years of molecular EQA: progress and challenges
 Fifteen years of molecular EQA: progress and challenges Anton M van Loon 1, Stuart West 2 and Paul Wallace 2 1 Department of Virology, UMC Utrecht, The Netherlands 2 QCMD, Glasgow, Scotland Key Issues
How much data is enough? Predicting how accuracy varies with training data size
 How much data is enough? Predicting how accuracy varies with training data size Mark Johnson (with Dat Quoc Nguyen) Macquarie University Sydney, Australia September 4, 2017 1 / 33 Outline Introduction
THE INDIRECT EFFECT IN MULTIPLE MEDIATORS MODEL BY STRUCTURAL EQUATION MODELING ABSTRACT
 European Journal of Business, Economics and Accountancy Vol. 4, No. 3, 016 ISSN 056-6018 THE INDIRECT EFFECT IN MULTIPLE MEDIATORS MODEL BY STRUCTURAL EQUATION MODELING Li-Ju Chen Department of Business
MTH 225: Introductory Statistics
 Marshall University College of Science Mathematics Department MTH 225: Introductory Statistics Course catalog description Basic probability, descriptive statistics, fundamental statistical inference procedures
Week 17 and 21 Comparing two assays and Measurement of Uncertainty Explain tools used to compare the performance of two assays, including
 Week 17 and 21 Comparing two assays and Measurement of Uncertainty 2.4.1.4. Explain tools used to compare the performance of two assays, including 2.4.1.4.1. Linear regression 2.4.1.4.2. Bland-Altman plots
Section on Survey Research Methods JSM 2009
 Missing Data and Complex Samples: The Impact of Listwise Deletion vs. Subpopulation Analysis on Statistical Bias and Hypothesis Test Results when Data are MCAR and MAR Bethany A. Bell, Jeffrey D. Kromrey
Correlated to: ACT College Readiness Standards Science (High School)
") ACT College Readiness Science Score Range - 1-12 Students who score in the 1 12 range are most likely beginning to develop the knowledge and skills assessed in the other score ranges. locate data in simple
ACT College Readiness Science Score Range - 1-12 Students who score in the 1 12 range are most likely beginning to develop the knowledge and skills assessed in the other score ranges. locate data in simple
Hemostasis Test Validation, Performance and Reference Intervals
 Hemostasis Test Validation, Performance and Reference Intervals Richard A. Marlar, Ph.D. Pathology and Laboratory Medicine Oklahoma City VA Medical Center University of Oklahoma Health Sciences Center
Stability of native, lyophilized and inactivated standards
 Stability of native, lyophilized and inactivated standards Harry van Drimmelen Bio Quality Control, Heiloo, Netherlands Satellite Meeting before IPFA-PEI 25 th Workshop Twenty-five Years Standardization
Simple Linear Regression the model, estimation and testing
 Simple Linear Regression the model, estimation and testing Lecture No. 05 Example 1 A production manager has compared the dexterity test scores of five assembly-line employees with their hourly productivity.
A Comparison of Variance Estimates for Schools and Students Using Taylor Series and Replicate Weighting
 A Comparison of Variance Estimates for Schools and Students Using and Replicate Weighting Peter H. Siegel, James R. Chromy, Ellen Scheib RTI International Abstract Variance estimation is an important issue
COMMITTEE FOR MEDICINAL PRODUCTS FOR HUMAN USE (CHMP)
") European Medicines Agency Pre-authorisation Evaluation of Medicines for Human Use London, 21 September 2006 EMEA/CHMP/BWP/298390/2005 COMMITTEE FOR MEDICINAL PRODUCTS FOR HUMAN USE (CHMP) GUIDELINE ON
European Medicines Agency Pre-authorisation Evaluation of Medicines for Human Use London, 21 September 2006 EMEA/CHMP/BWP/298390/2005 COMMITTEE FOR MEDICINAL PRODUCTS FOR HUMAN USE (CHMP) GUIDELINE ON
Pitfalls in Linear Regression Analysis
 Pitfalls in Linear Regression Analysis Due to the widespread availability of spreadsheet and statistical software for disposal, many of us do not really have a good understanding of how to use regression
A Brief Introduction to Bayesian Statistics
 A Brief Introduction to Statistics David Kaplan Department of Educational Psychology Methods for Social Policy Research and, Washington, DC 2017 1 / 37 The Reverend Thomas Bayes, 1701 1761 2 / 37 Pierre-Simon
Technical Bulletin No. 161
 CPAL Central Pennsylvania Alliance Laboratory Technical Bulletin No. 161 cobas 6800 HIV-1 Viral Load Assay - New Platform - June 1, 2017 Contact: Heather Habig, MLS (ASCP) CM, MB CM, 717-851-1422 Operations
Method Comparison for Interrater Reliability of an Image Processing Technique in Epilepsy Subjects
 22nd International Congress on Modelling and Simulation, Hobart, Tasmania, Australia, 3 to 8 December 2017 mssanz.org.au/modsim2017 Method Comparison for Interrater Reliability of an Image Processing Technique
Introduction to Statistical Data Analysis I
 Introduction to Statistical Data Analysis I JULY 2011 Afsaneh Yazdani Preface What is Statistics? Preface What is Statistics? Science of: designing studies or experiments, collecting data Summarizing/modeling/analyzing
Statistical techniques to evaluate the agreement degree of medicine measurements
 Statistical techniques to evaluate the agreement degree of medicine measurements Luís M. Grilo 1, Helena L. Grilo 2, António de Oliveira 3 1 lgrilo@ipt.pt, Mathematics Department, Polytechnic Institute
Mathematical-Statistical Modeling to Inform the Design of HIV Treatment Strategies and Clinical Trials
 Mathematical-Statistical Modeling to Inform the Design of HIV Treatment Strategies and Clinical Trials 2007 FDA/Industry Statistics Workshop Marie Davidian Department of Statistics North Carolina State
Research Methods in Forest Sciences: Learning Diary. Yoko Lu December Research process
 Research Methods in Forest Sciences: Learning Diary Yoko Lu 285122 9 December 2016 1. Research process It is important to pursue and apply knowledge and understand the world under both natural and social
GUIDE TO THE EVALUATION OF COMMUTABILITY OF CONTROL MATERIALS
 GUIDE TO THE EVALUATION OF COMMUTABILITY OF CONTROL MATERIALS Ferruccio Ceriotti Servizio di Medicina di Laboratorio, Ospedale San Raffaele, Milano F. Ceriotti, Milano, 27-11-2015 2 Preamble Most of the
Bias in regression coefficient estimates when assumptions for handling missing data are violated: a simulation study
 STATISTICAL METHODS Epidemiology Biostatistics and Public Health - 2016, Volume 13, Number 1 Bias in regression coefficient estimates when assumptions for handling missing data are violated: a simulation
ANOVA in SPSS (Practical)
") ANOVA in SPSS (Practical) Analysis of Variance practical In this practical we will investigate how we model the influence of a categorical predictor on a continuous response. Centre for Multilevel Modelling
ANOVA in SPSS (Practical) Analysis of Variance practical In this practical we will investigate how we model the influence of a categorical predictor on a continuous response. Centre for Multilevel Modelling
Bayes Linear Statistics. Theory and Methods
 Bayes Linear Statistics Theory and Methods Michael Goldstein and David Wooff Durham University, UK BICENTENNI AL BICENTENNIAL Contents r Preface xvii 1 The Bayes linear approach 1 1.1 Combining beliefs
METHOD VALIDATION: WHY, HOW AND WHEN?
 METHOD VALIDATION: WHY, HOW AND WHEN? Linear-Data Plotter a,b s y/x,r Regression Statistics mean SD,CV Distribution Statistics Comparison Plot Histogram Plot SD Calculator Bias SD Diff t Paired t-test
Use of Viral Load Testing in Managing CMV Infections in SOTR
 Use of Viral Load Testing in Managing CMV Infections in SOTR Angela M. Caliendo, MD, PhD, FIDSA Professor and Vice Chair, Medicine Alpert Medical School of Brown University Providence, RI Disclosures Scientific
Sample Sizes for Predictive Regression Models and Their Relationship to Correlation Coefficients
 Sample Sizes for Predictive Regression Models and Their Relationship to Correlation Coefficients Gregory T. Knofczynski Abstract This article provides recommended minimum sample sizes for multiple linear
Find the slope of the line that goes through the given points. 1) (-9, -68) and (8, 51) 1)
 (-9, -68) and (8, 51) 1)") Math 125 Semester Review Problems Name Find the slope of the line that goes through the given points. 1) (-9, -68) and (8, 51) 1) Solve the inequality. Graph the solution set, and state the solution set
Math 125 Semester Review Problems Name Find the slope of the line that goes through the given points. 1) (-9, -68) and (8, 51) 1) Solve the inequality. Graph the solution set, and state the solution set
Accuracy of Range Restriction Correction with Multiple Imputation in Small and Moderate Samples: A Simulation Study
 A peer-reviewed electronic journal. Copyright is retained by the first or sole author, who grants right of first publication to Practical Assessment, Research & Evaluation. Permission is granted to distribute
VQA Control SOP Version 4.0 Roche Amplicor HIV-1 DNA Test, v August 2007
 1. PRINCIPLE 1.1. The Virology Quality Assurance (VQA) Laboratory provides external cell pellet controls for use in the validation of assays that detect HIV proviral DNA. 1.2. HIV seronegative peripheral
Psychology Research Process
 Psychology Research Process Logical Processes Induction Observation/Association/Using Correlation Trying to assess, through observation of a large group/sample, what is associated with what? Examples:
Meta-analysis of diagnostic test accuracy studies with multiple & missing thresholds
 Meta-analysis of diagnostic test accuracy studies with multiple & missing thresholds Richard D. Riley School of Health and Population Sciences, & School of Mathematics, University of Birmingham Collaborators:
Chunyang Ding. A Sweet Conclusion: Comparing the Osmotic Potentials of Yams and Sweet Potatoes. 2 October Mr. Allen. AP/IB Biology P.
 Chunyang Ding A Sweet Conclusion: Comparing the Osmotic Potentials of Yams and Sweet Potatoes 2 October 2013 Mr. Allen AP/IB Biology P.3 Ding 2 Data Collection: Yam Raw Data: Raw Masses of Yams (±0.01
Data harmonization tutorial:teaser for FH2019
 Data harmonization tutorial:teaser for FH2019 Alden Gross, Johns Hopkins Rich Jones, Brown University Friday Harbor Tahoe 22 Aug. 2018 1 / 50 Outline Outline What is harmonization? Approach Prestatistical
bivariate analysis: The statistical analysis of the relationship between two variables.
 bivariate analysis: The statistical analysis of the relationship between two variables. cell frequency: The number of cases in a cell of a cross-tabulation (contingency table). chi-square (χ 2 ) test for
Results of the College of American Pathologists (CAP) Proficiency Program for CMV, EBV, and BKV Viral Load Testing
 Proficiency Program for CMV, EBV, and BKV Viral Load Testing") 2009 College of American Pathologists. The College does not permit reproduction of any substantial portion of the material in this Report without its written authorization. The College hereby authorizes
2009 College of American Pathologists. The College does not permit reproduction of any substantial portion of the material in this Report without its written authorization. The College hereby authorizes
LAB ASSIGNMENT 4 INFERENCES FOR NUMERICAL DATA. Comparison of Cancer Survival*
 LAB ASSIGNMENT 4 1 INFERENCES FOR NUMERICAL DATA In this lab assignment, you will analyze the data from a study to compare survival times of patients of both genders with different primary cancers. First,
BOOTSTRAPPING CONFIDENCE LEVELS FOR HYPOTHESES ABOUT QUADRATIC (U-SHAPED) REGRESSION MODELS
 REGRESSION MODELS") BOOTSTRAPPING CONFIDENCE LEVELS FOR HYPOTHESES ABOUT QUADRATIC (U-SHAPED) REGRESSION MODELS 12 June 2012 Michael Wood University of Portsmouth Business School SBS Department, Richmond Building Portland
BOOTSTRAPPING CONFIDENCE LEVELS FOR HYPOTHESES ABOUT QUADRATIC (U-SHAPED) REGRESSION MODELS 12 June 2012 Michael Wood University of Portsmouth Business School SBS Department, Richmond Building Portland
investigate. educate. inform.
 investigate. educate. inform. Research Design What drives your research design? The battle between Qualitative and Quantitative is over Think before you leap What SHOULD drive your research design. Advanced
Investigating the robustness of the nonparametric Levene test with more than two groups
 Psicológica (2014), 35, 361-383. Investigating the robustness of the nonparametric Levene test with more than two groups David W. Nordstokke * and S. Mitchell Colp University of Calgary, Canada Testing
B19 Virus EQA Programme Final Report QAV (B19DNA14)
") B19 Virus 2014 EQA Programme Final Report QAV034116 (B19DNA14) Prof. Hubert GM Niesters Scientific Expert on behalf of QCMD Report authorised by the QCMD Executive in July 2014 A UKAS accredited proficiency
B19 Virus 2014 EQA Programme Final Report QAV034116 (B19DNA14) Prof. Hubert GM Niesters Scientific Expert on behalf of QCMD Report authorised by the QCMD Executive in July 2014 A UKAS accredited proficiency
Bayesian and Frequentist Approaches
 Bayesian and Frequentist Approaches G. Jogesh Babu Penn State University http://sites.stat.psu.edu/ babu http://astrostatistics.psu.edu All models are wrong But some are useful George E. P. Box (son-in-law
Validity. Ch. 5: Validity. Griggs v. Duke Power - 2. Griggs v. Duke Power (1971)
") Ch. 5: Validity Validity History Griggs v. Duke Power Ricci vs. DeStefano Defining Validity Aspects of Validity Face Validity Content Validity Criterion Validity Construct Validity Reliability vs. Validity
Ch. 5: Validity Validity History Griggs v. Duke Power Ricci vs. DeStefano Defining Validity Aspects of Validity Face Validity Content Validity Criterion Validity Construct Validity Reliability vs. Validity
Motivation Empirical models Data and methodology Results Discussion. University of York. University of York
 Healthcare Cost Regressions: Going Beyond the Mean to Estimate the Full Distribution A. M. Jones 1 J. Lomas 2 N. Rice 1,2 1 Department of Economics and Related Studies University of York 2 Centre for Health
Sample size and power calculations in Mendelian randomization with a single instrumental variable and a binary outcome
 Sample size and power calculations in Mendelian randomization with a single instrumental variable and a binary outcome Stephen Burgess July 10, 2013 Abstract Background: Sample size calculations are an
MCAS Equating Research Report: An Investigation of FCIP-1, FCIP-2, and Stocking and. Lord Equating Methods 1,2
 MCAS Equating Research Report: An Investigation of FCIP-1, FCIP-2, and Stocking and Lord Equating Methods 1,2 Lisa A. Keller, Ronald K. Hambleton, Pauline Parker, Jenna Copella University of Massachusetts
Polymer Technology Systems, Inc. CardioChek PA Comparison Study
 Polymer Technology Systems, Inc. CardioChek PA Comparison Study Evaluation Protocol: Accuracy Precision Clinical Correlation PTS Panels Lipid Panel Test Strips For Use in Comparisons to a Reference Laboratory
Estimating Reliability in Primary Research. Michael T. Brannick. University of South Florida
 Estimating Reliability 1 Running Head: ESTIMATING RELIABILITY Estimating Reliability in Primary Research Michael T. Brannick University of South Florida Paper presented in S. Morris (Chair) Advances in
MBios 478: Systems Biology and Bayesian Networks, 27 [Dr. Wyrick] Slide #1. Lecture 27: Systems Biology and Bayesian Networks
![MBios 478: Systems Biology and Bayesian Networks, 27 [Dr. Wyrick] Slide #1. Lecture 27: Systems Biology and Bayesian Networks](/thumbs/80/82116384.jpg "MBios 478: Systems Biology and Bayesian Networks, 27 [Dr. Wyrick] Slide #1. Lecture 27: Systems Biology and Bayesian Networks") MBios 478: Systems Biology and Bayesian Networks, 27 [Dr. Wyrick] Slide #1 Lecture 27: Systems Biology and Bayesian Networks Systems Biology and Regulatory Networks o Definitions o Network motifs o Examples
MBios 478: Systems Biology and Bayesian Networks, 27 [Dr. Wyrick] Slide #1 Lecture 27: Systems Biology and Bayesian Networks Systems Biology and Regulatory Networks o Definitions o Network motifs o Examples
Analysis of Environmental Data Conceptual Foundations: En viro n m e n tal Data
 Analysis of Environmental Data Conceptual Foundations: En viro n m e n tal Data 1. Purpose of data collection...................................................... 2 2. Samples and populations.......................................................
Molecular diagnosis of infectious disease - Method validation and environmental setting 傳染病的分子診斷 - 方法確認與環境背景. WC Yam 任永昌
 Molecular diagnosis of infectious disease - Method validation and environmental setting 傳染病的分子診斷 - 方法確認與環境背景 WC Yam 任永昌 Dept of Microbiology Queen Mary Hospital The University of Hong Kong Clinical and
JSM Survey Research Methods Section
 Methods and Issues in Trimming Extreme Weights in Sample Surveys Frank Potter and Yuhong Zheng Mathematica Policy Research, P.O. Box 393, Princeton, NJ 08543 Abstract In survey sampling practice, unequal
Technical Bulletin No. 162
 CPAL Central Pennsylvania Alliance Laboratory Technical Bulletin No. 162 cobas 6800 HCV Viral Load Assay - New Platform - June 1, 2017 Contact: Heather Habig, MLS (ASCP) CM, MB CM, 717-851-1422 Operations
Bayesian Analysis by Simulation
 408 Resampling: The New Statistics CHAPTER 25 Bayesian Analysis by Simulation Simple Decision Problems Fundamental Problems In Statistical Practice Problems Based On Normal And Other Distributions Conclusion
How Does Analysis of Competing Hypotheses (ACH) Improve Intelligence Analysis?
 Improve Intelligence Analysis?") How Does Analysis of Competing Hypotheses (ACH) Improve Intelligence Analysis? Richards J. Heuer, Jr. Version 1.2, October 16, 2005 This document is from a collection of works by Richards J. Heuer, Jr.
How Does Analysis of Competing Hypotheses (ACH) Improve Intelligence Analysis? Richards J. Heuer, Jr. Version 1.2, October 16, 2005 This document is from a collection of works by Richards J. Heuer, Jr.
Panther has new prey
 Raising the Bar for Performance Testing Panther has new prey The Aptima HIV-1 Quant Dx assay leads the hunt for HIV-1 diagnosis and viral load monitoring. Freedom to work the way you choose Run what assays
Statistical analysis of comparative data on composition and agronomic characteristics: new software tool and recurring issues identified
 Statistical analysis of comparative data on composition and agronomic characteristics: new software tool and recurring issues identified C. Paoletti*, J. Perry and H. Broll* * EFSA GMO Unit; EFSA GMO Panel
A novel approach to estimation of the time to biomarker threshold: Applications to HIV
 A novel approach to estimation of the time to biomarker threshold: Applications to HIV Pharmaceutical Statistics, Volume 15, Issue 6, Pages 541-549, November/December 2016 PSI Journal Club 22 March 2017
How many speakers? How many tokens?:
 1 NWAV 38- Ottawa, Canada 23/10/09 How many speakers? How many tokens?: A methodological contribution to the study of variation. Jorge Aguilar-Sánchez University of Wisconsin-La Crosse 2 Sample size in
EXECUTIVE SUMMARY DATA AND PROBLEM
 EXECUTIVE SUMMARY Every morning, almost half of Americans start the day with a bowl of cereal, but choosing the right healthy breakfast is not always easy. Consumer Reports is therefore calculated by an
VQA HIV DNA Control SOP Version 5.0 HIV DNA Testing 13 March 2012
 1. PRINCIPLE 1.1. The Virology Quality Assurance (VQA) Laboratory provides external cell pellet controls for use in the validation of assays that detect HIV proviral DNA. 1.2. HIV seronegative peripheral
Y90 SIRT Therapy Dosimetric Aspects
 Y90 SIRT Therapy Dosimetric Aspects David Chee-Eng Ng MBBS, BSc, MSc, MRCP, FAMS, FRCP (Edin) Head and Senior Consultant, Department of Nuclear Medicine and PET Singapore General Hospital Adjunct Assistant
DKK-1 ELISA, Cat.No. BI For the quantitative determination of DKK-1 in human serum
 DKK-1 ELISA, Cat.No. BI-20413 For the quantitative determination of DKK-1 in human serum ASSAY CHARACTERISTICS Method Standard range Conversion factor Sample volume / well Incubation time, temp. Sensitivity
Kelvin Chan Feb 10, 2015
 Underestimation of Variance of Predicted Mean Health Utilities Derived from Multi- Attribute Utility Instruments: The Use of Multiple Imputation as a Potential Solution. Kelvin Chan Feb 10, 2015 Outline
Psychology Research Process
 Psychology Research Process Logical Processes Induction Observation/Association/Using Correlation Trying to assess, through observation of a large group/sample, what is associated with what? Examples:
Review of Veterinary Epidemiologic Research by Dohoo, Martin, and Stryhn
 The Stata Journal (2004) 4, Number 1, pp. 89 92 Review of Veterinary Epidemiologic Research by Dohoo, Martin, and Stryhn Laurent Audigé AO Foundation laurent.audige@aofoundation.org Abstract. The new book
An Empirical Assessment of Bivariate Methods for Meta-analysis of Test Accuracy
 Number XX An Empirical Assessment of Bivariate Methods for Meta-analysis of Test Accuracy Prepared for: Agency for Healthcare Research and Quality U.S. Department of Health and Human Services 54 Gaither
NOMOGRAM FOR THE QUICK GRAPHIC ESTIMATION OF FATNESS
 NOMOGRAM FOR THE QUICK GRAPHIC ESTIMATION OF FATNESS LIVIU DRAGOMIRESCU Abstract The paper presents a nomogram built for the quick determination of a subject s class of fatness. There are used here only
QUALITY CONTROL for MOLECULAR DIAGNOSTICS Quality issues highlighted through international external quality assessment
 QUALITY CONTROL for MOLECULAR DIAGNOSTICS Quality issues highlighted through international external quality assessment William G MacKay PhD Neutral Office Coordinator QCMD The Altum Building, Todd Campus
Cytomegalovirus (CMV) Viral Load in Bronchoalveolar Lavage Fluid (BALF) and Plasma to Diagnose Lung Transplant Associated CMV Pneumonia
 Viral Load in Bronchoalveolar Lavage Fluid (BALF) and Plasma to Diagnose Lung Transplant Associated CMV Pneumonia") Cytomegalovirus (CMV) Viral Load in Bronchoalveolar Lavage Fluid (BALF) and Plasma to Diagnose Lung Transplant Associated CMV Pneumonia I.P. Lodding 1,2, H.H. Schultz 3, J.U. Jensen 1,5, C. Andersen 4,
Cytomegalovirus (CMV) Viral Load in Bronchoalveolar Lavage Fluid (BALF) and Plasma to Diagnose Lung Transplant Associated CMV Pneumonia I.P. Lodding 1,2, H.H. Schultz 3, J.U. Jensen 1,5, C. Andersen 4,