Questions. Developing and Working with Survival Data. Developing and Working with Survival Data 6/2/11. NAACCR Webinar Series 1
|
|
|
- Bethanie Curtis
- 6 years ago
- Views:
Transcription


1 Developing and Working with Survival Data NAACCR Webinar Series Questions Fabulous Prizes! Question of the Month! The participant that submits the best question of the session will receive a fabulous Prize! Tip of the Month! The participant that sends in the best tip related to the topic will win a spectacular prize! NAACCR Webinar Series 1
2 Agenda Overview Need for death clearance Survival and NDI Data quality Break SEER*Prep; SEER Stat Survival issues: NAACCR 2011 Closing remarks Survival statistics, and surviving statistics! An overview and update about cancer survival rates June 2, 2011 Dr. Donna Turner, Epidemiologist Provincial Director, Population Oncology Cancer Care Manitoba Dr Hannah Weir, Epidemiologist Division of Cancer Prevention and Control Centers for Disease Prevention and Control The findings and conclusions in this presentation are those of the presenter and do not necessarily represent the official position of the Centers for Disease Control and Prevention. Overview The evolution of population-based cancer survival EUROCARE and CONCORD studies Cancer Control in the UK and Canada Useful websites NAACCR Webinar Series 2
3 Clinical vs. Population-based Survival Clinical trials - highest achievable survival Patient focus How long do I have, doc? Clinical focus Value of one treatment vs. another Population - survival achieved Impact of cancer control initiatives (across the spectrum of initiatives) Targeting and monitoring cancer control initiatives Policy-setting Effectiveness of healthcare delivery - standard measure of cancer system performance Population-based Cancer Survival Why are there variations in cancer survival? * Timely diagnosis and good prognosis Stage of cancer at diagnosis Screening (availability, access and participation) Diagnostic access Public s awareness of cancer symptoms Types of cancer/disease diagnosed (aggressive variants Appropriate treatment Equitable access to treatment Implementation of best practices (use of practice guidelines) Organization of treatment services (timeliness, smooth transition) Access to healthcare (insurance) and human and financial resources * Adapted from Coleman MP: Opinion: why the variation in breast cancer survival in Europe? [commentary]. Population-based Cancer Survival Crude survival: how many individuals diagnosed with cancer are alive after five years? endpoint is death from any cause Both Cause Specific and Relative are a way of comparing survival of Cause-specific survival: people who have cancer with how many individuals diagnosed with those cancer who have don t not died they specifically shows of cancer after xx years? how much cancer shortens life endpoint is death from cancer only Relative survival: compares the survival experience of individuals with cancer to individuals without cancer (of the same age, race, gender, etc.) * measure excess mortality among cancer patients endpoint is death from any cause * Life tables NAACCR Webinar Series 3
4 Advantages and Disadvantage of Relative vs. Cause Specific Survival Relative Advantage Relies on fact of death not cause of death Enables estimation of avoidable deaths (excess mortality) Disadvantages Life tables may not be available for all populations Cause Specific Not limited to populations with life tables Death Certificates are not reliable (e.g., site of mets or recur) Population-based Survival - Focus on Relative Survival (Example) Suppose that in a jurisdiction far, far away Five-year survival is 60% for women aged diagnosed with breast cancer but Five-year survival is only 80% for women in general then Relative survival is 60% / 80% or 75%. Additional advantages of Relative Survival * Answers the question how much is [my/my patient s] survival decreased as a result of a cancer diagnosis? speaks directly to excess mortality among cancer patients 1 Adjusts for increasing background mortality in a population accounts for the fact that our risk of death increases as we age, whether we have cancer or not Adjusts for differences in background mortality between populations allows assessment of differences in cancer survival between populations that might have large variations in mortality generally 2 (e.g.. racial/ethnic differences, international comparison, etc.) * Adapted from Rachet B, Woods LM, Mitry E, Riga M, Cooper N, Quinn MJ, Steward J, Brenner H, Estève J, Sullivan R, Coleman MP. Cancer survival in England and Wales at the end of the 20 th century. Br J Cancer 2008; 99, S2 S10. 1 Estève J, Benhamou E, Croasdale M, Raymond L. Relative survival and the estimation of net survival: elements for further discussion. Stat Med. 1990;9: Micheli A, Baili P, Mugno E, Queen M, Capocaccia R, Grosclaude PC,EUROCARE Working Group. Life expectancy and cancer survival in the EUROCARE-3 cancer registry areas. Ann Oncol 2003; 14(Suppl 5): NAACCR Webinar Series 4
5 Relative survival: cohort and period approaches The basic cohort method 1-3 Uses everyone diagnosed with cancer in the past, who has had sufficient follow up time Traditional approach to survival statistics; reflect the survival expectations of patients diagnosed many years ago (i.e., everyone in the cohort must have had five years of follow up) 1 Berkson J, Gage RP. Calculation of survival rates for cancer. Proc Staff Meet Mayo Clinic 1950;25: Cutler SJ, Ederer F. Maximum utilisation of the life table method in analyzing survival. J Chron Dis 1958;8: Ederer F, Axtell LM, Cutler SJ. The relative survival: a statistical methodology. Natl Cancer Inst Monogr 1961;6: Relative survival: cohort and period approaches The Period approach 1 - Provides more up-to-date estimates of longterm survival rates, incorporates the survival experience of recently diagnosed cases into the analysis. e.g., 5-year survival for people diagnosed , with follow-up to the end of year estimate will include the 1-year survival experience of people diagnosed in year estimate will include the survival experience for people diagnosed in year estimate will include follow-up,. And so on. 1 Brenner H, Gefeller O. An alternative approach to monitoring cancer patient survival. Cancer 1996;78: Relative survival estimates: still evolving One primary or multiple primaries SEER vs. IARC rules for multiple primaries NAACCR Webinar Series 5
 studies The Canadian Strategy for Cancer Control: a cancer plan for Canada Canadian Partnership")
6 A Tale of Two Studies, Two Countries and Action Plans EUROCARE Studies U.K. - NHS Cancer Plan International Benchmarking Study CONCORD Study High Resolution (Patterns of-care) studies The Canadian Strategy for Cancer Control: a cancer plan for Canada Canadian Partnership Against Cancer (CPAC) C-SPAN EUROpean CAncer REgistry-based study on survival and care of cancer patients Initiated in Italy (1989) Istituto Nazionale Tumori (Milan)/Istituto Superiore di Sanità (Rome) 12 population-based (European) cancer registries Versions EUROCARE-1 ( ) EUROCARE-2 ( ) EUROCARE-3 ( ) EUROCARE-4 ( ) EUROCARE-5 ( ) Now includes 93 population-based registries in 23 European countries Objective of EUROCARE-5: To update the existing EUROCARE data bank by including data of patients diagnosed up to Follow up will be updated to the most recent possible dates in order to analyze both long and short term survival rates of cases diagnosed more recently. NAACCR Webinar Series 6


7 EUROCARE: Findings Survival for most solid tumours (breast, colorectal, stomach, cutaneous melanoma) was: highest in Finland, Sweden, Norway and Iceland lower in the UK and Denmark lowest in the Czech Republic, Poland and Slovenia Countries with higher expenditure on health generally had best survival (exceptions: Denmark and UK) Survival for Europe lower than for the US for nearly all cancers Sant M, Allemani C, Santaquilani M, Knijn A, Marchesi F, Capocaccia R, and the EUROCARE Working Group. EUROCARE-4. Survival of cancer patients diagnosed in Results and commentary. Eur J Cancer 2009,45: If the survival rates among the poorest matched those among the richest in England and Wales, 12,700 untimely deaths could have been prevented amongst those diagnosed between 1986 and Challenging cancer, Dept of Health, May 1999 NAACCR Webinar Series 7
 5- year Relative Survival Gatta G, Capocaccia R,")

8 EUROCARE vs. US (SEER) 5- year Relative Survival Gatta G, Capocaccia R, Coleman M, Reis L, et al. Toward a Comparison of Survival in American and European Cancer Patients. Cancer 2000 l89(4): NAACCR Webinar Series 8
 - prostate cancer, (15-99 years)")
 NAACCR 2010-2011 Webinar Series 9")
9 US Paradox High Survival Rates Worldwide. 5-year relative survival (%) - prostate cancer, (15-99 years) US Paradox High Survival Rates Worldwide. 5-year relative survival (%) - female breast cancer, (15-99 years) NAACCR Webinar Series 9


 in US by")
10 But Large and Consistent Racial Disparities. 5-year relative survival (%) - female breast cancer, (15-99 years) in US by race NAACCR Webinar Series 10


11 NAACCR Webinar Series 11
12 Interesting cancer survival websites (check it out) EUROCARE: Paul Dickman ( (Sweden) International Agency for Research on Cancer (IARC) UK Cancer Survival Group: SEER: Statistics Canada: Canadian Partnership Against Cancer: Portal: CancerViewCanada: Death Clearance Key Component to Developing Survival Statistics Objectives Describe Death Clearance Function of Death Clearance Importance to Survival Analysis References NAACCR Webinar Series 12
13 Death Clearance Process Identify Death to Cancer Patients Link to Mortality Files Update Vital Status Identify Missed Cases Unreported Patient Unreported Multiple Primary Follow Back Unlinked Cancers Confirmation of Condition Residence at Diagnosis Case Details Death Clearance in Canada Local (provincial) death clearance National Statistics Canada Example: Saskatchewan Death Clearance NAACCR Webinar Series 13
14 Why Death Clearance Originally developed by NCI-SEER Avoid unnecessary patient follow up Establish vital status Identify unreported cancer cases Critical to Survival Statistics Key for Active and for Passive Follow Up Reduce follow up cost for active follow up Substitute for active follow up if passive Must combine with NDI, SSDI or other Identifies biased group of unreported case Without death clearance will overstate survival What about Cancer Types for. Death Certificate First Cases? Site Cases Death 1st % Death 1st Female Breast 86,206 2, Prostate 82,084 2, Colorectal 56,366 4, Lung 74,045 15, Pancreas 11,278 3, Esophagus 5, Michigan Resident Cases Diagnosed between Death certificate first is a case first identified through death clearance. What about Stage at Diagnosis? Late Stage Site All Cases Death 1st Female Breast Prostate Colorectal Lung Pancreas Esophagus Michigan resident cases diagnosed between 1994 and 2003 with regional or distant stage at diagnosis NAACCR Webinar Series 14
15 What about..demographics? Percent Death Certificate 1 st by age and Race Site Percent by Age 65 and Younger Over 65* Percent by Race Black White Female Breast Prostate Colorectal Lung Pancreas Esophagus * Over 75 for prostate cancers Michigan resident cases diagnosed between 1994 and 2003 Death Clearance is Required Required by NPCR Required by NCI/SEER NAACCR Standard Requirement Necessary for NAACCR Certification Completed within 23 months Death Clearance is Required NAACCR Standard I.B.9 Must Be able to perform mortality linkage Have adequate staff for follow back Should Establish formal agreement with vital records Track progress and results Follow back on potential multiples Provide quality control feedback Identify case-finding issues NAACCR Webinar Series 15
16 What have you done when you are done? Confirmed Vital Status Nearly all deceased patients 97% of Deaths to Cases in Michigan Provide vital status updates to reporters Acquired Critical Missed Cases Poor Prognosis Tend to be Older Geographically Biased Assured Most Accurate Surviv Prompt improved reporting of clinical diagnoses References NAACCR Death Clearance Manual NAACCR Standards Vol. 3 pp SEER Data Management System Chapter 17 Best Practices for Developing and Working with Survival Data: NDI Linkages: What they are and why they matter. Monique Hernandez, PhD Chris Johnson, MPH Brad Wohler, MS NAACCR Webinar Series 16

17 Outline Brief overview of NDI linkages. For more detailed information, see Examples of impact of NDI linkages on populationbased survival measures. CONCORD Florida Cancer Data System NDI Linkage and Survival Project Accuracy of Cancer Mortality Study California, Colorado, Idaho 49 Thanks! Lyn Almon, Georgia Comprehensive Cancer Registry Chris Johnson, Cancer Data Registry of Idaho Robert Bilgrad, National Death Index Glenn Copeland, Michigan Cancer Surveillance Program Monique Hernandez, Florida Cancer Data System Colleen McLaughlin, New York State Cancer Registry Hannah Weir, Centers for Disease Control and Prevention Brad Wohler, Florida Cancer Data System 50 National Death Index The National Death Index (NDI) is a centralized registry maintained by the National Center for Health Statistics of all deaths that have occurred in the United States, Puerto Rico, and the Virgin Islands since NAACCR Webinar Series 17
18 National Death Index - Purpose Identifies deceased study subjects Provides the following: dates of death states of death death certificate numbers 52 National Death Index - Coverage All 50 states, District of Columbia, NYC, Puerto Rico, & Virgin Islands 65 million NDI records All deaths from deaths expected July NDI PLUS Implemented in 1997 Provides researchers with Underlying cause of death codes Multiple cause codes ICD-9 and ICD-10 codes 54 NAACCR Webinar Series 18
19 Death Clearance Safety Net Late cases Cancer registry Vital Statistics Missed cases Out of state 55 National Death Index - Process Select candidate records for submission to NDI unknown vital status Run EDITS, Inter-Record Edits Cut file using NPCR Extract utility Complete forms and submit them with data <NDI processes file> Receive results from NDI Process results using SAS algorithm available from NPCR docserver Manual review component Update central registry database with NDI results Data sharing with other states 56 Indirect CONCORD Florida ACM Evidence 57 NAACCR Webinar Series 19

20 Indirect Evidence 58 Indirect Evidence From , 12 states had at least 5% of their population migrate in from another state or abroad. 59 Indirect Evidence Americans very mobile May change residence state after dx Don t always die in their state of residence. Death missed during death ascertainment event count for survival calculations (numerator) increase in follow-up time (denominator). 60 NAACCR Webinar Series 20

21 CONCORD Cancer survival in five continents: a world-wide population-based study British Columbia, Manitoba, Nova Scotia, Ontario, Saskatchewan California, Colorado, Connecticut, Florida, Georgia - Atlanta SEER, Hawaii, Idaho, Iowa, Louisiana, Michigan, Nebraska, New Jersey, New Mexico, New York, Rhode Island, Utah, Washington - Seattle SEER, Wyoming In the U.S., NDI linkages were required. NDI Plus not conducted no cause of death information, so data not useful for cause-specific survival. 61 CONCORD NDI Results (Partial) 62 CONCORD States submitted some cases above and beyond those sites required for the CONCORD study. In both Idaho and Florida, about 25% of the total NDI matches were among in-state deaths. In Florida, 12% of total NDI matches were NY deaths. In Idaho, 28% of total NDI matches were WA deaths. 63 NAACCR Webinar Series 21

22 Evidence From CONCORD 64 Florida Cancer Data System NDI Linkage and Survival Analysis Project ,115,558 records submitted to NDI 65 FCDS NDI Linkage and Survival Analysis Project: Review NDI Results Bottom Line Vital status changed to deceased = 125,648 patients Affecting 147,211 tumors Death clearance safety net = 9,854 Remaining 115,794 died out of state FL VS does not re-release info on FL residents who died out of state 66 NAACCR Webinar Series 22
 dead at end of 2005 POST NDI: 1,201,666 (59.")
23 FCDS NDI Linkage and Survival Analysis Project: Kaplan-Meier Survival Curve Median survival time: The time at which exactly half of the population has survived 19 years 11 years Pre Post FCDS NDI Linkage and Survival Analysis Project there were 2,020,387 people DX with >= 1 tumor in FL PRE NDI: 1,076,018 (53.5%) dead at end of 2005 POST NDI: 1,201,666 (59.5%) dead at end of 2005 Number of Deaths by Year FCDS NDI Linkage and Survival Analysis Project: Percent Patient Survival Pre and Post at Time T in Years Site with most impact: lung and bronchus cancer Site with least impact: Breast cancer Greater than 5% difference NAACCR Webinar Series 23
24 Accuracy of Cancer Mortality Study What it is? California, Colorado, Idaho The Impact of National Death Index Linkages on Population-Based Cancer Survival Rates. A separate data collection effort merged cancer registry data to the National Death Index (NDI) to find deaths that occurred out of state and to obtain cause-of-death information for these deaths. State vital statistics linked deaths were thus augmented with linkages to the National Death Index (NDI). 70 Accuracy of Cancer Mortality Study The Impact of National Death Index Linkages on Population-Based Cancer Survival Rates We investigated the impact on 5-year cancer survival rates of performing the NDI linkage component of the ACM study cases with linkages to state vital statistics and NDI through 2004 Measured the impact of NDI linkages on cause-specific and relative cancer survival statistics. 71 Accuracy of Cancer Mortality Study Impact of NDI Linkages on Survival Statistics Two datasets created: One dataset included deaths ascertained through state vital records linkages augmented with deaths ascertained through NDI linkages. The second dataset included only deaths ascertained through state vital records linkages; all NDI deaths were censored at the end of the study period (vital status alive as of Dec 31, 2004), as if the NDI linkages had not been performed. 72 NAACCR Webinar Series 24
25 ACM - Impact of NDI Linkages on Survival Statistics 5-Year Relative Survival 73 ACM - Impact of NDI Linkages on Survival Statistics 5-Year Cause-Specific Survival, Narrow Definition 74 ACM - Impact of NDI Linkages on Survival Statistics 5-Year Cause-Specific Survival, Broad Definition 75 NAACCR Webinar Series 25
26 Conclusions Annual linkage of central cancer registry data with NDI data is highly recommended. Death clearance safety net Access to info on state residents who die out of state Access to info on cases who move out of state after dx Fee support via CDC or NCI The benefits of NDI linkage include improved followup for more accurate survival statistics 76 Thanks! Lyn Almon, Georgia Comprehensive Cancer Registry Chris Johnson, Cancer Data Registry of Idaho Robert Bilgrad, National Death Index Glenn Copeland, Michigan Cancer Surveillance Program Monique Hernandez, Florida Cancer Data System Colleen McLaughlin, New York State Cancer Registry Hannah Weir, Centers for Disease Control and Prevention Brad Wohler, Florida Cancer Data System 77 Best Practices for Developing and Working with Survival Data: Data Quality for Survival Analysis Contributors/Presenters: Katherine Fradette, Deborah Hurley, Hannah Weir, Donna Turner NAACCR Webinar Series 26
27 Data Quality for Survival: Two Main Considerations 1. The quality of information about the cases Missing, incomplete or poor quality reporting of cases can lead to a biased picture of survival 2. The quality of the death data Missing, incomplete or poor quality reporting of death information can also lead to a biased picture of survival (usually over-estimation) Input Quality Affects Output Quality For each regional registry included in analysis, the quality and comprehensiveness of information about cases and deaths is of primary importance Type of follow-back Routine data quality checks and clean-up Coding Rules Death related information Type of Follow-Back: Sources Active follow-back (medical records) Cancer Registry Initiated Contact physician or reporting hospital National, State or Province data exchange agreements Hospital/Physician Office Initiated Data sharing agreement with CCR or VR Passive follow-back (data linkages) Regional Vital Records National Death Index (US only) Social Security Death Index (US only) Canadian National Death Clearance (Canada only) NAACCR Webinar Series 27
28 Data Quality Checks and Clean-Up Data linkage quality control Manual review NDI SAS utility program Other data linkages Voter registration Health insurance data Hospital discharge data Government offices (motor vehicle, public safety, taxes, etc.) Edits NAACR/SEER/NPCR edit set Survival-specific edit set Coding Rules ICD coded diagnoses and COD are preferable Different jurisdictions sometime use slightly different rules for coding multiple primary cancers Prior to analysis and quality assessment, registry data can be transformed to a common rule structure for consistency (e.g., the International Agency for Research in Cancer (IARC) rules) Death Related Information Updated vital status Date of death (or date last seen) Complete dates are preferable (MDY) Accurate and complete COD information Non-missing COD preferable ICD coded COD preferable Primary & underlying COD information preferable NAACCR Webinar Series 28
29 Incomplete Date Information If complete dates are not available, imputation solutions can be used to produce an estimated survival time Example: C-SPAN mean imputation method Used in the case of missing month or day of death (or diagnosis) A SAS algorithm written by Larry Ellison at Statistics Canada returns an imputed a mean survival time Incomplete Dates: Mean Survival Imputation An exact interval SAS macro with the imputation algorithm is available at: bcontent/cspan_intervalmacro.sas The imputed value is a function of all potential values and the likelihood of their occurrence If either the diagnosis year or the death year is unknown then the survival is undefined If the month is missing from a date value then the day is also assumed to be missing Incomplete Dates: Mean Survival Imputation Example 1: If only the day of death is missing: If diagnosis and death month and year are the same Imputed survival time is equal to half of the time between the date of diagnosis and the last day of the month of death If diagnosis and death month and/or year are different Imputed survival time is equal to the middle of the month of death (the 15th or 16th, depending on the month) minus the date of diagnosis NAACCR Webinar Series 29
30 Incomplete Dates: Mean Survival Imputation Example 2: If the month and day of death are missing: If diagnosis and death year are the same Imputed survival time is equal to half of the time between the date of diagnosis and the last day of the year of death (December 31st) If diagnosis and death year are different Imputed survival time is equal to the middle of the year of death (July 2nd) minus the date of diagnosis Final Data Quality for Survival Analysis Final data quality must be specially appraised before survival is calculated using protocols designed to highlight potential areas of error or bias To provide a picture of data quality in the survival context, make an inventory of ineligible, eligible and excluded records Ineligible Records Following international protocols, criteria for ineligibility may include: Basal and squamous cell skin cancers Adolescent bone cancers In situ cancers (with the exception of in situ bladder) Tumours of benign or uncertain behaviour NAACCR Webinar Series 30
31 Age (<15 and >99 years at diagnosis) Unknown vital status Unknown sex Sex-site incompatibility Unknown year of birth, diagnosis or death Invalid sequences of dates Excluded Records Following international protocols, criteria for exclusion may include: Records where the diagnosis method was autopsy and the survival time was zero Records where the diagnosis method was death certificate only (DCO) In the case of first primary tumour analyses, second or subsequent tumours Quality Assessment of Included Records To ensure completeness of the included records, a data quality assessment might involve enumerating: Microscopically confirmed records Records with missing month or day of birth, diagnosis, or death Records where the diagnosis method is autopsy but survival time is greater than zero Records where survival time is zero but diagnosis method is not DCO or autopsy (considered a true zero survival time ) Reporting Quality Information To provide a comprehensive picture of data quality for survival analysis, the following might be provided by jurisdiction, site, diagnosis period and sex, where applicable: Percentage of ineligible and excluded records A description of completeness of the records retained in survival analyses after exclusions Percentage of all primary records included in survival analyses Percentage of patients where the attained age of the patient was 100 at the end of the study period NAACCR Webinar Series 31
32 The Cancer Survival and Prevalence Analytic Network (C-SPAN) Experience Primary data source: The Canadian Cancer Registry (CCR), housed at Statistics Canada A collaboration among Canadian provincial and territorial cancer registries and Statistics Canada Regular data quality edits, de-duplication and death clearance at a national level augment local level efforts Funding provided by: The Canadian Partnership Against Cancer Data Quality Results Overall, potential quality threats were minimal as measured by the quality protocol for survival analysis just presented C-SPAN s rates of DCOs, missing demographic or date information, and microscopic confirmation are remarkably similar to those arising from international studies that have set high quality data standards Inter-Provincial Differences Quality considerations highlighted that higher-level system (inter-provincial) differences must also be considered Consistent with previous analyses, Quebec s data were excluded from analyses due to differences in cancer registration practices and issues in determining vital status for Quebec cases in the CCR Until recently, the Newfoundland and Labrador (NL) Cancer Registry did not receive information on all death certificates that mentioned cancer Since the situation was recently resolved, NL data were included in analyses and interpreted with caution (consistent with national protocol) NAACCR Webinar Series 32
33 Data Quality Results There were 1,600,722 cancer records registered between 1992 and 2006, representing 1,565,425 cancer patients 6.1% of the registered records were ineligible, mostly in situ neoplasms, reflecting variations in registry practices - some provinces do not register non-invasive tumours Only 2.6% of all eligible patients were excluded and inclusion rates by site were high: Lung Colorectal Breast Prostate 96.6% 98.2% 99.3% 99.1% Data Quality Results 88.7% of included records were microscopically confirmed. Rates varied by site: Lung Colorectal Breast Prostate 96.6% 98.2% 99.3% 99.1% Most other indicators of potential quality issues showed low rates of occurrence, particularly for missing or questionable death date-related information A Need to Protect Confidentiality To reduce disclosure risk and maintain confidentiality: Percentages were categorized in most cases Any cell count less than 6 and greater than 0 was suppressed One area of particular disclosure risk involved the Territories Required heavy suppression due to small numbers These regional data are only presented in select cases NAACCR Webinar Series 33
34 Best Practices for Developing and Working with Survival Data: Using SEER*Prep and SEER*Stat to calculate survival statistics. Chris Johnson, MPH Epidemiologist Cancer Data Registry of Idaho Outline The presentation will follow from a NAACCR V12 layout through using SEER*Prep to create a SEER*Stat database, then the calculation of survival statistics in SEER*Stat. Brief overview of what needs to be done to prepare data for use in SEER*Prep and SEER*Stat. Examples of calculations of more commonly used survival statistics, i.e., observed, relative. 101 What is SEER*Stat? SEER*Stat is a statistical package created for the analysis of SEER and other cancer databases. It was developed by Information Management Services, Inc. in consultation with the SEER Program of the National Cancer Institute (NCI). The SEER*Stat statistical software provides a convenient, intuitive mechanism for the analysis of SEER and other cancer-related databases. It is a powerful PC tool to view individual cancer records and to produce statistics for studying the impact of cancer on a population. 102 NAACCR Webinar Series 34


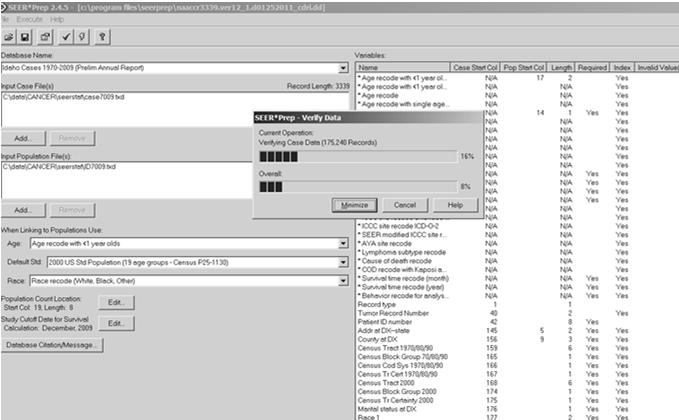
35 What is SEER*Prep? SEER*Prep software converts ASCII text data files to the SEER*Stat database format, allowing you to analyze your cancer data using SEER*Stat. SEER*Prep performs two main functions: it converts text data to the specific binary format required by SEER*Stat, and it creates the SEER*Stat data dictionary. 103 How to obtain SEER*Prep software How to obtain SEER*Stat software NAACCR Webinar Series 35

 and NAACCR Item 38")
36 How to access the SEER Research Data Create a NAACCR V12 Incidence file 1. Query your database for state/provincial residents diagnosed over the range of years you have completed death clearance/follow-up activities/(ndi linkages for U.S.). e.g. NAACCR Item Min Max 390 bbbb ID ID others? 2. Sort the query result by NAACCR Item 20 (Patient ID Number) and NAACCR Item 380 (Sequence Number Central). 3. Export a NAACCR V12 Incidence (3339 column width) file for the queried cases with a.txd file extension. 107 Use SEER*Prep to create a SEER*Stat dataset 108 NAACCR Webinar Series 36


37 Use SEER*Prep to create a SEER*Stat dataset 109 Use SEER*Prep to create a SEER*Stat dataset 110 Use SEER*Prep to create a SEER*Stat dataset 111 NAACCR Webinar Series 37

.")
38 Use SEER*Prep to create a SEER*Stat dataset 112 Using SEER*Stat for survival analysis 113 Population-based Cancer Survival Statistics Overview Cancer survival is the proportion of patients alive at some point subsequent to the diagnosis of their cancer, or from some point post-diagnosis (conditional survival). It is represented as the probability of a group of patients "surviving" a specified amount of time (e.g. 3 years, 5 years, 20 years). (Source: NCI NAACCR Webinar Series 38
39 Types of survival statistics available in SEER*Stat Observed Survival Estimate of the probability of surviving all causes of death. Net Survival (policy-based statistic) - The probability of surviving cancer in the absence of other causes of death. It is a measure that is not influenced by changes in mortality from other causes and, therefore, provides a useful measure for tracking survival across time, and comparisons between racial/ethnic groups or between registries. Conditional Survival Given survival to some number of years, what is the probability of surviving some additional number of years. Crude Probability of Death (patient prognosis measure) - The probability of dying of cancer in the presence of other causes of death. Survival Case Listing 115 Approaches to estimation of cancer-specific survival There are two ways to estimate Net Cancer-Specific Survival: using cause of death information or using expected survival tables. 116 Net cancer-specific survival Cause-specific survival Estimates are calculated by specifying the cause of death. Individuals who die of causes other than those specified are considered to be censored. Relative survival Uses population life tables to estimate expected survival. Relative survival is defined as the ratio of the proportion of observed survivors (all causes of death) in a cohort of cancer patients to the proportion of expected survivors in a comparable cohort of cancer-free individuals. Assumes independent competing causes of death. Since a cohort of cancer-free individuals is difficult to obtain, we use expected life tables and assume that the cancer deaths are a negligible proportion of all deaths. 117 NAACCR Webinar Series 39
40 Overview of SEER*Stat SEER*Stat allows you a great deal of freedom to request the cancer statistics/values/methods you want for your analysis. Part 1: Session Part 2: Execute Part 3: Matrix 118 Overview of SEER*Stat Part 1: Session The analysis is set up in the session window. Each session consists of tabs on which you select the database subset, statistics, and appearance of your output matrix. You should work through each tab in order from left to right and from top to bottom to ensure that all options have been considered. However, changes can be made in any order. It is possible to work on multiple sessions simultaneously. 119 Part 2: Execute Overview of SEER*Stat Once the session is set up, you are ready to execute it as a job. While the job is executing, you can change the session or begin a new one without affecting the original job. It is possible to execute more than one job at a time. 120 NAACCR Webinar Series 40


41 Part 3: Matrix Overview of SEER*Stat When the job has finished executing, the output matrix you requested is displayed. You can change the appearance of the output matrix, print it, copy it to the Windows clipboard, and/or export the statistics/values so they may be used in another application. 121 Dataset used for SEER*Stat examples 122 SEER*Stat Survival Session Table tab 123 NAACCR Webinar Series 41


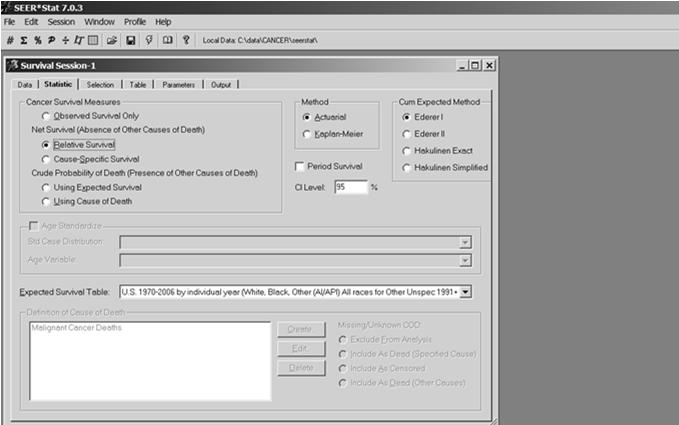
42 SEER*Stat Survival Session Parameters tab 124 SEER*Stat Survival Session Output tab 125 SEER*Stat Survival Session Statistics tab 126 NAACCR Webinar Series 42
 method 128 Example 2: Cause-specific survival using the actuarial (life table) method 129 NAACCR 2010-2011 Webinar")
43 Example 1: Observed and Relative Survival using the actuarial (life table) method 127 Example 2: Cause-specific survival using the actuarial (life table) method 128 Example 2: Cause-specific survival using the actuarial (life table) method 129 NAACCR Webinar Series 43


44 Example 3: Cause-specific survival using the actuarial method, melanoma of the skin deaths 130 Survival Proportion Calculations Five-year survival is calculated as the product of the conditional probabilities for surviving each single year interval. S 5yr = S 1yr * S 2yr 1yr * S 3yr 2yr * S 4yr 3yr * S 5yr 4yr 131 Cohort versus Period survival Survival estimates from cancer registry data are usually dated measures of current-year survival, because of the time needed to observe survival and lag between available data and the current year. There are different approaches of grouping survival experience with respect to year of diagnosis and follow-up to obtain more up-todate estimates of patients recently diagnosed. 132 NAACCR Webinar Series 44


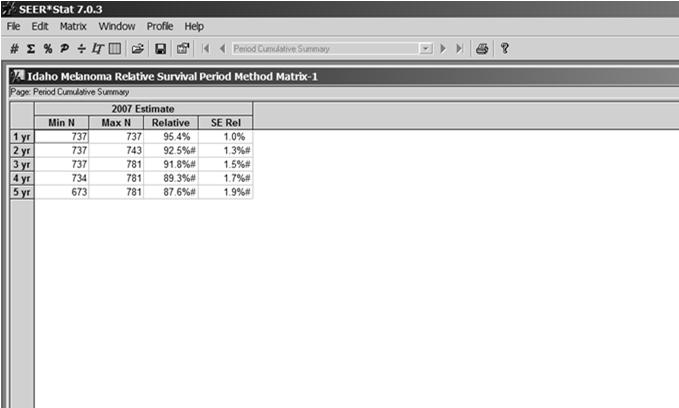
45 Example 4: Relative survival using the actuarial method; Period Survival 133 Example 4: Relative survival using the actuarial method; Period Survival 134 Example 4: Relative survival using the actuarial method; Period Survival 135 NAACCR Webinar Series 45
46 Comparison of common population-based survival methods 136 Conclusions: SEER*Stat Advantages of SEER*Stat over other statistical tools: Simple to use GUI Facilitates comparisons with SEER data Can paste results into other Windows programs SEER/NCI is responsible for keeping it updated and standardized Well supported by IMS 137 Summary Using SEER*Prep and SEER*Stat to calculate survival statistics. The presentation followed a NAACCR V12 layout through SEER*Prep to create a SEER*Stat database, then demonstrated the calculation of survival statistics in SEER*Stat. Brief overview of what needs to be done to prepare data for use in SEER*Prep and SEER*Stat. Examples of calculations of more commonly used survival statistics, i.e., observed, relative. 138 NAACCR Webinar Series 46
47 Some issues related to survival. Hannah Weir, PhD Trevor Thompson, BS Division of Cancer Prevention and Control Centers for Disease Prevention and Control The findings and conclusions in this presentation are those of the presenters and do not necessarily represent the official position of the Centers for Disease Control and Prevention. LIFE TABLES 140 General mortality varies by area Life expectancy at birth - all races, Cancer Registry areas e 0 Male e 0 Female Hawaii Utah Iowa Connecticut California Wyoming New Mexico USA NAACCR Webinar Series 47
48 General mortality varies by calendar year (principally in male population) 142 CONCORD Study - Relative Survival using two LTs Characteristic Patient example NCHS LT* CONCORD LT SEX Male Male Male RACE Black Black Black YEAR AREA Utah US Utah * US Census Life expectancy at birth in 1990 all races Male Female CONCORD NCHS CONCORD NCHS California Connecticut Hawaii Iowa New Mexico Utah Wyoming NAACCR Webinar Series 48
49 What do we expect in relative survival? WE KNOW THAT: General mortality varies in the period ( ) principally in male population General mortality varies by geographical area Hawaii is the area with major differences in comparison with the USA (also in female population) Using CONCORD life tables versus US Census (NCHS) life tables in relative survival estimates WE EXPECT THAT: Major differences will be present in male cancer sites Hawaii cancer relative survival estimates will have major differences 145 Areas 5-yr crude relative survival Male colorectal cancer - all races # Cases NCHS LT (1) CONCORD LT (2) Difference (2) (1) California 30, % 61.1% - 1.9% Connecticut 4, % 61.5% - 2.1% Hawaii 1, % 65.7% - 3.9% Iowa 4, % 60.1% - 1.5% New Mexico 1, % 59.0% - 1.9% Utah 1, % 61.4% - 3.1% Wyoming % 56.7% - 1.0% yr crude relative survival Female colorectal cancer- all races Areas # Cases NCHS LT (1) CONCORD LT (2) Difference (2) (1) California 29, % 61.0% - 0.7% Connecticut 4, % 61.6% - 1.4% Hawaii 1, % 66.2% - 2.3% Iowa 4, % 64.4% - 1.7% New Mexico 1, % 60.7% - 1.2% Utah 1, % 59.6% - 0.9% Wyoming % 58.6% - 0.5% 147 NAACCR Webinar Series 49
50 5-yr crude relative survival Female breast cancer- all races Areas # Cases NCHS LT (1) CONCORD LT (2) Difference (2) (1) California 82, % 85.8% - 0.5% Connecticut 11, % 85.1% - 1.1% Hawaii 2, % 89.5% - 1.7% Iowa 9, % 86.3% - 1.5% New Mexico 3, % 84.6% - 0.9% Utah 3, % 85.3% - 1.0% Wyoming 1, % 83.9% - 0.4% yr crude relative survival Male prostate cancer - all races Areas # Cases NCHS LT (1) CONCORD LT (2) Difference (2) (1) California 91, % 93.5% - 3.4% Connecticut 11, % 92.8% - 3.6% Hawaii 3, % 94.1% - 5.8% Iowa 10, % 92.8% - 2.4% New Mexico 5, % 93.2% - 3.4% Utah 5, % 94.2% - 5.0% Wyoming 1, % 93.9% - 2.0% 149 Recent updates to SEER*Stat (V 7.0.4) US LT available for individual years by gender and race (All, W, B and O) NAACCR Webinar Series 50
51 Cancer cause specific survival - an alternatives to relative survival when life tables not availalbe LT matched to cancer patients according to risk factors (age, calendar period, geographic area and race/ethnicity) - SES, smoking status, etc. RS can underestimate or overestimate the actual survival experience when there is a mismatch between the LT and cancer patient cohort (e.g., tobacco related cancers) Howlader et al, 2010 published broader definition of caused related death variable. Age Standardized Survival Estimates 152 Age-Standardized Survival Estimates Survival generally depends on age Age distribution among cancer patients may vary across comparison groups Standardization is needed to remove the confounding effect of age when comparing survival estimates Which standard population should be used? NAACCR Webinar Series 51
52 Commonly Used Standards Internal site-specific age distribution of a study Derived from observed age distribution of a specific cancer patient population International Cancer Survival Standards (ICSS) standard populations Set of general standard cancer patient populations developed from the EUROCARE-2 study ICSS Standard Populations Consists of three standard populations describing the main age patterns of cancer incidence 1. Increasing with age (91.1% of EUROCARE-2 patients) 2. Generally constant with age (7.4%) Nasopharynx, soft tissues, melanoma, cervix uteri, brain, thyroid, bone 3. Primarily affecting young adults (1.5%) Testis, Hodgkin s disease, acute lymphatic leukemia Which Standard to Use? Site-specific Has the desirable property that age-standardized survival estimates are generally close to the crude survival estimates Does not allow comparisons across sites Does not allow comparisons across studies if internal standards are used NAACCR Webinar Series 52
53 Which Standard to Use? ICSS Standardized survival estimates can differ from crude results Allows for comparisons with other sites that use the same standard Allows for comparisons with other studies using ICSS weights Example Comparison of Standards Table 1. 5-Year Relative Survival Estimates by Cancer Site, SEER Site N Crude Relative Age-Adjusted* Site Survival (95% CI) Specific (95% CI) Age-Adjusted ICCC (95% CI) Colorectal 118, ( ) 64.3 ( ) 64.9 ( ) Female Breast 172, ( ) 89.4 ( ) 89.7 ( ) Prostate 190, ( ) 99.1 ( ) 98.7 ( ) Thyroid 20, ( ) 95.8 ( ) 93.9 ( ) Melanoma 42, ( ) 90.6 ( ) 91.3 ( ) Cervix 12, ( ) 69.8 ( ) 65.5 ( ) Testis 7, ( ) 95.2 ( ) 90.4 ( ) Hodgkin Lymphoma 7, ( ) 80.2 ( ) 80.0 ( ) * Age-standardized to the site-specific age distribution of the USCS. Age-standardized to the appropriate ICSS standard. Software Considerations SEER*STAT currently does not perform agestandardization of relative survival estimates This may be included in future versions Age-specific relative survival estimates can be calculated in SEER*STAT and exported to other packages for standardization R and Stata code are available for calculating agestandardized survival estimates and confidence intervals NAACCR Webinar Series 53
54 The multiple primaries issue One person can have many cancers. Becoming more common scenario as survivorship from cancer increases. Multiple primary rules differ (IARC vs. SEER/Canadian) Survival statistics have traditionally focused on first primary but this doesn t include all the information available. EUROCARE now including ALL cancers diagnosed. Reference Baili P, Micheli A, De Angelis R, Weir HK, Francisci S, Santaquilani M, Hakulinen T, Quaresma M, Coleman MP, CONCORD Working Group. Life tables for world-wide comparison of relative survival for cancer (CONCORD study). Tumori ; Howlader N, Ries LA, Mariotto AB, Reichman ME, Ruhl J, Cronin KA. Improved estimates of cancer-specific survival rates from population-based data. J Natl Cancer Inst Oct 20;102(20): Corazziari I, Quinn MJ, Capocaccia R. Standard cancer patient population for age standardizing survival ratios. Eur J Cancer 2004; 40: Brenner H, Hakulinen T. Patients with previous cancer should not be excluded in international comparative cancer survival studies. Int J Cancer 2007;121: Rosso S, De Angelis R, Ciccolallo L, Carrani E, Soerjomataram I, Grande E, Zigon G, Brenner H, and the EUROCARE Working Group. Multiple tumours in survival estimates. Eur J Cancer 2009,45: Ellison LF. Measuring the effect of including multiple cancers in survival analyses using data from the Canadian Cancer Registry. Cancer Epidemiol Oct;34(5): Micheli A, Baili P, Mugno E, Queen M, Capocaccia R, Grosclaude PC, EUROCARE Working Group. Life expectancy and cancer survival in the EUROCARE-3 cancer registry areas. Ann Oncol 2003;14(Suppl 5): Conclusion NAACCR Webinar Series 54
55 Overview and Use of Population-based Survival Data Population-based survival monitors the effectiveness of health care delivery - cancer control and health policy Adding survival data enhances the registry Canada and NCI/SEER routinely produce these data NPCR is now expanding capacity: Currently 26 NCPR/SEER registries link to NDI (62% population coverage) 83% coverage with additional 10 interested registries 14 registries??? NAACCR Survival Workgroup is addressing issues related to the collection, analysis and interpretation of survival data 2011 NAACCR conference plenary address by Prof Michel Coleman, PI CONCORD (-2) Study Need for Death Clearance Routine DC helps with case ascertainment and provides information on vital status (~97% of deaths MI) NDI and impact on survival data Supplements DC to provide info on ~99% deaths (L Alom) Deaths out of state /residence out of state Identifies duplicate cases (NY-FL dual residences issue, etc.) Most deaths found through DC but NDI still critical NPCR-NDI umbrella application NDI linkage at no additional cost to NPCR/SEER registries Tools available to help with NDI output NAACCR Webinar Series 55
56 Data Quality Issues Complete case ascertainment and death ascertainment very important* Data quality indicators Confidentiality issues related to complete date variables Age is needed for LT Survival interval immediately following diagnosis - impact on long term survival and measures of excess mortality related to treatment Errors vs. non errors Patients with zero survival time??? * Johnson CJ, Weir HK, Yin D, Niu X. Assessment of the impact of variation in patient follow-up on survival statistics using synthetic datasets based on SEER data. JRM 2010: 37(3): Tools for calculating survival statistics SEER*Prep and SEER*Stat are powerful tools, freely available from NCI/IMS for use in calculating survival data. Other stat programs are available for more complex analyses (websites listed) Tools are there but some of the supporting data may be lacking In US, availability of State and race/ethnic specific LT is limited Cause of death for cause specific survival is not consistent Work Remains!!!! Dual residence issue Multiple primary rules Data quality incomplete vs. suppressed or tweaked data Quality of cause of death information on DC Availability of supporting information (LT) Choice of standard NAACCR Webinar Series 56
57 Eventually we will get to here.. Nationwide coverage of high quality and complete population-based cancer survival data available for cancer control, health policy and research use. Questions? Complete Case Identification and Ascertainment 7/7/11 Joyce Jones CoC trained Independent Cancer Program Consultant Coming up July 7, 2011 Complete Case Identification and Ascertainment Presented by Joyce Jones CoC trained Independent Cancer Program Consultant August 4, 2011 NAACCR Interoperability Activities and the Electronic Health Record Presented by NAACCR Path Data Workgroup NAACCR Webinar Series 57
58 NAACCR Webinar Series Registration is open! s.aspx NAACCR Webinar Series 58
NAACCR Data Quality Indicators
 NAACCR Data Quality Indicators NAACCR 2011 2012 Webinar Series June 14, 2012 Q&A Please submit all questions concerning webinar content through the Q&A panel. Reminder: If you have participants watching
CONCORD Programme: Worldwide Surveillance of Cancer Survival. The US Perspective
 CONCORD Programme: Worldwide Surveillance of Cancer Survival The US Perspective Hannah K Weir, PhD Division of Cancer Prevention and Control Centers for Disease Control and Prevention Overview Cancer Surveillance
An Overview of Survival Statistics in SEER*Stat
 An Overview of Survival Statistics in SEER*Stat National Cancer Institute SEER Program SEER s mission is to provide information on cancer statistics in an effort to reduce the burden of cancer among the
Construction of a North American Cancer Survival Index to Measure Progress of Cancer Control Efforts
 Construction of a North American Cancer Survival Index to Measure Progress of Cancer Control Efforts Chris Johnson, Cancer Data Registry of Idaho NAACCR 2016 Annual Conference June 14, 2016 Concurrent
Extract from Cancer survival in Europe by country and age: results of EUROCARE-5 a population-based study
 EUROCARE-5 on-line database Data and methods Extract from Cancer survival in Europe 1999 2007 by country and age: results of EUROCARE-5 a population-based study De Angelis R, Sant M, Coleman MP, Francisci
PREVIEW OF REGISTRY-SPECIFIC AND AGGREGATED RELATIVE SURVIVAL ESTIMATES IN CANCER IN NORTH AMERICA
 PREVIEW OF REGISTRY-SPECIFIC AND AGGREGATED RELATIVE SURVIVAL ESTIMATES IN CANCER IN NORTH AMERICA CINA SURVIVAL Authors: Chris Johnson, Deborah Hurley, Angela Mariotto, Reda Wilson, Donna Turner, Hannah
7/11/2011. The impact of cancer survival studies on health policy. NCI prevention budget falls. Cases Deaths Survivors
 The impact of cancer survival studies on health policy North American Association of Central Cancer Registries Louisville KY, 21 June 2011 NCI prevention budget falls Cancer burden set to rise Cases Deaths
Methodology for the Survival Estimates
 Methodology for the Survival Estimates Inclusion/Exclusion Criteria Cancer cases are classified according to the International Classification of Diseases for Oncology - Third Edition (ICDO-3) Disease sites
Presentation for DHSS 14 September Senior Statistician
 Presentation for DHSS 14 September 2014 Jeannette Jackson-Thompson, MSPH, PhD Director Chester Schmaltz, PhD Senior Statistician Missouri Cancer Registry and Research Center (MCR-ARC) University of Missouri
Downloaded from:
 Coleman, MP; Quaresma, M; Butler, J; Rachet, B (2011) Cancer survival in Australia, Canada, Denmark, Norway, Sweden, and the UK Reply. Lancet, 377 (9772). pp. 1149-1150. ISSN 0140-6736 Downloaded from:
Cancer survival and prevalence in Tasmania
 Cancer survival and prevalence in Tasmania 1978-2008 Cancer survival and prevalence in Tasmania 1978-2008 Tasmanian Cancer Registry University of Tasmania Menzies Research Institute Tasmania 17 Liverpool
Period estimates of cancer patient survival are more up-to-date than complete estimates even at comparable levels of precision
 Journal of Clinical Epidemiology 59 (2006) 570 575 ORIGINAL ARTICLES Period estimates of cancer patient survival are more up-to-date than estimates even at comparable levels of precision Hermann Brenner
Downloaded from:
 Rachet, B; Coleman, MP; Ellis, L; Shah, A; Cooper, N; Rasulo, D; Westlake, S (8) Cancer survival in the Primary Care Trusts of England, 1998-4. Technical Report. Office for National Statistics. Downloaded
Age-standardised Net Survival & Cohort and Period Net Survival Estimates
 Cancer survival analysis using population-based data Granada, 27-28 March 2017 Age-standardised Net Survival & Cohort and Period Net Survival Estimates Cancer survival analysis using population-based data
Inequalities in cancer survival: Spearhead Primary Care Trusts are appropriate geographic units of analyses
 Inequalities in cancer survival: Spearhead Primary Care Trusts are appropriate geographic units of analyses Libby Ellis* 1, Michel P Coleman London School of Hygiene and Tropical Medicine *Corresponding
Long-term survival of cancer patients in Germany achieved by the beginning of the third millenium
 Original article Annals of Oncology 16: 981 986, 2005 doi:10.1093/annonc/mdi186 Published online 22 April 2005 Long-term survival of cancer patients in Germany achieved by the beginning of the third millenium
Global surveillance of cancer survival
 Global surveillance of cancer survival Claudia Allemani Helena Carreira Rhea Harewood Devon Spika Xiao-Si Wang Finian Bannon Jane Ahn Loraine Marrett Donna Turner Thomas C Tucker Hannah K Weir CONCORD
Chester Schmaltz, PhD Dept. of Health Management & Informatics, School of Medicine Missouri Cancer Registry and Research Center (MCR-ARC) University
 University") Chester Schmaltz, PhD Dept. of Health Management & Informatics, School of Medicine Missouri Cancer Registry and Research Center (MCR-ARC) University of Missouri Columbia Chester Schmaltz, PhD The following
Chester Schmaltz, PhD Dept. of Health Management & Informatics, School of Medicine Missouri Cancer Registry and Research Center (MCR-ARC) University of Missouri Columbia Chester Schmaltz, PhD The following
Cancer Statistics, 2011
 Cancer Statistics, 2011 Cancer Statistics, 2011 The Impact of Eliminating Socioeconomic and Racial Disparities on Premature Cancer Deaths Rebecca Siegel, MPH 1 ; Elizabeth Ward, PhD 2 ; Otis Brawley, MD
Cancer in Ontario. 1 in 2. Ontarians will develop cancer in their lifetime. 1 in 4. Ontarians will die from cancer
 Cancer in Ontario 1 in 2 Ontarians will develop cancer in their lifetime 1 in 4 Ontarians will die from cancer 14 ONTARIO CANCER STATISTICS 2016 1 Cancer in Ontario An overview Cancer is a group of more
Estimated Minnesota Cancer Prevalence, January 1, MCSS Epidemiology Report 04:2. April 2004
 MCSS Epidemiology Report 04:2 Suggested citation Perkins C, Bushhouse S.. Minnesota Cancer Surveillance System. Minneapolis, MN, http://www.health.state.mn.us/divs/hpcd/ cdee/mcss),. 1 Background Cancer
Topics in Survival Data
 Topics in Survival Data NAACCR RDU PAN Survival Analysis Task Force 2013 2014 NAACCR Webinar Series July 10, 2014 1 Q&A Please submit all questions concerning webinar content through the Q&A panel. Reminder:
Annual Report to the Nation on the Status of Cancer, , Featuring Survival
 JNCI J Natl Cancer Inst (217) 19(9): djx3 doi: 1.193/jnci/djx3 First published online March 31, 217 Article Annual Report to the Nation on the Status of Cancer, 1975 214, Featuring Survival Ahmedin Jemal,
Downloaded from:
 Gauci, D; Allemani, C; Woods, L (2016) Population-level cure of colorectal cancer in Malta: An analysis of patients diagnosed between 1995 and 2004. Cancer epidemiology, 42. pp. 32-38. ISSN 1877-7821 DOI:
CANCER IN IDAHO 2016 Preliminary
 CANCER IN IDAHO 2016 Preliminary November 2017 A Publication of the Cancer Data Registry of Idaho Editors: Christopher J. Johnson, MPH, Epidemiologist Stacey L. Carson, RHIT, Vice President Operations
Cancer prevalence. Chapter 7
 Chapter 7 Cancer prevalence Prevalence measures the number of people diagnosed with cancer who are still alive. This chapter presents current and historical statistics on cancer prevalence in Ontario.
RESEARCH ARTICLE. Comparison between Overall, Cause-specific, and Relative Survival Rates Based on Data from a Population-based Cancer Registry
 DOI:http://dx.doi.org/.734/APJCP.22.3..568 RESEARCH ARTICLE Comparison between Overall, Cause-specific, and Relative Survival Rates Based on Data from a Population-based Cancer Registry Mai Utada *, Yuko
Cancer Survival in Wales, Goroesi Cancr yng Nghymru,
 Cancer Survival in Wales, 1989-1998 Goroesi Cancr yng Nghymru, 1989-1998 Welsh Cancer Intelligence & Surveillance Unit Uned Arolygiaeth a Gwybodaeth Cancr Cymru DIRECTOR S INTRODUCTION I am pleased to
Cancer Statistics, 2008
 CA Cancer J Clin 8;58:71 96 Cancer Statistics, 8 Ahmedin Jemal, DVM, PhD; Rebecca Siegel, MPH; Elizabeth Ward, PhD; Yongping Hao, PhD; Jiaquan Xu*, MD; Taylor Murray; Michael J. Thun, MD, MS ABSTRACT Each
Report on Cancer Statistics in Alberta. Breast Cancer
 Report on Cancer Statistics in Alberta Breast Cancer November 2009 Surveillance - Cancer Bureau Health Promotion, Disease and Injury Prevention Report on Cancer Statistics in Alberta - 2 Purpose of the
COLLABORATIVE STAGE TRAINING IN CANADA
 COLLABORATIVE STAGE TRAINING IN CANADA CANADIAN COUNCIL OF CANCER REGISTRIES DATA AND QUALITY MANAGEMENT COMMITTEE PRESENTATION NAACCR CONFERENCE JUNE 14, 2006 Regina, Saskatchewan Canada Ingrid Friesen
Cancer in the Northern Territory :
 Cancer in the Northern Territory 1991 21: Incidence, mortality and survival Xiaohua Zhang John Condon Karen Dempsey Lindy Garling Acknowledgements The authors are grateful to the many people, who have
Downloaded from:
 Li, R; Abela, L; Moore, J; Woods, LM; Nur, U; Rachet, B; Allemani, C; Coleman, MP (2014) Control of data quality for population-based cancer survival analysis. Cancer epidemiology, 38 (3). pp. 314-20.
Melanoma Surveillance in the United States: Overview of Methods
 Melanoma Surveillance in the United States: Overview of Methods Meg Watson, MPH Epidemiologist Epidemiology and Applied Research Branch Division of Cancer Prevention and Control Centers for Disease Control
Cancer in North America, Executive Summary
 Cancer Incidence in the United States Coverage Cancer in North America, 1996-2000 Executive Summary NAACCR s combined incidence rates for the United States represent the experience of 68 percent of the
Annual Report to the Nation on the Status of Cancer, , Featuring the Increasing Incidence of Liver Cancer
 Annual Report to the Nation on the Status of Cancer, 1975-, Featuring the Increasing Incidence of Liver Cancer A. Blythe Ryerson, PhD, MPH 1 ; Christie R. Eheman, PhD, MSHP 1 ; Sean F. Altekruse, DVM,
North American Association of Central Cancer Registries (NAACCR)
") North American Association of Central Cancer Registries (NAACCR) Susan T. Gershman President Outline I. NAACCR Organizational Structure II. Data Standards III. Education and Training IV. Certification
North American Association of Central Cancer Registries (NAACCR) Susan T. Gershman President Outline I. NAACCR Organizational Structure II. Data Standards III. Education and Training IV. Certification
Report on Cancer Statistics in Alberta. Melanoma of the Skin
 Report on Cancer Statistics in Alberta Melanoma of the Skin November 29 Surveillance - Cancer Bureau Health Promotion, Disease and Injury Prevention Report on Cancer Statistics in Alberta - 2 Purpose of
THE BURDEN OF CANCER IN NEBRASKA: RECENT INCIDENCE AND MORTALITY DATA
 THE BURDEN OF CANCER IN NEBRASKA: RECENT INCIDENCE AND MORTALITY DATA Presented by: Bryan Rettig, MS Nebraska Dept. of Health & Human Services Division of Public Health May 31, 2017 Nebraska Cancer Registry
Annual Report to the Nation on the Status of Cancer, , with a Special Feature Regarding Survival
 University of Nebraska - Lincoln DigitalCommons@University of Nebraska - Lincoln Public Health Resources Public Health Resources 7-1-2004 Annual Report to the Nation on the Status of Cancer, 1975 2001,
Overview of 2010 Hong Kong Cancer Statistics
 Overview of 2010 Hong Kong Cancer Statistics Cancer Registration in Hong Kong The Hong Kong Cancer Registry has since the 1960s been providing population-based cancer data for epidemiological research
Cirrhosis and Liver Cancer Mortality in the United States : An Observational Study Supplementary Material
 Cirrhosis and Liver Cancer Mortality in the United States 1999-2016: An Observational Study Supplementary Material Elliot B. Tapper MD (1,2) and Neehar D Parikh MD MS (1,2) 1. Division of Gastroenterology
Adolescents & Young Adults with Cancer
 Adolescents & Young Adults with Cancer April 2017 Technical Appendix Page 1 of 11 Cancer incidence rate Age-standardized incidence rates per 100,000 population for different cancers in adolescents & young
Report on Cancer Statistics in Alberta. Kidney Cancer
 Report on Cancer Statistics in Alberta Kidney Cancer November 29 Surveillance - Cancer Bureau Health Promotion, Disease and Injury Prevention Report on Cancer Statistics in Alberta - 2 Purpose of the Report
Trends in Lung Cancer Morbidity and Mortality
 Trends in Lung Cancer Morbidity and Mortality American Lung Association Epidemiology and Statistics Unit Research and Program Services Division November 2014 Table of Contents Trends in Lung Cancer Morbidity
Downloaded from:
 Sandiford, P; Abdel-Rahman, ME; Allemani, C; Coleman, MP; Gala, G (2015) How many cancer deaths could New Zealand avoid if fiveyear relative survival ratios were the same as in Australia? Australian and
Annual Report to the Nation on the Status of Cancer, , Featuring Survival Questions and Answers
 EMBARGOED FOR RELEASE CONTACT: Friday, March 31, 2017 NCI Media Relations Branch: (301) 496-6641 or 10:00 am EDT ncipressofficers@mail.nih.gov NAACCR: (217) 698-0800 or bkohler@naaccr.org ACS Press Office:
Christie Eheman, PhD NAACCR 6/2012
 Christie Eheman, PhD NAACCR 6/2012 Comparative Effectiveness Research CDC National Program of Cancer Registries Christie Eheman, PhD NAACCR 6/2012 CDC - Fran Michaud, Dave Butterworth, Linda Mulvihill,
Canadian Cancer Statistics
 Canadian Cancer Statistics 2007 www.cancer.ca PRODUCED BY: CANADIAN CANCER SOCIETY, NATIONAL CANCER INSTITUTE OF CANADA, STATISTICS CANADA, PROVINCIAL/ TERRITORIAL CANCER REGISTRIES, PUBLIC HEALTH AGENCY
Annual report on status of cancer in China, 2011
 Original Article Annual report on status of cancer in China, 2011 Wanqing Chen, Rongshou Zheng, Hongmei Zeng, Siwei Zhang, Jie He National Office for Cancer Prevention and Control, National Cancer Center,
Cancer Statistics, 2010 Ahmedin Jemal, Rebecca Siegel, Jiaquan Xu and Elizabeth Ward. DOI: /caac.20073
 Statistics, 21 Ahmedin Jemal, Rebecca Siegel, Jiaquan Xu and Elizabeth Ward CA J Clin 21;6;277-3; originally published online Jul 7, 21; DOI: 1.3322/caac.273 This information is current as of February
Colorectal Cancer Report on Cancer Statistics in Alberta. December Cancer Care. Cancer Surveillance
 December 212 21 Acknowledgements 2 This report was made possible through Alberta Health Services,, and the many contributions of staff and management across Alberta Health Services as well as external
Comparing Cancer Mortality Rates Among US and Foreign-Born Persons: United States,
 National Center for Chronic Disease Prevention and Health Promotion Comparing Cancer Mortality Rates Among US and Foreign-Born Persons: United States, 2005-2014 Benjamin D. Hallowell, PhD, MPH NAACCR 2018
2018 Texas Cancer Registry Annual Report
 2018 Texas Cancer Registry Annual Report As Required by Texas Health and Safety Code Section 82.007 November 2018 Table of Contents Executive Summary... 1 1. Introduction... 2 2. Background... 3 Cancer
Key Words. Cancer statistics Incidence Lifetime risk Multiple primaries Survival SEER
 The Oncologist Epidemiology and Population Studies: SEER Series Cancer Statistics, Trends, and Multiple Primary Cancer Analyses from the Surveillance, Epidemiology, and End Results (SEER) Program MATTHEW
Estimating relative survival: An analysis of bias introduced by outdated life tables. Larry Ellison Health Statistics Division Ottawa, June 24, 2014
 Estimating relative survival: An analysis of bias introduced by outdated life tables Larry Ellison Health Statistics Division Ottawa, June 24, 2014 Background relative survival defined... The ratio of
National Program of Cancer Registries Program Director s Meeting
 National Program of Cancer Registries Program Director s Meeting Christie Eheman, PhD Cancer Surveillance Branch Division of Cancer Prevention and Control April 2009 Department of Health and Human Services
Background. Background. AYA Overview. Epidemiology of AYA Cancers in Texas
 Texas Cancer Registry: Who We Are Epidemiology of AYA Cancers in Texas Melanie Williams, Ph.D. Texas Cancer Registry Cancer Epidemiology and Surveillance Branch Texas Department of State Health Services
North America:
 Cancer Cancer in in North North America: America: 2010-2014 2010-2014 Cancer in North 2010-2014 Volume Volume One: Combined Four:America: Cancer Cancer Survival Incidence Volume Three: Two: Registry-specific
The projection of short- and long-term survival for. Conditional Survival Among Patients With Carcinoma of the Lung*
 Conditional Survival Among Patients With Carcinoma of the Lung* Ray M. Merrill, PhD, MPH; Donald Earl Henson, MD; and Michael Barnes, PhD Objective: One- and 5-year probabilities of survival or death change
North America:
 Cancer Cancer in in North North America: America: 2010-2014 2010-2014 Cancer in North 2010-2014 Volume Volume One: Combined Four:America: Cancer Cancer Survival Incidence Volume Three: Two: Registry-specific
Cancer in Utah: An Overview of Cancer Incidence and Mortality from
 Cancer in Utah: An Overview of Cancer Incidence and Mortality from 1973-2010 A publication of the Utah Cancer Registry January 2014 Prepared by: C. Janna Harrell, MS Senior Research Analyst Kimberly A.
Cervical Cancer and Pap Test Utilisation in Manitoba
 Cervical Cancer and Pap Test Utilisation in Manitoba 1970-1999 Alain Demers Marion Harrison Grace Musto Kathleen Decker Robert Lotocki The Department of Epidemiology and Cancer Registry and the Manitoba
Impact and implications of Cancer Death Status Reporting Delay on Population- Based Relative Survival Analysis with Presumed-Alive Assumption
 Impact and implications of Cancer Death Status Reporting Delay on Population- Based Relative Survival Analysis with Presumed-Alive Assumption X Dong, Y Ren, R Wilson, and K Zhang NAACCR 6-20-2017 Introduction
Cancer Statistics, 2009 Ahmedin Jemal, Rebecca Siegel, Elizabeth Ward, Yongping Hao, Jiaquan Xu and Michael J. Thun. DOI: /caac.
 Cancer Statistics, 2009 Ahmedin Jemal, Rebecca Siegel, Elizabeth Ward, Yongping Hao, Jiaquan Xu and Michael J. Thun CA Cancer J Clin 2009;59;225-249; originally published online May 27, 2009; DOI: 10.3322/caac.20006
Trends in COPD (Chronic Bronchitis and Emphysema): Morbidity and Mortality. Please note, this report is designed for double-sided printing
: Morbidity and Mortality. Please note, this report is designed for double-sided printing") Trends in COPD (Chronic Bronchitis and Emphysema): Morbidity and Mortality Please note, this report is designed for double-sided printing American Lung Association Epidemiology and Statistics Unit Research
Trends in COPD (Chronic Bronchitis and Emphysema): Morbidity and Mortality Please note, this report is designed for double-sided printing American Lung Association Epidemiology and Statistics Unit Research
Summary Report Report on Cancer Statistics in Alberta. February Surveillance and Health Status Assessment Cancer Surveillance
 Summary Report 2008 Report on Cancer Statistics in Alberta February 2011 November 25, 2011 ERRATUM: Summary Report, 2008 Report on Cancer Statistics in Alberta There was an error in the spelling of prostate
Incidence of Cancers Associated with Modifiable Risk Factors and Late Stage Diagnoses for Cancers Amenable to Screening Idaho
 Incidence of Cancers Associated with Modifiable Risk Factors and Late Stage Diagnoses for Cancers Amenable to Screening Idaho 2009-2012 June 2015 A Publication of the Cancer Data Registry of Idaho PO Box
CANCER FACTS & FIGURES For African Americans
 CANCER FACTS & FIGURES For African Americans Pennsylvania, 2006 Pennsylvania Cancer Registry Bureau of Health Statistics and Research Contents Data Hightlights...1 Pennsylvania and U.S. Comparison...5
MEASURING CANCER CURE IN IRELAND
 MEASURING CANCER CURE IN IRELAND 2019 ABBREVIATIONS 95% CI 95% confidence interval APC Annual percentage change ASR Age-standardised rate (European standard population) IARC International Agency for Research
The validity of the mortality to incidence ratio as a proxy for site-specific cancer survival
 European Journal of Public Health, Vol. 21, No. 5, 573 577 ß The Author 2010. Published by Oxford University Press on behalf of the European Public Health Association. All rights reserved. doi:10.1093/eurpub/ckq120
Liver Cancer Report on Cancer Statistics in Alberta. December Cancer Care. Cancer Surveillance
 December 212 21 Report on Cancer Statistics in Alberta Acknowledgements 2 This report was made possible through Alberta Health Services,, and the many contributions of staff and management across Alberta
National Cancer Statistics in Korea, 2014
 National Cancer Statistics in Korea, 2014 2016. 12. 20. Korea Central Cancer Registry Cancer Incidence in Korea, 2014 National Cancer Incidence, 2014 Trends in Cancer Incidence by Sex and Year * Dark colored
Overview FLORIDA CANCER DATA SYSTEM
 Florida Cancer Data System 1 Florida Cancer Data System 2 FCDS is the legislatively mandated, population-based central cancer registry for the state of Florida. Data in the FCDS are collected from patient
Leukemia Report on Cancer Statistics in Alberta. December Cancer Care. Cancer Surveillance
 December 212 21 Report on Cancer Statistics in Alberta Report on Cancer Statistics in Alberta Acknowledgements 2 This report was made possible through Alberta Health Services,, and the many contributions
Incidence of Cancers Associated with Modifiable Risk Factors and Late Stage Diagnoses for Cancers Amenable to Screening Idaho
 Incidence of Cancers Associated with Modifiable Risk Factors and Late Stage Diagnoses for Cancers Amenable to Screening Idaho 2008-2011 August 2013 A Publication of the Cancer Data Registry of Idaho PO
Appendix 1 (as supplied by the authors): Supplementary data
: Supplementary data") Appendix 1 (as supplied by the authors): Supplementary data I. Cancer prevalence in Canada We obtained 10 year person based cancer prevalence rates for all of Canada for some years of our study period
Appendix 1 (as supplied by the authors): Supplementary data I. Cancer prevalence in Canada We obtained 10 year person based cancer prevalence rates for all of Canada for some years of our study period
Cancer in New Brunswick
 Cancer in New Brunswick 2002-2006 Message from the New Brunswick Cancer Network (NBCN) Co-CEOs The New Brunswick Cancer Network is pleased to provide the Provincial Cancer Report 2002-2006. This is the
Do morphology and stage explain the inferior lung cancer survival in Denmark?
 Eur Respir J 1999; 13: 430±435 Printed in UK ± all rights reserved Copyright #ERS Journals Ltd 1999 European Respiratory Journal ISSN 0903-1936 Do morphology and stage explain the inferior lung cancer
Cancer incidence and mortality patterns among specific Asian and Pacific Islander populations in the U.S.
 Cancer Causes Control (2008) 19:227 256 DOI 10.1007/s10552-007-9088-3 ORIGINAL PAPER Cancer incidence and mortality patterns among specific Asian and Pacific Islander populations in the U.S. Barry A. Miller
Overview of 2013 Hong Kong Cancer Statistics
 Overview of 2013 Hong Kong Cancer Statistics Cancer Registration in Hong Kong The Hong Kong Cancer Registry (HKCaR) is a population-based cancer registry, collecting the basic demographic data, information
Key Words. SEER Cancer Survival Incidence Mortality Prevalence
 The Oncologist Cancer Survival and Incidence from the Surveillance, Epidemiology, and End Results (SEER) Program LYNN A. GLOECKLER RIES, MARSHA E. REICHMAN, DENISE RIEDEL LEWIS, BENJAMIN F. HANKEY, BRENDA
National Cancer Institute
 Patient- reported outcome surveillance in older cancer survivors: Using the SEER-MHOS linked data resource Erin E. Kent, PhD Epidemiologist & Program Director Outcomes Research Branch Applied Research
HIV Viral Suppression, 37 States and the District of Columbia, 2014
 DOI 10.1007/s10900-017-0427-3 ORIGINAL PAPER HIV Viral Suppression, 37 States and the District of Columbia, 2014 Kristen L. Hess 1 H. Irene Hall 1 Published online: 18 September 2017 Springer Science+Business
Cancer in Puerto Rico:
 Puerto Rico Central Cancer Registry Comprehensive Cancer Center Cancer in Puerto Rico: 2006-2010 Incidence and Mortality Cancer in Puerto Rico 2006-2010 Editors: Guillermo Tortolero Luna, MD, PhD Diego
Canadian Cancer Treatment Linkage Project
 Canadian Cancer Treatment Linkage Project www.statcan.gc.ca Telling Canada s story in numbers Patti Murison On behalf of the CCTLP Team: Health Statistics Division Health Analysis Division Special Surveys
Nation nal Cancer Institute. Prevalence Projections: The US Experience
 Nation nal Cancer Institute Prevalence Projections: The US Experience State of Art Methods for the Analysis of Population- Based Cancer Data January 22-23, 2014 Ispra, Italy U.S. DEPARTMENT OF HEALTH AND
Cancer registry. Azin.Nahvijou, MD, PhD Candidate
 Cancer registry Azin.Nahvijou, MD, PhD Candidate 1 History of Cancer registration: The first efforts to estimate the number of new and existing cases of cancer in a given population were made at the turn
Annual report on status of cancer in China, 2010
 Original Article Annual report on status of cancer in China, 2010 Wanqing Chen, Rongshou Zheng, Siwei Zhang, Ping Zhao, Hongmei Zeng, Xiaonong Zou, Jie He National Office for Cancer Prevention and Control,
2007 Multiple Primary and Histology Coding Rules
 National Cancer Institute 2007 Multiple Primary and Histology Coding Rules NCI SEER for NAACCR 2006 Conference U.S. DEPARTMENT OF HEALTH AND HUMAN SERVICES Regina, Saskatchewan June 15, 2006 National Institutes
WEST NILE VIRUS AND OTHER MOSQUITO-BORNE DISEASE NATIONAL SURVEILLANCE REPORT
 WEST NILE VIRUS AND OTHER MOSQUITO-BORNE DISEASE NATIONAL SURVEILLANCE REPORT OCT 4 TO OCT 1, 215 REPORT WEEK 4 CANADA HUMANS During surveillance week 4, ending on Oct.1, 215, six (6) human clinical cases
What is the Impact of Cancer on African Americans in Indiana? Average number of cases per year. Rate per 100,000. Rate per 100,000 people*
 What is the Impact of Cancer on African Americans in Indiana? Table 13. Burden of Cancer among African Americans Indiana, 2008 2012 Average number of cases per year Rate per 100,000 people* Number of cases
THE ISSUE OF STAGE AT DIAGNOSIS
 THE ISSUE OF STAGE AT DIAGNOSIS IN SURVIVAL ANALYSIS Pamela Minicozzi Analytical Epidemiology and Health Impact Unit Department of Preventive and Predictive Medicine, Fodazione IRCCS Istituto Nazionale
Kidney Cancer Report on Cancer Statistics in Alberta. December Cancer Care. Cancer Surveillance
 December 212 21 Report on Cancer Statistics in Alberta Report on Cancer Statistics in Alberta Acknowledgements 2 This report was made possible through Alberta Health Services,, and the many contributions
Rare Cancer Prevalence in the SEER Population: Hepatobiliary Cancers,
 Rare Cancer Prevalence in the SEER Population: Hepatobiliary Cancers, 1975-2015 NAACCR 2018 Annual Conference Andrea Ayers, MPH Outline 1. Rare cancer classification 2. Hepatobiliary cancers 3. Key analytic
Using Policy, Programs, and Partnerships to Stamp Out Breast and Cervical Cancers
 Using Policy, Programs, and Partnerships to Stamp Out Breast and Cervical Cancers National Conference of State Legislatures Annual Meeting J August 2006 Christy Schmidt Senior Director of Policy National
United Kingdom and Ireland Association of Cancer Registries (UKIACR) Performance Indicators 2018 report
 Performance Indicators 2018 report") United Kingdom and Ireland Association of Cancer Registries (UKIACR) Performance Indicators 2018 report 20 June 2018 UKIACR Performance Indicators 2018 report 1 Contents Introduction... 3 Commentary for
United Kingdom and Ireland Association of Cancer Registries (UKIACR) Performance Indicators 2018 report 20 June 2018 UKIACR Performance Indicators 2018 report 1 Contents Introduction... 3 Commentary for
Cancer Statistics, 2014
 CA CANCER J CLIN 2014;64:9 29 Cancer Statistics, 2014 Rebecca Siegel, MPH 1 ; Jiemin Ma, PhD 2, *; Zhaohui Zou, MS 3 ; Ahmedin Jemal, DVM, PhD 4 Each year, the American Cancer Society estimates the numbers
2018 IMPLEMENTATION UPDATE: WHAT S NEW IN STAGING FOR 2018?
 2018 IMPLEMENTATION UPDATE: WHAT S NEW IN STAGING FOR 2018? SESSION 2 10/20/17 Q&A Please submit all questions concerning webinar content through the Q&A panel. A recording of today s session, the Q&A,
Cancer Statistics, 2015
 Cancer Statistics, 2015 Rebecca L. Siegel, MPH 1 *; Kimberly D. Miller, MPH 2 ; Ahmedin Jemal, DVM, PhD 3 Each year the American Cancer Society estimates the numbers of new cancer cases and deaths that