Topics in Survival Data
|
|
|
- Ashlyn Augusta King
- 6 years ago
- Views:
Transcription

1 Topics in Survival Data NAACCR RDU PAN Survival Analysis Task Force NAACCR Webinar Series July 10, Q&A Please submit all questions concerning webinar content through the Q&A panel. Reminder: If you have participants watching this webinar at your site, please collect their names and s. We will be distributing a Q&A document in about one week. This document will fully answer questions asked during the webinar and will contain any corrections that we may discover after the webinar. NAACCR Webinar Series 1


2 Fabulous Prizes!!! 3 1. CINA Survival Statistics Preview and Introduction Chris Johnson Cancer Data Registry of Idaho Co Chair, NAACCR Survival Analysis Task Force 4 NAACCR Webinar Series 2
3 What is Population based Survival (PBS) Clinical trials highest achievable survival Clinical focus Value of one treatment vs. another 3 4% of adult patients participate in clinical trials. Participants are younger and healthier. Population survival achieved Impact of cancer control initiatives (across the spectrum of initiatives) Targeting and monitoring cancer control initiatives Policy setting Effectiveness of healthcare delivery standard measure of cancer system performance 5 DURC SAWG RDU PAN SATF The NAACCR Data Use and Research Committee s Survival Analysis Work Group was formed in 2008 chiefly to evaluate how survival estimates are impacted by active follow up versus ascertainments of deaths only. ( Active follow up may all be done through record linkage.) Johnson CJ, Weir HK, Yin D, Niu X. The Impact of Patient Follow up on Population based Survival Rates. Journal of Registry Management 2010; 37(3): Johnson CJ, Weir HK, Fink AK, German RR, Finch JL, Rycroft RK, Yin D. The impact of National Death Index linkages on population based cancer survival rates in the United States. Cancer Epidemiology Feb;37(1): NAACCR Webinar Series 3
4 Goal = CINA Survival Statistics Under the NAACCR Strategic Management Plan, the Survival Analysis Task Force is responsible for facilitating the development of state and province specific relative survival data. Expected Deliverables: State and province specific relative survival statistics published in annual CINA publications. 7 NAACCR Call for Data and Survival November 2013 Call for Data NAACCR Prep survival variables Vital Status Follow Up Activities Form Active permission from registries to publish registry specific and aggregated survival estimates 8 NAACCR Webinar Series 4
 5-Year Relative and Period Survival by Race, Sex, Diagnosis Year, Age and Stage at Diagnosis 5-Year Relative Survival")
 cd All Races Whites Blacks Year Both Sexes Males Females Both Sexes Males Females Both Sexes Males Females 2010 65.0 65.2 64.")
5 CINA Included Stage Data Survival Data coming soon 9 SATF has not decided on templates for CINA survival statistics. Meanwhile, SEER CSR examples: Cancer of the Colon and Rectum (Invasive) 5-Year Relative and Period Survival by Race, Sex, Diagnosis Year, Age and Stage at Diagnosis 5-Year Relative Survival (Percent) by Year of Diagnosis Year of All Races Whites Blacks Diagnosis Both Sexes Males Females Both Sexes Males Females Both Sexes Males Females b 66.1 f 66.4 f 65.7 f 66.9 f 67.6 f 66.2 f 57.8 f 56.2 f 59.2 f 5-Year Period Survival (Percent) cd All Races Whites Blacks Year Both Sexes Males Females Both Sexes Males Females Both Sexes Males Females NAACCR Webinar Series 5
6 SATF has not decided on templates for CINA survival statistics. Meanwhile, SEER CSR examples: 5-Year Relative Survival (Percent) c by Age at Diagnosis Age at Diagnosis All Races Whites Blacks Both Sexes Males Females Both Sexes Males Females Both Sexes Males Females Ages < Ages Ages Ages Ages Ages < Ages Year Relative Survival (Percent) c by Stage at Diagnosis e Stage at Diagnosis All Races Whites Blacks Both Sexes Males Females Both Sexes Males Females Both Sexes Males Females All Stages Localized Regional Distant Unstaged SATF has not decided on templates for CINA survival statistics. Meanwhile, SEER CSR examples: Cancer of the Colon and Rectum (Invasive) SEER a Relative Survival (Percent) By Year of Diagnosis, All Races, Males and Females Survival Time year year year year year year year NAACCR Webinar Series 6
 4.")
7 What is the hold up? Life Tables for U.S. States 13 Topics in Survival Data Agenda 2. Evaluation and selection of registry data for CINA Survival Statistics (Chris Johnson for Hannah Weir) 3. Approaches to handling multiple primaries (Chris Johnson for Hannah Weir) 4. Types of survival statistics: observed, net, relative, causespecific, crude probability of death, period, cohort, complete (Diane Nishri, Diana Withrow) 5. Age standardized survival (Diane Nishri, Diana Withrow) 14 NAACCR Webinar Series 7
8 Topics in Survival Data Agenda 6. Choosing appropriate life tables for relative survival (Angela Mariotto) 7. Cause specific survival using special variables and comparisons to relative survival (Nadia Howlader) 8. Limitations in interpretability of survival among Hispanics and Asians (Paulo Pinheiro) 9. Active follow up versus presumed alive survival calculations which is appropriate for your data? (Chris Johnson) 10. Analyzing your own data. Loading your NAACCR 2014 Call for Data dataset into SEER*Prep, analysis of your data using SEER*Stat. (Chris Johnson) NAACCR Webinar Series 8
9 2. Evaluation and selection of registry data for CINA Survival Statistics (Chris Johnson for Hannah Weir) 17 Data Requirements Ascertain all cases in population catchment area Complete and high quality incidence data (e.g., NAACCR Certified) Ascertain all deaths among patients in registry Incidence data linked to state and national death certificate databases and/or active follow up Dataset passes survival related edits Complete dates of birth, diagnosis and death Data quality indicators available to facilitate interpretation of results (%DCO, %MP, %MC) 18 NAACCR Webinar Series 9
10 Incidence Data Issue: Survival estimates are influenced by case finding. Scenarios: Less fatal cancers (e.g., prostate, hematological cancers) may be diagnosed in a doctor s office. Some cases diagnosed clinically may have poor prognosis. Potential impact: Survival estimates can be biased (over or under estimated) by incomplete incidence data. Assessment: NAACCR Certification (including edits, %DCO, %case completeness) % MV (SEER 11: ) Mean 94.7% (range 92.2% 95.7%) The validity of population based survival comparisons is clearly dependent on the validity of the incidence data. Berrino, Ascertainment of Deaths Issue: Missing deaths Scenario: A person diagnosed with cancer moves to another state, and dies there. Potential impact: Survival estimates can be biased (over estimated) by incomplete death ascertainment. Assessment: Follow up source central Comparisons of survival rates by registry NAACCR Webinar Series 10
 Cause of Death (SEER COD) Date")
 Follow-Up Source (COC) Follow-up Source Central (NAACCR) Follow-Up Source Central, Vital Status (NPCR) Follow-Up Source, Vital Status (COC) ICD Revision Number (NPCR) ICD Revision")
11 NAACCR Vital Status Follow Up Activities Form 21 Data Evaluation Data Variables and Edits Date of diagnosis Date of last contact Follow-up source central Type of report source Diagnostic confirmation Vital status Cause of death ICD revision number Edits associated with vital status variables needed for survival analysis Age, Histologic Type, COD, ICDO3 (SEER IF43) Cause of Death (SEER COD) Date of Last Contact (NAACCR DATEEDIT) Date of Last Contact Flag (NAACCR) Date of Last Contact, Date Flag(NAACCR) Date of Last Contact, Date of Diag. (NAACCR IF19) Follow-Up Source (COC) Follow-up Source Central (NAACCR) Follow-Up Source Central, Vital Status (NPCR) Follow-Up Source, Vital Status (COC) ICD Revision Number (NPCR) ICD Revision Number, Cause of Death (SEER IF37) ICD Revision, Vital Stat, Date Last Contact (NPCR) Type of Rep Srce(DC),Seq Num--Cent,ICDO3(SEER IF04 Type of Report Srce (AO), Date of Dx (SEER IF02) Type of Report Srce(DC/AO), COD (SEER IF09) Type of Report Srce(DC/AO), Diag Conf (SEER IF05) Type of Report Srce(DC/AO), Vital Stat (SEER IF08) Type of Reporting Source (SEER RPRTSRC) Vital Status (Subm) Vital Status, Cause of Death (Subm) 22 Verify cause of death same on all records for a patient (SEER IR11) Verify date of follow-up same on all records for a patient (SEER IR08) Verify vital status same on all records for a patient (SEER IR10) NAACCR Webinar Series 11
.")
12 Upcoming Publication Evaluation of NAACCR Cancer in North America Data for Use in Population Based Cancer Survival Studies. Weir HK, Johnson CJ, Mariotto AB, Turner D, Wilson RJ, Nishri D, Ward KC. JNCI supplement (in press) NAACCR Webinar Series 12

13 3. Approaches to handling multiple primaries (Chris Johnson for Hannah Weir) 25 What is a multiple primary? Approximately 880,300 of the 11 million cancer survivors living in the US as of January 1, 2005, had been diagnosed with more than one cancer. Most of these second or more cancers would be expected to occur even if cancer survivors had the same risk of cancer as the general population. Multiple primary cancers can either be diagnosed at the same time (synchronous) or at different times (metachronous). 26 NAACCR Webinar Series 13
14 Risk of Subsequent Cancers Although cancer survivors as a group have a small (14%) increased lifetime risk of developing new cancers compared with the general population, some subgroups of patients have a much higher risk. The risk of developing subsequent cancers varies by the type of first cancer diagnosed, age at first diagnosis, environmental exposures, genetic factors, treatment, and other factors. 27 Multiple Primary Rule Sets SEER Rules The 2007 Multiple Primary and Histology Coding Rules present the first site specific multiple primary and histology rules developed to promote consistent and standardized coding by cancer registrars. Complicated! IARC/IACR Rules Simpler, result in fewer primaries 28 NAACCR Webinar Series 14
15 Old SEER MP/H Rules (general) A cancer of a different site and histologic (microscopic composition of cells and/or tissue) type than the original cancer is considered a separate primary. Cancers of different histologic types in the same site are considered separate primaries regardless of whether they are diagnosed at the same or different times. A new cancer of the same site or with the same histology as an earlier one is considered the same primary cancer if diagnosed within 2 months or a separate primary cancer if diagnosed after 2 months, unless the medical record specifically states that it is recurrent or metastatic disease. If an organ is paired, each member of the pair is generally considered to be a separate site. Important exceptions to these general rules include most histological types of cancer in the prostate and urinary bladder, for which multiple tumors are reported as a single primary with the date of the first invasive lesion. A different set of rules is used to determine multiple primaries of the lymphatic and hematopoeitic systems. 29 SEER 9 Sequence Distribution, NAACCR Webinar Series 15
16 Percentage of multiple primary cancers (all sites and both sexes combined) by IACR and SEER multiple primary rules ( ) 31 Approaches to handling multiple primaries Survival estimates based on first cancers only exclude a large and increasing number of MP cancers. Several recent papers advocate that data on all cancers should be included in the analysis in order to produce clinically and epidemiologically relevant and less biased cancer survival estimates. If all first cancers matching the selection criteria are used to produce site specific survival estimates, then the choice of which MP rule set (SEER or IACR) is used to identify primary cancers has little impact. 32 NAACCR Webinar Series 16
17 Example Sequence number and primary site category 01 Breast > 02 Colon > 03 Breast Analysis Multiple Primary Selection All Sites Combined Breast Colon First Primary Only X First Primary Matching Selection Criteria Analysis of Breast Cancer Survival 01 Analysis of Colon Cancer Survival 02 All Tumors Matching Selection Criteria Stratified by site* *To be able to produce all three statistics (all, breast, colon) in one run, you need to select "All Tumors Matching Selection Criteria" and stratify by site. 33 Relevant Publications The effect of multiple primary rules on population based cancer survival. Weir HK, Johnson CJ, Thompson TD. Cancer Causes Control Jun;24(6): Evaluation of NAACCR Cancer in North America Data for Use in Population Based Cancer Survival Studies. Weir HK, Johnson CJ, Mariotto AB, Turner D, Wilson RJ, Nishri D, Ward KC. JNCI supplement (in press). Full dates (day, month, year) should be used in population based survival studies. Woods LM, Rachet B, Ellis L, Coleman MP. Int J Cancer Oct 1;131(7):E NAACCR Webinar Series 17
18 Relevant Publications Brenner H, Hakulinen T (2007) Patients with previous cancer should not be excluded in international comparative cancer survival studies. Int J Cancer 121(10): Ellison LF (2010) Measuring the effect of including multiple cancers in survival analyses using data from the Canadian Cancer Registry. Cancer Epidemiol 34(5): NAACCR Webinar Series 18
19 4. Types of survival statistics: observed, net, relative, cause specific, crude probability of death, period, cohort, complete (Diana Withrow) 37 Types of Survival Analysis Diana Withrow Student Research Associate, Cancer Care Ontario PhD Candidate, Epidemiology, University of Toronto Survival Analysis Task Force Webinar July 10th, 2014 NAACCR Webinar Series 19
20 Acknowledgements & Disclaimers Acknowledgements: Material for these slides was heavily informed by the presentations of Drs. Paul Dickman and Paul Lambert for their Cancer Survival course held at the 2012 NAACCR annual meeting Disclaimer: I am not a biostatistician What will I be talking about? Mortality Survival Cause specific Net Relative survival Observed All cause Crude probability of death NAACCR Webinar Series 20
21 Survival vs. Mortality Survival The proportion of patients alive after a given time interval has passed since a cancer diagnosis e.g. The 5 year survival from breast cancer among women in Canada was 88% in Mortality As a cancer statistic: the number of people who have died from cancer in a year E.g. The age standardized mortality rate for all cancer in Ontario was deaths per 100,000 persons in Among people diagnosed with cancer: The proportion of patients dead after a given time interval has passed since cancer diagnosis 1 information/cancer 101/canadian cancer statistics publication/?region=on Mortality Survival Net Observed Cause specific Relative survival All cause Crude probability of death NAACCR Webinar Series 21
22 Observed vs. Net Survival Observed All cause Survival of cancer patients Cause specific Net Relative Mortality Survival Cause specific Net Relative survival Observed All cause Crude probability of death NAACCR Webinar Series 22
23 Observed survival Estimates mortality within a group of persons diagnosed with cancer Observed mortality = Measures mortality experience of cancer patients rather than mortality specifically due to cancer +: minimal data elements required, easy to calculate and interpret : reflects mortality associated with cancer AND background mortality Mortality Survival Cause specific Net Relative survival Observed All cause Crude probability of death NAACCR Webinar Series 23

24 Cause specific survival Estimates net mortality (mortality associated with a dx of cancer) under certain assumptions Deaths attributed to cancer are considered events, deaths due to other causes are censored Cause specific survival = +: relatively simple to calculate and understand : requires reliably coded cause of death, distinction between cancer and non cancer death Cause specific survival: COD considerations NAACCR Webinar Series 24
25 Mortality Survival Cause specific Net Relative survival Observed All cause Crude probability of death Relative Survival A measure of excess mortality as a result of cancer The relative survival ratio (RSR) is the ratio of the observed survival in the patient group to the expected survival of a comparable group from the general population +: no COD data required, measures excess mortality irrespective of whether it is directly or indirectly attributable to the cancer : must have an estimate of expected survival in a comparable group from the general population NAACCR Webinar Series 25
 (2 vols),")
26 Relative Survival Life tables Should be specific to geography and stratified by age, sex, calendar time and race/ethnicity The Northampton Life Table from R Price, Observations on reversionary payments : on schemes for providing annuities for widows, and for persons in old age: on the method of calculating the values of assurances on lives: and on the national debt, (4th edn) (2 vols), London: T Cadell Taken from: Mortality Survival Net Observed Cause specific Relative survival All cause Crude probability of death NAACCR Webinar Series 26
 BUT we might want to estimate the proportion of patients who will die of cancer in the presence of competing risks (crude probability of death) While still overcoming")
27 Crude probability of death 1 RSR: proportion of patients who will die of cancer within i years of follow up in the hypothetical situation where the cancer in question is the only possible cause of death (net probability of death) BUT we might want to estimate the proportion of patients who will die of cancer in the presence of competing risks (crude probability of death) While still overcoming cause of death issues Crude probability of death NAACCR Webinar Series 27
28 Interpretation In the hypothetical world where it is not possible to die of other causes, the probability of dying of prostate cancer within 15 years of diagnosis is 40% In the real world where it is possible to die of other causes, the probability of dying of prostate cancer within 15 years of diagnosis is less than 20% Resources 1. Dickman PW, Adami H O. Interpreting trends in cancer patient survival. J Intern Med Aug;260(2): Sarfati D, Blakely T, Pearce N. Measuring cancer survival in populations: relative survival vs cancer specific survival. International journal of epidemiology Apr;39(2): Howlader N, Ries LAG, Mariotto AB, Reichman ME, Ruhl J, Cronin KA. Improved estimates of cancer specific survival rates from population based data. JNCI Journal of the National Cancer Institute Oct 20;102(20): Cronin KA, Feuer EJ. Cumulative cause specific mortality for cancer patients in the presence of other causes: a crude analogue of relative survival. Statistics in medicine NAACCR Webinar Series 28
29 5. Age standardized survival (Diana Withrow) 57 Three approaches to survival estimation 1. Cohort analysis If we are estimating 5 year survival, then all patients must have potential followup of 5 years. This means that they must have been diagnosed at least 5 years ago. 2. Complete analysis If we are estimating 5 year survival, all patients are included, regardless of how much potential follow-up they have. This means that they must have been diagnosed at most 5 years ago. NAACCR Webinar Series 29

30 Three approaches to survival estimation 3. Period analysis Period analysis exclusively reflects the survival experience of subjects within the most recent calendar period for which the follow-up is available. This is achieved by left truncation of observations at the beginning of this period in addition to censoring at its end. Cohort Complete Period Source: Swaminathan R and Brenner H, IARC Scientific Publications volume 162, Lyon, NAACCR Webinar Series 30

31 Patient number Survival observed in 20 patients Date Observed survival Dead Alive Ontario colorectal cancer cases, age Ontario colorectal cancer cases, age Complete relative survival, diagnosed , followed to Dec 31, 2005 NAACCR Webinar Series 31
32 Patient number Patients included in cohort analysis Date Observed survival Dead Alive Ontario colorectal cancer cases, age Cohort relative survival, diagnosis year 2000 NAACCR Webinar Series 32

33 Patient number Patients included in period analysis Date Observed survival Dead Alive Ontario colorectal cancer cases, age Period relative survival, observed year 2005 NAACCR Webinar Series 33
34 A graph comparing the different approaches Survival Ontario colorectal cases Time since diagnosis (years) Complete Cohort Period Pros and cons of different approaches Cohort: Most familiar method and easiest to explain Have to wait years for follow-up, so results seem dated Complete: Can require more work to include additional patients More patients means smaller standard errors for shorter times, but few patients followed for 5 years Period: Uses the most recent observed data, may be closer to survival that will be experienced by those diagnosed now Much harder to explain! NAACCR Webinar Series 34
35 Age-standardization of survival People have been age-standardizing incidence and morality rates since Age-standardization enables the comparison of rates from two populations with different age structures. Age-standardization of survival estimates has become increasingly common since Corazziari et al published the International Cancer Survival Standards in Based on analyses of EUROCARE-2 data, they defined the smallest number of standard populations that provide age-standardized survival estimates closest to the crude survival estimates for as many cancer sites as possible. International Cancer Survival Standards From De Angelis (2009), with prostate modification Three age standards were identified based on the age patterns of incidence: Cancers mainly of young adults Cancers with little variation by age Cancers whose incidence increases with age NAACCR Webinar Series 35
36 Ontario colorectal survival by age group, with 95% CI Survival Age-std Cohort Period Cohort survival for cases diagnosed 2000; Period survival for cases observed 2005 Canadian Cancer Case Standard (Ellison, 2010) Each relative survival ratio is standardized WITHIN the site Age-standardized estimates were calculated using the direct method by weighting age-specific estimates for a given cancer to the age distribution of persons diagnosed with that cancer from 2001 to (Canadian Cancer Statistics, 2014) Facilitates comparisons within site over time, but not between sites Also prevents comparisons with other jurisdictions, since they are very unlikely to have used the CCCS! NAACCR Webinar Series 36

37 Choosing Appropriate Life Tables for Relative Survival Angela Mariotto Surveillance Research Program Division of Cancer Control and Population Sciences National Cancer Institute NAACCR Survival Analysis Webinar July 10, Outline Life tables and relative survival NCHS US and State life tables Comparisons relative survival using NCHS US vs. NCHS State life tables Current efforts- Modeling life tables by SES Discussion/Conclusions 74 NAACCR Webinar Series 37
38 Life Tables Life table (mortality table) provide for each age the probability that a person of that age will die before his/her next birthday. From the probabilities of death, a number of inferences can be derived, e.g., interval survival, cumulative survival, life expectancy. Calculated from mortality rates. Role of Expected Survival in Relative Survival Relative Survival Observed Survival (Patients) Expected Survival (Population) Calculated as the ratio between all-cause survival divided by the expected survival of a comparable group free of cancer (or population) Expected survival is calculated from life tables. Also called background survival/mortality Different methods to estimate (Ederer I, Ederer II, Hakulinen and Pohar Perme) Assumes life tables represents patients mortality/survival for other causes of death. NAACCR Webinar Series 38
39 Table 1. Life table for total population: United States, 2008 Probablity of dying between ages x and x + 1 Number surviving to age x Number dying between ages x and x + 1 Person-years lived between ages x and x + 1 Total number of person-years lived above age x Expectation of life at age x Age (years) q x l x d x L x T x e x , ,425 7,812, , ,318 7,712, , ,281 7,613, , ,256 7,514, , ,237 7,415, , ,221 7,315, , ,206 7,216, , ,193 7,117, , ,181 7,018, , ,171 6,919, , ,162 6,819, , ,154 6,720, , ,144 6,621, , ,128 6,522, , ,104 6,423, , ,070 6,324, ,303 1,930 7,338 25, ,373 1,607 5,569 18, ,766 1,298 4,117 12, ,467 1,017 2,959 8, , ,066 5, and over ,680 1,680 3,732 3, Source: CDC/NCHS E x =1-q x is what we use to calculate relative survival Relative Survival Biases if Life Tables Do Not Represent Patients Expected Survival Expected Higher 84% > 80% Relative Survival Underestimated True Expected is 80% Expected Lower 76% < 80% Relative Survival Overestimated 94% 89% 84% 80% 75% 75% 75% 76% 99% All cause Expected Relative NAACCR Webinar Series 39
40 Relative Survival Biases if Life Tables Do Not Represent Patients Expected Survival LT Higher 84% > 80% Relative Survival Underestimated True Expected is 80% Expected Lower 76% < 80% Relative Survival Overestimated 94% 89% 84% 80% 75% 75% 75% 76% 99% All cause Expected Relative Relative Survival Biases if Life Tables Do Not Represent Patients Expected Survival LT Higher 84% > 80% Relative Survival Underestimated True Expected is 80% LT Lower 76% < 80% Relative Survival Overestimated 94% 89% 84% 80% 75% 75% 75% 76% 99% All cause Expected Relative NAACCR Webinar Series 40
41 Years: Default Life Table in SEER*Stat: National U.S by individual year NCHS decennial 1970,1980,1990, and 2000 US life tables. NCHS annual US life tables Interpolation methods between missing years Race: White, Black and Other (AI/API), All Races used for unknown race Standard methods to estimate life tables for other races Ages: Maximum age is 99 (previously 119) Relative Survival from National Life Tables Accurate for populations with similar background mortality as the US population, e.g. SEER. Not accurate when the background mortality of the study cohort is different than the US. Examples: Special populations: small race/ethnicity groups, by socio-economic status, by comorbidity, by geographic areas May mislead comparisons by registries Cancers with common risk factors with other diseases: smoking and lung cancer Healthy screening effect (early stage breast and prostate cancer) NAACCR Webinar Series 41
42 NCHS State Life Tables NCHS state life tables are published only decennially ( , , ) Interpolation methods between missing years Available by race (white and black) and sex where the numbers of deaths were sufficient to produce reliable estimates. Blacks not available in 11 states Ages: Maximum age 119 Available at request in SEER*Stat. Blacks US life tables are used when NCHS state life tables are missing NCHS US vs. State Life tables 2000 White Males 1 AK AL 0.1 AR AZ Log (Probability of dying) US CA CO CT DC DE FL GA HI IA ID IL IN KS KY Age LA MA MD NAACCR Webinar Series 42
43 1 NCHS US vs. State Life tables 2000 Black Males #REF! AL 0.1 AR AZ Log (Probability of dying) US CA CO CT DC DE FL GA #REF! IA #REF! IL IN KS KY Age LA MA MD Impact of US and State Life Tables on Relative Survival Compared 5-year relative survival using US and State life tables for individuals diagnosed with female breast, colorectal, prostate cancers and all cancer sites combined in the SEER-18 areas. Compared by cancer site, age, race, and area. Stroup et al. The Impact of State-Specific Life Tables on Relative. Survival JNCI monograph (in review) NAACCR Webinar Series 43
44 To help interpretation Ordered SEER registries/states according to lower higher mortality Age-Adjusted Registry Mortality * Hawaii 615 Connecticut 669 California 674 Seattle 699 Utah 709 New Jersey 710 Iowa 726 US 764 New Mexico 770 Detroit 829 Georgia 862 Kentucky 919 Louisiana 929 US LT Expected Survival < State Expected US LT Relative Survival (RS)> State LT RS US LT Expected Survival > State Expected US LT Relative Survival (RS)< State LT RS 100% 90% 80% All Cancer All Cancer Sites Whites Sites Ages Ages ST RS lower ST RS higher 100% 90% 80% All Cancer Sites Blacks Ages % 70% 60% 60% 50% 50% 40% 40% 30% 30% 20% 20% 10% 10% 0% 0% US LT RS State LT RS US LT RS State LT RS 100% Colorectal Whites Ages % Colorectal Blacks Ages % 90% 80% 80% 72% 70% 60% 50% 40% 30% 70% 60% 50% 40% 30% 41% (16% 71%) 60% 61% 26% (2% 63%) 59% 52% 56% 59% 61% 63% 58% 20% 20% 10% 10% 0% 0% US LT RS State LT RS US LT RS State LT RS NAACCR Webinar Series 44
45 5-year Relative Survival and Confidence Intervals Black Patients Diagnosed with Colorectal Cancer in % 90% 80% 70% 60% 50% 40% 30% 20% 10% 0% Prostate Whites Ages 0-79 Prostate Blacks Ages % 100% 80% 80% 60% 60% 40% 40% 20% 20% 0% 0% US LT RS State LT RS US LT RS State LT RS 100% Female Breast Whites Ages % Female Breast Blacks Ages % 90% 80% 80% 70% 70% 60% 60% 50% 50% 40% 40% 30% 30% 20% 20% 10% 10% 0% 0% US LT RS State LT RS US LT RS State LT RS NAACCR Webinar Series 45
46 Comparisons for Whites Ages 85+ Probabilities of dying for older ages lower in State life tables compared to US life table Relative survival based on State LT systematically underestimated 100% 90% 80% 70% 60% 50% 40% 30% 20% 10% 0% All Cancer Sites Whites Ages % 90% 80% 70% 60% 50% 40% 30% 20% 10% 0% Prostate Cancer Whites Ages 85+ US LT RS State LT RS US LT RS State LT RS What have we learned? For younger ages < 80 relative survival using state life tables more accurate because it accounts for some state variability in background mortality. State life tables biased for older ages and should not be used Differences in relative survival due to different life tables in general very small NAACCR Webinar Series 46
47 What have we learned? (2) Relative survival differences between registries for the black population can be quite large due to small black populations in some registries. Example: colorectal cancer in Utah and Hawaii. Important to report variability of relative survival in comparisons, e.g., confidence intervals. How can we improve State Life Tables State Life Tables better than US Life Tables for younger ages. Corrections for older ages: We could use US life tables for ages 80+ or Modeling using Poisson regression models NAACCR Webinar Series 47

 Model by sex, race and geography area (to be defined) and use spline of age and SES as")
48 Current Efforts Poisson regression model using age as a spline function. On going effort in collaboration with Bin Huang and Hannah Weir. Uses mortality and socio-economic status data at county level Socio-economic status (SES) is measured as Yost composite index (Mandi et al, Cancer Causes and Control, 2014) Model by sex, race and geography area (to be defined) and use spline of age and SES as covariate Investigate excluding cancer death as cause of death Mortality Snapshot of the Data YOST Index NAACCR Webinar Series 48
49 Discussion/Conclusions There is an advantage in using NCHS life tables Has the imprimatur of NCHS Well documented and available to all Modeling is an alternative however it requires: Validation and method to identify the best life table for estimating relative survival Balance between modeling all important factors (race, sex, geography, SES) and allowing for enough data so that estimates are reliable Acknowledgements Bin Huang (Kentucky CR) Nan Stroup (New Jersey CR) Hannah Weir (CDC) Steve Scoppa, Jou Zou (IMS) Hyunsoon Cho (NCC Korea) NAACCR Webinar Series 49


50 Thank you Questions Improving Cause-Specific Survival Estimates: SEER Data Nadia Howlader, Lynn Ries, Angela Mariotto, Marsha Reichman, Jennifer Ruhl, Kathy Cronin NAACCR Webinar Topics in Survival Data July 10, 2014 NAACCR Webinar Series 50
51 Outline Background Relative survival approach limitations Issues with cause of death (COD) Algorithm for COD assignment (varies by one and only cancer vs. 1 st of multiple cancers) Compare relative and cause-specific (using new COD variable) estimates Conclusions Background Accurate estimates of cancer survival are important Population-based studies often use relative survival A ratio of observed to expected survival rates Observed survival rates (cancer patients) Expected survival rates (US general population life-table) NAACCR Webinar Series 51
52 Background (Cont d) Challenging to estimate relative survival rates for subgroups of population lack of appropriate life-tables ethnic minorities, risk factors, socioeconomic status, geographic area Other-cause mortality are not always well representated Background (Cont d) Concord study (2008) developed sex- and geographyspecific life tables SEER collects cause-of death information from death certificates NAACCR Webinar Series 52
53 Study Aim Parallel to improving life-tables, could we use cause of death information to obtain improved estimates of causespecific survival rates? Cause-specific widely used in clinical trials but used with caution in registry data (why?) Issues with Cause of Death (COD) Death certificate errors Metastatic site of the primary cancer diagnosis may be reported as the underlying COD How to assign CODs to a primary cancer diagnosis? Need to develop an algorithm to identify a single, diseasespecific, underlying COD NAACCR Webinar Series 53
54 SEER Cause-Specific Death Classification Variable Underlying COD was evaluated ICD-8 ( ), ICD-9 ( ), ICD-10 (1999+) The algorithm takes into account COD in conjunction with Site of original cancer diagnosis Tumor sequence (Seq 00 vs. Seq 01) Co-morbidities (e.g., HIV/AIDS and/or site-related non-cancer diseases) SEER Cause-Specific Death Classification Variable (Cont d) Determine the algorithm: Step1: Careful analysis of all possible COD from death certificates for each cancer site Step 2: Look at all possible COD to assess the chances that was due to the cancer of interest NAACCR Webinar Series 54
55 SEER Cause-Specific Death Classification Variable (Cont d) -Step 3: Use heuristic approach to classify each possible COD as cancer or other-cause death - Broad categories of COD were identified Major COD Categories Cancer of the same site Cancer of the same organ system Cancer of any other sites HIV alone (varies by cancer site) AIDS and cancer Site-specific disease NAACCR Webinar Series 55
56 Example: Deaths attributable to lip cancer for cases diagnosed with only lip cancer (Sequence 00) COD Categories Cancer of the same site Lip cancer Death attributed to lip cancer Cancer of the same body system Cancer of any other site AIDS and cancer HIV alone* Oral cavity and pharynx cancer Skin Cancer HIV disease with other malignant neoplasms HIV disease with infectious diseases Site specific disease Mouth disease *Only for HIV/AIDS associated cancers Cases that were diagnosed with only one cancer (sequence 00) % Total CODs Cancer of same site Cancer of same body system Breast Cancer of other site *Other cause is treated as censored observation Oral cavity & pharynx Site-specific disease Aids and cancer HIV alone Other-cause* NAACCR Webinar Series 56
57 Cases that were diagnosed with only rectum cancer (sequence 00) % Total CODs Other-cause* HIV alone Aids and cancer Site-specific disease Cancer of other site Cancer of same body system Cancer of same site *Other cause is treated as censored observation Cases that were only diagnosed with only lip cancer (sequence 00) % Total CODs Other-cause* HIV alone Aids and cancer Site-specific disease Cancer of other site Cancer of same body system Cancer of same site *Other cause is treated as censored observation NAACCR Webinar Series 57
58 Cases with Non-Hodgkin Lymphoma (Sequence 00) 100% 80% 60% 40% 20% 0% Suvival Probability Cause-specifc (old) Age at Diagnosis Note= Five-year Non-Hodgkin lymphoma cancer survival by age at diagnosis, SEER-13, Cases with Non-Hodgkin Lymphoma (Sequence 00) 100% Suvival Probability 80% 60% 40% 20% Cause-specifc (old) Relative Survival 0% Age at Diagnosis Note= Five-year Non-Hodgkin lymphoma cancer survival by age at diagnosis, SEER-13, NAACCR Webinar Series 58
59 Cases with Non-Hodgkin Lymphoma (Sequence 00) 100% Suvival Probability 80% 60% 40% 20% Cause-specifc (old) Cause-specific (new) Relative Survival 0% Age at Diagnosis Note= Five-year Non-Hodgkin lymphoma cancer survival by age at diagnosis, SEER-13, Cases with more than one cancer (Sequence 01) More stringent rule was applied Cancer of the same site of 1 st diagnosis were attributed COD due to 2 nd cancer were treated as censored COD for AIDS defining cancer AIDS and cancer HIV alone NAACCR Webinar Series 59
60 Overview of COD Algorithm Cause of death groups Death attributed to the specific cancer site Sequence 00- one & only one primary Sequence 01 first of more than one tumor Cancer of the same site Yes Yes Cancer of the same body system Yes Yes Cancer of any other site Yes No (in general) AIDS and cancer (B21) Yes HIV/AIDS associated cancers* HIV alone (B20) HIV/AIDS associated cancers* HIV/AIDS associated cancers* Site specific disease Selective Selective *HIV/AIDS associated cancers= Oral Cavity and Pharynx, Cervix, Anus Cancer, and Lymphomas and Kaposi Sarcoma * 119 How do cause-specific rates using new COD variable compare to relative survival rates? NAACCR Webinar Series 60
61 100+ Cancer Sites in SEER, 65+ Ages 100% 90% 80% Relative Survival Rates 70% 60% 50% 40% 30% 20% 10% 0% 0% 20% 40% 60% 80% 100% Absolute diff <3 Abs diff >3+ Cause-specific Rates Compare Relative and Cause-specific* Estimates (Con t) Relative = Observed/Expected If expected rate is overestimated then ( ) Relative = Observed/Expected ( ) If expected rate is underestimated then ( ) Relative = Observed/Expected ( ) *Using SEER Cause-Specific Death Classification Variable NAACCR Webinar Series 61
62 Example of Relative Survival Being Problematic: SEER-13, White AI/AN Relative C-S Diff Relative C-S Diff Breast, In-situ & Prostate, L/R & Lung, All Stage & < Oral Cavity, All Stage & < Note: AI/AN = American Indian/Alaska Native; C-S = Cause-specific; L/R=Localized/Regional Example of Relative Survival Being Problematic: SEER-13, White AI/AN Relative C-S Diff Relative C-S Diff Breast, In-situ & Prostate, L/R & Lung, All Stage & < Oral Cavity, All Stage & < Note: AI/AN = American Indian/Alaska Native; C-S = Cause-specific; L/R=Localized/Regional NAACCR Webinar Series 62
63 Example of Relative Survival Being Problematic: SEER-13, White AI/AN Relative C-S Diff Relative C-S Diff Breast, In-situ & Prostate, L/R & Lung, All Stage & < Oral Cavity, All Stage & < Note: AI/AN = American Indian/Alaska Native; C-S = Cause-specific; L/R=Localized/Regional Example of Relative Survival Being Problematic: SEER-13, White AI/AN Relative C-S Diff Relative C-S Diff Breast, In-situ & Prostate, L/R & Lung, All Stage & < Oral Cavity, All Stage & < Note: AI/AN = American Indian/Alaska Native; C-S = Cause-specific; L/R=Localized/Regional NAACCR Webinar Series 63
64 Absent SES-specific life tables, relative survival rates exaggerate disparity 2000 Census Tract Poverty Relative survival rate Cause- Specific survival rate Bias in expected survival rate Bias in relative survival rate Hi SES, <10.0% Medium SES, 10.0% % Low SES, 20.0% Difference between High and Low SES Note: Corpus & Uterus Cancer patients diagnosed between SEER-13. Conclusion Developed algorithm associating COD to primary cancer Improved cause-specific survival rate estimates In most cases, relative survival estimates are in agreement with cause-specific survival estimates However, relative survival is not suitable for Heavily screened, different SES, high risk of cancer and other diseases, ethnic minorities NAACCR Webinar Series 64

65 Conclusion (Cont d) Lack of appropriate life-table information led to biased survival estimates with relative survival approach Cause-specific estimates could be useful for the above subgroups to provide accurate and reliable survival measures New COD variable implemented in seer*stat software 130 NAACCR Webinar Series 65
66 For More Information Howlader, N., L. Ries, A. Mariotto, M. Reichman, J. Ruhl, and K. Cronin. Improved Estimates of Cancer-Specific Survival Rates from Population-Based Data. Journal of National Cancer Institute, Vol102, Issue 20, October Contact information: Thank you! 132 NAACCR Webinar Series 66


67 Topics in Survival 7/10/2014 CANCER SURVIVAL STATISTICS FOR ASIANS AND HISPANICS IN THE US PAULO S, PINHEIRO, M.D., PH.D., UNIVERSITY NEVADA LAS VEGAS AND NEVADA CENTRAL CANCER REGISTRY NAACCR Webinar Series 67
 Asians (non-hispanic)")


68 IN THIS PRESENTATION Whites (non-hispanic) Blacks (non-hispanic) Asians (non-hispanic) Hispanics POPULATION GROUPS IN THE US 2012 Whites 54% Hispanics 16% Blacks 13% Asians 8% Native Americans <1% Source: NAACCR Webinar Series 68


69 WE NEED BETTER CANCER INDICATORS FOR: HISPANICS ASIANS And that includes survival! TWO TYPES OF FOLLOW-UP IN US REGISTRIES: PASSIVE VS. ACTIVE FOLLOW-UP PASSIVE FOLLOW-UP Ascertainment of deaths Presumed Alive NPCR Mary Pumpkin Diagnosed in 2005, not matched in NDI 2010: Survival time = 5 years ACTIVE FOLLOW-UP idem + Last alive contact Reported Alive SEER Mary Pumpkin Diagnosed in 2005, not matched in NDI 2010, last known as alive in 2007: Survival time = 2 years The Lost to follow-up are presumed as alive The Lost to follow-up and their length of time under observation, e.g. be it 1 month, 4 years or 10 years, is taken into account NAACCR Webinar Series 69
70 ACTIVE VS PASSIVE FOLLOW-UP Does it make any difference when calculating 5-year survival rates (active vs passive follow-up)? 5-YEAR SURVIVAL PROPORTIONS WITH ACTIVE AND PASSIVE FOLLOW- UP. SEER-17, LAST FUP 2009 Site colorectal female breast lung prostate Race/ ethnicity Whites Blacks Hispanics Asians Whites Blacks Hispanics Asians Whites Blacks Hispanics Asians Whites Blacks Hispanics Asians Passive follow up 56.2 ( ) 46.7 ( ) 54.8 ( ) 60.9 ( ) 78.7 ( ) 66.1 ( ) 76.8 ( ) 82.4 ( ) 14.9 ( ) 10.9 ( ) 16.1 ( ) 18.1 ( ) 82.5 ( ) 75.5 ( ) 82.4 ( ) 85.3 ( ) Active followup Site Race/ ethnicity Survival difference (in percent points) 56.0 ( ) 0.2 gall bladder Whites 46.2 ( ) 0.5 Blacks 53.6 ( ) 1.2 Hispanics 59.8 ( ) 1.1 Asians 78.5 ( ) 0.2 liver Whites 65.8 ( ) 0.3 Blacks 75.9 ( ) 0.9 Hispanics 81.9 ( ) 0.5 Asians 14.7 ( ) 0.2 pancreas Whites 10.6 ( ) 0.3 Blacks 14.2 ( ) 1.9* Hispanics 16.0 ( ) 2.1* Asians 82.4 ( ) 0.2 stomach Whites 75.2 ( ) 0.3 Blacks 81.7 ( ) 0.7 Hispanics 84.9 ( ) 0.4 Asians Passive follow up 15.8 ( ) 11.6 ( ) 21.4 ( ) 19.5 ( ) 11.7 ( ) 8.0 ( ) 11.6 ( ) 18.4 ( ) 6.0 ( ) 5.3 ( ) 8.6 ( ) 8.9 ( ) 22.1 ( ) 21.7 ( ) 24.9 ( ) 33.3 ( ) Active followup 15.2 ( ) ( ) ( ) 6.2* 16.8 ( ) ( ) ( ) ( ) 2.0* 16.5 ( ) 1.9* 5.7 ( ) ( ) ( ) 2.7* 6.7 ( ) 2.2* 21.6 ( ) ( ) ( ) 3.4* 31.2 ( ) 2.1 Survival difference (in percent points) NAACCR Webinar Series 70

71 FINDINGS 1. Larger/Significant differences between the two types of follow-up for Hispanics and Asians 2. Larger differences for cancers of poor prognosis PROPORTION OF LOST TO FOLLOW-UP BY TIME AFTER DIAGNOSIS. LUNG CANCER SEER-17 NAACCR Webinar Series 71
72 FINDING Hispanics and Asians are much more likely to be lost to follow-up than Whites or Blacks ARE THOSE WHO ARE LOST TO FOLLOW-UP THE SAME AS THOSE WITH COMPLETE FOLLOW-UP? REVERSE COX REGRESSION, RISK OF LOST FOLLOW-UP, 5 YEARS POST-DIAGNOSIS, BY STAGE, RACE AND ETHNICITY, SEER-17, *, N = 777,641 Population SEER stage N Hazard Ratio* Whites localized/regional 462, distant 109, ( ) unstaged/unknown 29,256 Blacks localized/regional 63, distant 17, ( ) unstaged/unknown 4,386 Hispanics localized/regional 40, distant 8, ( ) unstaged/unknown 2,531 Asians localized/regional 29, distant 7, ( ) unstaged/unknown 1,362 *Adjusted for Age, Year of diagnosis, SEER Registry, Gender, and Cancer Site NAACCR Webinar Series 72
73 FINDING Hispanics and Asians who are lost to follow-up are more likely to have BAD prognoses THIS WILL BIAS OUR SURVIVAL STATISTICS ESTIMATED PROPORTION OF MISSED DEATHS DIAGNOSES WITH LESS THAN 3% 5-YEAR SURVIVAL : HIGHLY FATAL CANCERS DISTANT STAGE LIVER LUNG ETC POPULATION COUNTRY OF ORIGIN Missed deaths / Likely 95% CI deaths WHITES 0.1% ( ) BLACKS 0.3% ( ) HISPANICS 2.8% ( ) Mexican 4.7% ( ) Puerto Rican 0.3% ( ) Cuban 1.3% ( ) Central and South American 9.4% ( ) all other Hispanics 1.2% ( ) ASIANS 2.6% ( ) Chinese 2.8% ( ) Japanese 0.3% ( ) Filipino 4.2% ( ) Hawaiian 0.3% ( ) Korean 1.3% ( ) Vietnamese 2.2% ( ) South Asian (India, Pakistan, Sri Lanka) 6.4% ( ) all other Asians 3.2% ( ) NAACCR Webinar Series 73
74 WE ARE NOT DETECTING 100% OF DEATHS Why? -cause they go back to their countries to die? (salmon bias) -cause they came for treatment only, followed by a quick return home, and are recorded as US de-facto residents? -names? Changed, complicated, unfamiliar, increased likelihood of typos -SSN? About 11 million fake SSNs being used (9 million Hispanics//1.3 millions Asians) Sources and Refs: Federal Trade Commission Report on SSNs and ID theft; Pew Hispanic Center HISPANIC NAMES Juan (1) Manuel (2) Garcia (3) Perez (4) Garcia=father s surname Perez=mother s surname #3 is the true last name as in US standards When in the US: Some will have #3 as last name Some will have #4 as last name Some will have #3 and #4 together as a single name, others as a double-barrelled name NAACCR Webinar Series 74
75 WHAT IS THE TAKE HOME MESSAGE? For Asians and Hispanics: Death Linkages are somewhat deficient: -Reported Alive (SEER) is somewhat deficient -Presumed Alive (NPCR) is more deficient It is a data quality issue, it is problem of the Foreign-born It is not a methods issue IS THIS CURRENTLY A PROBLEM? Very small problem Cancer Registries SURVIVAL RATES RARELY ON HISPANICS AND ASIANS (no life tables) OVERESTIMATION OF RATES AMONG WHITES (TX, FL, CA states with a large proportion of white latinos) Substantial problem Outside Researchers MULTIVARIATE ANALYSES LARGE STATES: FL, TX (PASSIVE follow-up) biased Hispanic advantages CA (ACTIVE follow-up), potential problem to a lesser degree NY (no reports on survival among Hispanics and Asians) NAACCR Webinar Series 75


76 NEED A PUBLICATION? PRESS COVERAGE? TRY THE HISPANIC PARADOX WHAT CAN REGISTRIES DO? CURRENTLY NOT MUCH [DATA RELEASE TO RESEARCHERS] 1- Recommend caution to outside researchers when analyzing survival for Hispanics and Asians 2- Avoid use of the variable birthplace for all survival calculations in registry or in datasets for outside researchers [NDI LINKAGES] 3- If names or dates are problematic then submit multiple name sequences (or dates) possibilities for the NDI linkage, e.g. Cristina Garcia-Perez, submit Cristina Garcia, Cristina Perez, Cristina Garcia-Perez [SSDI LINKAGES] 4- Hopefully available in the near future, this linkage will inform on invalid SSNs and make possible more efforts based on name and DOB with the NDI linkages for these records NAACCR Webinar Series 76
77 ANALYSIS RULE OF THUMB 5- Calculate survival rates for distant stage lung cancer, if the differences between races are significant and very different between races, then that will point toward a problem with the death detection in your registry data Thank you! paulo.pinheiro@unlv.edu NAACCR Webinar Series 77
78 9. Active follow up versus presumed alive survival calculations which is appropriate for your data? Chris Johnson Cancer Data Registry of Idaho Co Chair, NAACCR Survival Analysis Task Force 155 Follow up procedures vary among cancer registries in North America SEER registries ascertain vital status and date of last contact to meet follow up standards. NPCR and Canadian registries primarily conduct linkages with local and national death records to ascertain deaths. 156 NAACCR Webinar Series 78
79 Active Follow Up vs. Passive Follow Up To calculate survival statistics, we are chiefly interested in obtaining follow up information on vital status (alive or dead) and date of last contact or death. Active follow up is any activity which involves direct contact with the patient, the patient s family, or the patient s physician, in order to encourage contact between the patient and the health provider. Passive follow up refers to methods which do not require contact with hospitals, physicians, or patients. Central Cancer Registries: Design, Management, and Use (1994) 157 Passive Follow Up Passive methods are used mostly to determine the vital status of the patient and a more current date last seen alive, or date of death. Sources of information/linkages with: State and national death files Motor vehicles records Hospital discharge data Health care claims data Voter registration 158 NAACCR Webinar Series 79

80 SEER Follow Up Calculation Feb 2013 Submission 159 Active Follow Up vs. Active Follow Up What is in a name? Reported Alive versus Presumed Alive 160 NAACCR Webinar Series 80
81 Presumed Alive Because not all central cancer registries conduct active patient follow up, it is necessary to have an option for calculating survival times based on the assumption that the registry has ascertained all available deaths, and persons not known to be deceased are presumed to be alive as of the last date for which complete death ascertainment is available. 161 Follow Up Time Under Active Follow Up vs. Ascertainment of Deaths Only Patient 1 Active FUP Patient 2 Active FUP Patient 3 Active FUP? Patient 4 Active FUP Patient 5 Active FUP Patient 1 Deaths only????? Patient 2 Deaths only Patient 3 Deaths only????? Patient 4 Deaths only????? Patient 5 Deaths only????? Jan 07 Jan NAACCR Webinar Series 81
82 SEER NPCR SEER SEER NPCR SEER SEER NPCR NPCR NPCR NPCR NPCR NPCR NPCR NPCR NPCR NPCR NPCR 60 Month Observed Survival Cases Followed Through 2008 Female Breast Cancer 0% 10% 20% 30% 40% 50% 60% 70% 80% 90% 100% SEER 163 NPCR The Importance of Death Ascertainment Johnson CJ, Weir HK, Yin D, Niu X. The impact of patient follow up on population based survival rates. J Registry Manag Fall;37(3): OBJECTIVE: designed to measure the impact of variation in patient follow up on survival statistics. METHODS: SEER data used to construct datasets simulated scenarios of complete (SEER), incomplete, and no follow up (NPCR) of alive patients; and complete and incomplete death ascertainment. CONCLUSIONS: Complete death ascertainment important for producing accurate cancer survival statistics, and Ascertainment of deaths only should generally be sufficient for survival analysis. 164 NAACCR Webinar Series 82
83 Follow Up Requirements Alive Status SEER Program requires all SEER registries to follow alive patients 95% patients (minimum of 90%) have current follow up NPCR registries are not required to follow patients impute follow up date to be the end of study (e.g., Dec ) Death Status All Registries conduct death clearance with state DC SEER and NPCR provide support for registries to link with the National Death Index and the Social Security Death Index 165 Reported Alive or Presumed Alive? The at risk interval for living patients should be based on the best available information. Use reported alive method if data meet SEER standards for follow up. Otherwise, use presumed alive method. Reports of cancer survival should clearly indicate whether the results are based on the reported alive method, the presumed alive method, or a combination of both. 166 NAACCR Webinar Series 83
84 Analyzing your own registry data using SEER*Stat Chris Johnson Cancer Data Registry of Idaho Co Chair, NAACCR Survival Analysis Task Force 168 NAACCR Webinar Series 84
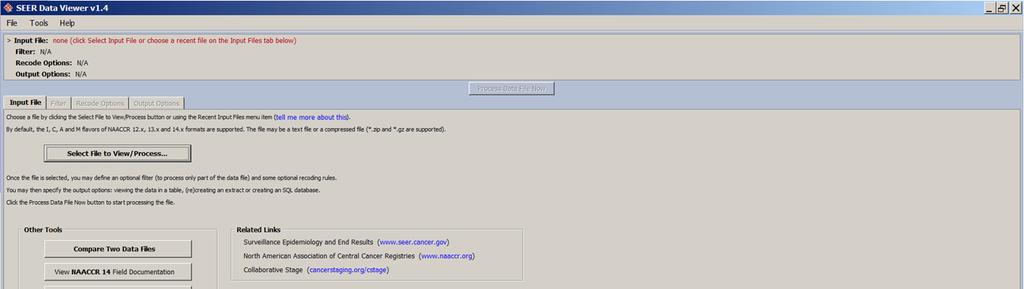
85 Proposed Model for Preparing Registry Data for Survival Analysis Overview 1. Start with your NAACCR Call for Data file (that includes day components of date, cause of death, and county of residence at dx). 2. Process it with SEER Data Viewer software to create new fields for survival (pre calculated survival fields based on days, SEER Cause specific death classification and SEER Other cause of death classification). 3. Run the new file through SEERPrep using latest.dd file. 4. Analyze with SEERStat. 169 Step 1 Start with your NAACCR Call for Data file Where is that pesky file, anyway? If your CFD data file doesn t already include day components of dates, cause of death, and county of residence at dx, make one that does. IMPORTANT make certain the your data file is sorted by Addr at DX state Patient ID Sequence number central so that survival time variables will be calculated correctly and person selection features will be available in SEER*Stat. 170 NAACCR Webinar Series 85
86 Step 2. Process your Data File with SEER Data Viewer software Creates new fields for survival: 7 pre calculated survival fields based on days SEER Cause specific death classification SEER Other cause of death classification In future version, we anticipate that County at Diagnosis will be used to match to life tables for relative survival 171 SEER Survival Variable Resources 7 pre calculated survival fields based on days Additional information about the algorithm and what specific values are assigned in given missing date situations are available here: SEER Cause specific Death Classification NAACCR Webinar Series 86


87 NAACCR Webinar Series 87
. For Nov 2013 CFD, study cutoff year was 2011 the last year you could have ascertained all deaths for.")
 Go to Output Options and select the option to Create a copy of the input file and specify a target name Click the Process Data File Now button 175 176")
88 SEER Data Viewer Instructions File >Preferences and select Survival Time on the left and specify your study cut off year (by default it would be current year 22 months or 2012 currently). For Nov 2013 CFD, study cutoff year was 2011 the last year you could have ascertained all deaths for. To have the data viewer add the survival time fields and SEER cause specific and other cause of death classifications: Select a file to view/process (needs to be NAACCR 13) Go to Output Options and select the option to Create a copy of the input file and specify a target name Click the Process Data File Now button NAACCR Webinar Series 88


89 NAACCR Webinar Series 89


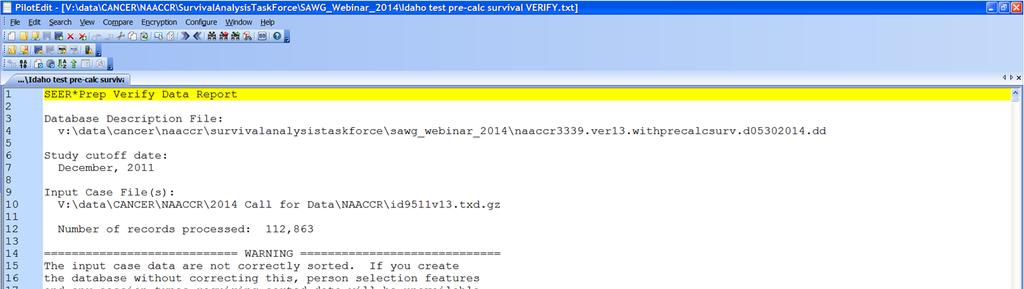
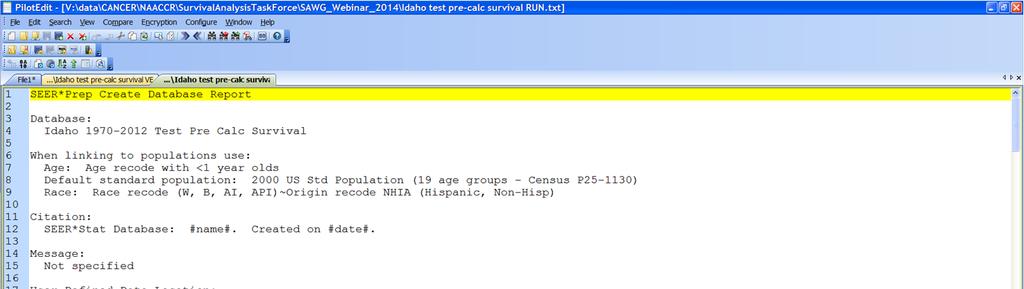
90 179 Step 3. Run the New File through SEER*Prep Run the new file through SEER*Prep using latest.dd file. 180 NAACCR Webinar Series 90
91 What is SEER*Prep? SEER*Prep software converts ASCII text data files to the SEER*Stat database format, allowing you to analyze your cancer data using SEER*Stat. SEER*Prep performs two main functions: it converts text data to the specific binary format required by SEER*Stat, it creates the SEER*Stat data dictionary NAACCR Webinar Series 91


92 NAACCR Webinar Series 92


93 NAACCR Webinar Series 93


94 NAACCR Webinar Series 94
.")
95 Step 4. Analyze Your Data with SEER*Stat 189 What is SEER*Stat? SEER*Stat is a statistical package created for the analysis of SEER and other cancer databases. It was developed by Information Management Services, Inc. in consultation with the SEER Program of the National Cancer Institute (NCI). The SEER*Stat statistical software provides a convenient, intuitive mechanism for the analysis of SEER and other cancer related databases. It is a powerful PC tool to view individual cancer records and to produce statistics for studying the impact of cancer on a population. 190 NAACCR Webinar Series 95
96 191 Overview of SEER*Stat SEER*Stat allows you a great deal of freedom to request the cancer statistics/values/methods you want for your analysis. Part 1: Session Part 2: Execute Part 3: Matrix 192 NAACCR Webinar Series 96
97 Overview of SEER*Stat Part 1: Session The analysis is set up in the session window. Each session consists of tabs on which you select the database subset, statistics, and appearance of your output matrix. You should work through each tab in order from left to right and from top to bottom to ensure that all options have been considered. However, changes can be made in any order. It is possible to work on multiple sessions simultaneously. 193 Overview of SEER*Stat Part 2: Execute Once the session is set up, you are ready to execute it as a job. While the job is executing, you can change the session or begin a new one without affecting the original job. It is possible to execute more than one job at a time. 194 NAACCR Webinar Series 97
98 Overview of SEER*Stat Part 3: Matrix When the job has finished executing, the output matrix you requested is displayed. You can change the appearance of the output matrix, print it, copy it to the Windows clipboard, and/or export the statistics/values so they may be used in another application NAACCR Webinar Series 98
99 NAACCR Webinar Series 99

100 NAACCR Webinar Series 100

101 201 Conclusions: SEER*Stat Advantages of SEER*Stat over other statistical tools: Simple to use GUI Facilitates comparisons with SEER data Can paste results into other Windows programs SEER/NCI is responsible for keeping it updated and standardized Well supported by IMS 202 NAACCR Webinar Series 101
. 2.")
. 3. Run the new file through SEERPrep using latest.dd file. 4.")
102 Proposed Model for Preparing Registry Data for Survival Analysis Overview 1. Start with your NAACCR Call for Data file (that includes day components of date, cause of death, and county of residence at dx). 2. Process it with SEER Data Viewer software to create new fields for survival (pre calculated survival fields based on days, SEER Cause specific death classification and SEER Other cause of death classification). 3. Run the new file through SEERPrep using latest.dd file. 4. Analyze with SEERStat. 203 Questions? 204 NAACCR Webinar Series 102
An Overview of Survival Statistics in SEER*Stat
 An Overview of Survival Statistics in SEER*Stat National Cancer Institute SEER Program SEER s mission is to provide information on cancer statistics in an effort to reduce the burden of cancer among the
NAACCR Data Quality Indicators
 NAACCR Data Quality Indicators NAACCR 2011 2012 Webinar Series June 14, 2012 Q&A Please submit all questions concerning webinar content through the Q&A panel. Reminder: If you have participants watching
PREVIEW OF REGISTRY-SPECIFIC AND AGGREGATED RELATIVE SURVIVAL ESTIMATES IN CANCER IN NORTH AMERICA
 PREVIEW OF REGISTRY-SPECIFIC AND AGGREGATED RELATIVE SURVIVAL ESTIMATES IN CANCER IN NORTH AMERICA CINA SURVIVAL Authors: Chris Johnson, Deborah Hurley, Angela Mariotto, Reda Wilson, Donna Turner, Hannah
Construction of a North American Cancer Survival Index to Measure Progress of Cancer Control Efforts
 Construction of a North American Cancer Survival Index to Measure Progress of Cancer Control Efforts Chris Johnson, Cancer Data Registry of Idaho NAACCR 2016 Annual Conference June 14, 2016 Concurrent
Annual Report to the Nation on the Status of Cancer, , Featuring Survival Questions and Answers
 EMBARGOED FOR RELEASE CONTACT: Friday, March 31, 2017 NCI Media Relations Branch: (301) 496-6641 or 10:00 am EDT ncipressofficers@mail.nih.gov NAACCR: (217) 698-0800 or bkohler@naaccr.org ACS Press Office:
A New Measure to Assess the Completeness of Case Ascertainment
 A New Measure to Assess the Completeness of Case Ascertainment Barnali Das, Ph.D. Linda Pickle, Ph.D. Eric J. (Rocky) Feuer, Ph.D. Lin Clegg, Ph.D. Surveillance Research Program, National Cancer Institute
Key Words. Cancer statistics Incidence Lifetime risk Multiple primaries Survival SEER
 The Oncologist Epidemiology and Population Studies: SEER Series Cancer Statistics, Trends, and Multiple Primary Cancer Analyses from the Surveillance, Epidemiology, and End Results (SEER) Program MATTHEW
Cancer in North America, Executive Summary
 Cancer Incidence in the United States Coverage Cancer in North America, 1996-2000 Executive Summary NAACCR s combined incidence rates for the United States represent the experience of 68 percent of the
Incidence-based Mortality Method to Partition Tumor-Specific Mortality Trends: Application to Non-Hodgkin Lymphoma Cancer
 Incidence-based Mortality Method to Partition Tumor-Specific Mortality Trends: Application to Non-Hodgkin Lymphoma Cancer Nadia Howlader, Lindsay M Morton, Eric J Feuer, Caroline Besson, Eric A Engels
Cancer Statistics, 2008
 CA Cancer J Clin 8;58:71 96 Cancer Statistics, 8 Ahmedin Jemal, DVM, PhD; Rebecca Siegel, MPH; Elizabeth Ward, PhD; Yongping Hao, PhD; Jiaquan Xu*, MD; Taylor Murray; Michael J. Thun, MD, MS ABSTRACT Each
Annual Report to the Nation on the Status of Cancer, , Featuring Survival
 JNCI J Natl Cancer Inst (217) 19(9): djx3 doi: 1.193/jnci/djx3 First published online March 31, 217 Article Annual Report to the Nation on the Status of Cancer, 1975 214, Featuring Survival Ahmedin Jemal,
Nation nal Cancer Institute. Prevalence Projections: The US Experience
 Nation nal Cancer Institute Prevalence Projections: The US Experience State of Art Methods for the Analysis of Population- Based Cancer Data January 22-23, 2014 Ispra, Italy U.S. DEPARTMENT OF HEALTH AND
CDRI Cancer Disparities Geocoding Project. November 29, 2006 Chris Johnson, CDRI
 CDRI Cancer Disparities Geocoding Project November 29, 2006 Chris Johnson, CDRI cjohnson@teamiha.org CDRI Cancer Disparities Geocoding Project Purpose: To describe and understand variations in cancer incidence,
Cancer incidence and mortality patterns among specific Asian and Pacific Islander populations in the U.S.
 Cancer Causes Control (2008) 19:227 256 DOI 10.1007/s10552-007-9088-3 ORIGINAL PAPER Cancer incidence and mortality patterns among specific Asian and Pacific Islander populations in the U.S. Barry A. Miller
Annual Report to the Nation on the Status of Cancer, , with a Special Feature Regarding Survival
 University of Nebraska - Lincoln DigitalCommons@University of Nebraska - Lincoln Public Health Resources Public Health Resources 7-1-2004 Annual Report to the Nation on the Status of Cancer, 1975 2001,
Questions. Developing and Working with Survival Data. Developing and Working with Survival Data 6/2/11. NAACCR Webinar Series 1
 Developing and Working with Survival Data NAACCR 2010-2011 Webinar Series Questions Fabulous Prizes! Question of the Month! The participant that submits the best question of the session will receive a
Methodology for the Survival Estimates
 Methodology for the Survival Estimates Inclusion/Exclusion Criteria Cancer cases are classified according to the International Classification of Diseases for Oncology - Third Edition (ICDO-3) Disease sites
Extract from Cancer survival in Europe by country and age: results of EUROCARE-5 a population-based study
 EUROCARE-5 on-line database Data and methods Extract from Cancer survival in Europe 1999 2007 by country and age: results of EUROCARE-5 a population-based study De Angelis R, Sant M, Coleman MP, Francisci
RESEARCH ARTICLE. Comparison between Overall, Cause-specific, and Relative Survival Rates Based on Data from a Population-based Cancer Registry
 DOI:http://dx.doi.org/.734/APJCP.22.3..568 RESEARCH ARTICLE Comparison between Overall, Cause-specific, and Relative Survival Rates Based on Data from a Population-based Cancer Registry Mai Utada *, Yuko
Global surveillance of cancer survival
 Global surveillance of cancer survival Claudia Allemani Helena Carreira Rhea Harewood Devon Spika Xiao-Si Wang Finian Bannon Jane Ahn Loraine Marrett Donna Turner Thomas C Tucker Hannah K Weir CONCORD
Report on Cancer Statistics in Alberta. Breast Cancer
 Report on Cancer Statistics in Alberta Breast Cancer November 2009 Surveillance - Cancer Bureau Health Promotion, Disease and Injury Prevention Report on Cancer Statistics in Alberta - 2 Purpose of the
Estimated Minnesota Cancer Prevalence, January 1, MCSS Epidemiology Report 04:2. April 2004
 MCSS Epidemiology Report 04:2 Suggested citation Perkins C, Bushhouse S.. Minnesota Cancer Surveillance System. Minneapolis, MN, http://www.health.state.mn.us/divs/hpcd/ cdee/mcss),. 1 Background Cancer
Report on Cancer Statistics in Alberta. Kidney Cancer
 Report on Cancer Statistics in Alberta Kidney Cancer November 29 Surveillance - Cancer Bureau Health Promotion, Disease and Injury Prevention Report on Cancer Statistics in Alberta - 2 Purpose of the Report
Report on Cancer Statistics in Alberta. Melanoma of the Skin
 Report on Cancer Statistics in Alberta Melanoma of the Skin November 29 Surveillance - Cancer Bureau Health Promotion, Disease and Injury Prevention Report on Cancer Statistics in Alberta - 2 Purpose of
Incidence of Cancers Associated with Modifiable Risk Factors and Late Stage Diagnoses for Cancers Amenable to Screening Idaho
 Incidence of Cancers Associated with Modifiable Risk Factors and Late Stage Diagnoses for Cancers Amenable to Screening Idaho 2008-2011 August 2013 A Publication of the Cancer Data Registry of Idaho PO
Cancer in New Mexico 2014
 Cancer in New Mexico 2014 Please contact us! Phone: 505-272-5541 E-Mail: info@nmtr.unm.edu http://som.unm.edu/nmtr/ TABLE OF CONTENTS Introduction... 1 New Cases of Cancer: Estimated Number of New Cancer
Annual Report to the Nation on the Status of Cancer, , Featuring the Increasing Incidence of Liver Cancer
 Annual Report to the Nation on the Status of Cancer, 1975-, Featuring the Increasing Incidence of Liver Cancer A. Blythe Ryerson, PhD, MPH 1 ; Christie R. Eheman, PhD, MSHP 1 ; Sean F. Altekruse, DVM,
Cancer survival and prevalence in Tasmania
 Cancer survival and prevalence in Tasmania 1978-2008 Cancer survival and prevalence in Tasmania 1978-2008 Tasmanian Cancer Registry University of Tasmania Menzies Research Institute Tasmania 17 Liverpool
Key Words. SEER Cancer Survival Incidence Mortality Prevalence
 The Oncologist Cancer Survival and Incidence from the Surveillance, Epidemiology, and End Results (SEER) Program LYNN A. GLOECKLER RIES, MARSHA E. REICHMAN, DENISE RIEDEL LEWIS, BENJAMIN F. HANKEY, BRENDA
Cancer in the Northern Territory :
 Cancer in the Northern Territory 1991 21: Incidence, mortality and survival Xiaohua Zhang John Condon Karen Dempsey Lindy Garling Acknowledgements The authors are grateful to the many people, who have
The Cancer Burden in California. Janet Bates MD MPH California Cancer Registry California Department of Public Health April 25, 2012
 The Cancer Burden in California Janet Bates MD MPH California Cancer Registry California Department of Public Health April 25, 2012 Goals Introduce you to the California Cancer Registry (CCR) Provide an
Impact and implications of Cancer Death Status Reporting Delay on Population- Based Relative Survival Analysis with Presumed-Alive Assumption
 Impact and implications of Cancer Death Status Reporting Delay on Population- Based Relative Survival Analysis with Presumed-Alive Assumption X Dong, Y Ren, R Wilson, and K Zhang NAACCR 6-20-2017 Introduction
Cancer in Rural Illinois, Incidence, Mortality, Staging, and Access to Care. April 2014
 Cancer in Rural Illinois, 1990-2010 Incidence, Mortality, Staging, and Access to Care April 2014 Prepared by Whitney E. Zahnd, MS Research Development Coordinator Center for Clinical Research Southern
Melanoma Surveillance in the United States: Overview of Methods
 Melanoma Surveillance in the United States: Overview of Methods Meg Watson, MPH Epidemiologist Epidemiology and Applied Research Branch Division of Cancer Prevention and Control Centers for Disease Control
Cancer in New Mexico 2017
 Cancer in New Mexico 0 Please contact us! Phone: 0-- E-Mail: nmtr-info@salud.unm.edu URL: nmtrweb.unm.edu TABLE OF CONTENTS Introduction... New Cases of Cancer Estimated Number of New Cancer Cases Description
Incidence of Cancers Associated with Modifiable Risk Factors and Late Stage Diagnoses for Cancers Amenable to Screening Idaho
 Incidence of Cancers Associated with Modifiable Risk Factors and Late Stage Diagnoses for Cancers Amenable to Screening Idaho 2009-2012 June 2015 A Publication of the Cancer Data Registry of Idaho PO Box
North America:
 Cancer Cancer in in North North America: America: 2010-2014 2010-2014 Cancer in North 2010-2014 Volume Volume One: Combined Four:America: Cancer Cancer Survival Incidence Volume Three: Two: Registry-specific
Cancer Statistics, 2011
 Cancer Statistics, 2011 Cancer Statistics, 2011 The Impact of Eliminating Socioeconomic and Racial Disparities on Premature Cancer Deaths Rebecca Siegel, MPH 1 ; Elizabeth Ward, PhD 2 ; Otis Brawley, MD
Trends in Lung Cancer Morbidity and Mortality
 Trends in Lung Cancer Morbidity and Mortality American Lung Association Epidemiology and Statistics Unit Research and Program Services Division November 2014 Table of Contents Trends in Lung Cancer Morbidity
Comparing Cancer Mortality Rates Among US and Foreign-Born Persons: United States,
 National Center for Chronic Disease Prevention and Health Promotion Comparing Cancer Mortality Rates Among US and Foreign-Born Persons: United States, 2005-2014 Benjamin D. Hallowell, PhD, MPH NAACCR 2018
NIH Public Access Author Manuscript Cancer. Author manuscript; available in PMC 2006 December 17.
 NIH Public Access Author Manuscript Published in final edited form as: Cancer. 2005 December 15; 104(12 Suppl): 2989 2998. 1999 2001 Cancer Mortality Rates for Asian and Pacific Islander Ethnic Groups
Rare Cancer Prevalence in the SEER Population: Hepatobiliary Cancers,
 Rare Cancer Prevalence in the SEER Population: Hepatobiliary Cancers, 1975-2015 NAACCR 2018 Annual Conference Andrea Ayers, MPH Outline 1. Rare cancer classification 2. Hepatobiliary cancers 3. Key analytic
CONCORD Programme: Worldwide Surveillance of Cancer Survival. The US Perspective
 CONCORD Programme: Worldwide Surveillance of Cancer Survival The US Perspective Hannah K Weir, PhD Division of Cancer Prevention and Control Centers for Disease Control and Prevention Overview Cancer Surveillance
CANCER IN IDAHO 2016 Preliminary
 CANCER IN IDAHO 2016 Preliminary November 2017 A Publication of the Cancer Data Registry of Idaho Editors: Christopher J. Johnson, MPH, Epidemiologist Stacey L. Carson, RHIT, Vice President Operations
Period estimates of cancer patient survival are more up-to-date than complete estimates even at comparable levels of precision
 Journal of Clinical Epidemiology 59 (2006) 570 575 ORIGINAL ARTICLES Period estimates of cancer patient survival are more up-to-date than estimates even at comparable levels of precision Hermann Brenner
Background. Background. AYA Overview. Epidemiology of AYA Cancers in Texas
 Texas Cancer Registry: Who We Are Epidemiology of AYA Cancers in Texas Melanie Williams, Ph.D. Texas Cancer Registry Cancer Epidemiology and Surveillance Branch Texas Department of State Health Services
Cancer prevalence. Chapter 7
 Chapter 7 Cancer prevalence Prevalence measures the number of people diagnosed with cancer who are still alive. This chapter presents current and historical statistics on cancer prevalence in Ontario.
Cancer in Ontario. 1 in 2. Ontarians will develop cancer in their lifetime. 1 in 4. Ontarians will die from cancer
 Cancer in Ontario 1 in 2 Ontarians will develop cancer in their lifetime 1 in 4 Ontarians will die from cancer 14 ONTARIO CANCER STATISTICS 2016 1 Cancer in Ontario An overview Cancer is a group of more
Christie Eheman, PhD NAACCR 6/2012
 Christie Eheman, PhD NAACCR 6/2012 Comparative Effectiveness Research CDC National Program of Cancer Registries Christie Eheman, PhD NAACCR 6/2012 CDC - Fran Michaud, Dave Butterworth, Linda Mulvihill,
Cancer survival in Bhopal, India,
 Chapter 13 Cancer survival in Bhopal, India, 1991 1995 Dikshit R, Kanhere S and Surange S Abstract The Bhopal population-based cancer registry was established in 1986 under the national cancer registry
The Effect of Changing Hysterectomy Prevalence on Trends in Endometrial Cancer, SEER
 The Effect of Changing Hysterectomy Prevalence on Trends in Endometrial Cancer, SEER 1992-2008 Annie Noone noonea@mail.nih.gov Missy Jamison, Lynn Ries, Brenda Edwards NAACCR 2012 Portland, OR Outline
National Cancer Statistics in Korea, 2014
 National Cancer Statistics in Korea, 2014 2016. 12. 20. Korea Central Cancer Registry Cancer Incidence in Korea, 2014 National Cancer Incidence, 2014 Trends in Cancer Incidence by Sex and Year * Dark colored
Overview of 2010 Hong Kong Cancer Statistics
 Overview of 2010 Hong Kong Cancer Statistics Cancer Registration in Hong Kong The Hong Kong Cancer Registry has since the 1960s been providing population-based cancer data for epidemiological research
Colorectal Cancer Report on Cancer Statistics in Alberta. December Cancer Care. Cancer Surveillance
 December 212 21 Acknowledgements 2 This report was made possible through Alberta Health Services,, and the many contributions of staff and management across Alberta Health Services as well as external
Chapter II: Overview
 : Overview Chapter II: Overview This chapter provides an overview of the status of cancer in Minnesota, using cases reported to the Minnesota Cancer Surveillance System (MCSS) and deaths reported to the
Downloaded from:
 Rachet, B; Coleman, MP; Ellis, L; Shah, A; Cooper, N; Rasulo, D; Westlake, S (8) Cancer survival in the Primary Care Trusts of England, 1998-4. Technical Report. Office for National Statistics. Downloaded
Common Questions about Cancer
 6 What is cancer? Cancer is a group of diseases characterized by uncontrolled growth and spread of abnormal cells. The cancer cells form tumors that destroy normal tissue. If cancer cells break away from
Abstracting and Coding Boot Camp: Cancer Case Scenarios
 NAACC R 2015-2016 Webinar Series Abstracting and Coding Boot Camp: Cancer Case Scenarios NAACCR 2015 2016 Webinar Series Presented by: Angela Martin amartin@naaccr.org Jim Hofferkamp jhofferkamp@naaccr.org
Metropolitan and Micropolitan Statistical Area Cancer Incidence: Late Stage Diagnoses for Cancers Amenable to Screening, Idaho
 Metropolitan and Micropolitan Statistical Area Cancer Incidence: Late Stage Diagnoses for Cancers Amenable to Screening, Idaho 26-29 December 2 A Publication of the CANCER DATA REGISTRY OF IDAHO P.O. Box
Cancer survival in Hong Kong SAR, China,
 Chapter 5 Cancer survival in Hong Kong SAR, China, 1996 2001 Law SC and Mang OW Abstract The Hong Kong cancer registry was established in 1963, and cancer registration is done by passive and active methods.
ELIMINATING HEALTH DISPARITIES IN AN URBAN AREA. VIRGINIA A. CAINE, M.D., DIRECTOR MARION COUNTY HEALTH DEPARTMENT INDIANAPOLIS, INDIANA May 1, 2002
 ELIMINATING HEALTH DISPARITIES IN AN URBAN AREA VIRGINIA A. CAINE, M.D., DIRECTOR MARION COUNTY HEALTH DEPARTMENT INDIANAPOLIS, INDIANA May 1, 2002 Racial and ethnic disparities in health care are unacceptable
2012 Report on Cancer Statistics in Alberta
 212 Report on Cancer Statistics in Alberta Leukemia Surveillance & Reporting CancerControl AB February 215 Acknowledgements This report was made possible through Surveillance & Reporting, Cancer Measurement
Burden of Cancer in California
 Burden of Cancer in California California Cancer Reporting and Epidemiologic Surveillance Institute for Population Health Improvement UC Davis Health August 22, 2018 Outline 1. Incidence and Mortality
CANCER FACTS & FIGURES For African Americans
 CANCER FACTS & FIGURES For African Americans Pennsylvania, 2006 Pennsylvania Cancer Registry Bureau of Health Statistics and Research Contents Data Hightlights...1 Pennsylvania and U.S. Comparison...5
Cancer survival in Seoul, Republic of Korea,
 Cancer survival in Seoul, Republic of Korea, 1993 1997 Ahn YO and Shin MH Abstract The Seoul cancer registry was established in 1991. Cancer is a notifiable disease, and registration of cases is done by
Chapter 13 Cancer of the Female Breast
 Lynn A. Gloeckler Ries and Milton P. Eisner INTRODUCTION This study presents survival analyses for female breast cancer based on 302,763 adult cases from the Surveillance, Epidemiology, and End Results
6/20/2012. Co-authors. Background. Sociodemographic Predictors of Non-Receipt of Guidelines-Concordant Chemotherapy. Age 70 Years
 Sociodemographic Predictors of Non-Receipt of Guidelines-Concordant Chemotherapy - among Locoregional Breast Cancer Patients Under Age 70 Years Xiao-Cheng Wu, MD, MPH 2012 NAACCR Annual Conference June
Cancer Statistics, 2007 Ahmedin Jemal, Rebecca Siegel, Elizabeth Ward, Taylor Murray, Jiaquan Xu and Michael J. Thun
 Ahmedin Jemal, Rebecca Siegel, Elizabeth Ward, Taylor Murray, Jiaquan Xu and Michael J. Thun CA Cancer J Clin 2007;57;43-66 This information is current as of August 3, 2007 The online version of this article,
2012 Report on Cancer Statistics in Alberta
 212 Report on Cancer Statistics in Alberta Kidney Cancer Surveillance & Reporting CancerControl AB February 215 Acknowledgements This report was made possible through Surveillance & Reporting, Cancer Measurement
Liver Cancer Report on Cancer Statistics in Alberta. December Cancer Care. Cancer Surveillance
 December 212 21 Report on Cancer Statistics in Alberta Acknowledgements 2 This report was made possible through Alberta Health Services,, and the many contributions of staff and management across Alberta
THE BURDEN OF CANCER IN NEBRASKA: RECENT INCIDENCE AND MORTALITY DATA
 THE BURDEN OF CANCER IN NEBRASKA: RECENT INCIDENCE AND MORTALITY DATA Presented by: Bryan Rettig, MS Nebraska Dept. of Health & Human Services Division of Public Health May 31, 2017 Nebraska Cancer Registry
Appendix 1 (as supplied by the authors): Supplementary data
: Supplementary data") Appendix 1 (as supplied by the authors): Supplementary data I. Cancer prevalence in Canada We obtained 10 year person based cancer prevalence rates for all of Canada for some years of our study period
Appendix 1 (as supplied by the authors): Supplementary data I. Cancer prevalence in Canada We obtained 10 year person based cancer prevalence rates for all of Canada for some years of our study period
Cancer in Utah: An Overview of Cancer Incidence and Mortality from
 Cancer in Utah: An Overview of Cancer Incidence and Mortality from 1973-2010 A publication of the Utah Cancer Registry January 2014 Prepared by: C. Janna Harrell, MS Senior Research Analyst Kimberly A.
A post-psa Update on Trends in Prostate Cancer Incidence. Ann Hamilton and Myles Cockburn Keck School of Medicine, USC, Los Angeles
 A post-psa Update on Trends in Prostate Cancer Incidence Ann Hamilton and Myles Cockburn Keck School of Medicine, USC, Los Angeles Background 1986: FDA approved PSA test to monitor disease status in prostate
North American Association of Central Cancer Registries (NAACCR)
") North American Association of Central Cancer Registries (NAACCR) Susan T. Gershman President Outline I. NAACCR Organizational Structure II. Data Standards III. Education and Training IV. Certification
North American Association of Central Cancer Registries (NAACCR) Susan T. Gershman President Outline I. NAACCR Organizational Structure II. Data Standards III. Education and Training IV. Certification
Leukemia Report on Cancer Statistics in Alberta. December Cancer Care. Cancer Surveillance
 December 212 21 Report on Cancer Statistics in Alberta Report on Cancer Statistics in Alberta Acknowledgements 2 This report was made possible through Alberta Health Services,, and the many contributions
Health Promotion, Screening, & Early Detection
 OCN Test Content Outline 2018 Health Promotion, Screening, & Early Detection Kelley Blake MSN, RN, AOCNS, OCN UW Medicine/Valley Medical Center I. Care Continuum 19% A. Health promotion & disease prevention
Calibrating Time-Dependent One-Year Relative Survival Ratio for Selected Cancers
 ISSN 1995-0802 Lobachevskii Journal of Mathematics 2018 Vol. 39 No. 5 pp. 722 729. c Pleiades Publishing Ltd. 2018. Calibrating Time-Dependent One-Year Relative Survival Ratio for Selected Cancers Xuanqian
ALL CANCER (EXCLUDING NMSC)
") ALL CANCER (EXCLUDING NMSC) AVERAGE NUMBER OF CASES PER YEAR (2011-2015) AVERAGE NUMBER OF DEATHS PER YEAR (2011-2015) Male Female Both sexes Male Female Both sexes 4,557 4,516 9,073 1 2,196 1,984 4,180
ALL CANCER (EXCLUDING NMSC) AVERAGE NUMBER OF CASES PER YEAR (2011-2015) AVERAGE NUMBER OF DEATHS PER YEAR (2011-2015) Male Female Both sexes Male Female Both sexes 4,557 4,516 9,073 1 2,196 1,984 4,180
North America:
 Cancer Cancer in in North North America: America: 2010-2014 2010-2014 Cancer in North 2010-2014 Volume Volume One: Combined Four:America: Cancer Cancer Survival Incidence Volume Three: Two: Registry-specific
Florida Cancer Data System, University of Miami. Presentation for the Annual Conference of the North American Association of Central Cancer
 Hernandez, MN, Mackinnon, JA, Fleming, LE, Lee, DJ Florida Cancer Data System, University of Miami Presentation for the Annual Conference of the North American Association of Central Cancer Registries
Communities and Universities Working Together to Reduce Cancer Disparities Symposium 2005 UCLA
 Communities and Universities Working Together to Reduce Cancer Disparities Symposium 2005 UCLA Marjorie Kagawa Singer, Ph.D., M.N., M.A., R.N. UCLA School of Public Health and Asian American Studies Center
Boot Camp /5/15
 Abstracting & Coding Boot Camp: Cancer Case Scenarios 2014-2015 NAACCR Webinar Series March 5, 2015 Q&A Please submit all questions concerning webinar content through the Q&A panel. Reminder: If you have
*
 Introduction Cancer is complex, can have many possible causes, and is increasingly common. For the U.S. population, 1 in 2 males and 1 in 3 females is at risk of developing cancer in their lifetime. The
Incidence of Primary Liver Cancer in American Indians and Alaska Natives
 Incidence of Primary Liver Cancer in American Indians and Alaska Natives Stephanie C. Melkonian, PhD Epidemiologist Epidemiology and Applied Research Branch NAACCR Annual Conference June 21, 2017 Overview
Colorectal Cancer in Idaho November 2, 2006 Chris Johnson, CDRI
 Colorectal Cancer in Idaho 2002-2004 November 2, 2006 Chris Johnson, CDRI cjohnson@teamiha.org Colorectal Cancer in Idaho, 2002-2004 Fast facts: Colorectal cancer is the second leading cause of cancer
Kidney Cancer Report on Cancer Statistics in Alberta. December Cancer Care. Cancer Surveillance
 December 212 21 Report on Cancer Statistics in Alberta Report on Cancer Statistics in Alberta Acknowledgements 2 This report was made possible through Alberta Health Services,, and the many contributions
Hysterectomy-Corrected Rates of Endometrial Cancer among Women of Reproductive Age
 Hysterectomy-Corrected Rates of Endometrial Cancer among Women of Reproductive Age Annie Noone noonea@mail.nih.gov NAACCR 2017 Albuquerque, NM Motivation Cancer incidence rates are typically calculated
THE SURVIVORSHIP EXPERIENCE IN PANCREATIC CANCER
 THE SURVIVORSHIP EXPERIENCE IN PANCREATIC CANCER Casey A. Boyd, Jaime Benarroch, Kristin M. Sheffield, Yimei Han, Catherine D. Cooksley, Taylor S. Riall Department of Surgery The University of Texas Medical
Opportunities for Cancer Control An overview of screen-detectable and tobacco-related cancer in New Mexico
 Opportunities for Cancer Control An overview of screen-detectable and tobacco-related cancer in New Mexico Prepared by the New Mexico Tumor Registry for the New Mexico Department of Health February 1,
ALL CANCER (EXCLUDING NMSC)
") ALL CANCER (EXCLUDING NMSC) AVERAGE NUMBER OF CASES PER YEAR (2012-2016) AVERAGE NUMBER OF DEATHS PER YEAR (2012-2016) Male Female Both sexes Male Female Both sexes 4,607 4,632 9,240 1 2,238 2,036 4,274
ALL CANCER (EXCLUDING NMSC) AVERAGE NUMBER OF CASES PER YEAR (2012-2016) AVERAGE NUMBER OF DEATHS PER YEAR (2012-2016) Male Female Both sexes Male Female Both sexes 4,607 4,632 9,240 1 2,238 2,036 4,274
The effect of multiple primary rules on cancer incidence rates and trends
 The effect of multiple primary rules on cancer incidence rates and trends Hannah K. Weir, Centers for Disease Control and Prevention Christopher J. Johnson, Cancer Data Registry of Idaho Kevin C. Ward,
Measuring cancer survival in populations: relative survival vs cancer-specific survival
 Int. J. Epidemiol. Advance Access published February 8, 2010 Published by Oxford University Press on behalf of the International Epidemiological Association ß The Author 2010; all rights reserved. International
Cancer Facts & Figures for African Americans
 Cancer Facts & Figures for African Americans 219-221 Contents Cancer Statistics 1 Figure 1. Non-Hispanic Black Population as a Percentage of Total County Population, 216 1 Table 1. Leading Causes of Death
Estimating and modelling relative survival
 Estimating and modelling relative survival Paul W. Dickman Department of Medical Epidemiology and Biostatistics Karolinska Institutet, Stockholm, Sweden paul.dickman@ki.se Regstat 2009 Workshop on Statistical
Cancer in Ireland : Annual Report of the National Cancer Registry
 Cancer in Ireland 1994-213: Annual Report of the National Cancer Registry 215 Page 3 ABBREVIATIONS 95% CI 95% confidence interval APC Annual percentage change ASR Age-standardised rate (European standard
Epidemiology in Texas 2006 Annual Report. Cancer
 Epidemiology in Texas 2006 Annual Report Cancer Epidemiology in Texas 2006 Annual Report Page 94 Cancer Incidence and Mortality in Texas, 2000-2004 The Texas Department of State Health Services Texas Cancer
Cancer in North America: Volume One: Combined Cancer Incidence for the United States, Canada, and North America
 Cancer in North America: 2007-2011 Volume One: Combined Cancer Incidence for the United States, Canada, and North America Seattle / Puget Sound Greater Bay Area Metro Detroit Washington D.C. Los Angeles
Supplementary Online Content
 Supplementary Online Content Henson KE, Brock R, Charnock J, Wickramasinghe B, Will O, Pitman A. Risk of suicide after cancer diagnosis in England. JAMA Psychiatry. Published online November 21, 2018.
Annual report on status of cancer in China, 2011
 Original Article Annual report on status of cancer in China, 2011 Wanqing Chen, Rongshou Zheng, Hongmei Zeng, Siwei Zhang, Jie He National Office for Cancer Prevention and Control, National Cancer Center,