FUNNEL: Automatic Mining of Spatially Coevolving Epidemics
|
|
|
- Frederica Watkins
- 5 years ago
- Views:
Transcription
1 FUNNEL: Automatic Mining of Spatially Coevolving Epidemics By Yasuo Matsubara, Yasushi Sakurai, Willem G. van Panhuis, and Christos Faloutsos SIGKDD 2014 Presented by Sarunya Pumma
2 This presentation has been modified from a presentation slide from SIGKDD 2014 Link to the presentation:
3 Outline Introduction & motivation Problem definition Epidemic modeling using FUNNEL With a single epidemic With multi-evolving epidemics Optimization algorithm Experiments and results Conclusion
4 Introduction & Motivation
5 Introduction & Motivation Given a large set of epidemiological data Shocks (in 1941) Vaccine effect Yearly periodicity Measles cases in the U.S. (number of infectious per week) How to find a model that can represent it efficiently?
6 Introduction & Motivation Considering some existing models The SI model Pros Use a few number of parameters Can capture the dynamics of epidemiological data Cons Cannot represent periodic patterns Cannot use for predicting a future trend S R I Recall a general SIR model Picture reference:
 Non-linear pattern Picture reference: https://www.linkedin.")
7 Introduction & Motivation Considering some existing models The auto regression (AR) model Pros Use a few number of parameters Cons Cannot model the non-linear patterns (i.e. virus propagation) Non-linear pattern Picture reference:

8 Introduction & Motivation Considering some existing models The PARAFAC model (a generalization of PCA) Pros Use a few number of parameters Cons Cannot handle missing values A graphical representation of a twocomponent PARAFAC model of the data array X Picture reference:
9 Introduction & Motivation They proposed FUNNEL A model for describing non-linear dynamics in coevolving epidemics Properties Sense-making: it can describe the seasonality of diseases, vaccination, and external shocks Fully automatic: it is parameter-free and be able to handle missing/mistake values. No human interaction required Scalable: it scales linearly with the input size Generality: it can be applied to many types of epidemic data
10 Problem Definition
11 Data Description Project Tycho provides infectious diseases data in the U.S. 50 states 56 diseases d l x X n 1888 Time (weekly) (> 125 years) x is number of cases (infectious) e.g. ( measles, NY, April 1-7, 1931, 4000 )
12 Problem Definition Given: Tensor X (disease x state x time) X Find: Compact representation of X X = FUNNEL P1 P2 P3 P4 P5 Pi is property i
13 Problem Definition Important properties of epidemics P1 - yearly periodicity P2 - disease reduction effects P3 - area specificity and sensitivity P4 - external shock events P5 - mistakes, incorrect values
14 Problem Definition P1 - Yearly periodicity Radius: seasonality strength Angle: peak season Spring Summer Winter Fall
 Winter")
15 Problem Definition P1 - Yearly periodicity Radius: seasonality strength Angle: peak season Spring Summer Influenza (peak in cold season) Winter Fall
")
16 Problem Definition P1 - Yearly periodicity Radius: seasonality strength Angle: peak season Spring Summer Measles (peak in spring) Winter Fall
")
17 Problem Definition P1 - Yearly periodicity Radius: seasonality strength Angle: peak season Spring Summer Winter Lyme-disease (peak in summer) Fall
 (no peak season) Summer Winter")
18 Problem Definition P1 - Yearly periodicity Radius: seasonality strength Angle: peak season Spring Gonorrhea (STD) (no peak season) Summer Winter Fall

19 Problem Definition P2 - Disease reduction effects Vaccine licensure in 1963

20 Problem Definition P3 - Area specificity and sensitivity Potential population of susceptible for measles PA NY CA TX

21 Problem Definition P4 - External shock events Large outbreaks of measles

22 Problem Definition P5 - Mistakes, incorrect values (Typo)
23 Epidemic Modeling using FUNNEL
24 FUNNEL with a Single Epidemic FUNNEL-BASE where Amplitude of the fluctuation Phase shift of the seasonal cycle Pp = 52, N = S(t) + I(t) + V(t), Average of rate β over the year Number of weeks in a year S(1) = N - 1, I(1) = 1, V(1) = 0 b = {N, β0, δ, γ, Pa, Ps}
25 FUNNEL with a Single Epidemic FUNNEL-R (with disease reduction) where Starting time of disease reduction effect Reduction rate Diffusion rate of the disease reduction effect r = {t θ, θ0}
26 FUNNEL with a Single Epidemic FUNNEL-RE (with disease reduction and external shocks) where Total number of events Temporal susceptible rate Strength of the external shock Duration of the event e (T) = {tμ, t σ, ε0 } Central time point of the external shock event
27 FUNNEL with Multi-Evolving Epidemics Find: Compact representation of X FUNNEL F = {B, R, N, E, M} disease d l states X n time = FUNNEL Global view N B R E M P1 P2 P3 P4 P5 Global view Local view Extra view Extra view Seasonality Reduction P1 P2 bi = {Ni, β0i, δi, γi, Pai, Psi}, bi ϵ B ri = {t θi, θ0i}, ri ϵ R i is a disease ID
28 FUNNEL with Multi-Evolving Epidemics Find: Compact representation of X FUNNEL F = {B, R, N, E, M} disease d l states X n time = FUNNEL N B R E M P1 P2 P3 P4 P5 Global view Global view Local view Extra view Extra view Locality P3 Nij = Sij(t) + Iij(t) + Vij(t) i is a disease ID j is a state ID
 in the full model with e (S) to consider l individual")
29 FUNNEL with Multi-Evolving Epidemics Find: Compact representation of X FUNNEL F = {B, R, N, E, M} disease d l states P4 X n time External shocks = FUNNEL B Global view R N P1 P2 P3 P4 P5 Global view Local view E Recall: temporal susceptible rate Extra view M Extra view E = We replace e (T) in the full model with e (S) to consider l individual location
30 FUNNEL with Multi-Evolving Epidemics Find: Compact representation of X FUNNEL F = {B, R, N, E, M} disease d l states X n time = FUNNEL Global view N B R E M P1 P2 P3 P4 P5 Global view Local view Extra view Extra view Mistake values P5 M is a 3rd-order tensor of mistake data points (a very sparse tensor)
31 Optimization Algorithm
32 Optimization Algorithm The optimization follows the minimum description length (MDL) principle Objective: minimize the size of data by compressing it Objective function: cost of model description (spacewise) Data compression: Huffman coding with a Gaussian distribution is adopted
33 Optimization Algorithm Multi-layer optimization Global-fit is F G = {B, R, E (D), E (T), M (D), M (T) } Local-fit is F L = {N, E (S), M (S) } Levenlerg-Marquardt (LM) is adopted to minimize the cost function
34 Experiments and Results
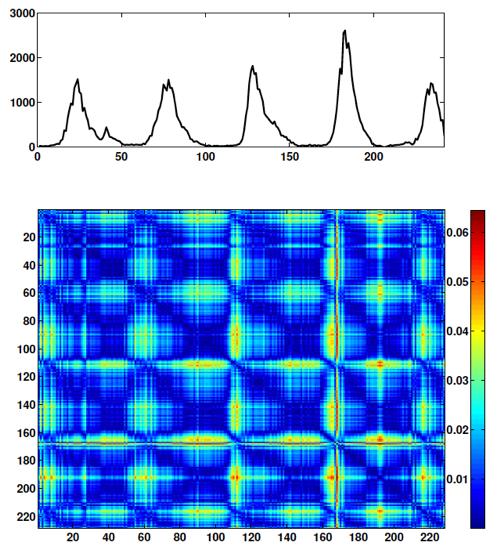
35 Mumps (Seasonality Disease)

36 Local-Level Fittings for Measles

37 External-Shock Effects

38 Missing Data and Incorrect Data Point Effects

39 Model Accuracy
40 Model Scalability
41 Forecasting Train data: 2/3 Forecast: 1/3

42 Apply to Other Applications Computer virus outbreaks!
43 Conclusion
44 Conclusion FUNNEL is an efficient model for representing epidemic dynamics It can capture yearly-periodicity, epidemic reduction, and local sensitivity efficiently It is fully automatic and highly scalable It can handle missing/wrong data effectively It is general which can be applied to various domains

45 Thank you for your attention
46 Dynamic Poisson Autoregression for Influenza-Like-Illness Case Count Prediction By Zheng Wang, Prithwish Chakrabortty, Sumiko R. Mekaru, John S. Brownstein, Jieping Ye, Naren Ramakrishnan KDD 2015 Presented by Sarunya Pumma
47 Outline Introduction & motivation Case count forecasting ARX model for time series prediction Dynamic ARX model Dynamic Poisson ARX model Experiments and results Conclusion
48 Introduction & Motivation
49 Introduction & Motivation Influenza-like-illness (ILI) is the most common disease Example of Influenza-like-illness case count Goal: predicting characteristics of ILI Seasonal characteristics Overall shape of ILI counts for a specific season (e.g., peak value, peak size Short-term characteristics Absolute values of next data points Picture reference:
50 Introduction & Motivation Existing works SEIR and SIRS Curve simulations with network-based models Filtering -based methods Existing indicator sources Online indicator (Google Flu Trend, Wikipedia, Twitter, etc.) Weather Existing works used the same model to predict influenza for the entire season Characteristics of influenza are different in the peak-season and off-season
51 Introduction & Motivation Proposed work A time series model for predicting short-term characteristics of ILI by using external factors from indicator sources Overview of the model Base model is autoregressive exogenous model (ARX) Models are built separately for each time point To model activities of the disease that evolve over time Models share common characteristics Block coordinate descent is used to fit the model
52 Case Count Forecasting
53 ARX Model for Time Series Prediction General ARX model error yt = F(yt-1, yt-2, yt-3,, xt-1, xt-2, xt-3) + εt variable of interest external variable
54 ARX Model for Time Series Prediction General ARX model weight of the target variables weight of the exogenous variables where p and b are previous time steps
55 ARX Model for Time Series Prediction Compact form where We would like to minimize the least square loss
56 Dynamic ARX Model We build a model for each time point Model similarity graph Node is the model (wt) at each time point Edge is a similarity between 2 models

57 Dynamic ARX Model Model similarity graph with different prior knowledge Fully connected nearest neighbors seasonal nearest neighbors
58 Dynamic ARX Model Adding a similarity measure (Euclidean distance) to the ARX model model similarity Solve a regression problem by using the block coordinate descent optimization
59 Dynamic Poisson ARX Model Since we predict the infected people at different time points, we formulate the problem as Poisson regression Likelihood function From the link function we get
60 Dynamic Poisson ARX Model We maximize the log-likelihood to train weights We can get from the identity link function Then we get our final model
61 Experiment and Results
62 Datasets Reference source: PAHO/CDC US and 14 Latin American countries Weekly count From Jan 1, 2010 to Oct 8, 2014 Physical indicators 5 weather attributes (absolute/relative/specific humidity, precipitation, and temperature) Social indicators Google Flu Trends Google Search Treands HealthMap
63 Evaluation Measures Prediction error actual value predicted value number of time points Prediction Score is 4 - error (a perfect score is 4)
64 Model Similarity

65 Model Similarity Fully connected nearest neighbors seasonal nearest neighbors
66 Forecasting Results Training data First 50 time points Time step settings p = 1 (target variables) and b = 15 (exogenous params) Result DPARX can yield better prediction accuracy than others
67 Seasonal Analysis They calculated the short-term predictions in multiple steps and fitted the curve to get seasonal prediction
68 Conclusion
69 Conclusion DPARX can predict a number ILI cases at a desire time point DPARX extends the original ARX by having a dynamic term based on the similarity between models DPARX can also efficiently reflect the seasonal characteristics of ILI

70 Thank you for your attention
Data Driven Methods for Disease Forecasting
 Data Driven Methods for Disease Forecasting Prithwish Chakraborty 1,2, Pejman Khadivi 1,2, Bryan Lewis 3, Aravindan Mahendiran 1,2, Jiangzhuo Chen 3, Patrick Butler 1,2, Elaine O. Nsoesie 3,4,5, Sumiko
Tom Hilbert. Influenza Detection from Twitter
 Tom Hilbert Influenza Detection from Twitter Influenza Detection from Twitter Addressed Problem Contributions Technical Approach Model Data Results/Findings Page 2 Influenza Detection from Twitter Addressed
Agent-Based Models. Maksudul Alam, Wei Wang
 Agent-Based Models Maksudul Alam, Wei Wang Outline Literature Review about Agent-Based model Modeling disease outbreaks in realistic urban social Networks EpiSimdemics: an Efficient Algorithm for Simulating
SIS-SEIQR Adaptive Network Model for Pandemic Influenza
 SIS-SEIQR Adaptive Network Model for Pandemic Influenza WANNIKA JUMPEN,2, SOMSAK ORANKITJAROEN,2, PICHIT BOONKRONG,2 BOONMEE WATTANANON, BENCHAWAN WIWATANAPATAPHEE,2 Department of Mathematics, Faculty
Time series analyses and transmission models for influenza
 Time series analyses and transmission models for influenza Cécile Viboud Division of Epidemiology and International Population Studies Fogarty International Center, National Institutes of Health Bethesda,
Visual and Decision Informatics (CVDI)
") University of Louisiana at Lafayette, Vijay V Raghavan, 337.482.6603, raghavan@louisiana.edu Drexel University, Xiaohua (Tony) Hu, 215.895.0551, xh29@drexel.edu Tampere University (Finland), Moncef Gabbouj,
University of Louisiana at Lafayette, Vijay V Raghavan, 337.482.6603, raghavan@louisiana.edu Drexel University, Xiaohua (Tony) Hu, 215.895.0551, xh29@drexel.edu Tampere University (Finland), Moncef Gabbouj,
Large Graph Mining: Power Tools and a Practitioner s guide
 Large Graph Mining: Power Tools and a Practitioner s guide Task 6: Virus/Influence Propagation Faloutsos, Miller,Tsourakakis CMU KDD'09 Faloutsos, Miller, Tsourakakis P6-1 Outline Introduction Motivation
Part 3: Case Studies. McGlohon, Faloutsos ICWSM
 Part 3: Case Studies 3-1 Outline Part 1: How do networks form, evolve, collapse? Part 2: What tools can we use to study networks? Part 3: Case studies How do ideas diffuse through a network? How to detect
CHALLENGES IN INFLUENZA FORECASTING AND OPPORTUNITIES FOR SOCIAL MEDIA MICHAEL J. PAUL, MARK DREDZE, DAVID BRONIATOWSKI
 CHALLENGES IN INFLUENZA FORECASTING AND OPPORTUNITIES FOR SOCIAL MEDIA MICHAEL J. PAUL, MARK DREDZE, DAVID BRONIATOWSKI NOVEL DATA STREAMS FOR INFLUENZA SURVEILLANCE New technology allows us to analyze
Yugo Shobugawa, MD, PhD med.niigata-u.ac.jp
 1. Previous Host Immunity Affected Clustering of Influenza in Sado island, Japan 2. Prediction of Onset Timing of Seasonal Influenza Epidemic, Japan Yugo Shobugawa, MD, PhD yugo@ med.niigata-u.ac.jp Post
Exercises on SIR Epidemic Modelling
 Exercises on SIR Epidemic Modelling 1 Epidemic model (from Wikipedia) An epidemic model is a simplified means of describing the transmission of communicable disease through individuals. The modeling of
List of Figures. 3.1 Endsley s Model of Situational Awareness Endsley s Model Applied to Biosurveillance... 64
 List of Figures 1.1 Select Worldwide Disease Occurrences in Recent Decades... 5 1.2 Biosurveillance Taxonomy... 6 1.3 Public Health Surveillance Taxonomy... 7 1.4 Improving the Probability of Detection
Modern Epidemiology A New Computational Science
 Modern Epidemiology A New Computational Science Facilitating Epidemiological Research through Computational Tools Armin R. Mikler Computational Epidemiology Research Laboratory Department of Computer Science
Searching for flu. Detecting influenza epidemics using search engine query data. Monday, February 18, 13
 Searching for flu Detecting influenza epidemics using search engine query data By aggregating historical logs of online web search queries submitted between 2003 and 2008, we computed time series of
The mathematics of diseases
 1997 2004, Millennium Mathematics Project, University of Cambridge. Permission is granted to print and copy this page on paper for non commercial use. For other uses, including electronic redistribution,
Motivation: Fraud Detection
 Outlier Detection Motivation: Fraud Detection http://i.imgur.com/ckkoaop.gif Jian Pei: CMPT 741/459 Data Mining -- Outlier Detection (1) 2 Techniques: Fraud Detection Features Dissimilarity Groups and
Project title: Using Non-Local Connectivity Information to Identify Nascent Disease Outbreaks
 MIDAS Pilot Study Final Report Project title: Using Non-Local Connectivity Information to Identify Nascent Disease Outbreaks Tongbo Huang, James Sharpnack and Aarti Singh Carnegie Mellon University 1 Specific
Stochastic Modelling of the Spatial Spread of Influenza in Germany
 Stochastic ling of the Spatial Spread of Influenza in Germany, Leonhard Held Department of Statistics Ludwig-Maximilians-University Munich Financial support by the German Research Foundation (DFG), SFB
Counteracting structural errors in ensemble forecast of influenza outbreaks
 DOI:.38/s4467-7-33- Counteracting structural errors in ensemble forecast of influenza outbreaks Sen Pei & Jeffrey Shaman OPEN For influenza forecasts generated using dynamical models, forecast inaccuracy
Statistical modeling for prospective surveillance: paradigm, approach, and methods
 Statistical modeling for prospective surveillance: paradigm, approach, and methods Al Ozonoff, Paola Sebastiani Boston University School of Public Health Department of Biostatistics aozonoff@bu.edu 3/20/06
MMCS Turkey Flu Pandemic Project
 MMCS Turkey Flu Pandemic Project This is a group project with 2 people per group. You can chose your own partner subject to the constraint that you must not work with the same person as in the banking
MAE 298, Lecture 10 May 4, Percolation and Epidemiology on Networks
 MAE 298, Lecture 10 May 4, 2006 Percolation and Epidemiology on Networks Processes on networks Search for information Spreading processes Interplay of topology and function Epidemiology Understanding how
Influence propagation in large graphs - theorems and algorithms
 Influence propagation in large graphs - theorems and algorithms B. Aditya Prakash http://www.cs.cmu.edu/~badityap Christos Faloutsos http://www.cs.cmu.edu/~christos Carnegie Mellon University GraphEx 12
Temporal Topic Modeling to Assess Associations between News Trends and Infectious Disease Outbreaks
 Temporal Topic Modeling to Assess Associations between News Trends and Infectious Disease Outbreaks The Harvard community has made this article openly available. Please share how this access benefits you.
Seasonality of influenza activity in Hong Kong and its association with meteorological variations
 Seasonality of influenza activity in Hong Kong and its association with meteorological variations Prof. Paul Chan Department of Microbiology The Chinese University of Hong Kong Mr. HY Mok Senior Scientific
Predicting the Peak of Influenza Cases by Geographical Zones in Alberta. Jeannette Amissah
 Predicting the Peak of Influenza Cases by Geographical Zones in Alberta by Jeannette Amissah A thesis submitted in partial fulfillment of the requirements for the degree of Master of Science in BIOSTATISTICS
A Vision-based Affective Computing System. Jieyu Zhao Ningbo University, China
 A Vision-based Affective Computing System Jieyu Zhao Ningbo University, China Outline Affective Computing A Dynamic 3D Morphable Model Facial Expression Recognition Probabilistic Graphical Models Some
Towards Real Time Epidemic Vigilance through Online Social Networks
 Towards Real Time Epidemic Vigilance through Online Social Networks SNEFT Social Network Enabled Flu Trends Lingji Chen [1] Harshavardhan Achrekar [2] Benyuan Liu [2] Ross Lazarus [3] MobiSys 2010, San
MISMS: International influenza research activities at the Fogarty International Center, NIH
 MISMS: International influenza research activities at the Fogarty International Center, NIH Stacey Knobler and Gerardo Chowell For the Multinational Influenza Seasonal Mortality Study Group (MISMS) Division
Deterministic Compartmental Models of Disease
 Math 191T, Spring 2019 1 2 3 The SI Model The SIS Model The SIR Model 4 5 Basics Definition An infection is an invasion of one organism by a smaller organism (the infecting organism). Our focus is on microparasites:
Predicting Sleep Using Consumer Wearable Sensing Devices
 Predicting Sleep Using Consumer Wearable Sensing Devices Miguel A. Garcia Department of Computer Science Stanford University Palo Alto, California miguel16@stanford.edu 1 Introduction In contrast to the
Network Science: Principles and Applications
 Network Science: Principles and Applications CS 695 - Fall 2016 Amarda Shehu,Fei Li [amarda, lifei](at)gmu.edu Department of Computer Science George Mason University Spreading Phenomena: Epidemic Modeling
NIH Public Access Author Manuscript Conf Proc IEEE Eng Med Biol Soc. Author manuscript; available in PMC 2013 February 01.
 NIH Public Access Author Manuscript Published in final edited form as: Conf Proc IEEE Eng Med Biol Soc. 2012 August ; 2012: 2700 2703. doi:10.1109/embc.2012.6346521. Characterizing Non-Linear Dependencies
Forecasting the Influenza Season using Wikipedia
 Forecasting the 2013 2014 Influenza Season using Wikipedia Kyle S. Hickmann, Geoffrey Fairchild, Reid Priedhorsky, Nicholas Generous James M. Hyman, Alina Deshpande, Sara Y. Del Valle arxiv:1410.7716v2
Cellular Automata Model for Epidemics
 Cellular Automata Model for Epidemics Sharon Chang UC Davis Physics shschang@ucdavis.edu Cellular automata models are used to simulate the spread of disease across a population. Two types of infections
The Structure of Social Contact Graphs and their impact on Epidemics
 The Structure of Social Contact Graphs and their impact on Epidemics Anil Vullikanti Virginia Bioinformatics Institute, and Dept. of Computer Science, Virginia Tech Joint work with: Chris Barrett, Madhav
Some Thoughts on Calibrating LaModel
 Some Thoughts on Calibrating LaModel Dr. Keith A. Heasley Professor Department of Mining Engineering West Virginia University Introduction Recent mine collapses and pillar failures have highlighted hli
Infectious disease modeling
 Infectious disease modeling Matthew Macauley Department of Mathematical Sciences Clemson University http://www.math.clemson.edu/~macaule/ Math 4500, Spring 2017 M. Macauley (Clemson) Infectious disease
SEIQR-Network Model with Community Structure
 SEIQR-Network Model with Community Structure S. ORANKITJAROEN, W. JUMPEN P. BOONKRONG, B. WIWATANAPATAPHEE Mahidol University Department of Mathematics, Faculty of Science Centre of Excellence in Mathematics
Jonathan D. Sugimoto, PhD Lecture Website:
 Jonathan D. Sugimoto, PhD jons@fredhutch.org Lecture Website: http://www.cidid.org/transtat/ 1 Introduction to TranStat Lecture 6: Outline Case study: Pandemic influenza A(H1N1) 2009 outbreak in Western
Challenges in Developing Learning Algorithms to Personalize mhealth Treatments
 Challenges in Developing Learning Algorithms to Personalize mhealth Treatments JOOLHEALTH Bar-Fit Susan A Murphy 01.16.18 HeartSteps SARA Sense 2 Stop Continually Learning Mobile Health Intervention 1)
Associations of Seasonal Influenza Activity with Meteorological Parameters in Temperate and Subtropical Climates: Germany, Israel, Slovenia and Spain
 Associations of Seasonal Influenza Activity with Meteorological Parameters in Temperate and Subtropical Climates: Germany, Israel, Slovenia and Spain Radina P. Soebiyanto 1,2, Pernille Jorgensen 3, Diane
Learning Classifier Systems (LCS/XCSF)
") Context-Dependent Predictions and Cognitive Arm Control with XCSF Learning Classifier Systems (LCS/XCSF) Laurentius Florentin Gruber Seminar aus Künstlicher Intelligenz WS 2015/16 Professor Johannes Fürnkranz
Context-Dependent Predictions and Cognitive Arm Control with XCSF Learning Classifier Systems (LCS/XCSF) Laurentius Florentin Gruber Seminar aus Künstlicher Intelligenz WS 2015/16 Professor Johannes Fürnkranz
Ongoing Influenza Activity Inference with Real-time Digital Surveillance Data
 Ongoing Influenza Activity Inference with Real-time Digital Surveillance Data Lisheng Gao Department of Machine Learning Carnegie Mellon University lishengg@andrew.cmu.edu Friday 8 th December, 2017 Background.
Influenza forecast optimization when using different surveillance data types and geographic scale
 Received: 12 February 2018 Accepted: 11 July 2018 DOI: 10.1111/irv.12594 ORIGINAL ARTICLE Influenza forecast optimization when using different surveillance data types and geographic scale Haruka Morita
FORECASTING DEMAND OF INFLUENZA VACCINES AND TRANSPORTATION ANALYSIS.
 FORECASTING DEMAND OF INFLUENZA VACCINES AND TRANSPORTATION ANALYSIS. GROUP MEMBER 1. HOLLY / NGHIEM NGUYET HUU RA6057117 2. YOSUA TJOKRO HINDRO / RA6057060 3. ADAM HUNG 洪一智 4. STAN LU 陸潤龍 RA7041193 CONTENTS
Epidemic Modeling with Cellular Automata
 Epidemic Modeling with Cellular Automata Bernadetta Stachura-Terlecka, Antoni Ligęza 07.03.2018 BST ALI ( ) Epidemic Modeling with Cellular Automata 2018 1 / 12 Outline 1 State of the art 2 Classical CA
Neuron, Volume 63 Spatial attention decorrelates intrinsic activity fluctuations in Macaque area V4.
 Neuron, Volume 63 Spatial attention decorrelates intrinsic activity fluctuations in Macaque area V4. Jude F. Mitchell, Kristy A. Sundberg, and John H. Reynolds Systems Neurobiology Lab, The Salk Institute,
FORECASTING THE DEMAND OF INFLUENZA VACCINES AND SOLVING TRANSPORTATION PROBLEM USING LINEAR PROGRAMMING
 National Cheng Kung University Institute of International Management Business Decision Methods FORECASTING THE DEMAND OF INFLUENZA VACCINES AND SOLVING TRANSPORTATION PROBLEM USING LINEAR PROGRAMMING HOLLY
A dynamic spatio-temporal model to investigate the effect of movements of animals on the spreading of Bluetongue BTV-8 in Belgium
 A dynamic spatio-temporal model to investigate the effect of movements of animals on the spreading of Bluetongue BTV-8 in Belgium Chellafe Ensoy 1, Christel Faes 1, Marc Aerts 1 1 I-Biostat, Hasselt University,
Epidemics & Networks. Jesús Gómez Gardeñes Instituto de Biocomputación y Física de Sistemas Complejos (BIFI) Universidad de Zaragoza
 Universidad de Zaragoza") Epidemics & Networks Jesús Gómez Gardeñes Instituto de Biocomputación y Física de Sistemas Complejos (BIFI) Universidad de Zaragoza DO WE NEED A MOTIVATION? Epidemics Lecture III: & Networks, Walks, Conges4on
Epidemics & Networks Jesús Gómez Gardeñes Instituto de Biocomputación y Física de Sistemas Complejos (BIFI) Universidad de Zaragoza DO WE NEED A MOTIVATION? Epidemics Lecture III: & Networks, Walks, Conges4on
Machine Learning for Population Health and Disease Surveillance
 Machine Learning for Population Health and Disease Surveillance Daniel B. Neill, Ph.D. H.J. Heinz III College Carnegie Mellon University E-mail: neill@cs.cmu.edu We gratefully acknowledge funding support
Mobile Health Surveillance: The Development of Software Tools for. Monitoring the Spread of Disease
 Mobile Health Surveillance: The Development of Software Tools for Monitoring the Spread of Disease Albert Gerovitch 1 and Andrew Gritsevskiy 2 and Gregory Barboy 3 Abstract Disease spread monitoring data
A Predictive Chronological Model of Multiple Clinical Observations T R A V I S G O O D W I N A N D S A N D A M. H A R A B A G I U
 A Predictive Chronological Model of Multiple Clinical Observations T R A V I S G O O D W I N A N D S A N D A M. H A R A B A G I U T H E U N I V E R S I T Y O F T E X A S A T D A L L A S H U M A N L A N
Influenza Surveillance Report
 Influenza Surveillance Report www.infectiousdisease.dhh.la.gov Week 5: 12/23/18-12/29/18 Influenza activity increased this week in Louisiana. Rhino/Enteroviruses, RSV, and Coronaviruses represent the majority
Data-Driven Methods for Modeling and Predicting Multivariate Time Series using Surrogates
 Data-Driven Methods for Modeling and Predicting Multivariate Time Series using Surrogates Prithwish Chakraborty Dissertation submitted to the Faculty of the Virginia Polytechnic Institute and State University
Statistics 202: Data Mining. c Jonathan Taylor. Final review Based in part on slides from textbook, slides of Susan Holmes.
 Final review Based in part on slides from textbook, slides of Susan Holmes December 5, 2012 1 / 1 Final review Overview Before Midterm General goals of data mining. Datatypes. Preprocessing & dimension
Data mining for Obstructive Sleep Apnea Detection. 18 October 2017 Konstantinos Nikolaidis
 Data mining for Obstructive Sleep Apnea Detection 18 October 2017 Konstantinos Nikolaidis Introduction: What is Obstructive Sleep Apnea? Obstructive Sleep Apnea (OSA) is a relatively common sleep disorder
Introduction to Reproduction number estimation and disease modeling
 Introduction to Reproduction number estimation and disease modeling MISMS Latin America Influenza Meeting and Training Workshop 25 June 2012 Gerardo Chowell & Cécile Viboud Generation time The time from
Case Studies in Ecology and Evolution. 10 The population biology of infectious disease
 10 The population biology of infectious disease In 1918 and 1919 a pandemic strain of influenza swept around the globe. It is estimated that 500 million people became infected with this strain of the flu
What do epidemiologists expect with containment, mitigation, business-as-usual strategies for swine-origin human influenza A?
 What do epidemiologists expect with containment, mitigation, business-as-usual strategies for swine-origin human influenza A? Dr Thomas TSANG Controller, Centre for Health Protection, Department of Health
Mathematical modelling of infectious disease transmission
 Mathematical modelling of infectious disease transmission Dennis Chao Vaccine and Infectious Disease Division Fred Hutchinson Cancer Research Center 11 May 2015 1 / 41 Role of models in epidemiology Mathematical
Data Mining. Outlier detection. Hamid Beigy. Sharif University of Technology. Fall 1395
 Data Mining Outlier detection Hamid Beigy Sharif University of Technology Fall 1395 Hamid Beigy (Sharif University of Technology) Data Mining Fall 1395 1 / 17 Table of contents 1 Introduction 2 Outlier
Keywords Artificial Neural Networks (ANN), Echocardiogram, BPNN, RBFNN, Classification, survival Analysis.
, Echocardiogram, BPNN, RBFNN, Classification, survival Analysis.") Design of Classifier Using Artificial Neural Network for Patients Survival Analysis J. D. Dhande 1, Dr. S.M. Gulhane 2 Assistant Professor, BDCE, Sevagram 1, Professor, J.D.I.E.T, Yavatmal 2 Abstract The
Design of Classifier Using Artificial Neural Network for Patients Survival Analysis J. D. Dhande 1, Dr. S.M. Gulhane 2 Assistant Professor, BDCE, Sevagram 1, Professor, J.D.I.E.T, Yavatmal 2 Abstract The
Strategies for containing an emerging influenza pandemic in South East Asia 1
 Strategies for containing an emerging influenza pandemic in South East Asia 1 Modeling pandemic spread and possible control plans of avian flu H5N1 BBSI, Nicole Kennerly, Shlomo Ta asan 1 Nature. 2005
Thursday. Compartmental Disease Models
 Thursday Compartmental Disease Models Model Formulation Major decisions in designing a model Even after compartmental framework is chosen, still need to decide: Deterministic vs stochastic Discrete vs
UNIVERSITY of PENNSYLVANIA CIS 520: Machine Learning Midterm, 2016
 UNIVERSITY of PENNSYLVANIA CIS 520: Machine Learning Midterm, 2016 Exam policy: This exam allows one one-page, two-sided cheat sheet; No other materials. Time: 80 minutes. Be sure to write your name and
Modeling of epidemic spreading with white Gaussian noise
 Article Statistical Physics and Mathematics for Complex Systems December 20 Vol.56 No.34: 3683 3688 doi: 0.007/s434-0-4753-z SPECIAL TOPICS: Modeling of epidemic spreading with white Gaussian noise GU
Spatio-temporal modeling of weekly malaria incidence in children under 5 for early epidemic detection in Mozambique
 Spatio-temporal modeling of weekly malaria incidence in children under 5 for early epidemic detection in Mozambique Katie Colborn, PhD Department of Biostatistics and Informatics University of Colorado
Contents. Mathematical Epidemiology 1 F. Brauer, P. van den Driessche and J. Wu, editors. Part I Introduction and General Framework
 Mathematical Epidemiology 1 F. Brauer, P. van den Driessche and J. Wu, editors Part I Introduction and General Framework 1 A Light Introduction to Modelling Recurrent Epidemics.. 3 David J.D. Earn 1.1
Modelling responses to a smallpox epidemic taking into account uncertainty
 Epidemiol. Infect. (2003), 132, 19 25. f 2004 Cambridge University Press DOI: 10.1017/S0950268803001390 Printed in the United Kingdom Modelling responses to a smallpox epidemic taking into account uncertainty
Quantifying and Mitigating the Effect of Preferential Sampling on Phylodynamic Inference
 Quantifying and Mitigating the Effect of Preferential Sampling on Phylodynamic Inference Michael D. Karcher Department of Statistics University of Washington, Seattle April 2015 joint work (and slide construction)
Religious Festivals and Influenza. Hong Kong (SAR) China. *Correspondence to:
 China. *Correspondence to:") Religious Festivals and Influenza Alice P.Y. Chiu 1, Qianying Lin 1, Daihai He 1,* 1 Department of Applied Mathematics, Hong Kong Polytechnic University, Hong Kong (SAR) China *Correspondence to: daihai.he@polyu.edu.hk
Religious Festivals and Influenza Alice P.Y. Chiu 1, Qianying Lin 1, Daihai He 1,* 1 Department of Applied Mathematics, Hong Kong Polytechnic University, Hong Kong (SAR) China *Correspondence to: daihai.he@polyu.edu.hk
Statistical Methods for Improving Biosurveillance System Performance
 Statistical Methods for Improving Biosurveillance System Performance Associate Professor Ron Fricker Naval Postgraduate School Army Conference on Applied Statistics October 17, 27 1 The New Status Quo?
Inferring Clinical Correlations from EEG Reports with Deep Neural Learning
 Inferring Clinical Correlations from EEG Reports with Deep Neural Learning Methods for Identification, Classification, and Association using EHR Data S23 Travis R. Goodwin (Presenter) & Sanda M. Harabagiu
Modelling the Dynamic of the Foot-and Mouth Disease in England 2001
 Modelling the Dynamic of the Foot-and Mouth Disease in England 2001 Seminar on Veterinary Epidemiology Franz Rubel Budapest, 28 May 2003 Mathematical Epidemiology Group, Institute for Medical Physics and
Mathematics of Infectious Diseases
 Mathematics of Infectious Diseases Zhisheng Shuai Department of Mathematics University of Central Florida Orlando, Florida, USA shuai@ucf.edu Zhisheng Shuai (U Central Florida) Mathematics of Infectious
Influenza-like-illness, deaths and health care costs
 Influenza-like-illness, deaths and health care costs Dr Rodney P Jones (ACMA, CGMA) Healthcare Analysis & Forecasting hcaf_rod@yahoo.co.uk www.hcaf.biz Further articles in this series are available at
WINTER SEASON 2016/17 MORTALITY SUMMARY REPORT FROM THE EUROMOMO NETWORK
 WINTER SEASON 2016/17 MORTALITY SUMMARY REPORT FROM THE EUROMOMO NETWORK Pooled analysis of all-cause and influenza-attributable mortality from 21 European countries participating in the EuroMOMO network
An Empirical Mixture Model for Large-Scale RTT Measurements
 1 An Empirical Mixture Model for Large-Scale RTT Measurements Romain Fontugne 1,2 Johan Mazel 1,2 Kensuke Fukuda 1,3 1 National Institute of Informatics 2 JFLI 3 Sokendai June 9, 2015 Introduction RTT:
Hacettepe University Department of Computer Science & Engineering
 Subject Hacettepe University Department of Computer Science & Engineering Submission Date : 29 May 2013 Deadline : 12 Jun 2013 Language/version Advisor BBM 204 SOFTWARE LABORATORY II EXPERIMENT 5 for section
The Message or the Messenger? Inferring Virality and Diffusion Structure from Online Petition Signature Data
 The Message or the Messenger? Inferring Virality and Diffusion Structure from Online Petition Signature Data Chi Ling Chan, Justin Lai, Bryan Hooi*, Todd Davies Stanford University * Carnegie Mellon University
Rapid loss of immunity is necessary to explain historical cholera epidemics
 Rapid loss of immunity is necessary to explain historical cholera epidemics Ed Ionides & Aaron King University of Michigan Departments of Statistics and Ecology & Evolutionary Biology Bengal: cholera s
Detection of Glaucoma and Diabetic Retinopathy from Fundus Images by Bloodvessel Segmentation
 International Journal of Engineering and Advanced Technology (IJEAT) ISSN: 2249 8958, Volume-5, Issue-5, June 2016 Detection of Glaucoma and Diabetic Retinopathy from Fundus Images by Bloodvessel Segmentation
Module 5: Introduction to Stochastic Epidemic Models with Inference
 Module 5: Introduction to Stochastic Epidemic Models with Inference Instructors:, Dept. Mathematics, Stockholm University Ira Longini, Dept. Biostatistics, University of Florida Jonathan Sugimoto, Vaccine
Proceedings of the 5th WSEAS International Conference on Telecommunications and Informatics, Istanbul, Turkey, May 27-29, 2006 (pp )
") A Predictive Control Approach For Nonlinear Systems MALIK F. ALAMAIREH, MOHAMMAD R. HASSAN Department of Computer Science Amman University Assalt 19112 P. O. Box 5043 JORDAN Abstract: - The theory of artificial
A Predictive Control Approach For Nonlinear Systems MALIK F. ALAMAIREH, MOHAMMAD R. HASSAN Department of Computer Science Amman University Assalt 19112 P. O. Box 5043 JORDAN Abstract: - The theory of artificial
SourceSeer: Forecasting Rare Disease Outbreaks Using Multiple Data Sources
 SourceSeer: Forecasting Rare Disease Outbreaks Using Multiple Data Sources Theodoros Rekatsinas University of Maryland with Saurav Ghosh 1, Sumiko Mekaru 2, Elaine Nsoesie 2, John Brownstein 2, Lise Getoor
SUNDAY Nature Academy 2018/2019: Influenza Outbreak
 SUNDAY Nature Academy 2018/2019: Influenza Outbreak Description: Outbreaks (epidemics) have had devastating outcomes on the human population. Public health and other health care providers are essential
L4, Modeling using networks and other heterogeneities
 L4, Modeling using networks and other heterogeneities July, 2017 Different heterogeneities In reality individuals behave differently both in terms of susceptibility and infectivity given that a contact
Outlier Analysis. Lijun Zhang
 Outlier Analysis Lijun Zhang zlj@nju.edu.cn http://cs.nju.edu.cn/zlj Outline Introduction Extreme Value Analysis Probabilistic Models Clustering for Outlier Detection Distance-Based Outlier Detection Density-Based
Confluence: Conformity Influence in Large Social Networks
 Confluence: Conformity Influence in Large Social Networks Jie Tang *, Sen Wu *, and Jimeng Sun + * Tsinghua University + IBM TJ Watson Research Center 1 Conformity Conformity is the act of matching attitudes,
arxiv: v1 [cs.si] 29 Jan 2018
![arxiv: v1 [cs.si] 29 Jan 2018](/thumbs/75/72689274.jpg "arxiv: v1 [cs.si] 29 Jan 2018") Detecting the impact of public transit on the transmission of epidemics Zhanwei Du 1,* and Yuan Bai 1 1 Jilin University, Changchun, Jilin, 130012, China * duzhanwei0@gmail.com ABSTRACT arxiv:1801.09333v1
Detecting the impact of public transit on the transmission of epidemics Zhanwei Du 1,* and Yuan Bai 1 1 Jilin University, Changchun, Jilin, 130012, China * duzhanwei0@gmail.com ABSTRACT arxiv:1801.09333v1
MBios 478: Systems Biology and Bayesian Networks, 27 [Dr. Wyrick] Slide #1. Lecture 27: Systems Biology and Bayesian Networks
![MBios 478: Systems Biology and Bayesian Networks, 27 [Dr. Wyrick] Slide #1. Lecture 27: Systems Biology and Bayesian Networks](/thumbs/80/82116384.jpg "MBios 478: Systems Biology and Bayesian Networks, 27 [Dr. Wyrick] Slide #1. Lecture 27: Systems Biology and Bayesian Networks") MBios 478: Systems Biology and Bayesian Networks, 27 [Dr. Wyrick] Slide #1 Lecture 27: Systems Biology and Bayesian Networks Systems Biology and Regulatory Networks o Definitions o Network motifs o Examples
MBios 478: Systems Biology and Bayesian Networks, 27 [Dr. Wyrick] Slide #1 Lecture 27: Systems Biology and Bayesian Networks Systems Biology and Regulatory Networks o Definitions o Network motifs o Examples
A Comparison of Collaborative Filtering Methods for Medication Reconciliation
 A Comparison of Collaborative Filtering Methods for Medication Reconciliation Huanian Zheng, Rema Padman, Daniel B. Neill The H. John Heinz III College, Carnegie Mellon University, Pittsburgh, PA, 15213,
Mathematical Modeling of Trending Topics on Twitter
 Mathematical Modeling of Trending Topics on Twitter April 14, 2015 Comparison of Trending Topics Window refers to the moving sum period (e.g., each point represents count in past 200s) Project Objectives
Automated Social Network Epidemic Data Collector
 Automated Social Network Epidemic Data Collector Luis F Lopes, João M Zamite, Bruno C Tavares, Francisco M Couto, Fabrício Silva, and Mário J Silva LaSIGE, Universidade de Lisboa epiwork@di.fc.ul.pt Abstract.
arxiv: v1 [nlin.ao] 12 Dec 2013
![arxiv: v1 [nlin.ao] 12 Dec 2013](/thumbs/91/104780971.jpg "arxiv: v1 [nlin.ao] 12 Dec 2013") Papers in Physics, vol. 5, art. 050003 (2013) www.papersinphysics.org Received: 6 April 2013, Accepted: 3 June 2013 Edited by: G. Mindlin Licence: Creative Commons Attribution 3.0 DOI: http://dx.doi.org/10.4279/pip.050003
Papers in Physics, vol. 5, art. 050003 (2013) www.papersinphysics.org Received: 6 April 2013, Accepted: 3 June 2013 Edited by: G. Mindlin Licence: Creative Commons Attribution 3.0 DOI: http://dx.doi.org/10.4279/pip.050003
Computational Perception /785. Auditory Scene Analysis
 Computational Perception 15-485/785 Auditory Scene Analysis A framework for auditory scene analysis Auditory scene analysis involves low and high level cues Low level acoustic cues are often result in