A Senior Honors Thesis. Brandie Andrews
|
|
|
- Gervase Riley
- 5 years ago
- Views:
Transcription
1 Auditory and Visual Information Facilitating Speech Integration A Senior Honors Thesis Presented in Partial Fulfillment of the Requirements for graduation with distinction in Speech and Hearing Science in the undergraduate colleges of The Ohio State University by Brandie Andrews The Ohio State University June 2007 Project Advisor: Dr. Janet M. Weisenberger, Department of Speech and Hearing Science
2 Abstract Speech perception is often thought to be a unimodal process (using one sense) when, in fact, it is a multimodal process that uses both auditory and visual inputs. In certain situations where the auditory signal has become compromised, the addition of visual cues can greatly improve a listener s ability to perceive speech (e.g., in a noisy environment or because of a hearing loss). Interestingly, there is evidence that visual cues are used even when the auditory signal is completely intelligible, as demonstrated in the McGurk Effect, in which simultaneous presentation of an auditory syllable ba with a visual syllable ga results in the perception of the sound da, a fusion of the two inputs. Audiovisual speech perception ability varies widely across listeners; individuals integrate different amounts of auditory and visual information to understand speech. It is suggested that characteristics of the listener, characteristics of the auditory and visual inputs, and characteristics of the talker may all play a role in the variability of audiovisual integration. The present study explored the possibility that differences in talker characteristics (unique acoustic and visual characteristics of articulation) might be responsible for some of the variability in a listener s ability to perceive audiovisual speech. Ten listeners were presented with degraded auditory, visual, and audiovisual speech syllable stimuli produced by fourteen talkers. Results indicated substantial differences in intelligibility across talkers under the auditory-only condition, but little variability in visual-only intelligibility. In addition, talkers produced widely varying amounts of audiovisual integration, but interestingly, the talkers producing the most audiovisual integration were not those with the highest auditory-only intelligibility. 2
3 Acknowledgments I would like to thank my advisor, Dr. Janet M. Weisenberger, for providing me the opportunity to work alongside her on this thesis, as well as the guidance she has given me throughout the entire process. Through her insight and support, I have grown personally, professionally, and academically. I would like to thank Natalie Feleppelle for the all the time, assistance, and guidance she has given me throughout this year. Furthermore, I would like to thank my family and friends for their constant encouragement and support. This project was supported by an ASC Undergraduate Scholarship and an SBS Undergraduate Research Scholarship. 3
4 Table of Contents Abstract 2 Acknowledgments 3 Table of Contents.4 Chapter 1: Introduction and Literature Review 5 Chapter 2: Method 14 Chapter 3: Results and Discussion 19 Chapter 4: Summary and Conclusion 26 Chapter 5: References...27 List of Tables and Figure..29 Table Figures
5 Chapter 1: Introduction and Literature Review Speech perception is often thought of as a unimodal process when, in fact, it is a multimodal process that uses both auditory and visual inputs. In situations where the auditory signal is impoverished in some way, such as a noisy environment or with hearing impaired individuals, speech perception can be difficult. In these situations, the visual information present can significantly improve speech integration. However, there is evidence that visual input is used even when the auditory signal is completely intelligible. McGurk and MacDonald (1976) demonstrated the integration of these cues in what is known today as the McGurk Effect. They dubbed auditory syllables onto a videotape of a speaker vocalizing a different syllable. For example, an auditory syllable such as the bilabial [ba] would be dubbed onto a speaker visually saying the velar consonant [ga]. The listener would integrate this information and report perceiving a [da], a fusion of the place of articulation of the two sounds. These results show that even with a completely intelligible auditory signal, the listener could not ignore the visual information and used both of the available modalities to identify the syllable. Thus, the current consensus is that audiovisual integration occurs constantly, even when auditory input is perfect. In explaining the nature of audiovisual integration of speech, it is important to evaluate the cues contained in the auditory and visual speech tokens. Auditory Cues for Speech Perception 5
6 The auditory signal can provide a variety of information to a listener, such as the place, manner, and voicing of the speech sound. The place of articulation describes where in the mouth the articulation was produced. The various places of articulation are bilabials (with the lips), labiodentals (with the lower lips and upper front teeth), interdentals (with the tongue between the teeth), alveolars (with the tip of the tongue and the alveolar ridge), palatal-alveolars (with the blade of the tongue and the alveolar ridge), palatals (with the tongue and the hard palate) and velars (with the tongue and the soft palate). The manner of articulation describes how the articulators make contact with each other. There are stops, fricatives, affricates, liquids and glides. Voicing refers to the state of the vocal folds while a sound is being produced. If the vocal folds are vibrating, then the sound is voiced and if the vocal folds are not vibrating, they are said to be voiceless. Vowels can be described in terms of tongue height, tongue advancement (backness) and lip rounding. For example, /I/ is a high vowel, made in the front of the mouth with lips spread (little lip rounding). /o/ is a high-middle vowel made toward the back of the mouth, with a good degree of lip rounding. All of this auditory information can be found in both the spectral and temporal aspects of a speech waveform. With all of this available information, the speech signal is said to be highly redundant, i.e., the signal contains far more information than is absolutely necessary for identification of the speech sound. Even if some of this information were missing, the remaining temporal and spectral information would be useful in identifying speech sounds. In fact, studies have shown that a substantial amount of information can be removed from the speech signal without significantly reducing intelligibility. A study conducted by Shannon et al. (1998) shows that when the spectral waveform was reduced down to just two broad noise bands, which were then modulated by the original envelope characteristics, speech recognition performance was still 6
7 relatively high. With four bands of noise, the performance increased drastically and listeners were able to identify almost all of the manner and voicing information present. This study provides evidence of the redundancy of the speech signal, indicating that speech recognition can be achieved when this information is drastically reduced. Visual Cues for Speech Perception Visual cues can be a source of important information when identifying speech sounds. But with visual information, an observer can detect only the place of articulation, and even that information can be ambiguous (Jackson, 1988). Cues to manner and voicing are even less evident. When some phonemes are produced, it is easy to see a visual difference between them. For example, a clear visual difference can be seen between /f/, a labiodental, and /b/, a bilabial. However some phonemes are so similar that a visual difference cannot be seen. These visual phonemes are known as visemes (Jackson, 1988). Visemes contain more than one speech sound within each set and all of the sounds in the set are produced with similar facial movements. For example, /p, b, m / constitute a viseme group. They are all bilabial consonants that are different auditorily but the difference cannot be seen visually. These sounds have an identical place of articulation but differ in terms of manner and voicing. Viseme groups are determined by several other factors other than visual attributes of speech sounds. Differences among talkers and the environment in which the sound is produced are important elements that contribute to visual speech perception. Talker variations appear to account for significant differences in viseme groups. Jackson found that talkers who are easy to speechread create more viseme categories than talkers who are more difficult to understand. Additionally, easy to speechread talkers 7
8 produce more viseme groups which are said to be universal, while hard to speechread talkers produce a fewer number of viseme groups (Jackson, 1988). Given these cues in the auditory and visual signals, how does the integration process take place? Theories of audiovisual integration attempt to describe this process. Auditory-Visual Integration Theories Many different models have been introduced to describe optimal speech integration between the two modalities. In the Pre-Labeling Model of Integration (PRE), developed by Braida (as cited by Grant, 2002), a prediction of auditory-visual recognition is made from auditory-only and visual-only confusion matrices. The model proposes that all information extracted from both the auditory and visual modalities is preserved in the multimodal case, with no interference or biasing from the other modality. Thus, the predicted multimodal recognition for any speech sound should be equal to or greater than recognition in one of the modalities alone. The predictions of this model are an excellent source of information for the development of rehabilitative programs which strive to improve auditory-visual speech recognition. When a subject performs close to the predicted auditory-visual recognition score, then it is assumed that they are integrating speech information optimally and further rehabilitative efforts should be focused on improving unimodal auditory or visual recognition scores. In contrast, subjects who perform far below the predicted auditory-visual score are not integrating speech information optimally and should receive integration training to facilitate auditory and visual integration. Studies employing the PRE model have also shown that hearing-impaired subjects perform far 8
9 below the predicted score and thus should receive rehabilitative efforts that focus on the integration of auditory and visual cues (Grant, 2002). Another model of integration is the Fuzzy Logical Model of Perception (FLMP). This model, constructed by Massaro (as cited in Grant, 2002), tries to reduces the difference between the predicted auditory-visual scores and the auditory-alone and the visual-alone score. The FLMP uses matrices but, unlike the PRE model, considers all conditions, auditory, visual and auditory-visual. However, Grant (2002) argued that the FLMP underestimates the ability of humans to integrate speech information. One major difference between these two theories lies in when the actual integration occurs. In the PRE, the integration of information from the two unimodal sources occurs prior to actual phoneme identification. The FLMP, in contrast, posits that integration of the signals occurs very late in the process, after preliminary identification of the visual and auditory inputs. In addition to theoretical accounts of the overall process, it is also important to consider the nature of the information that is being integrated, and specifically to evaluate the role of redundant information in facilitating or impeding integration. Role of Redundancy in Audiovisual Speech Perception When an auditory signal is distorted by noise or a reduced acoustic signal, the available visual cues can significantly increase intelligibility and aid in audiovisual integration. Additional information suggests that auditory speech signals are highly redundant. In a study conducted by Shannon et al. (1998), speech recognition of vowel, consonants and words in simple sentences 9
10 was measured when the spectral distributions of the envelope cues were distorted. The results of this study showed that when the spectral cues were distorted, consonant recognition was not affected as much by the distortions as vowel recognition was, which made sentence recognition extremely difficult. Overall, the study by Shannon et al. indicated that consonant phonemes can still be perceived with high accuracy even with spectral distortions. This information is useful in understanding the high speech recognition of cochlear implant patients. Evidence suggests that even when only four electrodes are used to stimulate neurons, cochlear implant patients are able to discriminate speech. Shannon et al. s results also suggest that when envelope cues are distorted, tonotopic distribution is imperative for speech recognition (Shannon, et al., 1998). In an earlier study conducted by Shannon et al. (1995), spectral information was reduced and the ability to recognize speech was measured. Temporal envelopes of speech were manipulated so that the temporal cues were preserved but the spectral information was severely degraded. Results showed that even with only three bands of modulated noise, high speech recognition scores were still obtained. Furthermore, the identification of consonants, vowels and sentences improved as the number of bands was increased (Shannon et al., 1995). This study provides evidence that there is more information in non-degraded auditory speech signals than is absolutely necessary to recognize phonemes. Impoverished auditory signals can become highly intelligible with the presentation of visual information. Ken Grant and Philip Seitz (1998) compared a variety of auditory-visual integration measures in attempts to determine the significance of differing integration abilities among individuals. Congruent and discrepant auditory-visual nonsense syllables were used 10
11 to measure integration in this study. Congruent speech is defined as a stimulus in which an acoustic speech sound source matches with the presented visual speech signal. In contrast, discrepant speech is created when one auditory speech sound is dubbed onto a visual input of a different sound, as demonstrated by McGurk and MacDonald in the McGurk Effect (1976). The results of Grant and Seitz s research showed that even with a highly impoverished auditory signal (i.e., fundamental frequency), speech was intelligible when paired with a visual signal. One of the most impoverished, least redundant speech signals is sine-wave speech. Remez (1981) and his fellow researchers created a three-tone sinusoid pattern replica of a naturally produced utterance; no traditional acoustic cues were present in the stimuli. Remez, et al. stated that the stimulus utterance should be perceived by listeners as three separate tones. Three conditions were tested for this study; the first group was told nothing about the nature of sounds they would be hearing, the second group was told they would hear a sentence produced by a computer and the third group was told exactly what they would hear. The groups were asked to distinguish what they had heard and the quality of the sound. Almost all of the words presented were able to be recognized and although they were judged to have an unnatural voice quality, they were said to be clear and intelligible. The results of this study indicated that time-varying sinusoids were sufficient information for even the naive listeners to detect linguistic content without traditional acoustic cues. In contrast to ambiguous speech information is clear speech. Gagné et al. (2002), described clear speech as a speaking style which improves a talker s intelligibility in degraded or noisy listening environments. Clear speech differs from conversational speech in that is has a slower speaking rate, an expanded vowel space, greater temporal modulation, increased range of voice fundamental frequency and more stimulus energy in high frequencies (Chen, 1980; 11
12 Picheny et al., 1985; Uchanski et al., 1992; Payton et al., 1994). In previous studies, it has been shown that clear speech yields higher auditory-speech intelligibility scores than conversational speech for hearing-impaired individuals in a quiet background, as well as for normal-hearing and hearing-impaired individuals in a noisy background (Gagné et al., 2002). Gagné and his colleagues investigated the effects of clear speech on auditory alone, visual alone and audiovisual speech intelligibility while taking into account the effects of intraspeaker variability. Six different talkers each produced four different iterations of consonants and vowels with both clear speech and conversational speech instructions. Significant clear speech effects were found in all three conditions. However, not all talkers produced clear speech benefits under all presentation conditions. The amount of benefit varied from condition to condition across talkers, and across iterations within each talker. These data suggest that characteristics of individual talkers may be an important determinant of audiovisual integration. What still remains unknown is whether an ambiguous speech signal, such as an impoverished auditory signal, or a redundant signal, such as clear speech, is ideal for integration. The answer to this may depend on the individual talker characteristics presented. All talkers have their own, individual speaking strategies and speaking rates. But what makes a good (i.e., highly intelligible) talker? And are the characteristics of a good auditory talker the same as those for a good visual talker? Finally, do good visual and auditory talkers produce the greatest benefit in audio-visual speech tasks? One important issue is to determine whether ambiguity or redundancy in one or both of the cues is preferable. The present study focused on various talker characteristics to determine which characteristics produce optimal auditory + visual integration. Fourteen talkers were video recorded producing a set of single-syllable speech tokens. In order to avoid ceiling effects and 12
13 allow for the visual signal to produce an improvement in intelligibility in the multimodal situation, the speech tokens were digitally degraded, resulting in an auditory signal containing a preserved speech envelope with removed spectral content. These degraded auditory signals were then dubbed onto visual samples of a talker producing a single syllable speech token. Ten listeners were presented with these stimuli under three conditions; 1) degraded auditory-only, 2) visual- only, and 3) degraded auditory + visual. Listeners were asked to identify the speech syllable presented. Examinations of correlations of performance with different talkers across the three presentation conditions were performed to address the question of whether characteristics that make someone a good talker in auditory only situations also make that person a good talker in visual only and audiovisual situations. Thus, the question of whether clarity or ambiguity in the auditory and visual inputs best promotes audiovisual integration was addressed. In addition, the acoustic and visual characteristics of articulation were examined for speech tokens as produced by good and bad talkers, to gain a better understanding of the factors that characterize good multimodal speech tokens. 13
14 Chapter 2: Method Participants Participants in this study included ten listeners and fourteen talkers. Six females and four males, ages 19-42, participated in this research study as listeners. All ten passed a hearing screening and all reported having normal or corrected vision. None of the listeners had taken any courses relating to phonetics or language. Listeners received $80.00 for their involvement in the study. Seven female and seven male talkers, ages participated as talkers. All fourteen reported being native English speakers. Talkers were not compensated for their participation. Interfaces for Stimulus Presentation Visual Presentation Presentation of degraded auditory and visual stimuli was similar for all participants. Each participant was tested under three conditions; 1) degraded auditory only, 2) visual only, and 3) degraded auditory + visual. A 50 cm video monitor was positioned approximately 60 cm outside the window of a sound attenuating booth. The monitor was positioned at eye level, about 4 feet away from the participant s head. Stimuli were presented using recorded DVDs on the video monitor for each condition. For visual only presentations, the monitor s sound was turned off. Degraded Auditory Presentation 14
15 The degraded auditory stimuli were presented from the headphone output to the video monitor through Telephonics, 300-ohm TDH headphones. Under degraded auditory only presentations, the video monitor was turned off to remove visual cues. When degraded auditory and visual stimuli were presented together, the video monitor was left on. Stimuli Stimulus Selection A limited set of CVC syllables were presented as stimuli for this study. These syllables were chosen to satisfy the following conditions: 1) Pairs of the stimuli were minimal pairs, differing only in the initial consonant. 2) All stimuli were accompanied by the vowel /ae/, because it does not involve lip rounding or lip extension. 3) Multiple stimuli were used in each category of articulation, including; place (bilabial, alveolar), manner (stop, fricative, nasal), and voicing (voiced, voiceless). 4) All stimuli were presented without a carrier phrase. 5) Stimuli were known to elicit McGurk-like responses when appropriately chosen pairs of syllables were presented. Stimuli For each condition, the same set of eight stimuli was administered: 15
16 1) mat 2) bat 3) gat 4) pat 5) cat 6) zat 7) sat 8) tat The four following dual-syllable (dubbed) stimuli were also used in the degraded auditory + visual conditions. The first column indicates the auditory stimulus, the second column indicates the visual stimulus: 1) bat-gat 2) gat-bat 3) pat-cat 4) cat-pat Stimulus Recording and Editing Each talker was video recorded with a digital video camera. Their voices were recorded though a microphone directly into a computer, using the software program Video Explosion 16
17 Deluxe, which allowed files to be stored in.wav format. All fourteen talkers repeated the selected set of eight monosyllabic words five times, resulting in five visual and auditory tokens for each of the eight words. The auditory speech samples were then converted into degraded auditory speech samples using MATLAB. The program takes the speech waveform and a broadband noise and swaps their temporal envelopes. The waveform containing the noise fine structure and the temporal envelope cues of the original speech waveform was preserved, while the other waveform was discarded. Each speech signal was then filtered into four broad spectral bands, providing equal spacing in basilar membrane distance. The upper cutoff frequencies for the four spectral bands were: 504 Hz, 1,794 Hz, 5,716 Hz, and 17,640 Hz. The resulting auditory stimulus was similar to those used by Shannon et al. (1998), as mentioned in the Introduction. Video Explosion Deluxe was also used to dub degraded auditory stimuli onto visual stimuli. Using the computer software program Sonic MY DVD, stimulus lists were created and burned onto recordable DVDs. Three DVDs were created for each talker, each with a different randomized stimulus order to minimize participant memorization. Procedure Testing for this study was conducted in The Ohio State University s Speech and Hearing Department in Pressey Hall. Each participant was tested individually in a sound attenuating booth, with the door closed. Participants sat comfortably, facing a 50 cm video monitor outside the booth approximately four feet away from the participant s face. Each participant watched 42 DVDs (3 DVDs for each of 14 talkers) with 60 randomly ordered stimulus syllables in the following presentation conditions; 1) degraded auditory-only, 17
18 2) visual-only, and 3) degraded auditory + visual. The presentation condition was also randomized. For the degraded auditory + visual presentations, the DVDs contained 30 same trials and 30 different trials. Same trials present the same syllable auditorily and visually. Different trials present the dual-syllable (dubbed) stimuli where the auditory and visual syllables do not match. The 30 different trials were used in the degraded auditory + visual condition to elicit McGurk-like responses. Participants listened to and/or watched each DVD on the video monitor and/or with TDH headphones. Participants were instructed that the stimulus presented would end in at and could begin with any speech sound, including possibilities not found in the English language. The participants were instructed to verbally respond to what they perceived on the video monitor and/or through the headphones, while an examiner listened through an intercom system and recorded their responses. Risk of participant memorization of stimuli was minimized by using a substantial set of different DVDs, each employing a random stimulus order. Testing took approximately seven-eight hours for each participant. Testing was broken up into one-two hour sessions with frequent breaks throughout. 18
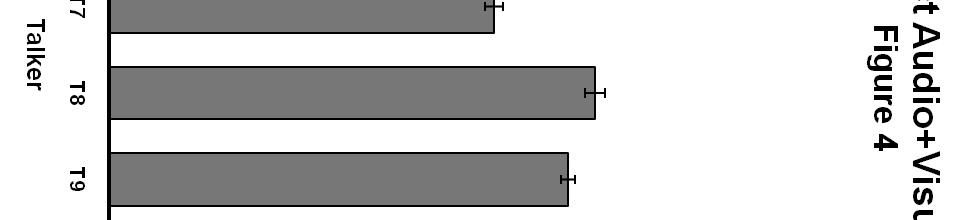
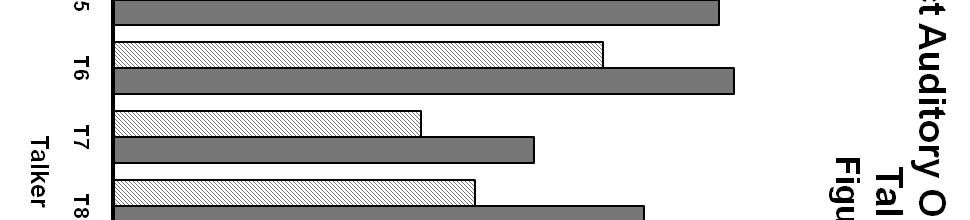
19 Chapter 3: Results and Discussion Single Syllable Stimuli The first step in analysis was to evaluate performance for single-syllable presentations, in which the two modalities (degraded auditory-only and visual-only) received the same stimulus syllable. This was done by measuring percent correct identification. Responses were considered correct when the subject responded with the syllable that had actually been produced by the talker. Figure 1 shows the overall percent correct by modality for each of the three presentation conditions, averaged across all talkers and all listeners. Figures 2, 3, and 4 show performance averages across subjects for each of the fourteen talkers in visual-only, auditory-only, and degraded auditory + visual, respectively. Integration was assessed by determining the degree to which the auditory + visual performance was better than the auditory-only, as shown in Figure 5. Figure 1 shows the overall percent correct responses by modality. The data indicate that subjects performed better in the auditory-only condition than in the visual-only condition. Further, subjects showed better performance in the auditory + visual condition than in either of the other conditions. These results indicate that listeners were able to integrate the auditory and visual signals to improve intelligibility in the degraded auditory + visual condition. Also, in Figure 1 it can be seen that the overall percent correct for the visual-only condition is 39%. This level is predictable, because the probability of a listener correctly identifying a bilabial (/bæt/, /pæt/, or /mæt/) is 33%, the probability of correctly identifying an alveolar (/sæt/, /zæt/, or /tæt/) 19
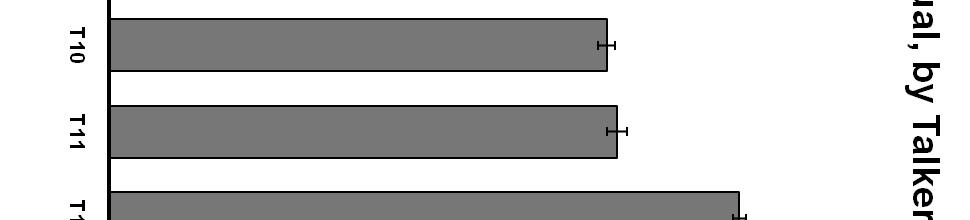
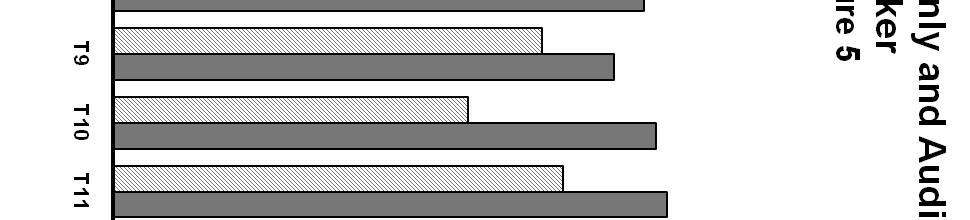
20 is 33%, and the probability of correctly identifying a velar (/gæt/ or /cæt/) is 50%, all averaging out to 39%. This indicates that subjects were at least able to discriminate the place of articulation presented, as is consistent with results from Jackson (1988) suggesting that visual speech provides primarily place of articulation information. Figure 2 shows percent correct in the auditory-only condition, by talker. Substantial differences were seen across talkers in intelligibility under auditory-only conditions, with a range of 38% to 71%. In contrast, Figure 3 shows the percent correct in the visual-only condition, by talker. It can be seen that the variation in visual intelligibility across talkers in this condition was not large, with all subjects performing between 36% and 43% correct. This finding is consistent with previous studies conducted in this laboratory for the same stimulus set. Finally, Figure 4 shows the percent correct in the auditory + visual condition across talkers. Again, performance varied widely, with a range of 48% to 82% correct. Figure 5 provides a direct comparison of auditory-only and auditory + visual performance for individual talkers. Several aspects of this figure are worth noting. First, the substantial variability in the degree of audiovisual integration can be seen, with a range of 5% to 34%. It can also be observed that the talker who had the greatest auditory intelligibility (Talker 12) was not the talker who produced the highest amount of integration (Talker 4), nor the talker who produced the lowest amount of integration (Talker 2). Together with the finding in Figure 3 that there was virtually no variability among talkers in the visual condition, this suggests that audiovisual integration is not necessarily related to a talker s performance in auditory-only or visual-only conditions. Finally, when also taking into account the percent correct in the visualonly condition, it can be observed that the degree of audiovisual integration is not the sum of the auditory and visual performance. For example, Talker 8 scored 43% correct in the visual-only 20
21 condition and 45% correct in the auditory-only condition. If these numbers are summed, the result is 88%. Performance in the auditory + visual condition in fact is only 65%. This observation suggests that that there is an overlap of information (the information in the auditory input is to some degree redundant with the visual input), or that the listeners are not perfect integrators. Figure 6 shows the degree of benefit between the auditory-only and audiovisual conditions by talker. It can be seen from the graph that the degree of benefit varies widely across talkers, with a range of 4% to 34%. These variations do not necessarily correspond to the talker s auditory-only performance. For example, Talkers 4 and 7 have essentially the performance level of 39% for auditory-only. However, when looking at the degree of benefit for those talkers, Talker 4 had a 34% degree of benefit and Talker 7 only had a 13% degree of benefit. Talker 14, who also performed around 39% for auditory-only, had a degree of benefit of 27%, somewhere in between that of Talkers 4 and 7. Again, this information shows that performance in the auditory-only condition does not dictate the amount of audiovisual integration. Dual-Syllable Stimuli The second step was to assess performance for dual-syllable stimuli, in which each modality was presented with a different syllable. There is no single correct response for these stimuli. Responses were categorized as auditory when the subject responded with the auditory stimulus, visual when the subjects responded with the visual stimulus, or other when the subject gave a response which was neither the auditory stimulus nor the visual stimulus. Integration was then determined by evaluating the responses in the other category. 21
22 Figure 7 plots this analysis, and shows that the highest number of responses was other, then visual, followed by auditory. It is not surprising that since the auditory input was degraded, subjects relied more on the visual information. The substantial percentage of other responses suggests that neither the auditory nor the visual stimulus possessed sufficient salience to dominate response patterns. Figure 8 shows the percent of visual responses by talker, with a range of 28% to 50%. Figure 9 shows the percent of auditory responses by talker, with a wider range of 4% to 41%. Finally, Figure 10 shows the percent of other responses by talker, with a range of 27% to 62%. When comparing these three graphs, characteristics of individual talkers emerge. For example, Talker 5 elicited a fairly high percentage of visual responses at 44%, a fairly high percentage of auditory responses at 29%, and therefore had a very low percentage of other responses at 27%. In contrast, Talker 7 elicited a low percentage of visual responses at 30%, a low percentage of auditory responses at 5%, and consequently elicited the highest percentage of other responses at 62%. This analysis suggests that there could be many different factors at work here. But it is evident that a relatively unintelligible auditory talker does not automatically produce a higher percentage of visual responses. Types of Integration Responses Finally, the percentage of other responses was examined in detail to see what type of integration responses subjects exhibited. Responses were divided into three categories: fusion, as when an auditory /bæt/ is paired with a visual /gæt/, producing a response of /dæt/, combination, as when an auditory /bæt/ and a visual /gæt/ produce a response of /bgæt/, and neither, a different response entirely, such as /hæt/ or /bræt/. Figure 11 shows the overall 22
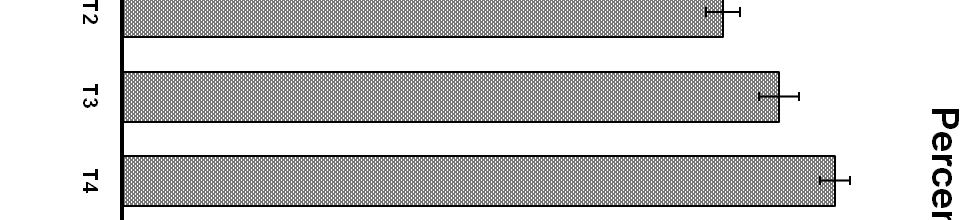
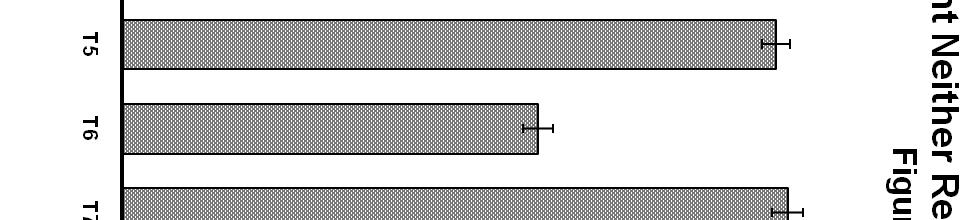
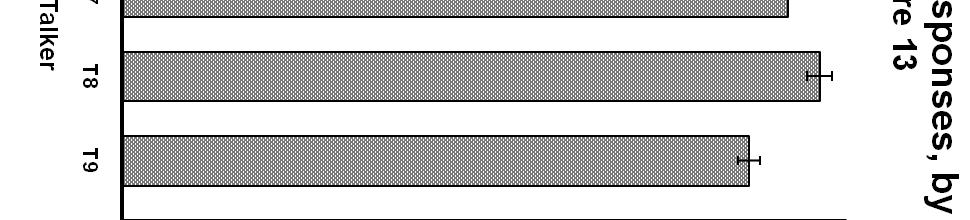
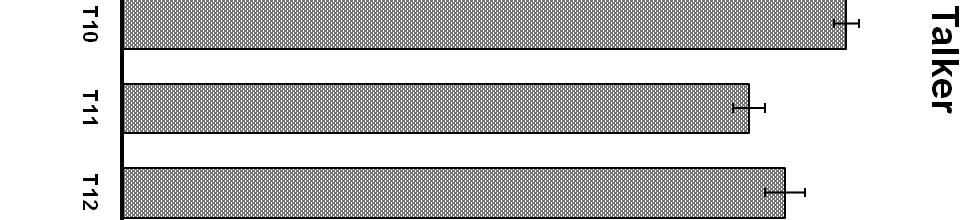
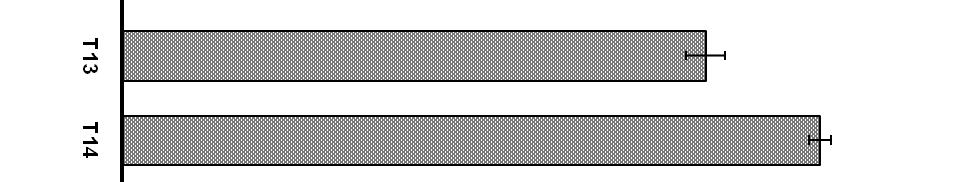
23 percent response, reflecting this McGurk type integration, with a range of 0% to 76% across talkers. Figure 12 shows the percent of fusion responses, with a range of 11% to 30% across talkers. Figure 13 shows the percent of neither responses with a range of 50% to 89%. As can be seen in Figure 11, there was a very minimal percentage of combination responses, a small percentage of fusion responses, and a large number of neither responses. The minimal amount of combination responses is not surprising. Although subjects were told that these types of responses were allowed, they are not phoneme sequences that are permissible in the English language, so subjects very rarely presented this type of response. The small number of fusion responses is somewhat surprising. In previous studies in this laboratory with this stimulus set, this number was much higher than the 18% observed in the present study. One possible consideration in this context is that all subjects reported perceiving the syllable /hæt/ in substantial percentages. /hæt/ cannot be considered a fusion because it is a glottal, meaning it is articulated by the vocal folds. The reason for so many /hæt/ responses is unknown. One possible explanation is that there was a large amount of additional background noise due to the fact that the auditory output was fed through an amplifier prior to delivery to the headphones. This could have been perceived as airflow before the syllable was produced. Another explanation could be the noise present from swapping the speech fine structure with that of broad band noise. It may also be that the acoustic characteristics of the auditory stimulus may have contained something that created the perception of /hæt/. Finally, something in the auditory + visual combination may have made listeners perceive a glottal. Additional investigation is needed to differentiate these possible explanations. Statistical Analysis 23
24 A two factor analysis of variance (ANOVA) within subjects was run to determine if significant main effects of talker, presentation condition, and talker by condition interactions existed. Significant main effects of talker were found, F(13,117)=6.66, p<.001, η²=.42. Follow up pairwise comparisons showed a number of significant differences between pairs of talkers. Primarily, Talker 12 was significantly more intelligible than most of the other talkers. Significant main effects of presentation condition were found, F(2,18)=39.4, p<.001, η²=.81. Follow up pairwise comparisons indicate that all conditions differed significantly from each other. Significant talker by condition interactions were also found, F(26,234)=5.46, p<.001, η²=.38. Overall Pearson r across talkers showed no relationship between auditory-only and visual-only performance (r=.16, ns), and no relationship between visual-only and auditory + visual (r=.21, ns). Only a moderate relationship was found for auditory-only and auditory + visual (r=.63, ns), p<.05. This moderate relationship would be expected given any amount of integration at all by the subjects. An additional Pearson r between the degree of benefit and the auditory-only performance showed a moderate relationship (r= -.51, ns). The fact that this is not significant indicates that auditory-only performance does not predict integration performance. To determine whether talker intelligibility in the auditory-only and visual-only conditions were related to intelligibility in the auditory + visual condition across all listeners, the Pearson r correlation coefficient was calculated for individual talkers. Table 1 indicates that three talkers showed significant correlations between presentation conditions. Talker 5 showed a significant relationship between the auditory-only and auditory + visual conditions [r =.91, p<.001] and between the visual-only and auditory + visual conditions [r =.62, p<.054]. Similarly, Talker 11 also showed a significant relationship between the auditory-only and 24
25 auditory + visual conditions [r =.84, p<.002] and between the visual-only and auditory + visual conditions [r =.76, p<.011]. Finally, Talker 12 showed a significant relationship only between the auditory-only and auditory + visual conditions [r =.64, p<.048]. Figure 2 shows that Talkers 12 and 5 were the first and second best auditory-only talkers, respectively. However, Talker 11 was not among one of the best auditory talkers, nor one of the worst. This relatively random pattern of correlations observed for individual talkers supports the conclusion that there is no systematic relationship among auditory-only, visual-only, and auditory + visual performance. It seems clear that the characteristics of a good talker for audiovisual integration are more complex than an overall assessment of auditory or visual intelligibility can predict. 25
26 Chapter 4: Summary and Conclusion Overall, results from this study indicate that talker characteristics can be an important component in audiovisual speech integration. There was significant variability in the auditoryonly and auditory + visual conditions across talkers. This information suggests that there may be talker characteristics underlying these differences. Additionally, it was found that the amount of audiovisual integration produced by a talker is not necessarily related to a talker s performance in auditory-only or visual-only conditions. The increase in performance in the auditory + visual condition over the auditory-only and visual-only conditions indicate that listeners were able to integrate the auditory and visual signals to improve intelligibility in the auditory + visual condition. The present results are just a preliminary look into this issue. Further investigations are required to clarify just how talker differences improve performance. In depth auditory analyses should be conducted to see if the answer lies within the auditory signal. Additionally, the visual characteristics of talkers, such as lip opening, lip rounding, and jaw movement, should be evaluated to determine if the answer lies in the visual cues of a talker. Results of this study have implications for a better understanding of how multimodal speech is perceived and integrated. With this information, we will be able to further the development of aural rehabilitation programs for individuals with hearing impairments. 26
27 Chapter 5: References Chen, F. (1980). Acoustic characteristics of clear and conversational speech at the segmental level. Cambridge, MA: Massachusetts Institute of Technology. Gagné, J.P., Rochette, A.J., and Charest, M. (2002). Auditory and audiovisual clear speech. Speech Communication 37, Grant, K.W. (2002). Measures of auditory-visual integration for speech understanding: A theoretical perspective (L). The Journal of the Acoustical Society of America 112 (1), Grant, K.W. and Seitz, P.F. (1998). Measures of auditory-visual integration in nonsense syllables and sentences. The Journal of the Acoustical Society of America 104, Jackson, P.L. (1988). The theoretical minimal unit for visual speech perception: Visemes and coarticulation. The Volta Review, 90 (5), McGurk, H. and MacDonald, J. (1976). Hearing lips and seeing voices. Nature, 264, Payton, K.L., Uchanski, R.M., and Braida, L.D. (1994). Intelligibility of conversational and clear speech in noise and reverberation for listeners with normal and impaired hearing. The Journal of the Acoustical Society of America 95, Picheny, M.A., Durlach, N.I., Braida, L.D. (1985). Speaking clearly for the hard of hearing I; Intelligibly differences between clear and conversational speech. Journal of Speech and Hearing Research 28,
28 Remez, R.E., Rubin, P.E., Pisoni, D.B., and Carrell, T.D. (1981). Speech perception without traditional speech cues. Science 212, Shannon, R.V., Zeng, F.G., Kamath, V., Wygonski, J., and Ekelid, M. (1995). Speech recognition with primary temporal cues. Science 270, Shannon, R.V., Zeng, F.G., and Wygonski, J. (1998). Speech recognition with altered spectral distribution of envelope cues. The Journal of the Acoustical Society of America 104, Uchanski, R.M., Miller, K.M., Reed, C.M., and Braida, L.D. (1992). Effects of token variability on vowel identification. In Schouten, E.H. (Ed.), The auditory processing of speech. New York: Mouton de Gruyter. 28
29 List of Tables and Figures Table 1: Pearson r Values for Individual Talkers Figure 1: Overall Percent Correct, by Modality Figure 2: Percent Correct Auditory Only, by Talker Figure 3: Percent Correct Visual Only, by Talker Figure 4: Percent Auditory +Visual, by Talker Figure 5: Percent Correct Auditory Only and Auditory +Visual, by Talker Figure 6: Degree of Benefit, Auditory-only vs. Auditory + Visual, by Talker Figure 7: Overall Percent Response Dual-Syllable Stimuli Figure 8: Percent Visual Responses, by Talker Figure 9: Percent Auditory Responses, by Talker Figure 10: Percent Other Responses, by Talker Figure 11: Overall McGurk Type Integration Figure 12: Fusion Responses, by Talker Figure 13: Percent Neither Responses, by Talker 29
30 Pearson r Values for Individual Talkers Table 1 Talker A/AV V/AV *.62* *.76* 12.64* * p<.05 30

31
32 32
33 33


34 34


35 35


36 36
37 37
38 38
39 39
40 40
41 41
42 42
43 43
The Role of Information Redundancy in Audiovisual Speech Integration. A Senior Honors Thesis
 The Role of Information Redundancy in Audiovisual Speech Integration A Senior Honors Thesis Printed in Partial Fulfillment of the Requirement for graduation with distinction in Speech and Hearing Science
Auditory-Visual Integration of Sine-Wave Speech. A Senior Honors Thesis
 Auditory-Visual Integration of Sine-Wave Speech A Senior Honors Thesis Presented in Partial Fulfillment of the Requirements for Graduation with Distinction in Speech and Hearing Science in the Undergraduate
Audio-Visual Integration: Generalization Across Talkers. A Senior Honors Thesis
 Audio-Visual Integration: Generalization Across Talkers A Senior Honors Thesis Presented in Partial Fulfillment of the Requirements for graduation with research distinction in Speech and Hearing Science
Consonant Perception test
 Consonant Perception test Introduction The Vowel-Consonant-Vowel (VCV) test is used in clinics to evaluate how well a listener can recognize consonants under different conditions (e.g. with and without
Speech (Sound) Processing
 Processing") 7 Speech (Sound) Processing Acoustic Human communication is achieved when thought is transformed through language into speech. The sounds of speech are initiated by activity in the central nervous system,
7 Speech (Sound) Processing Acoustic Human communication is achieved when thought is transformed through language into speech. The sounds of speech are initiated by activity in the central nervous system,
THE ROLE OF VISUAL SPEECH CUES IN THE AUDITORY PERCEPTION OF SYNTHETIC STIMULI BY CHILDREN USING A COCHLEAR IMPLANT AND CHILDREN WITH NORMAL HEARING
 THE ROLE OF VISUAL SPEECH CUES IN THE AUDITORY PERCEPTION OF SYNTHETIC STIMULI BY CHILDREN USING A COCHLEAR IMPLANT AND CHILDREN WITH NORMAL HEARING Vanessa Surowiecki 1, vid Grayden 1, Richard Dowell
Language Speech. Speech is the preferred modality for language.
 Language Speech Speech is the preferred modality for language. Outer ear Collects sound waves. The configuration of the outer ear serves to amplify sound, particularly at 2000-5000 Hz, a frequency range
Gick et al.: JASA Express Letters DOI: / Published Online 17 March 2008
 modality when that information is coupled with information via another modality (e.g., McGrath and Summerfield, 1985). It is unknown, however, whether there exist complex relationships across modalities,
ACOUSTIC AND PERCEPTUAL PROPERTIES OF ENGLISH FRICATIVES
 ISCA Archive ACOUSTIC AND PERCEPTUAL PROPERTIES OF ENGLISH FRICATIVES Allard Jongman 1, Yue Wang 2, and Joan Sereno 1 1 Linguistics Department, University of Kansas, Lawrence, KS 66045 U.S.A. 2 Department
It is important to understand as to how do we hear sounds. There is air all around us. The air carries the sound waves but it is below 20Hz that our
 Phonetics. Phonetics: it is a branch of linguistics that deals with explaining the articulatory, auditory and acoustic properties of linguistic sounds of human languages. It is important to understand
HCS 7367 Speech Perception
 Long-term spectrum of speech HCS 7367 Speech Perception Connected speech Absolute threshold Males Dr. Peter Assmann Fall 212 Females Long-term spectrum of speech Vowels Males Females 2) Absolute threshold
RESEARCH ON SPOKEN LANGUAGE PROCESSING Progress Report No. 24 (2000) Indiana University
 Indiana University") COMPARISON OF PARTIAL INFORMATION RESEARCH ON SPOKEN LANGUAGE PROCESSING Progress Report No. 24 (2000) Indiana University Use of Partial Stimulus Information by Cochlear Implant Patients and Normal-Hearing
COMPARISON OF PARTIAL INFORMATION RESEARCH ON SPOKEN LANGUAGE PROCESSING Progress Report No. 24 (2000) Indiana University Use of Partial Stimulus Information by Cochlear Implant Patients and Normal-Hearing
LINGUISTICS 221 LECTURE #3 Introduction to Phonetics and Phonology THE BASIC SOUNDS OF ENGLISH
 LINGUISTICS 221 LECTURE #3 Introduction to Phonetics and Phonology 1. STOPS THE BASIC SOUNDS OF ENGLISH A stop consonant is produced with a complete closure of airflow in the vocal tract; the air pressure
Auditory-Visual Speech Perception Laboratory
 Auditory-Visual Speech Perception Laboratory Research Focus: Identify perceptual processes involved in auditory-visual speech perception Determine the abilities of individual patients to carry out these
Role of F0 differences in source segregation
 Role of F0 differences in source segregation Andrew J. Oxenham Research Laboratory of Electronics, MIT and Harvard-MIT Speech and Hearing Bioscience and Technology Program Rationale Many aspects of segregation
FREQUENCY COMPRESSION AND FREQUENCY SHIFTING FOR THE HEARING IMPAIRED
 FREQUENCY COMPRESSION AND FREQUENCY SHIFTING FOR THE HEARING IMPAIRED Francisco J. Fraga, Alan M. Marotta National Institute of Telecommunications, Santa Rita do Sapucaí - MG, Brazil Abstract A considerable
2/25/2013. Context Effect on Suprasegmental Cues. Supresegmental Cues. Pitch Contour Identification (PCI) Context Effect with Cochlear Implants
 Context Effect with Cochlear Implants") Context Effect on Segmental and Supresegmental Cues Preceding context has been found to affect phoneme recognition Stop consonant recognition (Mann, 1980) A continuum from /da/ to /ga/ was preceded by
Context Effect on Segmental and Supresegmental Cues Preceding context has been found to affect phoneme recognition Stop consonant recognition (Mann, 1980) A continuum from /da/ to /ga/ was preceded by
SPEECH PERCEPTION IN A 3-D WORLD
 SPEECH PERCEPTION IN A 3-D WORLD A line on an audiogram is far from answering the question How well can this child hear speech? In this section a variety of ways will be presented to further the teacher/therapist
HCS 7367 Speech Perception
 Babies 'cry in mother's tongue' HCS 7367 Speech Perception Dr. Peter Assmann Fall 212 Babies' cries imitate their mother tongue as early as three days old German researchers say babies begin to pick up
Intelligibility of clear speech at normal rates for older adults with hearing loss
 University of South Florida Scholar Commons Graduate Theses and Dissertations Graduate School 2006 Intelligibility of clear speech at normal rates for older adults with hearing loss Billie Jo Shaw University
Effects of noise and filtering on the intelligibility of speech produced during simultaneous communication
 Journal of Communication Disorders 37 (2004) 505 515 Effects of noise and filtering on the intelligibility of speech produced during simultaneous communication Douglas J. MacKenzie a,*, Nicholas Schiavetti
Prelude Envelope and temporal fine. What's all the fuss? Modulating a wave. Decomposing waveforms. The psychophysics of cochlear
 The psychophysics of cochlear implants Stuart Rosen Professor of Speech and Hearing Science Speech, Hearing and Phonetic Sciences Division of Psychology & Language Sciences Prelude Envelope and temporal
Exploring the parameter space of Cochlear Implant Processors for consonant and vowel recognition rates using normal hearing listeners
 PAGE 335 Exploring the parameter space of Cochlear Implant Processors for consonant and vowel recognition rates using normal hearing listeners D. Sen, W. Li, D. Chung & P. Lam School of Electrical Engineering
Evaluating the role of spectral and envelope characteristics in the intelligibility advantage of clear speech
 Evaluating the role of spectral and envelope characteristics in the intelligibility advantage of clear speech Jean C. Krause a and Louis D. Braida Research Laboratory of Electronics, Massachusetts Institute
Effects of speaker's and listener's environments on speech intelligibili annoyance. Author(s)Kubo, Rieko; Morikawa, Daisuke; Akag
Kubo, Rieko; Morikawa, Daisuke; Akag") JAIST Reposi https://dspace.j Title Effects of speaker's and listener's environments on speech intelligibili annoyance Author(s)Kubo, Rieko; Morikawa, Daisuke; Akag Citation Inter-noise 2016: 171-176 Issue
JAIST Reposi https://dspace.j Title Effects of speaker's and listener's environments on speech intelligibili annoyance Author(s)Kubo, Rieko; Morikawa, Daisuke; Akag Citation Inter-noise 2016: 171-176 Issue
11 Music and Speech Perception
 11 Music and Speech Perception Properties of sound Sound has three basic dimensions: Frequency (pitch) Intensity (loudness) Time (length) Properties of sound The frequency of a sound wave, measured in
MULTI-CHANNEL COMMUNICATION
 INTRODUCTION Research on the Deaf Brain is beginning to provide a new evidence base for policy and practice in relation to intervention with deaf children. This talk outlines the multi-channel nature of
Audiovisual speech perception in children with autism spectrum disorders and typical controls
 Audiovisual speech perception in children with autism spectrum disorders and typical controls Julia R. Irwin 1,2 and Lawrence Brancazio 1,2 1 Haskins Laboratories, New Haven, CT, USA 2 Southern Connecticut
Assessing Hearing and Speech Recognition
 Assessing Hearing and Speech Recognition Audiological Rehabilitation Quick Review Audiogram Types of hearing loss hearing loss hearing loss Testing Air conduction Bone conduction Familiar Sounds Audiogram
Speech Reading Training and Audio-Visual Integration in a Child with Autism Spectrum Disorder
 University of Arkansas, Fayetteville ScholarWorks@UARK Rehabilitation, Human Resources and Communication Disorders Undergraduate Honors Theses Rehabilitation, Human Resources and Communication Disorders
Speech Cue Weighting in Fricative Consonant Perception in Hearing Impaired Children
 University of Tennessee, Knoxville Trace: Tennessee Research and Creative Exchange University of Tennessee Honors Thesis Projects University of Tennessee Honors Program 5-2014 Speech Cue Weighting in Fricative
MODALITY, PERCEPTUAL ENCODING SPEED, AND TIME-COURSE OF PHONETIC INFORMATION
 ISCA Archive MODALITY, PERCEPTUAL ENCODING SPEED, AND TIME-COURSE OF PHONETIC INFORMATION Philip Franz Seitz and Ken W. Grant Army Audiology and Speech Center Walter Reed Army Medical Center Washington,
USING AUDITORY SALIENCY TO UNDERSTAND COMPLEX AUDITORY SCENES
 USING AUDITORY SALIENCY TO UNDERSTAND COMPLEX AUDITORY SCENES Varinthira Duangudom and David V Anderson School of Electrical and Computer Engineering, Georgia Institute of Technology Atlanta, GA 30332
Overview. Acoustics of Speech and Hearing. Source-Filter Model. Source-Filter Model. Turbulence Take 2. Turbulence
 Overview Acoustics of Speech and Hearing Lecture 2-4 Fricatives Source-filter model reminder Sources of turbulence Shaping of source spectrum by vocal tract Acoustic-phonetic characteristics of English
ACOUSTIC ANALYSIS AND PERCEPTION OF CANTONESE VOWELS PRODUCED BY PROFOUNDLY HEARING IMPAIRED ADOLESCENTS
 ACOUSTIC ANALYSIS AND PERCEPTION OF CANTONESE VOWELS PRODUCED BY PROFOUNDLY HEARING IMPAIRED ADOLESCENTS Edward Khouw, & Valter Ciocca Dept. of Speech and Hearing Sciences, The University of Hong Kong
Demonstration of a Novel Speech-Coding Method for Single-Channel Cochlear Stimulation
 THE HARRIS SCIENCE REVIEW OF DOSHISHA UNIVERSITY, VOL. 58, NO. 4 January 2018 Demonstration of a Novel Speech-Coding Method for Single-Channel Cochlear Stimulation Yuta TAMAI*, Shizuko HIRYU*, and Kohta
SLHS 1301 The Physics and Biology of Spoken Language. Practice Exam 2. b) 2 32
 2 32") SLHS 1301 The Physics and Biology of Spoken Language Practice Exam 2 Chapter 9 1. In analog-to-digital conversion, quantization of the signal means that a) small differences in signal amplitude over time
SLHS 1301 The Physics and Biology of Spoken Language Practice Exam 2 Chapter 9 1. In analog-to-digital conversion, quantization of the signal means that a) small differences in signal amplitude over time
WIDEXPRESS. no.30. Background
 WIDEXPRESS no. january 12 By Marie Sonne Kristensen Petri Korhonen Using the WidexLink technology to improve speech perception Background For most hearing aid users, the primary motivation for using hearing
Sonic Spotlight. SmartCompress. Advancing compression technology into the future
 Sonic Spotlight SmartCompress Advancing compression technology into the future Speech Variable Processing (SVP) is the unique digital signal processing strategy that gives Sonic hearing aids their signature
Categorical Perception
 Categorical Perception Discrimination for some speech contrasts is poor within phonetic categories and good between categories. Unusual, not found for most perceptual contrasts. Influenced by task, expectations,
Optimal Filter Perception of Speech Sounds: Implications to Hearing Aid Fitting through Verbotonal Rehabilitation
 Optimal Filter Perception of Speech Sounds: Implications to Hearing Aid Fitting through Verbotonal Rehabilitation Kazunari J. Koike, Ph.D., CCC-A Professor & Director of Audiology Department of Otolaryngology
Tactile Communication of Speech
 Tactile Communication of Speech RLE Group Sensory Communication Group Sponsor National Institutes of Health/National Institute on Deafness and Other Communication Disorders Grant 2 R01 DC00126, Grant 1
The role of periodicity in the perception of masked speech with simulated and real cochlear implants
 The role of periodicity in the perception of masked speech with simulated and real cochlear implants Kurt Steinmetzger and Stuart Rosen UCL Speech, Hearing and Phonetic Sciences Heidelberg, 09. November
Speech Spectra and Spectrograms
 ACOUSTICS TOPICS ACOUSTICS SOFTWARE SPH301 SLP801 RESOURCE INDEX HELP PAGES Back to Main "Speech Spectra and Spectrograms" Page Speech Spectra and Spectrograms Robert Mannell 6. Some consonant spectra
ILLUSIONS AND ISSUES IN BIMODAL SPEECH PERCEPTION
 ISCA Archive ILLUSIONS AND ISSUES IN BIMODAL SPEECH PERCEPTION Dominic W. Massaro Perceptual Science Laboratory (http://mambo.ucsc.edu/psl/pslfan.html) University of California Santa Cruz, CA 95064 massaro@fuzzy.ucsc.edu
Binaural Hearing. Why two ears? Definitions
 Binaural Hearing Why two ears? Locating sounds in space: acuity is poorer than in vision by up to two orders of magnitude, but extends in all directions. Role in alerting and orienting? Separating sound
Speech conveys not only linguistic content but. Vocal Emotion Recognition by Normal-Hearing Listeners and Cochlear Implant Users
 Cochlear Implants Special Issue Article Vocal Emotion Recognition by Normal-Hearing Listeners and Cochlear Implant Users Trends in Amplification Volume 11 Number 4 December 2007 301-315 2007 Sage Publications
Production of Stop Consonants by Children with Cochlear Implants & Children with Normal Hearing. Danielle Revai University of Wisconsin - Madison
 Production of Stop Consonants by Children with Cochlear Implants & Children with Normal Hearing Danielle Revai University of Wisconsin - Madison Normal Hearing (NH) Who: Individuals with no HL What: Acoustic
Perception of clear fricatives by normal-hearing and simulated hearing-impaired listeners
 Perception of clear fricatives by normal-hearing and simulated hearing-impaired listeners Kazumi Maniwa a and Allard Jongman Department of Linguistics, The University of Kansas, Lawrence, Kansas 66044
Binaural processing of complex stimuli
 Binaural processing of complex stimuli Outline for today Binaural detection experiments and models Speech as an important waveform Experiments on understanding speech in complex environments (Cocktail
What you re in for. Who are cochlear implants for? The bottom line. Speech processing schemes for
 What you re in for Speech processing schemes for cochlear implants Stuart Rosen Professor of Speech and Hearing Science Speech, Hearing and Phonetic Sciences Division of Psychology & Language Sciences
Ambiguity in the recognition of phonetic vowels when using a bone conduction microphone
 Acoustics 8 Paris Ambiguity in the recognition of phonetic vowels when using a bone conduction microphone V. Zimpfer a and K. Buck b a ISL, 5 rue du Général Cassagnou BP 734, 6831 Saint Louis, France b
Providing Effective Communication Access
 Providing Effective Communication Access 2 nd International Hearing Loop Conference June 19 th, 2011 Matthew H. Bakke, Ph.D., CCC A Gallaudet University Outline of the Presentation Factors Affecting Communication
A Consumer-friendly Recap of the HLAA 2018 Research Symposium: Listening in Noise Webinar
 A Consumer-friendly Recap of the HLAA 2018 Research Symposium: Listening in Noise Webinar Perry C. Hanavan, AuD Augustana University Sioux Falls, SD August 15, 2018 Listening in Noise Cocktail Party Problem
Auditory Scene Analysis
 1 Auditory Scene Analysis Albert S. Bregman Department of Psychology McGill University 1205 Docteur Penfield Avenue Montreal, QC Canada H3A 1B1 E-mail: bregman@hebb.psych.mcgill.ca To appear in N.J. Smelzer
Computational Perception /785. Auditory Scene Analysis
 Computational Perception 15-485/785 Auditory Scene Analysis A framework for auditory scene analysis Auditory scene analysis involves low and high level cues Low level acoustic cues are often result in
Speech perception in individuals with dementia of the Alzheimer s type (DAT) Mitchell S. Sommers Department of Psychology Washington University
 Mitchell S. Sommers Department of Psychology Washington University") Speech perception in individuals with dementia of the Alzheimer s type (DAT) Mitchell S. Sommers Department of Psychology Washington University Overview Goals of studying speech perception in individuals
Speech perception in individuals with dementia of the Alzheimer s type (DAT) Mitchell S. Sommers Department of Psychology Washington University Overview Goals of studying speech perception in individuals
Hearing the Universal Language: Music and Cochlear Implants
 Hearing the Universal Language: Music and Cochlear Implants Professor Hugh McDermott Deputy Director (Research) The Bionics Institute of Australia, Professorial Fellow The University of Melbourne Overview?
Perceptual Effects of Nasal Cue Modification
 Send Orders for Reprints to reprints@benthamscience.ae The Open Electrical & Electronic Engineering Journal, 2015, 9, 399-407 399 Perceptual Effects of Nasal Cue Modification Open Access Fan Bai 1,2,*
Juan Carlos Tejero-Calado 1, Janet C. Rutledge 2, and Peggy B. Nelson 3
 PRESERVING SPECTRAL CONTRAST IN AMPLITUDE COMPRESSION FOR HEARING AIDS Juan Carlos Tejero-Calado 1, Janet C. Rutledge 2, and Peggy B. Nelson 3 1 University of Malaga, Campus de Teatinos-Complejo Tecnol
Speechreading (Lipreading) Carol De Filippo Viet Nam Teacher Education Institute June 2010
 Carol De Filippo Viet Nam Teacher Education Institute June 2010") Speechreading (Lipreading) Carol De Filippo Viet Nam Teacher Education Institute June 2010 Topics Demonstration Terminology Elements of the communication context (a model) Factors that influence success
Speechreading (Lipreading) Carol De Filippo Viet Nam Teacher Education Institute June 2010 Topics Demonstration Terminology Elements of the communication context (a model) Factors that influence success
AUDL GS08/GAV1 Signals, systems, acoustics and the ear. Pitch & Binaural listening
 AUDL GS08/GAV1 Signals, systems, acoustics and the ear Pitch & Binaural listening Review 25 20 15 10 5 0-5 100 1000 10000 25 20 15 10 5 0-5 100 1000 10000 Part I: Auditory frequency selectivity Tuning
PLEASE SCROLL DOWN FOR ARTICLE
 This article was downloaded by:[michigan State University Libraries] On: 9 October 2007 Access Details: [subscription number 768501380] Publisher: Informa Healthcare Informa Ltd Registered in England and
Best Practice Protocols
 Best Practice Protocols SoundRecover for children What is SoundRecover? SoundRecover (non-linear frequency compression) seeks to give greater audibility of high-frequency everyday sounds by compressing
Sylvia Rotfleisch, M.Sc.(A.) hear2talk.com HEAR2TALK.COM
 hear2talk.com HEAR2TALK.COM") Sylvia Rotfleisch, M.Sc.(A.) hear2talk.com 1 Teaching speech acoustics to parents has become an important and exciting part of my auditory-verbal work with families. Creating a way to make this understandable
Sylvia Rotfleisch, M.Sc.(A.) hear2talk.com 1 Teaching speech acoustics to parents has become an important and exciting part of my auditory-verbal work with families. Creating a way to make this understandable
Acoustics of Speech and Environmental Sounds
 International Speech Communication Association (ISCA) Tutorial and Research Workshop on Experimental Linguistics 28-3 August 26, Athens, Greece Acoustics of Speech and Environmental Sounds Susana M. Capitão
Does Wernicke's Aphasia necessitate pure word deafness? Or the other way around? Or can they be independent? Or is that completely uncertain yet?
 Does Wernicke's Aphasia necessitate pure word deafness? Or the other way around? Or can they be independent? Or is that completely uncertain yet? Two types of AVA: 1. Deficit at the prephonemic level and
Topics in Linguistic Theory: Laboratory Phonology Spring 2007
 MIT OpenCourseWare http://ocw.mit.edu 24.91 Topics in Linguistic Theory: Laboratory Phonology Spring 27 For information about citing these materials or our Terms of Use, visit: http://ocw.mit.edu/terms.
TIPS FOR TEACHING A STUDENT WHO IS DEAF/HARD OF HEARING
 http://mdrl.educ.ualberta.ca TIPS FOR TEACHING A STUDENT WHO IS DEAF/HARD OF HEARING 1. Equipment Use: Support proper and consistent equipment use: Hearing aids and cochlear implants should be worn all
Integral Processing of Visual Place and Auditory Voicing Information During Phonetic Perception
 Journal of Experimental Psychology: Human Perception and Performance 1991, Vol. 17. No. 1,278-288 Copyright 1991 by the American Psychological Association, Inc. 0096-1523/91/S3.00 Integral Processing of
Auditory Dominance: Overshadowing or Response Competition?
 Auditory Dominance: Overshadowing or Response Competition? Christopher W. Robinson (robinson.777@osu.edu) Center for Cognitive Science The Ohio State University 208F Ohio Stadium East, 1961 Tuttle Park
Simulations of high-frequency vocoder on Mandarin speech recognition for acoustic hearing preserved cochlear implant
 INTERSPEECH 2017 August 20 24, 2017, Stockholm, Sweden Simulations of high-frequency vocoder on Mandarin speech recognition for acoustic hearing preserved cochlear implant Tsung-Chen Wu 1, Tai-Shih Chi
Sound localization psychophysics
 Sound localization psychophysics Eric Young A good reference: B.C.J. Moore An Introduction to the Psychology of Hearing Chapter 7, Space Perception. Elsevier, Amsterdam, pp. 233-267 (2004). Sound localization:
Communication with low-cost hearing protectors: hear, see and believe
 12th ICBEN Congress on Noise as a Public Health Problem Communication with low-cost hearing protectors: hear, see and believe Annelies Bockstael 1,3, Lies De Clercq 2, Dick Botteldooren 3 1 Université
Interjudge Reliability in the Measurement of Pitch Matching. A Senior Honors Thesis
 Interjudge Reliability in the Measurement of Pitch Matching A Senior Honors Thesis Presented in partial fulfillment of the requirements for graduation with distinction in Speech and Hearing Science in
Congruency Effects with Dynamic Auditory Stimuli: Design Implications
 Congruency Effects with Dynamic Auditory Stimuli: Design Implications Bruce N. Walker and Addie Ehrenstein Psychology Department Rice University 6100 Main Street Houston, TX 77005-1892 USA +1 (713) 527-8101
How Does Speaking Clearly Influence Acoustic Measures? A Speech Clarity Study Using Long-term Average Speech Spectra in Korean Language
 Clinical and Experimental Otorhinolaryngology Vol. 5, No. 2: 68-73, June 12 http://dx.doi.org/10.3342/ceo.12.5.2.68 Original Article How Does Speaking Clearly Influence Acoustic Measures? A Speech Clarity
The effect of wearing conventional and level-dependent hearing protectors on speech production in noise and quiet
 The effect of wearing conventional and level-dependent hearing protectors on speech production in noise and quiet Ghazaleh Vaziri Christian Giguère Hilmi R. Dajani Nicolas Ellaham Annual National Hearing
The influence of selective attention to auditory and visual speech on the integration of audiovisual speech information
 Perception, 2011, volume 40, pages 1164 ^ 1182 doi:10.1068/p6939 The influence of selective attention to auditory and visual speech on the integration of audiovisual speech information Julie N Buchan,
Effect of spectral content and learning on auditory distance perception
 Effect of spectral content and learning on auditory distance perception Norbert Kopčo 1,2, Dávid Čeljuska 1, Miroslav Puszta 1, Michal Raček 1 a Martin Sarnovský 1 1 Department of Cybernetics and AI, Technical
Perception of Spectrally Shifted Speech: Implications for Cochlear Implants
 Int. Adv. Otol. 2011; 7:(3) 379-384 ORIGINAL STUDY Perception of Spectrally Shifted Speech: Implications for Cochlear Implants Pitchai Muthu Arivudai Nambi, Subramaniam Manoharan, Jayashree Sunil Bhat,
Advanced Audio Interface for Phonetic Speech. Recognition in a High Noise Environment
 DISTRIBUTION STATEMENT A Approved for Public Release Distribution Unlimited Advanced Audio Interface for Phonetic Speech Recognition in a High Noise Environment SBIR 99.1 TOPIC AF99-1Q3 PHASE I SUMMARY
Essential feature. Who are cochlear implants for? People with little or no hearing. substitute for faulty or missing inner hair
 Who are cochlear implants for? Essential feature People with little or no hearing and little conductive component to the loss who receive little or no benefit from a hearing aid. Implants seem to work
Hearing Lectures. Acoustics of Speech and Hearing. Auditory Lighthouse. Facts about Timbre. Analysis of Complex Sounds
 Hearing Lectures Acoustics of Speech and Hearing Week 2-10 Hearing 3: Auditory Filtering 1. Loudness of sinusoids mainly (see Web tutorial for more) 2. Pitch of sinusoids mainly (see Web tutorial for more)
IN THE UNITED STATES PATENT AND TRADEMARK OFFICE. For PROVISIONAL APPLICATION FOR LETTERS PATENT. Inventor: David Rexford. Logical Phonetic Alphabet
 IN THE UNITED STATES PATENT AND TRADEMARK OFFICE PROVISIONAL APPLICATION FOR LETTERS PATENT For Logical Phonetic Alphabet Inventor: David Rexford Logical Phonetic Alphabet Inventor: David Rexford FIELD
Who are cochlear implants for?
 Who are cochlear implants for? People with little or no hearing and little conductive component to the loss who receive little or no benefit from a hearing aid. Implants seem to work best in adults who
ID# Exam 2 PS 325, Fall 2003
 ID# Exam 2 PS 325, Fall 2003 As always, the Honor Code is in effect and you ll need to write the code and sign it at the end of the exam. Read each question carefully and answer it completely. Although
Multimodal interactions: visual-auditory
 1 Multimodal interactions: visual-auditory Imagine that you are watching a game of tennis on television and someone accidentally mutes the sound. You will probably notice that following the game becomes
Place and Manner of Articulation Sounds in English. Dr. Bushra Ni ma
 Place and Manner of Articulation Sounds in English Dr. Bushra Ni ma Organs of Speech Respiratory System Phonatory System Articulatory System Lungs Muscles of the chest Trachea Larynx Pharynx Lips Teeth
Temporal Location of Perceptual Cues for Cantonese Tone Identification
 Temporal Location of Perceptual Cues for Cantonese Tone Identification Zoe Wai-Man Lam, Kathleen Currie Hall and Douglas Pulleyblank Department of Linguistics University of British Columbia 1 Outline of
Elements of Effective Hearing Aid Performance (2004) Edgar Villchur Feb 2004 HearingOnline
 Edgar Villchur Feb 2004 HearingOnline") Elements of Effective Hearing Aid Performance (2004) Edgar Villchur Feb 2004 HearingOnline To the hearing-impaired listener the fidelity of a hearing aid is not fidelity to the input sound but fidelity
Elements of Effective Hearing Aid Performance (2004) Edgar Villchur Feb 2004 HearingOnline To the hearing-impaired listener the fidelity of a hearing aid is not fidelity to the input sound but fidelity
Speech, Hearing and Language: work in progress. Volume 11
 Speech, Hearing and Language: work in progress Volume 11 Periodicity and pitch information in simulations of cochlear implant speech processing Andrew FAULKNER, Stuart ROSEN and Clare SMITH Department
Automatic Judgment System for Chinese Retroflex and Dental Affricates Pronounced by Japanese Students
 Automatic Judgment System for Chinese Retroflex and Dental Affricates Pronounced by Japanese Students Akemi Hoshino and Akio Yasuda Abstract Chinese retroflex aspirates are generally difficult for Japanese
Week 2 Systems (& a bit more about db)
") AUDL Signals & Systems for Speech & Hearing Reminder: signals as waveforms A graph of the instantaneousvalue of amplitude over time x-axis is always time (s, ms, µs) y-axis always a linear instantaneousamplitude
AUDL Signals & Systems for Speech & Hearing Reminder: signals as waveforms A graph of the instantaneousvalue of amplitude over time x-axis is always time (s, ms, µs) y-axis always a linear instantaneousamplitude
Changes in the Role of Intensity as a Cue for Fricative Categorisation
 INTERSPEECH 2013 Changes in the Role of Intensity as a Cue for Fricative Categorisation Odette Scharenborg 1, Esther Janse 1,2 1 Centre for Language Studies and Donders Institute for Brain, Cognition and
Jitter, Shimmer, and Noise in Pathological Voice Quality Perception
 ISCA Archive VOQUAL'03, Geneva, August 27-29, 2003 Jitter, Shimmer, and Noise in Pathological Voice Quality Perception Jody Kreiman and Bruce R. Gerratt Division of Head and Neck Surgery, School of Medicine
A. Faulkner, S. Rosen, and L. Wilkinson
 Effects of the Number of Channels and Speech-to- Noise Ratio on Rate of Connected Discourse Tracking Through a Simulated Cochlear Implant Speech Processor A. Faulkner, S. Rosen, and L. Wilkinson Objective:
Topic 4. Pitch & Frequency
 Topic 4 Pitch & Frequency A musical interlude KOMBU This solo by Kaigal-ool of Huun-Huur-Tu (accompanying himself on doshpuluur) demonstrates perfectly the characteristic sound of the Xorekteer voice An
Research Article Measurement of Voice Onset Time in Maxillectomy Patients
 e Scientific World Journal, Article ID 925707, 4 pages http://dx.doi.org/10.1155/2014/925707 Research Article Measurement of Voice Onset Time in Maxillectomy Patients Mariko Hattori, 1 Yuka I. Sumita,
Slide 1. Slide 2. Slide 3. Introduction to the Electrolarynx. I have nothing to disclose and I have no proprietary interest in any product discussed.
 Slide 1 Introduction to the Electrolarynx CANDY MOLTZ, MS, CCC -SLP TLA SAN ANTONIO 2019 Slide 2 I have nothing to disclose and I have no proprietary interest in any product discussed. Slide 3 Electrolarynxes