arxiv: v1 [cs.cv] 9 Feb 2018
|
|
|
- Hilary Bradford
- 5 years ago
- Views:
Transcription
1 Automatic segmenting teeth in X-ray images: Trends, a novel data set, benchmarking and future perspectives Gil Silva 1, Luciano Oliveira 2 Ivision Lab, Federal University of Bahia, Brazil arxiv: v1 [cs.cv] 9 Feb 2018 Abstract Matheus Pithon 3 Southeast State University of Bahia, Brazil This review presents an in-depth study of the literature on segmentation methods applied in dental imaging. Ten segmentation methods were studied and categorized according to the type of the segmentation method (region-based, threshold-based, cluster-based, boundary-based or watershed-based), type of X- ray images used (intra-oral or extra-oral) and characteristics of the dataset used to evaluate the methods in the state-of-the-art works. We found that the literature has primarily focused on threshold-based segmentation methods (54%). 80% of the reviewed papers have used intra-oral X-ray images in their experiments, demonstrating preference to perform segmentation on images of already isolated parts of the teeth, rather than using extra-oral X-rays, which show tooth structure of the mouth and bones of the face. To fill a scientific gap in the field, a novel data set based on extra-oral X-ray images are proposed here. A statistical comparison of the results found with the 10 image segmentation methods over our proposed data set comprised of 1,500 images is also carried out, providing a more comprehensive source of performance assessment. Discussion on limitations of the methods conceived over the past year as well as future perspectives on exploiting learning-based segmentation methods to improve performance are also provided. Keywords: image segmentation, dental X-ray, orthopantomography 1. Introduction In dentistry, radiographic images are fundamental data sources to aid diagnosis. Radiography is the photographic record of an image produced by the 1 gil.jader@gmail.com 2 lrebouca@ufba.br 3 matheuspithon@gmail.com
2 passage of an X-ray source through an object (Quinn and Sigl, 1980). X-ray images are used in dental medicine to check the condition of the teeth, gums, jaws and bone structure of a mouth (Quinn and Sigl, 1980). Without X-rays, Dentists would not be able to detect many dental problems until they become severe. This way, the radiographic examination helps the dentist to discover the cause of the problem at an early stage, allowing then to outline the best treatment plan for the patient. Another application of dental X-rays is in the field of forensic identification, especially in cadavers (Paewinsky et al., 2005). The forensic dentistry aims to identify individuals based on their dental characteristics. In recent years, forensic literature has also provided automatic methods to assessing person s age from degenerative changes in teeth (Willems et al., 2002). These age-related changes can be assessed by digital radiography (Paewinsky et al., 2005). With the advancement of artificial intelligence and pattern recognition algorithms, X-ray images have been increasingly used as an input to these intelligent algorithms. In this context, we highlight here an in-depth study over some segmentation methods in the literature that are regarded to the recognition of image patterns in dental X-rays Overview of dental image segmentation In dentistry, X-rays are divided into two categories: (i) Intra-oral radiographic examinations are techniques performed with the film positioned in the buccal cavity (the X-ray image is obtained inside the patient s mouth); and (ii) extra-oral radiographic examinations are the techniques in which the patient is positioned between the radiographic film and the source of X-rays (the X-ray image is obtained outside the patient s mouth) (Association, 1987). In this paper, some works that use segmentation methods applied to the following types of X-ray images are analyzed: bitewing and periapical (intraoral), and panoramic (extra-oral). The bitewing X-ray images are used to show details of the upper and lower teeth in a mouth region, while the periapical X-ray images is used to monitor the entire tooth (Wang et al., 2016). On the other hand, panoramic radiography, also known as orthopantomography, is one of the radiological exams capable of obtaining fundamental information for the diagnosis of anomalies in dental medicine (Amer and Aqel, 2015), (Wang et al., 2016). Orthopantomographic examination allows for the visualization of dental irregularities, such as: teeth included, bone abnormalities, cysts, tumors, cancers, infections, post-accident fractures, temporomandibular joint disorders that cause pain in the ear, face, neck and head (Oliveira and Proença, 2011). X-ray images are pervasively used by dentists to analyze the dental structure and to define patient s treatment plan. However, due to the lack of adequate automated resources to aid the analysis of dental X-ray images, X-ray analysis relies on mostly the dentist s experience and visual perception (Wang et al., 2016). Other details in dental X-rays that make it difficult to analyze these images are: Variations of patient-to-patient teeth, artifacts used for restorations and prostheses, poor image qualities caused by certain conditions (such as noise, low contrast, homogeneity in regions close to objects of interest), space existing by a missing tooth, and limitation of acquisition methods; all these challenges 2
3 result in unsuccessful development of automated computer tools to aid dental diagnosis, avoiding completely automatic analysis Amer and Aqel (2015). Image segmentation is the process of partitioning a digital image into multiple regions (pixel set) or objects, in order to make an image representation simpler, and to facilitate its analysis. The present work is being carried out to help in finding advances in the state-of-the art of methods for segmenting dental X-ray images that are able, for example, to isolate teeth from other parts of the image (jaws, temporomandibular regions, details of nasal, face and gums) towards facilitating the automatic analysis of X-rays. With that, we are capable to discuss limitations in the current proposed methods and future perspectives for breakthroughs in this research field Contributions This paper provides an in-depth review of the literature in dental X-ray image segmentation. A comparative evaluation of ten methods to segment extraoral dental images over a novel data set is also addressed. The proposed data set was gathered specially for the present study, and contains 1,500 annotated panoramic X-ray images 4. This present study is towards to answering the following questions (see Section 3): Which category of segmentation method is most used in the reviewed works?, do public data sets used to evaluate dental segmentation methods present sufficiently variability to evaluate the progress of the field?. Also, these other following questions (see Section 4) which segmentation method obtains the best performance on extracting characteristics of radiographic images (panoramic X-ray), so that it is possible to perfectly isolate teeth?, what are the gaps in dental X-rays that can benefit from the application of image segmentation methods? Finally, we discuss recent advances in pattern recognition methods that could be applied in tooth segmentation (see Section 5). To answer the list of questions, the present review follows the steps: (i) analysis of the current state-of-the-art, observing the trends of the segmentation methods in dental X-ray images, (ii) identification of which image segmentation methods are the most used among the reviewed works, (iii) analysis of the amount and variety of images used in the experiments of the reviewed works, (iv) identification of which type of dental X-ray image has been most used among the reviewed works, (v) introduction of a novel annotated data set with a high variability and a great number of images, and, finally, (vi) a comparative evaluation of dental segmentation methods applied to our data set. These steps are followed from the classification of the papers found in the literature, considering: segmentation methods, X-ray image types, size and variety of the data sets used. It is noteworthy that the reviewed articles mostly work with small data sets, ranging from 1 to 100 images in average, and the only work with more than one thousand images is not publicly available, or only containing images varying 4 Our data set will be publicly available on the acceptance of the paper. 3
4 only in relation to the number of teeth. To tackle this limitation, the proposed data set is comprised of 1,500 annotated images, which allow the classification of X-rays in 10 categories according to the following general characteristics: Structural variations in relation to the teeth, number of teeth, existence of restorations, existence of dental implants, existence of dental appliances, and existence of dental images with more than 32 teeth. The images represent the most diverse situations found among patients in dental offices. In this sense, a comparative evaluation of 10 segmentation methods was performed to verify which method can more accurately identify each individual tooth, in panoramic X-ray images. Metrics, such as accuracy, specificity, precision, recall (sensitivity) and F-score, were used to assess the performance of each segmentation method analyzed here. 2. Research methodology This review has followed the methodological steps: (A) select the digital libraries and articles (Section 2.1), (B) review the selected articles (Section 2.2), (C) define relevant categories to classify the articles and classify articles in the categories defined (Section 3). Steps (B) and (C) ran until final results were obtained. Step (D) was repeated until the evaluation of all the segmentation methods studied was finalized (Section 4). Finally, step (E) presents discussion about the evaluated methods and future directions to build more robust and efficient segmentation methods (Section 5) Research sources and selection of the articles Our review is based on the state-of-the-art articles found in the following digital libraries: IEEE Xplore 1, ScienceDirect 2, Google Scholar 3 and Scopus 4. The choice of these four digital libraries relies on the fact that they include articles presented in all other digital libraries related to either Computer Science or Dentistry. The selection of the articles was based on their prominence in the field of English language. The articles were selected in two phases: In phase I, a total of 94 articles were found in these four digital libraries. In Phase II, articles such as calendars, book chapter, publisher s notes, subject index, volume content, and from symposiums were excluded from the present study. Only peer-reviewed international conferences and journal articles were considered; among those, studies that corresponded to some of the following cases were considered as non-relevant and excluded from the analysis: (1) did not answer any of our questions in this research, (2) duplicated, (3) not peer-reviewed, and (4) did not apply segmentation methods on at least one of the following types of dental X-rays: Bitewing, periapical or panoramic. The final number of articles selected
5 was reduced to 41, at the end. The number of articles initially found in each digital library is summarized in Table 1. As shown in Table 1, only three of the four libraries surveyed have found relevant studies. In addition, forty-nine percent (49%) of the articles selected as relevant were found in the Science Direct digital library. Table 2 shows the initial statistics obtained in the review stage of the present study, containing the distribution of articles by digital library and year of publication. The data presented in Table 2 show the largest number of articles found in the IEEE Xplore digital library with 34 articles (36%). The results in Table 2 also show the increasing trend in the number of articles published in recent years. Sixtysix percent (66%) of the articles found were published in the last five years (61 articles) Selection of the relevant articles In the second stage, the goal was to ensure the correct classification of the articles selected only as relevant. The review of the articles follows a categorization phase (presented in the next section), since it was necessary to re-read articles to classify them in each of the respective categories. SOURCE Table 1: Total number of studies found by digital library. Source Results Not Relevant Repeated Incomplete Relevant Studies IEEE Xplore Science Direct Google Scholar Scopus TOTAL Table 2: Distribution of articles by digital library and year of publication. YEAR Sum % IEEE Xplore Science Direct Google Scholar Scopus % % % % % % % % % % % % % Total %
6 3. Taxonomy of the relevant works Each article selected as relevant was classified among categories defined in the present study, according to: The segmentation method used, type of dental X-ray used images, the size and variety of the data set used. It is noteworthy that the segmentation methods discussed and benchmarked in this review are strictly from the state-of-the-art works Segmentation categories Chen and Leung (2004) categorize segmentation methods according to the characteristics (shape, histogram, threshold, region, entropy, spatial correlation of pixels, among others) searched in a variety of source images (X-ray, thermal ultrasonic, etc) to generate the cut-off point (value that determines what the objects of interest in the analyzed image are). We adapted the general classification found in (Chen and Leung, 2004) to the classification of the works studied in the field of dental image segmentation as follows: (1) Region-based, (2) threshold-based, (3) cluster-based, (4) boundary-based, (5) watershed-based. The categories were defined based on the characteristics that the relevant articles explore in the images analyzed to carry out the segmentation. Table 3 shows the relevant works, classified into the categories of the segmentation methods. Important details about each segmentation method presented in each category are addressed in Section 4.2. Region-based. The goal of the region-based method is to divide an image into regions, based on discontinuities in pixel intensity levels. Among the relevant articles selected, only Lurie et al. (2012) and Modi and Desai (2011) used the region-based segmentation. The aim of the study in (Lurie et al., 2012) was to segment panoramic X-ray images of the teeth to assist the Dentist in procedures for detection of osteopenia and osteoporosis. Modi and Desai (2011) used region growing approach to segment bitewing X-ray images. Threshold-based. The rationale of the intensity threshold application in image segmentation starts from the choice of a threshold value. Pixels whose values exceed the threshold are placed into a region, while pixels with values below the threshold are placed into an adjacent region. Most of the articles selected as relevant (54%) use the threshold-based segmentation approach (Abaza et al., 2009), (Ajaz and Kathirvelu, 2013) (Cameriere et al., 2015), (Jain and Chen, 2004), (Lin et al., 2014), (Dighe and Revati, 2012), (Huang and Hsu, 2008), (Lin et al., 2015), (Bruellmann et al., 2016), (Amer and Aqel, 2015), (Tikhe et al., 2016)), ((Said et al., 2006), (Geraets et al., 2007), (Lin et al., 2010), (Wang et al., 2016), (Nomir and Abdel-Mottaleb, 2008b), (Kaur and Kaur, 2016), (Nomir and Abdel-Mottaleb, 2008a), (Keshtkar and Gueaieb, 2007), (Lin et al., 2013), (Indraswari et al., 2015), (Mohamed Razali et al., 2014). In certain cases, pixel gray levels, which belongs to the objects of interest, are substantially different from the gray levels of the pixels in the background. In those cases, threshold segmentation based on the histogram of the image is 6
7 Table 3: Works grouped by segmentation methods. Category Segmentation method (Related works) Region-based Region growing ((Lurie et al., 2012), (Modi and Desai, 2011)) Threshold-based Histogram-based threshold ((Abaza et al., 2009), (Ajaz and Kathirvelu, 2013) (Cameriere et al., 2015), (Jain and Chen, 2004), (Lin et al., 2014), (Dighe and Revati, 2012), (Huang and Hsu, 2008), (Lin et al., 2015), (Bruellmann et al., 2016), (Amer and Aqel, 2015), (Tikhe et al., 2016)) / Variable threshold ((Said et al., 2006), (Geraets et al., 2007), (Lin et al., 2010), (Wang et al., 2016), (Nomir and Abdel- Mottaleb, 2008b), (Kaur and Kaur, 2016), (Nomir and Abdel-Mottaleb, 2008a), (Keshtkar and Gueaieb, 2007), (Lin et al., 2013), (Indraswari et al., 2015), (Mohamed Razali et al., 2014)) Cluster-based Fuzzy-C-means (Alsmadi (2015), Son and Tuan (2016)) Boundary-based Level set method ((Ehsani Rad et al., 2013), (Li et al., 2006), (Li et al., 2007), (An et al., 2012)) / Active contour ((Ali et al., 2015), (Niroshika et al., 2013), (Hasan et al., 2016)) / Edge detection ((Senthilkumaran, 2012b), (Lin et al., 2012), (Razali et al., 2015), (Senthilkumaran, 2012a), (Gráfová et al., 2013), (Trivedi et al., 2015)) / Point detection ((Economopoulos et al., 2008)) Watershed-based Watershed ((Li et al., 2012)) usually used to separate objects of interest from the background. This way, histograms can be used in situations, where objects and background have intensity levels grouped into two dominant modes. The present research identified that seven out of the relevant papers used histogram-based threshold as the main stage of segmentation (Abaza et al., 2009), (Ajaz and Kathirvelu, 2013) (Cameriere et al., 2015), (Jain and Chen, 2004), (Lin et al., 2014), (Dighe and Revati, 2012), (Huang and Hsu, 2008), (Lin et al., 2015), (Bruellmann et al., 2016), (Amer and Aqel, 2015), (Tikhe et al., 2016). Thresholding simply based on the histogram of the image usually fails when the image exhibits considerable variation in contrast and illumination, resulting in many pixels that can not be easily classified as first or second plane. One solution to this problem is to try to estimate a shading function, and then use it to compensate for the pattern of non-uniform intensities. The commonly used approach to compensate for irregularities, or when there is a lot of variation of the intensity of the pixels related to the dominant object (in which case the histogram-based thresholding has difficulties) is the use of variable threshold based on local statistics of the pixels of the image. The studies in (Said et al., 2006), (Geraets et al., 2007), (Lin et al., 2010), (Wang et al., 2016), (Nomir and Abdel-Mottaleb, 2008b), (Kaur and Kaur, 2016), (Nomir and Abdel-Mottaleb, 2008a), (Keshtkar and Gueaieb, 2007), (Lin et al., 2013), (Indraswari et al., 2015), (Mohamed Razali et al., 2014) applied local variable thresholding as 7
8 the main step for segmentation of the dental X-ray images. Cluster-based. Clustering is a method used to make automatic grouping of data according to a certain degree of similarity between the data. The criterion of similarity depends on the problem to be solved. In general, the number of groups to be detected must be informed as the initial parameter for the algorithm to perform data clustering. Among the relevant papers, Alsmadi (2015) used clustering to perform the segmentation of panoramic X-ray images, while Son and Tuan (2016) proposed a clustering-based method to segment X-rays of bitewing and periapical types. Boundary-based. Boundary-based methods are used to search for discontinuities (point and edge detection) in the gray levels of the image. Thirty-four percent (34%) of the relevant papers used boundary-based segmentation methods. The classical boundary-based approach performs the search for points and edges in images by detecting discontinuity in color or pixel intensities in images. Among the works that used boundary-based methods, (Senthilkumaran, 2012b), (Lin et al., 2012), (Razali et al., 2015), (Senthilkumaran, 2012a), (Gráfová et al., 2013), (Trivedi et al., 2015) and (Economopoulos et al., 2008) used the classical approach for point and edge detection to segment the images. A more recent approach on boundary-based segmentation is known as active contour model (Ali et al., 2015), (Niroshika et al., 2013), (Hasan et al., 2016), also called snakes, which performs segmentation by delineating an object outline from an image. The goal is to minimize the initialization of energy functions, and the stop criterion is when the minimum energy is detected. The region that represents the minimum energy value corresponds to the contour that best approaches the perimeter of an object. Another recent boundary-based detection approach is a variation of the active contour model known as level set method (LSM). The LSM performs segmentation by means of geometric operations to detect contours with topology changes. The studies found in (Ehsani Rad et al., 2013), (Li et al., 2006), (Li et al., 2007), (An et al., 2012) used LSM to segment the X-ray images. Watershed-based. Watershed is a transformation defined in a grayscale image. The watershed transformation uses mathematical morphology to segment an image in adjacent regions. Among the relevant articles selected, only (Li et al., 2012) used the watershed-based segmentation to segment bitewing X-ray images Type of the X-ray images Approximately eighty percent (80%) of the reviewed papers used intra-oral X-ray images. Only three of the reviewed papers used extra-oral panoramic X-ray images. The studies addressed in (Geraets et al., 2007), (Son and Tuan, 2016) and (Trivedi et al., 2015) perform experiments with intra-oral and extraoral images. Table 4 summarizes the relevant papers grouped by the type of X-ray image. 8
9 X-ray Table 4: Works grouped by X-ray images. Related works Bitewing (Jain and Chen, 2004), (Ehsani Rad et al., 2013), (Senthilkumaran, 2012b), (Nomir and Abdel- Mottaleb, 2008a), (Lin et al., 2010), (Lin et al., 2012), (Wang et al., 2016), (Keshtkar and Gueaieb, 2007), (Nomir and Abdel-Mottaleb, 2008b), (Modi and Desai, 2011), (Ali et al., 2015), (Li et al., 2012), (Kaur and Kaur, 2016) Periapical Panoramic Cameriere et al. (2015), (Lin et al., 2014), (Li et al., 2006), (Dighe and Revati, 2012), (Li et al., 2007), (Huang and Hsu, 2008), (Lin et al., 2015), (Bruellmann et al., 2016), (Lin et al., 2013), (Niroshika et al., 2013), (Tikhe et al., 2016), (Senthilkumaran, 2012a), (An et al., 2012), (Economopoulos et al., 2008) (Alsmadi, 2015), (Amer and Aqel, 2015), (Lurie et al., 2012), (Ajaz and Kathirvelu, 2013), (Indraswari et al., 2015), (Mohamed Razali et al., 2014), (Razali et al., 2015), (Hasan et al., 2016), (Gráfová et al., 2013) Bitewing / Periapical (Said et al., 2006), (Abaza et al., 2009) Bitewing / Panoramic (Son and Tuan, 2016) Periapical / Panoramic (Geraets et al., 2007) Bitewing / Periapical / Panoramic (Trivedi et al., 2015) 3.3. Characteristics of the data sets used in the reviewed works Sixty-one percent (61%) of the relevant papers used data sets containing between 1 and 100 X-ray images ((Lin et al., 2012), (Li et al., 2007), (Son and Tuan, 2016), (Alsmadi, 2015), (Lin et al., 2015), (Lin et al., 2010), (Cameriere et al., 2015), (Jain and Chen, 2004), (Dighe and Revati, 2012), (Lin et al., 2014), (Bruellmann et al., 2016), (Economopoulos et al., 2008), (Gráfová et al., 2013), (Kaur and Kaur, 2016), (An et al., 2012), (Ehsani Rad et al., 2013), (Tikhe et al., 2016), (Lin et al., 2013), (Ajaz and Kathirvelu, 2013), (Mohamed Razali et al., 2014), (Indraswari et al., 2015), (Modi and Desai, 2011), (Amer and Aqel, 2015), (Li et al., 2012), (Senthilkumaran, 2012a)). Eight of the reviewed articles did not present information about the data set used ((Li et al., 2006), (Senthilkumaran, 2012b), (Trivedi et al., 2015), (Niroshika et al., 2013), (Ali et al., 2015), (Razali et al., 2015), (Keshtkar and Gueaieb, 2007), (Geraets et al., 2007)). Four of the papers reviewed used between 101 and 200 images ((Wang et al., 2016), (Nomir and Abdel-Mottaleb, 2008b), (Lurie et al., 2012), (Nomir and Abdel-Mottaleb, 2008a)). Three used between 201 and 500 images ((Huang and Hsu, 2008), (Abaza et al., 2009), (Hasan et al., 2016)). Only one among the papers reviewed used more than 500 images in their experiments (Said et al., 9
 rather than extraoral radiographs (which present the entire")
10 Figure 1: Number of works by number of images 2006). In general, the reviewed articles exploited data sets containing X-ray images with small variations (i.e., varying only with respect to the number of teeth). In addition, as shown in the previous section, there is a predominance of intra-oral radiographs (which show only a part of the teeth) rather than extraoral radiographs (which present the entire dental structure in a single image). Figure 1 depicts the number of works versus number of images used in each group of work. 4. Evaluation of the segmentation methods In our work, to evaluate the segmentation methods studied, we created a methodology that consists of six stages. In the first stage, we started with the acquisition of images through the orthopantomograph (device used for the generation of orthopantomography images), and the collected images were classified into 10 categories according to the variety of structural characteristics of the teeth. The second stage consists of annotating the images (obtaining the binary images), which correspond to the demarcations of the objects of interest in each analyzed image. After finishing the tooth annotation process, in the third stage, the buccal region is annotated, as the region of interest (ROI) to determine the actual image of the teeth. In the fourth stage, the statistics of the gathered data set are calculated. The fifth and sixth consist in analyzing the performance of the segmentation algorithms, using the metrics summarized in Table 7, and in evaluating the results achieved by each segmentation method studied Construction of the data set The images used in our data set were acquired from the X-ray camera model: ORTHOPHOS XG 5 / XG 5 DS / Ceph, manufactured by Sirona Dental Sys- 10
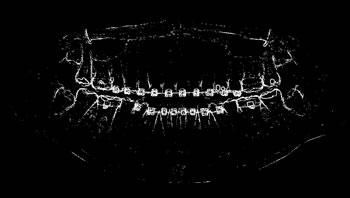
11 tems GmbH. X-rays were acquired at the Diagnostic Imaging Center of the Southwest State University of Bahia (UESB). The radiographic images used for this research were coded in order to identify the patient in the study 5. The gathered data set consists of 1,500 annotated panoramic X-ray images. The images have significant structural variations in relation to: the teeth, the number of teeth, existence of restorations, existence of implants, existence of appliances, existence of supernumerary teeth (referring to patients with more than 32 teeth), and the size of the mouth and jaws. All images originally obtained by the ORTHOPHOS XG 5 / XG 5 DS / Ceph ortopantomograph had dimensions pixels. The images were captured in gray level. The work with panoramic X-ray images is more challenging, due to heterogeneity reasons, among which the following stands out: 1) Different levels of noise generated by the ortopantomograph; 2) Image of the vertebral column, which covers the front teeth in some cases; 3) Low contrast, making morphological properties complex. To thoroughly benchmark the methods studied here, the 1,500 images were distributed among 10 categories. The images were named, using whole numbers, in sequential order by category, aiming at not identifying the patients in the study. The process of categorizing the images was performed manually, selecting images individually, counting tooth by tooth, as well as verifying structural characteristics of the teeth. The images were classified according to the variety of structural characteristics of the teeth (see Table 5). Finally, the images were cut out to disregard non-relevant information (white border around the images and part of the spine) generated by the orthopantomograph device. After the clipping process, there was a change in the size of the images to pixels, but without affecting the objects of interest (teeth), as shown in Figure 2. The cropped images were saved on the new dimension to be used in the following stages, which will be presented in the next sections. Figure 3 shows an X-ray image corresponding to each of the categories of our data set. Image annotation. The process of annotating the images of our proposed data set occurred in two parts. First, it was initiated by the upper jaw through the annotation of the third right upper molar and making the annotation of all the teeth of the upper arch to the third left upper molar. Then, the same process was performed on the lower jaw with all the teeth, and in the same direction as the upper jaw, from left to right, starting with the annotation of the third right lower molar, and annotating all teeth from the lower arch to the lower third molar. Figure 4 illustrates the tooth annotation process through a panoramic X-ray image of the data set. Determining ROI. For each image, after the annotation of the teeth, the buccal region was also annotated, covering the whole region delineated by the 5 The use of the radiographs in the research was authorized by the National Commission for Research Ethics (CONEP) and by the Research Ethics Committee (CEP), under the report number 646,050, approved on 05/13/
.")
12 Figure 2: Example of the clipping and resizing of the data set images of the present work. contour of the jaws. This process was carried out in view of preserving the area containing all the teeth (objects of interest). Finally, the region of interest (ROI) was determined by multiplying the values of the pixel array elements, representing the original panoramic X-ray image, by its corresponding binary matrix, resulting from the process of oral annotation. Figure 5 illustrates the whole process to determine the ROI of the images. Data set statistics. Table 5 presents the statistics of our data set: The categorization of the images, the total number of images used, the total of images by category and the average of teeth of the images by category. Statistics of the image ROIs. For all statistics, only the pixels in the image ROIs were considered. The results of the statistical operations were used as a parameter to perform the segmentation algorithms studied. The statistics raised over the image ROIs were as follows: The image statistics per category were organized in a single table to better analyze the results found among the categories, as shown in Table 6. From the analysis of that table, it was possible to compare the characteristics of each data set category. For instance, category 5 is formed by images with dental implants, which correspond to regions of high luminosity in the images, resulting in pixels with greater intensity than those found in the images of the other categories Performance analysis of the segmentation methods The following metrics were used to evaluate the segmentation methods studied: Accuracy, specificity, precision, recall (sensitivity) and F-score, which are 12
 Category 9; (j) Category 10. commonly used in the field of computer vision for performance analysis of segmentation. Table 7 presents a summary of these metrics. 4.2.1. Methodology of the performance analysis Only the image ROIs were considered to calculate the metrics for the evaluation of the segmentation methods.")
13 Figure 3: Examples of images from the data set categories of present work: (a) Category 1; (b) Category 2; (c) Category 3; (d) Category 4; (e) Category 5; (f) Category 6; (g) Category 7; (h) Category 8; (i) Category 9; (j) Category 10. commonly used in the field of computer vision for performance analysis of segmentation. Table 7 presents a summary of these metrics Methodology of the performance analysis Only the image ROIs were considered to calculate the metrics for the evaluation of the segmentation methods. The process presented in Figure 6 was carried 13


14 Figure 4: Annotation of the teeth. Figure 5: Determining the ROI of the images. 14
15 Table 5: Categorization of data set images and average number of teeth per category. Number Category Images Average teeth 1 Images with all the teeth, containing teeth with restoration and with dental appliance 2 Images with all the teeth, containing teeth with restoration and without dental appliance 3 Images with all the teeth, containing teeth without restoration and with dental appliance 4 Images with all the teeth, containing teeth without restoration and without dental appliance 5 Images containing dental implant Images containing more than 32 teeth Images missing teeth, containing teeth with restoration and dental appliance 8 Images missing teeth, containing teeth with restoration and without dental appliance 9 Images missing teeth, containing teeth without restoration and with dental appliance 10 Images missing teeth, containing teeth without restoration and without dental appliance Table 6: Image statistics by category. Category Highest value Lowest value Mean Entropy Category Category Category Category Category Category Category Category Category Category out on all the segmented images obtained by each one of the 10 segmentation methods analyzed. Figure 7 illustrates the steps of the performance evaluation over 10 segmentation methods (see also Table 9 for a list of the evaluated methods) Computing the metrics over the data set Table 8 summarizes the process to calculate the accuracy for all images in each category, using only one segmentation method. Parameters of each method were optimized for best performance. On each category, the average accuracy was computed. After that, to find the accuracy for all images in the data set, the average accuracy was multiplied by the number of images in each category, obtaining a weighted sum for all images in the data set (1, 500 images). By dividing by the number of images in the whole data set, we were able to find the 15
16 Table 7: Metrics used to evaluate the segmentation methods studied. Positive (P) Negative (N) True Positive (TP) True Negative (TN) False Positive (FP) False Negative (FN) Accuracy Specificity Precision Sensitivity/Recall F-score Initial measures Pixel is in a class of interest Pixel is not in a class of interest The pixel in the ground truth is positive, while method ranks the pixel as positive The pixel in; 3) the ground truth is negative, while method ranks the pixel as negative The pixel in the ground truth is negative, while method ranks the pixel as positive The pixel in the ground truth is positive, while method ranks the pixel as negative Metrics used for performance evaluation Relation between total of hits on the total set of errors and hits. This value is calculated by: (TP + TN)/(TP + FN + FP + TN) Percentage of negative samples correctly identified on total negative samples. This value is calculated by: TN/(FP + TN) Percentage of positive samples correctly classified on the total of samples classified as positive. This value is calculated by: TP/(TP + FP) Percentage of positive samples correctly classified on the total of positive samples. This value is calculated by: TP/(TP + FN) Represents the harmonic average between precision and sensitivity. It is calculated by: 2*Recall*Precision/(Recall + Precision) Table 8: Average accuracy per category. Category (Images) Accuracy Category 1 (73) x 73 = Category 2 (220) x 220 = Category 3 (45) x 45 = Category 4 (140) x 140 = Category 5 (120) x 120 = Category 6 (170) x 170 = Category 7 (115) x 115 = Category 8 (457) x 457 = Category 9 (45) x 45 = Category 10 (115) x 115 = SUM Overall accuracy Overall accuracy = SUM/1,500 average accuracy of the data set for one segmentation method. The same process was performed to calculate all other metrics (specificity, recall, precision and f- score), over each segmentation method. The segmentation methods evaluated in this work are summarized in Table 9. Next, each one of the methods are discussed and evaluated. 16
 Region growing; 2) Region splitting and merging Thresholding-based 3) Basic global thresholding; 4) Niblack Clustering-based 5) Fuzzy C-means clustering")
17 Figure 6: Obtaining the values of the metrics used over each image of the data set. Table 9: Segmentation methods evaluated in the present study. Category Segmentation methods Region-based 1) Region growing; 2) Region splitting and merging Thresholding-based 3) Basic global thresholding; 4) Niblack Clustering-based 5) Fuzzy C-means clustering Boundary-based 6) Sobel; 7) Canny; 8)Active contour without edges; 9) Level-set Watershed 10) Marker-controlled watershed 1) Region growing. Region growing is a method that groups pixels based on a predefined criterion to create larger regions. A standard approach for the region growing method is to perform calculations that generate sets of pixel values, whose properties group them close to the center (centroids) of the values we are looking for, so these values are used as seeds. Region growing needs two parameters to perform the segmentation operations, as follows: Seeds - Initial points to start the growth of regions. In the present work, the cells containing the X and Y coordinates of the centroids (center of the objects of interest) of the tooth regions (objects of interest in the images) were selected manually to serve as seeds. The seed values were grouped into vectors for each corresponding image, which served as the initial points for the execution of the region growing method; Dist - Threshold that will work as a basis to indicate the similarity between the pixels that will be part of the region or not. The parameter dist 17

18 Figure 7: Steps of the performance analysis of segmentation algorithms. also corresponds to the conditional stop value of the algorithm. Thus, it is used to verify when the difference of the mean intensity between the pixels of a region and a new pixel becomes larger than the informed parameter, and therefore there are no more pixels to be inserted in the regions. The parameter dist also corresponds to the conditional stop value of the algorithm. The best value found for the dist parameter was ) Region splitting and merging. Segmentation based on division and union of regions is generally performed in four basic steps: 1) The image as a whole is considered as the area of initial interest; 2) The area of interest is examined to decide which of the pixels satisfy some criteria of similarity; 3) if true, the area of interest becomes part of a region in the image, receiving a label; 4) otherwise, the area of interest is divided and each one is successively considered as area of interest. After each division, a joining process is used to compare adjacent regions, putting them together if necessary. This process continues until no further division or no further union of regions are possible. The most granular level of division that can occur is when there are areas that contain only one pixel. Using this approach, all the regions that satisfy the similarity criterion are filled with 1 s. Likewise, the regions that do not satisfy the similarity criterion are filled with 0 s, thus creating a segmented image. The method needs two 18
19 parameters: qtdecomp - Minimum block size for decomposition (this parameter must be a positive integer), and set to 1 in our evaluation; splitmerge - Similarity criterion used to indicate whether the region (block) should be divided or not. In the present work, we compared the standard deviation of the intensity of the pixels in the analyzed region. If the standard deviation is greater than the lowest intensity value of the pixels, then the region is divided. 3) Basic global thresholding. This method performs segmentation based on the histogram of the image. Assuming that f(x, y) corresponds to the histogram of an image, then to separate objects of interest from the background, an initial threshold (T ) is chosen. Then any pixel of the image, represented by (x, y), that is greater than T is marked as an object of interest, otherwise the pixel is marked as the background. In our work, we used the following steps: 1. Estimate an initial value for the global limit, T (we used the average pixel intensity of the ROI of each image analyzed); 2. Segment the image through the threshold (T ). Then, two groups of pixels appear: G 1, referring to pixels with values greater than T and G 2, referring to pixels with values less than or equal to T ; 3. Calculate the mean intensity values, m 1 and m 2, of the pixels in G 1 and G 2, respectively; 4. Calculate (m 1 + m 2 )/2 to obtain a new threshold (T ) value; 5. Repeat steps 2 to 4 until the value of T, is less than a positive value predefined by a parameter T. The larger the T, the less interactions the method will perform. For the experiments, 0.5 was the best value found for T, in our work; 6. Finally, converting the grayscale image into a binary image using the T / den threshold, where T is the threshold obtained in the previous steps and den denote an integer value, which scales the maximum value of the ratio of T / den to 1. The output image is binarized by replacing all pixels of the input image that are of intensity greater than the threshold T / den by the value 1 and all other pixels by the value 0. 4) Niblack method. Based on two measures of local statistics: mean and standard deviation within a neighborhood block of size n n, a threshold T (x, y) for each pixel is calculated. Then, as the neighborhood block moves, it involves different neighborhoods, obtaining new thresholds, T, at each location (x, y). Local standard deviation and mean are useful to determine local thresholds, because they are descriptors of contrast and luminosity. When the contrast or luminosity are found with great intensity in the images, they hinder the segmentation process in methods that use a single global threshold, such as the basic global thresholding. Adaptations of segmentation using local variable 19
20 thresholding have been proposed in the literature. However, the method originally proposed in (Niblack, 1985) was evaluated here. The local threshold is calculated with a block of size n n, according to T (x, y) = m(x, y) + k σ(x, y), (1) where m(x,y) and σ(x,y) represent the mean and local standard deviation of the local block of size n n, respectively. k is an imbalance constant (also called bias) that modifies the local value obtained by the local standard deviation. k equal to 1 was adopted to avoid modifying the standard deviation locally calculated. For each pixel, the following process for all the images was performed: 1. Calculate mean and standard deviation within the local block (x, y); 2. Calculate the threshold T (x, y); 3. If the value of the pixel is greater than T (x, y), one is assigned. 5) Fuzzy C-means clustering. Fuzzy C-Means starts from a set X k = {X 1, X 2, X 3,..., X n } R p, where X k is a characteristic vector for all k {1, 2,..., n}, and R p is the p-dimensional space (Bezdek, 1981). A fuzzy pseudopartition, denoted by P = {U 1, U 2,..., U c }, must satisfy the following c U 1 (X k ) = 1, (2) i=1 for every k {1, 2,..., n}, and n denotes the number of elements of the set X. The sum of the membership degrees of an element in all families must be equal to one. And, 0 < n U i (X k ) < n, (3) k=1 for every i {1, 2,..., c} and c represents the number of classes. Therefore, the sum of the membership degrees of all the elements of a family must be less than the number of elements in the set X. U i is the degree of relevance for X k in a cluster. The way to determine if the algorithm based on the Fuzzy C-means method finds an optimal fuzzy partition is defined by the objective function: J m = n t=1 c=1 k Uci m X mn V mc 2, (4) where V mc = (V 11,..., V mc ) is the matrix containing the centers of the clusters, M is the fuzzy coefficient responsible for the degree of fuzing of the elements X mn and V mc. The objective function is used to obtain the clusters by calculating the Euclidean distance between the image data and the cluster centers. The center V mc of each cluster c(c = 1,..., k) for an interaction t is given by n V mc (t) i=1 = (t) (U ci )M X mn n (t) i=1 (U ci 20 )M. (5)
21 To perform the segmentation using the Fuzzy C-means method, the following parameters were used: Fuzzy coefficient M equal to 2, responsible for the degree of fuzzification; Stop criterion using a number of iterations (100), or if the method reaches the minimum error rate ( ). The formation of clusters continues until the maximum number of iterations is completed, or when the minimum error rate is reached. 6) Sobel. Sobel works as an operator that calculates finite differences to identify the edges of the image. To perform the segmentation using the Sobel edge detector, we used an automatically threshold T, calculated from the image pixels. 7) Canny. In Canny (Canny, 1986) detector, the edges are identified by observing the maximum location of the gradient of f(x, y). Canny performs the following steps: 1. Smooth the Gaussian filter image first; 2. The local gradient, [gx 2 + gy] 2 1/2, and the edge direction, tan 1 (g x /g y ), are computed at each point; 3. The edges are identified in step (2). Known the directions of the edge, a non-maximum suppression is performed; this is done by tracing the border and suppressing pixel values (setting them to zero) that are not considered edge pixels. Two thresholds, T1 and T2, with T1 T2 (automatically calculated based on each image); 4. Finally, the edges detection of the image is performed considering the pixels that have values greater than T2. 8) Active contour without edges. This method is a variation of the model originally proposed by Chan and Vese (Chan and Vese, 2001), and works differently from the classical edge detection methods. This is able to detect objects whose boundaries are not defined by the gradient. To perform the segmentation using the active contour without edges method, the following parameters were used: Initial mask (a matrix of 0 s and 1 s), where the mask corresponds to 75% of the image to be segmented); Total number of iterations (500, in our case); A stopping term equal to 0.1, in our work. 21
22 9) Level set method. This method is a variation of the active contour method. Level set method (LSM) was originally proposed by Osher (1988). LSM can perform numeric calculations of curves and surfaces without requiring predefined criteria. The objective of LSM is to represent the limit of an object using a level adjustment function, usually represented mathematically by the variable α. The curves of the objects are obtained by calculating the value of γ through the set of levels of α, given by: γ = {(x, y) α(x, y) = 0}, (6) and the α function has positive values within the region delimited by the γ curve and negative values outside the curve. 10) Marker-controlled watershed. The goal of the watershed segmentation method is to separate two adjacent regions, which present abrupt changing in the gradient values. Assuming that gradient values form a topographic surface with valleys and mountains, brighter pixels (e.g. teeth in X-ray images) correspond to those with the highest gradient, while the darker ones (e.g. valleys between teeth in X-ray images) would correspond to those with the lowest gradient. A variation of the watershed method is the marker-controlled watershed that prevents the occurrence of the phenomenon known as super-segmentation (excess of pixels that can not be attached to any other part of the image) using morphological operations of opening and closing to make adjustments to the gray levels of the image and avoid over-segmentation. To segment the images in our data set by using the marker-controlled watershed method, the following steps are performed: 1. Compute a segmentation function, which tries to identify dark regions; 2. Compute markers of the target object; 3. Compute markers of the segments out of the target objects; 4. Calculate the transformation of the segmentation function to obtain the position of the target objects and the positions of the background markers Result analysis Tables 10 and 11 present samples of the results obtained by each of the segmentation methods evaluated, in each category. Table 12 summarizes the overall averages obtained by calculating the metrics, which were applied to evaluate the performance of each segmentation method. From Table 12, we can observe that the splitting and merging-based and the sobel methods achieved almost perfect results in the specificity (which corresponds to the true negatives). This could be explained due to the characteristics of the two methods to focus on the edges. Similarly, the fuzzy C-means and canny methods also had over 90% with respect to specificity. In contrast, these four segmentation methods obtained poor results in relation to the recall metric (which privileges the true positives in the evaluation). Thus, the images, segmented by algorithms based on splitting and 22


23 Table 10: Samples of the results of the segmentation methods evaluated (PART 1). Method Category 1 Category 2 Category 3 Category 4 Category 5 Region growing Splitting and merging Basic global threshold Niblack method Fuzzy c-means Canny Sobel Active contour without edges Level set method Watershed 23


24 Table 11: Samples of the results of the segmentation methods evaluated (PART 2). Method Category 6 Category 7 Category 8 Category 9 Category 10 Region growing Splitting and merging Basic global threshold Niblack method Fuzzy c-means Canny Sobel Active contour without edges Level set method Watershed 24
25 merging, fuzzy C-means, canny and sobel, showed a predominance of true negatives in their results. However, when segmentation results in a predominance of elements of a class (for example, true negatives), it indicates that for a binary classification problem, the result of the segmentation algorithm is equivalent to the random suggestion of a class. Therefore, algorithms based on splitting and merging, fuzzy C-means, canny and sobel presented poor results when applied to the data set images used in the present work. Table 12: Overall average results. Method Accuracy Specificity Precision Recall F-score Region growing Splitting/merging Global thresholding Niblack method Fuzzy C-means Canny Sobel Without edges Level set method Watershed The results presented in Table 12 also show that the niblack reached the highest value of the recall metric (approximately 83%), indicating that the images segmented by niblack presented the highest number of true positives (pixels corresponding to the objects of interest in the analyzed images) and, therefore, few false negatives with respect to the other methods of segmentation evaluated. Niblack also obtained approximately 82% in relation to the specificity metric, which corresponds to the true negatives that were correctly identified. Besides niblack, only the marker-controlled watershed method reached above 80% of the recall metric. The marker-controlled watershed obtained lower results than the Nibliack method in all other analyzed metrics. The active contour without edges and the level set segmentation methods obtained less than 70% of the recall metric; these methods also achieved poorer results when compared to the Niblack and marker-controlled watershed methods. Considering the results, one can state that the segmentation process of panoramic X-ray images of the teeth based on thresholding, achieved a significant performance improvement when a local threshold (niblack method) was used, instead of using a single global threshold (basic global thresholding). Niblack was the one which presented superior performance to segment teeth. 5. Discussion and conclusions From the images obtained with the X-ray, the dentist can analyze the entire dental structure and construct (if necessary) the patient s treatment plan. However, due to the lack of adequate automated resources to aid the analysis 25
Segmentation of Periapical Dental X-Ray Images by applying Morphological Operations
 Segmentation of Periapical Dental X-Ray Images by applying Morphological Operations [1] Anuj kumar, [2] H.S.Bhadauria, [3] Nitin Kumar [1] Research scholar, [2][3] Assistant Professor, [1][2][3] Department
Preprocessing, Segmentation and Matching of Dental Radiographs used in Dental Biometrics
 ISSN No. 2278-3083 Volume 1, No.2, May June 2012 International Journal of Science and Applied Information Technology Available Online at www.warse.org/ijsait/info.html Shubhangi C. Dighe et al., International
A Comparative Analysis on the Dental X-ray Image Segmentation Approaches
 A Comparative Analysis on the Dental X-ray Image Segmentation Approaches Ritu Bala 1, Divjot Kaur 2 1, 2 Department of Computer Science and Engineering, Rayat Institute of Engineering & Information Technology,
Segmentation of Tumor Region from Brain Mri Images Using Fuzzy C-Means Clustering And Seeded Region Growing
 IOSR Journal of Computer Engineering (IOSR-JCE) e-issn: 2278-0661,p-ISSN: 2278-8727, Volume 18, Issue 5, Ver. I (Sept - Oct. 2016), PP 20-24 www.iosrjournals.org Segmentation of Tumor Region from Brain
EARLY STAGE DIAGNOSIS OF LUNG CANCER USING CT-SCAN IMAGES BASED ON CELLULAR LEARNING AUTOMATE
 EARLY STAGE DIAGNOSIS OF LUNG CANCER USING CT-SCAN IMAGES BASED ON CELLULAR LEARNING AUTOMATE SAKTHI NEELA.P.K Department of M.E (Medical electronics) Sengunthar College of engineering Namakkal, Tamilnadu,
Cancer Cells Detection using OTSU Threshold Algorithm
 Cancer Cells Detection using OTSU Threshold Algorithm Nalluri Sunny 1 Velagapudi Ramakrishna Siddhartha Engineering College Mithinti Srikanth 2 Velagapudi Ramakrishna Siddhartha Engineering College Kodali
IJREAS Volume 2, Issue 2 (February 2012) ISSN: LUNG CANCER DETECTION USING DIGITAL IMAGE PROCESSING ABSTRACT
 ISSN: LUNG CANCER DETECTION USING DIGITAL IMAGE PROCESSING ABSTRACT") LUNG CANCER DETECTION USING DIGITAL IMAGE PROCESSING Anita Chaudhary* Sonit Sukhraj Singh* ABSTRACT In recent years the image processing mechanisms are used widely in several medical areas for improving
LUNG CANCER DETECTION USING DIGITAL IMAGE PROCESSING Anita Chaudhary* Sonit Sukhraj Singh* ABSTRACT In recent years the image processing mechanisms are used widely in several medical areas for improving
Enhanced Detection of Lung Cancer using Hybrid Method of Image Segmentation
 Enhanced Detection of Lung Cancer using Hybrid Method of Image Segmentation L Uma Maheshwari Department of ECE, Stanley College of Engineering and Technology for Women, Hyderabad - 500001, India. Udayini
AUTOMATIC TOOTH SEGMENTATION USING ACTIVE CONTOUR WITHOUT EDGES. Samir Shah, Ayman Abaza, Arun Ross and Hany Ammar
 AUTOMATIC TOOTH SEGMENTATION USING ACTIVE CONTOUR WITHOUT EDGES Samir Shah, Ayman Abaza, Arun Ross and Hany Ammar West Virginia University, Morgantown, WV 26506 USA {sshah, ayabaza, ross, ammar}@csee.wvu.edu
Automatic Segmentation of Digital Orthopantomograms for Forensic Human Identification
 Automatic Segmentation of Digital Orthopantomograms for Forensic Human Identification Dariusz Frejlichowski and Robert Wanat West Pomeranian University of Technology, Szczecin, Faculty of Computer Science
Brain Tumor segmentation and classification using Fcm and support vector machine
 Brain Tumor segmentation and classification using Fcm and support vector machine Gaurav Gupta 1, Vinay singh 2 1 PG student,m.tech Electronics and Communication,Department of Electronics, Galgotia College
EXTRACT THE BREAST CANCER IN MAMMOGRAM IMAGES
 International Journal of Civil Engineering and Technology (IJCIET) Volume 10, Issue 02, February 2019, pp. 96-105, Article ID: IJCIET_10_02_012 Available online at http://www.iaeme.com/ijciet/issues.asp?jtype=ijciet&vtype=10&itype=02
Automated Brain Tumor Segmentation Using Region Growing Algorithm by Extracting Feature
 Automated Brain Tumor Segmentation Using Region Growing Algorithm by Extracting Feature Shraddha P. Dhumal 1, Ashwini S Gaikwad 2 1 Shraddha P. Dhumal 2 Ashwini S. Gaikwad ABSTRACT In this paper, we propose
arxiv: v2 [cs.cv] 8 Mar 2018
![arxiv: v2 [cs.cv] 8 Mar 2018](/thumbs/87/97094636.jpg "arxiv: v2 [cs.cv] 8 Mar 2018") Automated soft tissue lesion detection and segmentation in digital mammography using a u-net deep learning network Timothy de Moor a, Alejandro Rodriguez-Ruiz a, Albert Gubern Mérida a, Ritse Mann a, and
Automated soft tissue lesion detection and segmentation in digital mammography using a u-net deep learning network Timothy de Moor a, Alejandro Rodriguez-Ruiz a, Albert Gubern Mérida a, Ritse Mann a, and
Dental X-Ray Based Human Identification System for Forensic
 Engineering and Technology Journal Vol. 35, Part A, No. 1, 2017 S. Dh. Khudhur Computer Engineering Department University of Technology Baghdad, Iraq saja_alzubaidy@yahoo.com M.S. Croock Computer Engineering
Early Detection of Lung Cancer
 Early Detection of Lung Cancer Aswathy N Iyer Dept Of Electronics And Communication Engineering Lymie Jose Dept Of Electronics And Communication Engineering Anumol Thomas Dept Of Electronics And Communication
MRI Image Processing Operations for Brain Tumor Detection
 MRI Image Processing Operations for Brain Tumor Detection Prof. M.M. Bulhe 1, Shubhashini Pathak 2, Karan Parekh 3, Abhishek Jha 4 1Assistant Professor, Dept. of Electronics and Telecommunications Engineering,
Automated Detection Of Glaucoma & D.R From Eye Fundus Images
 Reviewed Paper Volume 2 Issue 12 August 2015 International Journal of Informative & Futuristic Research ISSN (Online): 2347-1697 Automated Detection Of Glaucoma & D.R Paper ID IJIFR/ V2/ E12/ 016 Page
Detection of Lung Cancer Using Marker-Controlled Watershed Transform
 2015 International Conference on Pervasive Computing (ICPC) Detection of Lung Cancer Using Marker-Controlled Watershed Transform Sayali Satish Kanitkar M.E. (Signal Processing), Sinhgad College of engineering,
Unsupervised MRI Brain Tumor Detection Techniques with Morphological Operations
 Unsupervised MRI Brain Tumor Detection Techniques with Morphological Operations Ritu Verma, Sujeet Tiwari, Naazish Rahim Abstract Tumor is a deformity in human body cells which, if not detected and treated,
AN ALGORITHM FOR EARLY BREAST CANCER DETECTION IN MAMMOGRAMS
 AN ALGORITHM FOR EARLY BREAST CANCER DETECTION IN MAMMOGRAMS Isaac N. Bankman', William A. Christens-Barryl, Irving N. Weinberg2, Dong W. Kim3, Ralph D. Semmell, and William R. Brody2 The Johns Hopkins
Edge Detection Techniques Using Fuzzy Logic
 Edge Detection Techniques Using Fuzzy Logic Essa Anas Digital Signal & Image Processing University Of Central Lancashire UCLAN Lancashire, UK eanas@uclan.a.uk Abstract This article reviews and discusses
Intelligent Edge Detector Based on Multiple Edge Maps. M. Qasim, W.L. Woon, Z. Aung. Technical Report DNA # May 2012
 Intelligent Edge Detector Based on Multiple Edge Maps M. Qasim, W.L. Woon, Z. Aung Technical Report DNA #2012-10 May 2012 Data & Network Analytics Research Group (DNA) Computing and Information Science
Edge Detection Techniques Based On Soft Computing
 International Journal for Science and Emerging ISSN No. (Online):2250-3641 Technologies with Latest Trends 7(1): 21-25 (2013) ISSN No. (Print): 2277-8136 Edge Detection Techniques Based On Soft Computing
Automated Dental Identification with Lowest Cost Path- Based Teeth and Jaw Separation
 Automated Dental Identification with Lowest Cost Path- Based Teeth and Jaw Separation Jan-Vidar Ølberg, Morten Goodwin* University of Agder, Kristiansand, Norway *E-mail: morten.goodwin@uia.no, Abstract:
A Multi-Stage Approach for 3D Teeth Segmentation from Dentition Surfaces
 A Multi-Stage Approach for 3D Teeth Segmentation from Dentition Surfaces Marcin Grzegorzek 1, Marina Trierscheid 0,1,2, Dimitri Papoutsis 2, and Dietrich Paulus 1 1 Research Group for Active Vision, University
Automated Preliminary Brain Tumor Segmentation Using MRI Images
 www.ijcsi.org 102 Automated Preliminary Brain Tumor Segmentation Using MRI Images Shamla Mantri 1, Aditi Jahagirdar 2, Kuldeep Ghate 3, Aniket Jiddigouder 4, Neha Senjit 5 and Saurabh Sathaye 6 1 Computer
Dental Image Matching By Canny Algorithm for Human Identification
 International Journal of Advanced Computer Research (ISSN (Print): 22-7277 ISSN (Online): 2277-770) Volume- Number- Issue-17 December-201 Dental Image Matching By Canny Algorithm for Human Identification
MEM BASED BRAIN IMAGE SEGMENTATION AND CLASSIFICATION USING SVM
 MEM BASED BRAIN IMAGE SEGMENTATION AND CLASSIFICATION USING SVM T. Deepa 1, R. Muthalagu 1 and K. Chitra 2 1 Department of Electronics and Communication Engineering, Prathyusha Institute of Technology
CHAPTER 6 HUMAN BEHAVIOR UNDERSTANDING MODEL
 127 CHAPTER 6 HUMAN BEHAVIOR UNDERSTANDING MODEL 6.1 INTRODUCTION Analyzing the human behavior in video sequences is an active field of research for the past few years. The vital applications of this field
Automatic Classification of Breast Masses for Diagnosis of Breast Cancer in Digital Mammograms using Neural Network
 IJSTE - International Journal of Science Technology & Engineering Volume 1 Issue 11 May 2015 ISSN (online): 2349-784X Automatic Classification of Breast Masses for Diagnosis of Breast Cancer in Digital
Brain Tumor Segmentation: A Review Dharna*, Priyanshu Tripathi** *M.tech Scholar, HCE, Sonipat ** Assistant Professor, HCE, Sonipat
 International Journal of scientific research and management (IJSRM) Volume 4 Issue 09 Pages 4467-4471 2016 Website: www.ijsrm.in ISSN (e): 2321-3418 Brain Tumor Segmentation: A Review Dharna*, Priyanshu
Identification of Sickle Cells using Digital Image Processing. Academic Year Annexure I
 Academic Year 2014-15 Annexure I 1. Project Title: Identification of Sickle Cells using Digital Image Processing TABLE OF CONTENTS 1.1 Abstract 1-1 1.2 Motivation 1-1 1.3 Objective 2-2 2.1 Block Diagram
COMPUTER AIDED DIAGNOSTIC SYSTEM FOR BRAIN TUMOR DETECTION USING K-MEANS CLUSTERING
 COMPUTER AIDED DIAGNOSTIC SYSTEM FOR BRAIN TUMOR DETECTION USING K-MEANS CLUSTERING Urmila Ravindra Patil Tatyasaheb Kore Institute of Engineering and Technology, Warananagar Prof. R. T. Patil Tatyasaheb
Performance evaluation of the various edge detectors and filters for the noisy IR images
 Performance evaluation of the various edge detectors and filters for the noisy IR images * G.Padmavathi ** P.Subashini ***P.K.Lavanya Professor and Head, Lecturer (SG), Research Assistant, ganapathi.padmavathi@gmail.com
Detection and Classification of Lung Cancer Using Artificial Neural Network
 Detection and Classification of Lung Cancer Using Artificial Neural Network Almas Pathan 1, Bairu.K.saptalkar 2 1,2 Department of Electronics and Communication Engineering, SDMCET, Dharwad, India 1 almaseng@yahoo.co.in,
Keywords Fuzzy Logic, Fuzzy Rule, Fuzzy Membership Function, Fuzzy Inference System, Edge Detection, Regression Analysis.
 Volume 6, Issue 3, March 2016 ISSN: 2277 128X International Journal of Advanced Research in Computer Science and Software Engineering Research Paper Available online at: www.ijarcsse.com Modified Fuzzy
COMPARATIVE STUDY ON FEATURE EXTRACTION METHOD FOR BREAST CANCER CLASSIFICATION
 COMPARATIVE STUDY ON FEATURE EXTRACTION METHOD FOR BREAST CANCER CLASSIFICATION 1 R.NITHYA, 2 B.SANTHI 1 Asstt Prof., School of Computing, SASTRA University, Thanjavur, Tamilnadu, India-613402 2 Prof.,
Tumor cut segmentation for Blemish Cells Detection in Human Brain Based on Cellular Automata
 Tumor cut segmentation for Blemish Cells Detection in Human Brain Based on Cellular Automata D.Mohanapriya 1 Department of Electronics and Communication Engineering, EBET Group of Institutions, Kangayam,
International Journal of Computer Sciences and Engineering. Review Paper Volume-5, Issue-12 E-ISSN:
 International Journal of Computer Sciences and Engineering Open Access Review Paper Volume-5, Issue-12 E-ISSN: 2347-2693 Different Techniques for Skin Cancer Detection Using Dermoscopy Images S.S. Mane
NMF-Density: NMF-Based Breast Density Classifier
 NMF-Density: NMF-Based Breast Density Classifier Lahouari Ghouti and Abdullah H. Owaidh King Fahd University of Petroleum and Minerals - Department of Information and Computer Science. KFUPM Box 1128.
ANALYSIS AND DETECTION OF BRAIN TUMOUR USING IMAGE PROCESSING TECHNIQUES
 ANALYSIS AND DETECTION OF BRAIN TUMOUR USING IMAGE PROCESSING TECHNIQUES P.V.Rohini 1, Dr.M.Pushparani 2 1 M.Phil Scholar, Department of Computer Science, Mother Teresa women s university, (India) 2 Professor
COMPUTERIZED SYSTEM DESIGN FOR THE DETECTION AND DIAGNOSIS OF LUNG NODULES IN CT IMAGES 1
 ISSN 258-8739 3 st August 28, Volume 3, Issue 2, JSEIS, CAOMEI Copyright 26-28 COMPUTERIZED SYSTEM DESIGN FOR THE DETECTION AND DIAGNOSIS OF LUNG NODULES IN CT IMAGES ALI ABDRHMAN UKASHA, 2 EMHMED SAAID
Comparative Study of K-means, Gaussian Mixture Model, Fuzzy C-means algorithms for Brain Tumor Segmentation
 Comparative Study of K-means, Gaussian Mixture Model, Fuzzy C-means algorithms for Brain Tumor Segmentation U. Baid 1, S. Talbar 2 and S. Talbar 1 1 Department of E&TC Engineering, Shri Guru Gobind Singhji
Threshold Based Segmentation Technique for Mass Detection in Mammography
 Threshold Based Segmentation Technique for Mass Detection in Mammography Aziz Makandar *, Bhagirathi Halalli Department of Computer Science, Karnataka State Women s University, Vijayapura, Karnataka, India.
IJRE Vol. 03 No. 04 April 2016
 6 Implementation of Clustering Techniques For Brain Tumor Detection Shravan Rao 1, Meet Parikh 2, Mohit Parikh 3, Chinmay Nemade 4 Student, Final Year, Department Of Electronics & Telecommunication Engineering,
Image Processing and Data Mining Techniques in the Detection of Diabetic Retinopathy in Fundus Images
 I J C T A, 10(8), 2017, pp. 755-762 International Science Press ISSN: 0974-5572 Image Processing and Data Mining Techniques in the Detection of Diabetic Retinopathy in Fundus Images Payal M. Bante* and
International Journal for Science and Emerging
 International Journal for Science and Emerging ISSN No. (Online):2250-3641 Technologies with Latest Trends 8(1): 7-13 (2013) ISSN No. (Print): 2277-8136 Adaptive Neuro-Fuzzy Inference System (ANFIS) Based
Digital Imaging from a new perspective
 TREATMENT CENTRES HANDPIECES HYGIENE SYSTEMS X-RAY SYSTEMS CEREC TREATMENT CENTRES HANDPIECES HYGIENE SYSTEMS X-RAY SYSTEMS CEREC SIRONA CREATING AND MAINTAINING VALUE. You are right to expect a great
Lung Tumour Detection by Applying Watershed Method
 International Journal of Computational Intelligence Research ISSN 0973-1873 Volume 13, Number 5 (2017), pp. 955-964 Research India Publications http://www.ripublication.com Lung Tumour Detection by Applying
An efficient method for Segmentation and Detection of Brain Tumor in MRI images
 An efficient method for Segmentation and Detection of Brain Tumor in MRI images Shubhangi S. Veer (Handore) 1, Dr. P.M. Patil 2 1 Research Scholar, Ph.D student, JJTU, Rajasthan,India 2 Jt. Director, Trinity
1 Introduction. Abstract: Accurate optic disc (OD) segmentation and fovea. Keywords: optic disc segmentation, fovea detection.
 segmentation and fovea. Keywords: optic disc segmentation, fovea detection.") Current Directions in Biomedical Engineering 2017; 3(2): 533 537 Caterina Rust*, Stephanie Häger, Nadine Traulsen and Jan Modersitzki A robust algorithm for optic disc segmentation and fovea detection
Current Directions in Biomedical Engineering 2017; 3(2): 533 537 Caterina Rust*, Stephanie Häger, Nadine Traulsen and Jan Modersitzki A robust algorithm for optic disc segmentation and fovea detection
Automatic Hemorrhage Classification System Based On Svm Classifier
 Automatic Hemorrhage Classification System Based On Svm Classifier Abstract - Brain hemorrhage is a bleeding in or around the brain which are caused by head trauma, high blood pressure and intracranial
The Application of Image Processing Techniques for Detection and Classification of Cancerous Tissue in Digital Mammograms
 The Application of Image Processing Techniques for Detection and Classification of Cancerous Tissue in Digital Mammograms Angayarkanni.N 1, Kumar.D 2 and Arunachalam.G 3 1 Research Scholar Department of
CHAPTER 2 MAMMOGRAMS AND COMPUTER AIDED DETECTION
 9 CHAPTER 2 MAMMOGRAMS AND COMPUTER AIDED DETECTION 2.1 INTRODUCTION This chapter provides an introduction to mammogram and a description of the computer aided detection methods of mammography. This discussion
AUTOMATIC MEASUREMENT ON CT IMAGES FOR PATELLA DISLOCATION DIAGNOSIS
 AUTOMATIC MEASUREMENT ON CT IMAGES FOR PATELLA DISLOCATION DIAGNOSIS Qi Kong 1, Shaoshan Wang 2, Jiushan Yang 2,Ruiqi Zou 3, Yan Huang 1, Yilong Yin 1, Jingliang Peng 1 1 School of Computer Science and
Improved Intelligent Classification Technique Based On Support Vector Machines
 Improved Intelligent Classification Technique Based On Support Vector Machines V.Vani Asst.Professor,Department of Computer Science,JJ College of Arts and Science,Pudukkottai. Abstract:An abnormal growth
Available online at ScienceDirect. Procedia Computer Science 93 (2016 )
") Available online at www.sciencedirect.com ScienceDirect Procedia Computer Science 93 (2016 ) 431 438 6th International Conference On Advances In Computing & Communications, ICACC 2016, 6-8 September 2016,
Available online at www.sciencedirect.com ScienceDirect Procedia Computer Science 93 (2016 ) 431 438 6th International Conference On Advances In Computing & Communications, ICACC 2016, 6-8 September 2016,
International Journal of Computational Science, Mathematics and Engineering Volume2, Issue6, June 2015 ISSN(online): Copyright-IJCSME
: Copyright-IJCSME") Various Edge Detection Methods In Image Processing Using Matlab K. Narayana Reddy 1, G. Nagalakshmi 2 12 Department of Computer Science and Engineering 1 M.Tech Student, SISTK, Puttur 2 HOD of CSE Department,
Various Edge Detection Methods In Image Processing Using Matlab K. Narayana Reddy 1, G. Nagalakshmi 2 12 Department of Computer Science and Engineering 1 M.Tech Student, SISTK, Puttur 2 HOD of CSE Department,
Tooth/Teeth Segmentation and modeling from X-ray/CT images: A Survey
 I J C T A, 10(8), 2017, pp. 423-428 International Science Press ISSN: 0974-5572 Tooth/Teeth Segmentation and modeling from X-ray/CT images: A Survey Niharika Thakur 1, Mamta Juneja 2 and Prashant Jindal
VOTING BASED AUTOMATIC EXUDATE DETECTION IN COLOR FUNDUS PHOTOGRAPHS
 VOTING BASED AUTOMATIC EXUDATE DETECTION IN COLOR FUNDUS PHOTOGRAPHS Pavle Prentašić and Sven Lončarić Image Processing Group, Faculty of Electrical Engineering and Computing, University of Zagreb, Unska
TWO HANDED SIGN LANGUAGE RECOGNITION SYSTEM USING IMAGE PROCESSING
 134 TWO HANDED SIGN LANGUAGE RECOGNITION SYSTEM USING IMAGE PROCESSING H.F.S.M.Fonseka 1, J.T.Jonathan 2, P.Sabeshan 3 and M.B.Dissanayaka 4 1 Department of Electrical And Electronic Engineering, Faculty
Study And Development Of Digital Image Processing Tool For Application Of Diabetic Retinopathy
 Study And Development O Digital Image Processing Tool For Application O Diabetic Retinopathy Name: Ms. Jyoti Devidas Patil mail ID: jyot.physics@gmail.com Outline 1. Aims & Objective 2. Introduction 3.
BONE CANCER DETECTION USING ARTIFICIAL NEURAL NETWORK
 ISSN: 0976-2876 (Print) ISSN: 2250-0138(Online) BONE CANCER DETECTION USING ARTIFICIAL NEURAL NETWORK 1 Asuntha A, 2 Andy Srinivasan 1 Department of Electronics and Instrumentation Engg., SRM Institute
Unsupervised Caries Detection in Non-Standardized Bitewing Dental X-Rays
 UNIVERSITY OF KWAZULU-NATAL College of Agriculture, Engineering and Science Unsupervised Caries Detection in Non-Standardized Bitewing Dental X-Rays by Darren John Osterloh Supervisor: Prof. Serestina
International Journal of Advance Research in Engineering, Science & Technology
 Impact Factor (SJIF): 3.632 International Journal of Advance Research in Engineering, Science & Technology e-issn: 2393-9877, p-issn: 2394-2444 (Special Issue for ITECE 2016) An Efficient Image Processing
Extraction and Identification of Tumor Regions from MRI using Zernike Moments and SVM
 I J C T A, 8(5), 2015, pp. 2327-2334 International Science Press Extraction and Identification of Tumor Regions from MRI using Zernike Moments and SVM Sreeja Mole S.S.*, Sree sankar J.** and Ashwin V.H.***
Comparative Analysis of Canny and Prewitt Edge Detection Techniques used in Image Processing
 Comparative Analysis of Canny and Prewitt Edge Detection Techniques used in Image Processing Nisha 1, Rajesh Mehra 2, Lalita Sharma 3 PG Scholar, Dept. of ECE, NITTTR, Chandigarh, India 1 Associate Professor,
Particle Swarm Optimization based K-mediods Clustering on Dental X-ray Images
 Volume 8, No. 4, May 2017 (Special Issue) International Journal of Advanced Research in Computer Science REVIEW ARTICLE Available Online at www.ijarcs.info Particle Swarm Optimization based K-mediods Clustering
A Review on Brain Tumor Detection in Computer Visions
 International Journal of Information & Computation Technology. ISSN 0974-2239 Volume 4, Number 14 (2014), pp. 1459-1466 International Research Publications House http://www. irphouse.com A Review on Brain
Lung Region Segmentation using Artificial Neural Network Hopfield Model for Cancer Diagnosis in Thorax CT Images
 Automation, Control and Intelligent Systems 2015; 3(2): 19-25 Published online March 20, 2015 (http://www.sciencepublishinggroup.com/j/acis) doi: 10.11648/j.acis.20150302.12 ISSN: 2328-5583 (Print); ISSN:
DETECTING DIABETES MELLITUS GRADIENT VECTOR FLOW SNAKE SEGMENTED TECHNIQUE
 DETECTING DIABETES MELLITUS GRADIENT VECTOR FLOW SNAKE SEGMENTED TECHNIQUE Dr. S. K. Jayanthi 1, B.Shanmugapriyanga 2 1 Head and Associate Professor, Dept. of Computer Science, Vellalar College for Women,
Mammogram Analysis: Tumor Classification
 Mammogram Analysis: Tumor Classification Term Project Report Geethapriya Raghavan geeragh@mail.utexas.edu EE 381K - Multidimensional Digital Signal Processing Spring 2005 Abstract Breast cancer is the
Skin cancer reorganization and classification with deep neural network
 Skin cancer reorganization and classification with deep neural network Hao Chang 1 1. Department of Genetics, Yale University School of Medicine 2. Email: changhao86@gmail.com Abstract As one kind of skin
CHAPTER 5 DECISION TREE APPROACH FOR BONE AGE ASSESSMENT
 53 CHAPTER 5 DECISION TREE APPROACH FOR BONE AGE ASSESSMENT The decision tree approach for BAA makes use of the radius and ulna wrist bones to estimate the bone age. From the radius and ulna bones, 11
INTRODUCTION TO MACHINE LEARNING. Decision tree learning
 INTRODUCTION TO MACHINE LEARNING Decision tree learning Task of classification Automatically assign class to observations with features Observation: vector of features, with a class Automatically assign
2D-Sigmoid Enhancement Prior to Segment MRI Glioma Tumour
 2D-Sigmoid Enhancement Prior to Segment MRI Glioma Tumour Pre Image-Processing Setyawan Widyarto, Siti Rafidah Binti Kassim 2,2 Department of Computing, Faculty of Communication, Visual Art and Computing,
Grading of Vertebral Rotation
 Chapter 5 Grading of Vertebral Rotation The measurement of vertebral rotation has become increasingly prominent in the study of scoliosis. Apical vertebral deformity demonstrates significance in both preoperative
I. INTRODUCTION III. OVERALL DESIGN
 Inherent Selection Of Tuberculosis Using Graph Cut Segmentation V.N.Ilakkiya 1, Dr.P.Raviraj 2 1 PG Scholar, Department of computer science, Kalaignar Karunanidhi Institute of Technology, Coimbatore, Tamil
International Journal of Combined Research & Development (IJCRD) eissn: x;pissn: Volume: 5; Issue: 4; April -2016
 eissn: x;pissn: Volume: 5; Issue: 4; April -2016") Lung Cancer Detection on Chest Radiographs Using Image Processing Kavita 1, Dr.Channappa Bhyri 2, Dr.Kalpana Vanjerkhede 3 1 PG Student, Department of Electronics and Instrumentation Engineering, 2,3 Professor,
Lung Cancer Detection on Chest Radiographs Using Image Processing Kavita 1, Dr.Channappa Bhyri 2, Dr.Kalpana Vanjerkhede 3 1 PG Student, Department of Electronics and Instrumentation Engineering, 2,3 Professor,
Development of novel algorithm by combining Wavelet based Enhanced Canny edge Detection and Adaptive Filtering Method for Human Emotion Recognition
 International Journal of Engineering Research and Development e-issn: 2278-067X, p-issn: 2278-800X, www.ijerd.com Volume 12, Issue 9 (September 2016), PP.67-72 Development of novel algorithm by combining
Conclusions and future directions
 Chapter 9 Conclusions and future directions This chapter summarises the findings within this thesis, examines its main contributions, and provides suggestions for further directions. 9.1 Thesis summary
Implementation of Automatic Retina Exudates Segmentation Algorithm for Early Detection with Low Computational Time
 www.ijecs.in International Journal Of Engineering And Computer Science ISSN: 2319-7242 Volume 5 Issue 10 Oct. 2016, Page No. 18584-18588 Implementation of Automatic Retina Exudates Segmentation Algorithm
Analogization of Algorithms for Effective Extraction of Blood Vessels in Retinal Images
 Analogization of Algorithms for Effective Extraction of Blood Vessels in Retinal Images P.Latha Research Scholar, Department of Computer Science, Presidency College (Autonomous), Chennai-05, India. Abstract
A Review of Techniques for Lung Cancer Detection
 International Journal of Current Engineering and Technology E-ISSN 2277 4106, P-ISSN 2347 5161 2015 INPRESSCO, All Rights Reserved Available at http://inpressco.com/category/ijcet Review Article A Review
Full Mouth Survey. Delta Dental of Massachusetts DeltaDentalMA.com
 X-Rays Having X-rays taken is a painless procedure that uses small amounts of radiation to capture images of your teeth and bones. Because your dentist takes precautions and the amount of radiation used
ITERATIVELY TRAINING CLASSIFIERS FOR CIRCULATING TUMOR CELL DETECTION
 ITERATIVELY TRAINING CLASSIFIERS FOR CIRCULATING TUMOR CELL DETECTION Yunxiang Mao 1, Zhaozheng Yin 1, Joseph M. Schober 2 1 Missouri University of Science and Technology 2 Southern Illinois University
A Novel Method for Automatic Optic Disc Elimination from Retinal Fundus Image Hetal K 1
 IJSRD - International Journal for Scientific Research & Development Vol. 3, Issue 01, 2015 ISSN (online): 2321-0613 A Novel Method for Automatic Optic Disc Elimination from Retinal Fundus Image Hetal K
Detection Of Red Lesion In Diabetic Retinopathy Using Adaptive Thresholding Method
 Detection Of Red Lesion In Diabetic Retinopathy Using Adaptive Thresholding Method Deepashree Devaraj, Assistant Professor, Instrumentation Department RVCE Bangalore. Nagaveena M.Tech Student, BMSP&I,
International Journal of Digital Application & Contemporary research Website: (Volume 1, Issue 1, August 2012) IJDACR.
 IJDACR.") Segmentation of Brain MRI Images for Tumor extraction by combining C-means clustering and Watershed algorithm with Genetic Algorithm Kailash Sinha 1 1 Department of Electronics & Telecommunication Engineering,
Segmentation of Brain MRI Images for Tumor extraction by combining C-means clustering and Watershed algorithm with Genetic Algorithm Kailash Sinha 1 1 Department of Electronics & Telecommunication Engineering,
Clustering of MRI Images of Brain for the Detection of Brain Tumor Using Pixel Density Self Organizing Map (SOM)
") IOSR Journal of Computer Engineering (IOSR-JCE) e-issn: 2278-0661,p-ISSN: 2278-8727, Volume 19, Issue 6, Ver. I (Nov.- Dec. 2017), PP 56-61 www.iosrjournals.org Clustering of MRI Images of Brain for the
IOSR Journal of Computer Engineering (IOSR-JCE) e-issn: 2278-0661,p-ISSN: 2278-8727, Volume 19, Issue 6, Ver. I (Nov.- Dec. 2017), PP 56-61 www.iosrjournals.org Clustering of MRI Images of Brain for the
NAILFOLD CAPILLAROSCOPY USING USB DIGITAL MICROSCOPE IN THE ASSESSMENT OF MICROCIRCULATION IN DIABETES MELLITUS
 NAILFOLD CAPILLAROSCOPY USING USB DIGITAL MICROSCOPE IN THE ASSESSMENT OF MICROCIRCULATION IN DIABETES MELLITUS PROJECT REFERENCE NO. : 37S0841 COLLEGE BRANCH GUIDE : DR.AMBEDKAR INSTITUTE OF TECHNOLOGY,
Design of Palm Acupuncture Points Indicator
 Design of Palm Acupuncture Points Indicator Wen-Yuan Chen, Shih-Yen Huang and Jian-Shie Lin Abstract The acupuncture points are given acupuncture or acupressure so to stimulate the meridians on each corresponding
Gabor Wavelet Approach for Automatic Brain Tumor Detection
 Gabor Wavelet Approach for Automatic Brain Tumor Detection Akshay M. Malviya 1, Prof. Atul S. Joshi 2 1 M.E. Student, 2 Associate Professor, Department of Electronics and Tele-communication, Sipna college
Research Article. Automated grading of diabetic retinopathy stages in fundus images using SVM classifer
 Available online www.jocpr.com Journal of Chemical and Pharmaceutical Research, 2016, 8(1):537-541 Research Article ISSN : 0975-7384 CODEN(USA) : JCPRC5 Automated grading of diabetic retinopathy stages
Classification of benign and malignant masses in breast mammograms
 Classification of benign and malignant masses in breast mammograms A. Šerifović-Trbalić*, A. Trbalić**, D. Demirović*, N. Prljača* and P.C. Cattin*** * Faculty of Electrical Engineering, University of
A Quantitative Performance Analysis of Edge Detectors with Hybrid Edge Detector
 A Quantitative Performance Analysis of Edge Detectors with Hybrid Edge Detector Bunil Kumar Balabantaray 1*, Om Prakash Sahu 1, Nibedita Mishra 1, Bibhuti Bhusan Biswal 2 1 Product Design and Development
BRAIN TUMOR DETECTION AND SEGMENTATION USING WATERSHED SEGMENTATION AND MORPHOLOGICAL OPERATION
 BRAIN TUMOR DETECTION AND SEGMENTATION USING WATERSHED SEGMENTATION AND MORPHOLOGICAL OPERATION Swe Zin Oo 1, Aung Soe Khaing 2 1 Demonstrator, Department of Electronic Engineering, Mandalay Technological
ROI DETECTION AND VESSEL SEGMENTATION IN RETINAL IMAGE
 ROI DETECTION AND VESSEL SEGMENTATION IN RETINAL IMAGE F. Sabaz a, *, U. Atila a a Karabuk University, Dept. of Computer Engineering, 78050, Karabuk, Turkey - (furkansabaz, umitatila)@karabuk.edu.tr KEY
Investigating the performance of a CAD x scheme for mammography in specific BIRADS categories
 Investigating the performance of a CAD x scheme for mammography in specific BIRADS categories Andreadis I., Nikita K. Department of Electrical and Computer Engineering National Technical University of