EVALUATION OF COMPUTERISED PROGRAMS FOR THE DIAGNOSIS AND TREATMENT OF BINOCULAR ANOMALIES
|
|
|
- Lorin Craig
- 5 years ago
- Views:
Transcription
1 EVALUATION OF COMPUTERISED PROGRAMS FOR THE DIAGNOSIS AND TREATMENT OF BINOCULAR ANOMALIES A thesis submitted to The University of Manchester for the degree of Doctor of Philosophy in the Faculty of Biology, Medicine and Health 2016 WEI LIN School of Health Sciences / Division of Pharmacy and Optometry
2 CONTENTS CONTENTS... 2 LIST OF FIGURES... 6 LIST OF TABLES... 8 ABBREVIATIONS ABSTRACT DECLARATION COPYRIGHT STATEMENT ACKNOWLEDGEMENTS General Introduction Binocular anomalies Normal binocular vision Classification Prevalence of convergence insufficiency Symptoms of convergence insufficiency Diagnostic testing for binocular anomalies Assessment of size and direction of dissociated phoria Assessment of vergence Assessment of accommodation Assessment of AC/A Challenges in diagnosis of convergence insufficiency Computerised testing for assessing binocular anomalies Treatment for binocular anomalies Best refraction correction Vision training Relieving prism correction Refractive modification
3 1.4.5 Surgery Challenges in treatment of convergence insufficiency Computerised vision training for treating binocular anomalies Overview of thesis rationale Comparing inter-session repeatability of computerised and traditional measurements of binocular vision functions Introduction Computerised measurements of binocular vision functions Evaluation of repeatability for clinical testing Inter-session repeatability of computerised measurements Aim of this study Methods Subjects Test procedures Computerised testing Traditional testing Statistical analysis Results Profile of research subjects Dissociated horizontal phoria at near Near horizontal fusional vergence Accommodative facility Discussion A pilot study for design of a randomised clinical trial investigating the effectiveness of computerised vision training as a home-based treatment for convergence insufficiency Introduction Methods Subject enrollment Eligibility examination procedures Treatment protocols Computerised vergence/accommodative training Brock string training Assessment visits Outcome measures
4 3.2.8 Statistical analysis Results Subjects enrollment and profiles Outcome measures Treatment coherence Sample size calculation for a randomised clinical trial Discussion The nature of accommodative targets affecting the ocular accommodative response in computerised testing of accommodative facility Introduction Methods Study design Designing accommodative targets Subject selection Screening exam Accommodative response measurements Accommodative response calculation Statistical analysis Results Subjects profile Missing data in accommodative response measurements Mean accommodative responses Accommodative errors in computerised and traditional accommodative targets Colour effects Colour filter effects Luminance effects Background effects Display tool effects Discussion Changes in near horizontal vergence after prolonged near vision work Introduction Methods Subject recruitment and eligibility exam Study design
5 5.2.3 Evaluation sessions Three-hour near vision task (NVT) Statistical analysis Results Characteristics of study subjects Changes of vergence functions after 3-hour of the NVT Changes of vergence functions during 3-hour of the NVT Subjects with a clinically significant change in NPC after 3-hour NVT Changes of vergence functions in the subjects with an initially poor NPC Visual fatigue scores Association between NPC change and visual fatigue change after 3-hour NVT Association between near phoria and visual fatigue Discussion General discussion Summary Implications Conclusions References Appendix A A1 Assessment form A2 Treatment protocol of Brock String Training A3 Diary for Brock string training Appendix B B1 Sequence of 13 accommodative target variables on accommodative response measurements in 51 subjects Final word count: 56, 159 5
6 LIST OF FIGURES Figure 1.1 Simplified schematic model showing how binocular single vision is achieved Figure 1.2 Research aims of the four studies in this thesis Figure 2.1 Sequence of the evaluation tests in two sessions Figure 2.2 Auxiliary lenses used in HTS BVA computerised testing Figure 2.3 Computerised dissociated phoria testing Figure 2.4 Examples of two test results for computerised dissociated phoria testing Figure 2.5 Computerised fusional vergence testing at near Figure 2.6 Example of test result of computerised fusional vergence testing Figure 2.7 Computerised accommodative facility testing Figure 2.8 A result of computerised accommodative facility testing Figure 2.9 Distribution of near heterophoria measured by prism cover tests Figure 2.10 Bland-Altman plots showing the near dissociated phoria measurements with the difference vs mean at the two sessions Figure 2.11 Scatterplot of near dissociated phoria measured by the traditional method against the computerised method in Session Figure 3.1 Study design of this pilot study Figure 3.2 Flowchart of this pilot study showing the subject recruitment and the 6 visits assessing outcome measures Figure 3.3 Changes of sings and symptoms over 8 weeks of the home-based vision training Figure 3.4 Individual improvements of outcome measures after home-based vision training for 8 weeks vs Training sessions completed Figure 4.1 Two accommodative targets used in computerised testing of accommodative facility Figure 4.2 Five comparison clusters for 13 accommodative targets in this study Figure 4.3 Light transmittance plot of two filters Figure 4.4 Apparatus and device for measuring accommodative responses during AF testing Figure 4.5 Comparison of mean accommodative lag between computerised red targets, computerised blue targets and traditional targets Figure 4.6 Comparison of mean accommodative lag between accommodative targets in red, blue, green and yellow colours Figure 4.7 Comparison of mean accommodative lag between targets seen through without filter and with filter for the red targets and the blue targets Figure 4.8 Comparison of mean accommodative lag between the accommodative targets with low, 6
7 median and high luminance Figure 4.9 Comparison of mean accommodative lag between targets on black ground and on white background for red and blue targets Figure 4.10 Comparison of mean accommodative lag of the accommodative targets displayed between laptop screen and printed paper Figure 5.1 Experimental timeline Figure 5.2 Rating scale of visual fatigue Figure 5.3 Three-hour near vision task (NVT) at a fixed working distance of 30 cms Figure 5.4 Changes in mean near point of convergence (NPC) over the 3-hour NVT Figure 5.5 Changes in mean dissociated phoria at near over the 3-hour NVT Figure 5.6 Changes in mean associated phoria at near over the 3-hour NVT Figure 5.7 Changes in mean vergence facility over ther 3-hour NVT Figure 5.8 Changes in mean near fusional vergence over the 3-hour NVT Figure 5.9 Changes in mean NPC break and recovery over the 3-hour NVT Figure 5.10 Changes in mean dissociated phoria at near over the 3-hour of the NVT Figure 5.11 Changes in mean associated phoria at near over the 3-hour of the NVT Figure 5.12 Changes in mean vegence facility over the 3-hour of the NVT Figure 5.13 Changes in mean base-in fusional vergence at near over the 3-hour of the NVT Figure 5.14 Changes in mean base-out fusional vergence at near over the 3-hour of the NVT Figure 5.15 Changes in mean visual fatigue score over the 3-hour of the NVT Figure 5.16 Changes of visual fatigue scores in subjects with initial NPC break < 10 cms and 10 cms Figure 5.17 Association between NPC and visual fatigue Figure 5.18 Association between near dissociated phoria and visual fatigue score
8 LIST OF TABLES Table 1.1 Classification of non-strabismic binocular anomalies Table 1.2 Classification of horizontal heterophoria Table 1.3 Summary of convergence insufficience (CI) prevalence from previous studies Table 1.4 Comparison of 3 common techniques for phoria measurements Table 1.5 Finding of near point of convergence (NPC) tests with various viewing targets Table 1.6 Clinical tests used in the determination of CI Table 1.7 Influences of accommodative target (AT) and non-at on NPC results Table 1.8 Clinical signs to diagnose CI in previous studies Table 1.9 Criteria used by Rouse to define subjects with CI Table 1.10 Norms of binocular vision tests and cut-off values in the HTS BVA screening program Table 1.11 Current vision trainings and their design purposes Table 1.12 Comparison of effectiveness of vision training protocols in treating CI Table 1.13 The exercises contained in two computer-based software programs Table 2.1 Descriptive data of near dissociated phoria measured by the computerised and traditional methods in two independent evaluation sessions Table 2.2 Inter-session repeatability of near horizontal dissociated phoria measurements Table 2.3 Agreement of near horizontal phoria measurements between the computerised method and traditional method in Session 1 and Table 2.4 Descriptive data of near horizontal fusional vergence measured by computerised and traditional methods in two independent evaluation sessions Table 2.5 Inter-session repeatability on near fusional vergence measured by the computerised and traditional method Table 2.6 Comparison of Inter-session repeatability on near fusional vergence between the total subjects and the subjects who had the base-out break point less than or equal to 49 Δ Table 2.7 Agreement of near fusional vergence measurements between computerised method and traditional method in Session 1 and
9 Table 2.8 Descriptive data of accommodative facility measured by computerised and traditional methods in two independent evaluation sessions Table 2.9 Inter-session repeatability assessments on accommodative facility measured by the computerised and traditional methods Table 2.10 Agreement of accommodative facility measurements between the computerised method and traditional method in Session 1 and Table 2.11 Comparison of COR of binocular visual functions measured HTS BVA computerised program between the present study and a previous study Table 2.12 Comparison of mean and standard deviation of near phoria, near fusional vergence and accommodative facility measured by the same traditional tests used in this present study with previous studies Table 3.1 Demographics and clinical measures at baseline Table 3.2 Changes of mean of outcome measures after home-based vision training for 8 weeks Table 3.3 Percentage of subjects reaching clinically significant improvement in each outcome measure in this study after home-based vision training for 8 weeks Table 3.4 Sample size estimation for a randomised clinical trial Table 4.1 A comparison of the characteristics of the accommodative targets used in computerised testing and traditional testing of accommodative facility Table 4.2 Thirteen variables of accommodative targets Table 4.3 Parameters of each colour used to make the accommodative target variables Table 4.4 Sequence of total accommodative demands changed in each accommodative target for measuring accommodative response Table 4.5 Visual characteristics of the 51 subjects Table 4.6 Accommodative responses induced by accommodative targets in the 13 different conditions Table 4.7 Mean difference of accommodative responses between the 38 subjects with the measurement data of colour filters in placeand the remaining 13 subjects in total accommodative stimuli of 1 D Table 4.8 Mean difference of accommodative responses between the 38 subjects with the measurement data of colour filters in place and the remaining 13 subjects in total accommodative stimuli of 9
10 4 D Table 5.1 Visual characteristics of the study population Table 5.2 Changes of the vergence functions after 3-hour near vision task (NVT) in 34 subjects Table 5.3 Mean difference of NPC in the subjects with NPC break change > 5 cms and 5 cms after three-hour NVT Table 5.4 Percentage of the subjects who had significantly receded NPC break after the 3-hour NVT in normal convergence and poor convergence Table 5.5 Mean difference after 3-hour NVT in five vergence functions for the subjects with NPC break 10 cms and < 10 cms Table 5.6 Visual fatigue scores before and after one-hour of the distant vision task Table 5.7 Comparison of visual fatigue induced by close work at 30 cms and at 20 cms
11 ABBREVIATIONS AA AC/A AF AR BAF BI BIFV BO BOFV BST BV CI CIRS CISS CITT COA COR CPM D FV HB-CVAT ICC LoA MAD Amplitude of accommodation Accommodative convergence per unit of accommodation Accommodative facility Accommodative responses Binocular accommodative facility Base-out Base-in fusional vergence Base-in Base-out fusional vergence Brock string training Binocular vision Convergence insufficiency Convergence Insufficiency and Reading Study Convergence Insufficiency Symptom Survey Convergence Insufficiency Treatment Trial Coefficient of agreement Coefficient of repeatability Cycles per minute Dioptre Fusional vergence Home-based computerised vergence/accommodative training Intra-class correlation coefficient Limits of agreement Median of absolute difference 11
12 MD MEM NFV NPC NRA NVT OB-CVAT OB-PT OBVT OBVT PFV PRA R/B RCT SD VT Mean difference Monocular estimation method Negative fusion vergence Near point of convergence Negative relative accommodation Near vision task Office-based computerised vergence/accommodative training Office-based placebo training Home-based vision training Office-based vision training Positive fusional vergence Positive relative accommodation Red and blue Randomized clinical trial Standard deviation Vision training 12
13 ABSTRACT Institute: The University of Manchester Candidate: Wei Lin Degree title: PhD Optometry Title: Evaluation of computerised programs for the diagnosis and treatment of binocular anomalies Date: 22 nd July 2016 Computerised diagnostic testing and computerised vision training (VT) have been developed for the orthoptic management of binocular vision (BV) anomalies in clinical practice. Computerised measurement of BV is assumed to assist accurate diagnosis of BV anomalies because variability of testing resulting from subjective judgements of examiners is eliminated by automatic measurements. Computerised VT is thought to be effective in the treatment of BV anomalies because the computer games used for vision training will enhance the patient s motivation. However, these assumptions were lacking scientific support. This thesis reports a range of studies to investigate the computerised programs of diagnostic testing (HTS-BVA) and vision training (HTS-iNet) in comparison with corresponding traditional approaches, respectively. The first study was to investigate inter-session repeatability of computerised testing on BV functions. The study results showed that computerised testing on measuring near horizontal fusional vergence (FV) and accommodative facility (AF) did not present higher inter-session repeatability than corresponding traditional testing. The second study was a pilot study for a future rigorous randomized clinical trial (RCT) investigating effectiveness of computerised VT as a home-based treatment for convergence insufficiency (CI). The study results showed the subjects with CI demonstrated improvement of near point of convergence (NPC), near base-out FV and symptoms associated with CI after an 8-week treatment regime. The third study, following from the first study, was to investigate whether accommodative responses (AR) are affected by the novel accommodative stimuli used in computerised AF testing. The study results showed the AR might be affected by the colours of accommodative targets and the colour filter used. Especially, the data of accommodative demand of 4 dioptres revealed that blue targets presented poorer AR than red targets, and the targets seen with colour filters presented poorer AR than those seen without colour filters. The fourth study, also following from the first study, was to investigate whether a prolonged near vision task affects measurements made relating to the near FV system, thus contributing to the variability of clinical findings. The study results showed statistically significant changes in NPC and near dissociated phoria. In further sub-group analyses, the subjects with an initially poor NPC (n = 9) presented greater changes in the NPC and near dissociated phoria than the subjects with normal poor NPC (n = 25). Overall, the computerised testing did not show more repeatable BV measurements than the traditional testing. Finally, an RCT is needed to determine if the computerised VT is more effective than placebo computerised VT as a home-based treatment for CI. 13
14 DECLARATION No portion of the work referred to in this thesis has been submitted in support of an application for another degree or qualification of The University of Manchester, or any other university or institute of learning. COPYRIGHT STATEMENT i. The author of this thesis (including any appendices and/or schedules to this thesis) owns certain copyright or related rights in it (the Copyright ) and s/he has given The University of Manchester certain rights to use such Copyright, including for administrative purposes. ii. Copies of this thesis, either in full or in extracts and whether in hard or electronic copy, may be made only in accordance with the Copyright, Designs and Patents Act 1988 (as amended) and regulations issued under it or, where appropriate, in accordance with licensing agreements which the University has from time to time. This page must form part of any such copies made. iii. The ownership of certain Copyright, patents, designs, trade marks and other intellectual property (the Intellectual Property ) and any reproductions of copyright works in the thesis, for example graphs and tables ( Reproductions ), which may be described in this thesis, may not be owned by the author and may be owned by third parties. Such Intellectual Property and Reproductions cannot and must not be made available for use without the prior written permission of the owner(s) of the relevant Intellectual Property and/or Reproductions. iv. Further information on the conditions under which disclosure, publication and commercialisation of this thesis, the Copyright and any Intellectual Property and/or Reproductions described in it may take place is available in the University IP Policy (see ), in any relevant Thesis restriction declarations deposited in the University Library, The University Library s regulations (see and in The University s policy on Presentation of Theses. 14
15 ACKNOWLEDGEMENTS I would like to thank: - My supervisor Professor Christine Dickinson for the encouragement and scientific guidance. - My co-supervisor Dr. Catherine Porter and the Behavioural Optometrist Mr. John Glover for their clinical guidance on binocular vision. - My Mum, Dad and my brother for their endless warm supports. - My husband Dr. Yao-Tseng Wen for always calming me down on those difficult days - The Central Taiwan University of Science and Technology for financial support - All the research subjects participating. 15
16 1. General Introduction 1.1 Binocular anomalies Normal binocular vision Binocular vision is the coordination and integration of the images obtained by each eye. The images are fused together and then form a single percept which is called single binocular vision. Achieving a single binocular vision requires complete binocular fusion. A well-known classification scheme of binocular fusion was developed by Worth (1903). In this scheme there were three levels of fusion: (1) simultaneous perception, (2) flat fusion and (3) fusion with stereopsis. Level one, simultaneous perception also called superimposition, is obtained from perceiving the image of an object by both eyes at once. Level two, flat fusion, involves combining the image of the right eye and the image of the left eye into a single image with binocular summation. Level three, fusion with stereopsis, is the highest level of binocular visual function. Worth believed in the existence of a fusional hierarchy such that a person who can achieve a higher level of fusion must have the lower level fusion take place in advance. This clear and simple classification suggested by Worth is still applied in the current clinical practice and literature (Steinman and Steinman, 2000). The existence of single binocular vision depends on normal functioning of the three basic constituents of binocular vision which are (Figure 1.1): the normal anatomical position, the motor system and the sensory system (Evans, 2007 p.2). Theoretically, normal anatomical position means that the visual axes of both eyes are parallel, so that the image of the object falls on to the fovea in each eye when fixating an object at distance. Therefore, in these circumstances, the fovea in the eye 16
17 serves as the corresponding retinal point transmitting the visual information to the same location in the visual cortex (Smith, 1952). Actually, the original anatomical positions of both eyes without tonic convergence are slightly outward although this is seldom seen when the eyes are open and viewing objects. Therefore tonic convergence contributes to move the visual axes from the anatomical position to a position where is called the position of physiological rest. The motor system consists of the extraocular muscles, the intraocular muscles and the corresponding innervation that coordinates the proper movement and accommodation of the eyes to allow motor fusion. Motor fusion can be considered in two parts. One part makes the retinal images fall on corresponding points on each retina by extraocular muscle movement when both eyes look at the object in either different directions (conjugate movement or version) or at different distances (disconjugate movement or vergence). The other part is to make the retinal image always clear through accommodation, which is required when viewing a closer object. Therefore, for example, when motor fusion for a near target occurs, accommodation and convergence must happen at the same time. In fact, convergence is affected by several factors and the stimulus to accommodate is just one of them. Maddox (1893) described four stimuli linked to convergence which are tonic convergence (the physiologic position of rest), fusional convergence (the desire for binocular single vision), accommodative convergence (resulting from focusing on a near target) and proximal convergence (the awareness of nearness). The sensory system refers to the visual pathway which is responsible for the transformation of visual information, the visual cortex which combines the superimposed images at the corresponding points in the retina into a single percept to allow sensory fusion. Sensory fusion is achieved when there is sufficient similarity between the two corresponding retinal images, and this includes the clarity of the optical image in both eyes. 17
 and accurate accommodation (correct focus of fixation target fall on retina).")
18 Figure 1.1 Simplified schematic model showing how binocular single vision is achieved (Evans 2007 p.2). Single binocular vision with successful fusion is achieved by accurate vergence (visual axes aim at fixation target) and accurate accommodation (correct focus of fixation target fall on retina). An object at particular distance has specific demands of convergence and accommodation. The visual system not only needs to fulfil the demands of convergence and accommodation but also have enough reserve and facility to maintain a clear and comfortable single binocular vision in a dynamic situation. Binocular vision anomalies could happen if any constituent part of the system is abnormal, and they can present as a manifest misalignment (which may be intermittent), or a latent misalignment. Abnormal anatomical development or disruption to the motor or sensory systems can lead to manifest misalignment of the visual axes which is called strabismus, tropia or squint. The direction of misalignment can be exo (one eye is outward relative to the optimum position), eso (one eye tends to be inward), hyper (one eye is higher than the other eye) and hypo (one eye is lower than the other eye). The tendency of misalignment in both eyes can be manifest (tropia) or latent (phoria). In the case of a phoria, the fusional abilities of the individual are sufficient to control and overcome any deviation of eye position. Abnormal motor fusion means the inability to make the images fall on corresponding retinal points when trying to compensate for any misalignment of the eyes relative to the stimulus distance. Abnormal motor fusion presents when the opposing fusional reserve is not 18
19 sufficient to compensate a significant eye deviation or the vergence demand of a near target, and it is called a decompensated phoria which is likely to cause complaints and symptoms. Greater misalignment of both eyes creates a higher degree of difficulty, and a greater possibility of failure in maintaining single binocular vision, for example, insufficient base-out fusional reserve in an exophoric patient. However, patients with a large phoria may be symptomless if the phoria is fully compensated by the opposing fusional reserve; or if one eye is suppressed. Inadequate motor fusion would lead to a failure of sensory fusion because it means that different images will fall on corresponding points in the two eyes. However there are other reasons for significant dissimilarities between two retinal images such as different image sizes due to significantly different refractive errors in each eye (anisometropia): this could cause a failure of sensory fusion, but not motor fusion Classification Binocular vision anomalies manifest in various signs detected in optometric clinical examination. A clear classification of binocular vision anomalies to group similar problems together is important for eye care professionals to deal with these anomalies efficiently. A clinical accepted system for classifying non-strabismic binocular vision anomalies (Table 1.1) had been suggested by Scheiman and Wick (2008 p.58-59) which is modified from Wick s classification (Wick, 1981), which came originally from Duane (1896). In Scheiman and Wick s classification, the non-strabismic binocular vision anomalies were divided into the categories of horizontal heterophoria, vertical phoria, accommodative anomalies, and ocular motor problems. In the category of horizontal heterophoria, it is divided into three groups based on the accommodative convergence to accommodation (AC/A) ratio. This refers to the amount of accommodative convergence resulting from 1D of accommodative stimulus, and can be divided into low AC/A, normal AC/A and high AC/A (Table 1.2). This is important 19
20 because the AC/A ratio is the critical factor in determining an effective management strategy among these binocular anomalies (Scheiman and Wick, 2008). Low AC/A ratio means insufficient convergence induced by accommodation and the group of heterophoria with low AC/A contains convergence insufficiency and divergence insufficiency. High AC/A ratio means excess convergence induced by accommodation and this group contains convergence excess and divergence excess cases. A so-called basic phoria, whose direction and magnitude are very similar at distance and near, is likely to result in conjunction with a normal AC/A ratio. Table 1.1 Classification of non-strabismic binocular anomalies (adapted from Scheiman and Wick, 2008). Category Content 1) Horizontal heterophoria Low AC/A, normal AC/A and high AC/A 2) Vertical heterophoria Right or left hyperphoria 3) Accommodative anomalies Accommodative insufficiency, III-sustained accommodation, accommodative excess and accommodative infacility 4) Ocular motor problem Ocular motor dysfunction such as the problem of vergence facility, fixation, saccades and pursuits Table 1.2 Classification of horizontal heterophoria (modified from Scheiman and Wick, 2008). Category Description 1) Low AC/A Orthophoria at distance and exophoria at near Convergence insufficiency Exophoria at distance, greater exophoria at near Convergence insufficiency Esophoria at distance, orthophoria at near Divergence insufficiency 2) Normal AC/A Orthophoria at distance and orthoophoria at near Fusional vergence dysfunction Esophoria at distance, same degree of esophoria at Basic esophoria near Exophoria at distance, same degree of exophoria at near Basic exophoria 3) High AC/A Orthophoria at distance and esophoria at near Convergence excess Esophoria at distance, greater esophoria at near Convergence excess Exophoria at distance, less exophoria at near Divergence excess 20
21 1.1.3 Prevalence of convergence insufficiency Of the binocular vision anomalies, convergence insufficiency (CI) is one of the most common causes of ocular discomfort and eye fatigue. Several studies have estimated the prevalence of CI to range from 3.5% to 33% among children and pre-presbyopic adults in recent decades (Table 1.3) (Letourneau et al., 1979; Dwyer, 1992; Scheiman et al., 1996; Porcar and Martinez-Palomera, 1997; Rouse et al., 1998; Rouse et al., 1999; Lara et al., 2001). An important finding in these studies is that the CI prevalence was low in general school populations than in clinical populations. The CI prevalence is reported to be between 7.7% and 13% in general school populations, and between 3.5% and 33% in clinical populations. The reason for the wide range of the CI prevalence found in clinical populations could be due to the different types of clinic sampled. Prevalence of CI could tend to be higher if the clinic chosen specialises in managing binocular vision anomalies, and receives specific referrals; the CI prevalence would be lower if the clinic is a general optometric clinic. The highest CI prevalence of 33% in a clinical population was reported by Dwyer (1992) who recruited 144 consecutive patients in his optometric practice. However the high prevalence in Dwyer s study is cast into doubt by the lack of clear criteria to diagnose CI. Therefore, a non-clinical setting, and the use of clear definitions CI would be critical to determine an accurate CI prevalence for the general population. In addition, most CI prevalence studies did not provide information on the gender mix of their population, and there is only one review study to mention that theratio of females and males in the CI population was 3 to 2 (Cooper and Duckman, 1978). 21
22 Table 1.3 Author Summary of CI prevalence from previous studies. Year Resource of subjects Age (range) Number of subject CI Prevalence School population Letourneau et al Elementary school % Pocar et al University 22 ± 3* % Rouse et al Elementary school % Clinical population Dwyer 1992 Optometry practice % Scheiman et al Eye institute , % Rouse et al Optometry clinic % Lara et al Optometry clinic 21 ± 6* % * Age is given as mean ± standard deviation because age range was not shown in this article Symptoms of convergence insufficiency Convergence is the mechanism that produces the correct alignment of both eyes for viewing an object when that object moves closer (Rowe, 2004). CI is a condition in which the eyes fail to turn inward sufficiently for a comfortable near vision (Evans, 2007; Scheiman and Wick, 2008). When patients who experience difficult converging engage in a near-vision task, misalignment of the eyes could result in double vision. Additional convergence efforts would need to be exerted to re-align the eyes to eliminate the double vision. The additional converging effort needed to overcome this double vision means that significant symptoms related to the performance of the near-vision task can occur. Symptoms are reported when patients with CI are doing near-vision tasks (Borsting et al., 1999) which they find difficult and uncomfortable. Individuals tend to develop symptoms and seek relief when high demands are made by extended periods of near-vision. Symptoms of CI are frequently related to the use of the eyes for reading, using computer or other near vision tasks and a typical characteristic is that the symptoms usually happen, or get worse, at the end of the day (Cooper and Duckman, 1978). Common complaints include intermittent blurring, intermittent diplopia, and words moving when reading (Scheiman and Wick, 2008, p.245; Porcar and 22
23 Martinez-Palomera, 1997). Other common complaints, which are also related to other ocular problems, include asthenopia, headaches, burning and tearing (Porcar and Martinez-Palomera, 1997; Mahto, 1972). Common complaints related to difficulty of near work are inability to sustain, inability to concentrate and sleepiness after sustained near vision stress (Scheiman and Wick, 2008; Porcar and Martinez-Palomera, 1997). Less common complaints are nausea, motion sickness, dizziness, gritty sensation and general fatigue (Cooper and Duckman, 1978). Convergence insufficiency may show either orthophoria or exophoria at distance, but the near symptoms of each are quite similar although symptoms may be present at distance as well if the distance exophoria is large. (Scheiman and Wick, 2008). Some patients with CI are asymptomatic and the possible reasons are the avoidance of near vision tasks, a high tolerance threshold, occlusion of one eye when reading or suppression (Cooper and Duckman, 1978). Schieman and Wick (2008) suggest that avoidance of near vision tasks is an important reason for recommending treatment when patients with CI report an absence of related symptoms. Measurement of symptoms for a CI patient is necessary because severity of symptoms is a critical factor to determine whether further active management is needed to improve CI (Daum 1988). Symptoms of CI are varied, and using questionnaires to record symptoms of CI is a useful method to systematically catch all the possible problems from a CI patient and quantify the severity of symptom easily. This is helpful for examiners to quantify the effectiveness of treatment on reducing symptoms of CI patient. A symptom questionnaire which included yes-or-no questions to know whether the symptom is present or not was used by Adler (2002). Questions using three or five step grading scales to investigate how frequently the symptom occurs were employed in some previous studies (Borsting et al., 1999; Gallaway et al., 2002). The questionnaire of the Convergence Insufficiency Symptom Survey (CISS) (see Appendix A1)also uses a grading system to measure the type and 23
24 frequency of symptoms, and had been used before and after treatment for patients with CI (Scheiman and Wick, 2008). This questionnaire was the first standardized tool that has been shown to be valid and reliable (Borsting et al., 1999; Rouse et al., 2004; Borsting et al., 2003). The CISS questionnaire consists of 15 items, and each item has five possible answers (never, infrequently, sometimes, fairly often, and always). Each answer is scored from 0-4. Score 4 represents the highest frequency of symptom occurrence (i.e. always) and score 0 represents the lowest frequency of symptom occurrence (i.e. never). The scores of the 15 items are summed to obtain the total CISS score. The lowest score is 0 which indicates asymptomatic and the highest score is 60 which indicate most symptomatic. Different cut-off values were found for the CISS scores among children and adults to differentiate patients with symptomatic CI from those with normal binocular vision. The cut-off values of CISS scores are 16 for children aged 9 to 17 years and 21 for adults aged 18 and older (Rouse et al., 2004; Borsting et al., 2003). 1.2 Diagnostic testing for binocular anomalies Assessment of size and direction of dissociated phoria Measurement of dissociated phoria is achieved by dissociating the eyes to eliminate fusion. Fusion could be broken by several methods such as the occlusion of one eye, an angled physical septum to separate both eyes, creating deviation or torsion of the image of a target viewed in either of the eyes, or producing dissimilar targets for each eye (Schroeder et al., 1996; Pointer, 2005). Phoria measurements can be obtained either by subjective methods, in which examiners rely on patients reporting the end point of tests or objective methods in which the examiner could observe the results. 24
25 In clinical practice, the conventional procedures for both the distant and near phoria measurements with real distances are the von Graefe Technique, the Modified Thorington Technique and the cover test. The comparisons of these three conventional techniques are listed in Table 1.4. Other procedures would include the stereoscope, which use simulated distance to conduct the test, and the Maddox Wing Test, which can only measure near phoria. A potential source of variability in phoria measurements using the different techniques, would be the significant varying status of accommodation during the measurement process (Scheiman and Wick, 2008; Howarth and Heron, 2000). Over-accommodation (lead) status tends to have more eso finding, and under-accommodation (lag) status tends to have more exo finding. The cover test and the Modified Thorington Technique, which are non phoropter-based measurements, are more suitable for younger children. The intra-examiner repeatability of the cover test was reported to be 0.5~1.0 prism diopters of average difference between test sessions (Rainey et al., 1998; Johns et al., 2004). The Modified Thorington Technique had higher intra-examiner repeatability (0.1~0.9 of average difference) than von Graefe Technique (0.7~2.2 of average difference) reported by previous studies (Rainey et al., 1998; Morris, 1960). Although there are several methods of phoria measurements available, the cover test is still the most universally-practiced technique for the initial screening because of the quick test time, the ability to distinguish a phoria from a tropia, the simple equipment required and high repeatability. The expected values are 1 exophoria (± 1 S.D.) at distance and 3 exophoria (± 3 S.D.) at near for general population (Scheiman and Wick, 2008). 25
26 Table 1.4 Examination Cover Test Von Graefe Technique Modified Thorington Technique Comparison of 3 common techniques for phoria measurements. Type Objective Subjective Subjective Fusion broken Occlusion of one eye by an occluder Displace the image of one eye by prism Distort the image of one eye by cylinder with high power Phoropterbased No Yes No Comparison Advantages Suitable for younger children High repeatability The smallest scale is 0.5 or 1 Suitable for younger children High repeatability The smallest scale is 1 Disadvantages Test results are affected easily by varying accommodation convergence At least 2 deviation could be detected by examiners Test results are affected easily by varying accommodation convergence Not suitable for 7 years old and younger children Test results are affected easily by varying accommodation convergence Assessment of vergence Near point of convergence (NPC) is the term commonly used in clinical practice to describe the measurement of the distance of the nearest possible target which can be fixated binocularly, representing the maximum ability of both eyes to turn inward. NPC has been defined as the point intersected by the visual axes of both eyes when maximal convergence is utilized (Millodot 1997 p.55). NPC is measured by pushing up a near target towards the nose in the midline and observing when the patient reports double vision (subjective NPC) or when the examiner notices a break in fusion (objective NPC); and then by pulling it away from nose and noting when the patient reports that the double images become single (Carlson and Kurtz, 2004 p ). The NPC result is recorded as break point /recovery point in centimeters. The fixation target used for NPC tests could be classified into 2 major categories which are accommodative targets such as an optotype, and non-accommodative targets such as a penlight. Accommodative targets may be mounted on rules such as RAF rule or Bernell accommodative rule to make the measurement of the NPC distance easy and accurate. Ciuffreda (1974) reported that 26
27 targets with a high accommodative demand lead to a value indicating better NPC. Recently, several studies were conducted to investigate the influence of different types of viewing targets on NPC measurement in non-presbyopes (Table 1.5) (Adler et al., 2007; Scheiman et al., 2003; Siderov et al., 2001).However there were only small differences between NPC measurements obtained with the accommodative and non-accommodative targets. With accommodative targets, the mean value of NPC break point and recovery point were from 2.5±1.7 to 7.9±0.6 cm and 4.4±2.7 to 10.3±6.1 cm, respectively. With non-accommodative targets, the mean values of NPC break point recovery point ranged from 2.1±1.9 to 6.3±4.8 cm and 3.7±2.9 to 10.8±5.4 cm. Although there were statistically significant differences of NPC break points between optotype (accommodative targets) and penlight (non-accommodative targets) reported by Scheiman et al and Adler et al. s studies, the mean differences were only 0.4 cm (Scheiman et al. 2003) or 0.5 cm (Adler et al. 2007). These were too small toreach the clinically significant difference of 5 cm assumed by Adler et al. (2007). Clinical cut-off values of NPC for non-presbyopes were suggested by Scheiman et al (2003) who recommended that the break and recovery points were 5 cm and 7 cm, respectively with either accommodative targets or penlight with red and green glasses. These values were obtained by identifying the NPC value which was achieved by at least 85% of the research subjects (Hayes et al., 1998). It is not clear why Hayes et al. chose 85% rather than the more common confidence interval of 95%: a possible reason might be that 85% locates between a narrow confidence interval of 68% (1 standard deviation) and a wide confidence interval of 98.5% (2 standard deviations). 27
28 Table 1.5 Finding of NPC tests with various viewing targets in the general population of non-presbyopes (a). Author Siderov et al., 2001 Scheiman et al., 2003 Subject Accommodative target Non-accommodative target N Age range (b) Pencil tip Finger tip Optotype Penlight ± Penlight with R/G (c) glasses 7.9±0.6 / 7.7±0.5 / 5.3±1.9 / ±1.5 (d) 7.9±1.2 (d) 7.6±1.9 (d) 2.5±1.7 / 2.1±1.9 / 2.4±2.1 / 4.4±2.7 (e) 3.7±2.9 (e) 4.4±3.2 (e) Adler et al., 5.2±4.1/ 5.2±4.3/ 5.8±5.1/ 6.3±4.8/ ±5.0 (f) 9.6±5.1 (f) 10.3±6.1 (f) 10.8±5.4 (f) - (a) The result of NPC test was shown as break point/recovery point with mean ± standard deviation in centimeters. (b) Ages were shown as mean±standard deviation or as ranges when the means were not reported. (c) R/G: red and green. (d) Data obtained by conducting test with RAF rule. (e) Data obtained by conducting test with Bernell rule. (f) Data obtained by conducting test in free space. Fusional reserve (also called fusional vergence) is measured to assess the ability to compensate for heterophoria, if heterophoria exists. The amplitude of fusional reserve is commonly measured with a rotary prism mounted on phoropter which is called smooth vergence test, or measured through a prism bar which is called step vergence test. It is determined by the maximum amplitude and base direction of the prism which can be overcome by the fusion mechanism. When evaluating either energetic or not responding children, the step vergence test would be a better alternative because it is done outside the phoropter to allow the examiners to observe easily whether the child s eyes maintain binocularity or not (Scheiman and Wick, 2008 p.12). This measurement could be taken at distance or at near, and it is taken with prism base-out (convergent fusional reserves or positive fusional vergence (PFV), prism of base-in (divergent fusional reserves or negative fusional vergence (NFV) or vertical prism (vertical fusional reserves). The amplitude of fusional vergence can be evaluated to the thresholds of blur, break, and recovery successively. Scheiman and Wick (2008) explained the meaning of each finding for fusional vergence test. The prism value of the blur point indicates the amount of fusional vergence which is free of accommodation. The measure to the break point is the sum of fusional vergence and accommodative vergence. reduction of prism back to the recovery point indicates when the patients can regain single binocular vision after double vision 28
29 occurs. Testing of fusional vergence can be affected by several factors, such as the instructions to the patient, the type of target and speed of increase of the testing prism (Evans, 2007 p.58-91). A study to assess the reliability of binocular vision measurements on fifth and sixth grade school children reported that smooth vergence measurement (von Graefe phorometry method) was found to have only fair intra-examiner reliability, within and between sessions (Rouse et al., 2002). A difference of up to 12 was also found between the initial and follow-up visits even without intervention. Rouse et al. therefore suggested a change of larger than 12 would be necessary to believe the change was real and not the result of measurement variability, for a single examiner when assessing the effectiveness of vision therapy. Based on clinical investigations, the expected findings of near negative fusional vergence for blur, break, and recovery using the smooth vergence test are 13/21/13 ( ) with standard deviation 4/4/5 ( ) respectively (Scheiman and Wick, 2008 p.9). Based on clinical investigations, the expected findings of near positive fusional vergence using the smooth vergence test for blur, break, and recovery are 17/21/11 ( ) with standard deviation 5/6/7 ( ) respectively (Scheiman and Wick, 2008 p.9) Assessment of accommodation Subjective accommodative amplitude can be measured by push-up amplitude or minus lens amplitude. The expected accommodative amplitude for age is determined by the Hofstetter formula: 18-(1/3 age in years) (Carlson and Kurtz, 2004). Accommodative response can be objectively measured by monocular estimate method (MEM) retinoscopy, although this requires an experienced examiner to assess the neutral point in static 29
30 measurements of accommodation response to determine the lead or lag of accommodation (Aldaba et al., 2015). The normative values are +0.25~+0.50D with a standard deviation of +0.25D (Scheiman and Wick, 2008). Open-field autorefractors are also commonly used to measure the accommodative response in clinical investigations (McBrien and Millodot, 1986; Mallen et al., 2001; Atchison et al., 2004; Langaas et al., 2008; Taylor et al., 2009; Theagarayan et al., 2009). The advantage is that the measurement is automatic and it does not require a skilled observer. In addition, the dynamic measurements of accommodative response such as accommodative velocity, accommodative latency, and response time can also be taken in some particular types of open-field autorefractors (Atchison et al., 2004; Langaas et al., 2008). Accommodative facility is usually measured by a ±2.00D lens flipper Assessment of accommodative convergence/accommodation An AC/A ratio is more accurately called a stimulus AC/A ratio when it is obtained by measuring the amount of accommodative convergence induced from each unit of accommodative stimulus, and it can be calculated as AC/A = accommodative convergence (, prism dioptre)/ the change of accommodative stimuli (D, dioptre). Clinically, the change of accommodative stimulus in the above formula could be achieved either by changing the test distance (calculated AC/A) or changing the spherical lens power at the same test distance (gradient AC/A). The methods to determine these two different AC/A ratio are described below: Calculated AC/A: a calculated AC/A ratio could be determined by using either of the following formulas: 30
31 Formula 1 (Goss, 1995): AC/A = (Pn+ NCD)-Pd/NAS (D) Pn: near phoria in prism diopters (eso: + and exo: - ) NCD: near convergence demand in prism diopters Pd: distance phoria in prism diopters (eso: + and exo: - ) NAS: near accommodative stimulus in diopters Formula 2 (Scheiman and Wick 2008): AC/A = IPD(cm) - NFD(m)(Pn - Pd) IPD: inter-pupillary distance in centimeters NFD: near fixation distance in meters Pn: near phoria in prism diopters (eso: + and exo: - ) Pd: distance phoria in prism diopters (eso: + and exo: - ) Example: A patient with IPD of 64 mm is 1 esophoria at distance and 4 exophoria at near (40 cm), what is the calculated AC/A ratio? Using formula 1: AC/A = (-4+(6.4/0.427))-(1)/(1/0.4)=(-4+15)-(1)/2.5 = 4 /D or Using formula 2: AC/A = (-4-1) = 4.4 /D Gradient AC/A: Gradient AC/A is determined by the change of the phoria associated with an additional minus lens at a fixed distance. It is denoted as the following formula: Formula (Goss 1995): AC/A = (phoria #1 phoria #2 ) / (AS #1- AS #2) Phoria: esophoria is denoted as + and exophoria is denoted as - ( ). AS: accommodative stimulus (D). Example: A patient is 6 exophoria with over-correction of -1.00D at 40 cm and 16 exophoria with over-correction of +1.00D at 40 cm, then the AC/A ratio is: (-6-(-16)) / ( ) = 10 / 2D= 5 /D. The calculated AC/A ratio tends to be larger than the gradient AC/A ratio for the same person because the proximal convergence contributes to the gross amount of convergence in near viewing in the calculated AC/A ratio: however in the gradient AC/A ratio, the proximal convergence is the same throughout all the measurements (Scheiman and Wick 2008). The results of AC/A ratio vary if the accommodative response is not equal to the accommodative stimulus presented (Goss 1995). This happens when there is a lag of accommodation. A good clinical technique to try to minimize the lag 31
32 of accommodation is to ask the patient to fixate a target with a size near his threshold visual acuity, and to keep this target clear Challenges in diagnosis of convergence insufficiency The characteristic of CI is the inability to perform accurate convergence under conditions of binocular fixation. Thus, several tests related to vergence are included as part of the diagnostic testing for CI. They can be categorised as measurement of convergence amplitude, measurement of latent ocular deviation, convergent fusional reserve and accommodation. Table 1.6 lists these tests, their normative values and the expected findings of a potential CI patient. AC/A ratio is also included because it provides additional important information about the relationship between accommodation and convergence, and shows the extent of accommodative convergence. Table 1.6 Latent ocular deviation Convergence amplitude Clinical tests used in the determination of CI. Classification Clinical tests Normative values* Expected findings of possible CI # Cover test 1±2 exophoria at D 3±3 exophoria at N Exophoria at N 6 (1) Break: 5±2.5 cm (a) Near point of Recovery: 7±3.0 cm (a) Break/recovery > 10/17.5 convergence (2) Break: 7±4.0 cm (b) cm Recovery: 10±5.0 cm (b) Fusional reserve convergence Positive fusional vergence test Base out_blur: 17±5 Base out_break: 21±6 Base out_recovery: 11±7 Base out_blur: < 11 or base out_break: < 14 or base out_recovery: < 3 or fail Sheard s Criterion (c) Relative accommodation NRA: +2.00±0.50D < D Accommodation Binocular accommodative (1) Children(±2.00D): 5 cpm (Indirect measures D 3 cpm facility (2) Adult(±2.00D): 10 cpm of convergence) MEM retinoscopy +0.50±0.25D < +0.25D AC/A ratio Dissociated phoria 6/1 < 3/1 * Reference from Scheiman and Wick (2008); # Reference from Lara et al. (2001). (a) Accommodative targets were used; (b) Non-accommodative targets (penlight and red/green glasses) were used; (c) Sheard s Criterion: positive fusional vergence less than twice the near phoria. D: Distance; N: Near; NRA: negative relative accommodation; MEM: monocular estimate method. 32
33 In the examination of potential CI patients, there are two suggestions offered by some authors to reveal the receded NPC of the CI patients. The first one is using a non-accommodative target such as a penlight with coloured lenses, to measure NPC rather than an accommodative target (Scheiman et al. 2003; Pang et al. 2010; Capobianco 1952). This recommendation was based on evidence from previous studies which showed a minor mean difference (0-0.2 cms) of NPC results between testing with accommodative targets and non-accommodative targets in non-ci subjects, but a lager mean difference of NPC results between the different target types ( cm) in CI subjects (Table 1.7). It is suspected that a falsely normal NPC value can result when measuring NPC in CI patients with an accommodative target because they may use extra accommodation to achieve the vergence requirement (Pang et al. 2010). The second suggestion is repeating NPC measurement for 10 times to yield more useful clinical information. This suggestion is based on a study which reported that after repeating the NPC measurement 10 times, the amount of NPC recession was small (less than 1 cm) in normal subjects but up to 4 cm in CI patients (Scheiman et al. 2003). Table 1.7 Influences of AT and non-at on NPC results in non-ci and CI subjects. Author Year Subject (N) Scheiman et al AT Break point Non-AT Mean difference among targets AT Recovery point Non-AT Mean difference Non- CI (175) 2.5± ± ± ±3.2 0 among targets CI (38) 9.3± ± ± ± Non- CI (18) 4.3± ± ± ± Pang et al CI (18) 10.1± ± ± ± AT: accommodative target; Non-AT: non-accommodative target The possible signs occurring in CI are described as follows. Receded near NPC: A remote NPC is considered by most studies to be characteristic of CI but they have chosen cut-off values between 4 and 10 cm (Letourneau et al. 1979; Scheiman et al., 33
34 1996; Rouse et al., 1999; Lara et al., 2001). Greater exophoria at near than at distance: The difference in the size between exophoria at near and at distance to meet the criterion for CI was suggested to be from four to six prism diopters ( ) by previous studies (Porcar and Martinez-Palomera 1997; Rouse et al. 1999; Lara et al. 2001). Insufficient near PFV: In general, individuals with greater near exophoria who do not have sufficient near PFV amplitudes to compensate this deviation could have difficulties in maintaining comfortable near vision and would be expected to have complaints when sustained near vision is used. Two common criteria are used to define insufficient PFV. One is that the PFV fails Sheard s criterion (Sheard, 1930), which is that the near PFV is less than twice the near phoria (Scheiman et al., 1996; Rouse et al., 1999). The other one is the PFV at near less than 11 to 12 to the blur point (Scheiman et al., 1996; Rouse et al., 1999; Lara et al., 2001) or less than 14 to 15 to the break point (Scheiman et al., 1996; Rouse et al., 1999; Lara et al., 2001) or less than 3 to the recovery point (Scheiman et al., 1996; Lara et al., 2001). Low AC/A ratio: Clinically, an AC/A ratio less than 3:1 is commonly thought to be present in CI (Scheiman and Wick 2008; Porcar and Martinez-Palomera 1997; Lara et al. 2001), and it is also an essential factor to consider when treatment is determined. Low negative relative accommodation: Due to the relationship of accommodation and convergence, any relaxation of accommodation would reduce the accommodative convergence, as determined by the AC/A ratio (Sen and Malik 1972). It means an individual needs to relax the accommodation and employ extra PFV to fulfill the requirements of this test which are to 34
35 maintain the clarity and fusion of a target (Scheiman and Wick 2008, p.60). For example, assuming an AC/A ratio of 4:1, when +2.50D lenses are placed in front of both eyes to a target at 40 cm, a relaxation of accommodation of 2.50D should occur to allow this target to be seen clearly, and 10 of PFV would be exerted to compensate the reduced accommodative convergence for single binocular vision. Therefore, a low value of NRA would indicate the possibility of insufficient PFV. An NRA result lower than +1.50D has been considered to be one of the signs of CI (Scheiman et al., 1996; Lara et al., 2001). Difficulty with plus lenses during binocular accommodative facility testing (BAF): The explanation of the difficulty with plus lenses during BAF testing in CI is similar to that for NRA described above. BAF also requires the observer to keep convergence at a particular fixed amount when the accommodative response is changed using plus lenses (Scheiman and Wick, 2008, p.60). A BAF result less than 3 cycles per minute (cpm) (Scheiman et al., 1996) or failing to clear +2.00D lenses in 10 seconds (Lara et al., 2001) would be one of the signs of CI. Low finding with monocular estimation method (MEM) retinoscopy: The difference between the accommodative stimulus and the accommodative response indicates the lag or lead of accommodation. A lead of accommodation or low accommodation lag (MEM finding lower than plano~+0.25d) might be one of the signs of CI (Scheiman et al. 1996; Lara et al. 2001) because the patient with CI might exert extra accommodation to stimulate additional accommodative convergence for maintaining fusion to compensate for insufficient convergence when viewing a near target. Overall, the diagnosis of CI has gradually shifted over time. In early studies, CI was defined by a single 35
36 sign which was a receded NPC to 10 cm (Pickwell and Stephens, 1975; Letourneau et al., 1979). Using a single sign, a receded NPC, to diagnose CI is easy, but accommodative insufficiency may be misdiagnosed as CI since difficult convergence would be a secondary sign presenting in patients who suffer from accommodative insufficiency. In studies published after 1980, CI has been diagnosed by more than one sign. Signs now considered important to the diagnosis of CI are a receded NPC, exophoria and insufficient near PFV (Lara et al., 2001; Rouse et al., 1999; Porcar and Martinez-Palomera, 1997; Scheiman et al., 1996). Several studies suggested that poor performances in accommodation were also related to CI such as low AC/A ratio, low accommodative lag (by MEM), low NRA and insufficient BAF (Lara et al., 2001; Scheiman et al., 1996). Different combinations of these signs and their cut-off values to diagnose CI were suggested in previous studies, and they are shown in Table 1.8. Instead of a dichotomous diagnosis of CI, another method to define CI was described by Rouse et al. (1999) who recognized the difficulty of diagnosing CI and suggested a more realistic and graded diagnosis. Rouse et al. s diagnosis criteria of CI patients are shown in Table 1.9. Near exophoria, exophoria at near 4 larger than at distance, receded NPC, and insufficient PFV were chosen to be the four signs to determine CI by Rouse et al., and the classification is shown as: (1) definite CI: all 4 signs present; (2) high suspect CI: near exophoria, exophoria at near 4 larger than at distance, and either one of receded NPC or insufficient PFV present; (3) low suspect CI: only near exophoria, and exophoria at near 4 larger than at distance present. 36
37 Table 1.8 Clinical signs to diagnose CI in previous studies. Author Year Signs (I) (II) (III) (IV) (V) (VI) (VII) Remote NPC Exophoria condition Insufficient near PFV Low AC/A ratio Low Accom. lag Low NRA Insufficient BAF Necessary Norn 1966 > 9 cm (I) None Pickwell and Stephens 1975 > 10 cm (I) None Letourneau et al > 10 cm (I) None Scheiman et al Pocar and Martinez-Palomera Rouse et al Break/recovery > 4/7 cm Exophoria at N (7) D (8) Failing Sheard s Criterion (1) or Near PFV < 11 blur or < 14 break or < 3 recovery 2/1 < Plano < D Cannot clear +2.00D < 10 sec 1997 Value not reported Exophoria > 6 Value not reported < 3/ cm break or 10.5 cm recovery Exophoria at N & Exophoria at N 4 than D Failing Sheard s Criterion or near PFV of 12 blur or 15 break sign (I) (I), (II), (III)&(IV) (II) PFV at near: < 11/14/3 for At least 2 Break/recovery > Exophoria at N > Fail in D; (I), (II) & Lara et al blur, break and recovery (at < 3/1 < D < D findings of 10/17.5 cm 6 3 cpm (III) least one of three) (IV) to (VII) NPC: near point of convergence; PFV: positive fusional vergence; AC/A: accommodative convergence per dioptre of accommodation; Accom.: accommodative lag; NRA: negative relative accommodation; BAF: binocular accommodative facility; N: near; cpm: cycles per minute. D: distant; (1) Sheard s Criterion: near PFV less than twice the near phoria (Sheard, 1930); Criteria Additional sign At least 3 findings of (II) to (VII) None At least 1 findings of (II) to (III) 37
38 Table 1.9 Criteria used by Rouse to define subjects with convergence insufficiency (CI) (Rouse et al., 1999). CI category High Definite Low suspect CI Clinical signs suspect CI CI Near exophoria v v v v Exophoria at N 4 than D v v v v Receded NPC x x v v Insufficient PFV x v x v N: near; D: distance; NPC: near point of convergence; PFV: positive fusional vergence. v: presenting with the sign. x: presenting without the sign. No matter which sign is used to diagnose CI, a good clinical test to measure the sign is the basis for a correct diagnosis of the condition. An ideal clinical test contains two important characteristics which are high validity and high reliability (Hulley et al., 2007; Schroeder et al., 1996). The validity refers to the accuracy of test, and it is defined that the extent to that the test actually measures what it is intended to measure (Hulley et al., 2007). Generally, a gold standard test for diagnosis or a reference technique which is considered the most accurate is necessary when the validity of a measurement is assessed (Hulley et al., 2007). A gold standard of diagnosis would be difficult to obtain when a subjective response is being measured in most clinical tests of binocular functions (compared to the objective methods in the other areas such as OCT (optical coherence tomography) in glaucoma management (McAlinden et al., 2011). Therefore, in my opinion, the validity of binocular function measurement is seldom considered in previous studies. Furthermore, the reliability refers to the precision, reproducibility, repeatability and consistency, and it is defined by the extent to which the test can have the same value in repeated measurements (Hulley et al., 2007). In addition, a useful clinical test would be expected to produce consistent results when conducted at different time points, by different people and in different places (Hulley et al., 2007). However, the inter-sessional comparison of PFV measurements demonstrated only fair reliability, and the difference of test results between sessions were up to 12 (Rouse et al., 2002). The potential significant variability found between test sessions would increase the difficulties in clinical decision-making in regards to 38
39 diagnosis and management (Rouse et al., 2002). 1.3 Computerised testing for assessing binocular anomalies A computerised screening program is convenient for examiners to use because all the fixation targets required in the binocular function examination are presented in a program. An ideal computerised screening program should have characteristics of fast test time, sensitivity to screen out all the potential anomalies, and easy to use. One computerised program called HTS BVA screening program ( is commercially available for screening binocular anomalies. The HTS BVA screening program is used at a viewing distance of 40 cm. The tests of this screening program and the cut-off values representing the normal function for each test are listed in Table Table 1.10 Binocular vision test Phoria at near Norms of binocular vision tests and cut-off values in the HTS BVA screening program. Fixation Disparities at near Fusional reserve at near Accommodation facility Norms of binocular test 3 exophoria (3 S.D.) Aligning prism < 1 Morgan BI:13±4/21±4/13±5 ( ) BO:17±5/21±6/11±7( ) (blur/break/recovery) Children: (±2.00D) 5 cpm binocularly, 7 cpm monocularly Adult: (±2.00D) 10 cpm binocularly, 11 cpm monocularly 39 BVA screening program Test Yes Yes Yes Yes Cut-off value 4 esophoria and 6 exophoria Lines are aligned BI: 10/6 ( ), BO: 20/16( ) (break/recovery) >12 cpm > 80% correct response for OD and OS, respectively Worth 4 dots at near See four dots Yes See 4 targets No >80% correct response Eyes follow the moving Pursuits Yes Average response time < No target smoothly 1.20 sec Saccades Eyes jump to view targets at opposite two Yes >80% correct response Average response time < Glasses needed R/B R/B R/B R/B & ±1.50D flipper* No
40 ends accurately 1.20 sec NPC: near point of convergence; MEM: monocular estimation method; : prism diopter; D: diopter; cpm: cycles per minute; R/B: red/blue; sec: seconds; S.D.: standard deviation. *A special monocular flipper (-1.50D over left eye and +1.50D over right eye) is used with a pair of R/B glasses to measure monocular accommodative facility when accommodative targets in red and blue are displayed in turn on computer screen. 1.4 Treatment for binocular anomalies Previous studies reported that CI is a type of treatable binocular anomalies (Cooper and Duckman, 1978; Grisham, 1988) and the overall cure rate is around 72% (Grisham, 1988). The most effective treatment of CI is recognized as vision training (Cooper and Duckman, 1978; Grisham, 1988; Scheiman and Wick, 2008). The common options to treat binocular anomalies could be categorized to be non-invasive or invasive. Non-invasive treatments include refractive modification, relieving prism, and vision training, and these could benefit most non-strabismic binocular anomalies. However, only vision training and relieving prism could produce enough effect to treat CI and refractive modification would be considered as a less effective treatment of CI because CI is usually characterized by a low AC/A group (Scheiman and Wick, 2008). Invasive treatments such as surgery are also options to treat CI, but they are generally reserved as a last resort for this condition after trying all possible non-invasive methods, and not improving symptoms and signs Best refraction correction As a general rule, best refraction correction is the first priority in managing CI with a significant uncorrected refractive error, because this may result in blurred retinal images which interfere with sensory fusion (Scheiman and Wick, 2008 p ). Blum (1959) reported the criteria for significant refractive error which requires correction as hyperopia 1.50D, myopia 1.00D, astigmatism 1.00D, and anisometropia 1.00D difference in either the sphere or cylinder. In view 40
41 of the relationship between refraction, binocular vision and accommodation, the new prescription needs to be worn by the patient who presents with a significant refractive error for 4 to 6 weeks, following which a reassessment of accommodative and binocular functions is suggested by Scheiman and Wick (2008 p ). A previous study on 143 non-strabimic patients who had ametropia and had binocular vision or accommodative anomalies, or both, reported that 51.6% of these patients presented improvements of binocular function after an initial refractive correction had been worn for one or more months (Dwyer and Wick, 1995) Vision training Von Graefe in the middle of 19 th century was the first one to describe CI and recommend that exercises can improve the convergence amplitude (von Noorden and Campos, 2002 p ). Such exercises continued to be developed into the vision training programs which have become the mainstay of treatment for CI to this day (Scheiman and Wick, 2008p ; Arnoldi and Reynolds, 2007). There are several vision training exercises which have been developed to treat symptomatic CI in the past and they can be classified into three categories, according to their purposes (Scheiman et al., 2005a). The three categories are: (1) to develop the ability of voluntary convergence for normalization of the near point of convergence; (2) to increase the ability of the fusional vergence response for the normalization of fusional vergence function; (3) to increase the ability of accommodative facility for the normalization of accommodation function. The procedures of a wide variety of vision training protocols are described in the following paragraph. Several vision training items are developed with the same purpose, offering the practitioner different choices to treat CI. 41
42 Current vision training items are listed in Table Table 1.11 Design purpose Current vision trainings and their design purposes (Adapted from Scheiman et al., 2005a). Vision training / orthoptics Brief description (1) Develop the ability of voluntary convergence Pencil push-ups Brock string Barrel card (2)Increase the ability of the fusional vergence response Tranaglyghs Vectograms Aperture rule Eccentric circles (3) Increase the ability of accommodative facility Monocular accommodative facility Binocular accommodative facility Letter chart accommodative facility/hart chart near far rock The patient needs to hold a target at arm s length and then gradually bringing it towards the eye, keeping bifoveal fixation all the time. The patient needs to converge accurately on the beads placed on a string; the distance between eyes and beads can be changed from several meters to 5 cm depending on the difficulty of level. The patient needs to converge accurately on targets on a handheld card 5 cm from the eyes The patient needs to wear a pair of red/green glasses to maintain single binocular vision as targets with red/green are disparate to create base-out or base-in vergence demand The patient needs to wear a pair of Polaroid glasses to maintain single binocular vision as targets with polarization are disparate to create base-out or base-in vergence demand. The patient needs to converge to achieve single binocular with targets with increasingly larger base-out or base-in vergence demand. The patient needs to converge to achieve single binocular with targets with increasingly larger base-out or base-in vergence demand. The patient needs to make the target of 6/9 to 6/15- size print clear at 40 cm alternatively through a flipper with minus and plus lenses under monocular condition The patient takes the same procedures as monocular accommodative facility, but it is done under binocular condition. The patient needs to make targets of 6/9-size print at 40 cm clear and then 6/9-size targets at distance alternatively under monocular condition. Office-based vision training can contain a combination of all the vision training exercises with an experienced therapist to monitor the progress of a CI patient and adjust the type of exercises as required. It is considered an effective treatment of CI from the consistent research result of recent 42
43 studies (Adler, 2002; Scheiman et al., 2005a; Scheiman et al., 2008). There is currently no consensus on what is the best type of treatment for CI, but generally a combination of different training exercises is the basis. Home-based therapy has several advantages which include flexible and unlimited training time, and less expense of training compared to office-based training. Techniques such as pencil push-ups, stereograms, loose prism, Brock string, or eccentric circles are traditionally prescribed with home-based approach (Scheiman and Wick, 2008 p ). A previous survey suggested that training of pencil push-ups was commonly prescribed for home-based therapy approach in CI in both optometry and ophthalmology (Scheiman et al., 2002). This is most likely due to its simplicity and low cost. A previous study reported pencil push-ups with home-based approach only resulted in some improvements in both objective findings and symptoms in the less that 50% of subjects who completed the study (Gallaway et al., 2002). An inherent problem in such home-based therapy is compliance of patient, since it is more likely that patients lose interest with the procedure and discontinue. Furthermore, the low effectiveness of the home-based therapy may result from the lack of the monitoring capability that would be provided by an experienced therapist in the office setting, who could interpret patients responses and use that information to alter stimulus conditions and offer more exercises. Table 1.12 lists several types of vision training used in treating CI in previous studies. However, the effectiveness of vision training in different studies is not easy to directly compare. Thus, effect size which derives from the absolute value of mean improvement dividing by standard deviation is used to interpret these differences among these studies because effect size can adjust for the effect of varying means and standard deviations between the studies. From Table 1.12, it is interesting to find 43
44 the effect size of office-based vision training (OB-VT) is better in children than that in adults (Sheiman et al., 2005a; Sheiman et al., 2005b). In contrast, the effect size of home-based pencil push-ups (HB-PP) is better in adults than in children (Sheiman et al., 2005a; Sheiman et al., 2005b). The reason could be that children have less compliance at home than adults, but they are more likely than adults to follow the instruction of doctors in a clinical office. Most of children will believe the authoritative direction of doctors and will follow the procedures in a clinical office well. However, the effect of regular OB-VT on CI adults could be reduced because adults might attend OB-VT with exhausted body after heavy work or shift-work. Therefore home-based training might be of more benefit to CI adults than to children because the flexible schedule allows CI adults find a suitable schedule to conduct training sessions by themselves. 44
45 Table 1.12 Comparison of effectiveness of different vision training protocols in treating CI from previous studies. N of subjects Age Duration of Type of treatment Study Study design (Nonresponse range of treatment (Location) /total) subjects Serna et al., 2011 Retrospective -/ wks Computer VT program (HB) Symptoms improved (1) NPC improved PFV improved Mean improvement (2) 100% reported (4) Effect size (3) improvement of symptoms Mean improvement (2) (cm) Effect size (3) Mean improvement (2) ( ) Effect size (3) Cooper and Feldman, 2009 Scheiman et al., 2008 Brautaset and Jennings, 2006 Scheiman et al., 2005b Scheiman et al., 2005a Gallaway et al., 2002 Retrospective -/ NR Computer VT program (HB) NR NR Prospective, placebo controlled, randomized, masked 3/ wks VT program (OB+HB) Placebo VT program (OB+HB) Computer VT program+ pencil push-ups (HB) Pencil push-ups (HB) Prospective NR/ ±4.1 (5) 12 wks VT program (HB) NR Prospective, placebo controlled, randomized, masked Prospective, placebo controlled, randomized, masked 6/ wks 9/ wks Prospective 13/ wks Pencil push-ups (HB) VT program (OB) Placebo VT program (OB) Pencil pushups (HB) VT program (OB) Placebo VT program (OB) Pencil push-ups (HB) % report improvement of symptoms (4) symptoms of 15 Adler, 2002 Retrospective -/ NR VT program (OB+HB) described (4) NR - NPC: near point of convergence; PFV: positive fusional vergence; OB: office-based; HB: home-based; wks: weeks; VT: vision therapy. NR: not reported. (1) Using CISS standardized questionnaire for convergence insufficiency; (2) Mean improvement = mean of post-treatment - the mean of pre-treatment; (3) Effect size = the absolute value of mean improvement/standard deviation; (4) Data from Non CISS questionnaire; (5) Ages were shown as mean ± standard deviation because age range was not shown in this study. NR: not reported. 45
46 1.4.3 Relieving prism correction Theoretically, the use of relieving base-in prism should be a good option to treat CI because it could immediately create an outwardly deviated image of object. Fixation disparity analysis (Scheiman and Wick, 2008) or Sheard s criterion (Sheard, 1930) could be used to prescribe the amount of base-in prism for CI. Sheard proposed the following formula: the amount of prism to be prescribed = 2/3 phoria 1/3 compensating fusional vergence. This formula was based on the concept that the fusional reserve must be at least twice the amount of the phoria for a patient with a significant phoria to be comfortable. However, there have been very few studies to prove its effectiveness in clinical practice. A randomized clinical trial reported that the effectiveness of base-in prism reading glasses (using Sheard s criterion) was no more than placebo reading glasses when treating 72 symptomatic CI children who were aged 9-17 years. The results showed no significant differences between the treatment and the placebo group in the change of the CI Symptom Survey scores (p = 0.33), the change of near point of convergence (p = 0.91), and the change of positive fusional vergence (p = 0.59) after 6 weeks of wearing glasses (Scheiman et al., 2005c). Therefore, Scheiman and Wick (2008) consider the use of base-in prism as a primary treatment cannot be supported in children with CI and suggested the use of prism to treat CI could be considered when a patient has a poor compliance with vision training or a failure of vision training. Recently, Teitelbaum et al. (2009) reported that symptoms of presbyopes with CI was significantly alleviated by a novel progressive addition lens design which incorporates base-in prism in the near portion only. The application of prism to treat CI still needs more studies to determine its effectiveness. 46
47 1.4.4 Refractive modification Theoretically, in order to make eyes turn inward further, use could be made of increasing negative adds (additional minus spherical lens to the best correction): when viewing a target this would stimulate additional accommodation and so induce more accommodative convergence. However, in low AC/A cases such as CI, added negative lenses could stimulate only a small amount of accommodative convergence. Therefore, consideration of the use of added lenses is moved close to the bottom of the sequential management of CI Surgery Surgery is seldom used by clinicians to treat CI because the use of non-surgical treatments is so successful (Scheiman and Wick, 2008). In addition, the efficacy of surgery for CI had not been proven by sufficient number of studies. One available case report with 14 cases of intractable CI found that a surgery with resection of both medial rectus muscles is an effective treatment for eliminating the asthenopia symptoms of these patients (Hermann, 1981). Therefore, a recommendation of surgery might be considered when a patient manifests very high magnitude of exophoria and has a failure of any non-surgical treatment Challenges in treatment of convergence insufficiency Although CI is considered as a treatable binocular anomaly, the costs of office based vision training (OB-VT) to treat CI are high. In countries where the OB-VT is not funded by the national health system, patients with CI might be unable to receive the OB-VT treatment due to financial barriers. Therefore, using relatively cheap tools to perform the vision training at home is a possible solution to 47
48 help more patients with CI to be treated. However, the compliance of such home-based vision training for CI is of concern because if there is poor compliance it is difficult to assess the progress of treatment. 1.5 Computerised vision training for treating binocular anomalies Computerised software programs have been designed to improve the effectiveness of home-based training by making the procedures of home-based vision training easier and more interesting. In this way, it is hoped to enhance the compliance with home-based vision training. Computer-based training is a new advance in eye care and means the vision training can be given to more patients. It often consists of several exercises inside a program and it is suitable to be conducted either at home or in the optometric office because it is easy to understand and manipulate for patients. The outstanding feature of computer-based training is that all the visual stimuli are provided by a computer without any additional equipment required. Sometimes the patient needs to wear a specific pair of glasses such as red/green glasses or polarising filters to see stimuli presented on the computer. There are two commercial computer-based software programs designed for home-based vision training. One is HTS inet by HTS and the other one is Computer Vergence Program by Computer Aided Vision Therapy. The items of vision training in these two computer-based software programs are listed in Table HTS inet software program includes the exercises for vergence, accommodation, saccades, and pursuit. The outstanding characteristics of this program are that it allows a therapist to monitor a patient s performance at home over the internet, and it automatically increases the challenge based on improvement of the patient. Taking one training item called Accommodative Rock in HTS inet 48
49 program as an example, the program gives a prompt to use the next highest flipper level when 13 cycles per minute with 80 percent correct response is achieved at a given flipper level (Goss et al., 2007). The lens powers in each flipper level are: +0.75/-1.50 D at level one, +1.25/-2.50 D at level two, +1.75/-3.50D at level three, +2.00/-4.00 D at level four, +2.25/-4.50 D at level five, and +2.50/-5.00D at level six (Goss et al., 2007). Table 1.13 The exercises contained in two computer-based software programs. HTS inet Program Base-in/base-out vergence Auto slide vergence Jump ductions Accommodative rock Base-up/base-down vergence Saccades Pursuits Computer Vergence Program Single jump vergence Double jump vergence Smooth vergence Random dot stereograms Stereo picture targets Red blue saccades Binocular pursuit Life saver drills Anti-suppression games Computerised home-based therapy has been reported as effective treatment of CI in several retrospective and case studies (Serna et al., 2011; Cooper and Feldman, 2009), although a randomized clinical trial (Convergence Insufficiency Treatment Trial, CITT) for the treatment of CI children found that computerised home-based therapy is not as effective as office-based vision therapy (Scheiman et al., 2008). In the CITT study, office-based vision therapy was compared to home based pencil push-ups and home-based computer therapy plus pencil push-ups. The results showed around 75% of the patients who received office-based vision therapy became asymptomatic, with improved clinical signs. However, the computerised home-based treatments were no more effective than the placebo treatment; only 40% of patients became asymptomatic, with a normal NPC and PFV 49
50 at near. A most likely cause might be that the compliance of CI children in the computerised home-based treatments was quite low in the CITT trial (Cooper and Feldman, 2009). 1.6 Overview of thesis rationale The computerised program theoretically has a number of advantages in addressing the problems in management of prevalent binocular anomalies such CI using traditional methods. As discussed previously, the automatic measurements using a computerised program are potentially able to increase the measurement repeatability by reducing the measurement errors in assessing binocular vision functions, and thus allow more accurate diagnosis of binocular anomalies. In addition, the interactive games of the computerised training program have the potential to increase the success rate of the vision training by enhancing the patient motivation when conducting long term home-based vision training for effective treatment of binocular anomalies. However, such computerised programs used in the management of binocular anomalies currently lack systematic validation for evaluating their performance objectively. A clear demonstration of the advantages arising from the difference between the computerised programs and the traditional methods remains to be provided. Therefore, two commercially available computerised programs, HTS BVA (for diagnosis) program and HTS inet program (for visin training) (HTS Inc., USA: were chosen to be evaluated in this thesis to see if such computerised programs are suitable to be recommended for clinical use in the management of binocular vision anomalies. An illustration is shown for the research aims in the studies to be reported in this thesis. 50


51 Figure 1.2 Research aims of the four studies in this thesis Chapter 2 of this thesis presents the experiment investigating the inter-session reliability of test-retest measurements of binocular vision functions carried out by the HTS BVA computerised program, and the reliability of computerised testing was further compared with the corresponding traditional testing. This is important since the test is to be used to monitor changes occurring as a result of treatment, and these must be distinguishable from random fluctuations. Chapter 3 of this thesis presents the study investigating effectiveness of vision training carried out by the HTS inet computerised program for improving CI, and effectiveness of the corresponding traditional vision training for improving CI was also investigated in the same study. This was to act as a pilot study for a full RCT comparing the two forms of treatment. The study results in Chapter 2 showed that the repeatability from the computerised measurements 51
52 was not higher than that from the traditional measurements in the binocular vision testing. It was therefore necessary to investigate the possible factors that might cause poor repeatability of the computerised measurements. Thus, Chapter 4 and Chapter 5 were designed to evaluate the factors affecting accuracy and precision for the binocular vision function testing. Chapter 4 of this thesis evaluates whether the accuracy of accommodative responses was influenced by the accommodative target design while the computerised AF testing was carried out. Chapter 5 of this thesis presents an experiment investigated whether the type of close work commonly carried out in everyday life would have a short-term effect in changing the near horizontal vergence among young adults. The final chapter, Chapter 6, provides a summary of main findings of this thesis and discusses the advantages and disadvantages of the computerised program. In addition, the suggestions for using the computerised program are also discussed in this chapter. 52
53 2. Comparing inter-session repeatability of computerised and traditional measurements of binocular vision functions 2.1 Introduction Computerised measurements of binocular vision functions Clinically, binocular vision functions are investigated to aid in the diagnosis of binocular vision anomalies which can create common symptoms such as eye strain, headache, blurred vision, double vision and reduction of stereopsis, (Lara et al., 2001), that might significantly affect the quality of life. Nowadays, these binocular vision functions could be automatically measured by computer programs without the need for specialist personnel, like other automated measurements which are common in optometry, such as refractive error, cornea curvature and visual field (Heijl, et al., 1989; Zadnik et al., 1992). The binocular vision functions which are able to be measured by computerised programs are dissociated phoria, fusional vergence amplitudes, accommodative facility, fixation disparities, stereo acuity, pursuits and saccades (Ma et al., 2013; Capó-Aponte et al., 2012; Erickson et al., 2011; Han et al., 2010; Rouse et al., 1991; Feldman et al., 1989). If they are reliable in repeated measurements, these computerised measurements of binocular functions would be helpful not only in diagnosing binocular anomalies but also in monitoring the progress of treatment of binocular anomalies. 53
54 2.1.2 Evaluation of repeatability for clinical testing Repeatability is also called test retest reliability or stability, and it refers to how consistent consecutive test values of a single test are (Bashir et al., 2008). Clinically, the repeatability of a clinical test is evaluated by having the test repeated by the same examiner/instrument on the same individual person under the same conditions within a short period of time, for a representative group of human subjects (Bland and Altman, 2003). A less-than-perfect repeatability has variability called measurement error (Bashir et al., 2008), and the sources of such variability can be due to the tested individual, or to the examiner/instrument (Hulley et al., 2013). For example, the examiner variability in testing of accommodative facility may come from inconsistent speed on flipping the lens flipper during testing. Poor accommodative facility occurs if the flipping speed is slow, and vice versa. As a result, the lower the test-retest variability produced by a test method, the more repeatable the test method is and vice versa. Knowing the repeatability of a test method used in clinical investigation is important for making a reliable diagnosis, and evaluating how effective a treatment is without bias (Rankin and Stokes, 1998). A test with poor repeatability increases the chances of making false negative/positive diagnoses, or failing to show the effectiveness of a treatment. In recent repeatability studies, the most common statistical methods for continuous data are the Bland-Altman method and the intra-class correlation method, and each of them serves a different role in describing the level of repeatability (Lee, 1992; Rankin and Stokes, 1998). Although other some statistical methods such as Pearson s correlation, paired t-test, and coefficient of variation were also used in some repeatability studies, the inappropriateness of using these statistical methods in the analysis of repeatability has been highlighted (Streiner et al., 2008; Riddle et al., 1989; Brennan and Silman, 1992; Altman and Bland, 1983; Patton et al., 2006). 54
55 Bland and Altman (1983) firstly proposed the use of the Limits of Agreement (LoA) in analysis of reliability, and this LoA technique can be represented using a scatter plot. This technique is executed by firstly calculating the mean and the difference for each pair of measurements that are being compared, and then plotting the mean of the pair on the x axis against its corresponding difference on the y axis. Finally, an additional three lines parallel to the x axis are added to make this scatter plot informative. One is the mean difference of all the pairs. The other two are the upper and lower LoA showing the interval within which 95% of the differences between the measurements are expected to lie. The upper and lower LoA are calculating by the mean difference ± 1.96 standard deviations, respectively. The LoA technique has been adopted by many scientific researchers because this plot allows data to be interpreted visually from seeing the magnitude and range of the differences in measurements, and seeing any relation between the magnitude of the differences and the magnitude of the mean (Rankin and Stokes, 1998). A good reliability in a Bland-Altman plot is indicated by a mean difference close to 0 and 95% LoA as narrow as possible (Johns et al. 2004). A measure derived from the LoA technique called coefficient of repeatability (COR) is commonly used for easy comparison of repeatability between test methods or between examiners/instruments in recent studies, and it is calculated as the standard deviation of the differences multiplied by 1.96 (Polito et al., 2005; Flint et al., 2000; Shankar et al., 2008; Prakash et al., 2009; Patel et al., 2008; Cebrian et al., 2014). Intra-class correlation coefficient (ICC) is a ratio of between-groups variance to total variance shown in the following equation (Wolak et al. 2012). ICC = S b 2 S b 2 +S w 2 Where S b 2 and S w 2 denote between-groups variance and within-groups variance respectively. 55
56 The ICC is also conceptualized as an overall index of reliability within the interval [0, 1] (Wolak et al., 2012), and an ICC value of 0 indicates a test method is unreliable, and an ICC value of 1 indicates a test method is perfectly reliable (Fleiss, 1986): this single reliability coefficient makes it easy to compare methods (Rankin and Stokes, 1998). A commonly used grading system of ICC to indicate the level of reliability was suggested by Fleiss (1986), and it is defined as ICC < 0.4 denoting poor reliability; 0.4 ICC 0.75 denoting fair-to-good reliability; ICC > 0.75 denoting good-to-excellent reliability. Rouse et al. (2002) also used this grading sytem in their study to evaluate the repeatability of tests on binocular vision functions associated with the diagnosis of CI Inter-session repeatability of computerised measurements Inter-session repeatability is one type of test-retest repeatability assessment (Riddle et al., 1989). For a given test method, the inter-sessional repeatability is assessed by having the test carried out repeatedly by a single examiner under the same conditions in different sessions, and the sessions usually have a time interval that could vary from a couple of minutes to a maximum of 12 weeks in eye-related research (Patel et al., 2011; Patel et al., 2009; Patel et al., 2008; Chen and Lam, 2007; Koozekanani et al., 2000; Kim et al., 2007). Choosing the binocular function measurements with good inter-session repeatability to be used in clinical optometric practice, or research, is particularly important when optometrists need to judge whether a change found after treatment is the effect of the treatment itself or it is just the random variation of repeated measurements because of the measurement tools used (Rouse et al., 2002). In terms of the inter-session repeatability, the automatic measurements of binocular visual functions made by computer program are expected to be more repeatable than traditional measurements due 56
57 to removing one possible source of variability (i.e. the examiner) (Feldman et al., 1989; Feldman and Cooper, 1980). There have been some studies investigating the inter-session repeatability of such computerised measurements on binocular vision functions (Han et al., 2010; Capó-Aponte et al., 2012; Ma et al., 2013; Feldman et al., 1989; Erickson et al., 2011). Among these repeatability studies, one of them suggested the repeatability differed for different visual functions (Erickson et al., 2011), and most of them reported that the computerised measurements were repeatable over sessions (Han et al., 2010; Capó-Aponte et al., 2012; Ma et al., 2013; Feldman et al., 1989). However, there were weaknesses in these studies. For example, the results of a traditional test acting as a comparison standard were not reported (Capó-Aponte et al., 2012), or sample size was small (n = 2) (Han et al., 2010). In other studies, an inappropriate statistical method was used on analysing test-retest measurements (Feldman et al., 1989), and individuals with strabismus were included (Ma et al., 2013). Therefore, a well-designed study is needed to explore the reliability of the computerised methods of measuring binocular visual functions, compare this to traditional methods Aim of this study This study aimed to investigate the inter-session repeatability of a computer program called Binocular Vision Assessment (BVA) (HTS Inc., USA: which is commercially available and allows many binocular vision functions to be measured in a single package. It could then be determined whether the computer measurement could act as a reliable assessment tool for a clinical trial which include several follow-up visits assessing effectiveness of treatments for binocular anomalies. There are two objectives in this study. Firstly, this study assessed inter-session repeatability of the computerised measurements on near phoria, near fusional vergence and accommodative facility, and they are compared with the inter-session 57
58 repeatability of equivalent traditional measurements that were commonly used in clinical practice. Secondly, this study also examined how the computerised measurements agreed with the traditional measurements of near phoria, near fusional vergence and accommodative facility. 2.2 Methods Subjects Thirty-six healthy adults aged between 18 and 35 years, with good vision and no academic background relating to clinical investigations in optometry, were recruited from the students and staff members of University of Manchester by advertisement via the university intranet between June and December The subjects were excluded if they had visual acuity with their habitual correction less than 6/9 in either eye at distance, or strabismus, after screening with a visual acuity test and a cover test. All the testing procedures carried out on the subjects in this study were approved by the Committee on the Ethics of Research on Human Beings at the University of Manchester (project number: 12048) Test procedures Each subject was required to attend two study visits with one week interval between visits. The evaluation tests were conducted with his/her habitual distance correction if prescribed. Figure 2.1 shows the sequence of computerised and traditional tests in the two visits. The evaluation tests in the second visit were conducted as in the first visit. The time interval of one week between visits was chosen because it was considered to be long enough as a wash-out period to minimize the possibility 58


59 of significant learning effects from repeated measurements among sessions (Antona et al., 2008), but it was short enough to assume no ageing change affecting the ocular status in research subjects. Half of the subjects assigned with odd numbers received the computerised tests first and then traditional tests, and for the other half of the subjects with even numbers received traditional tests and then computerised tests. The assignment of the subject number was based on chronological order that subjects came for the first study visit. All of the tests in this study were conducted by a single examiner. For each subject, the examiner did not view his/her test results from the first visit during the time period from the end of their first visit to the end of their second visit. Figure 2.1 Sequence of the evaluation tests in two sessions. 59
60 2.2.3 Computerised testing The HTS BVA computerised testing was set up and carried out as described in the testing manual of BVA for measuring the horizontal dissociated phoria, horizontal fusional vergence and accommodative facility at a testing distance of 40 cms. Before the computerised testing started, one practice run of each computerised test was given to make the subjects familiar with what they needed to do during testing. This was to avoid having a poor test result due to unfamiliarity with operation. A single laptop with a 14-inch screen (Dell Latitude E6420) was employed to perform all computerised testing. During each test, the subject wore a pair of glasses with a red (~630 nm) filter in front of the red eye and a blue (~440 nm) filter in front of left eye (Figure 2.2a) over his/her habitual distance correction whilst completing the tasks presented by the HTS BVA program. The procedures of each computerised test are described in detail in the following paragraphs. 60
 Transmission curves of the red and blue glasses. Upper graph: red; lower graph: blue.")

61 Figure 2.2 Auxiliary lenses used in HTS BVA computerised testing. (a) A pair of red and blue glasses. (b) A lens holder with a -1.50D lens for the left eye and a +1.50D lens for the right eye for measuring accommodative facility only. (c) Transmission curves of the red and blue glasses. Upper graph: red; lower graph: blue. Near phoria was measured by the computerised program by the subject completing a matching task of a red cross and a blue box (Figure 2.3). The subject was instructed to move the red cross by manipulating arrow keys and press enter the button to end this matching task when he/she thought the red cross was exactly fitted onto a black cross in the blue box located in the centre of the screen. This allowed the type and magnitude of dissociated phoria at near to be detected and recorded by the computerised program (Figure 2.4). Negative values indicate exophoria, and positive values indicate esophoria. 61


62 Figure 2.3 Computerised dissociated phoria testing. (a) The subject s task was to move the upper-left cross in red into the central box in blue by operating arrow keys. During testing, the red-blue glasses worn by the subject made the red cross be seen only by the right eye and the blue box be seen only by left eye. (b) The subject ended this task by pressing Enter button when he/she saw the red cross perfectly fitted into the blue box. These two images were screenshots when the near phoria was measured by HTS BVA screening testing. Source: Figure 2.4 Examples of two test results for computerised dissociated phoria testing. (a) Esophoria: 8.78 esophoria. (b) Exophoria: The actual images were captured when the subject ended this matching task (left panel). The results were recorded and displayed by the computerised program (right panel). The pass/fail classifications were not analysed in this study. These two images were screenshots when near phoria was 62
63 measured by HTS BVA screening testing. Source: Horizontal fusional vergence at near was measured by the computerised program whilst the subject performed a search task to find out where a stereoscopic square was in a series of random dot stereograms with different fusional vergence demands (Figure 2.5). The subject was instructed to always fixate at a letter located in the centre of each stereogram and use the 4 arrow keys of up, down, right and left to identify the position of a small square popping out from the laptop screen, when it was seen i.e. this square only appeared in the positions that were either up, down, right or left of the central letter. Base-in fusional vergence (divergent ability) was always measured first and it was immediately followed by base-out vergence (convergent ability). This was achieved by making the stereograms with uncrossed fusional stimuli (Figure 2.5a) come before those with crossed fusional stimuli (Figure 2.5b). During testing, the amount of uncrossed fusional stimulus was progressively increased step-wise. This increase stopped once two consecutive incorrect responses were received, and the final stimulus with the correct response was recorded as the base-in break point. Then it was immediately followed by decreasing the amount of stimulus. This decrease stopped after three consecutive correct responses were received and final stimulus with correct response was recorded as the base-in recovery point. Finally, the same procedure was carried out on stereograms with crossed fusional stimuli to determine the base-out break point and recovery point. The measurement limit was 49. Figure 2.6 shows an example of fusional vergence result recorded by the computerised program. A break point measurement result of 50 was assigned for subjects who had not reached the break point by the measurement limit of 49 in the computerised fusional vergence test. The recovery point could not be found for those subjects who were assigned a break point value of 50 so they were treated as missing data in the following statistical analyses of the recovery point part. 63

 Crossed fusional vergence stimuli for measuring base-out/convergent fusional vergence to determine the break point followed by the recovery point.")
64 Figure 2.5 Computerised fusional vergence testing at near. The subject s task was to look for a stereoscopic square in each random-dot stereogram with different fusional vergence demand while red/blue glasses were worn. (a) Uncrossed fusional vergence stimuli for measuring base-in/divergent fusional vergence to determine the break point and the subsequent recovery point. (b) Crossed fusional vergence stimuli for measuring base-out/convergent fusional vergence to determine the break point followed by the recovery point. These two images were screenshots when fusional vergence was measured by HTS BVA screening testing. Source: Figure 2.6 Example of test result of computerised fusional vergence testing. The pass/fail classifications were not analysed in this study. This image was a screenshot when fusional vergence was measured by HTS BVA screening testing. Source: Accommodative facility was measured by the computerised program when the subject performed a task responding to the direction of Landolt letter Cs presented by the program. Accommodative targets of firstly four red, and then four blue Landolt letter Cs, were alternately displayed acting as a 64
65 fixed accommodative stimulus of 2.50 D due to the fixation distance of 40 cms (Figure 2.7b). During testing, the subject viewed through a lens holder with RE and LE D lenses (Figure 2.2b) held over the red/blue glasses (Figure 2.7a), which allowed the monocular accommodative stimuli of 1.00 D and 4.00 D to be alternately produced for the subject s right eye and left eye, respectively. The subjects were instructed that this was a timed task and the task is to respond to the direction of each letter c starting from right side to left side as soon as the letter c is seen clearly by clicking the corresponding arrow keys of up, down, left and right until the task automatically ended. The test ran for one minute. The size of each Landolt c is 6/24 reduced Snellen. Similar to the traditional testing of accommodative facility using lens flipper, the subject relaxed and activated accommodation by overcoming the additional accommodative stimuli produced from plus lenses and minus lenses. However, an exceptional feature is that the computer program measured the accommodative facility of right eye being responsible for relaxing accommodation and left eye being responsible for activating accommodation under binocular viewing. Therefore, the computerised measurement was considered as a monocular accommodative facility in binocular condition. Figure 2.8 shows a test result of accommodative facility as recorded by the computerised program, with the outcome displayed as average cycles per minute. The average cycles per minute is converted from the average response time. The computer program only uses the time from the response to the last red Landolt c to the response to the first blue Landolt c in the next screen (response time to accommodation relaxation); and the time from the response to the last blue Landolt c to the response to the first red Landolt c in the next screen (response time of accommodation stimulation) over one minute. A test result of correct letter recognition equal to at least 80 % in each eye was considered as reliable according to the testing manual. 65


66 Figure 2.7 Computerised accommodative facility testing: (a) testing in progress; (b) red and blue accommodative targets of Landolt c alternately changed during testing. The two monocular accommodative stimuli seen in binocular condition were achieved during testing because the red targets of Landolt c were only seen by the subject s red eye with a red filter and a D lens and the blue target of Landolt c were only seen by the subject s left eye with a blue filter and a D lens under binocular viewing. Figure 2.8 A result of computerised accommodative facility testing. Data of pass/fail were not analysed in this study. This image was a screenshot when fusional vergence was measured by HTS BVA screening testing. Source: The ambient illumination was not specified in the test manual. Therefore, dim room lighting (illuminance: lux) was used to minimize the reflection of room lights from the laptop screen 66
67 affecting the fixation of accommodative targets. In the two evaluation sessions, the examiner only viewed and recorded the result of computerised measurements shown from the computer program after completion of all traditional testing. In addition, target luminance is not described in the HTS program manual. In the HTS BVA accommodative facility testing, the luminance of the red targets was 27.2±0.4 cd/m 2 and the luminance of the blue targets was 22.1±0.4 cd/m 2 when the luminance measurements were carried out by Hagner photometer. A full investigation of the target effects on accommodation is shown in Chapter Traditional testing The horizontal dissociated phoria, horizontal fusional vergence and accommodative facility were measured by the modified Thorington phoria test, the step fusional vergence test and the flipper accommodative facility test, respectively, with the same testing distance of 40 cms as the computerised testing. The modified Thorington phoria test measured the direction and magnitude of horizontal phoria using the Bernell Muscle Imbalance Measure (MIM) card as this was recommended by several authors for its simplicity, control over accommodation and high reliability and repeatability (Schroeder et al., 1996; Rainey et al., 1998). During the measurement, a white light spot placed behind the MIM card was seen through a small hole in the centre of the horizontal number scale on MIM card, and a red Maddox rod with the grooves oriented horizontally was introduced in front of the subject s right eye to make the light spot be seen as a vertical red line. The subject was instructed to view at the white light and to report which number on the horizontal scale was crossed by the red vertical line and to which side the red line appeared (left side of the white light or right side of the 67
68 white light). If the subject reported that this vertical line was travelling between some numbers, the subject was instructed to close both eyes and give the first number passed by the red vertical line when opening the eyes. The subject was also reminded to keep the scale on the MIM card clear all the time. The number crossed by the line indicated the magnitude of the phoria and the side where the line stayed indicates the type of phoria. Exophoria was recorded as a negative number, and esophoria was recorded as a positive number. The step fusional vergence test measured base-in and base-out fusional vergence using a prism bar introduced over the subject s right eye. A fixation target using a single letter with the size one line larger than subject s best VA on a budgie fixation stick was placed at 40 cms in front of subject s eye for accurate accommodation and fixation. Base-in fusional vergence was always measured before base-out fusional vergence, as it was in the computerised testing. During the base-in fusional vergence measurement, the subject was instructed to look at the near target and the power of base-in prism was gradually increased by step until double was noted and this measure was the break point. Then the power of base-in prism was decreased until single vision was gained and this measure was the recovery point. This procedure was repeated for the base-out fusional vergence with a change in the base of prism on the prism bar. Each step of prism power was consistently changed after approximately 2-3 seconds (Scheiman and Wick 2008; Goss and Becker, 2011). The prism bar had the powers in the following steps: 1, 2, 4, 6, 8, 10, 12, 14, 16, 18, 20, 25, 30, 35, 40, and 45. If the subjects did not report double before 45 of prism was introduced, another prism bar was introduced on the subject s left eye to increase the prism power from 46 to 90 until the break and recovery point was determined. However, for subsequent analyses a break point of 50 and no recovery point (i.e. missing data for the recovery point) were used if the subjects had a break point over 49. This was done to match the measurement limit to that of the computerised fusional 68
69 vergence testing for fair comparison. In order to match with the computerised test, accommodative facility was measured with a traditional lens flipper of ± 1.50 D (one pair of D lenses and one pair of D lenses) used alternately under binocular conditions. The same size of accommodative target (6/24 reduced Snellen) was used as the computerised testing. This accommodative target was a single letter c attached on a tongue depressor placed at 40 cms in front of the subject s eyes. The subject was instructed: "please look at the letter c and say now as soon as the letter c becomes clear while a pair of lenses is introduced in front of your eyes and this will repeated for one minute". The two pairs of lenses were flipped at a consistent speed by the examiner. The number of full cycles completed in the time was counted by the examiner and recorded as the numbers of cycles per minute (cpm). A full cycle included clearing plus lenses once and clearing minus lenses once. The ambient illuminance was maintained at lux for all the traditional testing Statistical analysis Descriptive statistics of mean, median, standard deviation and range were used to report the central and deviated tendency of each measurement. Distribution of each measurement was checked for normality by the Shapiro-Wilk test. Paired t-tests were used to examine the statistical difference of the mean measurements between sessions and between methods when the measurements were distributed normally. The paired t-tests were replaced by Wilcoxon signed-rank tests if the measurements were not distributed normally. The significance level was set as p < 0.05 (two-tailed). Inter-session repeatability was assessed by the Bland and Altman analysis using coefficient of 69
70 repeatability (COR), intra-class correlation coefficient (ICC), and median of absolute difference (MAD) for each computerised measurement. The same analyses were carried out for the corresponding measurements taken by the traditional method. The COR was calculated as 1.96 x standard deviation of differences between two evaluation sessions, and the lower COR indicates the better inter-session repeatability (Antona et al., 2008). The COR was substituted by the 95 th percentile of the absolute values of the differences if differences between sessions were not normally distributed (Antona et al., 2008). The ICC was computed as a two-way random effects model (Rouse et al, 2002). The MAD is a median measure of absolute differences between two evaluation sessions and it gives an idea of a typical difference between two measurement sessions no matter if the distribution of differences is normal or not normal (Rouse et al., 2002). Bland-Altman plots with the difference versus the mean of two evaluation sessions (Bland and Altman, 1986) are shown only when the data points were not evenly distributed in the scatter plot and the mean difference line showed a specific trend. The interpretation of ICC: ICC < 0.4 indicates poor reliability; 0.4 ICC 0.75 indicates fair-to-good reliability; ICC > 0.75 indicates good-to-excellent reliability. Agreement between methods was also assessed by the Bland and Altman analysis, using coefficient of agreement (COA), ICC, and MAD. The COA was calculated as 1.96 x standard deviation of differences between methods, and a lower COA indicates a better agreement between methods. The same substitution of COA as COR was conducted if differences between methods were not normally distributed. The computation and interpretation of ICC between methods for agreement assessment is the same as inter-session repeatability. The MAD between methods is a median measure of absolute differences between two methods. 70
71 All data analyses were performed by SPSS, version 22.0 (SPSS Inc., USA). A sample size of 33 subjects was selected for this study. This number of 33 came from 30 subjects based on the sample size estimation plus an estimate of 10% subjects loss for the second study visit (30 x 10 % = 3). The sample size estimation was run by G*power (Faul et al., 2009) when the effect size of correlation coefficient (r), α and β was set as 0.5, 0.05 and 0.2 to test the hypothesis of having just a fair level of correlation (H o : r =0.50 at the 0.05 level of significance) and have 80% power to reject the alternative hypothesis that repeated measurement has excellent correlation, r = 0.80 (Hulley et al and Rouse et al., 2002). 2.3 Results Profile of research subjects Of 36 subjects screened, 33 subjects passed the initial screening tests and were recruited into this study and each of them attended both evaluation sessions without loss to follow-up. The other 3 subjects were excluded because one had intermittent esotropia and the other two had poor distance visual acuity of less than 6/9 with habitual correction in one eye or both eyes. The median of time interval between evaluation sessions was 7 days with a range from 6 days to 14 days, and the time interval was 6, 8, 8, 8 and 14 days for the 5 subjects whose time interval was not 7 days. These 33 subjects had the mean age of 27.13±3.80 years and 33.3 % of subjects were male (n=11). Thirty two subjects were students and the other subject was a staff member of the university. A total of 78.8 % (n=26) of the subjects had monocular visual acuity with their habitual correction equal to 71

72 or better than 6/6 in both eye at distance. All the 33 subjects had good monocular visual acuity at near ( 6/7.5) in both eyes with their habitual correction. The percentage of subjects who had exophoria, orthophoria and esophoria at near was 72.7 %, 12.1 % and 15.2 %, respectively in prism cover tests carried out in the initial screening. The distribution of the near horizontal heterophoria status of research subjects is shown in Figure 2.9. In addition, none of the subjects had vertical phoria observed in this test. Figure 2.9 Distribution of near heterophoria measured by the prism cover tests. pd: prism dioptre Dissociated horizontal phoria at near Table 2.1 shows the summary of descriptive statistics on dissociated phoria measured by the computerised and traditional methods. The difference between the mean dissociated phoria at the 72
73 two sessions was not significant in either the computerised or traditional measurement (p=0.513 and 0.461, respectively). In addition, the computerised test had the mean phoria (-1.03 Δ in Session 1) closer to orthophoria than traditional test (-2.32 Δ in Session 1). Furthermore, the ranges of phoria detected by the computerised method (~ 8 Δ) were narrower than those detected by the traditional method (~ 25 Δ) in the same population. Interestingly, there was 39 % of subjects (n=13) who measured as orthophoria by computerised testing both at Session 1 and Session 2, but none of the subjects were orthophoric in the traditional test. Table 2.1 Descriptive data of near dissociated phoria measured by computerised and traditional methods in two independent evaluation sessions, one week apart. Near dissociated phoria testing (n = 33) Mean ± S.D. (Δ) Mean difference of (S2-S1) ± S.D. Median (Range) (Δ) Session 1 Session 2 ( ) Session 1 Session 2 Computerised method a ± ± ± 1.66 Traditional method b ± ± ± (-7.0 to 0.8) (-14.0 to 12.0) 0.00 (-7.5 to 0.8) (-12.0 to 12.0) a: HTS BVA phoria test; b: modified Thorington phoria test. S.D: standard deviation; S: session; Δ: prism dioptre. Negative values indicate exophoria and positive values indicate esophoria. *Note: none of the mean differences showed statistical significance (all p 0.05). Table 2.2 summarizes the inter-session repeatability measures for near dissociated phoria testing. The results from COR and MAD indicate the computerised method had more consistent phoria measures between sessions than the traditional method because the COR and MAD of computerised method were 3.64 Δ and 0.52 Δ lower than those of traditional method, respectively. However, a Bland-Altman plot (Figure 2.10) reveals that the computerised method had narrower range of average phoria measurements (5 Δ exo to 5 Δ eso) than the traditional method (15 Δ exo to 15 Δ eso). In addition, the ICC analysis provided a contradictory finding to COR analysis on assessing the 73
74 repeatability level of the phoria measurements. An ICC of 0.64 by the computerised method indicated a fair inter-session repeatability on repeated phoria measurements, but an ICC of 0.94 by the traditional method indicated an excellent inter-session repeatability. Table 2.2 Inter-session repeatability of near horizontal dissociated phoria measurements. Test Method COR ( ) ICC (95 % CI) MAD ( ) Computerised a (n = 33) 3.64 # 0.64 ( ) 0.52 Traditional b (n = 33) ( ) 1.50 a: HTS BVA dissociated phoria test; b: Modified Thorington phoria test; COR: coefficient of repeatability that is 1.96 times the standard deviation of the session differences; ICC: intra-class correlation coefficient; MAD: Median absolute difference of the session differences; : prism dioptres; CI: confidence interval. In case that the COR is denoted with #, the COR is replaced by the 95 th percentile of the absolute differences. 74
75 (a) Computerised phoria testing (b) Traditional phoria testing Figure 2.10 Bland-Altman plots showing the near dissociated phoria measurements with the difference vs mean at the two sessions: (a) Computerised testing (n = 33); (b) Traditional testing (n=33). In the plot (a), there were 13 subjects represented on the same black dot with the average and difference value of 0 and 0, respectively. pd: prism dioptres; S: session. The solid line denotes the mean of sessions. The two dotted lines of U and L denote the 95 % limits of agreement (mean ± 1.96 standard deviations). 75
76 The difference was not statistically significant between the mean computerised near phoria measurements and mean modified Thorington near phoria measurements at both sessions (p = at Session 1 and p = at Session 1) (Table 2.1). However, a poor agreement between both methods was noted with both a large COA of Δ and a low ICC of 0.29 in Session 1 (Table 2.3). Similarly, poor agreement was also found in Session 2. In addition, a scatterplot shows that the computerised method tended to have the dissociated phoria measurements consistently close to zero compared to the wide range of phoria values measured by the traditional method for the same subjects (Figure 2.11). Table 2.3 Agreement of near horizontal phoria measurements between the computerised method a and traditional method b in Session 1 and 2. Session (n = 33) COA ( ) ICC (95% CI) MAD ( ) (-0.04 to 0.57) (-0.07 to 0.56) 4.00 a: HTS BVA phoria test; b: Modified Thorington phoria test. : prism dioptres; COA: coefficient of agreement; ICC: intra-class correlation coefficient; CI: confidence interval; MAD: Median of absolute difference between sessions. 76
77 Figure 2.11 Scatterplot of near dissociated phoria measured by the traditional method (modified Thorington method) against the computerised method in Session 1. Positive sign: esophoria. Negative sign: exophoria. The diagonal line denotes the line of prefect agreement between methods. Δ: prism dioptre Near horizontal fusional vergence Table 2.4 shows the summary of descriptive statistics regarding near fusional vergence measured by the computerised and traditional methods. The mean near fusional vergence parameters measured by the computerised method were not significantly different between Session 1 and Session 2, except for BI break. In computerised BI break, the mean of Session 2 (13.55 ± 5.92 Δ) was statistically significantly lower than that of Session 1 (15.55 ± 5.92 Δ) (p = 0.008). In terms of the measurement limit of 49 Δ, none of the subjects had BI break measured by the computerised method or traditional method that reached this limit in either session 1 or session 2. However, it was found that almost half of the subjects (45.5%, n = 15) had the BO break over than the limit of 49 Δ in in the computerised method in at least one of the two sessions, and the percentage in the traditional method was 18.2% (n = 6). It is not possible for these subjects therefore to determine a "recovery" point. 77
78 Table 2.4 Descriptive data of near horizontal fusional vergence measured by computerised and traditional methods in two independent evaluation sessions. Near fusional vergence testing Mean ± S.D. (Δ) Mean difference of (S2-S1) ± S.D. Median (Range) (Δ) Session 1 Session 2 ( ) Session 1 Session 2 Computerised method a BI break (n=33) ± ± ± 4.06* BI recovery (n=33) 8.15 ± ± ± 3.76 BO break (n=33) ± ± ± BO recovery (n=18) ± ± ± Traditional method b ( ) 7.00 ( ) ( ) 6.00 ( ) ( ) 8.00 ( ) ( ) ( ) BI break (n=33) ± ± ± ( ) ( ) BI recovery (n=33) ± ± ± ( ) ( ) BO break (n=33) ± ± ± ( ) ( ) BO recovery (n=27) ± ± ± ( ) ( ) a: HTS BVA fusional vergence test; b: Step fusional vergence; S.D.: standard deviation; S: session; BI: base-in; BO: base-out; : prism dioptre; *: p < Table 2.5 summarizes the statistics on assessing inter-session repeatability of near fusional vergence measured by the computerised and traditional method. In the computerised method, the COR of BI fusional vergence (9.02 and 9.37 Δ in the break and recovery points) were much lower than the COR of BO fusional vergence (25.80 and Δ in the break and recovery points). The lower COR of the BI fusional vergence than the BO fusional vergence was also found in the traditional method. In terms of ICC analysis, ICCs were found to be generally higher in the BI than BO fusional vergence measurements, but an exception was the ICC of computerised BO break. The computerised BO break measurements had good ICC of which was the highest among the four measurements of the computerised fusional vergence, but it also presented the greatest variability among the four measurements of the computerised fusional vergence with COR of Δ. The MAD ranged from 78
79 2.00 Δ to 4.00 Δ in the computerised fusional vergence measurements. Table 2.5 Inter-session repeatability on near fusional vergence measured by the computerised and traditional method. Fusional vergence tests COR ( ) ICC (95% CI) MAD ( ) Computerised method a BI break (n = 33) (0.473 to 0.863) 4.00 BI recovery (n = 33) (0.439 to 0.827) 2.00 BO break (n = 33) # (0.635 to 0.896) 2.00 BO recovery (n = 18) # (0.294 to 0.854) 3.50 Traditional method b BI break (n = 33) 9.20 # (0.348 to ) 2.00 BI recovery (n = 33) 9.60 # (0.254 to 0.748) 2.00 BO break (n = 33) # (0.264 to 0.748) 5.00 BO recovery (n = 27) ( to 0.568) 7.00 a: HTS BVA fusional vergence test; b: Step fusional vergence test. COR: coefficient of repeatability that is 1.96 times the standard deviation of the session differences; ICC: intra-class correlation coefficient; MAD: Median absolute difference of the session differences; : prism dioptres; CI: confidence interval; BI: base-in; BO: base-out. In cases where the COR is denoted with #, the COR is calculated as the 95th percentile of the absolute differences. Since the computerised method failed to detect the base-out break point in near fusional vergence for nearly half of the subjects, a further analysis of inter-session repeatability was carried out on the 18 subjects who had the computerised base-out break points under or equal to the measurement limit of 49 Δ in both sessions (Table 2.6). Although the COR from the 18 subjects in the base-out break fusional vergence was the same as the COR from the total subjects, the ICC decreased to indicating fair-to-good repeatability in 18 subjects from ICC of indicating good-to-excellent repeatability in the total subjects. In addition to ICC, the MAD showing typical difference between sessions also increased from 2.00 Δ to 6.50 Δ in the computerised method when the subjects whose break point was over the measurement limit of 49 were not counted in the analysis (n = 15). 79
80 However, these obvious changes of the ICC and the MAD in the computerised method were not found in the traditional method between the total subjects (n = 33) and the subjects (n = 27) who had the base-out break point within the measurement limit. Table 2.6 Comparison of Inter-session repeatability on near fusional vergence between the total subjects and the subjects who had the base-out break point less than or equal to the measurement limit of 49 Δ. Fusional vergence tests COR ( ) ICC (95% CI) MAD ( ) Computerised method a BO break (n = 33) c # (0.635 to 0.896) 2.00 BO break (n = 18) d (0.270 to 0.848) 6.50 Traditional method b BO break (n = 33) c # (0.264 to 0.748) 5.00 BO break (n = 27) d (0.088 to 0.705) 5.00 a: HTS BVA fusional vergence test; b: Step fusional vergence test. c: the total subjects. d: the subjects who had the base-out break point less than or equal to the measurement limit of 49 Δ. COR: coefficient of repeatability that is 1.96 times the standard deviation of the session differences; ICC: intra-class correlation coefficient; MAD: Median absolute difference of the session differences; : prism dioptres; CI: confidence interval; BI: base-in; BO: base-out. In case that the COR is denoted with #, the COR is calculated as the 95th percentile of the absolute differences. Table 2.7 summarises the statistics of the agreement between methods on the measurements of near horizontal fusional vergence. In Session 1, the COA between methods was Δ and Δ for the BI break and recovery, respectively, and the COA between methods was up to and Δ for the BO break and recovery, respectively. Similarly, the MAD between methods was 5.00 and 6.00 Δ in the BI break and recovery, respectively, and the MAD between methods was up to and Δ in the BO break and recovery, respectively. In addition, the ICCs of these fusional vergence measurements were all lower than 0.3, which suggests poor agreement of fusional vergence measurements between the computerised and traditional methods. The above findings from Session 1 were similar to those in Session 2. 80
81 Table 2.7 Agreement of near fusional vergence measurements between computerised method a and traditional method b in Session 1 and 2. Session Near fusional vergence COA ( ) ICC (95% CI) MAD ( ) BI break (n = 33) ( to 0.495) BI recovery (n = 33) ( to 0.430) 6.00 BO break (n = 33) ( to 0.533) BO recovery (n = 21) ( to 0.509) BI break (n = 33) ( to 0.546) BI recovery (n = 33) (0.096 to 0.422) 7.00 BO break (n = 33) ( to 0.460) BO recovery (n = 17) ( to 0.446) a: HTS BVA phoria test; b: Step fusional vergence test; COA: coefficient of agreement; ICC: intra-class correlation coefficient; CI: confidence interval; MAD; mean absolute difference; : prism dioptre; BI: base-in; BO: base-out. In case that the COA is denoted following with #, the COA is replaced by the 95th percentile of the absolute differences Accommodative facility A total of 3 (9.1 %) subjects had unreliable test results in one of their eyes with less than 80% correct responses in the computerised measurement of accommodative facility. The unreliable results occurred for the right eye for 2 subjects and for the left eye for 1 subject in Session 1. It was the same for these 3 subjects in Session 2. These 3 subjects were excluded from the following analyses of computerised accommodative facility testing. Table 2.8 shows the summary of descriptive statistics for accommodative facility measured by the computerised and traditional methods. The mean accommodative facility increased from Session 1 to Session 2 in both the computerised and the traditional method, but only the mean increase of 2.60 ± 4.88 cpm found in the computerised method was significant (p = 0.007). The mean accommodative facility measured by the computerised method was lower than that measured by the 81
82 traditional method in both Session 1 and Session 2. Table 2.8 Descriptive data of accommodative facility measured by computerised and traditional methods in two independent evaluation sessions. Accommodative facility testing Mean ± S.D. (cpm) Mean difference of (S2-S1) ± S.D. Median (Range) (cpm) Session 1 Session 2 (cpm) Session 1 Session 2 Computerised method a (n = 30) ± ± ± 4.88* ( ) ( ) Traditional method b (n = 33) ± ± ± ( ) ( ) a: HTS BVA accommodative facility test; b: flipper accommodative facility test; S.D: standard deviation; S: session; cpm: cycles per minute. *: p < Table 2.9 summarizes the statistics on assessing inter-session repeatability of accommodative facility measured by the computerised and traditional method. The test-retest results of accommodative facility were more variable in the computerised method than in the traditional method because the COR of 8.39 cpm in the computerised method was higher than that in the traditional method and the ICC of in the computerised method was lower than the traditional method. The typical difference between sessions in the computerised (MAD = 2.69 cpm) was also greater than the traditional method (MAD = 2.00 cpm). Table 2.9 Inter-session repeatability assessments on accommodative facility measured by the computerised and traditional methods. Accommodative facility testing COR (cpm) ICC (95% CI) MAD (cpm) Computerised method a (n = 30) 8.39 # (0.251 to 0.783) 2.69 Traditional method b (n = 33 ) (0.631 to 0.896) 2.00 a: HTS BVA accommodative facility test; b: flipper accommodative facility test. COR: coefficient of repeatability that is 1.96 times the standard deviation of the session differences; ICC: intra-class correlation coefficient; MAD: median absolute difference between the sessions; cpm: cycles per minute; CI: confidence interval. When the COR is denoted with #, the COR is calculated as the 95th percentile of the absolute differences. Table 2.10 summarizes the statistics of the agreement between methods on the measurements of 82
83 accommodative facility. The poor agreement between methods was found with the high COA up to cpm and the low ICC of in Session 1. This poor agreement was similar in both Session 1 and Session 2. The typical difference between methods on the measurement of accommodative facility was also up to 5.01 cpm. Table 2.10 Agreement of accommodative facility measurements between the computerised method a and traditional method b in Session 1 and 2. Session COA (cpm) ICC (95% CI) MAD (cpm) 1 (n = 30) # ( to 0.470) (n = 30) ( to 0.383) 3.85 a: HTS BVA accommodative facility test; b: flipper accommodative facility test; COA: coefficient of agreement; ICC: intra-class correlation coefficient; CI: confidence interval; MAD; mean absolute difference; cpm: cycles per minute. In case that the COA is denoted following with #, the COA is replaced by the 95th percentile of the absolute differences. 2.4 Discussion Having reliable assessment tools to use in evaluating the progress of treatment of binocular anomalies is necessary to ensure that the error involved in measurement is small enough to detect actual changes in what is being measured. Therefore, this study assessed how repeatable the binocular vision functions measured by the computerised methods and the traditional methods were in the repeated measurements of two sessions which were one week apart. The computerised measurements of accommodative facility demonstrated poorer inter-session repeatability (i.e. higher COR, lower ICC and higher MAD) than the corresponding traditional measurements. The computerised measurements of near dissociated phoria and near fusional vergence showed similar level of inter-session repeatability with the corresponding traditional measurements. Since there is no measure without disadvantages on describing inter-session repeatability, the repeatability analysis of COR, ICC and MAD were presented together in this chapter for giving a 83
84 comprehensive understanding of the variability of repeated measurements. For example, the COR and MAD was 8.39 cpm and 2.69 cpm for the inter-session repeatability of the accommodative facility measured by the computerised method (Table 2.9). This means the difference between accommodative facilities taken one week apart might possibly be as large as ~8.5 cpm, and it might typically differ by ~3.0 cpm. In the same computerised measurements of accommodative facility found in this study, the ICC of 0.58 means the percentage of within-subject variability is 42% (100% minus 58%) in total variability when measurements were repeated in different sessions (Table 2.9). Regarding inter-session repeatability, the within-subject variability of replicate measurements is clinically relevant to clinical researchers and practitioners because the lower within-subject variability indicates the better inter-session repeatability when the total variability in replicate measurements is classified to within-subject variability and between-subject variability Furthermore, in comparison to the traditional method, the accommodative facility measured by the computerised method was considered as having poorer inter-session repeatability because of a consistent trend showing that the computerised method had greater intra-subject variability of replicate measurements owing to its higher COR and lower ICC than the traditional method in this study (Table 2.9). However, the analyses of ICC did not always give an equivalent result to the analyses of COR, when judging whether one test method is more repeatable than the other test method in this study. Here are two examples. The first one is the inter-session repeatability analyses of near dissociated phoria. The computerised method and traditional method (the modified Thorington method) had similar COR (3~4 ) suggesting a similar level of inter-session repeatability, but the computerised method had ICC of 0.64 indicating only fair-to-good inter-session repeatability when comparing to the traditional method having an ICC of 0.94 indicating excellent inter-session repeatability. A possible explanation of different results between COR and ICC in the repeated measurements of near dissociated phoria is that the between-subject variability might be 84
85 significantly under-estimated by the computerised method because Table 2.1 shows the standard deviation of group mean in the computerised method (~2 Δ) was only one third that of the traditional method (~6 Δ), and the range of phoria distribution in the computerised method (~8 Δ) was also only one third of that the traditional method (~24 Δ). It appears that the within-subject variability was similar in both the computerised and the traditional methods, but the ICC of the computerised phoria measurements is decreased because the between-subject variability in the computerised method was much lower than the traditional method. The reason for the low between-subject variability might be that the red-blue glasses used in the computerised method did not dissociate the two eyes adequately, and this led to orthophoria being recorded in over one third of the study population (Figure 2.10). A second example of different results between ICC and COR is the computerised measurements of the base-out break point in near fusional vergence. Again, in the inter-session repeatability analyses of near fusional vergence measurements, the computerised method and traditional method (the modified Thorington method) had similar COR (~25 ) indicating a similar level of inter-session repeatability, but the computerised method had ICC of 0.80 indicating good-to-excellent inter-session repeatability when comparing to the traditional method having an ICC of 0.55 which only indicated fair-to-good inter-session repeatability. A possible explanation is that the within-subject variability might be significantly under-estimated by the computerised method because there were up to 15 subjects whose base-out near fusional vergence reached the measurement without breaking fusion (ceiling effect) whereas this occurred in only 6 subjects using the traditional method. Therefore, ICC of the computerised base-out fusional vergence measurements for the break point might be increased when the between-subject variability was similar in both the computerised and the traditional method, but the intra-subject variability in the computerised method was much lower than the traditional method. This plausible explanation is supported by Table 2.6 showing that the 85
86 ICC of the computerised method reaches the same level of just fair-to-good inter-session repeatability as the ICC of the traditional method when the subjects having a break point over the measurement limit were removed from the ICC analyses. Capo-Aponte et al. (2012) also assessed the inter-session repeatability of HTS BVA computerised measurements of binocular vision functions on adults as in the current study. Table 2.11 shows a comparison of COR results in the two studies. A similar COR was found in Capo-Aponte et al. s study and the current study for the near dissociated phoria and the recovery point in near fusional vergence, but the COR of break point in near fusional vergence and accommodative facility was much lower in Capo-Aponte et al. s study (See Table 2.11). The main difference between these two studies is the duration of time interval between sessions. Capo-Aponte et al. carried out repeated measurements with 15 minutes of time interval between sessions, and the current study had a one week time interval between sessions. The higher COR in near fusional vergence for break point and accommodative facility found in the current study suggests that the within-subject variability might be greater when the subject performs the replicated measurements of fusional vergence and accommodative facility on a different day. Table 2.11 Comparison of coefficient of repeatability (COR) of binocular visual functions measured HTS BVA computerised program between the present study and a previous study. Author Present study Study Subject age 27±4 y/o (n = 33) Test-retest 1 x per session/ 2 sessions/ 1 week apart Binocular visual functions Near dissociated Near fusional phoria (Δ) Vergence (Δ) BIB # BIR 7.4 BOB 25.8 # Accommodative facility (cpm) BOR 23.7 BIB 5.0;5.5;4.3 a 1 x per session/ Capo-Aponte 33±9 y/o 3 sessions/ 1.6;1.2;3.0 a BIR 9.2;8.4;7.1 a 5.7;5.0;6.9 a et al., 2012 (n = 40) BOB 13.4;14.0;12.3 a 15 minutes apart BOR 23.3;10.2;21.2 a #: In cases where the COR is denoted with #, the COR is calculated as the 95th percentile of the absolute differences. a: The three CORs indicate Session 1-2, Session 2-3 and Session 1-3, respectively. 8.4 # 86
87 In the current study, the near base-in fusional vergence had better inter-session repeatability (COR: 7.4/9.6 (break/recovery) Δ) than near base-out fusional vergence (COR: 23.7/25.8 Δ), no matter whether the computerised method or the traditional method was used. This finding was supported by a previous repeatability study carried out by Antona et al. (2008) who also undertook the repeated measurements of fusional vergence over one week by two traditional methods on a study population of 61 young adults aged years. The COR of near base-in fusional vergence was 6.6/8.1 Δ and 6.4/7.5 Δ for the traditional method, using a prism bar and a phoropter with rotary prisms to create the vergence stimuli, respectively. The COR of near base-out fusional vergence was 10.2/15.0 Δ and 7.7/16.4 Δ for prism bar method and the phoropter rotary prisms method, respectively. The lower intra-subject variability (smaller COR) observed in base-in fusional vergence compared with base-out fusional vergence, could be because the function of the divergent fusional vergence and convergent fusional vergence might be controlled by different underlying neural mechanisms. Evidence for this comes from patients with brain lesions who have paralysis of one function but not the other (Ciuffreda, 1992; Tannen and Ciuffreda, 1995; Ciuffreda et al., 2006). Regarding the group means between two separate sessions, the mean base-in break point fusional vergence measured by the computerised method showed a significant difference mean decrease by 2.00 Δ at Session 2 compared to Session 1. This suggests a worse performance of fusional vergence at the second visit, but this small change is not considered clinically significant. In contrast, the base-out fusional vergence had mean increase by 4.22 Δ and 2.67 Δ for break and recovery points at Session 2 from Session 1 suggesting an improved performance although this change was not statistically significant. The same pattern of an apparent improved performance occurring in base-out fusional vergence at the second measurement was similar to a previous study carried out by Feldman et al. who used the same computerised random dot stereograms to act as fusional stimuli for test-retest measurements of fusional vergence amplitude (Feldman et al., 1989). Feldman et al. reported that 87
88 the average performance improved by about 3-5 Δ (the numbers was estimated from Figure 6 and 7 shown in this article of Feldman et al.) in base-out fusional vergence at the second measurement which was taken 30 minutes after the first measurement, but whether the improved change reached statistical significance was not shown. Therefore, it might be considered that there is no apparent bias existing in computerised fusional vergence testing between the first and second measurement, although the base-out fusional vergence amplitude seems to have the potential to be improved through repeated practice. The study population in the current study was considered to represent a typical population of young adults when the means of the three binocular visual functions measured by the traditional methods were compared to those in the previous studies using the same methods (see Table 2.12). Although the mean binocular accommodative facility in the current study was higher than those reported by the studies carried out by O Leary and Allen (2001) and Iribarren et al. (2002), this is not surprising because the power of flipper (± 1.50 D) used in the current study was lower than those (± 2.00 D) used in the two previous studies. 88
89 Table 2.12 Comparison of mean and standard deviation of near phoria, near fusional vergence and accommodative facility measured by the same traditional tests used in this present study with previous studies. Authors Present study Study Subjects age (n=33) Near phoria 1 (Δ) Exo 2.3 ± 6.2 Mean ± standard deviation Near fusional vergence 2 (Δ) BIB BIR BOB BOR 18.9 ± ± ± ±9.5 BAF 3 (cpm) 14.7 ± 4.1 Rainey et al., (n = 72) Exo 2.2 ± Casillas & Rosenfield, 2006 (n = 60) Exo 2.4 ± Goss et al., (n = 68) Exo 2.1 ± Sanker et al., (n = 110) Exo 2.7 ± Abraham et al., (n = 50) Exo 2.2 ± Goss et al., (n = 50) ±9.4 ±4.1 ±11.0 ±7.5 - Antona et al., (n = 61) ±3.4 ±3.0 ±9.1 ±6.0 - O Leary & Allen, ± 5.1/ (n = 79) 12.9 ± Iribarren et al., (n = 87) ± 3.5 BAF: binocular accommodative facility. 1: phoria measured by modified Thorington method. 2: fusional vergence measured by step fusional vergence method. 3: BAF measured by flipper method. 4: standard deviation converted from the sample size and standard error provided in study of Casillas et al. (2006). 5: myopia subjects/emmetropia subjects. Overall, the results in this study revealed that most of the binocular vision functions measured by the computerised methods did not show better inter-session repeatability than those measured by the traditional methods. In addition, the functions of base-out fusional vergence and accommodative facility measured by the computerised method were likely to be improved when repeated. Therefore, using such computerised measurements as an assessment tool for monitoring the progress of long-term treatment (eg. vision training) should be undertaken with caution. 89
90 3. A pilot study for design of a randomised clinical trial investigating the effectiveness of computerised vision training as a home-based treatment for convergence insufficiency 3.1 Introduction Convergence insufficiency (CI) is one of the most common binocular anomalies seen in optometric practice, and it is characterised by greater exophoria at near than at distance, receded near point of convergence (NPC), insufficient fusional convergence (base-out fusional vergence, BOFV) at near and low AC/A ratio (Dusek et al., 2011; Scheiman and Wick, 2008). Patients suffering from CI have more symptoms than patients without a binocular anomaly (Borsting et al., 2003; Rouse et al., 2004; Borsting et al., 1999) and the common symptoms of CI are headaches, asthenopia, difficulties with reading or near work and diplopia (Layrich, 2010). However these symptoms may be absent due to a high discomfort threshold, avoidance of near work, suppression or occlusion of one eye during reading (Momeni-Moghaddam et al., 2015). Previous studies have shown that vision training is an effective treatment of choice for CI for the removal of symptoms and improvement of convergence ability (Layrich 2010; Arnoldi and Reynolds 2007; Birnbaum et al., 1999; Scheiman, 2009; Scheiman, 2005; Dalziel 1981). The conventional vision training (also called orthoptic exercises) used in UK optometric practice consists of simple convergence exercises performed by CI patients at home supervised by a family member if needed (Adler, 2002). One of the commonly prescribed home-based eye exercises is Brock string training (BST) (Adler, 2002), and BST is usually carried out by using a long string with three beads located at different distances for achieving better control of binocular convergence with awareness of physiological diplopia (Kirscher, 1992 and Cooper, 1988). Treatments using such vision training 90
91 carried out at home cost relatively little, and it is unlikely that the patients with CI would refuse such treatments because of financial concerns. However, it has also been noted that patients might easily become bored with the training procedure and fail to consistently perform the training especially when vision training was carried out by patients themselves at home (Momeni-Moghaddam et al., 2015). Several years ago, computer games with vision training incorporated were developed to increase interest and attention and to try to enhance motivation. Currently, a widely used computerised software package including a series of eye exercises for improving vergence and accommodation functions is the Home Therapy System (HTS) program (HTS Inc., USA: (Layrich, 2010). Cooper and Feldman (2009) conducted a retrospective review on 43 pre-presbyopic patients with binocular anomalies who completed the HTS computerised vergence/accommodative training (CVAT) with at least 40 training sessions (equivalent to 8 weeks) at home, and the mean symptom score was significantly decreased from 32.8 ± 8.1 (before training) to 20.6 ± 11.5 (after training) (p< 0.001) when using the Convergence Insufficiency Symptom Survey (CISS) questionnaire to quantify the severity of symptoms. More recently, another retrospective study of the home-based HTS CVAT reported on 42 children aged 5-18 who were newly diagnosed as CI and the results showed that the convergence ability was significantly improved by the HTS CVAT with mean treatment period of 12.6 ± 6.6 weeks (range: 3 to 30 weeks) (Serna et al., 2011). The mean NPC break was decreased from pre-treatment 24.2 ± 15.3 cms to post-treatment 5.6 ± 1.14 cms (p<0.001), and the mean BOFV break at near was increased from pre-treatment 11.3± 4.71 to post-treatment 26 ± 5.08 (p < 0.001). Additionally, 64.2 % patients (n = 27) reported resolution of symptoms after treatment. However, the retrospective nature and lack of controls are causes for criticism when claiming the improvement induced by such home-based CVAT because the possibility cannot be excluded the possibility that the 91
92 improvement of CI signs and symptoms is due to selection bias of the included cases, or due to a placebo effect. In contrast, a prospective study randomized and compared the same HTS home-based CVAT (HB-CVAT), office-based vergence/accommodative training (OB-VAT) and office-based placebo training (OB-PT) as treatments for children aged 9 to 17 with symptomatic CI (CITT study group, 2008). After the 12-week treatment, the HB-CVAT (n = 52) demonstrated the decrease of mean NPC break from 14.4 cms at baseline to 6.8 cms at week 12, the increase of mean near BOFV break from 10.5 at baseline and 22.8 at week 12 and the decrease of mean CISS score from 31.7 at baseline to 24.7 at week 12. However, the percentage of subjects presenting clinical improvement of signs and symptoms in the HB-CVAT group was only 33% which was similar to the 35% of OB-PT subjects (n = 54) and was much lower than the 73% of the OB-VAT group (n = 59). Therefore, the authors of this study admitted that it was unknown whether the changes seen in HB-CVAT group are a real or just a placebo treatment effect because there was no placebo HB-CVAT group in their study. However, the authors also felt that it was possible that the outcome of the HB-CVAT group may be influenced if the compliance could be improved, because the compliance in this group was poor. As a result, it is important to conduct a rigorous randomized clinical trial (RCT) to scrutinise whether the CVAT is more effective than placebo CVAT as a home-based treatment for CI and to evaluate whether the home-based CVAT is more effective than the existing home-based vision training for CI. Answers to these questions would help optometrists to prescribe the most suitable home-based vision training for the treatment of the patients with CI. However, running such an RCT requires considerable time and money. In order to ensure the successful conduct of a RCT, a pilot study is an initial and vital step in exploring new treatments which are intended to be tested in the RCT. Results collected from the pilot study are able to identify modifications required in planning the 92
93 hypothesis-testing RCT (Leon et al., 2010). Therefore, the aim of this study is to act as a pilot study to examine the feasibility of approaches that are intended to be used in a future RCT comparing two types of active home-based vision training as the treatment for CI by having a treatment arm receiving the in-home CVAT and the other treatment arm receiving in-home BST, a single training exercise commonly prescribed for CI in the UK. The four aspects of feasibility examined are subject recruitment, the assessment process, treatment fidelity and treatment adherence. Treatment fidelity refers to whether the vision training is implemented as intended, and treatment adherence refers to compliance with vision training during treatment period. 3.2 Methods The study aimed to mirror the clinical use of CVAT and BST as home-based treatments for CI, using a prospective and unmasked design. Randomization of the two treatment groups was not employed because there was no intention to compare the effectiveness between these two types of vision training in this study. All the procedures carried out on the subjects in this study were approved by Committee on the Ethics of Research on Human Beings at University of Manchester (project number: 12048) Subject enrollment Subjects were referred to attend an eligibility assessment for this study if they were aged 18-35, were suspected as convergence insufficiency and were not currently involved in vision training. The referrals were made from four sources: the research subjects in the study investigating repeatability of computerised testing of binocular vision (please see chapter 2 of this thesis), year 2 optometry 93
94 students attending the Binocular Vision Practical at the University of Manchester and patients attending the general Optometry teaching clinic or Orthoptic teaching clinic at the University of Manchester Eligibility examination procedures The subjects were invited into this study if they fitted the following inclusion criteria in the eligibility exam. The test items used to determine the eligibility are listed with the corresponding inclusion criterion. A stereopsis test at near (using TNO) was carried out at the eligibility exam. All testing at near was carried out at 40 cms. It was important that all subjects wore an appropriate refractive correction throughout all the tests and training. Therefore, if a patient was wearing spectacles and no change in prescription was necessary, the assignment of treatment occurred immediately and a study visit including baseline assessment and introduction of vision training was scheduled within one week after the eligibility exam. If a significant uncorrected refractive error was present or a significant change in refractive correction was required, a new prescription was provided. A significant refractive error or change in needed refractive correction was defined as: myopia 0.50 D or hyperopia 1.50 D or astigmatism 0.75 D or anisometropia in spherical equivalent 0.75 D (based on the rule of thumb: the maximum plus (or minimum minus) spherical lens which provides the patient with the best visual acuity). After wearing the new prescription a minimum of 2 weeks, the eligibility exam was repeated to determine if the patient still met the inclusion criteria. Inclusion criteria: Exophoria at near and the exophoria at near larger than the exophoria at distance by at least 4 _ assessed by alternating cover test with prism neutralisation at near and at distance. Receded NPC or insufficient near BOFV _ assessed by near point of convergence (NPC) test and base-out fusional vergence (BOFV) test (fusional convergence amplitude) at near. Receded NPC was defined as break point of NPC > 6 cms. Insufficient BOFV was defined as the 94
95 BOFV break point < 15 or the BOFV break point < twice the magnitude of exophoria at near (failing to meet Sheard's criterion) No strabismus or manifest ocular disease _ assessed by unilateral cover test and ocular evaluation. Best-corrected visual acuity greater than 6/9 _ assessed by best corrected visual acuity test at distance and near. Monocular accommodative amplitude > 5.00 D _ assessed by push-up monocular amplitude of accommodation test with RAF rule Treatment protocols Eligible subjects who agreed to participate in this study were assigned a participation number using the chronological sequence of eligibility exam date for the determination of vision training group. The subjects who had odd numbers were assigned into the CVAT group, and the subjects who had even numbers were assigned into the BST group (Figure 3.1). Additionally, the subjects were allowed to change their vision training group before the vision training started if they had difficulties performing the vision training they were assigned: for example, the subjects who did not have a computer when they were assigned into the CVAT group. All subjects were taught how to perform the home-based vision training by a single well-trained researcher (the author of this thesis) at the end of the baseline assessment. 95
 was carried out using Home Therapy System (HTS) inet program (HTS Inc., USA: http://www.")
96 Figure 3.1 Study design of this pilot study Computerised vergence/accommodative training The computerised vergence/accommodative training (CVAT) was carried out using Home Therapy System (HTS) inet program (HTS Inc., USA: The subjects were instructed to perform the HTS inet program for a total of 40 training sessions in eight weeks for 20 minutes per day and 5 days per week. The default auto mode regimen in HTS inet program was used and it covered four types of the fusional vergence training (ie. base-in vergence, base-out vergence, auto slide vergence and jump duction), one type of accommodation training (i.e. accommodative rock) and two types of eye movement training (ie. pursuits and saccades). This computer program automatically modified the therapy program after each training session based on the patient s performance, and this was much like a clinic therapist would do at each follow-up visit. The progress of each session was automatically uploaded and stored in an internet database at the end of the training session to record actual training adherence. However, the subjects were 96
97 requested to save their data on a disk provided by the study and to bring the disk to each follow-up visit if they did not have internet access whilst the vision training was carried out. All training procedures were following the manufacturer s design and instructions Brock string training The Brock string training (BST) was carried out for a total of 40 training sessions in for eight weeks for 10 minutes per day and 5 days per week. The Brock string consisted of a string with three beads of different colours with the same size of 0.8 cms in diameter to act as a good fixation target for stimulation of vergence and accommodation. The BST had three training stages (the standardized protocol is described in Appendix A2). The purpose of the first stage was to have awareness of physiological diplopia (eg. seeing an x). The purpose of the second stage was to accurately converge both eyes at far distance (150 cms), intermediate distance (75 cms) and near distance (25 cms) (eg. seeing an x at each different distance). The purpose of the third stage was to extend the convergence range (eg. bring the convergence close to 5 cms). Unlike the CVAT, the subjects in BST group were required to modify their daily training program by themselves based on their subjective judgement of their progress. Additionally, the subjects in the BST group were also required to keep a training diary to reflect their training adherence. The training diary is attached as Appendix A Assessment visits The assessments of the outcome measures in this pilot study were made in each of six visits before, during and after vision training by using the same protocol (see Appendix A1_ Assessment Form). The baseline assessment was made at the visit within one week after the eligibility exam visit and before the home-based vision training commenced. The follow-up assessments were made in the 5 97
98 visits at week 1, week 2, week 4, week 6 and week 8 after the home-based vision training. A single examiner carried out the assessments in each visit for each subject without masking the treatment which the subject received, because the examiner was also acting as the therapist. Although the unmasked design was employed, the form with assessment results was placed into an envelope at the end of each assessment, and the examiner did not view them until the final assessment at week 8 was completed. Additionally, the subjects were also not masked in this study because an obvious difference existed in the treatment process between the CVAT and the BST Outcome measures The NPC and near BOFV were used as primary outcome measures to observe how the convergence ability was improved by the home-based vision training. Additionally, the CISS score was used as secondary outcome measure to reflect how symptoms associated with CI were improved by the home-based vision training. Additionally, three consecutive measurements were made for the NPC and the near BOFV in each assessment using the standardised measurement protocols described below. In taking these three measurements, the rest time between measurements was no more than 10 ~ 15 seconds. The NPC was measured by using an accommodative target of an isolated letter with the size equivalent to reduced Snellen of 6/9. This accommodative target was placed on a tongue depressor with a measuring tape for accurate measurements of the distance and the target was moved towards the subject at eye level at a rate around 1~2 cms per second (Hayes et al and Scheiman et al. 2003). The subjects were encouraged to keep the target single. For each NPC measurement, the break measurement was always taken followed immediately by the recovery measurement, and the values were measured using the measuring tape and recorded in centimetres as break/recovery. The 98
99 minimum possible value for each measurement was around one centimetre (about the spectacle plane). The break value was defined as the average of three measurements when the subjective report of diplopia was made, or the objective finding of one eye deviating was observed by the examiner. The recovery value was defined as the average of three measurements when the subjective report of resumption of single vision was made, or the objective finding of ocular alignment being regained was observed by the examiner. The near BOFV (blur/break/recovery) was measured with a horizontal prism bar while the subject viewed at the target which was a single column of letters with size equivalent to 6/9 reduced Snellen displayed on a tongue depressor held at 40 cms. The prism bar was introduced in front of the subject s right eye in the spectacle plane. The subject was instructed to keep viewing the near target clear and single while the vergence power of the prism was increased from 1. The blur value and break value were recorded in prism dioptres ( ) when the subject reported the target became blurred or double and they could no longer keep them clear or single. Then, the vergence power of the prism was decreased and the recovery value was recorded when the subject reported the target became single again. The same procedure of measurement was repeated three times for each subject. The blur, break and recovery values were each determined as the average of the three measurements. The prism power was changed at a rate of one step every 2 to 3 seconds (Scheiman and Wick 2008; Antona et al. 2008). The prism bar used was a standard prism bar ranging from 1 to 45 with 1 step for 1, 2 steps between 2 and 20 and 5 steps between 25 and 45. The CISS score was obtained from the administration of a 15-question CISS questionnaire (see Appendix A1), and this questionnaire has been widely used to quantify the severity of symptoms related to CI in previous investigations (Horwood et al., 2014; Bade et al., 2013; Pang et al., 2012; Marran et al., 2006; CITT study group, 2008). Each response in the CISS questionnaire was scored as 0 99
100 to 4 points to indicate frequency of symptom occurrence (i.e., 0 for never; 1 for infrequently; 2 for sometimes; 3 for fairly often; 4 for always). The 15 items were summed to obtain the total CISS score with the lowest possible score of 0 (no symptom) and the highest possible score of 60 (most symptomatic). The validity and reliability of this CISS questionnaire was proved that the total CISS score of 21 or higher for adults aged with CI was classified as symptomatic CI (Rouse et al., 2004). The clinically significant improvement in each outcome measure was defined as a decrease of the NPC break 4 cms, an increase of the BOFV break 10 and a decrease of the total CISS 10 points (CITT Study Group, 2008) Statistical analysis A sample size of 10 subjects in each treatment group of this pilot study was chosen for collection of sufficient information for assessing feasibility in the four aspects of subject recruitment, assessment process, treatment fidelity and treatment coherence so that no formal sample size calculations were performed prior to this pilot study. The mean and standard deviation was computed for the outcome measure at each visit, and each of them was also checked if they were distributed normally or not by using Shapiro-Wilk test. The mean change after the 8-week treatment in each outcome was tested by paired-t test for data which was distributed normally, and Wilcoxon signed rank test for data not normally distributed, to determine whether the mean change was statistically significant or not. The significance level was set as p < 0.05 (two-tailed). Although inferential statistics are not appropriate in a pilot study, we only compared the changes of outcome measurements before and after treatments, rather than between treatments. 100
101 The sample size needed per group for the future RCT was estimated by using G*power 3.1 (Faul et al., 2007) with the effect size, 80% power and alpha of 0.05 (two tailed t-test). The effect size of the NPC break was determined as MD/SD, where MD is the mean of the difference of the NPC break between pre-training and post-training of 8 weeks and SD is the standard deviation of the difference of NPC break between pre-training and post-training (Faul et al., 2007). 3.3 Results Subjects enrollment and profiles During the periods of time between June 2012 and March 2014, there were 22 subjects referred for the eligibility exam of this study but only 10 subjects attended the eligibility exam. All of the 10 subjects were eligible for this study and agreed to participate and they were assigned into either the CVAT or BST treatment groups. Among the five subjects assigned in the BST group, one subject withdrew before the baseline assessment visit. Eventually, the remaining four subjects of the BST group and all five subjects of the CVAT group completed the home-based training for 8 weeks, and the number of the subjects who attended the assessment visits shown in Figure

102 Figure 3.2 Flowchart of this pilot study showing the subject recruitment and the 6 visits assessing outcome measures. CVAT: computerised vergence/accommodation training. BST: Brock string training. Sign of I indicates one subject missed that visit. Sign of II indicates two subjects missed that visit. Table 3.1 shows the profiles of the subjects who completed the 8-week training. The majority of the subjects were optometry students in both the CVAT group (60%) and BST group (75%). Furthermore, none of the subjects presented with severe CI at the baseline assessment visit, and most of the subjects presented the NPC break of 6~10 cms and the near BOFV break of 15~28 Δ. For the subjects who were classified as definite CI, there were 3 subjects in the both CVAT and BST group. Additionally, approximately half of the subjects had a CISS score equal to or over 21 points in CVAT group (40%) and BST group (50%). Only one subject was classified as a symptomatic and definite CI, and this subject was in the BST group. 102
103 Table 3.1 Demographics and clinical measures at baseline. Characteristic Mean ± SD CVAT (n = 5) BST (n = 4) Age (year) 22.8 ± ± 2.4 Male gender, % (No.) 40% (n = 2) 50% (n = 2) Occupation Optometry students, % (No.) 60% (n = 3) 75% (n = 3) Other students, % (No.) 40% (n = 2) 25% (n = 1) Best-corrected VA at distance, right eye* 6/6, % (No.) 100% (n = 5) 100% (n = 5) < 6/6, % (No.) 0% (n = 0) 0% (n = 0) Best-corrected VA at near, right eye* 6/6, % (No.) 100% (n = 5) 100% (n = 4) < 6/6, % (No.) 0% (n = 0) 0% (n = 0) Distance dissociated phoria (Δ) Exo 2.0 ± 2.0 Exo 2.0 ± 4.0 Near dissociated phoria (Δ) Exo 10.0 ± 7.0 Exo 8.0 ± 3.3 NPC break Poor_> 10 cm, % (No.) 20 % (n = 1) 0 % (n = 0) Moderate_6~10 cm, % (No.) 80 % (n = 4) 100 % (n = 4) Good_< 6 cm, % (No.) 0 % (n = 0) 0 % (n = 0) BOFV break Poor_< 15 Δ, % (No.) 20 % (n = 1) 25 % (n = 1) Moderate_15~28 a Δ, % (No.) 60 % (n = 3) 50 % (n = 2) Good_> 28 Δ, % (No.) 20 % (n = 1) 25 % (n = 1) CISS score 21, % (No.) 40 % (n = 2) 50 % (n = 2) < 21, % (No.) 60 % (n = 3) 50 % (n = 2) Definite CI b, % (No.) 60 % (n = 3) 75 % (n = 3) Symptomatic and definite CI c, % (No.) 0% (n = 0) 25% (n = 1) Stereo acuity at 40 cm (minute of arc) 30.0 ± ± 0.0 Monocular AA, right eye (D)* 9.4 ± ± 0.9 Spherical equivalent, right eye (D)* ± ± 1.23 Glasses wearer, % (No.) 40% (n = 2) 50% (n = 2) Free of ocular disease, % (No.) 100% (n = 5) 100 % (n = 4) a: 28 Δ obtained from the mean expected finding of 19 ± 9 Δ in near BOFV for adults measured by the step prism (Scheiman and Wick, 2008) by calculating as the mean of plus on standard deviation of the mean; b: Definite CI refers to the subjects presenting all the three CI signs of greater near exophoria (the exophoria at near greater than at far with at least 4 Δ), receded NPC (NPC break 6 cm) and insufficient near BOFV/convergent amplitude (ie, the near BOFV blur or break 15 Δ or failing Sheard s criterion that the near BOVF less than twice of the near phoria); c: the inclusion criteria of CI subjects used in a randomized clinical trial of convergence insufficiency treatment conducted by the CITT Study Group (2008) and it refers to adult subjects who had the CISS score 21 and also presented all the three CI signs mentioned in b. *The data of left eye is similar to right eye. 103
104 3.3.2 Outcome measures Table 3.2 shows the total change of outcome measures after treatment in both the CVAT and BST groups. In the CVAT group, the mean improvement of NPC, BOFV and CISS score after 8-week of home-based training were statistically significant (p-value < 0.05) with the NPC break decreasing by 4.4±1.4 cms, NPC recovery decreasing by 5.6±3.3 cms, BOFV break increasing by 9.1±7.0 Δ and CISS score decreasing by 7.8±5.9 points. The near BOFV recovery increased by 14.0 Δ, which approached statistical significance (p = 0.051). Furthermore, the BST group also had the improvement in NPC, near BOFV and CISS measures after 8-week of home-based training although only the near BOFV break, with a mean increase of 7.6 Δ, reached statistical significance (p < 0.05). Table 3.2 Changes of mean of outcome measures after receiving home-based vision training for 8 weeks. Outcome Measure NPC (cm) CVAT (mean ± SD) BST (mean ± SD) Baseline Week 8 Change p-value Baseline Week 8 Change p-value Break 9.1± ± ± * 8.9± ± ± Recovery 13.4± ± ± * 12.8± ± ± Near BOFV (Δ) Break 21.2± ± ± * 21.2± ± ± * Recovery 12.3± ± ± ± ± ± CISS score 18.2± ± ± * 15.5± ± ± *A statistically significant change (p < 0.05) In consideration of the clinically significant improvement, Table 3.3 shows that the majority of subjects overall had NPC break decreasing by 4 cms after 8-week home-based training (60% in the CVAT group and 50% in the BST group), but there were less than half of the subjects in either group showing clinical improvement of their BOFV and CISS score. 104
105 Table 3.3 Percentage of subjects reaching clinically significant improvement in each outcome measure in this study after receiving home-based vision training for 8 weeks. Outcome measure CVAT (n = 5) BST (n = 4) NPC break improved (decreased) by 4 cms 60% 50% Near BOFV break improved (increased) by 10 Δ 40% 25% CISS score improved (decreased) by 10 points 40% 25% NPC: near point of convergence; BOFV: base-out fusional vergence; CISS: convergence insufficiency symptom survey. Figure 3.3 shows changes of the three outcome measures during the home-based training for 8 weeks in the two treatment groups. The mean NPC break constantly improved (decreased) over the 8 weeks of home-based training in both groups, and it reached the norm of 6 cms during the training time between week 4 and week 6 in the CVAT group and during the training time between week 2 and week 4 in the BST group. Regarding the near BOFV, the mean near BOFV also constantly improved (increased) over the 8 weeks of home-based training in both groups although it was already greater than the norm of 15Δ at the baseline visit in both groups. Again, the mean CISS scores was also considered to constantly improve (decrease) over the 8 weeks in both groups although a rebound occurred at the week 4 of the visit in the BST group. This rebound at week 4 resulted from one subject with consistently low CISS scores over the 8 weeks in the BST group who failed to attend this visit in week 4 so that the mean of CISS scores in the BST group at week 4 was markedly affected. 105
. Error bars indicate ± 1 standard error of mean. NPC break of norm < 6 cms. Near BOFV break of norm: > 15 Δ.")
106 Figure 3.3 Changes of signs and symptoms over 8 weeks of the home-based vision training. Left panel: Computerised vergence/accommodative training (CVAT). Right Panel: Brock string training (BST). Error bars indicate ± 1 standard error of mean. NPC break of norm < 6 cms. Near BOFV break of norm: > 15 Δ. CISS score of norm: < 21 points. 106
107 3.3.3 Treatment coherence The percentage of subjects completing more than 35 training sessions; between 25 and 35 sessions; and less than 25 sessions; in 8 weeks was 40% (n = 2), 40% (n = 2) and 20% (n = 1) in the CVAT group, respectively, but 100% of the subjects (n = 4) in BST group reported they completed more than 35 training sessions from the diary records. Figure 3.4 shows the individual subjects in each group with comparison of his/her overall changes of each outcome measure against his/her total training sessions completed in the 8 weeks. In CVAT group, subject 2 who completed the most training sessions of the CVAT demonstrated the greatest improvement in CI signs of NPC break and near BOFV break, but subject 1 who also completed the same number of the CVAT training sessions as the subject 2 demonstrated the least improvement in CI signs of NPC break and near BOFV break. In contrast, subject 1 in the BST group completed the least BST training sessions, but this subject demonstrated the greatest improvement of CI signs and symptoms. 107
. Right Panel: Brock string training (BST).")
108 Figure 3.4 Individual improvements of outcome measures after home-based vision training for 8 weeks vs Training sessions completed. Left panel: Computerised vergence/accommodative training (CVAT). Right Panel: Brock string training (BST). The improvement of CISS score was zero in the subject 1 of the CVAT group and the subject 3 of the BST group. 108
109 3.3.4 Sample size calculation for RCT The sample size was estimated in each treatment arm of this pilot study for future RCT (Table 3.4). Table 3.4 Sample size estimation for RCT CVAT BST Outcome measure Effect size (MD/SD) Sample size Effect size (MD/SD) Sample size NPC break 3.14 (4.4/1.4) (3.9/2.0) 5 BOFV break 1.30 (9.1/7.0) (7.6/6.8) 9 CISS score 1.32 (7.8/5.9) (6.3/14.2) 43 The required sample size MD: mean of difference between pre-training of 8 weeks and post-training of 8 weeks; SD: standard deviation of difference between pre-training of 8 weeks and post-training of 8 weeks 3.4 Discussion This pilot study was conducted to examine the feasibility of the methods of eligible subject recruitment, assessment process, treatment fidelity, and treatment adherence that are planned to be used in an RCT evaluating the relative effectiveness of the CVAT and the BST as home-based treatment for CI. The CVAT and BST groups both showed gradual improvement in mean NPC break, increase of mean near BOFV and decrease of mean CISS scores over the 8 weeks of home-based training for CI. The overall improvement of signs and symptoms of CI in this pilot study confirmed that an RCT is needed to determine whether home-based vision training such as CVAT or BST in the treatment of CI is more effective than a placebo treatment (CITT Study Group, 2008; Cooper and Feldman 2009; Serna et al., 2011). A great deal was learned from this pilot study in terms of recruitment, assessment procedures, treatment fidelity and treatment adherence. 109
110 In the aspect of subject recruitment, a problem was encountered in achieving the 20 eligible subjects which was the pre-determined sample size proposed for this pilot study. Although 22 referrals were received in the recruitment period of 21 months, only 10 of them attended to the eligibility exam of this study, and finally all of the 10 subjects were confirmed to be eligible. The rate of recruitment was only approximately one eligible subject recruited every two months. Possible reasons that made the other 12 referrals fail to take the eligibility exam may be the frequent assessment visits (6 visits in 8 weeks) in this pilot study. Therefore, less frequent assessment visits are suggested to increase subjects willingness taking part in the future RCT. Additionally, there are two strategies that might help increase the recruitment rate. The first is to have more than one site performing the study. This approach was observed from the recent large-scale RCTs investigating CI treatment, and these studies collected subjects with CI by using 5-8 trial sites in a study period from 1 to around 1.5 years (CITT Study Group, 2008; Scheiman et al., 2005a; Scheiman et al., 2005b). The second is to conduct a symptom screening by using the CISS questionnaire to identify more adults who might suffer from CI. The CISS questionnaire could be posted via social media or distributed to schools and the individuals who had a CISS total score over 21 could be invited to attend the eligibility exam of the study. Regarding the assessment process, the use of the unmasked examiner generated potential bias, but several steps were taken to reduce the bias. All procedures of each assessment were standardised, and the examiner did not review previous findings until the end of the assessment at week 8. However, having two different personnel, to be the examiner and the therapist respectively, in the future RCT with a masked design is highly recommended. Treatment fidelity was generally interpreted as whether the treatment is implemented as intended, and it has been addressed in studies investigating behavioral intervention as a treatment since the 110
111 1980s (Peterson et al., 1982; Moncher and Prinz, 1991; Resnick et al., 2005). The importance of assuring optimal treatment fidelity is to make the study results truly informative as to the utility of the treatment. It may also reduce the cost of a study because good treatment fidelity would increase effectiveness, and the sample size needed could be decreased (Burgio et al., 2001 and Lichstein et al., 1994). Therefore, a standardised protocol of treatment was used in this study to ensure the vision training in each treatment was delivered in a consistent way. The CVAT was taught by using the HTS guide designed by the manufacturer including software program installation and operation and the BST was taught by using the treatment protocol shown in Appendix A2. In addition, the treatment protocol of the BST was validated by an experienced therapist who practiced at the University of Manchester. Moreover, this treatment protocol for the BST was tested by a lay person who had no optometric background, before this study started, in order to remove any jargon and check for easy understanding. However, the degree to which the subjects understood the treatment was not systemically tested, although the therapist always left sufficient time at the end of the training introduction for the subjects to ask questions regarding the home-based training they needed to perform. It is interesting to know whether the improvements obtained would be related to how faithfully individual subjects follow the training protocols. Therefore, a checklist of vision training used in the future RCT allowing subjects to demonstrate important skills of vision training is highly recommended to ensure good treatment fidelity. Treatment adherence of the CVAT was assessed by using the electronic data from the internet data base which stored the subjects performance in the vision training exercises. This was believed to truly reveal how compliant the subject was in the recommended training duration because the HTS recording system recorded the result of each training item performed by the subject in all sessions. However, the treatment adherence of the BST was assessed by using the treatment diary (Appendix A3) recorded by the subjects, and it was felt that this was not an accurate tool to demonstrate the 111
112 true compliance when compared to the reports of the subjects in discussion with the therapist during the follow-up visits in this study. Therefore, an approach assessing treatment adherence suggested by CITT group (2008) should be used in the future RCT. This approach used a question asking the therapist in each follow-up visit: What percent (0%, 1%-24%, 25%-49%, 50%-74%, 75%-99%, or 100%) of the time do you feel the patient adhered to the home protocol?. The therapist should answer this question based on the treatment diary of BST group, the electronic data of the CVAT group, and have a discussion with the patient about their in-home vision training in the BST and CVAT group. Additionally, the adult subjects were assumed to have better treatment adherence for such home-based training than children because the adults would more carefully consider if they can engage in this commitment or not. This assumption was supported by a previous study investigating effectiveness of home-based treatment using pencil push-ups for 6 weeks among 25 subjects aged 9 to 51 suffering from CI (Gallaway et al., 2002). Only one follow-up visit was scheduled at week 6 in this study. In 12 subjects who attended this follow-up visit, the average age was 26 years for subjects who returned their treatment diary, compared with 17 years for those who did not. As a result, the ideal age of the patients recruited in the future RCT of computerised vision training is about over 18 years when we hope to have good treatment compliance during treatment period in the RCT. Extra measures should be taken if the patients under 18 years are recruited in an RCT. Furthermore, a longer duration of vision training than 8 weeks is suggested for the future RCT, because the percentage of subjects who reached a clinically significant improvement was 60%, 40% and 40% based on the NPC, BOFV and CISS scores, respectively, after the 8-week CVAT training. It is worth knowing whether the rate of clinical significant improvement could be increased by lengthening the duration of vision training. A range between 8 weeks and 12 weeks for vision training 112
113 was recommended by the manual of the HTS CVAT program. Therefore, the duration of 12 weeks for vision training might be optimal choice in a future RCT. The sample size estimated for the future RCT is 5 subjects based on the NPC break results in the CVAT group and the BST group in this study, and it is 9 subjects based on the BOFV break results in the CVAT group and the BST group in this study (Table 3.4). Therefore, it does not require many subjects show the effectiveness of vision training in an RCT if the effectiveness exists. However, a large number of subjects might help power the study to test factors of predictive success (e.g. age or severity of CI) for sub-group analysis. Furthermore, this estimation should be concerned because a pilot study with small sample size does not provide a meaningful effect size estimate for planning future RCT due to the imprecision of representation (Leon et al., 2011). For example, CISS scores could have been biased in this study by the one subject who had symptomatic CI being in the BST group (i.e. no subject in the CVAT group changed their CISS score very much). It s the high SD in the BST group that s making the effect size small and requiring a lot of subjects. Because the range of scores (and hence the SD) in the CVAT is lower, it goes a bigger effect size, and lower number of participants. Therefore, the estimated sample size of 43 subjects based on the CISS score results in the BST group in this study should discount. In terms of investigating a placebo effect in a future RCT, it is suggested to have not only groups with different types of vision training, but also a group with placebo vision training. A good design for placebo training is to establish a practice that is consistent with the vision training but has no training effect. For example, patients in the computerised vision training group perform the accommodative rock training by using flippers with lenses containing accommodative stimulus, but patients in the placebo computerised vision training group perform the accommodative rock training by using flippers with plano lenses containing no accommodative stimulus. 113
114 There are some additional issues which a future RCT would need to address which were not considered in the pilot study. Firstly, a robust process for randomization would be required, perhaps stratified by age (adults vs. children) or severity of CI. Secondly, the long-term effectiveness (retention) of treatment was not evaluated. In summary, the improvement of convergent functions (i.e. NPC and near BOFV break) and CI symptoms (i.e. CISS score) after the home-based treatment of the computerized HTS inet vision training observed in the pilot study suggests that it would be appropriate to include the computerized HTS inet vision training as one of the treatment arms in an RCT of CI. 114
115 4. The nature of accommodative targets affecting the ocular accommodative response in computerised testing of accommodative facility 4.1 Introduction Accommodative facility (AF) is tested during an optometric examination when the accommodative system is suspected of making slower-than-expected changes when responding to different levels of accommodative stimuli in the surrounding environment (Wick et al., 2002). Traditional AF testing is carried out by most clinicians with high-contrast print (black on white) fixed at a close distance as the accommodative target, and using hand-held lens flippers to optically change the accommodative demand of the targets (Pandian et al., 2006). The lens flippers contain pairs of plus and minus lenses, and the common powers used are 2-dioptre change (± 1.00 D), 3-dioptre change (± 1.50 D), 4-dioptre change (± 2.00 D) and 5-dioptre change (± 2.50 D) (Zellers et al., 1984). During monocular AF testing, the clinician changes the lens of the accommodative flipper through which the subject is viewing, as soon as the subject orally reports the accommodative target is seen clearly: this is repeated for one minute whilst the non-tested eye is occluded. The clinician records the number of cycles completed in 1 min (Zellers et al., 1984). However, there are some inevitable limitations in traditional AF testing which have been thought to affect test-retest repeatability. These factors include the reaction time of the clinician when flipping the lenses (Kedzia et al., 1999; Leslie, 1997); the time spent on physically flipping the lenses; and the reaction time of the subject when reporting that the target is seen clearly (Groffman, 1997). In order to prevent the clinician-controlled technique of manually flipping the lenses from affecting measurements in traditional AF testing, one of the computer-based programs was developed to 115
. This program was designed to automatically produce stimulation with low and high accommodative demand for measurement of monocular AF.")
116 perform the monocular AF testing without flipping the lenses (Rouse et al., 1991). This computer-based program is currently commercially available and called Binocular Vision Assessment (HTS Inc., USA: This program was designed to automatically produce stimulation with low and high accommodative demand for measurement of monocular AF. The average reaction time to see these accommodative targets was converted to a number of cycles completed in one minute, shown at the end of testing (Rouse et al., 1991). This computer-based testing of AF was achieved by automatically alternately presenting accommodative targets in two colours which were red and blue to act as accommodative stimuli of 2.50 D (testing distance of 40 cms) (Figure 4.1). Meanwhile, it required the subject to wear a pair of red/blue filters and hold a pair of lenses over the filters (Figure 2.7) such that one red filter and one D lens covered the right eye and, one blue filter and one D lens covered the left eye. This optically changed the accommodative stimuli from 2.50 D to 1.00 D and 4.00 D, respectively (i.e. right eye seeing the red target only and responding to the total accommodative stimuli of 1 D; left eye seeing the blue target only and responding to the total accommodative stimuli of 4 D), and the subject was asked to respond by indicating the direction of each letter c for a given time period (usually one minute). Figure 4.1 Two accommodative targets used in the computerised testing of accommodative facility: (a) red targets; (b) blue targets. These two images were screenshots when measuring accommodative facility using HTS 116
117 BVA screening testing. Source: Although the sources of variability of AF testing inherent in the lens flipping technique were eliminated by the computerised program which uses automatic change of accommodative stimulation, the test-rest results of the computerised AF testing remained highly variable (please refer to Chapter 2 of this thesis). Except for the difference of flipper technique used, another main difference between the computerised and traditional AF testing was the accommodative targets used, and all these differences are listed in Table 4.1. To our knowledge, the influence of different accommodative target conditions on repeatability of AF testing remains unclear. Studies have previously reported that the amount of accommodative lag may be affected by accommodative targets in different colours (Aggarwala et al., 1995) or with different backgrounds (Bakaraju et al., 2007; Benel and Benel, 1992). The colour and the background of the accommodative targets used in the computerised testing were different from those used in traditional testing. In addition, other differences between computerised and traditional targets were the colour filter used, the luminance and the display modality. It was hypothesised that the nature of the accommodative targets could affect ocular accommodative response in computerised AF testing. Therefore, this study was to investigate accommodative responses produced by the computerised accommodative targets and traditional accommodative targets while AF testing is carried out. Furthermore, the errors between accommodative demands and accommodative responses were compared to see if there were differences in the accommodative errors found between the computerised targets and traditional targets. If these accommodative errors were different, then further comparisons of accommodative errors produced between different types of accommodative targets would help to identify why this occured. The stimulus factors relating to the accommodative targets were classified into five clusters: colour (red vs blue vs green vs yellow), colour filter used or not (with red filter vs without red filter and with blue filter vs without blue filter), background (white vs black), luminance 117
118 (low vs medium vs high) and display tool (laptop screen vs printed paper). All the comparisons were done using the accommodative stimuli 1 D and 4D, respectively, to simulate the accommodative stimuli presented in computerised AF testing. Table 4.1 A comparison of the characteristics of the accommodative targets used in computerised testing and traditional testing of accommodative facility. Target Colour Colour filter Luminance Background used & Contrast colour Display tool Computerised target 1 Red Red Low Black Computer screen Computerised target 2 Blue Blue Low Black Computer screen Traditional target Black None High White Printed paper 4.2 Methods Study design Two accommodative targets were chosen based on those used in computerised AF testing which were coded as R_Bk/LS+F (red on black / laptop screen + filter) and B_Bk/LS+F (blue on black / laptop screen + filter), and another 11 accommodative targets were also designed for comparison purposes. Table 4.2 shows details of the accommodative target in each stimulus condition. Each accommodative target was an isolated letter c with a size of 6/24 reduced Snellen (N12) located in a square. Accommodative responses stimulated by each accommodative target condition were compared in five clusters which were: colour cluster, filter cluster, luminance cluster, background cluster and display tool cluster. Figure 4.2 is an illustration showing the 13 comparison variables in each of the 5 clusters. 118
119 Table 4.2 Thirteen variables of accommodative targets. Number Code of variable Filter used Display tool Accommodative target Background Colour Luminance a (cd/m 2 ) Colour Luminance a (cd/m 2 ) Contrast b 1 R_Bk/LS Nil Laptop screen Red Low (27.2 ± 0.4) Black Min (0.3±0.0) Low (83.9) 2 B_Bk/LS Nil Laptop screen Blue Low (22.1 ± 0.4) Black Min (0.3±0.0) Low (68.1) 3 G_Bk/LS Nil Laptop screen Green Low (25.3 ± 1.0) Black Min (0.3±0.0) Low (78.2) 4 Y_Bk/LS Nil Laptop screen Yellow Low (25.3 ± 0.5) Black Min (0.3±0.0) Low (78.0) 5 R_Bk/LS +F Red Laptop screen Red Low (27.2 ± 0.4) Black Min (0.3±0.0) Low (83.9) 6 B_Bk/LS+F Blue Laptop screen Blue Low (22.1 ± 0.4) Black Min (0.3±0.0) Low (68.1) 7 R_W/LS Nil Laptop screen Red Low (27.2 ± 0.4) White Max (105.3±0.9) Medium (-0.74) 8 B_W/LS Nil Laptop screen Blue Low (22.1 ± 0.4) White Max (105.3±0.9) Medium (-0.79) 9 Gr*L_Bk/LS Nil Laptop screen Dark grey Low (25.3 ± 0.9) Black Min (0.3±0.0) Low (78.1) 10 Gr*M_Bk/LS Nil Laptop screen Light grey Medium (65.0 ± 0.6) Black Min (0.3±0.0) High (202.0) 11 Gr*H_Bk/LS Nil Laptop screen White High (105.3 ± 0.9) Black Min (0.3±0.0) High (328.0) 12 Bk_W/LS Nil Laptop screen Black No (0.3 ± 0.0) White Max (105.3±0.9) High (-1.00) 13 Bk_W/P Nil Paper Black N/A White N/A N/A a. Luminance was measured by Hagner photometer S4 (Hagner Photometric Instruments Ltd, Sweden); b. Weber Contrast: CW = (Luminance target Luminance background ) / (Luminance background); R:red; B: blue; G:green; Y:yellow; Bk: black; F: filter; W: white; Gr: grey; L: low; M: medium; H: High; LS: laptop screen; P: paper 119
 Colour cluster: red vs blue vs green vs yellow; (b) Filter cluster: red target with no filter vs red target without red filter; blue target with no filter vs blue target with blue filter; (c)")
120 Figure 4.2 Five comparison clusters for 13 accommodative targets in this study. (a) Colour cluster: red vs blue vs green vs yellow; (b) Filter cluster: red target with no filter vs red target without red filter; blue target with no filter vs blue target with blue filter; (c) Luminance cluster: low vs medium vs high; (d) Background cluster: red on black vs red on white and blue on black vs blue on white (e) Display modality cluster: laptop screen vs printed paper. The code of each target such as R_Bk/LS, B_Bk/LS and G_Bk/LS etc. is specified in Table 4.2. R:red; B: blue; G:green; Y:yellow; Bk: black; F: filter; W: white; Gr: grey; L: low; M: medium; H: High; LS: laptop screen; P: paper. 120
121 4.2.2 Designing accommodative targets For the variables in the colour cluster, the red (R_Bk/LS) and blue (B_Bk/LS) targets were designed to match the original targets used in the HTS BVA screening testing. This was done by Paint software. The values of hue, luminance and saturation in Paint for the red and blue targets are shown in Table 4.3. The other two colours of accommodative targets in green (G_Bk/LS) and yellow (Y_Bk/LS) were designed by matching the actual luminance measured by Hagner Photometer (Hagner Photometric Instruments Ltd, Sweden) to R_Bk/LS and B_Bk/LS for fair comparison. Table 4.3 Parameters of each colour used to make the accommodative target variables Colour Actual luminance measured by photometer 1 (cd/m 2 ) Paint parameter Hue Saturation Luminance R G B Red 2 Low (27.2±0.4) Blue 3 Low (22.1±0.4) Green 4 Low (25.3±1.0) Yellow 5 Low (25.3±0.5) Dark grey 6 Low (25.3±0.9) Light grey 7 Medium (65.0±0.6) White 8 High (105.3±0.9) Black 9 No (0.3 ± 0.0) Luminance was measured by Hagner photometer S4. 2. Red was used in the variables of R_Bk/LS, R_Bk/LS+F and R_W/LS. 3. Blue was used in the variables of B_Bk/LS, B_Bk/LS+F and B_W/LS. 4. Green was used in the variables of G_Bk/LS. 5. Yellow was used in the variables of Y_Bk/LS. 6. Dark grey was used in the variables of Gr*L_Bk/LS. 7. Light grey was used in the variables of Gr*M_Bk/LS. 8. White was used in the variables of Gr*H_Bk/LS, Bk_W/LS, R_W/LS, B_W/LS. 9. Black was used in the variables of R_Bk/LS, B_Bk/LS, G_Bk/LS, Y_Bk/LS, R_Bk/LS+F, B_Bk/LS+F, Gr*L_Bk/LS, Gr*M_Bk/LS, Gr*H_Bk/LS and Bk_W/LS. For the above code of each variable please refer to Table 4.2. For the variables in the luminance cluster, the low luminance of the dark grey used in the variable of 121

122 Gr*L_Bk/LS was matched with the average luminance of the red and blue. For the stimulus variables of the filter cluster, the spectral distribution of transmittance of the red filter used in the variable of R_Bk/LS+F was matched with the red filter goggle used in HTS BVA screening testing of accommodative facility: however, the % transmittance of the red filter was slightly higher than that in the HTS BVA screening testing, in order to provide sufficient light transmitted to measure the accommodative response. This was also true for the blue filter used in the variable of B_Bk/LS+F. Figure 4.3 shows that the red filter used in this experiment had a peak of approximately 75 % of light transmittance at nm (029 Plasma Red, LEE Filters). The blue filter chosen had a peak of approximately 50 % light transmittance at nm (195 Zenith Blue, LEE Filters). Figure 4.3 Light transmittance plot of two filters: (a) Red filter; (b) Blue filter. Source of the plot was from Considering the variables investigated in the display format cluster, the accommodative target used in Bk_W/LS was printed onto a piece of blank white photo paper using a laser printer (HP Colour LaserJet CP3525x), to create the stimulus to be used for the variable of Bk_W/P. 122
123 4.2.3 Subject selection Healthy adults aged were recruited to attend a study visit for this study. The study visit consisted of a screening exam and, a series of accommodative response measurements for the 13 accommodative targets which are shown in Figure 4.2. The accommodative response measurements were not carried out if the subjects met any of the exclusion criteria listed below during screening. The subject recruitment was carried out through advertisements posted on the intranet of the students and staff members at the University of Manchester. Exclusion criteria: Corrected distance visual acuity of right eye < 6/6 Amplitude of accommodation of right eye < 4.00 D Pupil size of right eye in room light < 3 mm Colour vision deficiency Presenting a significant refractive error not corrected by contact lenses Note: A significant refractive error was defined as spherical and/or cylindrical error > 1.00D Having a history of ocular disease, relevant systemic disease or medication in use that affects accommodation The subjects were asked to bring their up-to-date contact lens to attend the study visit if they had refractive error to be corrected. There were two reasons for excluding spectacle wearers from this study. The first was to make it easier to obtain readings with the autorefractor used for measuring the accommodative response in this study, by limiting the number of lenses placed in the trial frame. This was based on unpublished data from a pilot study for this experiment which showed that it was not possible to take 123
124 measurements from 3 out of 10 subjects when there was 1 trial lens plus 1 filter placed in the trial frame worn by the subjects, and 7 out of 10 subjects could not be measured when there were 2 trial lenses plus 1 filter. It was suspected that the failure of measurement resulted from an insufficient amount of light transmitted back to the autorefractor, due to reflections from multiple trial lens surfaces. The second reason was to avoid the retinal image size being significantly changed when viewed by subjects who wore spectacles with high-power prescription lenses. In addition, the subjects who had small pupil size were excluded because it was reported that the autorefractor used in this study was able to take measurements from pupils of diameter size larger than 3 mm (Mallen et al., 2001) Screening exam The screening exam included the following tests performed on the right eye of the subjects: visual acuity test, refractive exam, monocular amplitude of accommodation test (RAF rule), colour vision tests (Ishihara s tests of 24-plate edition), pupil size measurement, and monocular accommodative facility test (± 1.50D lens flipper). The subjective refraction was carried out based on the rule of thumb of maximum plus power to achieve best corrected visual acuity (BCVA). For any refractive error identified, there were three ways to correct this. Firstly, if the subjects had spherical and cylindrical refractive error less than 0.25D (between D and D), they were defined as emmetropes and were not corrected by any lenses. Secondly, if the subjects had corrected spherical and/or cylindrical refractive error of ± 1.00D, and they were not contact lens wearers, their refractive error was corrected by trial lenses. For the subjects who had a spherical and/or cylindrical refractive error > 1.00D, they were asked to 124
125 wear their contact lenses, and an over-refraction was performed. Any residual refractive error detected over the contact lens was corrected by trial lenses. The trial lenses used for the correction of refractive error on non-contact lens wearers and for the correction of residual refractive error on contact lens wearers were held by trial frames at a vertex distance of 12 mm. Therefore, the right aperture of this trial frame worn by the subjects who were emmetropes or contact lens wearers without residual refractive error was left empty before the accommodative response measurements. Otherwise, a single trial lens was placed in the right aperture of this trial frame to correct the low refractive error of non-contact lens wearers or the residual refractive error of contact lens wearers. The left aperture of the trial frame worn by each subject was fully covered by an opaque occluder. The other tests in the screening exam such as accommodation tests and colour vision tests were carried out whilst the subjects wore the trial frame with any required corrective lenses. The monocular accommodative facility was carried out for 0.5 minutes, then this number was multiplied by 2 to obtain cycles per minute. The accommodative target was placed 40 cm away from subject s face at eye level. Due to the accommodative response measurements taken in a simulation status that the accommodative facility testing was carried out, a short practice session on viewing the different stimuli clearly through the different lenses was conducted to allow the subject to understand how to perform prior to the start of the accommodative measurements. The subject was instructed to view the target, try to bring it into focus, and report clear as soon as the target became clear after a lens was inserted. The practice was completed when the subject was confident that they understood the task. No attempt was made to systematically train them to produce maximal responses because it was hoped that they would give natural responses reflecting their true accommodative 125
126 performance during the testing Accommodative response measurements At the start of data collection, the distance refraction was measured by the Shin-Nippon autorefractor under the condition that the subjects achieved BCVA to establish a baseline for following accommodative response calculation. For each accommodative target, accommodative responses were measured monocularly from the subjects right eye whilst the accommodative target was viewed by the same eye at 40 cms and measurements were taken using DS and DS trial lenses alternately for four cycles. Accommodative response measurements were taken by a Shin-Nippon SRW-5000 open-field autorefractor (Ajinomoto Trading Inc., Tokyo, Japan) which provided highly repeatable and valid accommodation measurements (Mallen et al., 2001; Chat and Edwards, 2001; David et al., 2003). These trial lenses were alternately placed in the trial frame worn by the subject to keep these lenses steady whilst accommodative responses were measured: the subject's head was held in position by a head rest. Figure 4.4 illustrates the apparatus and device of measuring accommodative response. 126
127 Figure 4.4 Apparatus and device for measuring accommodative responses during AF testing: (a) a trial frame for alternate positioning the lenses of ± 1.50 D to produce the required accommodative stimuli; (b) accommodative targets displayed on a laptop screen and placed at 40 cms seen by subjects wearing the trial frame and sitting at an open-field autorefractor for measuring accommodative response. Accommodative response measurements were taken immediately three consecutive times for each additional lens when the subject reported clear whilst viewing the accommodative target. However, if the subject could not see the target clearly after 5 seconds, the three readings were still taken, but it was recorded as blur. These two additional lens stimuli of D lens and D produced an accommodative demand of 1 D and 4 D respectively for the target placed at 40 cms. An accommodative demand of 0 D was achieved by inserting a D lens for each accommodative target, in order to establish a baseline to be used in the calculation of the net accommodation response. For each subject, the procedure of accommodative response measurements was identical for each target variable, but the sequence of measurement of the target variables was different. The systematic sequence used in measuring 13 target variables in each subject is listed in Appendix B1. 127
128 This systematic change was to avoid some variables always being measured first and some always measured at the end, because inaccurate accommodative response has been associated with fatigue effect (Thiagarajan and Ciuffreda, 2013). Dim room light (illuminance: lux) was used during the accommodative measurements for those 12 targets presented on the laptop screen, in order to produce the same conditions as when the HTS BVA AF computerised testing was carried out in the repeatability study of Chapter 2. Normal room light (illuminance: lux) was used during the accommodative measurement for the target presented on paper (Bk_W/P). All accommodative response measurements in this study were taken by the same single investigator Accommodative response calculation Each accommodative response was obtained by the following two steps. Mean accommodative response for each target variable, for each subject, was calculated by averaging the accommodative response of cycle, 2, 3, and 4. The reason for ignoring cycle 1 was that the change of accommodative demand in the first cycle of D lens (from 2.50D to 1.00D) is different from the rest of three cycles (from 4.00D to 1.00D). 128
129 Calculation for each accommodative response Step 1: Calculate spherical equivalents (SE) from mean measurements (i.e. mean of three refractive readings of Shin-Nippon autorefractor) Step 2: Convert SE to accommodative response values by the following formula Accommodative response = - (SE of mean measurements) - (power of stimulus lens) - (baseline) Note: Baseline indicating distance Rx measured by Shin-Nippon autorefractor for subject s corrected right eye. Then accommodative error was further obtained by this calculated accommodative response minus the total accommodative demand for the 13 conditions for each subject Statistical analysis An estimate of 51 subjects was required in this study to detect any statistically significant difference between accommodative responses stimulated by the accommodative targets used by the computerised testing of AF and the accommodative targets modified from those used by the computerised testing of AF. This estimate of the sample size was derived by G-power (Version 3.1) (Faul et al., 2007; Faul et al., 2009) when the effect size, significance level and statistical power were set 0.68, and The effect size of 0.68 (3.19 x 10% / 0.47) was calculated based from detecting a 10% difference of mean accommodative response stimulated by different accommodative targets, based on a mean accommodative response of 3.19 ± 0.47 D as measured by the same auto-refractor from a previous study carried out on 39 subjects responding to an accommodative demand of 4 D (McClelland and Saunders, 2003). The significance level of was determined by Bonferroni correction to counteract the problem of multiple comparisons that 129
130 statistical significance will randomly appear from a large number of comparisons. The statistical power of 0.95 was determined for decreasing the chances of making a type II error and improving the ability to detecting small differences between accommodative responses. All the accommodative response/accommodative error data were checked to determine if they were distributed normally. The mean lag of accommodation between the different conditions of accommodative targets in each cluster was compared by paired-t test for the comparison of two conditions, or one-way repeated measurements ANOVA for the comparison of three or more conditions. A p-value less than 0.05 was considered statistically significant. If the accommodative lag data were not normally distributed, the equivalent non-parametric analyses were used. SPSS software (SPSS, Inc., Chicago, Illinois, USA) were used to conduct all statistical analyses in this study. 4.3 Results Subjects profile A total of 53 adult subjects meeting the inclusion criteria attended the study visit. After the screening exam, 2 of the subjects were excluded (1 because the monocular accommodative amplitude was less than 4.0 D, and 1 because the pupil size was less than 3 mm). The remaining 51 subjects completed all accommodative response measurements. The mean age of the 51 subjects was 25.3 ± 4.2 years and there were 22 males (43%). Table 4.4 shows the mean of refractive error, accommodative amplitude and accommodative facility for the subjects right eyes. 55% of subjects were emmetropes (n = 28), and 45% of subjects were ametropes 130
131 (n = 23). Interestingly, there were 7 subjects with accommodative facility lower than 6 cpm, and each of them reported that it took a much longer time to get a clear image with the plus lens (+1.50 D) than with the minus lens (-1.50D). Table 4.4 Visual characteristics of the 51 subjects. Visual characteristics a Mean ± SD Minimum Maximum SE of refractive error (D) ± Amplitude of accommodation (D) 9.00 ± Monocular accommodative facility (cpm) 11.41± a: right eye only; SE: spherical equivalent; D: dioptre; cpm: cycles per minute Missing data in accommodative response measurements There were two situations in which the accommodative response (AR) measurements could not be obtained. One was due to the use of the coloured filters for the variables of R_Bk/LS+F and B_Bk/LS+F. The autorefractor used in this study failed to take measurements in 13 subjects (2 subjects for the variable of R_Bk/LS+F, 2 subjects for the variable of B_Bk/LS+F and 9 subjects for both variables). The other missing measurement was due to human error since the fourth cycle of AR measurements was accidentally omitted by the investigator for the variable of R_Bk/LS in 1 subject and the variable of B_Bk/LS in another subject. The strategy of dealing with these missing data was that the means of the cycles 2 and 3 in those two variables without the measurements of the fourth cycle were used to calculate AR instead of using the mean of the cycles 2, 3 and
132 4.3.3 Mean accommodative responses The mean ARs induced by the accommodative targets in the 13 different conditions are shown in Table 4.5. Generally, the mean ARs were lower than the accommodative stimuli in the 12 variables using the laptop screen to present the accommodative targets and in the one variable using printed paper to present the accommodative targets (Bk_W/P). When the total accommodative stimulus was 4 D, the highest and the lowest mean AR occurred in the Bk_W/P variable (2.67 ± 0.59 D) and in the B_Bk/LS+F variable (1.82 ± 0.98 D), respectively. For a total accommodative stimulus of 1 D, the highest mean AR occurred in the R_Bk/LS variable (0.81 ± 0.63) and R_Bk/LS+F (0.81 ± 0.63 D), and the relatively low mean AR (0.46~0.48 D) occurred in the variables using the grey scale targets presented on the laptop screen (i.e. Gr*L_Bk/LS, Gr*M_Bk/LS, Gr*H_Bk/LS and Bk_W/LS ). Additionally, the red targets ( R_Bk/LS and R_W/LS ) tended to produce better AR than most other targets for both accommodative stimuli of both 1 D and 4 D except for the red targets seen through the red filter (R_Bk/LS+F). As to the minimum AR, the lowest value of AR was lower than zero dioptre when the total accommodative stimulus was 1 D. Furthermore, the lag amount of AR was higher for total accommodative stimuli of 4 D than for 1 D. 132
133 Table 4.5 Accommodative responses induced by accommodative targets in the 13 different conditions. Target variables (n = 51) Total accom. stimuli of 1 D Total accom. stimuli of 4 D Mean ± SD (D) Range (D) Mean ± SD (D) Range (D) 1. R_Bk/LS 0.81 ± ~ ± ~ B_Bk/LS 0.54 ± ~ ± ~ G_Bk/LS 0.59 ± ~ ± ~ Y_Bk/LS 0.52 ± ~ ± ~ R_Bk/LS+F (n = 40) 0.81 ± ~ ± ~ B_Bk/LS+F (n = 40) 0.68 ± ~ ± ~ R_W/LS 0.75 ± ~ ± ~ B_W/LS 0.52 ± ~ ± ~ Gr*L_Bk/LS 0.48 ± ~ ± ~ Gr*M_Bk/LS 0.47 ± ~ ± ~ Gr*H_Bk/LS 0.46 ± ~ ± ~ Bk_W/LS 0.48 ± ~ ± ~ Bk_W/P 0.57 ± ~ ± ~3.78 Accom.: accommodative; R_Bk/LS: red target on black background displayed by laptop screen; B_Bk/LS: blue target on black background displayed by laptop screen; G_Bk/LS: green target on black background displayed by laptop screen; Y_Bk/LS: yellow target on black background displayed by laptop screen; R_Bk/LS+F: red target on black background displayed by laptop screen seen through red filter; B_Bk/LS+F: blue target on black background displayed by laptop screen seen through blue filter; R_W/LS: red target on white background displayed by laptop screen; B_Bk/LS: blue target on white background displayed by laptop screen; Gr*L_Bk/LS: grey target with low luminance (Dark grey) on black background displayed by laptop screen; Gr*M_Bk/LS: grey target with medium luminance (white) on black background displayed by laptop screen; Gr*H_Bk/LS: grey target with high luminance (Light grey) on black background displayed by laptop screen;; Bk_W/LS: black target on white background displayed by laptop screen; Bk_W/P: black target on white background displayed by printed paper. Table 4.76 and Table 4.7 show the mean difference of ARs between the 38 subjects who were able to have measurements taken with the colour filter in place, and the remaining 13 subjects who were not. Generally, the mean differences of ARs were lower in the 38 subjects than the 13 subjects for the 11 variables excluding R_Bk/LS+F and B_Bk/LS+F in both accommodative stimuli, but of majority of the mean differences were not statistically significant. In the variable of R_W/LS, the mean accommodative response was lower in the 38 subjects than the 13 subjects by 0.61 D and 0.43 D for the total accommodative stimuli of 1 D and 4 D, respectively (p = and 0.038). Meanwhile, it was also found that the mean accommodative response of Bk_W/P was lower in the 38 subjects than the 13 subjects by 0.39 D for the total accommodative stimuli of 1 D (p = 0.043). 133
134 Table 4.6 Mean difference of accommodative responses between the 38 subjects with the measurement data of colour filters in place (i.e. R_Bk/LS+F and B_Bk/LS+F ) and the remaining 13 subjects in total accommodative stimuli of 1 D. Mean ± SD Code of Mean difference Having data with filter, Not having data with variable Total, n = 51 (I)-(II) n = 38 (I) filter, n = 13 (II) 1 R_Bk/LS 0.81 ± ± ± B_Bk/LS 0.54 ± ± ± G_Bk/LS 0.59 ± ± ± Y_Bk/LS 0.52 ± ± ± R_Bk/LS+F ± B_Bk/LS+F ± R_W/LS 0.75 ± ± ± * 8 B_W/LS 0.52 ± ± ± Gr*L_Bk/LS 0.48 ± ± ± Gr*M_Bk/LS 0.47 ± ± ± Gr*H_Bk/LS 0.46 ± ± ± Bk_W/LS 0.48 ± ± ± Bk_W/P 0.57 ± ± ± * Note: The description of the accommodative target in each variable code was shown in Table 4.2. Table 4.7 Mean difference of accommodative responses between the 38 subjects with the measurement data of colour filters in place (i.e. R_Bk/LS+F and B_Bk/LS+F ) and the remaining 13 subjects in total accommodative stimuli of 4 D. Mean ± SD Code of Mean difference Having data of filter, Not having data of variable Total, n = 51 (I)-(II) n = 38 (I) filter, n = 13 (II) 1 R_Bk/LS 2.59 ± ± ± B_Bk/LS 2.32 ± ± ± G_Bk/LS 2.44 ± ± ± Y_Bk/LS 2.52 ± ± ± R_Bk/LS+F ± B_Bk/LS+F ± R_W/LS 2.54 ± ± ± * 8 B_W/LS 2.57 ± ± ± Gr*L_Bk/LS 2.52 ± ± ± Gr*M_Bk/LS 2.59 ± ± ± Gr*H_Bk/LS 2.62 ± ± ± Bk_W/LS 2.62 ± ± ± Bk_W/P 2.67 ± ± ± Note: The description of the accommodative target in each variable code was shown in Table
 and the Bk_W/P variable (traditional targets).")
135 4.3.4 Accommodative errors in computerised and traditional accommodative targets Figure 4.5 shows that the mean lag of AR was statistically significantly different from the B_Bk/LS+F variable (computerised blue targets) and the Bk_W/P variable (traditional targets). The mean lag of AR was lower in the Bk_W/P variable than the B_Bk/LS+F variable by 0.75 D in the accommodative stimuli of 4 D (p < with Bonferroni correction), but the mean lag of AR was higher in the Bk_W/P variable than the B_Bk/LS+F variable by 0.24 D in the accommodative stimuli of 1 D (p < with Bonferroni correction). In addition, the mean lag of AR was also lower in the R_Bk/LS+F variable (computerised red targets) than the B_Bk/LS+F variable by 0.39 D in the accommodative stimuli of 4 D (p < with Bonferroni correction) although the mean lag of AR for the accommodative stimuli of 1 D was not statistically significantly different between these two variables (p = 0.538). Figure 4.5 Comparison of mean accommodative lag between computerised red targets (R_Bk/LS+F), computerised blue targets (B_Bk/LS+F) and traditional targets (Bk_W/P): (a) accommodative stimulus of 1 D and (b) accommodative stimulus of 4 D. *p < 0.016, Bonferroni correction. Error bars indicate standard error of mean. 135
 among the four different colours.")
136 4.3.5 Colour effects Figure 4.6 shows the mean accommodative lag produced by these different colours of accommodative targets. In both accommodative stimuli of 1 D and 4 D, the least amount of mean accommodative lag was found in the red target (R_Bk/LS) among the four different colours. In addition, the blue targets (B_Bk/LS) had the highest amount of mean accommodative lag in accommodative stimuli of 4 D, and the second highest amount of mean accommodative lag in accommodative stimuli of 1 D. The mean accommodative lag was statistically significantly lower in the R_Bk/LS variable than in the B_Bk/LS variable by 0.26 D and by 0.27 D in the accommodative stimuli of 4 D and 1 D respectively (both p < 0.008, Bonferroni correction). Figure 4.6 Comparison of mean accommodative lag between accommodative targets in red (R_Bk/LS), blue (B_Bk/LS), green (G_Bk/LS) and yellow (Y_Bk/LS) colours: (a) accommodative stimulus of 1 D and (b) accommodative stimulus of 4 D. *p < 0.008, Bonferroni correction. Error bars indicate standard error of mean Colour filter effects Figure 4.7b shows that the colour targets used together with the colour filter produced greater amount of accommodative lag than when the colour target is used by itself in the accommodative 136
. This difference increased in the condition of blue targets.")
137 demand of 4 D. The mean difference of accommodative lag between the red target with red filter and the red target only were 0.45 ± 0.82 D with statistical significance (p < 0.025, Bonferroni correction). This difference increased in the condition of blue targets. The mean difference of accommodative lag between the blue target with blue filter and the blue target only were 0.65 ± 0.78 D with statistically significance (p < 0.025, Bonferroni correction). However, none of these differences showed the statistical significance in the condition of accommodative demand of 1 D in either red or blue targets (Figure 4.6a). Figure 4.7 Comparison of mean accommodative lag between targets seen through without filter (light grey) and with filter (dark grey) for the red targets (R_Bk/LS vs R_Bk/LS+F) and the blue targets (B_Bk/LS vs B_Bk/LS+F): (a) accommodative stimulus of 1 D and (b) accommodative stimulus of 4 D. *p < 0.025, Bonferroni correction. Error bars indicate standard error of mean Luminance effects Figure 4.8 shows that no significant difference was found in the mean accommodative lag between the accommodative targets with low, medium and high luminance on a black background, presented on a laptop screen, for accommodative stimuli of both 1 D and 4 D (all p > with Bonferroni 137
, median luminance (Gr*M_Bk/LS) and high luminance (Gr*H_Bk/LS): (a) accommodative stimulus of")
138 correction). Figure 4.8 Comparison of mean accommodative lag between the accommodative targets with low luminance (Gr*L_Bk/LS), median luminance (Gr*M_Bk/LS) and high luminance (Gr*H_Bk/LS): (a) accommodative stimulus of 1 D and (b) accommodative stimulus of 4 D. Error bars indicate standard error of mean Background effects Figure 4.9 shows that the mean accommodative lag was statistically significantly lower by 0.26 D (p < 0.025, Bonferroni correction) for the blue target presented on a white background, than for that on a black background for a total accommodative stimulus of 4 D, although this statistically significant difference was not found in the total accommodative stimulus of 1 D. For the red targets, no statistically significant difference was found between the AR for the black and white background, for the accommodative stimuli of 1 and 4 D. 138
 accommodative stimulus of 1 D and (b) accommodative stimulus of 4 D. *p < 0.025, Bonferroni correction. Error bars indicate standard error of mean. 4.3.9 Display modality effects Figure 4.")
139 Figure 4.9 Comparison of mean accommodative lag between targets on black ground (Dark grey) and on white background (light grey) for red and blue targets. (a) accommodative stimulus of 1 D and (b) accommodative stimulus of 4 D. *p < 0.025, Bonferroni correction. Error bars indicate standard error of mean Display modality effects Figure 4.10 shows that no significant difference was found on the mean accommodative response when the accommodative target was displayed on the laptop screen, compared to printed paper in accommodative stimuli for both 1 D and 4 D (both p-value > 0.05). 139
 and printed paper (Bk_W/P): (a) accommodative stimulus of 1 D and (b) accommodative")
140 Figure 4.10 Comparison of mean accommodative lag of the accommodative targets displayed between laptop screen (Bk_W/LS) and printed paper (Bk_W/P): (a) accommodative stimulus of 1 D and (b) accommodative stimulus of 4 D. Error bars indicate standard error of mean. 4.4 Discussion This study is the first to investigate how different characteristics of accommodative targets affect the accuracy of the AR under four cycles of AF testing with healthy young adults. The study results showed that accommodative lag was found in all of the 13 accommodative stimulus conditions used in this study. The amount of accommodative error induced by the computerised targets in the blue setting (B_Bk/LS+F) were significantly greater than the computerised targets in the red setting (R_Bk/LS+F) and the traditional targets (Bk_W/P), when AF testing with a 4 D accommodative stimuli was carried out. Further cluster analyses showed that the significant lag of accommodation resulted from the blue colour and the blue filter. The findings in this study that the amount of lag increased as the accommodative demand increased (eg D for 1D vs 1.79 D for 4 D of accommodative demand of computerised targets in red setting 140
141 (R_Bk/LS+F)) were similar to previous studies investigating the AR stimulated by a near-point target with different accommodative demand (Taylor et al., 2009; Hartwig et al., 2011; Langaas et al., 2008; McClelland and Saunders, 2003; Aggarwala et al., 1995; Bakaraju et al., 2007). This phenomenon may be explained by the depth of focus contributing to the effect of the accommodation effort. The depth of focus in the human eye serves a mechanism of blur tolerance (Tucker and Charman, 1975). It means that the eye perceives the target image as being clear even when the eye takes slightly more accommodation (lead of accommodation) or less accommodation (lag of accommodation) if the target image falls into the range of depth of focus, and this is understood as the influence of neurological intervention from brain perception (Wang and Ciuffreda, 2006). The human brain tends to choose to make less effort (lag of accommodation) to get the target image clear, rather than choosing to exert more effort (lead of accommodation). The finding that the different colours of the accommodative targets affect the AR under the moderate accommodative demand was similar to previous investigations (Kröger and Binder, 2000; Seidemann and Schaeffel, 2002). Kroger and Binder (2000) found that the accommodation was significantly reduced by approximately 0.5 D during elimination of long wavelengths at a reading distance of 33 cms (requiring an accommodative demand of approximately 3 D) among 41 young adults aged years wearing their best subjective refractive correction. The accommodative target used in Kroger and Binder s experiment was a black cross printed on a piece of white paper with illumination of 3300 K of constant intensity, and long wavelengths were eliminated by a short-pass blue filter (Lee Filters, over 80% transmission of wavelengths below 560 nm). A similar finding was also observed by Seidemann and Schaeffel (2002) in their study investigating whether the spectral composition of the ambient illumination affected the accommodation responses, and it was 141
142 concluded that the subjects (n = 5) accommodated less in short wavelengths than in longer wavelengths when the subjects were asked to read text monocularly at a distance of 33 cms. The text used in Seidemann and Schaeffel s study was illuminated by the slide projector with different interference filters in the beam being 430, 480, 515, 555, 595, 615 and 655 nm. The mean accommodative response was 0.61±0.24 D greater with interference filters of 655 nm compared to interference filters of 430 nm (the mean accommodation response reduced in all wavelengths shorter than 590 nm, compared to 655 nm) (ANOVA: p < 0:0001, post hoc t-test: p < 0:001) (Seidemann and Schaeffel, 2002). Interestingly, the reduction of AR caused by shorter wavelength in our study was consistent with those two studies although the target design was different (blue target on black background vs black target on blue background). This might suggest the accommodative response is affected by the colours of the accommodative target, and the colour can be from the target itself or from the target background/environment. The colour effect influencing the accuracy of AR (more lag in blue vs less lag in red) may be explained by longitudinal chromatic aberration (LCA), and this was proposed in the early years of this century (Atchison et al., 2004; Seidemann and Schaeffel, 2002; Kröger and Binder, 2000). The LCA indicates there is a failure of the eye to focus all colours to the same convergence point, and shorter wavelength light is refracted more than longer wavelengths (Howarth and Bradley, 1986; Kruger et al., 1993; Rynders et al., 1998). Therefore the LCA makes the targets with shorter wavelength have shorter image distance. As a result, the near targets with shorter focusing distance have smaller defocus errors than those with longer focusing distance before accommodation is exerted. Therefore, the principle of LCA explains the result found in our study that less accommodation is required in viewing the accommodative target with short wavelength (i.e. blue) for a clear retinal image, than 142
143 those with long wavelength i.e. red. The theoretical dioptric difference in the focal plane between blue and red light has been thought to average approximately 1~1.75 D between 420nm blue and 660nm red (Wald and Griffin, 1947; Bedford and Wyszecki, 1957). In the current study, the practical difference of AR between blue and red was only 0.3~0.4D (R_Bk/LS v.s. B_Bk/LS in Table 4.6). The decrease from the theoretical difference to practical difference of AR between blue and red targets may result from measurement error or the broadband nature of the filter transmission. However, further investigations are needed to reveal the actual causation of the decrease from the theoretical difference to practical difference of AR between blue and red targets. The second factor significantly affecting accuracy of AR in the current study was the additional colour filter used with colour target (Figure 4.7b). A reduction of luminance contrast of the accommodative target was found after the accommodative target on the black background was viewed through the colour filter because the colour filter reduces the brightness of the target. The reduction of target contrast may decrease the ability to detect the sharpness of the target, and this may contribute to inaccurate AR. The level of target contrast would need to drop down to a critical threshold to cause this poor AR. According to results in the luminance cluster, the low luminance around 25 cd/m 2 did not significantly affect the accuracy of AR (Figure 4.8). This may be because the luminance of 25 cd/m 2 still had an acceptable luminance contrast on the black background (luminance contrast: 78.1) to present a clear target. However, AR was significantly attenuated when the low target luminance was partially filtered out to be left only approximately 11 cd/m 2 (eg. the luminance of the blue target viewed through with the blue filter = 22.1 cd/m 2 x 50% transmittance in 440 nm), and in this case the luminance contrast of this target condition significantly decreases to The above observations regarding the trend of AR change were all based on the results of the 143
144 accommodative stimulus of 4 D in the cluster analyses for the colour effect (Figure 4.6b) and colour filter effect (Figure 4.7b). It is not surprising that the pattern for AR change for the 1 D stimulus in colour filter analyses was different to those of the 4 D stimulus (Figure 4.7a vs Figure 4.7b) because of two possible reasons. Firstly, the accommodative stimulus of 1 D might not be an effective difference which can be detected for the particular testing conditions in the cluster analyses (eg. with filter vs without filter in red target of 1 D stimulus in 4.7a). Secondly, the method of using a plus lens of 1.50 D to relax the accommodation from a dioptric distance of 2.50 D (40 cms) in order to produce a total accommodative stimulus of 1 D might not be an appropriate method for young adults because the young adults with a good amplitude of accommodation tend to find it difficult to relax the accommodation through the plus lens stimulus. Therefore, the result that the lag of AR with blue filter (mean lag of 0.32 D) was less than those without blue filter (mean lag of 0.46 D) for a blue target (Figure 4.7a) was not surprising, because the plus lens might not play an effective role in simulating the 1 D of accommodative stimulus. Therefore, it is expected that using a physical distance of 1 m to create the 1 D stimulus might produce more accurate results than using the plus lens to partially relax the accommodation from 2.50 D. Another possible reason to influence the accuracy of AR is a cross-talk effect when the monocular AF testing is carried out using binocular viewing with the anaglyphic method i.e. HTS BVA AF testing. Figure 4.3 shows the blue filter transmits above 650 nm, and this is a source to cause a cross-talk effect. Traditionally, the cross-talk effect in the anaglyphic method of displaying stereoscopic images reduces 3D image quality because the cross-talk means that each eye sees a small portion of the perspective image intended for the other eye, and this ghosting image limits the brain s ability to fully fuse the intended images perceived by each eye (Woods, 2012). A similar phenomenon might 144
145 occur in the HTS BVA AF testing with that the ghosting image resulting from incomplete isolation of left and right image channels producing an AR driven by the isolated eye and so interfering with the AR attributed to the measurement eye. Thus, this might be considered as a further limitation to use the HTS BVA AF testing, although the anaglyph method is a cheap and easily used technique. This suggests that the target presentation, in which blue targets are seen through a blue filter, as used in the HTS BVA AF computerised testing, may not be a good choice to stimulate a good accommodative response. Therefore, although computerised testing of AF can be carried out easily with the HTS BV program, caution is necessary in interpreting the measurement results from computerised testing in order to avoid diagnostic errors. 145
146 5. Changes in near horizontal vergence after prolonged near vision work 5.1 Introduction The results of the repeatability study (shown in Table 2.5) in Chapter 2 of this thesis showed that very different measurement values could be obtained when near base-out (convergent) fusional vergence was measured on two separate occasions, one week apart, on the same young adult by using either the computerised method (Coefficient of repeatability (COR): 25.8 Δ in the break point and 23.7 Δ in the recovery point) or the traditional method (COR: 25.0 Δ in the break point and 24.2 Δ in the recovery point). Interestingly, it was also found in an informal chat at the end of measurement sessions of the repeatability study, that some of the study subjects reported feeling fatigue prior to the measurements commencing: it was assumed that this feeling of fatigue might be a consequence of near vision work because the majority of these subjects were university students who are likely to have a heavy near visual demand for study. However, to our best knowledge, the relationship between near vision work and changes of the measurement values of near horizontal fusional vergence remains unclear. In addition, it would be interesting to know whether the near vision work also affects other aspects of the horizontal vergence system which are commonly measured clinically, such as near dissociated phoria, near associated phoria, vergence facility and near point of convergence. Therefore, this study was designed to test a hypothesis that the near horizontal vergence would be influenced by the near vision work carried out prior to taking measurements. The horizontal vergence system controls conjugate movements of both eyes turning in opposite directions to maintain accurate bilateral fixation, such as convergent movements or divergent 146
147 movements to remove retinal disparity error resulting from the changing distances of a single fixation object (Ciuffreda 1992 and Lambooij et al., 2009). Abnormal operation of the horizontal vergence system results in a common symptom of diplopia (Mahto 1972; Porcar & Martinez-Palomera, 1997; Martinez et al., 2009). Near dissociated phoria refers as a deviation from the orthovergence position that occurs when no fusional vergence is presented (Grosvenor and Grosvenor 2007). Contradictory findings on how a near vision work affects near dissociated phoria in adults were reported in previous studies (Yekta et al., 1987; Gratton et al., 1990; Ehrlich et al., 1987). An exo-shift of near dissociated phoria was observed after a day of close work in two field studies carried out by Yekta et al. (1987) and Gratton et al. (1990), respectively. The field study carried out by Yekta et al. (1987) observed that near dissociated phoria had a statistically significantly exo-shift from the mean of 4.38 ± 2.89 exo before work to the mean of 5.17 ± 3.10 exo after work among 84 university students and staff members aged (p < 0.001). The measurements of near dissociated phoria were taken before, and after near work at 7.30 am and 1.30 pm respectively. This was during a normal working day which usually included several hours of close work, but the authors did not know the exact working distance, or the exact duration of close work carried out by each subject. The other field study carried out by Gratton et al. (1990) was conducted on 7 female bank clerks aged who performed their normal data entry work on a computer workstation for 6 hours. Again, the exo-shift of near dissociated phoria by 1.29 ± 2.75 was found after the prolonged close work (mean: exo 5.57 at baseline and exo 6.86 at the end of 6-hour data entry work), but this change of exo-shift did not show statistical significance. However, the eye-screen distance was not fixed because longitudinal shifts of the chairs used by the bank clerks were possible between 40 cms and 80 cms during data entry work. Therefore, 147
148 it is unclear whether the near dissociated phoria would change significantly if the working distance was fixed. In contrast, an eso-shift of near dissociated phoria after close work was found in an experimental study using 15 young adults (Ehrlich et al., 1987). In this experimental study, the close work was carried out at a fixed working distance of 20 cms for 90 minutes with no breaks. The mean of near dissociated phoria statistically significantly changed from exo 4.87 ± 5.2 pre-task to exo 3.25 ± 3.7 post-task (p < 0.05). However, the working distance of 20 cms used in this experimental study represents an extreme near vision work which fails to replicate ordinary close work. Therefore, it would be interesting to know if this eso-shift would also be induced by a conventional near vision distance of cms. Associated phoria is clinically measured as the required amount of prism dioptres which reduces the fixation disparity to zero minutes of arc; and fixation disparity indicates the binocular vergence inaccuracy without fusion being broken (Otto et al., 2008). In the study with 84 subjects mentioned in the previous paragraph, the near associated phoria was found to have a statistically significant exo-shift from mean exo 0.7 ± 0.78 before close work at 7.30 am to mean exo 1.07 ± 1.20 after close work at 1.30 pm in the normal working day (p < 0.001) (Yekta et al., 1997). Similarly, this exo-shift finding of associated phoria is criticized because the close work was not well monitored. A study investigating the effect of a reading task on near associated phoria was carried out on 20 subjects aged between 22 and 30 (Collier and Rosenfield 2011). The reading task was performed by using a laptop computer at a viewing distance of 50 cms for 30 minutes. The near associated phoria was measured at two minute intervals during the course of a 30-minute reading task. No significant change was observed during the course of the 30-minute reading task, but it is not known whether significant changes would be induced by a more prolonged reading task. 148
149 Horizontal fusional vergence describes the ability of performing inward or outward eye movements when retinal disparity is detected, so that the brain can fuse the images when placed on corresponding points in each eye for single binocular vision (Han et al., 2014). In the study carried out by Gratton et al. (1990), it was found that the horizontal fusional vergence amplitude decreased in the 7 female bank clerks aged between 24 and 32 after a day with 6-hours of close work. After close work, positive fusional vergence borderline statistically significantly decreased by 5.4 ± 5.9 (from mean 16.6 to 11.2 ) (p = 0.05), and negative fusional vergence statistically significantly decreased by 2.1 ± 0.8 (from 15.8 to 13.7 ) (p < 0.001). However, it may not be appropriate to generalise this result to the general population of young adults due to the small sample size. Near point of convergence (NPC) is the point of intersection of the visual axes when maximum convergence is exerted (Maples and Hoenes, 2007). Clinicians often notice the NPC becoming poorer when it is measured after prolonged close work is performed, especially for individuals who report fatigue associated with close work. However, there is a lack of scientific studies to support this clinical observation of NPC change. Recently, Zhang et al. (2013) observed that the NPC became more receded after stereo viewing for 30 minutes. The break point and recovery point of NPC statistically significantly increased from 6.83 ± 2.69 cms and 9.70 ± 3.51 cms before stereoscopic viewing to 8.13 ± 3.90 cms and ± 4.42 cms after the stereoscopic viewing (p < 0.05). The authors proposed this change resulted from the fatigue effect from stereoscopic viewing. However, stereoscopic viewing is very different from the conventional 2D viewing of printed reading material, or normal computer use. Therefore, it is not known whether this change of NPC would occur after the conventional 2D viewing. In addition to this short-term change of NPC induced by stereoscopic viewing, it is also recognised that NPC can be altered by exercise as a long term effect. Achieving improved NPC 149
150 measurements has been an important indicator to reflect the progress of vision training treatment for patients with CI (Scheiman et al., 2005 and CITT Study Group, 2008). Therefore, a study investigating whether the short-term change of NPC would occur after ordinary near vision work is necessary. Vergence facility measures clinically how fast the fusional vergence system can respond accurately to different vergence demands repeatedly over time, recorded as the number of cycles per minute (cpm) (Gall et al., 1998). From reviewing previous literature, reported studies investigating vergence facility are relatively few. Most of the studies focused on understanding how the vergence facility test could be optimised for valid test results and accurate diagnosis of binocular anomalies (Gall et al., 1998a; Gall et al., 1998b and Dwyer 1991); and what the normative values of vergence facility were in different age groups or occupational groups (Buzzelli 1986; Pellizzer and Siderov, 1998; Dwyer 1991; Buzzelli et al., 1989). A recent study investigating effectiveness of orthoptic exercises (Horwood and Toor, 2014) appears to be the first to report vergence facility being used as an assessment tool. However, to our knowledge, there is no previous study investigating the changes of vergence facility after close work. Taken together, evidence provided from previous investigations suggest the parameters in near horizontal vergence system such as near dissociated phoria, near associated phoria, near fusional vergence, and NPC might be altered by near vision work, but the exact change of these parameters produced by near vision work does is not agreed. In addition, how these parameters relate to each other during near vision work is still unknown. Therefore, this study aimed to investigate whether the type of close work commonly carried out in everyday life would have a short-term effect on the near horizontal vergence among young adults. The measures of near horizontal vergence chosen for 150
151 investigation were near dissociated phoria, near associated phoria, near horizontal fusional vergence, NPC and vergence facility. 5.2 Methods Subject recruitment and eligibility exam Thirty-five subjects were recruited from students and staff members at the University of Manchester via the research volunteering website and they were healthy adults aged years with normal vision. The subjects were included into this study to undertake vision tasks, with evaluation sessions to monitor the near horizontal vergence system, if they met all the following criteria after an eligibility exam: (1) no strabismus; (2) having visual acuity 6/6 in either eye at distance and at near; (3) emmetropia or ametropia wearing habitual correction which contained the optimal distance prescription; (4) no medication or disease that affects accommodation, fusional vergence or ocular motility. Emmetropia was defined as having less than or equal to refractive error of 0.50 D in spherical equivalent. The habitual correction worn by ametropes was within +/ (spherical equivalent) of the optimum prescription. The protocol of this study was approved by the University of Manchester Research Ethics Committee (project number: 14110) and written informed consent was obtained from all volunteer subjects in this study. The eligibility exam included history taking, refractive exam (based on the maximum plus or minimum minus spherical lens which provides the patient with the best visual acuity) and prism cover test. The history included age, gender, medication history, health history, the duration of sleep in the night before experiment, and the duration of close work performed before the experiment on 151
152 the day of study visit. The close work was determined as doing visual work at a viewing distance within 1 meter e.g. the use of computer and smart phone, reading of printed documents or newspapers. The other tests carried out in the eligibility exam to collect relevant information concerning binocular vision status were: amplitude of accommodation, stereopsis (TNO) and Convergence Insufficiency Symptom Survey (CISS) questionnaire Study design This study contained two phases called 3-hour near vision task NVT (NVT) phase and Pre-NVT phase, and Figure 5.1 shows the experimental timeline of this study. In the 3-hour NVT phase, the eligible subjects undertook a NVT for three hours with four evaluation sessions of Post-0h, Post-1h, Post-2h and Post-3h with a time interval of one hour between each session in the 3-hour NVT phase. The Pre-NVT phase took place prior to the 3-hour NVT, and it was designed to prepare the subjects for the 3-hour NVT phase by including one additional evaluation session at Pre-1h and a distance vision task (DVT) for one hour. The Pre-1h evaluation session contained the same test items as the other four following sessions to make the subjects familiar with the measurements used in this study, and this would help to limit the variation caused by a learning effect occurring during the 3-hour NVT phase. The DVT was to wash out the possible effect accumulated by near vision tasks that might be carried out by the subjects prior to this experiment. The DVT required the subjects to go outdoors to view distant objects all the time by either having a walk or sitting on a bench on the university campus for one hour. The subject was instructed not to view anything located within one meter (e.g. smart phone). The subject was questioned by the investigator to confirm that they had accomplished the required DVT. 152

153 Due to the long duration of this study (over 5 hours), a meal was also provided in this hour. Additionally, the study visit was usually scheduled to start at the subjects earliest convenient time in the morning to minimise the chance that subjects might carry out close work before the study visit commenced. The subjects wore their habitual visual correction (if applicable) to perform the two vision tasks and the 5 evaluation sessions. Figure 5.1 Experimental timeline. NVT: near vision task; DVT: distance near task; E: Evaluation; min: minutes: h: hour. Note: Three dotted areas in evaluation at Pre-1h of NVT, Pre-0h of NVT and Post-3h of NVT indicate time spent on measuring near fusional vergence by three other techniques, and these measurement data are not shown in this thesis Evaluation sessions Each evaluation session contained five common clinical measurements for evaluating how the horizontal vergence system operates, and was carried out in the following order: near dissociated phoria, NPC, near associated phoria, vergence facility and near fusional vergence. The near measurements were all taken at a distance of 33 cms. Additionally, subjective report of the level of visual fatigue was also monitored. Near dissociated phoria was measured by using the modified Thorington phoria technique (Muscle 153
154 Imbalance Measure (MIM) Card). During the measurement, a white light placed behind the MIM card was seen through a small hole in the centre of the horizontal number scale on the MIM card, and a red Maddox rod with grooves placed horizontally was introduced in front of the subject s right eye. The subject was instructed to view the white light and to report the location of a red vertical line by specifying which number on the horizontal scale was crossed by the red vertical line and which side the red line was positioned (to the left or right of the white light). The number crossed by the line indicates the magnitude of the phoria and the side where the line rests indicates the type of phoria (i.e. the left side indicating exophoria and right side indicating esophoria). In addition, the final magnitude of phoria was computed as the original magnitude multiplied by 1.2 (40 cms / 33 cms = 1.2) because the scale of the MIM card used was calibrated for 40 cms instead of 33 cms. For example, if the red line crossed the number 5 of the scale on the left side of white light, it indicated 5 Δ of exophoria, but the final magnitude and direction of phoria was recorded as 6 Δ exophoria. The associated phoria was measured with the near Mallet Unit. The subject was instructed to view at OXO and concentrate on looking at the centre of X while wearing a pair of polarized glasses to allow the right eye only to see the line above the X and left eye only to see the line below the X. The subject was asked if the two lines point exactly at the centre of X or are slightly shifted to one side. If one of the lines misaligned, a prism bar was introduced in front of the subject s eye and the prism power was increased until the shifted line was brought back to centre. The prism bar used in this study ranged from 1 Δ up to 45 Δ with steps of 1, 2, 4, 6, 8, 10, 12, 14, 16, 18, 20, 25, 30, 35, 40, 45 Δ. The direction was determined to be exo-associated phoria for those requiring base-in prism and eso-associated phoria for those requiring base-out prism. The NPC was measured by using the fixation target of a single letter of N5 size (equivalent to 6/9 154
155 reduced Snellen) on a tongue depressor stick. This target was pushed towards the eyes of the subject and then pulled back in the reading plane while the subject fixated the target binocularly. The break point and the recovery point were determined when the subjects subjectively reported the target becoming double and returning to a single light, respectively. If the subject failed to report diplopia before the eyes lost fusion, the objective method to determine the break point (one eye going out) and the recovery point (the repositioning of the diverging eye) were used. The distance between the target and the spectacle plane in each case was measured by a tape measure mounted on the tongue depressor. Near fusional vergence was measured using a stereoscope with a rotary prism which introduced the same amount of prism power in front of each eye when the prism control knob was rotated by the examiner. The fixation target was a single vertical row composed of five letters with N5 size (equivalent to 6/9 reduced Snellen) printed in high contrast on a piece of white paper placed at 33 cms from the subject s spectacle plane. The subject was instructed to view at the target through the viewing window of the stereoscope and keep the target clear and single. Prism power was increased at a constant rate of approximately 2 Δ per second until the subject first reported blur (blur point); a further increase of prism power was introduced until diplopia occurred. At this point, the examiner made a pause on rotating the prism and asked the subject if the target stayed double, or if they could get it back to be single. If the subject could regain and maintain the fusion, the prism power was increased until a sustainable break in fusion was reached (break point). Then, the prism power was decreased until the subject was able to fuse the diplopic images again and reported that the target became single (recovery point). The maximum prism power contained in the stereoscope was 60 Δ. For the subjects who did not lose fusion even at 60 Δ, the break point was recorded as 61 Δ and no 155
156 recovery point was recorded. The base-in fusional vergence was measured first, and then base-out fusional vergence as suggested by Rosenfield et al. (1995) to avoid vergence adaptation. Vergence facility was measured using a prism flipper with magnitude of 3 Δ base-in (BI)/12 Δ base-out (BO). The fixation target was the same as the target used for the near horizontal fusional vergence. The subject was instructed to view the fixation target. Then BI prism was firstly placed in front of subject s right eye to make the target become double. The subject was asked to say now as soon as he/she made the double image become single again. This BI prism was flipped to the BO prism as soon as the subject said now. Then the BO prism was flipped to the BI prism following the same procedure. Fusing one flip of BI prism and one flip of BO prism was counted as one cycle. The number of cycles fused in 30 seconds was recorded. The visual fatigue was measured by using a visual rating scale ranging from 1 to 7 (Figure 5.2). A rating of 1 indicates no perceptible visual fatigue whereas a rating of 7 indicates extreme visual fatigue. This rating system was adopted from a study conducted by Owens and Wolf-Kelly (1987) for assessing the fatigue effects following prolonged near work. No additional description was made to specify the visual fatigue. However, if the subject expressed uncertainty on the rating, they were suggested to rate feelings of eyestrain rather than general fatigue or sleepiness. 156

157 Figure 5.2 Rating scale of visual fatigue. Each vergence measure was taken only once to simulate the situation in actual clinical practice and reduce the time spent on measurements during the NVT task. All measurements were undertaken by one single examiner to avoid inter-examiner variation, and this examiner did not view results of previous evaluation sessions while carrying out subsequent evaluation measures to reduce bias. The subjective evaluation of visual fatigue was always taken before the five horizontal vergence measures and this was to avoid the possible fatigue or discomfort feelings coming from the administration of vergence function test. The illumination of the tests was controlled at illuminance of lux for all measurements Three-hour near vision task The near vision task (NVT) was designed to simulate a common reading task performed on a computer; although with a relatively close working distance of 30 cms to optimise the chance of inducing a certain level of visual fatigue. The near vision task consisted of reading text-based materials. The reading materials were chosen by the subjects themselves in order to maintain optimal attention on looking at the texts. The font size of reading materials was not fixed. Those materials commonly chosen by the subjects could be classified into two following categories: general 157
158 computer reading works such as student s reports, lecture hand-outs and journal articles; and internet surfing for , news, social and networking websites or searching information for general interest. The subject was instructed to view the texts clearly and not to move their gaze away from the screen. To ensure the reading distance remained constant, a marker stick was placed against the subject s forehead for fixing the position of the head (Figure 5.3) and the distance between the subject s eye and the screen of the laptop was monitored throughout the NVT and checked periodically by the examiner. The top of screen was positioned approximately at eye level. The duration of three hours was chosen because it is a duration commonly practiced in general office-based work such as between 9 am and 12 noon before then taking a lunch break. In addition, if the subject had a toilet break during the NVT, the clock was stopped so that they still spent one hour in that part of the task. The subjects were also instructed that they could terminate their participation before the completion time designated without penalty if they have severe fatigue feeling which makes them unable to carry out the rest of NVT or testing sessions during the experiment. The laptop used in the NVT was brought by the subject for the convenient operation on the NVT and for those who were unable to bring their own, an on-site laptop was provided. The ambient illumination was controlled to the level of normal room lighting (illuminance: lux). During the NVT, the subjects were provided non-caffeinated drinks or biscuits if feeling thirsty or hungry. 158

159 Figure 5.3 Three-hour near vision task at a fixed working distance of 30 cms Statistical analysis Descriptive data are presented as mean ± standard deviation or the percentage of the study population. The Shapiro-Wilk test was applied to assess whether the parameters followed a normal distribution. The statistical significance of differences between Post-0h and Post-3h measurements were assessed by paired t-test and Wilcoxon test for parametric data and non-parametric data, respectively. One-way ANOVA on repeated measurements was used to detect any statistically significant difference in the evaluation measures between Post-0h, Post-1h, Post-2h and Post-3h. The Mauchly's test of sphericity was used to test whether the variance of the difference between these time points was equal or not. Pearson s correlation coefficient was used to examine the relationship between the subjective visual fatigue feelings and vergence measurements. All p-values were 2-tailed and were considered statistically significant when the values were < Additionally, p-values shown in multiple comparisons were corrected with Bonferonni adjustment. All data were analysed by using a statistical software package (SPSS for windows, version 22.0, IBM-SPSS Inc., USA). 159
160 The required number of research subjects in this study was estimated as 34 by statistical power analysis using G power (version 3.1) when the effect size, the significance level and study power were set to be at 0.5, 0.05 and 0.8, respectively (Faul et al., 2007 and Faul et al., 2009). 5.3 Results Characteristics of study subjects A total of 35 subjects volunteered to attend the study visit and underwent the screening at the beginning of this study visit. A total of 34 subjects passed the screening and completed all the procedures in the study visit. The one remaining subject, who was found to have alternating strabismus at near, was excluded and the study visit of this subject stopped at the end of the screening. The mean age of these 34 subjects enrolled was 27.4 ± 4.6 years, and the percentage of the meal subjects was 50% (n = 17). The average number of hours of sleep during the night before the experiment was reported as 7.2 ± 0.9 hours (ranging from 5 to 9 hours). A total of 65% of the subjects (n = 22) did not carry out significant amounts ( 5 minutes) of the NVT prior to the experiment: 26% carried out a short period of NVT (6~30 minutes) and 9% a moderate period of NVT (31~90 minutes). Of the 34 subjects, 53% (n = 18) reached the 6/6 binocular visual acuity with their habitual visual correction, and the other 16 subjects (47%) reached binocular visual acuity of 6/6 without visual correction. The 18 subjects wearing visual correction were all myopes with mean spherical equivalent 160
161 (SE) refraction of ± 2.69 D on the right eye and ± 2.76 D on the left eye, and this group consisted of 12 spectacle wearers and 6 contact lenses wearers. The other 16 subjects without habitual correction had a mean SE refraction of 0.19 ± 0.29 D and 0.11 ± 0.42 D on for the right eye and left eye, respectively. The mean and standard deviation of the visual characteristics in the study population are shown in Table 5.1. Although the mean difference of refractive error between two eyes in the subjects was only 0.42 D (ranging from 0.00 D to 1.87 D), there were four subjects whose degree of anisometropia was over 1.00 D. However, none of these four subjects had abnormal stereopsis: all of the 34 subjects had stereopsis better than or equal to 60 sec. of arc. The monocular amplitude of accommodation (AA) for both the right and left eyes ranged from 4.75 D to D. Table 5.1 Visual characteristics of the study population (n = 34). Parameters Visual characteristics measured at eligibility exam Mean ± SD SE of right eye (D) ± 2.67 SE of left eye (D) ± 2.63 Anisometropia (D) a 0.42 ± 0.49 Monocular AA of right eye (D) 8.11 ± 1.61 Stereopsis (sec. of arc) ± Horizontal vergence Pre-1h of NVT Dissociated phoria at near (Δ) Exo 5.82 ± 4.33 NPC break/ recovery (cm) 6.47 ± 3.16/11.27 ± 4.03 Fusional vergence at near (Δ) BI blur/ break/ recovery ± 3.03/19.82 ± 6.44/14.88 ± 5.53 BO blur/ break/ recovery ± 13.45/31.77 ± 12.98/18.57 ± 7.92 Vergence facility (cycles per 30 seconds) 9.94 ± 3.40 Associated phoria at near (Δ) Exo 0.59 ± 1.26 a: The difference of SE between the right eye and the left eye; SE: spherical equivalent; NPC: near point of 161
162 convergence; BI: base-in; BO: base-out; AA: amplitude of accommodation Changes of vergence functions after 3-hour of NVT Table 5.2 displays the mean differences of vergence functions before (Post-0h) and after (Post-3h) the 3-hour NVT. A statistically significant mean increase of 2.2 cms and 2.6 cms was found for the NPC break and recovery points, respectively (p-value: for break and for recovery) after the 3-hour NVT. An eso shift after the 3-hour NVT was found in both dissociated phoria and associated phoria. However, only the eso shift of 1.4 Δ in dissociated phoria was statistically significant (p-value = 0.002). After the 3-hour NVT, the vergence facility showed a small decrease; the near fusional vergence, the BO blur, break and recovery point all increased; and the blur, break and recovery point of BI fusional vergence decreased, but none of these changes reached statistical significance. The standard deviation of the mean NPC break point increased twofold after the 3-hour NVT (from 3.1 cms at Post-0h of the NVT to 6.4 cms at Post-3h of the NVT), as did the NPC recovery point. Of the 34 subjects, there were 20.5% (n = 7) of the subjects who presented a clinically significant change of NPC break (> 5 cms) after the 3-hour NVT. 162
163 Table 5.2 Changes of the vergence functions after 3-hour of NVT in 34 subjects NPC (cm) Post-0h NVT Post-3h Mean difference a P-value Break 6.7± ± ± ** Recovery 11.2± ± ± ** Dissociated phoria at near (Δ) c -5.7± ± ± ** Associated phoria at near (Δ) c -0.7± ± ± Vergence facility (cycles in 30 seconds) 11.0± ± ± Fusional vergence at near (Δ) BI blur 16.6± ± ± BI break 21.2± ± ± BI recovery 17.7± ± ± BO blur 22.9± ± ± BO break 28.6± ± ± BO recovery 20.2± ± ± a (Post-3h)-(Post-0h); b Negative sign denotes exo; ** p-value < 0.025; NVT: Near vision task; NPC: near point of convergence; BI: base-in; BO: base-out. Values were shown in mean ± standard deviation Changes of vergence functions during 3-hour of NVT Figure 5.4 shows the changes of mean NPC over the 3-hour NVT, and it clearly demonstrates that both NPC break and recovery increased at each successive time point (i.e., the NPC deteriorated progressively over the course of a three-hour NVT). The mean value of the NPC break increased progressively from 6.7 ± 3.1 cms at post-0h, 7.0 ± 4.1 cms at post-1h, 8.1 ± 5.2 at post-2h to finally reach 8.9 ± 6.4 at post-3h, and the one-way ANOVA with repeat measure analysis revealed that at least one of these means was statistically significantly different from the others (p = 0.001). The mean value of the NPC recovery increased from 11.2 ± 3.4 cms at post-0h, 12.5 ± 5.5 cms at post-1h, 14.1 ± 7.6 at post-2h to 14.3 ± 7.5 at post-3h, and the same ANOVA as carried out on the NPC break 163
164 revealed that at least one of these means in NPC recovery was statistically significantly different from the others (p = 0.002). Pairwise comparison with Bonferroni adjustment shows that the NPC break had a statistically significant mean increase of 2.2 cms from post-0h to post-3h (p = 0.024), 1.1 cms from post-1h to post-2h (95% CI: , p = 0.024), and 1.8 cms from post-1h to post-3h (p = 0.005) (Figure 5.4), and the NPC recovery had a statistically significant increase of 3.0 cms (p = 0.023) from post-0h to post-3h, and 2.9 cms from post-0h to post-2h (95% CI: , p = 0.048) (Figure 5.4). Figure 5.4 Changes in mean near point of convergence over the 3-hour NVT. Solid line indicates break point. Dotted line indicates recovery point. NVT: near vision task. *: p with Bonferroni adjustment < 0.05; **: p with Bonferroni adjustment < Error bars represent ± 1 standard error of the mean. Figure 5.5 shows the changes of mean dissociated phoria at near over the 3-hour NVT. An overall eso shift after the NVT for 1 hour was observed from the mean phoria of exo 5.7 ± 4.8 Δ at post-0h to exo 4.2 ± 4.8 Δ at post-1h. Then the mean dissociated phoria at post-2h (exo 4.1 ±5.0 Δ) and at post-3h (exo 4.3 ± 5.2 Δ) remained similar with that at post-1h. The one-way ANOVA with repeat measure 164
165 analysis found at least one mean value was statistically significantly different from the other mean values (p < 0.001). The pairwise comparison with Bonferroni adjustment shows the mean dissociated phoria was significantly different for the pairs of post-0h vs post-1h (p < 0.001), post-0h vs post-2h (p = 0.002) and post-0h vs post-3h (p = 0.011). Figure 5.5 Changes in mean dissociated phoria at near over the 3-hour NVT. Y-axis: positive sign indicating eso and negative sign indicating exo. NVT: near vision task; **: p with Bonferroni adjustment < Error bars represent ± 1 standard error of the mean. Figure 5.6, Figure 5.7 and Figure 5.8 show the changes of the mean near associated phoria, vergence facility and near fusional vergence, respectively, measured over the 3-hour NVT. The one-way ANOVA with repeat measures showed that none of these means at post-0h, post-1h, post-2h and post-3h were statistically significantly different in near associated phoria (p = 0.065), vergence facility (p = 0.650) and near fusional vergence in BI blur (p = 0.254), BI break (p = 0.205), BI recovery (p = 0.250), BO blur (p = 0.510), BO break (p = 0.336) and BO recovery (p = 0.253). 165
166 Figure 5.6 Changes in mean associated phoria at Figure 5.7 Changes in the mean vergence facility near over the 3-hour NVT. Y-axis: positive sign indicating eso and negative sign indicating exo. NVT: near vision task. Error bars represent ± 1 standard error of the mean. The differences of these means over the 3-hour NVT. NVT: near vision task. Error bars represent ± 1 standard error of the mean. The differences of these means were not statistically significant. were not statistically significant. Figure 5.8 Changes in mean near fusional vergence of blur point (double solid lines), break points (single solid line) and recovery points (dotted line) over the 3-hour NVT: (a) BI fusional vergence; (b) BO fusional vergence. NVT: near vision task. Error bars represents ± 1 standard error of the mean and one of the error bars for each mean was ignored for clear illustration. The differences of the means were not statistically significant. 166
167 5.3.4 Subjects with a clinically significant change in NPC after 3-hour of NVT A further analysis of NPC break and recovery was conducted on the 7 subjects who presented a change in NPC break change > 5 cms, which is considered to be a clinically significant change, after the 3-hour NVT. Table 5.3 shows these 7 subjects had mean NPC break at post-0h of 10.9 ± 1.6 cms which was recognised as a clinical sign of convergence insufficiency (i.e. NPC break > 10 cm). Table 5.4 shows 85.7% of them (n = 6) had NPC break 10 cms at post-0h of the NVT. Because of these two finding in Table 5.3 and Table 5.4, it is interesting to know how the horizontal vergence functions would change in the subjects with an initially poor NPC. Therefore, a stratified analysis using 10 cm of NPC break at post-0h as a cut-off value was carried out. Among the 34 subjects, there were 9 subjects who had NPC break > 10 cms, a poor NPC, at post-0h. Table 5.3 Mean difference of NPC in the subjects with NPC break change > 5 cms and 5 cms after the three-hour NVT. NPC NPC break change after 3-hour NVT > 5 cms (n = 7) 5 cms (n = 27) Total (n = 34) Break Point Recovery point Post-0h of the NVT 10.9± ± ±3.1 Post-3h of the NVT 19.7± ± ±6.4 Mean difference (3h-0h) 8.9± ± ±4.1 p-value 0.001** ** Post-0h of the NVT 15.1± ± ±3.4 Post-3h of the NVT 25.3± ± ±7.6 Mean difference (3h-0h) 10.1± ± ±5.0 p-value ** ** Values are presented as mean ± standard deviation. NPC: near point of convergence. NVT: near vision task. ** p <
168 Table 5.4 Percentage of the subjects who had significantly receded NPC break after the 3-hour NVT in normal convergence and poor convergence Initial convergence at Post-0h NPC break change after 3-hour NVT > 5 cms (n = 7) 5 cms (n = 27) Poor (NPC break 10 cms) 85.7% (n =6) 11.1% (n = 3) Normal (NPC break < 10 cms) 14.3% (n = 1) 88.9% (n = 24) NPC: near point of convergence; NVT: near vision task Changes of vergence functions in the subjects with an initially poor NPC Table 5.5 shows the mean NPC break and recovery in the subjects with aninitially poor NPC statistically significantly receded by 6.6 ± 5.6 cms and 7.3 ± 6.6 cms, respectively, after the 3-hour NVT (p = for break point and p = for recovery point). In contrast to the subjects with an initially poor NPC, both the mean change of NPC break and recovery in the subjects with an initially normal NPC was less than 1 cm after the 3-hour NVT, and neither of the changes were statistically significant (p-value = for the break point and for the recovery point). The same situation occurred in the analysis of the dissociated phoria at near. The subjects with initially poor NPC had a statistically significant eso-shift of 3.3 ± 1.5 Δ after the 3-hour NVT (p-value < 0.001), but the eso-shift of 0.7 ± 2.2 Δ in the subjects with initially normal NPC was not statistically significant (p-value = 0.144). In near associated phoria, vergence facility and near fusion vergence, none of the mean change after the 3-hour NVT was statistically significant in either the group of subjects with an initially poor NPC, or the group with an initially normal NPC (Table 5.5). Figure 5.9 to Figure 5.14 show the changes of mean values in each near horizontal vergence measurement over the 3-hour NVT in the subjects with an initially poor NPC (n = 9) and with an initially normal NPC (n = 25). 168
169 For NPC, an obvious increasing trend of mean NPC break and recovery over the 3-hour NVT was observed in the subjects with an initially poor NPC (Figure 5.9a), but this trend was not observed in the subjects with an initially normal NPC (Figure 5.9b). The one-way ANOVA with repeat measures found a statistical difference of NPC break and NPC recovery in their four mean values measured over the 3-hour NVT in the subjects with an initially poor NPC (both p < 0.050). Pairwise comparison revealed the mean NPC break of 17.7 ± 5.7 cms at post-3h was statistically significantly greater than that of 11.1 ± 1.5 cms at post-0h (p with Bonferroni correction < 0.050), but the mean NPC recovery of 22.6 ± 7.2 cms at post-3h was not statistically significantly greater than that of ± 1.4 cms at post-0h (p with Bonferroni correction = 0.064), although there is a trend in that direction. In contrast to the subjects with an initially poor NPC, the 3-hour NVT did not significantly affect the NPC break or recovery (both p > 0.050) in the subjects with an initially normal NPC. In near dissociated phoria, a trend to an eso-shift over the 3-hour NVT was observed in the subjects with an initially poor NPC (Figure 5.10a), but the same change was not observed in the subjects with an initially normal NPC (Figure 5.10b). The near dissociated phoria in the subjects with an initially poor NPC showed statistically significantly eso-shift by 3.3 ± 1.5 Δ from post-0h of NVT to post-3h NVT (p-value with Bonferroni correction = 0.001), but the eso-shift of 0.7 ± 2.2 in the subjects with an initially normal NPC was not statistically significant (p-value with Bonferroni correction = 0.862). However, a statistically significant eso-shift of 2.3 ± 1.7 Δ and 1.1 ± 1.8 Δ was observed in the subjects with an initially poor NPC and those with an initially normal NPC, respectively after just one hour of NVT (p-value with Bonferroni correction = and 0.027, respectively) Figure 5.11, Figure 5.12, Figure 5.13, Figure 5.14 show changes in mean values over 3-hour NVT for the near associated phoria, vergence facility, near base-in fusional vergence and near base-out fusion 169
170 vergence. No obvious trend in mean values of near associated phoria over the 3-hour NVT was found in either the group with an initially poor NPC, or an initially normal NPC. A similar observation applies also to the vergence facility, near base-in fusional vergence and near base-out fusional vergence. The one-way ANOVA with repeat measures analysis confirmed this finding. The subjects with an initially poor NPC had non-statistically significant changes in the four mean values over 3-hour NVT in near associated phoria (p = 0.364), vergence facility (p = 0.552), base-in fusional vergence (p = for blur point, for break point and for recovery point) and base-out fusional vergence (p = for blur point, for break point and for recovery point). The subjects with an initially normal NPC also had non-statistical significant changes in the four mean values over 3-hour NVT in near associated phoria (p = 0.140), vergence facility (p = 0.262), base-in fusional vergence (p = for blur point, for break point and for recovery point) and base-out fusional vergence (p = for blur point, for break point and for recovery point). 170
171 Table 5.5 Mean difference after the 3-hour NVT in five vergence functions for the subjects with NPC break 10 cms and < 10 cms at Post-0h of NVT. Subjects with NPC break 10 cms (n = 9) Subjects with NPC break < 10 cms (n = 25) (I) (II) (II)-(I) (III) (VI) (VI)-(III) Mean p-value Mean p-value Post-0h Post-3h Post-0h Post-3h Vergence functions difference difference NPC (cm) Break 11.1± ± ± ** 5.1± ± ± Recovery 15.2± ± ± ** 9.1± ± ± Dissociated phoria at near (Δ) c -6.6± ± ±1.5 <0.001** -5.4± ± ± Associated phoria at near (Δ) c -0.4± ± ± ± ± ± Vergence facility (cycles in 30 seconds) 11.7± ± ± ± ± ± Fusional vergence at near (Δ) BI blur 17.4± ± ± ± ± ± BI break 23.2± ± ± ± ± ± BI recovery 19.8± ± ± ± ± ± BO blur 20.8± ± ± ± ± ± BO break 24.3± ± ± ± ± ± BO recovery 11.9± ± ± ± ± ± Values are presented as mean ± standard deviation. NPC: near point of convergence. NVT: near vision task. **p <
172 Figure 5.9 Changes in mean NPC break (solid lines) and recovery (dotted lines) over the 3-hour NVT: (a) NPC break 10 cms at Post-0h and (b) NPC break < 10 cms at Post-0h. NPC: near point of convergence. NVT: near vision task. Error bars indicate ± 1 standard error. *p-value with Bonferroni correction < Figure 5.10 Changes in mean dissociated phoria at near over the 3-hour NVT: (a) NPC break 10 cms at Post-0h and (b) NPC break < 10 cms at Post-0h. Y axis: negative sign indicates exophoria. NPC: near point of convergence. NVT: near vision task. Error bars indicate ± 1 standard error. *p-value with Bonferroni correction < 0.050; **p-value with Bonferroni correction <
173 Figure 5.11 Changes in mean associated phoria at near over three hours of the NVT: (a) NPC break 10 cms at Post-0h and (b) NPC break < 10 cms at Post-0h.. Y axis: negative sign indicates exophoria; positive sign indicates esophoria. NPC: near point of convergence. NVT: near vision task. Error bars indicate ± 1 standard error. Figure 5.12 Changes in mean vegence facility over three hours of the NVT: (a) NPC break 10 cms at Post-0h and (b) NPC break < 10 cms at Post-0h. NPC: near point of convergence. NVT: near vision task. Error bars indicate ± 1 standard error. 173
174 Figure 5.13 Changes in mean base-in fusional vergence at near over 3 hour of the NVT with blur point (double solid lines), break points (single solid line) and recovery points (dotted line): (a) NPC break 10 cms at Post-0h and (b) NPC break < 10 cms at Post-0h. NVT: near vision task. Error bars represents ± 1 standard error of the mean and one of the error bars for each mean was ignored for clear illustration. Figure 5.14 Changes in mean base-out fusional vergence at near over the 3-hour NVT with blur point (double solid lines), break points (single solid line) and recovery points (dotted line): (a) NPC break 10 cms at Post-0h and (b) NPC break < 10 cms at Post-0h. NVT: near vision task. Error bars represents ± 1 standard error of the mean and one of the error bars for each mean was ignored for clear illustration. 174
175 5.3.6 Visual fatigue scores Table 5.6 shows that the mean visual fatigue score in the 34 subjects was 2.29 ± 1.21 at pre-1h of NVT, and it also shows that undertaking the DVT for one hour statistically significantly decreased the mean visual fatigue score to 1.96 ± 1.11 (p = 0.038). Figure 5.12 reveals an gradual increase in the mean visual fatigue score over the 3-hour NVT, but the increase of these mean fatigue scores during each hour progressively reduced from 0.62 (95% CI: ) in the first, 0.39 (95% CI: ) in the second and 0.29 (95% CI: ) in the third hour of the NVT. The one-way repeated measures ANOVA analysis found the NVT elicited statistically significant changes in visual fatigue score over time (p < 0.001). Pairwise comparison showed that the total mean increase of visual fatigue score of 1.31 (95% CI: ) after the NVT was carried out for three hours was statistically significant (p with Bonferroni correction < 0.001) (Figure 5.12). In addition, the mean visual fatigue score significantly increased from 1.96 ± 1.11 at post-0h to 2.57 ± 1.10 at post-1h and from 2.57 ± 1.10 at post-1h to 2.97 ± 1.19 at post-2h (p with Bonferroni correction = and 0.021), but the mean of 2.97 ± 1.19 at post-2h did not differ from the mean of 3.27 ± 1.27 at post-3h (p with Bonferroni correction = ). Figure 5.13 shows that the three-hour NVT had a statistically significant fatigue effect with a mean increase of the scores of 1.78 (95% CI: ) and 1.14 (95% CI: ) respectively for the subjects with an initially poor NPC (p = 0.006] and those with an initially normal NPC (p <0.001). However, the subjects with an initially poor NPC (mean visual fatigue score: 4.00 ± 1.25) tended to feel significantly more visually tired after the three-hour NVT than the subjects with normal convergence (mean visual fatigue score: 3.00 ± 1.19) (p = 0.041). 175
176 Table 5.6 Visual fatigue scores before and after one-hour DVT. (A) (B) (B)-(A) Before DVT (Pre-1h NVT) After DVT (Post-0h NVT) Mean difference p-value Visual fatigue score 2.29± ± ± * Values are presented as mean ± standard deviation. NVT: near vision task. * p < 0.05 Figure 5.15 Changes in mean visual fatigue score over the 3-hour NVT. NVT: near vision task; **: p with Bonferroni correction < Error bars represent ± 1 standard error of the mean. 176

177 Figure 5.16 Changes of visual fatigue scores between Post-0h (light grey) and Post 3h (dark grey) of the NVT in the subjects with initial NPC break < 10 cms and 10 cms. *: p < 0.050; **: p < 0.025; NS: Not statistically significant. Error bars represent ± 1 standard error of the mean Association between NPC change and visual fatigue change after 3-hour NVT Among the 9 subjects with an initially poor NPC, there was a moderate positive relationship between the mean increase of the NPC break and visual fatigue scores over the three hours of the NVT (r = 0.41, p = 0.275), and a small positive relationship between the mean increase of the NPC recovery and visual fatigue scores (r = 0.21, p = 0.580). Furthermore, among the 25 subjects with normal convergence, both of the mean NPC break (r = 0.02, p = 0.924) and mean NPC recovery (r = -0.08, p = 0.729) showed a negligible relationship with the visual fatigue scores. 177
178 Figure 5.17 Association between NPC and visual fatigue: (a) Subjects with initial NPC break 10 cms and (b) Subjects with initial NPC break < 10 cms. Upper half: NPC break; lower half: NPC recovery Association between near phoria and visual fatigue The association between the change of near phoria and the visual fatigue was low in both the subjects with an initially poor NPC and an initially normal NPC. 178
179 Figure 5.18 Association between near dissociated phoria and visual fatigue score: (a) initial NPC break 10 cms and (b) initial NPC break < 10 cms. 5.4 Discussion This present study is an experimental study investigating how the near horizontal vergence system is affected by the type of prolonged NVT which is commonly performed by young adults. Of the five measurements of the near horizontal vergence system, the mean increase of NPC and the mean eso-shift of near dissociated phoria after the 3-hour NVT showed a statistically significant difference, although none of the other three measurements (i.e. near associated phoria, near fusional vergence, and vergence facility) showed statistically significant changes. Additionally, the amount of change of NPC induced by the 3-hour NVT was greater in the subjects with an initial NPC break 10 cms (break point impaired by 6.6±5.6 cms and recovery point impaired by 7.3±6.6 cms) than in subjects with an initial NPC break < 10 cms (mean break point impaired by 0.6±1.7 cms and mean recovery point impaired by 0.7±2.4 cms). Similar to the NPC, the amount of changes of near dissociated phoria induced by the 3-hour NVT was also greater in the subjects with an initial NPC break 10 cms (mean eso shift of 3.3 Δ) than in the subjects with an initial NPC break < 10 cms (mean eso shift of 0.7 Δ). 179
180 During the 3-hour NVT, the major esophoric shift (from mean exo 5.7 Δ at post- 0h to mean exo 4.2 Δ at post-1h) on near dissociated phoria was observed at the evaluation of post-1h, and the near dissociated phoria at post-2h and post-3h remained very similar (Table 5.5). This is in agreement with a previous experimental study reporting that the near dissociated phoria was changed from pre-task exo 4.87 ± 5.2 Δ to post-task exo 3.25 ± 3.7 Δ in 15 healthy young adults who performed a visual researching task at a viewing distance of 20 cms for 90 minutes (Ehrlich, 1987). Accordingly, this suggests an esophoric shift is observed after one hour of close work, and the post-task shift is considered as phoria adaptation which moves the resting eye position with fusion broken towards a fusional stress point where the close work which is performed (Rosenfield, 1997; Ehrlich, 1987; Sethi, 1986). However, it is unclear how soon this phoria adaptation would occur during the close work is performed for one hour, and further investigation is needed to understand the process of the phoria adaptation induced by close work (i.e. whether phoria adaption induced by close work is a slow adaptation or a fast adaptation; or whether intensity of fusional stress affects phoria adaptation). The esophoric shift of near dissociated phoria was greater in the subject with an initial NPC break 10 cms (by 3.3 Δ) (n = 9) than in the overall group of subjects in this study (by 1.4 Δ) (n = 34), and this suggests that adults with CI might be more susceptible to the near fusional stress than general adult population. The greater esophoric shift associated with close work might result from an effort in bringing more accommodative convergence to aid the overall convergence when CI patients experience a difficulty in maintaining sufficient convergence for close vision work. However, this addition of subtle accommodative convergence does not appear to fully compensate in terms of the NPC measurement because the subjects with CI still presented a significantly impaired NPC after the 3-hour NVT. This might explain why it may not be the case that the NPC always presents a positive association with the magnitude of the near phoria (i.e. greater NPC with greater near exophoria) 180
181 when CI diagnosis is made in clinical practice. Therefore, our data suggest a history taking about close work carried out prior to eye examination is useful to confirm the CI diagnosis when the patient shows a poor NPC with relatively low or close to normal near exophoria. Our hypothesis that the eso-phoric shift results from additional accommodative convergence could occur only if there was an accommodative change induced by close work to drive the accommodative convergence: this accommodative change associated with close work has been observed in previous studies. Ehrlich (1987) found a transient myopia of 0.25 DS along with an esophoric change of near dissociated phoria occurred after a 2 hour near visual task at 20 cms although the phoria was measured after 90-minutes of the visual task. Additionally, Owens and Wolf-Kelly (1987) reported a myopic shift of the resting status of accommodation (dark focus) by an average of 0.6 D after reading at 20 cms for one hour (p < 0.001). More recently, Gwiazda et al. (1995) observed tonic accommodation increased by 1.15 D in myopes, 0.68 D in emmetropes and 0.24 D in hyperopes after 15-minutes of video game playing at 25 cms. However, there is a lack of studies investigating changes of accommodation produced by close work in subjects with CI. This would be interesting to investigate because CI patients usually present with a low AC/A ratio, and these CI patients therefore have to exert more accommodation than an individual with a normal AC/A ratio in order to produce the same amount of accommodative convergence. Therefore, it would be worthwhile to conduct further investigations to address whether the accommodation produced by close work is greater in CI patients than in people without CI, to better understand the mechanism by which patients with CI try to cope with close work. The obvious recession of the NPC induced by the NVT was first observed in the subjects with initial NPC break 10 cms. The deterioration of NPC break by 6.6 cms found in this study is considered as 181
182 clinically significant since a clinical change of NPC break by 4 cms has been defined as such by the CITT Study Group (2008). This finding of significant NPC deterioration induced by the NVT may suggest an explanation why patients with convergence insufficiency (CI) who perform extended periods of close vision work (i.e. reading or computer use) are more likely to report symptoms associated with close vision work (Scheiman and Wick, 2008; Borsting et al., 2003; Granet et al., 2005). The NVT used in the present study is reading text-based materials on a computer such as internet browsing or viewing lecture hand-outs, journal articles etc. This is considered as a realistic simulation of the way that close work is commonly performed nowadays. Additionally, it is likely that the finding in the present study could be generalized to close work on hard copy because the changes of feeling (about comfort for their eyes, mind, body) and vision (acuity, contrast, accommodation and vergence) did not differ for work with hard copy and work with a computer terminal in previous studies (Gould and Grischkowsky, 1984; Owens and Wolf-Kelly, 1987). Comparing the present study and a previous study carried out by Owens and Wolf-Kelly (1987) using the same approach to score the visual fatigue induced by close work (Table 5.7), it might suggest the intensity of near visual stress plays a more important role in determining the subjective visual fatigue feeling than the duration of near visual stress. This is because the mean score of visual fatigue induced by the moderate NVT at 30 cms for 3 hours was lower (3.27 ± 1.27) than that induced by the severe NVT at 20 cms just for 1 hour (4.75 ± 0.22) in Owens and Wolf-Kelly s study. However, Owens and Wolf-Kelly failed to report baseline data for visual fatigue prior to the NVT, so this speculation cannot be confirmed. 182
183 In an NVT using moderate near visual stress for a prolonged period, the subject with an initial NPC break 10 cms were likely to experience more feelings of fatigue than the subjects with initial NPC break < 10 cms (Figure 5.15). This is not surprising because CI patients tend to have visual symptoms associated with close work. However, such changes in reported visual fatigue feeling did not correlate well with the changes of either NPC or near dissociated phoria in the subjects with initial NPC 10 cms performing the NVT for 3 hours (Figure 5.17 and Figure 5.18). One possible explanation is that the threshold of tolerance might be different in these subjects with initial NPC 10 cms. For example, the association between the subjective fatigue and the objective finding could be diluted (especially in a small sample) if there are some subjects with a large change in the objective measure, but he/she also has a higher threshold of tolerance leading to less reported change in visual fatigue. Additionally, the subjects recruited into the present study (n = 34) can be considered as a general population group without severe non-strabismic binocular vision anomalies, since none of the subjects reported a feeling of severe fatigue making them unable to carry out the whole NVT. Table 5.7 Comparison of visual fatigue induced by close work at 30 cms (the present study) and by close work at 20 cms (Owens and Wolf-Kelly, 1987). Visual fatigue score 1 Close work at 30 cms (the present study, n = 34) Close work at 20 cms (Owens and Wolf-Kelly, 1987, n = 28) at post-0h 1.96 ± at post-1h 2.57 ± ± 0.22 at post-2h 2.97 ± at post-3h Scored from a rating score ranging from 1 (no perceptible visual fatigue) to 7 (extreme visual fatigue). There are several limitations in the present study. First, no additional evaluation session was administered after the completion of proper rest following the 3-hour NVT. This means that we do not know the retention time of the change of NPC and near dissociated phoria. Second, we do not know whether the vergence facility, near fusional vergence and near associated phoria would show a 183
184 significant change if an NVT was carried out longer than 3 hours although such a study would be very difficult to conduct. Third, it is also unknown whether the changes induced by the NVT would accumulate if further study visits were carried out on consecutive days to mimic the situation of an occupation involving intensive close work on 5 days per week. This is the first study observing the changes of near vergence system produced by prolonged NVT on young adults in experimental setting with well controlled duration and viewing distance of the NVT. The data suggest that the NPC and near dissociated phoria tend to be altered by the prolonged NVT, especially in those subjects with initially poor convergence. 184
185 6. General discussion In many aspects of life, computerised programs generally help people perform their works and carry out daily activities conveniently and efficiently. There is a tendency that the computerised program has taken over many conventional working practices if the computerised program is available and financially affordable. With the same trend in optometric practice, optometrists also use computerised programs to perform clinical examination of the eye and vision. However, whilst there is an attraction to choose the computerised programs in daily optometric practice for convenience and manpower savings, it is likely to ignore potential problems such as how reliable the computerised programs are. To address this issue, this thesis consists of a series of four studies. The first two studies evaluated two commercially available computerised programs for management of binocular vision anomalies: one is HTS BVA program (diagnosis program on measuring binocular vision functions) and the other is HTS inet program (vision training program on treating binocular vision anomalies). Based on evaluation results in the HTS BVA program study, the last two studies investigated the possible factors influencing the reliability of the computerised measurement of binocular vision functions. This chapter gives the scientific opinions in the use of these computerised programs in management of binocular vision anomalies, and makes suggestions, based on the study results obtained in this thesis, for the optimization of such a computerised program for measuring binocular vision functions. 6.1 Summary To discover the performance of the computerised programs in the management of binocular vision anomaly, the repeatability of the computerised diagnosis program was the first step to be evaluated in this thesis. Poor repeatability would mean the program is unable to provide reliable data for 185
186 diagnosis and unstable measurements would make it unsuitable for use as an assessment tool to monitor the treatment progress. The study in Chapter 2 investigated inter-session repeatability of the computerised testing on measuring the binocular vision functions of near dissociated phoria, near fusional vergence (FV) and accommodative facility (AF) among young adults. Surprisingly, the study findings revealed that none of these three computerised measurements presented higher repeatability than the corresponding traditional measurements. Therefore this result did not fit the expectation that the automatic measurements of computerised program should be able to produce more repeatable measurement results (n=33). Among these results, the computerised AF testing showed more variable test-retest results than the traditional flipper AF testing (COR: 8.39 cpm vs 5.47 cpm_ computerised testing vs traditional testing). Furthermore, the computerised FV testing demonstrated the test-retest variation was as extreme as the traditional step FV testing (COR of base-out break: Δ vs Δ _ computerised testing vs traditional testing). Alongside the evaluation of repeatability of computerised testing, the effectiveness of computerised vision training on improving convergence functions for treating convergence insufficiency (CI) patients was assessed in the study described in Chapter 3. This study was carried out as a pilot study to collect sufficient data for conduction of a rigorous randomized clinical trial (RCT), and it found the clinically significant improvements in the convergence functions (i.e. NPC and near base-out FV break) and the CI symptoms (i.e. CISS score) were demonstrated among 40%-60% of the research subjects with CI after an 8-week home-based treatment regime of computerised vision training (n=5). This therefore suggests that it would be appropriate to include the computerised home-based training as one of the treatment arms in a RCT. Obviously, the computerised vision training showed good ability to improve binocular vision 186
187 functions in the effectiveness study, but the poor repeatability in computerised diagnostic measurements means that it is a questionable method of monitoring the treatment progress. Therefore, two experimental studies carried out in this thesis were to find out why the measurements of binocular vision functions were unable to achieve repeatable results. Although the computerised testing was disappointing in this regard, traditional testing is almost as poor. Therefore, one of these studies was specific to the computerised methodology (the AF testing), and one was applicable to both methods (the FV testing). Firstly, we assumed the variable test-retest measurement results of the computerised AF testing might be caused by inaccurate accommodative response (AR) stimulated by the accommodative targets because the influence of different accommodative target conditions on repeatability of AF testing remains unclear. Therefore, one of the experimental studies (Chapter 4) was designed to test this assumption. This study was to see if the novel accommodative targets (i.e. the red/blue anaglyphic targets) of the computerised AF testing stimulated the accurate AR in the testing process, and the study results showed a significant reduction of AR under the relatively high accommodative demand (4 D) when the accommodative targets were in blue or with the extremely low luminance contrast in which the colour target was seen through the colour filter (n=51). Secondly, we assumed that the unstable repeated measurements of both the computerised and the traditional near FV testing might result from the near vision work carried out prior to the testing start. Therefore, the other experimental study (Chapter 5) was to test the above assumption. This study investigated how the near horizontal vergence system including the near FV was altered by the near vision task (NVT) for three consecutive hours. The study results showed statistically significant changes in NPC break, which increased by 2.2 cms, and in near dissociated phoria which eso-shifted 187
188 by 1.4 Δ after the 3-hour NVT. However, near horizontal FV did not show such changes (n=34). Interestingly, the further sub-group analyses found the greater changes in the NPC break and near dissociated phoria were present in the subjects with initially poor NPC (I.e. NPC break increasing by 6.6 cms and near dissociated phoria shifting by 3.3 Δ with eso-direction, n=9) than the subjects with normal NPC (I.e. NPC break increasing by 0.6 cms and near dissociated phoria shifting by 0.7 Δ with eso-direction, n=25) when the poor NPC was defined as NPC break greater than 10 cms. 6.2 Implications From clinical perspectives, diagnostic tests with great variability in test-retest measurements should not be employed in clinical practice. They yield unreliable results regarding the physical status which a patient/or an individual has, and this would result in a high chance of making false diagnoses, or incorrect judgements on the effectiveness of a particular optometric treatment. However, optometrists sometimes use diagnostic testing with mild-to-moderate variability of test-retest measurement: for example, the testing of near base-out FV limit (Rouse et al., 2002). The variability in repeated measurements comes from measurement errors in collecting clinical data, and the measurement errors are due to either random errors or systematic errors (Hulley et al., 2013). Random errors in clinical measurements result from unknown and unpredictable changes in the measurement process by chance, and these changes usually occur from the measuring instruments or from the environmental conditions. In order to approach a true value from unstable measurements at onset, averaging over several measurements is usually used to control the random errors in clinical medicine (Hulley et al., 2013; Taylor, 1996). The same concepts could be applied for the computerised testing programs we investigated for reaching a convincing result, and we suggest 188
189 the computerised measurements of a particular binocular vision function should be taken more than once, if time allows, and the average of these measurements then reduces the impact of random errors. Furthermore, it is still possible that the convergence functions in the treatment period of CI vision training are improved by chance, when the convergence function is monitored by testing with mild-to-moderate variability, and a wrong judgement might be made regarding the effectiveness of vision training for treating CI patients. It is important therefore that, as in the current study, when evaluating the effectiveness of CI vision training, not only the FV test is used as the assessment tool but also the NPC test and CI symptoms questionnaire. Having improvements observed by all these three assessment tools after treatment, increases confidence when judging that treatment is effective. Systematic errors refer to deviations in a particular direction from a true value, and the measuring instruments are usually the main source of the systematic errors under the assumption that measuring status of the tested human subject/object remains constant (Hulley et al., 2013). The finding in this thesis that the mean AF measured at Session 2 was significantly higher than that at Session 1 in the computerised measurements (Table 2.8) is considered a systematic error, due to a learning effect. This learning effect may come from the improvement of eye-hand coordination through repeated measurements. Based on the design of the computerised AF testing, the computerised AF measurement result may be affected by the speed of the subject pressing correct arrow keys with fingers when the subject sees the accommodative targets become clear for completion of the tasks given by the computerised program. Therefore, the better result of computerised AF testing in the repeated measurement of Session 2 may be caused by the subject presenting quicker speed to press arrow keys through the practice in the repeated measurements. 189
190 Overall, we consider the current computerised diagnostic testing can be a support to be used together with traditional diagnostic testing in the measurement of binocular vision functions in clinical practice, because the computerised testing can provide the additional evidence to help optometrists confirm the diagnosis made from the data of traditional testing. We suggest that the computerised tests should be used cautiously in the diagnosis of binocular vision anomalies, despite their ability to provide an easy and convenient manner to assess binocular vision functions with an objective and automated measurement. In Chapter 4, we found that accommodative target design is an important factor which can influence the accuracy of the accommodative response in the computerised AF testing. In our opinion, the poor accommodative response stimulated may produce measurement errors in the computerised AF measurements. Thus, we suggested that development of the computerised program for binocular vision functions should select the adequate target design to prevent the occurrence of this type of systematic error during the testing. In Chapter 5, we found that performing a near vision task is an important factor to change the vergence system in the people with poor convergence. This means the stability of the ocular motor status in the individual with poor convergence could be influenced by the duration of a proceeding near vision task. It is important to maintain the stability of binocular status to have a convincing result presenting the reliability of a testing from inter-sessional repeated measurements. Therefore, we suggest the duration of near vision work prior to the start of measurement should be controlled to stabilize the ocular motor status when inter-session repeated measurements are carried out on the people with poor convergence. 190
191 The computerised vision training has the potential to be an effective home-based treatment to improve CI because the computerised program acts as a personal vision trainer to adjust the difficulty level of vision training according to the patient s training progress: it is likely to enhance the patient s motivation by incorporating the vision training with computer games. This concept is also demonstrated in the pilot study with the results that around half of the subjects with CI showed improvements in the CI signs and CI symptoms after training in the computerised vision training. However, a genuine effectiveness of computerised vision training for CI, and a comparison of effectiveness versus traditional home-based methods, still needs to be investigated by a randomised clinical trial with a well-controlled placebo group, in the future. If the effectiveness of computerised vision training is proven in a rigorous manner, we expect the computerised vision training program may benefit the patients for whom office-based vision training is not available or affordable. 6.3 Conclusions The HTS BVA computerised programs of diagnostic testing in measurement of binocular vision functions failed to present good reliability from inter-session repeated measurements, but the HTS inet computerised programs of vision training showed a potential to be an effective home-based treatment in improving CI. Unstable measurements in binocular vision functions might result from the influence of the specific accommodative targets used, and the unstable ocular motor status of tested subjects. 191
192 7. References Abraham, N. G., Srinivasan, K., Thomas, J. (2015). Normative data for near point of convergence, accommodation, and phoria. Oman Journal of Ophthalmology, 8(1): 14. Adler, P. M. (2002). Efficacy of treatment for convergence insufficiency using vision therapy. Ophthalmic and Physiological Optics 22(6): Adler, P. M., Cregg, M., Viollier, A. J., Margaret W. J. (2007). Influence of target type and RAF rule on the measurement of near point of convergence. Ophthalmic and Physiological Optics 27(1): Aggarwala, K. R., Nowbotsing, S., Kruger, P. B. (1995). Accommodation to monochromatic and white-light targets. Investigative Ophthalmology & Visual Science, 36(13): Aldaba, M., Gómez-López, S., Vilaseca, M., Pujol, J., & Arjona, M. (2015). Comparing Autorefractors for Measurement of Accommodation. Optometry & Vision Science, 92(10): Altman, D. G., Bland, J. M. (1983). Measurement in medicine: the analysis of method comparison studies. The Statistician, 32(3): Anderson, M. (1961). Orthoptic treatment of loss of convergence accommodation caused by road accidents (" whiplash" injury). British Orthoptic Journal 18: Antona, B., Barrio, A., Barra, F., Gonzalez, E., Sanchez, I. (2008). Repeatability and agreement in the measurement of horizontal fusional vergences. Ophthalmic and Physiological Optics, 28(5): Arnoldi, K., & Reynolds, J. D. (2007). A review of convergence insufficiency: what are we really accomplishing with exercises? American Orthoptic Journal, 57(1): Atchison, D. A., Strang, N. C., & Stark, L. R. (2004). Dynamic accommodation responses to stationary colored targets. Optometry & Vision Science, 81(9): Bade, A., Boas, M., Gallaway, M., Mitchell, G. L., Scheiman, M., Kulp, M. T., & Rouse, M. (2013). Relationship between clinical signs and symptoms of convergence insufficiency. Optometry and vision science, 90(9):
193 Bakaraju, R. C., Yeotikar, N. S., & Rao, V.S. (2007). Accommodative lag versus different stimuli. Journal of Modern Optics, 54(9): Bashir, M., Afzal, M. T., & Azeem, M. (2008). Reliability and validity of qualitative and operational research paradigm. Pakistan Journal of Statistics and Operation Research, 4(1): Bedford, R. E., & Wyszecki, G. (1957). Axial chromatic aberration of the human eye. Journal of the Optical Society of America, 47(6): Benel, R. A., & Benel, D. C. (1992). Influence of background appearance on visual accommodation. In: Proceedings of the Human Factors and Ergonomics Society Annual Meeting. USA: SAGE Publications, 36(18): Benjamin, W. J. (2006). Borish's Clinical Refraction. 2nd ed. USA: Butterworth-Heinemann. Birnbaum, M. H., Soden, R., & Cohen, A. H. (1999). Efficacy of vision therapy for convergence insufficiency in an adult male population. Journal of the American Optometric Association, 70(4): Bland, J. M., & Altman, D. (1986). Statistical methods for assessing agreement between two methods of clinical measurement. The Lancet, 327(8476): Blum, H. L. (1959). Vision Screening for Elementary Schools: The Orinda study. Berkeley: University of California Press. Borsting, E. J., Rouse, M. W., De Land, P. N. (1999). Prospective comparison of convergence insufficiency and normal binocular children on CIRS symptom surveys. Optometry and Vision Science 76(4): Borsting, E. J., Rouse, M. W., Mitchell, G. L., Scheiman, M., & Cotter, S. A. (2003a). Validity and reliability of the revised convergence insufficiency symptom survey in children aged 9 to 18 years. Optometry & Vision Science, 80(12): Borsting, E. J., Rouse, M. W., Deland, P. N., Hovett, S., Kimura, D., Park, M., & Stephens, B. (2003b). Association of symptoms and convergence and accommodative insufficiency in school-age children. Optometry, 74(1):
194 Brautaset R. L., Jennings, A. J. M. (2006). Effects of orthoptic treatment on the CA/C and AC/A ratios in convergence insufficiency. Investigative Ophthalmology and Visual Science, 47(7): Brennan, P., & Silman, A. (1992). Statistical methods for assessing observer variability in clinical measures. British Medical Journal, 304(6840): Burgio, L., Lichstein, K. L., Nichols, L., Czaja, S., Gallagher-Thompson, D. (2001). Judging outcomes in psychosocial interventions for dementia caregivers: The problem of treatment implementation. The Gerontologist, 41(4): Burke, J. P., Shipman, T. C., Watts, M. T. (1993). Convergence insufficiency in thyroid eye disease. Journal of Pediatric Ophthalmology and Strabismus 30(2): Buzzelli, A. R. (1986). Vergence facility: developmental trends in a school age population. American journal of optometry and physiological optics, 63(5): Buzzelli, A. R., Trowell-Harris, I., & Protsko, R. (1989). The measurement of visual efficiency standards for pilots in the United States Air Force. Military medicine, 154(7): Capó-Aponte, J. E., Tarbett, A. K., Urosevich, T. G., Temme, L. A., Sanghera, N. K., & Kalich, M. E. (2012). Effectiveness of computerized oculomotor vision screening in a military population: Pilot study. Journal of Rehabilitation Research & Development, 49 (9): Capobianco, N. M. (1952). The subjective measurement of the near point of convergence and its significance in the diagnosis of convergence insufficiency. American Orthoptic Journal, 2: Carlson, N. B., Kurtz, D. (2004). Clinical Procedures for Ocular Examination. 3rd ed. USA: McGraw-Hill. Carmines, E. G., Zeller, R. A. (1979). Reliability and Validity Assessment. UK: Sage Publications, Inc. Casillas, E. C., and Rosenfield, M. (2006). Comparison of subjective heterophoria testing with a phoropter and trial frame. Optometry & Vision Science, 83(4): Cebrian, J. L., Antona, B., Barrio, A., Gonzalez, E., Gutierrez, A., & Sanchez, I. (2014). Repeatability of the Modified Thorington Card Used to Measure Far Heterophoria. Optometry & Vision Science, 91(7):
195 Chat, S. W., & Edwards, M. H. (2001). Clinical evaluation of the Shin Nippon SRW 5000 autorefractor in children. Ophthalmic and Physiological Optics, 21(2): Chen, D., & Lam, A. K. (2007). Intrasession and intersession repeatability of the Pentacam system on posterior corneal assessment in the normal human eye. Journal of Cataract & Refractive Surgery, 33(3): CITT (Convergence Insufficiency Treatment Trial) Study Group (2008a). Randomized clinical trial of treatments for symptomatic convergence insufficiency in children. Archives of Ophthalmology, 126(10): CITT (Convergence Insufficiency Treatment Trial) Study Group. (2008b). The convergence insufficiency treatment trial: design, methods, and baseline data. Ophthalmic epidemiology, 15(1): Ciuffreda, K. J. (1974). Near point of convergence as a function of target accommodative demand. Optical Journal and Review of Optometry, 111: Ciuffreda, K. J. (1992). Components of clinical near vergence testing. Journal of Behaviour Optometry, 3(1): Ciuffreda, K. J., & Tannen, B. (1995). Eye Movement Basics for the Clinician. St. Louis: Mosby. Ciuffreda, M. A., Ciuffreda, K. J., & Wang, B. (2006). Repeatability and variability of near vergence ranges. Journal of Behaviroural Optometry, 17: Collier, J. D., & Rosenfield, M. (2011). Accommodation and convergence during sustained computer work. Journal of the American Optometric Association, 82(7): Cooper, J, Duckman R. (1978). Convergence insufficiency - incidence, diagnosis, and treatment. Journal of the American Optometric Association, 49(6): Cooper, J. (1988). Review of computerized orthoptics with specific regard to convergence insufficiency. American journal of optometry and physiological optics, 65(6): Cooper, J., & Feldman, J. (2009). Reduction of symptoms in binocular anomalies using computerized home therapy HTS. Optometry - Journal of the American Optometric Association, 80(9):
196 Corbett, A., Maples, W. C. (2004). Test-retest reliability of the Saladin card. Optometry Journal of the American Optometric Association, 75(10): Cronbach, L. J. (1947). Test reliability : Its meaning and determination. Psychometrika, 12(1): Dalziel, C. C. (1981). Effect of vision training on patients who fail Sheard's criterion. American journal of optometry and physiological optics, 58(1): Daum, K. M. (1988). Characteristics of convergence insufficiency. American Journal of Optometry and Physiological Optics, 65(6): Davies, L. N., Mallen, E. A. H., Wolffsohn, J. S., & Gilmartin, B. (2003). Clinical evaluation of the Shin-Nippon NVision-K 5001/Grand Seiko WR-5100K autorefractor. Optometry & Vision Science, 80(4): de Vet, H. C. W., Terwee, C. B., Knol, D. L., Bouter, L. M. (2006). When to use agreement versus reliability measures. Journal of Clinical Epidemiology, 59(10): Duane, A. (1896). A new classification of the motor anomalies of the eye based upon physiological principles, together with their symptoms, diagnosis and treatment. Annals of Ophthalmology and Otology, 5: Duke-Elder, S. (1949). Textbook of Ophthalmology. St. Louis: Mosby. Dusek, W. A., Pierscionek, B. K., & McClelland, J. F. (2011). An evaluation of clinical treatment of convergence insufficiency for children with reading difficulties. BMC Ophthalmology, 11(1): 21. Dwyer, P. S. (1991). Clinical criteria for vergence accommodation dysfunction. Clinical and Experimental Optometry, 74(4): Dwyer, P. (1992). The prevalence of vergence accommodation disorders in a school age population. Clinical and Experimental Optometry, 75(1): Dwyer, P., Wick, B. (1995). The influence of refractive correction upon disorders of vergence and accommodation. Optometry and Vision Science, 72(4): Ehrlich, D. L. (1987). Near vision stress: vergence adaptation and accommodative fatigue. Ophthalmic and Physiological Optics, 7(4):
197 Erickson, G. B., Citek, K., Cove, M., Wilczek, J., Linster, C., Bjarnason, B., & Langemo, N. (2011). Reliability of a computer-based system for measuring visual performance skills. Journal of the American Optometric Association, 82(9): Eskridge, J. B., Amos, J. F., Bartlett, J. D. (1991). Clinical Procedures in Optometry. USA: Lippincott Williams and Wilkins. Evans, B. J. W. (2007). Pickwell's Binocular Vision Anomalies. 5th ed. USA: Elsevier. Faul, F., Erdfelder, E., Lang, A. G., & Buchner, A. (2007). G*Power 3: A flexible statistical power analysis program for the social, behavioral, and biomedical sciences. Behavioral Research Methods, 39: Faul, F., Erdfelder, E., Buchner, A., & Lang, A. G. (2009). Statistical power analyses using G*Power 3.1: Tests for correlation and regression analyses. Behavioral Research Methods, 41: Feldman, J., & Cooper, J. (1980). Rapid assessment of stereopsis in pre-verbal children using operant techniques: a preliminary study. Optometry. Journal of the American Optometric Association, 51(8): Feldman, J. M., Cooper, J., Carniglia, P., Schiff, F. M., & Skeete, J. N. (1989). Comparison of fusional ranges measured by Risley prisms, vectograms, and computer orthopter. Optometry & Vision Science, 66(6): Fleiss, J. L. (1986). The Design and Analysis of Clinical Experiments. Canada: John Wiley and Sons. Flint, A., Raben, A., Blundell, J. E., & Astrup, A. (2000). Reproducibility, power and validity of visual analogue scales in assessment of appetite sensations in single test meal studies. Journal of the International Association for the Study of Obesity, 24(1): Gall, R., Wick, B., & Bedell, H. (1998a). Vergence facility and target type. Optometry & Vision Science, 75(10): Gall, R., Wick, B., & Bedell, H. (1998b). Vergence facility: establishing clinical utility. Optometry & Vision Science, 75(10): Gallaway, M., Scheiman, M., & Malhotra, K. (2002). The effectiveness of pencil pushups treatment for convergence insufficiency: a pilot study. Optometry & Vision Science, 79(4):
198 García-Muñoz, A., Carbonell-Bonete, S., & Cacho-Martínez, P. (2014). Symptomatology associated with accommodative and binocular vision anomalies. Journal of Optometry, 7(4): Gordis, L. (2004). Epidemiology. 3rd ed. USA: Saunders. Goss, D. A. (1995). Ocular Accommodation, Convergence, and Fixation Disparity: A Manual of Clinical Analysis. 2nd ed. Boston: Butterworth-Heinemann. Goss, D. A., Downing, D. B., Lowther, A. H., Horner, D. G., Blemker, M., et al. (2007). The Effect of HTS Vision Therapy Conducted in a School Setting on Reading Skills in Third and Fourth Grade Students. Optometry & Vision Development, 38(1): Goss, D. A., Moyer, B. J., & Teske, M. C. (2008). A comparison of dissociated phoria test findings with von Graefe phorometry & modified Thorington testing. Journal of Behaviour Optometry, 19(6): 145. Goss, D. A., Becker, E. (2011). Comparison of near fusional vergence ranges with rotary prisms and with prism bars. Optometry 82(2): Gould, J. D., & Grischkowsky, N. (1984). Doing the same work with hard copy and with cathode-ray tube (CRT) computer terminals. The Journal of the Human Factors and Ergonomics Society, 26(3): Granet, D. B., Gomi, C. F., Ventura, R., & Miller-Scholte, A. (2005). The Relationship between Convergence Insufficiency and ADHD. Strabismus, 13(4): Gratton, I., Piccoli, B., Zaniboni, A., Meroni, M., & Grieco, A. (1990). Change in visual function and viewing distance during work with VDT. Ergonomics, 33(12): Grisham, J. D. (1988). Visual therapy results for convergence insufficiency: a literature review. American Journal of Optometry and Physiological Optics 65(6): Groffman, S. (1997). Consideration of Individual Characteristics and Learning Theory in Vision Therapy. St. Louis: Mosby. Grosvenor, T. & Grosvenor, T. P. (2007). Primary Care Optometry. 5th ed. St. Louis: Elsevier Health Sciences. 198
199 Gwiazda, J., Bauer, J., Thorn, F., & Held, R. (1995). Shifts in tonic accommodation after near work are related to refractive errors in children. Ophthalmic and Physiological Optics, 15(2): Haber, M., Barnhart, HX., Song, J., Gruden, J. (2005). Observer variability: a new approach in evaluating interobserver agreement. Journal of Data Science 3: Han, S. J., Guo, Y., Granger Donetti, B., Vicci, V. R., & Alvarez, T. L. (2010). Quantification of heterophoria and phoria adaptation using an automated objective system compared to clinical methods. Ophthalmic and Physiological Optics, 30(1): Han, J., Hong, S., Lee, S., Kim, J. K., Lee, H. K., & Han, S. H. (2014). Changes in fusional vergence amplitudes after laser refractive surgery for moderate myopia. Journal of Cataract & Refractive Surgery, 40(10): Hartwig, A., Charman, W. N., & Radhakrishnan, H. (2011). Accommodative response to peripheral stimuli in myopes and emmetropes. Ophthalmic and Physiological Optics, 31(1): Hayes, G. J., Cohen, B. E., Rouse, M. W., De Land, P. N. (1998). Normative values for the nearpoint of convergence of elementary schoolchildren. Optometry and Vision Science 75(7): Heijl, A., Lindgren, A., & Lindgren, G. (1989). Test-retest variability in glaucomatous visual fields. American Journal of Ophthalmology, 108(2): Hermann, J. S. (1981). Surgical therapy for convergence insufficiency. Journal of Pediatric Ophthalmology and Strabismus, 18(1): Hirsch, M. J., Bing, L. B. (1948). The effect of testing method on values obtained for phoria at 40 centimeters. American Journal of Optometry & Archives of American Academy of Optometry, 25(9): Horwood, A. M., Toor, S., & Riddell, P. M. (2014a). Screening for convergence insufficiency using the CISS is not indicated in young adults. British Journal of Ophthalmology, 98(5): Horwood, A., & Toor, S. (2014b). Clinical test responses to different orthoptic exercise regimes in typical young adults. Ophthalmic and Physiological Optics, 34(2): Howarth, P. A., & Bradley, A. (1986). The longitudinal chromatic aberration of the human eye, and its correction. Vision Research, 26(2):
200 Howarth, P. A., Heron, G. (2000). Repeated measures of horizontal heterophoria. Optometry and Vision Science, 77(11): Hulley, S. B., Cummings, S. R., Brower, W. S., Grady, D. G., Newman, T. B. (2007). Designing Clinical Research. USA: Lippincott Williams & Wilkins. Iribarren, R., Fornaciari, A., & Hung, G. K. (2001). Effect of cumulative nearwork on accommodative facility and asthenopia. International Ophthalmology, 24(4): Johns, H. A., Manny, R. E., Fern, K., Hu, Y. S. (2004). The intraexaminer and interexaminer repeatability of the alternate cover test using different prism neutralization endpoints. Optometry and Vision Science, 81(12): Kedzia, B., Pieczyrak, D., Tondel, G., & Maples, W. C. (1999). Factors affecting the clinical testing of accommodative facility. Ophthalmic and Physiological Optics, 19(1): Kim, L. S., McAnany, J. J., Alexander, K. R., & Fishman, G. A. (2007). Intersession repeatability of Humphrey perimetry measurements in patients with retinitis pigmentosa. Investigative Ophthalmology & Visual Science, 48(10): Kirscher, D. W. (1992). Sports vision training procedures. Optometry clinics: the official publication of the Prentice Society, 3(1): Koozekanani, D., Roberts, C., Katz, S. E., & Herderick, E. E. (2000). Intersession repeatability of macular thickness measurements with the Humphrey 2000 OCT. Investigative Ophthalmology and Visual Science, 41(6): Kröger, R. H., & Binder, S. (2000). Use of paper selectively absorbing long wavelengths to reduce the impact of educational near work on human refractive development. British Journal of Ophthalmology, 84(8): Krohel, G. B., Kristan, R. W., Simon, J. W., Barrows, N. A. (1986). Posttraumatic convergence insufficiency. Annals of Ophthalmology, 18(3): Kruger, P. B., Mathews, S., Aggarwala, K. R., & Sanchez, N. (1993). Chromatic aberration and ocular focus: Fincham revisited. Vision Research, 33(10):
201 Lambooij, M., Fortuin, M., Heynderickx, I., & Ijsselsteijn, W. (2009). Visual discomfort and visual fatigue of stereoscopic displays: a review. Journal of Imaging Science and Technology, 53(3): Langaas, T., Riddell, P. M., Svarverud, E., Ystenaes, A. E., Langeggen, I., & Bruenech, J. R. (2008). Variability of the accommodation response in early onset myopia. Optometry & Vision Science, 85(1): Lara, F., Cacho, P., Garcia, A., Megias, R. (2001). General binocular disorders: prevalence in a clinic population. Ophthalmic and Physiological Optics, 21(1): Lavrich, J. B. (2010). Convergence insufficiency and its current treatment. Current Opinion in Ophthalmology, 21(5): Lee, J. (1992). Evaluating agreement between two methods for measuring the same quantity: a response. Computers in Biology and Medicine, 22(5): Leon, A. C., Davis, L. L., & Kraemer, H. C. (2011). The role and interpretation of pilot studies in clinical research. Journal of Psychiatric Research, 45(5): Leslie, S. (1997). Applied Concepts of Vision Therapy. St. Louis: Mosby. Letourneau, J. E., Lapierre, N., Lamont, A. (1979). Relationship between convergence insufficiency and school-achievement. American Journal of Optometry and Physiological Optics, 56(1): Lichstein, K. L., Riedel, B. W., & Grieve, R. (1994). Fair tests of clinical trials: A treatment implementation model. Advances in Behaviour Research and Therapy, 16(1): Luckiesh, M., & Moss, F. K. (1935). Fatigue of convergence induced by reading as a function of illumination intensity. American Journal of Ophthalmology, 18(4): Ma, D. J., Yang, H. K., & Hwang, J. M. (2013). Reliability and Validity of an Automated Computerized Visual Acuity and Stereoacuity Test in Children Using an Interactive Video Game. American journal of ophthalmology, 156(1): Maddox, E. E. (1893). The Clinical Use of Prisms and the Decentering of Lenses. Bristol: John Wright. 201
202 Mahto, R. S. (1972). Eye strain from convergence insufficiency. British Medical Journal, 2(5813): Mallen, E. A. H., Wolffsohn, J. S., Gilmartin, B., & Tsujimura, S. (2001). Clinical evaluation of the Shin Nippon SRW 5000 autorefractor in adults. Ophthalmic and Physiological Optics, 21(2): Mann, I. (1940). Convergence deficiency. British Journal of Ophthalmology, 24(8): Maples, W. C., & Hoenes, R. (2007). Near point of convergence norms measured in elementary school children. Optometry & Vision Science, 84(3): Marran, L. F., De Land, P. N., & Nguyen, A. L. (2006). Accommodative insufficiency is the primary source of symptoms in children diagnosed with convergence insufficiency. Optometry & Vision Science, 83(5): Martínez, P. C., Muñoz, Á. G., & Ruiz-Cantero, M. T. (2009). Treatment of accommodative and nonstrabismic binocular dysfunctions: a systematic review. Optometry Journal of the American Optometric Association, 80(12): McAlinden, C., Khadka, J., Pesudovs, K. (2011). Statistical methods for conducting agreement (comparison of clinical tests) and precision (repeatability or reproducibility) studies in optometry and ophthalmology. Ophthalmic and Physiological Optics, 31(4): McBrient, N. A., & Millodot, M. (1986). The effect of refractive error on the accommodative response gradient. Ophthalmic and Physiological Optics, 6(2): McClelland, J. F., & Saunders, K. J. (2003). The repeatability and validity of dynamic retinoscopy in assessing the accommodative response. Ophthalmic and Physiological Optics, 23(3): McKenzie, K. M., Kerr, S. R., Rouse, M. W., DeLand, P. N. (1987.) Study of accommodative facility testing reliability. American Journal of Optometry and Physiological Optics, 64(3): Millodot, M. (1997). Dictionary of Optometry and Visual Science. 4th ed. Oxford: Butterworth-Heinemann. Momeni-Moghaddam, H., Kundart, J., Azimi, A., & Hassanyani, F. (2015). The effectiveness of home-based pencil push-up therapy versus office-based therapy for the treatment of 202
203 symptomatic convergence insufficiency in young adults. Middle East African Journal of Ophthalmology, 22(1): 97. Moncher, F. J., & Prinz, R. J. (1991). Treatment fidelity in outcome studies. Clinical Psychology Review, 11(3): Morris, F. M. (1960). The influence of kinesthesis upon near heterophoria measurements. American Journal of Optometry and Archives of American Academy of Optometry, 37: Norn, M. S. (1966). Convergence insufficiency - incidence in ophthalmic practice. Results of orthoptic treatment. Acta Ophthalmologica, 44(2): O'Leary, D. J., & Allen, P. M. (2001). Facility of accommodation in myopia. Ophthalmic and Physiological Optics, 21(5): Otto, J. M., Kromeier, M., Bach, M., & Kommerell, G. (2008). Do dissociated or associated phoria predict the comfortable prism? Graefe's Archive for Clinical and Experimental Ophthalmology, 246(5): Owens, D. A., & Wolf-Kelly, K. (1987). Near work, visual fatigue, and variations of oculomotor tonus. Investigative Ophthalmology & Visual Science, 28(4): Pandian, A., Sankaridurg, P. R., Naduvilath, T., O'Leary, D., Sweeney, D. F., Rose, K., & Mitchell, P. (2006). Accommodative facility in eyes with and without myopia. Investigative Ophthalmology & Visual Science, 47(11): Pang, Y., Gabriel, H., Frantz, K. A., Saeed, F. (2010.) A prospective study of different test targets for the near point of convergence. Ophthalmic and Physiological Optics, 30(3): Pang, Y., Teitelbaum, B., & Krall, J. (2012). Factors associated with base in prism treatment outcomes for convergence insufficiency in symptomatic presbyopes. Clinical and Experimental Optometry, 95(2): Patel, P. J., Chen, F. K., Rubin, G. S., & Tufail, A. (2008). Intersession repeatability of visual acuity scores in age-related macular degeneration. Investigative Ophthalmology & Visual Science, 49(10):
204 Patel, P. J., Chen, F. K., Rubin, G. S., & Tufail, A. (2009). Intersession repeatability of contrast sensitivity scores in age-related macular degeneration. Investigative Ophthalmology & Visual Science, 50(6): Patel, P. J., Chen, F. K., Ikeji, F., & Tufail, A. (2011). Intersession repeatability of optical coherence tomography measures of retinal thickness in early age related macular degeneration. Acta Ophthalmologica, 89(3): Patton, N., Aslam, T., & Murray, G. (2006). Statistical strategies to assess reliability in ophthalmology. Eye, 20(7): Pellizzer, S., & Siderov, J. (1998). Assessment of vergence facility in a sample of older adults with presbyopia. Optometry & Vision Science, 75(11): Peterson, L., Homer, A. L., & Wonderlich, S. A. (1982). The integrity of independent variables in behavior analysis. Journal of Applied Behavior Analysis, 15(4): Pickwell, L. D., Stephens, L. C. (1975). Inadequate convergence. British Journal of Physiological Optics, 30(1): Pointer, J. S. (2005). An enhancement to the Maddox Wing test for the reliable measurement of horizontal heterophoria. Ophthalmic and Physiological Optics, 25(5): Polito, A., Del Borrello, M., Isola, M., Zemella, N., & Bandello, F. (2005). Repeatability and reproducibility of fast macular thickness mapping with stratus optical coherence tomography. Archives of Ophthalmology, 123(10): Porcar, E., Martinez-Palomera, A. (1997). Prevalence of general binocular dysfunctions in a population of university students. Optometry and Vision Science, 74(2): Prakash, G., Agarwal, A., Jacob, S., Kumar, D. A., Agarwal, A., & Banerjee, R. (2009). Comparison of fourier-domain and time-domain optical coherence tomography for assessment of corneal thickness and intersession repeatability. American Journal of Ophthalmology, 148(2): Racette, B. A., Gokden, M., Tychsen, L., Perlmutter, J. S. (1999) Convergence insufficiency in idiopathic Parkinson's disease responsive to levodopa. Strabismus, 7(3):
205 Rainey, B. B., Schroeder, T. L., Goss, D. A., & Grosvenor, T. P. (1998). Inter-examiner repeatability of heterophoria tests. Optometry & Vision Science, 75(10): Rankin, G., & Stokes, M. (1998). Reliability of assessment tools in rehabilitation: an illustration of appropriate statistical analyses. Clinical Rehabilitation, 12(3): Raskind, R. H. (1976). Problems at the reading distance. The American Orthoptic Journal, 26: Resnick, B., Inguito, P., Orwig, D., Yahiro, J. Y., Hawkes, W., et al. (2005). Treatment fidelity in behavior change research: A case example. Nursing Research, 54(2): Riddle, D. L., Finucane, S. D., Rothstein, J. M., & Walker, M. L. (1989). Intrasession and intersession reliability of hand-held dynamometer measurements taken on brain-damaged patients. Physical Therapy, 69(3): Riffenburgh, R. H. (2005). Statistics in Medicine. 2nd ed. USA: Academic Press. Rosenfield, M., Ciuffreda, K. J., Ong, E., & Super, S. (1995). Vergence adaptation and the order of clinical vergence range testing. Optometry & Vision Science, 72(4): Rosenfield, M. (2011). Computer vision syndrome: A review of ocular causes and potential treatments. Ophthalmic and Physiological Optics, 31(5): Rosenfield, M. (1997). Tonic vergence and vergence adaptation. Optometry & Vision Science, 74(5): 303. Rouse, M. W., Freestone, G. M., Weiner, B. A., & Deland, P. N. (1991). Comparative study of computer-based and standard clinical accommodative facility testing methods. Optometry & Vision Science, 68(2): Rouse, M. W., DeLand, P. N., Mozayani, S., Smith, J. P. (1992). Binocular accommodative facility testing reliability. Optometry & Vision Science, 69(4): Rouse, M. W., Hyman, L., Hussein, M., Solan, H., Convergence Insufficiency Reading Study G. (1998). Frequency of convergence insufficiency in optometry clinic settings. Optometry and Vision Science, 75(2):
206 Rouse, M. W., Borsting, E., Hyman, L., Hussein, M., Cotter, S. A., Flynn, M., et al. (1999). Frequency of convergence insufficiency among fifth and sixth graders. Optometry & Vision Science 76(9): Rouse, M. W., Borsting, E., Deland, P. N., Hyman, L., Hussein, M., Solan, H., et al. (2002a). Reliability of binocular vision measurements used in the classification of convergence insufficiency. Optometry & Vision Science, 79(4): Rouse, M. W., Borsting, E., & Deland, P. N. (2002b). Reliability of binocular vision measurements used in the classification of convergence insufficiency. Optometry & Vision Science, 79(4): Rouse, M. W., Borsting, E. J., Lynn-Mitchell, G., Scheiman, M., Cotter, S. A., Cooper, J., & Wensveen, J. (2004). Validity and reliability of the revised convergence insufficiency symptom survey in adults. Ophthalmic and Physiological Optics, 24(5): Rowe, F., Wright, D., Brand, D., Jackson, C., Price, A., Walker, L. et al. (2011). Reading difficulty after stroke: ocular and non-ocular causes. International Journal of Stroke, 6(5): Rowe, F. (2004.) Clinical Orthoptics. 2nd ed. UK: Blackwell Publishing Ltd. Rynders, M. C., Navarro, R., & Losada, M. A. (1998). Objective measurement of the off-axis longitudinal chromatic aberration in the human eye. Vision Research, 38(4): Sanker, N., Prabhu, A., & Ray, A. (2012). A comparison of near dissociated heterophoria tests in free space. Clinical and Experimental Optometry, 95(6): Scheiman, M., Gallaway, M., Coulter, R., Reinstein, F., Ciner, E., Herzberg, C., et al. (1996). Prevalence of vision and ocular disease conditions in a clinical pediatric population. Journal of the American Optometric Association, 67(4): Scheiman, M., Cooper, J., Mitchell, G. L., Land, P. D., Cotter, S., Borsting, E. et al. (2002). A survey of treatment modalities for convergence insufficiency. Optometry and Vision Science, 79(3): Scheiman, M., Gallaway, M., Frantz, K. A., Peters, R. J., Hatch, S., Cuff, M., & Mitchell, G. L. (2003). Nearpoint of convergence: test procedure, target selection, and normative data. Optometry & Vision Science, 80(3):
207 Scheiman, M., Mitchell, G. L., Cotter, S., Cooper, J., Kulp, M., Rouse, M., et al. (2005a). A randomized clinical trial of treatments for convergence insufficiency in children. Archives of Ophthalmology, 123(1): Scheiman, M., Mitchell, G. L., Cotter, S., Kulp, M. T., Cooper, J., Rouse, M., et al. (2005b). A randomized clinical trial of vision therapy/orthoptics versus pencil pushups for the treatment of convergence insufficiency in young adults. Optometry & Vision Science, 82(7): Scheiman, M., Cotter, S., Rouse, M., Mitchell, G. L., Kulp, M., Cooper, J., & Borsting, E. (2005c). Randomised clinical trial of the effectiveness of base-in prism reading glasses versus placebo reading glasses for symptomatic convergence insufficiency in children. British Journal of Ophthalmology, 89(10): Scheiman, M. and Wick, B. (2008a). Clinical Management of Binocular Vision: Heterophoric, Accommodative, and Eye movement Disorders. 3rd ed. USA: Lippincott Williams & Wilkins. Scheiman, M., Cotter, S., Mitchell, G. L., Kulp, M., Rouse, M., Hertle, R., et al. (2008b). Randomized clinical trial of treatments for symptomatic convergence insufficiency in children. Archives of Ophthalmology, 126(10): Scheiman, M., Rouse, M., Kulp, M. T., Cotter, S., Hertle, R., & Mitchell, G. L. (2009). Treatment of convergence insufficiency in childhood: a current perspective. Optometry & Vision Science, 86(5): 420. Schroeder, T. L., Rainey, B. B., Goss, D. A., Grosvenor, T. P. (1996). Reliability of and comparisons among methods of measuring dissociated phoria. Optometry & Vision Science, 73(6): Scobee, R. G., & Green, E. L. (1947). Tests for heterophoria - Reliability of tests, comparisons between tests, and effect of changing testing conditions. American Journal of Ophthalmology, 30(4): Seidemann, A., & Schaeffel, F. (2002). Effects of longitudinal chromatic aberration on accommodation and emmetropization. Vision Research, 42(21): Sen, D. K., Malik, S. R. (1972). Accommodative-convergence over accommodation (AC/A) ratio (in normal Indian subjects). Indian Journal of Ophthalmology, 20(4):
208 Serna, A., Rogers, D. L., McGregor, M. L., Golden, R. P., Bremer, D. L., Rogers, G. L. (2011). Treatment of symptomatic convergence insufficiency with a home-based computer orthoptic exercise program. Journal of American Association for Pediatric Ophthalmology and Strabismus, 15(5): Sethi, B. (1986). Vergence adaptation: a review. Documenta Ophthalmologica, 63(3): Shankar, H., Taranath, D., Santhirathelagan, C. T., & Pesudovs, K. (2008). Anterior segment biometry with the Pentacam: comprehensive assessment of repeatability of automated measurements. Journal of Cataract & Refractive Surgery, 34(1): Sheard, C. (1930). Zones of ocular comfort. American Journal of Optometry, 7: Siderov, J., Chiu, S. C., Waugh, S. J. (2001). Differences in the nearpoint of convergence with target type. Ophthalmic and Physiological Optics, 21(5): Smith, W. (1952). Notes on retinal correspondence. The Australasian Journal of Optometry, 35(7): Steinman, S. B., Steinman, B. A, Garzia, R. P. (2000). Foundations of Binocular Vision: A Clinical Perspective. United States: McGraw-Hill. Streiner, D. L., Norman, G. R., & Cairney, J. (2008). Health Measurement Scales: A Practical Guide to Their Development and Use. 4th ed. UK: Oxford University Press. Taylor, J. (1996). Introduction to Error Analysis: The Study of Uncertainties in Physical Measurements. 2nd ed. USA: University Science Books. Taylor, J., Charman, W. N., O'Donnell, C., & Radhakrishnan, H. (2009). Effect of target spatial frequency on accommodative response in myopes and emmetropes. Journal of Vision, 9(1): 16, Teitelbaum, B., Pang, Y., Krall, J. (2009). Effectiveness of base in prism for presbyopes with convergence insufficiency. Optometry & Vision Science, 86(2): Theagarayan, B., Radhakrishnan, H., Allen, P. M., Calver, R. I., Rae, S. M., & O Leary, D. J. (2009). The effect of altering spherical aberration on the static accommodative response. Ophthalmic and Physiological Optics, 29(1):
209 Thiagarajan, P., & Ciuffreda, K. J. (2013). Visual fatigue and accommodative dynamics in asymptomatic individuals. Optometry & Vision Science, 90(1): Tucker, J., & Charman, W. N. (1975). The depth-of-focus of the human eye for snellen letters. Optometry & Vision Science, 52(1): Von Noorden, G. K., & Campos, Mosby. E. C. (2002). Binocular Vision and Ocular Motility. 6th ed. St. Louis: Wald, G., & Griffin, D. R. (1947). The change in refractive power of the human eye in dim and bright light. Journal of the Optical Society of America, 37(5): Wang, B., & Ciuffreda, K. J. (2006). Depth-of-focus of the human eye: theory and clinical implications. Survey of Ophthalmology, 51(1): Weymouth, F. W. (1963). An experimental comparison of three common methods of measuring heterophoria. American Journal of Optometry & Archives of American Academy of Optometry, 40: Wick, B. C. (1981). Diagnosis and Management in Vision Care. Boston: Butterworth-Heineman. Wick, B., Yothers, T. L., Jiang, B. C., & Morse, S. E. (2002). Clinical testing of accommodative facility: Part 1. A critical appraisal of the literature. Optometry, 73(1): Wolak, M. E., Fairbairn, D. J., & Paulsen, Y. R. (2012). Guidelines for estimating repeatability. Methods in Ecology and Evolution, 3(1): Wong, E. P. F., Fricke, T. R., Dinardo, C. (2002). Interexaminer repeatability of a new, modified prentice card compared with established phoria tests. Optometry & Vision Science, 79(6): Woods, A. J. (2012). Crosstalk in stereoscopic displays: a review. Journal of Electronic Imaging, 21(4): Worth, C. (1903). Squint: its Cause, Pathology and Treatment. London: Bale and Danielsson. Yekta, A. A., Jenkins, T., & Pickwell, D. (1987). The clinical assessment of binocular vision before and after a working day. Ophthalmic and Physiological Optics, 7(4):
210 Yothers, T., Wick, B., Morse, S. E. (2002). Clinical testing of accommodative facility: Part II. Development of an amplitude-scaled test. Optometry, 73(2): Zadnik, K., Mutti, D. O., & Adams, A. J. (1992). The repeatability of measurement of the ocular components. Investigative Ophthalmology & Visual science, 33(7): Zellers, J. A., Alpert, T. L., & Rouse, M. W. (1984). A review of the literature and a normative study of accommodative facility. Journal of the American Optometric Association, 55(1): Zhang, L., Zhang, Y. Q., Zhang, J. S., Xu, L., & Jonas, J. B. (2013). Visual fatigue and discomfort after stereoscopic display viewing. Acta Ophthalmologica, 91(2):
211 Appendix A A1 Assessment form Pilot Study: Evaluation of Computerized Software Program to Diagnose and Treat Convergence Insufficiency Participant number: Personal details of participant: Name: Sex: 0.Male 1.Female DOB: DD / MM / YYYY Age: y/o Occupation: Mobile phone number: Assessments Date of Visit Date of Scheduled Completion Note (1) Baseline (2) Follow-up at week 1 (3) Follow-up at week 2 (4) Follow-up at week 4 (5) Follow-up at week 6 (6) Follow-up at week 8 Having habitual correction for vision training: 0.No 1.Yes, they are spectacles/cl. 211


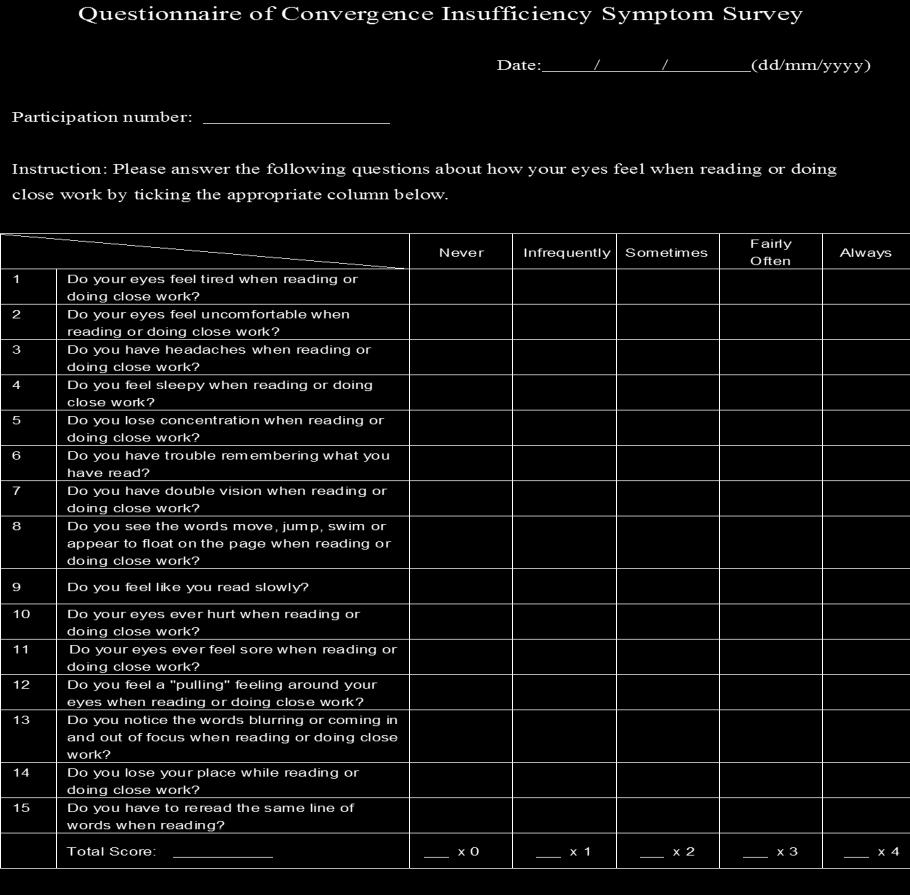
212 A1 Assessment form (Cont.) 212

213 A1 Assessment form (Cont.) 213
214 A1 Assessment form (Cont.) 214

215 A1 Assessment form (Cont.) 215


216 A1 Assessment form (Cont.) 216

217 A1 Assessment form (Cont.) 217
218 A2 Treatment protocol of Brock String Training 218
219 A2 Treatment protocol of Brock String Training (Con t) 219
220 A2 Treatment protocol of Brock String Training (Con t) 220

221 A3 Diary for Brock string training 221
ORIGINAL ARTICLE THE EFFECTIVENESS OF THE DOT CARD THERAPY TOWARDS CONVERGENCE INSUFFICIENCY PATIENTS AMONG YOUNG ADULTS
 ORIGINAL ARTICLE THE EFFECTIVENESS OF THE DOT CARD THERAPY TOWARDS CONVERGENCE INSUFFICIENCY PATIENTS AMONG YOUNG ADULTS Lim Yan Yi and Mizhanim Mohamad Shahimin Optometry and Vision Science Programme,
Duane-White Vergence Anomaly Types
 Duane-White Vergence Anomaly Types Combinations of inadequate binocularity at distance/near involving eso/exo phorias that are not adequately covered by the vergence ranges are logically diagnosed as Vergence
INTRODUCTION TO BINOCULAR VISION TESTING: LECTURE 1
 INTRODUCTION TO BINOCULAR VISION TESTING: LECTURE 1 Dr Hilary Gaiser OD, MSc Assistant Professor of Optometry New England College of Optometry This presentation has been created for Orbis International
ORIGINAL ARTICLE. Refractive and binocular vision status of optometry students, Ghana
 ORIGINAL ARTICLE Journal of Medical and Biomedical Sciences (2016) 5(2): 24-29 UDS Publishers Limited All Right Reserved 2026-6294 doi: http://dx.doi.org/10.4314/jmbs.v5i2.4 Refractive and binocular vision
I Graphical Representation of Maddox components II. Clinical tests for each Maddox component III. Assumptions of the analysis IV.
 I Graphical Representation of Maddox components II. Clinical tests for each Maddox component III. Assumptions of the analysis IV. Procedure for plotting the Maddox components Demand line Phoria line Relative
Effects of 10 minutes Opened-Loop Vergence training on accommodation parameters
 SEGi Review ISSN: 1985.5672 Vol.9, December 2015 Effects of 10 minutes Opened-Loop Vergence training on accommodation parameters Azam N. Hazman Faculty of Optometry & Vision Sciences SEGi University azam@segi.edu.my
The von Graefe testing procedure
 A COMPARISON OF DISSOCIATED PHORIA TEST FINDINGS WITH VON GRAEFE PHOROMETRY & MODIFIED THORINGTON TESTING David A. Goss, O.D., Ph.D. 1 Breezy J. Moyer, O.D. 1 Meghan C. Teske, O.D. 1 1. School of Optometry,
Type of strabismus and changes to fusion measures
 Type of strabismus and changes to fusion measures Carla Costa Lança, PhD Lisbon School of Health Technology carla.costa@estesl.ipl.pt There is no actual or potential conflict of interest in relation to
15) PENCIL PUSH-UP THE ECONOMICAL AND EASY ANSWER TO SYMPTOMATIC CONVERGENCE INSUFFICIENCY ABSTRACT
 PENCIL PUSH-UP THE ECONOMICAL AND EASY ANSWER TO SYMPTOMATIC CONVERGENCE INSUFFICIENCY ABSTRACT") 15) PENCIL PUSH-UP THE ECONOMICAL AND EASY ANSWER TO SYMPTOMATIC CONVERGENCE INSUFFICIENCY Dr. Shiv S Malli, Dr.Suhani Desai, Dr. Chinmayi Vyas, Dr. Reema Raval, Dr. Nitin Trivedi, C.H. Nagri Municipal
15) PENCIL PUSH-UP THE ECONOMICAL AND EASY ANSWER TO SYMPTOMATIC CONVERGENCE INSUFFICIENCY Dr. Shiv S Malli, Dr.Suhani Desai, Dr. Chinmayi Vyas, Dr. Reema Raval, Dr. Nitin Trivedi, C.H. Nagri Municipal
Dissociated phoria testing is an important
 COMPARISON OF FOUR DISSOCIATED PHORIA TESTS: RELIABILITY & CORRELATION WITH SYMPTOM SURVEY SCORES David A. Goss, O.D., Ph.D. Jennifer L. Reynolds, O.D. Rebekah E. Todd, O.D. School of Optometry Indiana
Care of the Patient with Accommodative and Vergence Dysfunction
 OPTOMETRIC CLINICAL PRACTICE GUIDELINE Care of the Patient with Accommodative and Vergence Dysfunction OPTOMETRY: THE PRIMARY EYE CARE PROFESSION Doctors of optometry are independent primary health care
Howell Modified Test for qualitative and quantitative assessment of near phoria
 Howell Test for qualitative and quantitative assessment of near phoria A.V. Kriuchko, ophthalmologist Optic Rehabilitation Center OKTAR; Poltava (Ukraine) E-mail: lkkz@ukr.net Key-words: binocular vision,
Phoria and vergence ranges are often performed behind
 Normative data for modified Thorington phorias and prism bar vergences from the Benton-IU study Don W. Lyon, O.D., a David A. Goss, O.D., Ph.D., a Douglas Horner, O.D., Ph.D., a John P. Downey, O.D., a
Complicated Refractive Cases and their Management
 Complicated Refractive Cases and their Management COPE 42302-GO Kristin Anderson, OD, FAAO Complicated Refractive Cases and Prescribing Considerations Kristin K. Anderson, OD Professor Southern College
Care of the Patient with Accommodative and Vergence Dysfunction
 OPTOMETRIC CLINICAL PRACTICE GUIDELINE Vision Service Plan is proud to underwrite this latest series of Clinical Practice Guidelines. These Guidelines will be a significant patient care information resource
Management of Diplopia Indiana Optometric Association Annual Convention April 2018 Kristine B. Hopkins, OD, MSPH, FAAO
 Management of Diplopia Indiana Optometric Association Annual Convention April 2018 Kristine B. Hopkins, OD, MSPH, FAAO For patients with diplopia, the clinician must differentiate monocular from binocular
Article 4 Effect of Test Target Size on Phoria and Horizontal Fusional Vergence
 Article 4 Effect of Test Target Size on Phoria and Horizontal Fusional Vergence Ayishetu Oshoke Shuaibu, OD, Department of Optometry, University of Benin, Edo State, Nigeria Oseleonomhen Monica Odigie,
Normative Values for the Fusional Amplitudes and the Prevalence of Heterophoria in Adults (Khatam-Al-Anbia Eye Hospital )
") Normative Values for the Fusional Amplitudes and the Prevalence of Heterophoria in Adults (Khatam-Al-Anbia Eye Hospital - 2009) Mohammad Etezad Razavi, MD 1 Setareh Sagheb Hossein Poor, MD 2 Amaneh Daneshyar,
Normative Values for the Fusional Amplitudes and the Prevalence of Heterophoria in Adults (Khatam-Al-Anbia Eye Hospital - 2009) Mohammad Etezad Razavi, MD 1 Setareh Sagheb Hossein Poor, MD 2 Amaneh Daneshyar,
Original Article. Hamed Momeni-Moghaddam 1, James O. D. Kundart2, Azimi O. D. Abbas3, Farzaneh Hassanyani1
 MEAJO_139_13R11 Original Article The Effectiveness of Home-based Pencil Push-up Therapy Versus Office-based Therapy for the Treatment of Symptomatic Convergence Insufficiency in Young Adults Hamed Momeni-Moghaddam
Convergence insufficiency (CI)
") THE TREATMENT OF CONVERGENCE INSUFFICIENCY A HISTORICAL OVERVIEW OF THE LITERATURE Mary Bartuccio, O.D. College of Optometry Fort Lauderdale, FL Abstract Convergence Insufficiency (CI) is a common non-strabismic
THE TREATMENT OF CONVERGENCE INSUFFICIENCY A HISTORICAL OVERVIEW OF THE LITERATURE Mary Bartuccio, O.D. College of Optometry Fort Lauderdale, FL Abstract Convergence Insufficiency (CI) is a common non-strabismic
City, University of London Institutional Repository
 City Research Online City, University of London Institutional Repository Citation: Conway, M. L., Thomas, J. and Subramanian, A. (2012). Is the Aligning Prism Measured with the Mallett Unit Correlated
Clinical Pearls for Treating Vertical Deviations Jen Simonson, OD, FCOVD
 Clinical Pearls for Treating Vertical Deviations Jen Simonson, OD, FCOVD Course Description: Dr. Simonson will share Clinical Pearls in treating vertical diplopia. This course will discuss eye alignment
Medical Policy An independent licensee of the Blue Cross Blue Shield Association
 Sensorimotor and Neurobehavioral Status Exams Page 1 of 5 Medical Policy An independent licensee of the Blue Cross Blue Shield Association Title: Sensorimotor and Neurobehavioral Status Exams for Optometric
VERGENCE AND ACCOMMODATION SYSTEM IN MALAY PRIMARY SCHOOL CHILDREN. Ai Hong Chen & Ahmad Hakimi Zainol Abidin
 Malaysian Journal of Medical Sciences, Vol. 9, No. 1, January 2002 (9-) ORIGINAL ARTICLE VERGENCE AND ACCOMMODATION SYSTEM IN MALAY PRIMARY SCHOOL CHILDREN Ai Hong Chen & Ahmad Hakimi Zainol Abidin Department
Incorporation of Vision Therapy into Daily Practice. Vision Therapy Services in a Primary Care Practice. Considerations. Management Considerations
 Incorporation of Vision Therapy into Daily Practice Vision Therapy Services in a Primary Care Practice Graham Erickson, OD, FAAO, FCOVD Pacific University College of Optometry Adequate data Consultation
Research Article Characterization of Visual Symptomatology Associated with Refractive, Accommodative, and Binocular Anomalies
 Journal of Ophthalmology Volume 2015, Article ID 895803, 13 pages http://dx.doi.org/10.1155/2015/895803 Research Article Characterization of Visual Symptomatology Associated with Refractive, Accommodative,
Clinical Study Diagnostic Validity of Clinical Signs Associated with a Large Exophoria at Near
 Journal of Ophthalmology Volume 23, Article ID 549435, pages http://dx.doi.org/.55/23/549435 Clinical Study Diagnostic Validity of Clinical Signs Associated with a Large Exophoria at Near Pilar Cacho-Martínez,
CONVERGENCE INSUFFICIENCY TREATMENT STUDY (CITS) Effectiveness of Home-Based Therapy for Symptomatic Convergence Insufficiency
 Effectiveness of Home-Based Therapy for Symptomatic Convergence Insufficiency") 1 2 3 4 5 6 7 8 9 10 11 12 13 14 15 16 17 18 19 20 21 22 23 24 CONVERGENCE INSUFFICIENCY TREATMENT STUDY (CITS) Effectiveness of Home-Based Therapy for Symptomatic Convergence Insufficiency PROTOCOL Version
1 2 3 4 5 6 7 8 9 10 11 12 13 14 15 16 17 18 19 20 21 22 23 24 CONVERGENCE INSUFFICIENCY TREATMENT STUDY (CITS) Effectiveness of Home-Based Therapy for Symptomatic Convergence Insufficiency PROTOCOL Version
Outline: Vergence Eye Movements: Classification I. Describe with 3 degrees of freedom- Horiz, Vert, torsion II. Quantifying units- deg, PD, MA III.
 Outline: Vergence Eye Movements: Classification I. Describe with 3 degrees of freedom- Horiz, Vert, torsion II. Quantifying units- deg, PD, MA III. Measurement of Vergence:- Objective & Subjective phoria
The use of video display units (VDU) has become a
 has become a") Int J Ophthalmol, Vol. 11, No. 3, Mar.18, 2018 www.ijo.cn Investigation Symptomatic accommodative and binocular dysfunctions from the use of flat-panel displays Esteban Porcar 1, Juan Carlos Montalt 1,
Int J Ophthalmol, Vol. 11, No. 3, Mar.18, 2018 www.ijo.cn Investigation Symptomatic accommodative and binocular dysfunctions from the use of flat-panel displays Esteban Porcar 1, Juan Carlos Montalt 1,
Author s Affiliation. Original Article. Frequency of presenting clinical features of asthenopia (ocular fatigue) in refractive patients.
 in refractive patients.") Vol: 7, Issue Original Article Frequency of presenting clinical features of asthenopia (ocular fatigue) in refractive patients. Author s Affiliation Purpose: Asthenopia is tiredness, uncomfortable, ocular
Vol: 7, Issue Original Article Frequency of presenting clinical features of asthenopia (ocular fatigue) in refractive patients. Author s Affiliation Purpose: Asthenopia is tiredness, uncomfortable, ocular
Convergence insufficiency and its current treatment Judith B. Lavrich
 Convergence insufficiency and its current treatment Judith B. Lavrich Department of Pediatric Ophthalmology, Wills Eye Institute, Thomas Jefferson University, Philadelphia, Pennsylvania USA Correspondence
STUDY OF ADULT STRABISMUS (SAS1)
") 1 2 3 4 5 6 7 8 9 10 11 12 13 14 15 16 17 18 19 20 21 22 23 24 25 26 27 28 29 30 31 32 STUDY OF ADULT STRABISMUS (SAS1) A Prospective Observational Study of Adult Strabismus SAS1a: A Prospective Observational
1 2 3 4 5 6 7 8 9 10 11 12 13 14 15 16 17 18 19 20 21 22 23 24 25 26 27 28 29 30 31 32 STUDY OF ADULT STRABISMUS (SAS1) A Prospective Observational Study of Adult Strabismus SAS1a: A Prospective Observational
Incorporation of Vision Therapy into Daily Practice. Vision Therapy Services in a Primary Care Practice. Considerations. Management Considerations
 Incorporation of Vision Therapy into Daily Practice Vision Therapy Services in a Primary Care Practice Graham Erickson, OD, FAAO, FCOVD Pacific University College of Optometry Adequate exam data Consultation
Accommodation and vergence status among the 3rd and 4th graders in a mainstream school in Gauteng*
 Accommodation and vergence status among the 3rd and 4th graders in a mainstream school in Gauteng* IT Metsing** and JT Ferreira*** Department of Optometry, University of Johannesburg, PO Box 524, Auckland
Attention deficit hyperactivity disorder (ADHD) is
 is") Measuring ADHD behaviors in children with symptomatic accommodative dysfunction or convergence insufficiency: a preliminary study Eric Borsting, O.D., M.S., Michael Rouse, O.D., M.S., and Ray Chu, O.D.
Measuring ADHD behaviors in children with symptomatic accommodative dysfunction or convergence insufficiency: a preliminary study Eric Borsting, O.D., M.S., Michael Rouse, O.D., M.S., and Ray Chu, O.D.
Convergence insufficiency and its current treatment.
 Thomas Jefferson University Jefferson Digital Commons Wills Eye Hospital Papers Wills Eye Hospital 9-1-2010 Convergence insufficiency and its current treatment. Judith B Lavrich Wills Eye Institute, Thomas
ASSESSMENT AND MANAGEMENT OF OCULOMOTOR DYSFUNCTIONS ASSOCIATED WITH TRAUMATIC BRAIN INJURY
 CLIICAL RECOMMEDATIO FOR THE EE CARE PROVIDER ASSESSMET AD MAAGEMET OF OCULOMOTOR DSFUCTIOS ASSOCIATED WITH TRAUMATIC BRAI IJUR Introduction and Background Several types of visual dysfunctions are common
DOWNLOAD PDF CLINICAL MANAGEMENT OF STRABISMUS
 Chapter 1 : Strabismus Causes - American Academy of Ophthalmology Clinical Management of Strabismus [Elizabeth E. Caloroso, Michael W. Rouse] on blog.quintoapp.com *FREE* shipping on qualifying offers.
Pediatric Headaches: Is It Their Eyes? Catherine McDaniel, OD, MS, FAAO
 Pediatric Headaches: Is It Their Eyes? Catherine McDaniel, OD, MS, FAAO Please silence all mobile devices and remove items from chairs so others can sit. Unauthorized recording of this session is prohibited.
Low Plus Prescriptions - Summary of Evidence
 Low Plus Prescriptions - Summary of Evidence By Steve Leslie BOptom, Leonard Press OD & Mark Overton Behavioural optometrists use low plus prescriptions to optimise near vision performance, based on well-established
Joel H. Warshowsky, OD, FAAO, FCOVD
 LENS APPLICATION FOR CLINICAL MANAGEMENT OF CYCLOVERTICAL DEVIATION ASSOCIATED WITH VESTIBULAR FUNCTION, PROPRIOCEPTION, OCULOMOTOR SKILLS AND EMOTION Joel H. Warshowsky, OD, FAAO, FCOVD Associate Clinical
BINOCULAR MECHANISMS IN SMALL-ANGLE
 Brit. J. Ophthal. (1959) 43, 648. BINOCULAR MECHANISMS IN SMALL-ANGLE STRABISMUS* BY A. STANWORTH AND DAPHNE DA CUNHA University of Manchester and Manchester Royal Eye Hospital THE purpose of treatment
10/4/2016. Organic (systemic) Form deprivation (structural) Strabismic Refractive Isometric Anisometric
 Form deprivation (structural) Strabismic Refractive Isometric Anisometric") Marc B. Taub, OD, MS, FAAO, FCOVD Chief, Vision Therapy and Rehabilitation Southern College of Optometry Editor in Chief, Optometry & Visual Performance A difference in the VA of the two eyes of at least
Marc B. Taub, OD, MS, FAAO, FCOVD Chief, Vision Therapy and Rehabilitation Southern College of Optometry Editor in Chief, Optometry & Visual Performance A difference in the VA of the two eyes of at least
Author: Ida Lucy Iacobucci, 2015
 Author: Ida Lucy Iacobucci, 2015 License: Unless otherwise noted, this material is made available under the terms of the Creative Commons Attribution-NonCommercial-Share Alike 4.0 License: http://creativecommons.org/licenses/by-nc-sa/4.0/
Article. A New Concept in Heterophoria Assessment: The Koslowe Monocular Straw Test and its Implications
 Article A New Concept in Heterophoria Assessment: The Koslowe Monocular Straw Test and its Implications Kenneth Koslowe, OD, MS, FCOVD-A; Dikla Miller, BOpt; Yarden Weinberger, BOpt; Einat Shneor BOpt,
ARTICLE. Characteristics and Management of Vertical Deviations in an Urban Academic Clinic: A Retrospective Analysis
 ARTICLE Characteristics and Management of Vertical Deviations in an Urban Academic Clinic: A Retrospective Analysis Kelly A. Chajka, OD, MS, MH M.H. Esther Han, OD, FCOVD, FAAO, Vision Rehabilitation Service,
RAF near point rule for near point of convergence a short review
 Review Article Page 1 of 6 RAF near point rule for near point of convergence a short review Indra P. Sharma Department of Ophthalmology, Regional Referral Hospital, Mongar-43001, Bhutan Correspondence
PRESENTATION TITLE/S LEARNING OBJECTIVES START TIME FINISH TIME
 OEP VT for Art and Science DAY 1 What is Vision? The Anti-Gravity Circle Convergence & Divergence The Identification Circle The Speech & Language Circle Emergent Vision Processes The Space Representation
It has been estimated that up to 10
 It has been estimated that up to 10 per cent of primary care patients attend an eye examination complaining of some form of binocular vision anomaly. With the ever-increasing use of computers in the workplace
Effects of Image Disparity on Perceived Immersion and Symptoms in 3D Gaming
 Effects of Image Disparity on Perceived Immersion and Symptoms in 3D Gaming Shun-nan Yang, PhD Pacific University, College of Optometry Vision Performance Institute A research consortium supporting Quality
Clinical Characteristics of Intermittent Exotropia
 International Journal of Medicine and Medical Sciences Vol. 2 (1), pp. 042-046, 27 January, 2012 International Scholars Journals (http://internationalscholarsjournals.org) Full Length Research Paper Clinical
Amblyopia Definition 9/25/2017. Strabismic Amblyopia. Amblyopia 101: How to use Current Amblyopia Research in Clinical Practice
 Amblyopia 101: How to use Current Amblyopia Research in Clinical Practice Valerie M. Kattouf O.D. Chief, Pediatric/Binocular Vision Service FAAO, FCOVD Illinois College of Optometry Associate Professor
Double Vision as a Presenting Symptom in Adults Without Acquired or Long- Standing Strabismus
 Double Vision as a Presenting Symptom in Adults Without Acquired or Long- Standing Strabismus Sara Shippman, C.O. Larisa Heiser, C.O. Kenneth R. Cohen, M.D., F.A.C.S. Lisabeth Hall, M.D. ABSTRACT Background:
Convergence accommodation to convergence (CA/C) ratio: stability with different levels of convergence demand
 ratio: stability with different levels of convergence demand") : 60 64 Convergence accommodation to convergence (CA/C) ratio: stability with different levels of convergence demand KOMAL J. HIRANI BMedSci (Hons) AND ALISON Y. FIRTH MSc DBO(T) Academic Unit of Ophthalmology
: 60 64 Convergence accommodation to convergence (CA/C) ratio: stability with different levels of convergence demand KOMAL J. HIRANI BMedSci (Hons) AND ALISON Y. FIRTH MSc DBO(T) Academic Unit of Ophthalmology
Influence of target type and RAF rule on the measurement of near point of convergence
 Ophthal. Physiol. Opt. 2007 27: 22 30 Influence of target type and RAF rule on the measurement of near point of convergence Paul M. Adler*, Mary Cregg, Ann-Julie Viollier à and J. Margaret Woodhouse *50
Amblyopia 101: How to use Current Amblyopia Research in Clinical Practice
 Amblyopia 101: How to use Current Amblyopia Research in Clinical Practice Valerie M. Kattouf O.D. Chief, Pediatric/Binocular Vision Service FAAO, FCOVD Illinois College of Optometry Associate Professor
Article 4 Reduction of Magnitude and Frequency of Vertical Strabismus through Vision Therapy
 Article 4 Reduction of Magnitude and Frequency of Vertical Strabismus through Vision Therapy Emily Aslakson, OD, Michigan College of Optometry, Big Rapids, Michigan ABSTRACT Background: Vertical strabismus
August [KZ 0811] Sub. Code: 6041 B.Sc. OPTOMETRY DEGREE EXAMINATION. THIRD YEAR Paper I BINOCULAR VISION Q.P. Code :
![August [KZ 0811] Sub. Code: 6041 B.Sc. OPTOMETRY DEGREE EXAMINATION. THIRD YEAR Paper I BINOCULAR VISION Q.P. Code :](/thumbs/89/99604303.jpg "August [KZ 0811] Sub. Code: 6041 B.Sc. OPTOMETRY DEGREE EXAMINATION. THIRD YEAR Paper I BINOCULAR VISION Q.P. Code :") August 2011 [KZ 0811] Sub. Code: 6041 DEGREE EXAMINATION. Paper I BINOCULAR VISION Q.P. Code : 806041 Time : Three hours Maximum : 100 marks Answer All questions. I. Elaborate on : (3 x 10 = 30) 1. Development
August 2011 [KZ 0811] Sub. Code: 6041 DEGREE EXAMINATION. Paper I BINOCULAR VISION Q.P. Code : 806041 Time : Three hours Maximum : 100 marks Answer All questions. I. Elaborate on : (3 x 10 = 30) 1. Development
CET CONTINUING. Acquired brain injury: part 2 Examining the patient with ABI 1 CET POINT. Course code C Deadline: May 17, 2013
 CET CONTINUING Sponsored by 1 CET POINT Acquired brain injury: part 2 Examining the patient with ABI 58 Mark Menezes, BSc (Hons), FACBO The first article of this series described the key visual effects
Orthoptic Treatment in the Management of Intermittent Exotropia
 Orthoptic Treatment in the Management of Intermittent Exotropia Reza Asadi, MD 1 Khalil Ghasemi-Falavarjani, MD 2 Nadia Sadighi, BS 3 Abstract Purpose: To evaluate the role of orthoptic treatments in the
Recent theories of myopia etiology
 Prospective Data from a RANDOMIZED LONGITUDINAL STUDY of ACCOMMODATION & CONVERGENCE TRAINING as a Potential Method of Myopia Control in Children David A. Goss, O.D., Ph.D. 1 Bill B. Rainey, O.D., M.S.
Strabismus. Nathalie Azar, MD Pediatric Ophthalmology for the Non-Ophthalmologist April 7, 2018 TERMINOLOGY:
 Strabismus Nathalie Azar, MD Pediatric Ophthalmology for the Non-Ophthalmologist April 7, 2018 TERMINOLOGY: Strabismus comes from the Greek word Strabismos which means to squint. For accuracy when describing
Tips for Handling BV without VT
 Tips fr Handling BV withut VT Catherine McDaniel, OD, MS, FAAO mcdaniel.547@su.edu Objective: Attendees will learn diagnsis f cmmn nn-strabismic bincular visin cnditins and treatment f these cnditins using
Visual Selection and Attention
 Visual Selection and Attention Retrieve Information Select what to observe No time to focus on every object Overt Selections Performed by eye movements Covert Selections Performed by visual attention 2
Ocular Motility in Health and Disease
 Ocular Motility in Health and Disease Contents: Extraocular Muscles Eye Movements Single Binocular Vision Strabismus Amblyopia Objectives: By the end of this course the undergraduate student should be
This 3-year-old presented with an alternating esotropia of two-month duration. Her initial
 Management of Significant Refractive Error Abstract: This case report is of a child who was referred to me by a practicing optometrist. This 3-year-old presented with an alternating esotropia of two-month
Intra-examiner repeatability and agreement in accommodative response measurements
 Ophthal. Physiol. Opt. 00 : O P O B Dispatch:..0 Journal: OPO CE: Manonmani Journal Name Manuscript No. Author Received: No. of pages: PE: Mahendrakumar 0 Intra-examiner repeatability and agreement in
Intermittent Exotropia, When to Recommend Glasses and When to Perform Surgery?
 Med. J. Cairo Univ., Vol. 86, No. 1, March: 289-296, 2018 www.medicaljournalofcairouniversity.net Intermittent Exotropia, When to Recommend Glasses and When to Perform Surgery? SHAIMAA H.M. SOKEER, M.Sc.;
NeuroLens: A tool to treat post- TBI visual hypersensitivity? David H. Biberdorf, OD, FCOVD Advanced Neuro-Vision Systems
 NeuroLens: A tool to treat post- TBI visual hypersensitivity? David H. Biberdorf, OD, FCOVD Advanced Neuro-Vision Systems Concussion/TBI: Why Vision? 80-90% of all information entering the brain is visual
EVALUATION OF HUMAN BINOCULAR FUNCTION WITH AN EYE-TRACKER
 MSc in Photonics PHOTONICSBCN Universitat Politècnica de Catalunya (UPC) Universitat Autònoma de Barcelona (UAB) Universitat de Barcelona (UB) Institut de Ciències Fotòniques (ICFO) http://www.photonicsbcn.eu
Determination of accommodative
 COMPARISON OF MEM RETINOSCOPY & NOTT RETINOSCOPY & THEIR INTEREXAMINER REPEATABILITIES David A. Goss, O.D., Ph.D. a Piper Groppel, O.D. a Luis Dominguez, O.D. a a. School of Optometry, Indiana University,Bloomington,
DEVELOPMENT OF NORMAL BINOCULAR VISION IN EARLY
 Brit. J. Ophthal. (1965) 49, 154 DEVELOPMENT OF NORMAL BINOCULAR VISION IN EARLY CONVERGENT STRABISMUS AFTER ORTHOPHORIA* BY From the University Eye Clinic, Parma, Italy A fundamental difference exists,
Author: Ida Lucy Iacobucci, 2015
 Author: Ida Lucy Iacobucci, 2015 License: Unless otherwise noted, this material is made available under the terms of the Creative Commons Attribution-NonCommercial-Share Alike 4.0 License: http://creativecommons.org/licenses/by-nc-sa/4.0/
TNO. computer vision syndrome (CVS) CVS.
 CVS.") mahjoob_opt@yahoo.com email: computer vision syndrome (CVS) CVS TNO ] [ pushup negative related NRA accommodation NRA positive related (monocular estimated PRA accommodation MEM method) Kolker Schaiman
mahjoob_opt@yahoo.com email: computer vision syndrome (CVS) CVS TNO ] [ pushup negative related NRA accommodation NRA positive related (monocular estimated PRA accommodation MEM method) Kolker Schaiman
This is a repository copy of Is there a relationship between prism fusion range and vergence facility?.
 This is a repository copy of Is there a relationship between prism fusion range and vergence facility?. White Rose Research Online URL for this paper: http://eprints.whiterose.ac.uk/625/ Article: Melville,
The assessment of binocular
 CET Continuing education Routine eye examination Part 3 Binocular assessment In the third part of our series on the eye examination, Andrew Franklin and Bill Harvey look at the assessment and interpretation
Vision Care for Connecticut Children
 Vision Care for Connecticut Children EXECUTIVE SUMMARY November 2003 Prepared by: Judith Solomon, JD Mary Alice Lee, PhD Children s Health Council With funding from: Children s Fund of Connecticut, Inc.
NIH Public Access Author Manuscript Optom Vis Sci. Author manuscript; available in PMC 2011 December 1.
 NIH Public Access Author Manuscript Published in final edited form as: Optom Vis Sci. 2010 December ; 87(12): E985 1002. doi:10.1097/opx.0b013e3181fef1aa. Vision Therapy in Adults with Convergence Insufficiency:
BINOCULAR DEPTH PERCEPTION IN SMALL-ANGLE
 Brit. J. Ophthal. (1959) 43, 662. BINOCULAR DEPTH PERCEPTION IN SMALL-ANGLE STRABISMUS* BY E. J. NAYLOR AND A. STANWORTH Department of Ophthalmology, University of Manchester MEASUREMENTS of the binocular
Article. Reverse-Engineering of Hyperopic Anisometropic Refractive Amblyopia. Leonard J. Press, OD, FAAO, FCOVD; Daniel J.
 Article Reverse-Engineering of Hyperopic Anisometropic Refractive Amblyopia Leonard J. Press, OD, FAAO, FCOVD; Daniel J. Press, OD, FCOVD Private Practice, Fair Lawn, NJ Abstract Background. Uncompensated
Measurement of Strabismic Angle Using the Distance Krimsky Test
 pissn: 1011-8942 eissn: 2092-9382 Korean J Ophthalmol 2013;27(4):276-281 http://dx.doi.org/10.3341/kjo.2013.27.4.276 Original Article Measurement of Strabismic Angle Using the Distance Krimsky Test Kwang
THE OUTCOME OF STRABISMUS SURGERY IN CHILDHOOD EXOTROPIA
 THE OUTCOME OF STRABISMUS SURGERY IN CHILDHOOD EXOTROPIA J. M. KEENAN and H. E. WILLSHAW Birmingham SUMMARY The results of squint surgery in 42 children with primary, non-paralytic, childhood are analysed.
ORIGINAL ARTICLE. Vision Therapy in Adults with Convergence Insufficiency: Clinical and Functional Magnetic Resonance Imaging Measures
 1040-5488/10/8712-0985/0 VOL. 87, NO. 12, PP. E985 E1002 OPTOMETRY AND VISION SCIENCE Copyright 2010 American Academy of Optometry ORIGINAL ARTICLE Vision Therapy in Adults with Convergence Insufficiency:
Reports. Accommodative and fusional components of fixation disparity. JOHN L. SEMMLOW AND GEORGE HUNG.
 Reports Accommodative and fusional components of fixation disparity. JOHN L. SEMMLOW AND GEORGE HUNG. Traditional measurements of fixation disparity, like other binocidar measurements, confound influences
RETINOSCOPY HANDBOOK FOR CLINICIANS
 RETINOSCOPY HANDBOOK FOR CLINICIANS Author: Sarah Wassnig B.Optom(OcTher), MPH New England College of Optometry created this handbook for the use of Orbis International trainees. This publication is the
Strabismus: Esotropia and Exotropia
 OPTOMETRIC CLINICAL PRACTICE GUIDELINE Vision Service Plan is proud to underwrite this landmark series of Clinical Practice Guidelines. These Guidelines will be a significant patient care information resource
Diagnostic and correction of heterophoria
 MASARYK UNIVERSITY FACULTY OF MEDICINE Diagnostic and correction of heterophoria DIPLOMA THESIS Masters thesis facilitator: doc. MUDr. Svatopluk Synek,CSc. Name of autor: Bc. Sonja Drugović Brno, June
Strabismus. A.Medghalchi,M.D Assistant professor of ophthalmology Gilan medical science university
 Strabismus A.Medghalchi,M.D Assistant professor of ophthalmology Gilan medical science university ۳ Anatomy Of The EOM s Six Extraocular muscles surround eye: Medial Rectus Lateral Rectus Superior Rectus
Vision Therapy/Orthoptics
 Medical Coverage Policy Vision Therapy/Orthoptics Table of Contents Effective Date...07/15/2017 Next Review Date...07/15/2018 Coverage Policy Number... 0221 Related Coverage Resources Coverage Policy...
Think Outside the Box. Strabismus & Amblyopia. Prescribing. Amblyopia 5/9/2017. Goals of today s lecture: Kacie Monroe, OD, FCOVD. Peripheral Movement
 Think Outside the Box Strabismus & Kacie Monroe, OD, FCOVD Goals of today s lecture: Define success in treatment Determine the best path to get there Spoiler: it may not be what you think Provide specific
Home Exercises to Improve Convergence Insufficiency
 Home Exercises to Improve Convergence Insufficiency Patient Information Orthoptic Department Author ID: SM Leaflet Number: Orth 013 Version: 4 Name of Leaflet: Home Exercises to Improve Convergence Insufficiency
Southampton Eye Unit. Orthoptic Induction Pack
 Southampton Eye Unit Orthoptic Induction Pack 1 Orthoptics Orthoptics is an Allied Health Profession. It is a graduate profession with a 3 year degree course offered at Liverpool and Sheffield Universities,
Refractive errors and binocular dysfunctions in a population of university students
 European Journal of Ophthalmology / Vol. 18 no. 1, 2008 / pp. 1-6 Refractive errors and binocular dysfunctions in a population of university students D.J. RISOVIC 1, K.R. MISAILOVIC 1, J.M. ERIC-MARINKOVIC
Retinoscopy. Contributors to this document include:
 Optometric Extension Program Foundation, Inc. 1921 East Carnegie Avenue, Suite 3-L Santa Ana, CA 92705 949 250-8070 - Phone 949 250-8157 Fax Retinoscopy Contributors to this document include: Paul Harris,
INTERMITTENT EXOTROPIA STUDY 3 (IXT3) A Pilot Randomized Clinical Trial of Overminus Spectacle Therapy for Intermittent Exotropia
 A Pilot Randomized Clinical Trial of Overminus Spectacle Therapy for Intermittent Exotropia") 1 2 3 4 5 6 INTERMITTENT EXOTROPIA STUDY 3 (IXT3) 7 8 9 10 11 A Pilot Randomized Clinical Trial of Overminus Spectacle Therapy for Intermittent Exotropia 12 13 14 15 16 17 18 19 20 21 22 23 24 PROTOCOL
1 2 3 4 5 6 INTERMITTENT EXOTROPIA STUDY 3 (IXT3) 7 8 9 10 11 A Pilot Randomized Clinical Trial of Overminus Spectacle Therapy for Intermittent Exotropia 12 13 14 15 16 17 18 19 20 21 22 23 24 PROTOCOL
Vision Therapy/Orthoptics
 Medical Coverage Policy Vision Therapy/Orthoptics Table of Contents Effective Date...08/15/2018 Next Review Date...07/15/2019 Coverage Policy Number... 0221 Related Coverage Resources Coverage Policy...
DIAGNOSIS? CASE NUMBER ONE CONVERGENCE DIFFICIENCIES. Children vs. Adults. Insufficiency vs. Paralysis CONVERGENCE INSUFFICIENCY
 CONVERGENCE DIFFICIENCIES Children vs. Adults Insufficiency vs. Paralysis CASE NUMBER ONE DIAGNOSIS? 8 year boy referred from school- headaches, reading difficulties and blurred vision MY EXAMINATION 20/20-
2014 Volume 17, Numbers 1/2
 2014 Volume 17, Numbers 1/2 To Honor Former Faculty: Thomas Madden and Stanley Rafalko Associated Phorias at Four Near Test Distances and Reading Eyestrain Current Clinical Vision Science Articles of Interest
J. Physiol. (I957) I37,
 I37,") 488 J. Physiol. (I957) I37, 488-508 THE RECIPROCAL ACTIONS OF ACCOMMODATION AND CONVERGENCE BY E. F. FINCHAM AND J. WALTON From the Institute of Ophthalmology, Judd Street, London, W.C. 1 and the Northampton
488 J. Physiol. (I957) I37, 488-508 THE RECIPROCAL ACTIONS OF ACCOMMODATION AND CONVERGENCE BY E. F. FINCHAM AND J. WALTON From the Institute of Ophthalmology, Judd Street, London, W.C. 1 and the Northampton