Diabetes Care Audit Instructional Guide
|
|
|
- Sherman Fisher
- 5 years ago
- Views:
Transcription

1 Diabetes Care Audit Instructional Guide PRIMIS development of the Diabetes Care audit tool has been funded by Boehringer Ingelheim and Lilly Diabetes Alliance. Boehringer Ingelheim and Lilly Diabetes Alliance has undertaken a medico legal review but PRIMIS has retained editorial control and intellectual property rights for this audit tool. Prepared by PRIMIS July 2014 The University of Nottingham. All rights reserved. UK/DIA/00169a Diabetes Care Audit
2 Contents Introduction... 3 Diabetes Case Finder... 9 View 1 Summary Sheet (classic view) View 2 - Datasheet Case finder pre-set filters Diabetes Care Management View 1 - Summary sheet Dashboard view Classic view Medication blood glucose lowering therapy Medication safety summary View 2 Datasheet Diabetes care pre-set filters Key questions for GP practices Recommended follow-up work References Glossary Appendices Columns within the Pseudonymised Datasheet Case finder Diabetes care main audit Risk scoring Instructions for mail merge function - case finder tool Word 2007/ Word 2003: Diabetes_Analysis_V th July 2014
3 Introduction Diabetes is a chronic metabolic disorder caused by defects in insulin secretion and action 1. There are two major types of diabetes, Type 1 and Type 2 along with a number of rarer types. In Type 1 diabetes the body is unable to produce any insulin because the insulinproducing cells of the pancreas have been destroyed 2. Type 1 diabetes can develop at any age but it typically develops in children or young adults (usually before the age of 40) 3. Treatment involves daily insulin injections, a healthy diet and regular physical activity. Approximately 10% of all adults with diabetes have Type 1 diabetes. In Type 2 diabetes insulin is produced but either the amount is not sufficient for the body s needs, or the cells in the body do not react adequately to the insulin that is produced (known as insulin resistance). Type 2 diabetes is more commonly diagnosed in adults over 40 years, but it is also on the increase in young people. Treatment involves a healthy diet, exercise, frequently oral medication but occasionally insulin is also required 4. Approximately 90% of all adults with diabetes have Type 2 diabetes. Conversely, around 96% of children (under the age of 17) have Type 1 diabetes, whereas just 2% have Type 2. An additional 2% have another type 2. Approximately 630,000 people in the UK have diabetes but have not yet been diagnosed 2. It is reported that the actual onset of diabetes can begin ten years or more before diagnosis and that complications relating to diabetes may also begin five to six years before a clinical diagnosis takes place 5. Early diagnosis of diabetes, leading to the prompt provision of appropriate medical care, can save lives in people with Type 1 diabetes, and avert development or progression of complications of Type 2 diabetes, some of which can be life-threatening. Action for diabetes, NHS England (2014) 6 Life expectancy in people with Type 1 diabetes is reduced by more than twenty years and up to ten years for people with Type 2 diabetes. Both types are at increased cardiovascular risk 5. Diabetes is a major cause of premature mortality with over 22,000 additional deaths each year. Diabetes is estimated to have cost the UK 9.8 billion in direct costs in 2010/2011, this equates to approximately ten per cent of the total health resource expenditure 80 per cent of these costs are incurred in treating potentially avoidable complications. Many people with diabetes have complications of diabetes and/or other long-term conditions as well, and there is predicted to be a 252% increase in the number of people with multiple long-term conditions by Action for diabetes, NHS England (2014) 6 Diabetes_Analysis_V1.0 Page 3 of th July 2014
4 By the time they are diagnosed, half of the people with Type 2 diabetes are showing signs of complications and it is estimated that over 800,000 people with diabetes are at increased risk of complications due to glucose control above recommended levels. Children and young people with diabetes have the worst rates of very high risk glucose control 5. Adults with Type 1 or Type 2 diabetes are largely managed in primary care however associated complications often result in hospital admission 1. The risk of complications associated with diabetes can be reduced by undertaking specific care processes as recommended by the National Institute for Health and Care Excellence (NICE) 7,8,9. NICE specify nine care processes that should be reviewed (at least) annually in all patients with diabetes: BMI measurement HbA1c measurement Record of smoking status Albumin: creatinine ratio BP measurement Cholesterol measurement Foot examination Serum creatinine measurement Retinal screening The quality of NHS services for people with or at risk of diabetes has improved over recent years 6. In 2010 the UK had one of the lowest rates of early death due to diabetes compared to other wealthy countries 10. Data from the National Diabetes Audit (NDA) show a tenfold increase in the number of people who had received all nine diabetes care processes from 5% to 54% between 2005 and Data from the Quality and Outcomes Framework (QOF) for the individual care processes averaged 94% in 2009/10, which is significantly higher than that reported by the NDA* 11. It has been suggested that the emphasis on processes of diabetes care within the QOF and the NDA may be positively contributing to clinical outcomes such as reduced mortality rates 6. Whilst distinct progress is being made on improving clinical outcomes for people with diabetes in England, there is still room for improvement, particularly in relation to addressing geographical variations in standards of care 6. Data from the NDA in 2010 show big variations in the percentage of patients receiving the nine care processes, ranging from 60% of patients in nineteen Primary Care Trusts (PCTs) to less than 10% in two PCTs 5. There is also much work to be done in meeting the target levels (advised by NICE) in relation to HbA1c, blood pressure and cholesterol in addition to simply ensuring that the processes have been done. Opportunities for improvement also exist in relation to the prevention and early diagnosis of Type 2 diabetes and individual management of both Type 1 and Type 2 diabetes 6. Local Clinical Commissioning Groups (CCGs) and NHS England are under a statutory duty to continuously improve quality. In order to help support delivery of the NHS Outcomes Framework (NHS OF), NHS England has developed the Clinical Commissioning Group Outcomes Indicator Set (CCG OIS). The CCG OIS 2014/15 contains specific indicators aimed at improving outcomes of the care received by people with diabetes with a focus on reducing premature mortality and enhancing quality of life 12. One indicator specifically looks at the nine care processes listed above. Diabetes_Analysis_V1.0 Page 4 of th July 2014
5 *Data recording in general practice Some of the variation between the QOF and the NDA results can be explained by exclusions within the QOF for specific patients groups, such as newly registered patients, newly diagnosed and patients under 17 years. Crucially though, the NDA and QOF were designed for different purposes; they utilise different code sets, different query logics and as a result the data are not directly comparable. 11 It is important to understand that the recording of data in general practice, using Read codes, is primarily influenced by the reason for recording that data electronically. The two main reasons (currently) are direct patient care and to achieve QOF target payments. As a result, there is often a strong incentive to use codes that are linked to QOF over other codes that may be available. Absence of a code within the patient s record does not necessarily mean that a particular care process has not taken place, but such information may instead be found in free text entries or elsewhere on the system (e.g. within scanned letters). This information still exists to support patient care but is not Read coded. 11 Related QOF indicators Year 2014/15 Diabetes mellitus: DM017, DM002, DM003, DM004, DM006, DM007, DM008. DM009, DM012, DM014, DM018 Diabetes_Analysis_V1.0 Page 5 of th July 2014
6 Aim of the diabetes care audit tool The aim of the diabetes care audit tool is twofold; to assist with case finding activity and to report upon the level of care being offered to patients with known diabetes. This audit tool expands the scope of the National Diabetes Audit in line with the NICE recommendations, as well as enabling practice/patient level analysis. The case finder element provides practices both with a list of patients identified as having possible diabetes and those at risk of developing diabetes. By undertaking a review of these patients and adding any missing diagnosis codes, practices can improve the quality of their diabetes register, establish a more accurate prevalence rate and ensure that patients are monitored regularly and receive appropriate management. The care management part of the audit tool helps practices identify where they can improve the quality of care they provide to patients with known diabetes and reduce their risk of complications. The diabetes audit tool enables practices to extract and analyse relevant clinical data from their clinical information system. The audit tool works across all clinical information systems and presents data in an easy to use format allowing practices to gain insight and knowledge into their management of patients with diabetes. The diabetes audit tool helps practices by: generating a list of patients with possible diabetes and providing relevant information to help clinicians to confirm or exclude diagnosis identifying patients at risk of developing the disease so that those at high risk can be regularly monitored (using the Leicester diabetes risk score) allowing practices to achieve a more accurate prevalence rate for diabetes within their practice population identifying patients of all ages who have an existing diagnosis of diabetes and facilitating clinical audit against national standards establishing the number of patients with diabetes who have received the NICE recommended care processes in the last year and the number who have achieved the related target thresholds for HbA1c, BP and cholesterol reporting on the number of patients currently being treated in accordance with NICE recommendations regarding blood glucose lowering therapy and presenting data visually by populating the integrated NICE medication flowchart reporting on the presence of associated complications of diabetes for all patients within the practice highlighting where prescribing in diabetes might be sub-optimal from a safety point of view with advice and cautions from the BNF Diabetes_Analysis_V1.0 Page 6 of th July 2014
7 providing the facility to compare data with other practices both locally and nationally and the option to share aggregated data with their CCG via the CHART Online tool contributing to the delivery of the Quality and Outcomes Framework, the National Diabetes Audit, the NHS Outcomes Framework and the Clinical Commissioning Group Outcomes Indicator Set As this is an audit tool, it has been designed simply to signpost GPs to patients who may be of interest or concern and would benefit from review. The tool is not intended to replace clinical decision making. Any action should be as a result of performing a clinical review with patients based upon individual circumstances. Clinical audit notes and GP revalidation This audit tool has been designed to support GP revalidation. GPs can use the various displays within the CHART software to review clinical data at both patient and practice level, enabling them to maintain an overall picture of how they are managing patients at a population level but at the same time, look in detail at the care of individual patients. This is a retrospective clinical audit - looking back at clinical practice that has already taken place. When conducting clinical audit for GP revalidation, GPs might choose to audit just their own clinical practice. Note that the diabetes audit tool will report on all patients with a diabetes diagnosis or with factors suggesting possible diabetes. Data will therefore be included on the activity of other colleagues within the practice. Involve fellow GPs in the clinical audit project. Several GPs who work together as a team can undertake a common audit. This is acceptable for the purpose of GP revalidation, as long as each GP can demonstrate that they have contributed fully to the clinical audit activity. Alternatively, seek their permission. A clinical audit on the care of patients with diabetes (or possible diabetes for case finder searches) matches the following criteria: it is of concern for patients and has the potential to improve patient outcomes it is important and is of interest to you and your colleagues it is of clinical concern it is of local or national importance it is practically viable there is new research evidence available on the topic it is supported by good research Diabetes_Analysis_V1.0 Page 7 of th July 2014

8 Running the diabetes audit tool Before running the audit you must ensure that CHART is installed and you are familiar with how to use the software. Detailed instructions on CHART installation and using the software can be found on the PRIMIS website: There are two MIQUEST query sets contained within the diabetes care audit tool: one for the case finder and one for the management of patients with known diabetes. Within the CHART software, practices can switch between the Diabetes Case Finder and the Diabetes Report by using the Select Databook function as illustrated below: Both audits search on all patients who are currently registered at the practice. It is recommended that both audits are run frequently (e.g. quarterly or six monthly) to monitor standards of care. CHART Online CHART Online is a secure web enabled tool that helps practices improve performance through comparative data analysis. Using CHART Online, practices can explore and compare the quality of their own data with anonymised data from other practices, locally or nationally, through interactive graphs. CHART Online helps practices and Primary Care Organisations (PCOs) to improve data quality and identify ways to enhance patient care. Variations in data management and activity are more visible when compared across a group of GP practices. Comparative data analysis provides a powerful tool for standardising care across localities and may be of interest to local commissioning groups to facilitate the planning of care pathways. Aggregated summary data from the diabetes care part of the audit tool can be uploaded to the PRIMIS comparative analysis tool, CHART Online. Access to the comparative views will be available in the near future once sufficient data have been received to generate the graphs. Please note that data from the case finder element cannot be uploaded to CHART Online as there is no corresponding toolkit. Additionally, there is an inbuilt security function that prevents patient identifiable data from the care management element being uploaded to CHART Online. Only aggregate data compiled from the pseudonymised responses can be transmitted. Diabetes_Analysis_V1.0 Page 8 of th July 2014
9 Diabetes Case Finder It is strongly recommended that practices use the case finder tool before going on to examine the management of patients with known diabetes. Using the case finder as a starting point will ensure that people with symptoms of diabetes are diagnosed earlier, receive appropriate treatment and that the practice diabetes register and practice prevalence rate are as accurate as possible. The diabetes case finder helps practices to answer the following questions: Do we have any patients with diabetes who do not have the diagnosis coded in their electronic record? Are there any patients who would benefit from review for possible inclusion in the register and relevant treatment? How accurate is the practice prevalence rate for diabetes? Which patients are at greatest risk of developing the disease and would therefore benefit from appropriate management to reduce the risk of developing the disease and its associated complications? The case finder audit includes all patients who are currently registered at the practice AND have Read coded entries that suggest possible diabetes or identify them as being at risk of developing the disease. Diabetes risk score The case finder includes a calculation of diabetes risk based on the scoring system developed by The University of Leicester and The University Hospital of Leicester NHS Trust in collaboration with Diabetes UK 13. It is an assessment tool which aims to identify individuals with impaired glucose regulation (IGR) and is designed to predict an individual s risk of developing Type 2 diabetes within the next ten years. This scoring system is recommended to GPs and other primary healthcare professionals by NICE 14. The risk assessment is evidenced-based and consists of seven questions related to age, gender, waist circumference, BMI, ethnic background, blood pressure and family history. It uses a points system to identify if a person is at low, moderate, increased or high risk of developing diabetes. Patients are categorised into: High risk Moderate risk Increased risk Low risk > Based on this score, appropriate advice should be provided in the form of lifestyle changes or a referral for further assessment. The case finder audit tool will also look for a Read coded entry for the Diabetes UK (Leicester) risk score (38Gv. in Read V2 Or XaYRF in CTV3). If it is present on the GP clinical system it will be displayed in the CHART datasheet, along with the calculated Leicester risk score for comparative purposes, in addition to the QDiabetes Risk Calculator score if present (38Gj. in Read V2 or Xaa0e in CTV3). Diabetes_Analysis_V1.0 Page 9 of th July 2014

10 View 1 Summary Sheet (classic view) The CHART summary sheet provides a synopsis of all the relevant data recorded by the practice and is the best place to start when viewing the results. The classic view presents practice data in tabular format. Below is an example practice summary sheet for the diabetes case finder. Diabetes_Analysis_V1.0 Page 10 of th July 2014

11 Key information The first four rows of data (blue) provide some important pieces of information: an up to date count of the registered practice population the number of patients who have a recorded diagnosis of diabetes the recorded prevalence rate of diabetes in the practice the number of patients who have Read coded entries related to diabetes or identify them as being at risk of developing the disease (patients included in the datasheet) What to note about this practice The recorded prevalence rate (for patients of all ages with diabetes) in this practice is 4.2%. This is lower than the 2013/14 Quality and Outcome Framework rate (reported February 2014) 14 of 6% of people aged 17 or over registered on practice lists. 4,276 patients have been picked up by the search and are included in the datasheet, meaning they have items in their record related to diabetes or they are at risk of developing the disease. Suggested actions As a baseline quality check, assess whether the practice population count seems accurate. An unusually low number may suggest a problem whilst running the queries. Review the remaining summary sheet for further information on possible missing diagnoses and patients at risk. There may be patients with diabetes who have not yet had this coded which might explain the lower than expected prevalence rate in this practice. Diabetes_Analysis_V1.0 Page 11 of th July 2014


12 Possible missing diabetes diagnosis The next table provides a count of the number of patients who may have a missing diagnosis and provides a breakdown of the indicative factors. Please note that patients may have more than one indicative factor therefore the count of total patients shown in the bottom row may be lower than the count of indicative factors that appear above. Related datasheet column The Possible missing diabetes diagnoses column within the datasheet (shown right) allows you to filter the data by each of the individual factors. For the purposes of this filter, patients can only be classified into one category. Where a patient has more than one factor suggesting diabetes, the one with most precedence is selected (regardless of the date of entry). The precedence order is displayed in the table below from top to bottom, so diabetic medication takes precedence over nonstandard diagnostic recording. Diabetic medication Blood glucose diagnostic level Fasting glucose diagnostic level HbA1c diagnostic level Diabetes monitoring codes Non-standard diagnostic recording Since patients can have more than one indicative factor, the counts provided by filtering on this column in the datasheet may not match the count of factors contained within the table on the summary sheet. This is because the summary sheet table counts the number of factors regardless of whether a patient has already been counted in another category. Also, note that the presence of each of the factors in the filter drop down menu (see right) is entirely dependent upon data being present for that category. So, for example if there are no patients with diabetes monitoring codes in the datasheet, this category will not appear for selection in the filter drop down menu. Diabetes_Analysis_V1.0 Page 12 of th July 2014
13 Important note: Patients identified within the diabetic medication category may be on diabetes related medication for other genuine reasons e.g. metformin for Polycystic Ovarian Syndrome (PCOS). What to note about this practice There are 44 patients identified in the Possible Missing Diagnosis list. Some patients may have more than one factor suggestive of diabetes recorded in their medical record. In this particular practice, the most common factor suggesting possible diabetes is a fasting glucose level within diagnostic range (27 patients). Suggested actions Using pre-set filter 1 within the datasheet (see page 19) identify the patients who may be missing a diagnosis of diabetes. You may want to start by listing patients who have more than one indicative factor. You can find these patients by applying an additional custom filter on the column Count of Factors within the datasheet. Next, use the associated data in the datasheet to gain a picture of the patient s history and look for clues as to whether a diagnosis may be missing or whether diabetes can be excluded. The patient s full medical record may need to be examined and/or the patient called for review before a final decision can be made. Use the mail merge function to produce invitation letters for patients that need to visit the practice for a review. Pre-set filter 5 within the datasheet will produce a list of patients who have ever had an HbA1c result greater than or equal to 48. It is worthwhile reviewing these patients also to establish whether a diagnosis needs to be made or excluded. For patients who have been assessed and diabetes has been excluded, consider adding the read coded entry Diabetes Mellitus Excluded to their electronic record (1I0.. in Read V2 or XaFvt in CTV3). This will make it clear that a specific assessment has taken place and when. These patients will need to be reviewed again in future, but it will be easier to set a review schedule if review dates are recorded clearly and accurately. Note that the case finder can only help to find patients who may be missing a diagnosis (potential under recording of diabetes) and cannot help to identify patients who may incorrectly have a diagnosis recorded on their record (potential over recording). However, the main diabetes care audit datasheet may be able to help identify such patients. Diabetes_Analysis_V1.0 Page 13 of th July 2014

.")
14 Patients at increased risk of diabetes The next table provides a count of the number of patients at increased risk of developing diabetes and provides a summary of the contributory risk factors. Please note that patients may have more than one contributory risk factor therefore the count of total patients shown in the bottom row of the table may actually be lower than the count of indicative factors that appear above. Related datasheet column The Increased risk of diabetes column within the datasheet (shown right) allows you to filter the data by each of the individual risk factors. For the purposes of this filter, patients can only be classified into one category. Where a patient has more than one factor, the one with most precedence is selected (regardless of date). The precedence order is displayed in the table below from top to bottom, so Polycystic Ovarian Syndrome (PCOS) takes precedence over Gestational diabetes. PCOS Glycosuria Insulin resistance High glucose Reaven's syndrome Prediabetes Impaired glucose tolerance Gestational diabetes Since patients can have more than one indicative factor, the counts provided by filtering on the column in the datasheet may not match the count of factors contained within the table on the summary sheet. This is because the summary sheet table counts the number of factors regardless of whether a patient has already been counted in another category. Also note that the presence of each of the factors in the filter drop down menu (shown right) is entirely dependent upon data being present for that category. So, for example, if there are no patients with Reaven s syndrome in the datasheet, this category will not appear for selection in the filter drop down menu. Diabetes_Analysis_V1.0 Page 14 of th July 2014
15 What to note about this practice There are 157 patients identified as being at increased risk of diabetes. The most common risk factor for diabetes in this particular practice is a previous diagnosis of glycosuria (71 patients). Suggested actions Using pre-set filter 2 within the datasheet (see page 19) identify the patients with diagnoses that put them at increased risk of developing diabetes in the future. Use the associated data in the datasheet to gain a picture of the patient s history and look for indications or symptoms that may suggest diabetes has since developed. Establish when the patient was last reviewed. The patient s full medical record may need to be examined and/or the patient called for review. Patients at increased risk of diabetes should be regularly monitored for signs of the disease. For patients who have been assessed and diabetes has been excluded, consider adding the read coded entry Diabetes Mellitus Excluded to their electronic record (1I0.. in Read V2 or XaFvt in CTV3). This will make it clear that a specific assessment has taken place and when. These patients will need to be reviewed again in future, but it will be easier to set a review schedule if review dates are recorded clearly and accurately. Diabetes_Analysis_V1.0 Page 15 of th July 2014
 One of the factors of")

16 Latest BMI value The latest BMI table has been included as supporting information. The following patients are not included in this table: patients without a BMI recorded patients whose latest BMI is <25 patients whose latest BMI is 100 (erroneous records) One of the factors of increased diabetes risk is a BMI of 25 or above. This table provides a breakdown of BMI results 25 for all patients in the practice. The table shows how many of these patients have also been identified as being at increased risk of developing diabetes or who have a possible missing diagnosis. What to note about this practice 22.4% of the practice population have a BMI 25 (3,038 patients). 32 patients with a BMI 25 also potentially have a missing diabetes diagnosis. 81 patients with a BMI 25 are also at increased risk of developing diabetes. Suggested actions Focus efforts on the 32 patients who potentially have a missing diagnosis of diabetes (in addition to a raised BMI) and the 81 patients at increased risk of developing diabetes (who also have a raised BMI). Rounding issue in datasheet For the purposes of categorising patients by their latest BMI value, the patients latest BMI value is extracted from the clinical system, this is then rounded to two decimal places within the datasheet. A subsequent column in the datasheet then identifies patients whose latest BMI 35. On occasion, this rounding up can create an artificial inflation, for example, where a patient has a BMI of the figure is rounded up to The Latest BMI 35 column within the datasheet will not include this patient as their true unrounded value is actually below 35 so they are correct to be excluded (see screenshot right example patient on penultimate row). Diabetes_Analysis_V1.0 Page 16 of th July 2014

17 Leicester Diabetes Risk Score The diabetes risk score table categorises patients by their level of risk. Data items used to calculate the patients scores include: age, gender, waist circumference, BMI, ethnic background, blood pressure and family history. Most data items are generally well recorded on the GP clinical system, however waist circumference, ethnicity and family history are perhaps less consistently recorded. What to note about this practice 262 ( ) patients have been identified as having a high risk score and have the highest risk of developing diabetes. Only one patient has all 7 data (or risk) items used to calculate the score. Suggested actions Using pre-set filter 3 within the datasheet, identify patients classified as being at high risk of developing the disease. These patients appear in red on the datasheet. You may want to start by focusing on any patients that have all 7 data items, then move on to patients with 6 items and finally review patients with less than 6 data items. Use the associated data in the datasheet to gain a picture of the patient s history and look for indications or symptoms that may suggest diabetes has since developed. Establish when the patient was last reviewed. The patient s full medical record may need to be examined and/or the patient called for review. Patients at increased risk of diabetes should be regularly monitored for signs of the disease. Based on their score, appropriate advice should be provided in the form of lifestyle changes or a referral for further assessment. For patients who have been assessed and diabetes has been excluded, consider adding the read coded entry Diabetes Mellitus Excluded to their electronic record (1I0.. in Read V2 or XaFvt in CTV3). This will make it clear that a specific assessment has taken place and when. These patients will need to be reviewed again in future, but it will be easier to set a review schedule if review dates are recorded clearly and accurately. Compare the calculated risk score with the recorded/extracted score from the clinical system (if present). Review any discrepancies. Also consider the QDiabetes risk score where present. Diabetes_Analysis_V1.0 Page 17 of th July 2014

 or a patient identifiable")

18 View 2 - Datasheet The datasheet (accessible via this icon from the toolbar) is perhaps the most valuable part of the diabetes case finder audit tool. It allows practices to access patient level data, providing relevant information in one place to help clinicians confirm or exclude a diagnosis of diabetes. The datasheet can be filtered as desired by the practice, to produce bespoke lists of patients. When preparing the queries to run on the clinical system, practices must decide whether to run a pseudonymised set, which uses a patient reference number (as shown below) or a patient identifiable set, that will return named patient information. The patient identifiable set is the most useful for case finding activity and also offers a mail merge function to allow practices to prepare invitation letters for patients should they wish to call patients in for review. See the appendices for instructions. The CHART datasheet contains many columns of relevant data. A full list of available columns is included in the appendices of this document. As an example, there is a column titled Diabetes excluded date at the far right of the datasheet which could be used by practices to exclude patients who have recently had a diabetes diagnosis excluded (e.g. in the last six months). In Excel 2003 you can apply a custom filter to the column by clicking on the black drop down arrow, selecting (custom ) and then selecting is less than, add the date from six or twelve months ago. Patients with an entry after this date will then be hidden (temporarily) from the datasheet. Diabetes_Analysis_V1.0 Page 18 of th July 2014

 in the missing diagnoses section of the datasheet, not the latest HbA1c column.")
19 Case finder pre-set filters In addition to creating custom filters, there are five pre-set (or pre-loaded) filters provided within this audit tool. Accessed via PRIMIS CHART, Load Filter when viewing the datasheet. Load a filter as desired and then review the columns containing data items suggestive of diabetes to determine the value of reviewing the patients records in more detail. This will also assist with prioritising patients for review. Note that filter 5 will filter a column (HbA1c 48 value) in the missing diagnoses section of the datasheet, not the latest HbA1c column. You will have to expand the plus signs towards the top of the datasheet to reveal hidden columns (see image below): Once you have finished using the case finder tool and are confident about the accuracy of the practice diabetes disease register move on to the next part of the audit tool examining the care of patients with known diabetes. Diabetes_Analysis_V1.0 Page 19 of th July 2014
20 Diabetes Care Management It is recommended that practices use the case finder tool before going on to examine the management of patients with known diabetes. This will ensure that the practice diabetes register and prevalence rate are as accurate as possible before examining the care and management of patients with diabetes. The diabetes care management tool helps practices to answer the following questions: What is the practice prevalence rate for diabetes? How many patients have Type 1, Type 2, another type or have a diagnosis that does not define type? How many patients have received the NICE recommended care processes in the last year? How many patients have achieved the relevant target thresholds for HbA1c, blood pressure and cholesterol? How many patients are currently being treated in accordance with NICE recommendations regarding blood glucose lowering therapy? How many of our patients with diabetes currently have complications associated with the disease? How many patients with diabetes are currently at risk due to sub-optimal prescribing? Diabetes care management output The diabetes care management tool provides the following views in CHART: 1. Summary sheet including - a dashboard view of the main audit data - a classic tabular view of the main audit data - a medication safety summary - populated NICE blood glucose lowering/medication pathway 2. Full patient datasheet Detailed information on each of these data views can be found below. View 1 - Summary sheet CHART summary sheets provide a snapshot of all the relevant data recorded by the practice. For diabetes care management there are four different summary sheet views available; a dashboard view, a classic tabular view, a medication safety summary and a populated NICE medication pathway. The dashboard view provides a visual display of the data whereas the classic view and medication summary present data in tabular form. Diabetes_Analysis_V1.0 Page 20 of th July 2014

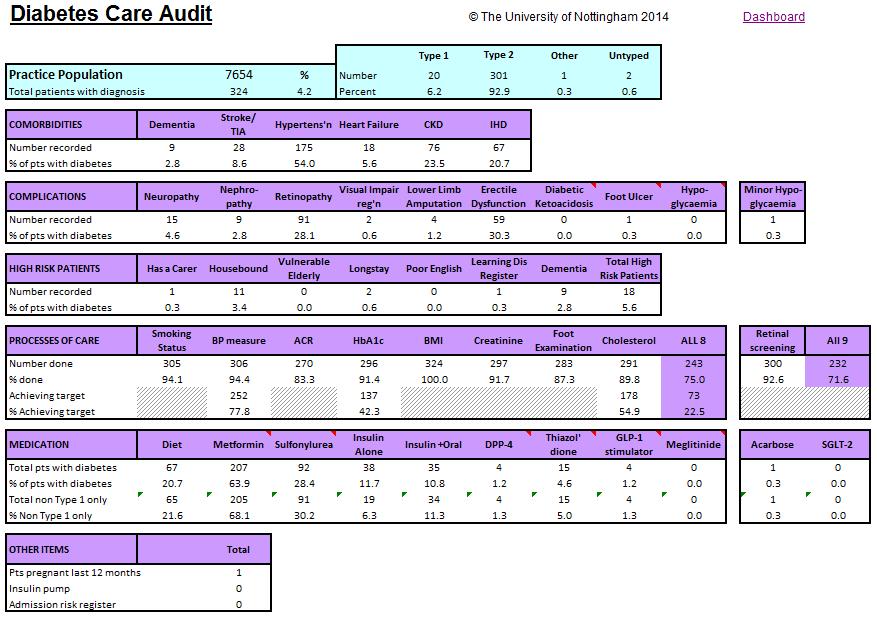
21 Dashboard view Classic view Diabetes_Analysis_V1.0 Page 21 of th July 2014

 of 6% for England and the UK average as a whole.")
22 Population/prevalence The classic view and dashboard view of the summary sheet start by providing key statistical information, including an up to date practice population count, disease prevalence rate and a breakdown of the number of patients with each type of diabetes. Untyped describes patients who have no specific diabetes type diagnosis code in their record (ie. a code that clarifies type). What to note about this practice The prevalence rate of diabetes in this practice is 4.2%. This is lower than the 2013/14 Quality and Outcome Framework rate 15 (reported February 2014) of 6% for England and the UK average as a whole. There are 2 patients who do not have a specific type of diabetes coded in their electronic health record. Suggested actions If your practice prevalence rate is inexplicably low compared to the national or local average (averages can be determined using CHART Online) then consider looking for patients who are potentially missing a diabetes diagnosis. The case finder can help with this task. If your practice prevalence rate seems unusually high, review coding practice in this area or look for evidence of the underlying cause. Co-morbidities The second table on the classic view displays information about the number of patients with co-morbidities such as heart failure, cardiovascular disease and hypertension. There is a corresponding graph on the dashboard. Knowledge of co-morbidities can help when planning a patient s care pathway particularly in relation to cardiovascular risk. It can also help you to understand how unwell patients are, or could become. It should be highlighted that patients picked up as having chronic kidney disease (CKD) may in fact have diabetic nephropathy but coding may not accurately reflect this therefore consider the rates for each. Diabetes_Analysis_V1.0 Page 22 of th July 2014

23 Complications Both the classic and dashboard view of the summary sheet display data relating to the associated complications of diabetes. Information regarding the incidence of complications relating to diabetes is important as they can often result in admission to hospital. Data can also help to inform appropriate management of the patient (e.g. visual impairment can make it difficult for patients to take the correct medication). It should be highlighted that patients with diabetic nephropathy may have instead been coded as having CKD. Consider rates for both CKD and diabetic nephropathy when reviewing data in this area. Note that the search criteria for the first six categories in the table below looks at entries ever. The last three categories (diabetic ketoacidosis, foot ulcer and hypoglycaemia) only include data from the last 12 months. Note: Lower limb amputation excludes toe amputation only. The first hypoglycaemia column in the table represents episodes where third party help may have been needed. The second column represents individuals who have information relating to minor hypoglycaemic episodes. High risk patients The summary on high risk patients gives information that is fundamental to the planning and provision of care for these patients. These patients may have difficulty with certain aspects of the self-management of diabetes. It includes information about mobility, learning disability, potential language barriers, carer status and whether they reside in a nursing or residential home. Diabetes_Analysis_V1.0 Page 23 of th July 2014


24 Processes of care The middle areas of both the dashboard and classic summary sheet display data regarding the number of patients that have received the nine processes of care recommended by NICE. Note that as provision of retinopathy services is largely outside the influence of the GP surgery, extracted information related to retinal screening is solely based upon attendance rates reported back to the practice. It is for this reason that retinal screening has not been included as one of the care processes in the central count section of the dashboard. However, detailed information relating to retinal screening can be found within the CHART datasheet. The top two lines of the classic view table (shown above) are about process; determining whether these tests have been done. The same applies to the graph on the dashboard (shown left). The bottom two lines of the table relate to the achievement of associated targets. NICE specifies targets for HbA1c, BP and cholesterol that are based on patients history. Achieving target shows the number of patients that have received that care process AND met the related target. In the example shown above, 91.4% of patients had their HbA1c measured but only 42.3% had values that met the target. The ALL 8 and ALL 9 columns of the table count the number of patients that have had all tests done (counted within the last 12 months with the exception of smoking status). Smoking status is based upon the QOF rules regarding codes and frequency of recording (e.g. a nonsmoker over 25 only needs to be recorded once). In the centre of dashboard a summary is provided (shown left) highlighting the number of patients who have received 8 of the 9 care processes (retinopathy screening is excluded from this count) and whether their latest HbA1c, BP and cholesterol results were within target. Diabetes_Analysis_V1.0 Page 24 of th July 2014
25 What to note about this practice 75% of patients with diabetes received 8 out of 9 care processes in the last 12 months. 71.6% received all 9 care processes. Only 22.5% of patients who received 8 care processes had values for HbA1c, blood pressure and cholesterol that met NICE targets. 42.3% of patients with an HbA1c recorded in the last 12 months had values that were below (or on) target. This means that 57.7% of patients had an HbA1c above the target level. Suggested actions Review patients who are not meeting targets for HbA1c, blood pressure and cholesterol and check that they are receiving optimal treatment as described within NICE guidance. Review related tables and graphs from the audit tool for more information on each target area (see pages of this guide). Review coding practice for any processes that are not well recorded (e.g. retinal screening). Investigate whether required information is being sent to the practice. Also, check that each process is routinely offered during annual reviews. Diabetes_Analysis_V1.0 Page 25 of th July 2014

26 HbA1c control Type 1 glycaemic control This dashboard graph displays information regarding glycaemic control in patients with Type 1 diabetes. This gives an indication of the risk of developing complications related to diabetes in the longer term. NICE advises that lowering blood glucose levels reduces the risk of complications and high levels of HbA1c may indicate the need for glucose-lowering drugs. NICE targets 7 DCCT units <7.5% 6.5% IFCC units <58.5 mmol/mol 47.5 mmol/mol Patients in this category All patients with type 1 diabetes except those at increased risk of complications Children and young people without frequent disabling hypoglycaemia Patients at increased risk of hypoglycaemia Graph key Green Amber Red Within target Above target - raised Above target - very high These patients are at increased hyperglycaemic risk which in turn is associated with increased risk of microvascular and macrovascular complications These patients are at significantly increased risk of complications such as heart failure 15 86mmol/mol (IFCC) is the equivalent of 10% (DCCT) Not done No HbA1c recorded in the last 12 months Suggested actions For patients above target, offer therapy (lifestyle and medication) to help achieve and maintain the HbA1c target level. Check that patients are receiving optimal treatment as described within NICE guidance. Children and young people with HbA1c levels consistently above 9.5% should be offered additional support by their diabetes care teams to help them improve their glycaemic control because they are at increased risk of developing diabetic ketoacidosis and long-term complications. Review patients with no HbA1c recorded in last 12 months. Diabetes_Analysis_V1.0 Page 26 of th July 2014

27 Non Type 1 Rx and HbA1c control This dashboard graph summarises patients HbA1c control and groups results by medication regime. See the medication section on page 30 for the full treatment category names. Green Amber Red Within (or hit) target Above (or missed) target Not done (no HbA1c recorded in the last 12 months) NICE targets 9 NICE recommends specific HbA1c targets according to treatment regime. DCCT units 6.5% <7.5% IFCC units 47.5 mmol/mol <58.5 mmol/mol Patients in this category Patients where their diabetes is managed by diet or one medication Patients at risk of severe hypoglycaemia (or on two or more oral glucose-lowering drugs or needing insulin) Children and young people What to note about this practice This practice appears to be good at monitoring patients HbA1c levels but may need to work further on appropriate management strategies. Suggested actions For patients above target check those patients are receiving optimal treatment as described within NICE guidance. Diabetes_Analysis_V1.0 Page 27 of th July 2014

28 BP control This graph displays information regarding achievement of blood pressure targets. No Rx indicates that patients are not currently on any antihypertensive medication. If BP is above target, then patients could be considered for this. Graph legend NICE targets 8 Green Within (or hit) target Target Amber Red Above (or missed) target Not done (no BP recorded in the last 12 months) <130/80 mm/hg <140/80 mm/hg Patients in this category Patients with eye, cerebrovascular or kidney damage (ECK) Patients without eye, cerebrovascular or kidney (ECK) damage What to note about this practice There are some patients with eye, cerebrovascular or kidney damage (ECK) who have missed the target for blood pressure control in this practice. Suggested actions For patients whose blood pressure is above target, repeat measurement regularly in accordance with NICE guidelines. Give patients advice on lifestyle measures and check that they are receiving optimal treatment (as described within NICE guidance). Review patients with no blood pressure recorded in last 12 months. Diabetes_Analysis_V1.0 Page 28 of th July 2014

29 Cholesterol vs medication This graph displays information regarding achievement of target cholesterol levels and categorises patients according to their use of a statin, alternative (non statin) therapy and those not using any lipid modifying therapy. Patients with all types of diabetes are included in this graph. Note that patients on statins may also be on other (non statin) lipid lowering therapy but they will appear in the statin section of the graph only. The NICE target is total cholesterol <4 mmol/litre 9. Green Amber Red Within (or hit) target Above (or missed) target Not done (no total cholesterol recorded in the last year) What to note about this practice Over half of the patients who are on a statin have a cholesterol level within target. There are over 100 patients who are not using any lipid modifying therapy and very few of these patients have a cholesterol level within target. Suggested actions Review patients who have missed the target. For those that are not taking a lipid modifying therapy, consider commencement of therapy. For patients on statins who have not achieved target, NICE guidance suggests increasing simvastatin (to 80 mg daily) and consider intensifying therapy with a more effective statin or ezetimibe if there is existing or newly diagnosed CV disease (HDL-C should not exceed 1.4mmol/litre) or increased albumin excretion rate. 17 Review patients with no cholesterol recorded in last 12 months. Diabetes_Analysis_V1.0 Page 29 of th July 2014

30 Medication blood glucose lowering therapy The following table provides information regarding treatment. This offers practices an overview of the numbers of patients taking each type of drug/diet only. Patients may appear in more than one category e.g. number on Metformin and number on insulin + oral. The integrated NICE blood glucose lowering pathway (see next page for full image) places patients into the relevant part of the pathway. In this view, patients will only appear once. Patients with Type 1 diabetes are excluded from this view. Patients who appear in each red category are potentially not being treated optimally (in accordance with NICE guidance). For example, using the data shown to the left, there are 22 patients on diet alone who have a HbA1c above the target level of 48. These patients should be considered for commencement of Metformin. Of the 85 patients on metformin, 50 have a HbA1c above the target level of 48. These patients should be considered for commencement of sulfonylurea or other suggested management options. Diabetes_Analysis_V1.0 Page 30 of th July 2014

31 Diabetes_Analysis_V1.0 Page 31 of th July 2014
32 Other data items Number of diabetic patients pregnant in last year This is provided for information and is a pointer to suggested audit. Pregnant patients with diabetes are cared for by (specialist) secondary care services and as a result primary care has little influence over their care during pregnancy. Number of patients with insulin pump Provided for information only. Admissions risk register This section reports on the number of patients who have coded entries relating to the avoidance of unplanned admissions to hospital. The codes included in the audit are as follows: Read Version 2 CTV3 8CT2. 8CV4. 8IAe1 XaYD2 XaYD1 XabFn Admission avoidance care ended Admission avoidance care started Admission avoidance care plan declined Admission avoidance care ended Admission avoidance care started Admission avoidance care plan declined Diabetes_Analysis_V1.0 Page 32 of th July 2014

33 Medication safety summary The medication safety summary table helps practices examine areas where prescribing (in diabetes) might be sub-optimal from a safety point of view. There are two main groups; those of general prescribing safety and those related to poor renal function. Advice and cautions are taken from the BNF. Medication is analysed from the last six months. General prescribing safety Useful information Insulin and betablockers the number of patients identified is the number on insulin. The number of patients at risk is the number taking both insulin and betablockers. Women of child bearing age on statins - statins are contraindicated in pregnancy as a known cause of congenital abnormalities. This topic has been introduced to highlight the potential risk. Women of child bearing age on ACEI/ARB - ACE inhibitors and ARB drugs should be avoided in pregnancy unless essential. This topic has been introduced to highlight the potential risk. What to note about this practice There are 25 patients on both insulin and betablockers. There are 3 women of child bearing age on statins. There are 3 women of child bearing age on ACEI/ARB. Suggested actions Review the patients highlighted as being at risk. For women of child bearing age on statins or ACEI or ARB, ensure that they have been given appropriate advice about the risks in pregnancy. Diabetes_Analysis_V1.0 Page 33 of th July 2014

34 Renal function Useful information egfr data is based upon the latest entry in the last 12 months. Sitagliptin and egfr - patients with an egfr<50ml/min should not take more than 50mg sitagliptin daily; note this does not take account of combinations with inherent metformin but they are handled elsewhere. Vildagliptin and egfr - caution is advised in patients on vildagliptin with an egfr<50ml/min; the specification above does include combination drugs including metformin which may be identified elsewhere if egfr<45ml/min. Saxagliptin and egfr - patients with an egfr<60ml/min should not take more than 2.5mg sixagliptin daily; the specification above does handle combination drugs including metformin on the assumption they are taken twice daily. Exenatide and egfr - patients should avoid exenatide M/R where the egfr is <50ml/min and all exenatide forms where the egfr <30ml/min. Caution should be advised in patients on normal exenatide where their egfr <50ml/min. Liraglutide and egfr - patients should avoid liraglutide where the egfr <60ml/min. What to note about this practice There is 1 patient on metformin with an egfr value of less than 30ml/min. There are 15 patients on metformin with an egfr value of less than 45ml/min. Suggested actions Review the patients highlighted as being at risk and ensure they are being treated safely. Diabetes_Analysis_V1.0 Page 34 of th July 2014

 or a patient identifiable")
 only the pseudonymised set can be uploaded in order")
35 View 2 Datasheet The datasheet (accessible via this icon from the toolbar) is perhaps the most valuable part of the diabetes care audit tool. It allows practices to access patient level data, providing relevant information in one place to help clinicians review relevant information regarding diabetes care. The datasheet can be filtered as desired by the practice, to produce bespoke lists of patients. When preparing the queries to run on the clinical system, practices must decide whether to run a pseudonymised set, which uses a patient reference number (as shown below) or a patient identifiable set that will return named patient information. The patient identifiable set is the most useful for audit and patient care but to achieve the benefits of comparative analysis (using CHART Online) only the pseudonymised set can be uploaded in order to keep patient data secure. The CHART datasheet contains many columns of relevant data. A full list of available columns is included in the appendices of this document. As an example, towards the left hand side of the datasheet there is a column titled Latest diabetes type (see image right). It is beneficial for practices to apply a filter to this column to identify any patients who have an untyped diagnosis. For these patients, there is no indication in their record as to whether they have Type 1, Type 2 or another type of diabetes which prevents patients being put on the correct course of treatment or audited effectively. In the example below, patients have only ever had the top level code C10.. Diabetes Mellitus added to their record. Diabetes_Analysis_V1.0 Page 35 of th July 2014

36 Diabetes care pre-set filters In addition to creating custom filters, there are five pre-set (or pre-loaded) filters provided within this audit tool. Accessed via PRIMIS CHART, Load Filter when viewing the datasheet. Load a filter as desired and then review the columns containing data items to determine the value of reviewing the patients records in more detail. This will also assist with prioritising patients for review. Suggested action for practices Identify patients with eye, cerebrovascular or kidney (ECK) damage with a blood pressure above target. Repeat measurement regularly in accordance with NICE guidelines. Give patients advice on lifestyle measures and check that they are receiving optimal treatment (as described within NICE guidance). Identify patients with a cholesterol level above the NICE target <4 mmol/litre. Review patients who have missed the target. For those that are not taking a lipid modifying therapy, consider commencement of therapy. For patients on statins who have not achieved target, consider alternative therapies (as described within the NICE guidance). Review coding practice for care processes that are not well recorded. Investigate whether the required information is being sent to the practice. Check that each care process is routinely offered during annual reviews. For patients with a high HbA1c (according to their treatment type), check they are receiving optimal treatment as described within NICE guidance. Diabetes_Analysis_V1.0 Page 36 of th July 2014
37 Key questions for GP practices Do we have any patients with diabetes who do not have the diagnosis coded in their electronic record? How accurate is our practice prevalence rate for diabetes? What should our approach be towards the number of patients identified with obesity and at increased risk of developing diabetes? How should we handle the broader group of patients at increased risk of developing diabetes? How can we improve our achievement of the NICE target thresholds for HbA1c, blood pressure and cholesterol? How effective is our approach to helping patients manage their glycaemic control? How effective is our approach to helping patients manage their cardiovascular risk? What is our strategy for reducing the risk of complications associated with the disease? Do we have a procedure in place to review patients whose treatment appears sub-optimal? Are key data items (such as the care processes) being recorded routinely and accurately? Should some of the individual patients identified be added to the practice Admissions Risk register? Recommended follow-up work Establish the proportion of the practice population at risk of developing diabetes. Consider and implement preventative strategies at both individual and population level. Review treatment efficacy with individual patients with known diabetes and consider alternative strategies as appropriate. Upload summative data to the PRIMIS CHART Online data warehouse and compare your practice data to other practices in the locality and nationally. Improve data recording and accuracy of clinical coding. Diabetes_Analysis_V1.0 Page 37 of th July 2014
38 References 1. National Institute for Health and Care Excellence. (December 2013) Consultation on potential new indicators for the 2015/16 Quality and Outcomes Framework. Available: Last accessed: 5 th June %2f440%2f43%2fNICE_QOF_Indicator_Consultation_Document_ pdf 2. Diabetes UK. (March 2014) Diabetes: Facts and Stats. Version 3. Available: Last accessed: 16 th July Diabetes UK. (March 2010) Diabetes in the UK 2010: Key statistics on diabetes. Available: Last accessed: 16 th July Diabetes UK. (May 2014) What is Type 2 diabetes? Available: Diabetes/ Last accessed: 16 th July Diabetes UK. (April 2012) Diabetes in the UK 2012: Key statistics on diabetes. Available: Last accessed: 16 th July NHS England, Medical Directorate. (January 2014) Action for diabetes Available: Last accessed: 16 th July Department of Health. (2001). National service framework for diabetes: standards. Available: 6/National_Service_Framework_for_Diabetes.pdf. Last accessed: 16 th July National Institute for Health and Clinical Excellence. (June 2009) Clinical Guideline 15. Type 1 diabetes: Diagnosis and management of type 1 diabetes in children, young people and adults (update) Available: Last accessed: 16 th July 2014 Diabetes_Analysis_V1.0 Page 38 of th July 2014
39 9. National Institute for Health and Clinical Excellence. (March 2014) Clinical Guideline 87: Type 2 diabetes: the management of type 2 diabetes (update) Available: Last accessed: 16 th July Murray, C.J.L., Richards, M.A., Newton, J.N., et al. (2013) UK health performance: findings of the Global Burden of Disease Study Lancet. Vol. 381(9871), pp Sullivan, R., and Easton, L (August 2012) Reporting on Annual Healthcare Checks for People with Diabetes. V12. Available: %20QOF%20Differences%20Report%20FINAL.pdf Last accessed: 16 th July NHS England (December 2013) CCG Outcomes Indicator Set 2014/15 at a glance. Available: Last accessed: 16 th July Gray, L.J., Taub, N.A., Khunti, K. et al. (2010) The Leicester Risk Assessment score for detecting undiagnosed Type 2 diabetes and impaired glucose regulation for use in a multiethnic UK setting. Diabet Med. Vol. 27(8), pp National Institute for Health and Clinical Excellence, (July 2012) NICE public health guidance 38. Preventing type 2 diabetes: risk identification and interventions for individuals at high risk. Available: Last accessed: 16 th July Diabetes UK. Diabetes Prevalence 2013 (February 2014) Available: Last accessed: 16 th July Iribarren, C., Karter, A.J., Go, A.S. et al (2001) Glycemic control and heart failure among adult patients with diabetes. American Heart Association. Vol. 103, pp National Institute for Health and Clinical Excellence, (May 2009) CG87. Type 2 diabetes: The management of type 2 diabetes. Quick reference guide. Diabetes_Analysis_V1.0 Page 39 of th July 2014
40 Glossary BMI BP CCG CCG OIS CHART CHART Online HbA1c NDA NHS OF NICE PCT QOF Body Mass Index Blood Pressure Clinical Commissioning Group Clinical Commissioning Group Outcomes Indicator Set CCG OIS measures are developed from NHS Outcomes Framework indicators that can be measured at clinical commissioning group level together with additional indicators developed by NICE and the Health and Social Care Information Centre. PRIMIS data analysis tool (MS Excel based) PRIMIS comparative data analysis tool (web based) Haemoglobin A1c. The predominant form of glycated haemoglobin, present in red blood cells, and formed when the normal haemoglobin A reacts nonenzymatically with glucose National Diabetes Audit NHS Outcomes Framework National Institute for Health and Care Excellence Primary Care Trust (now replaced by CCGs) Quality and Outcomes Framework Diabetes_Analysis_V1.0 Page 40 of th July 2014
41 Appendices Columns within the Pseudonymised Datasheet Case finder Reference Fasting gluc >=7 value High glucose Age Glucose >=11 date High glucose date Sex Glucose >=11 value Previous glycosuria diagnosis Registered_Date Possible missing diabetes diagnoses Previous glycosuria diagnosis date Ethnicity Count of factors Increased risk of diabetes Latest BMI date Gestational diabetes Count of factors Latest BMI value Gestational diabetes date Hypertension diagnosis Latest BMI >=35 PCOS Hypertension diagnosis date Non-standard diagnostic recording Non-standard diagnostic recording date PCOS date Prediabetes Family history status Family history status date Diabetes monitoring code Prediabetes date Waist circumference date Diabetes monitoring date Reaven's syndrome Waist circumference value Diabetic medication Reaven's syndrome date Leicester diabetes risk score date Diabetic medication date Insulin resistance Leicester diabetes risk score HbA1c >=48 date Insulin resistance date No of Leicester diabetes risk score items HbA1c >=48 value Fasting gluc >=7 date Impaired glucose tolerance Impaired glucose tolerance date Calculated Leicester diabetes risk score Latest glucose date Diabetes_Analysis_V1.0 Page 41 of th July 2014
42 Latest glucose value Qdiabetes score date Latest BMI>25 ever value Glucose tolerance test Qdiabetes score Diabetic diagnosis date Glucose tolerance test Date High diabetes risk Diabetes resolved date Glycosuria High diabetes risk Date Diabetes excluded date Glycosuria date Triglycerides value date Triglycerides value Latest HDL date Latest HDL value Latest HbA1c date Latest HbA1c value Latest smoking QOF Latest smoking QOF date Current smoker code Current smoker date Latest FH code or 1st degree Latest FH code or 1st degree date IHD IHD Date Latest BP medication Latest BP medication date Cushings syndrome Cushings syndrome date Oral steroids rx Oral steroids rx date Raised HbA1c >42 ever date Raised HbA1c >42 ever value Raised fasting glucose >5.5 ever date Raised fasting glucose >5.5 ever value Latest BMI>25 ever date Diabetes_Analysis_V1.0 Page 42 of th July 2014
43 Diabetes care main audit Reference Age Latest Untyped Diabetes Code Latest Untyped Diabetes Date Albumin creatinine ratio value egfr code Sex Latest Diabetes Type egfr date Registered_Date Ethnicity code egfr value Earliest Diabetes Diagnosis Code Earliest Diabetes Diagnosis Date Latest Diabetes Type 1 Code Latest Diabetes Type 1 Date Latest Diabetes Type 2 Code Latest Diabetes Type 2 Date Latest Probable Type 1 Code Latest Probable Type 1 Date Latest Probable Type 2 Code Latest Probable Type 2 Date Housebound code Housebound date Long stay code Long stay date Carer status code Carer status date Vulnerable elderly date On learning disability register date Poor English code Poor English date Creatinine date Creatinine value Total cholesterol date Total cholesterol value Total cholesterol level HbA1c target value HbA1c target date HbA1c date HbA1c value Latest weight date Latest Other Diabetes Code High risk care Latest weight value Latest Other Diabetes Date Albumin creatinine ratio date Latest BMI date Diabetes_Analysis_V1.0 Page 43 of th July 2014
44 Latest BMI value Foot check status Amputation date Latest BMI level QOF smoking code Diabetic ketoacidosis date Blood pressure date QOF smoking date Erectile dysfunction date Blood pressure systolic Smoking brief intervention date Hypoglycaemia L12M code Blood pressure diastolic Smoking cessation referral code Hypoglycaemia L12M date ECK Smoking cessation referral date Minor hypoglycaemia date BP level Smoking cessation activity code Earliest CKD diagnosis code Foot ulceration code Smoking cessation activity date Earliest CKD diagnosis date Foot ulceration date No foot ulcer code Smoking cessation medication code Smoking cessation medication date Latest CKD stage code Latest CKD stage date No foot ulcer date Smoking status Latest CKD diag or term Amputation left code Count of care processes Earliest IHD diagnosis date Amputation left date Retinal screening date Stroke or TIA date Amputation right code Diabetic neuropathy date Earliest hypertension diagnosis date Amputation right date Diabetic retinopathy date Earliest heart failure diagnosis date Left foot risk code Diabetic nephropathy date Earliest dementia diagnosis date Left foot risk date Visual impairment registration code Right foot risk date Right foot risk code Amputation code Metformin Rx code Diabetes_Analysis_V1.0 Page 44 of th July 2014
45 Metformin Rx date GLP-1 stimulator Rx code Non statin cholesterol lowering Rx date Adverse reaction to metformin code Adverse reaction to metformin date GLP-1 stimulator Rx date Meglitinide Rx code ACEI CI or declined date ARB Rx code Sulphonylurea Rx code Meglitinide Rx date ARB Rx date Sulphonylurea Rx date Insulin Rx code ARB CI or declined Metformin & su Insulin Rx date ARB CI or declined date Adverse reaction to sulphonylurea code Adverse reaction to sulphonylurea date Adverse reaction to insulin code Adverse reaction to insulin date Beta blocker date Hypertension Rx code Glibenclamide Rx code Metformin s-urea & insulin Hypertension Rx date Glibenclamide Rx date Acarbose Rx date Maximum tolerated antidiabetic Rx Adverse reaction to glibenclamide code Adverse reaction to glibenclamide date SGLT-2 Rx date Count of medications Seasonal flu vaccination date Seasonal flu vaccine date Thiazolidinedione Rx date Statin Rx code Seasonal flu vacc declined date Adverse reaction to thiazolidinedione code Adverse reaction to thiazolidinedione date Bladder cancer diagnosis date Statin Rx date Count of co-morbidities ACEI Rx code Flu vac done or declined Pneumococcal vaccination date Pneumococcal vaccine date DPP4 inhibitor Rx code ACEI Rx date Pneumococcal declined date Visual impairment registration date ACEI CI or declined Pneumo vacc or declined SU & dpp4 Non statin cholesterol lowering Rx Depression diagnosis code L12M Diabetes_Analysis_V1.0 Page 45 of th July 2014
46 Depression diagnosis date L12M Depression resolved date Depression screening questions code Depression screening questions date Latest depression status Dietary review date Dietary review declined date Structured education review declined date Structured ed review <12mts Diag Erectile dysfunction screening date Erectile dysfunction advice date Latest microalbiminuria date Latest persistent proteinuria date Dementia screening questions code Dementia screening questions date Diabetes selfmanagement plan date Insulin pump date Pregnant in last year code Pregnant in last year date Hysterectomy date Female sterilisation Coil in place code Coil in place date Coil removal date Diabetic care hospital only date Secondary care involved code Secondary care involved date Admission risk register code Admission risk register date Diabetes annual review date Diabetes care plan declined date Diabetes care plan date Diabetes selfmanagement plan code Diabetes_Analysis_V1.0 Page 46 of th July 2014
47 Risk scoring Calculation of the Leicester diabetes risk score is dependent upon certain codes being present within the patient s electronic record. Absence of these codes could either indicate that the patient does not have the specified risk factor or that alternative Read codes could be being used that are inaccurate or too generic. It is pertinent therefore that practices record such clinical data in as much detail as is possible and is relevant. Scores provided within this audit tool should not replace clinical decision making and are only included to help inform that decision. Patients must be reviewed to confirm the accuracy of recorded information before management is decided. Diabetes_Analysis_V1.0 Page 47 of th July 2014

48 Instructions for mail merge function - case finder tool How to create mail merge letters for patient review When you import the named response files into CHART, you will be given the option to create three mail merge files and save them to a location of your choice. These are: 1 High_leicester_diabetes_risk_score.xls this includes all patients with a calculated Leicester Diabetes Risk Score of 25 or above. 2 Increased_risk_diabetes.xls this includes all patients who have a Read code recorded indicating any of the following conditions: Previous Gestational Diabetes Polycystic Ovarian Syndrome Pre-diabetes diagnosis Reaven s syndrome Insulin resistance diagnoses Impaired Glucose tolerance High glucose Previous Glycosuria diagnosis 3 Possible_missing_diagnoses.xls this includes all patients who have a Read code recorded indicating that they have any of the following: a Diabetes diagnosis code excluding C10% codes a Diabetes monitoring code Diabetes medication a HbA1c value >=48 a fasting Glucose value >=7 a random Glucose value >=11 The following message box will appear before you see the CHART Summary sheet: Diabetes_Analysis_V1.0 Page 48 of th July 2014


49 If the No button is clicked, you will see the following message box: If the Yes button is clicked, you will see the following message box. Please browse to choose a location to save the files. In the C:\CHART\DIABETES\ folder, there are three corresponding letter templates which can be used to create mail merge letters for the three groups of patients. Please note that the three groups are not mutually exclusive, so a patient may appear in more than one spreadsheet. To create a mail merge letter (steps 1 and 2 are the same for Word 2003/2007/2010, then follow the remaining steps under the heading Word 2003 or Word 2007/2010. Diabetes_Analysis_V1.0 Page 49 of th July 2014

50 1. Open the first letter e.g. High_Leicester_Diabetes_risk_score.docx. 2. Edit the letter, adding the practice address, amending the body of the letter with your own invitation details and sign off. Word 2007/10 3. Choose Mailings from the ribbon, then click on Select Recipients and Use Existing List. Diabetes_Analysis_V1.0 Page 50 of th July 2014


51 4. Browse to the location of the High_Leicester_diabetes_risk_score.xls file, select it and click Open : 5. Click on OK when you see the following message: 6. Choose Finish & Merge and Edit Individual Documents. Diabetes_Analysis_V1.0 Page 51 of th July 2014


52 7. Click OK to merge to a new document. 8. You will then be able to scroll through the letters, print them or browse to a location to save them for printing at a later date. 9. Repeat steps 1-9 for each of the three lists of patients. Diabetes_Analysis_V1.0 Page 52 of th July 2014


53 Word 2003: 3. After opening and editing the letter, choose Letters and Mailings from the Tools menu, then click on the option Show Mail Merge Toolbar. 4. Click on the Open Data Source button on the toolbar. Diabetes_Analysis_V1.0 Page 53 of th July 2014


54 5. Browse to the location of the Increased_risk_diabetes.xls file, select it and click Open. 6. Click Ok when you see the following message box: Diabetes_Analysis_V1.0 Page 54 of th July 2014

 if you wish to keep a copy before loading up a subsequent response file.")
55 7. Go back to Word and click on the View Merged Data button on the toolbar. 8. You will then be able to scroll through the letters, print them or browse to a location to save them for printing at a later date. Please note that CHART will try to create three new mail merge files each time the DCFREP.CSV response file is opened. Please rename the original files (e.g. Increased_risk_diabetes_Mar2014.xls) if you wish to keep a copy before loading up a subsequent response file. A clinician should always review the list of patients provided before any mail merge letters are created and sent out. Diabetes_Analysis_V1.0 Page 55 of th July 2014
Quality Improvement Tool Instruction Guide Diabetes Care
 PRIMIS: Quality Improvement Tool Instruction Guide Quality Improvement Tool Instruction Guide Diabetes Care PRIMIS development of the Diabetes Quality Improvement tool has been funded by Boehringer Ingelheim.
POTENTIAL LINKAGES BETWEEN THE QUALITY AND OUTCOMES FRAMEWORK (QOF) AND THE NHS HEALTH CHECK
 AND THE NHS HEALTH CHECK") POTENTIAL LINKAGES BETWEEN THE QUALITY AND OUTCOMES FRAMEWORK (QOF) AND THE NHS HEALTH CHECK Author: CHARLOTTE SIMPSON, SPECIALTY REGISTAR PUBLIC HEALTH (ST3), CHESHIRE EAST COUNCIL/MERSEY DEANERY SUMMARY
POTENTIAL LINKAGES BETWEEN THE QUALITY AND OUTCOMES FRAMEWORK (QOF) AND THE NHS HEALTH CHECK Author: CHARLOTTE SIMPSON, SPECIALTY REGISTAR PUBLIC HEALTH (ST3), CHESHIRE EAST COUNCIL/MERSEY DEANERY SUMMARY
Quality Improvement Tool Instruction Guide GRASP-AF
 Quality Improvement Tool Instruction Guide GRASP-AF The GRASP-AF quality improvement tool has been developed by PRIMIS and delivered in partnership with NHS England. Prepared by PRIMIS September 2017 The
Outcomes of diabetes care in England and Wales. A summary of findings from the National Diabetes Audit : Complications and Mortality reports
 Outcomes of diabetes care in England and Wales A summary of findings from the National Diabetes Audit 2015 16: Complications and Mortality reports About this report This report is for people with diabetes
Diabetes. Ref HSCW 024
 Diabetes Ref HSCW 024 Why is it important? Diabetes is an increasingly common, life-long, progressive but largely preventable health condition affecting children and adults, causing a heavy burden on health
National Diabetes Audit
 National Diabetes Audit 2012-2013 Report 1: Care Processes and Treatment Targets Clinical Commissioning Group (CCG) / Local Health Board (LHB) Report Summary for NHS Bristol CCG (11H) Key findings about
National Diabetes Audit
 National Diabetes Audit 2012-2013 Report 1: Care Processes and Treatment Targets Clinical Commissioning Group (CCG) / Local Health Board (LHB) Report Summary for NHS Wirral CCG (12F) Key findings about
Four Years of NHS Health Checks in Barnsley - Outcomes and Inequalities
 Four Years of NHS Health Checks in Barnsley - Outcomes and Inequalities Summary After four years of NHS Health Checks, Barnsley has access to aggregated data on over 47,000 people. This data was analysed
Map 6: Percentage of people in the National Diabetes Audit (NDA) with Type 1 diabetes receiving all nine key care processes by PCT
 with Type 1 diabetes receiving all nine key care processes by PCT") 78 NHS ATLAS OF VARIATION ENDOCRINE, NUTRITIONAL AND METABOLIC PROBLEMS Map 6: Percentage of people in the National Diabetes Audit (NDA) with Type 1 diabetes receiving all nine key care processes by PCT
78 NHS ATLAS OF VARIATION ENDOCRINE, NUTRITIONAL AND METABOLIC PROBLEMS Map 6: Percentage of people in the National Diabetes Audit (NDA) with Type 1 diabetes receiving all nine key care processes by PCT
National Diabetes Audit
 National Diabetes Audit 2012-2013 Report 1: Care Processes and Treatment Targets Report Summary for Dorset County Hospital (RBD01) Key findings about the outcomes for people with diabetes in Dorset County
Audit support for continuous subcutaneous insulin infusion for the treatment of diabetes mellitus (review of technology appraisal guidance 57)
") Audit support for continuous subcutaneous insulin (review of technology appraisal guidance 57) Issue date: 2008 Audit support Continuous subcutaneous insulin infusion for the treatment of diabetes mellitus
Audit support for continuous subcutaneous insulin (review of technology appraisal guidance 57) Issue date: 2008 Audit support Continuous subcutaneous insulin infusion for the treatment of diabetes mellitus
Quality Improvement Tool Instruction Guide GRASP-COPD
 PRIMIS: Quality Improvement Tool Instructional Guide Quality Improvement Tool Instruction Guide GRASP-COPD The GRASP-COPD quality improvement tool has been developed by PRIMIS and delivered in partnership
Summary of 2011/12 QOF indicator changes, points and thresholds
 Summary of 2011/12 QOF indicator changes, points and thresholds Retirements 2010/11 QOF ID 2010/11 Indicator Wording Points Threshold CHD5 The percentage of patients with coronary heart disease whose notes
NICE Indicator Programme. Consultation on proposed amendments to current QOF indicators
 NICE Indicator Programme Consultation on proposed amendments to current QOF s Consultation dates: 18 July to 1 August 2018 This document outlines proposed amendments to a small number of QOF s in the diabetes
Policy for the Provision of Insulin Pumps for Patients with Diabetes Mellitus
 Policy for the Provision of Insulin Pumps for Patients with Diabetes Mellitus Version No. Changes Made Version of July 2018 V0.5 Changes made to the policy following patient engagement including: - the
CCG data collection for people with severe mental illness receiving a full physical health check and follow-up interventions in primary care
 CCG data collection for people with severe mental illness receiving a full physical health check and follow-up interventions in primary care Technical guidance NHS England INFORMATION READER BOX Directorate
Managing Type 2 Diabetes in Frailty within Primary Care
 Managing Type 2 Diabetes in Frailty within Primary Care Author Medicines Management Pharmacist Version 1.0 Written: May 2017 Next review: May 2018 Approved by IESCCG Workstream Date approved 27/6/17 Contents
QOF Indicator DM013:
 QOF Indicator DM013: The percentage of patients with diabetes, on the register, who have a record of a dietary review by a suitably competent professional in the preceding 12 months Note: the bold signposts
National Diabetes Audit
 National Diabetes Audit Executive Summary Key findings about the quality of care for people with diabetes in England and Wales Report for the audit period 2007-2008 Prepared in partnership with: Executive
National Diabetes Audit, Report 1: Care Processes and Treatment Targets
 National Diabetes Audit, 2016-17 Report 1: Care Processes and Treatment Targets England and Wales 14 th March 2018 Full Report Prepared in collaboration with: The Healthcare Quality Improvement Partnership
National Diabetes Transition Audit, England and Wales
 National Diabetes Transition Audit, 2011-2017 England and Wales Prepared in collaboration with: The Healthcare Quality Improvement Partnership (HQIP). The National Diabetes Audit (NDA) is part of the National
Shaping Diabetes Services in Southern Derbyshire. A vision for Diabetes Services For Southern Derbyshire CCG
 Shaping Diabetes Services in Southern Derbyshire A vision for Diabetes Services For Southern Derbyshire CCG Vanessa Vale Commissioning Manager September 2013 Contents 1. Introduction 3 2. National Guidance
Time Series Analysis for selected clinical indicators from the Quality and Outcomes Framework
 Time Series Analysis for selected clinical indicators from the Quality and Outcomes Framework 21-26 Title Document Type Time Series Analysis for selected clinical indicators from the Quality and Outcomes
National Diabetes Audit, Report 2a: Complications and Mortality (complications of diabetes) England and Wales 13 July 2017
 England and Wales 13 July 2017") National Diabetes Audit, 2015-16 Report 2a: Complications and Mortality (complications of diabetes) 13 July 2017 V0.22 7 March 2017 Prepared in collaboration with: The Healthcare Quality Improvement Partnership
National Diabetes Audit, 2015-16 Report 2a: Complications and Mortality (complications of diabetes) 13 July 2017 V0.22 7 March 2017 Prepared in collaboration with: The Healthcare Quality Improvement Partnership
Estimated number of people with hypertension. Significantly higher than the. Proportion. diagnosed with. hypertension
 Hypertension profile Background Diagnosis and control of hypertension in * This profile compares with data for, authorities in the South East region and the Office for National Statistics (ONS) group of
NATIONAL INSTITUTE FOR HEALTH AND CLINICAL EXCELLENCE SCOPE. Type 2 diabetes: the management of type 2 diabetes (update)
") NATIONAL INSTITUTE FOR HEALTH AND CLINICAL EXCELLENCE 1 Guideline title SCOPE Type 2 diabetes: the management of type 2 diabetes (update) 1.1 Short title Type 2 diabetes (update) 2 Background a) The National
NATIONAL INSTITUTE FOR HEALTH AND CLINICAL EXCELLENCE 1 Guideline title SCOPE Type 2 diabetes: the management of type 2 diabetes (update) 1.1 Short title Type 2 diabetes (update) 2 Background a) The National
Dementia Direct Enhanced Service
 Vision 3 Dementia Direct Enhanced Service England Outcomes Manager Copyright INPS Ltd 2015 The Bread Factory, 1A Broughton Street, Battersea, London, SW8 3QJ T: +44 (0) 207 501700 F:+44 (0) 207 5017100
Diagnostic criteria for diabetes Routine cases and Non-diabetic hyperglycaemia adapted with permission from Royal Devon and Exeter
 Diagnostic criteria for diabetes Routine cases and Non-diabetic hyperglycaemia adapted with permission from Royal Devon and Exeter Diabetes may be diagnosed on any of the following criteria (WHO 2006,
National Diabetes Insulin Pump Audit, England and Wales
 National Diabetes Insulin Pump Audit, 2016-2017 England and Wales V0.22 7 March 2017 Prepared in collaboration with: The Healthcare Quality Improvement Partnership (HQIP). The National Diabetes Audit (NDA)
Costing report: Lipid modification Implementing the NICE guideline on lipid modification (CG181)
") Putting NICE guidance into practice Costing report: Lipid modification Implementing the NICE guideline on lipid modification (CG181) Published: July 2014 This costing report accompanies Lipid modification:
Putting NICE guidance into practice Costing report: Lipid modification Implementing the NICE guideline on lipid modification (CG181) Published: July 2014 This costing report accompanies Lipid modification:
National Diabetes Treatment and Care Programme
 National Diabetes Treatment and Care Programme Introduction to and supporting documentation for VALUE BASED TRANSFORMATION FUNDING SITE SELECTION December 2016 1 Introduction and Contents The Planning
They are updated regularly as new NICE guidance is published. To view the latest version of this NICE Pathway see:
 Gestational diabetes: risk assessment, testing, diagnosis and management bring together everything NICE says on a topic in an interactive flowchart. are interactive and designed to be used online. They
National Diabetes Audit, Report 1: Care Processes and Treatment Targets
 National Diabetes Audit, 2016-17 Report 1: Care Processes and Treatment Targets England and Wales 14 th March 2018 Learning Disability - Supplementary Information Prepared in collaboration with: The Healthcare
JSNA: Diabetes. Introduction. Implications for commissioning
 JSNA: Diabetes Introduction Diabetes mellitus is a collection of conditions with common features, of which raised blood glucose levels are the most apparent. It is a chronic disease which can cause substantial
Hypertension Profile. NHS High Weald Lewes Havens CCG. Background
 NHS High Weald Lewes Havens Background Hypertension Profile Diagnosis and control of in NHS High Weald Lewes Havens * This profile compares NHS High Weald Lewes Havens with data for, a group of similar
Vascular checks a vascular risk assessment and management. Heather White Deputy Branch Head Vascular Programme
 Vascular checks a vascular risk assessment and management Heather White Deputy Branch Head Vascular Programme Three Questions (1) What is the starting point? (2) Where are we now? (3) What happens next?
NATIONAL INSTITUTE FOR HEALTH AND CLINICAL EXCELLENCE
 NATIONAL INSTITUTE FOR HEALTH AND CLINICAL EXCELLENCE QUALITY AND OUTCOMES FRAMEWORK (QOF) INDICATOR DEVELOPMENT PROGRAMME Briefing paper QOF indicator area: Peripheral arterial disease Potential output:
NATIONAL INSTITUTE FOR HEALTH AND CLINICAL EXCELLENCE
 NATIONAL INSTITUTE FOR HEALTH AND CLINICAL EXCELLENCE QUALITY AND OUTCOMES FRAMEWORK (QOF) INDICATOR DEVELOPMENT PROGRAMME Briefing paper QOF indicator area: Diabetes dietary review Potential output: Recommendations
Type 2 Diabetes. Stopping Smoking. Consider referral to smoking cessation. Consider referring for weight management advice.
 Type 2 Diabetes Stopping Smoking Consider referral to smoking cessation BMI > 25 kg m² Set a weight loss target of a 5-10% reduction Consider referring for weight management advice Control BP to
OF THE ENGLAND IN THE BEST AREA FOUR TIMES MORE PEOPLE GET THE CHECKS THEY NEED THAN IN THE WORST
 OF THE ENGLAND 2013 IN THE BEST AREA FOUR TIMES MORE PEOPLE GET THE CHECKS THEY NEED THAN IN THE WORST Foreword 3 Actions needed to tackle diabetes challenge 5 The State of the Nation: Diabetes is still
Case scenarios: Patient Group Directions
 Putting NICE guidance into practice Case scenarios: Patient Group Directions Implementing the NICE guidance on Patient Group Directions (MPG2) Published: March 2014 [updated March 2017] These case scenarios
Integrated Community Diabetes Services (ICDS) GP Referral Guide Version 3 - October 2014
 GP Referral Guide Version 3 - October 2014") Integrated Community Diabetes Services (ICDS) GP Referral Guide Version 3 - October 2014 Introduction The Integrated Community Diabetes Service (ICDS) will deliver high quality care to individuals who
Integrated Community Diabetes Services (ICDS) GP Referral Guide Version 3 - October 2014 Introduction The Integrated Community Diabetes Service (ICDS) will deliver high quality care to individuals who
A Suite of Enhanced Services for. Prudent Structured Care for Adults with Type 2 Diabetes
 An Enhanced Service for Prudent Structured Care for Adults with Type 2 Diabetes Page 1 A Suite of Enhanced Services for Prudent Structured Care for Adults with Type 2 Diabetes 1. Introduction All practices
Guideline scope Hypertension in adults (update)
") NATIONAL INSTITUTE FOR HEALTH AND CARE EXCELLENCE Guideline scope Hypertension in adults (update) This guideline will update the NICE guideline on hypertension in adults (CG127). The guideline will be
NATIONAL INSTITUTE FOR HEALTH AND CARE EXCELLENCE Guideline scope Hypertension in adults (update) This guideline will update the NICE guideline on hypertension in adults (CG127). The guideline will be
NATIONAL INSTITUTE FOR HEALTH AND CLINICAL EXCELLENCE
 NATIONAL INSTITUTE FOR HEALTH AND CLINICAL EXCELLENCE QUALITY AND OUTCOMES FRAMEWORK (QOF) INDICATOR DEVELOPMENT PROGRAMME Briefing paper QOF indicator area: Primary prevention of CVD Potential output:
NHS GG&C Introduction of Freestyle Libre flash glucose monitoring system
 NHS GG&C Introduction of Freestyle Libre flash glucose monitoring system The Freestyle Libre flash glucose monitoring system is a sensor based, factory-calibrated system that measures interstitial fluid
Standard Operating Procedure 11. Completion of DAFNE Data Collection: Full Post Course Form F04.010, Version 8
 Standard Operating Procedure 11 Completion of DAFNE Data Collection: Full Post Course Form F04.010, Version 8 Date Version Issue Review Contact Approved Date Date Person October 2013 9 October 2013 March
2. Quality and Outcomes Framework: new NICE recommendations
 Proposed Changes to the GMS Contract 2013/14 1. GP pay and expenses uplift It is proposed GP pay and expenses is uplifted by 1.5%. This increased investment will allow for an average pay increase of up
New indicators to be added to the NICE menu for the QOF and amendments to existing indicators
 New indicators to be added to the for the QOF and amendments to existing indicators 1 st September 2015 Version 1.1 This document was originally published on 3 rd August 2015, it has since been updated.
Local Improvement Scheme (LIS) 2016/17 Local Service for Dementia Care in East Lancashire GP Practices
 2016/17 Local Service for Dementia Care in East Lancashire GP Practices") Local Improvement Scheme (LIS) 2016/17 Local Service for Dementia Care in East Lancashire GP Practices CONTENT Page number 1. Introduction 2 2. 5 key elements of the Dementia LIS 3 Practice Awareness Practice
Local Improvement Scheme (LIS) 2016/17 Local Service for Dementia Care in East Lancashire GP Practices CONTENT Page number 1. Introduction 2 2. 5 key elements of the Dementia LIS 3 Practice Awareness Practice
Commissioning Statement. Flash Glucose Monitoring system (FreeStyle Libre ) March 2018
 March 2018") Technology Commissioning Statement Flash Glucose Monitoring system (FreeStyle Libre ) March 2018 FreeStyle Libre (Abbott) Flash Glucose Monitoring System for use in adults, young people and children. Recommendation
Technology Commissioning Statement Flash Glucose Monitoring system (FreeStyle Libre ) March 2018 FreeStyle Libre (Abbott) Flash Glucose Monitoring System for use in adults, young people and children. Recommendation
SUMMARY OF CHANGES TO QOF 2017/18 - ENGLAND CLINICAL
 SUMMARY OF CHANGES TO QOF 2017/18 - ENGLAND KEY No change Retired/replaced Wording and/or timeframe change Point or threshold change Indicator ID change 1/17 QOF ID 17/18 QOF ID NICE ID Indicator wording
THE SHEFFIELD AREA PRESCRIBING GROUP. Position Statement for Prescribing of Freestyle Libre In Type 1 Diabetes. Date: March 2018.
 THE SHEFFIELD AREA PRESCRIBING GROUP Position Statement for Prescribing of Freestyle Libre In Type 1 Diabetes Date: March 2018 Overview Freestyle Libre is a flash glucose sensor device that measures *interstitial
National Chronic Kidney Disease Audit
 National Chronic Kidney Disease Audit // National Report: Part 2 December 2017 Commissioned by: Delivered by: // Foreword by Fiona Loud And if, as part of good, patient-centred care, a record of your condition(s),
17/18 Threshold 18/19 Points 18/19. Points NO CHANGE NO CHANGE NO CHANGE
 SUMMARY OF CHANGES TO QOF 2018/19 - ENGLAND 18-19 QOF005 KEY No change Retired/replaced Wording and/or timeframe change Point or threshold change Indicator ID change 17/18 QOF ID 18/19 QOF ID NICE ID Indicator
STATE OF THE NATION 2012
 STATE OF THE NATION 2012 ENGLAND Contents Foreword 3 Retinal screening 16 Inpatient care 25 Executive summary 4 Foot checks 17 Pregnancy care 26 The rising tide of diabetes the challenge for England 6
Networking for success: A burning platform in Berkshire West
 SERVICE REDESIGN CASE STUDY 1: NOVEMBER 2014 Networking for success: A burning platform in Berkshire West SUMMARY In 2012, four federated CCGs set up a network to redesign diabetes services in Berkshire
Diabetes Prevention Programme and National Diabetes Audit Pilot
 Diabetes Prevention Programme and National Diabetes Audit Pilot Requirement Specification 1 Copyright 2017, Health and Social Care Information Centre Document filename: Annex A- Diabetes Prevention Programme
Proof of Concept: NHS Wales Atlas of Variation for Cardiovascular Disease. Produced on behalf of NHS Wales and Welsh Government
 Proof of Concept: NHS Wales Atlas of Variation for Cardiovascular Disease Produced on behalf of NHS Wales and Welsh Government April 2018 Table of Contents Introduction... 3 Variation in health services...
NHS England Impact Analysis of implementing NHS Diabetes Prevention Programme, 2016 to 2021
 NHS England Impact Analysis of implementing NHS Diabetes Prevention Programme, 2016 to 2021 1. Purpose The purpose of this document is to describe both the estimated resource implications to NHS England
Placename CCG. Policies for the Commissioning of Healthcare
 Placename CCG Policies for the Commissioning of Healthcare Policy for the Provision of Continuous Glucose Monitoring and Flash Glucose Monitoring to patients with Diabetes Mellitus. This document is part
NATIONAL INSTITUTE FOR HEALTH AND CARE EXCELLENCE QUALITY AND OUTCOMES FRAMEWORK (QOF) INDICATOR DEVELOPMENT PROGRAMME. Indicator Assessment Report
 INDICATOR DEVELOPMENT PROGRAMME. Indicator Assessment Report") NATIONAL INSTITUTE FOR HEALTH AND CARE EXCELLENCE QUALITY AND OUTCOMES FRAMEWORK (QOF) INDICATOR DEVELOPMENT PROGRAMME Output: Advice for NHS England Assessment Report Date of QOF Advisory Committee meeting:
NATIONAL INSTITUTE FOR HEALTH AND CARE EXCELLENCE QUALITY AND OUTCOMES FRAMEWORK (QOF) INDICATOR DEVELOPMENT PROGRAMME Output: Advice for NHS England Assessment Report Date of QOF Advisory Committee meeting:
Commissioning Statement
 Commissioning Statement Treatment/ device For the treatment of Commissioning position Flash Glucose Monitoring Systems (including Freestyle Libre ) Monitoring glucose levels in adults and children over
Indicator Points Payment stages. HF 1: The practice can produce a register of patients with 4 heart failure
 Heart failure Indicator Points Payment stages Records HF 1: The practice can produce a register of patients with 4 heart failure Initial diagnosis HF 2: The percentage of patients with a diagnosis of heart
GP Insight Report. The Family Practice CQC ID:
 GP Insight Report The Family Practice CQC ID: 1-562698152 1 CQC GP Insight Report February 2017 spacer Practice background > Introduction INTRODUCTION CONTEXTUAL INFORMATION This report details the CQC
GOVERNING BOARD. Assisted Conception (IVF): Review of access criteria. Date of Meeting 21 January 2015 Agenda Item No 13. Title
: Review of access criteria. Date of Meeting 21 January 2015 Agenda Item No 13. Title") GOVERNING BOARD Date of Meeting 21 January 2015 Agenda Item No 13 Title Assisted Conception (IVF): Review of access criteria Purpose of Paper The SHIP (Southampton, Hampshire, Isle of Wight and Portsmouth)
GOVERNING BOARD Date of Meeting 21 January 2015 Agenda Item No 13 Title Assisted Conception (IVF): Review of access criteria Purpose of Paper The SHIP (Southampton, Hampshire, Isle of Wight and Portsmouth)
14/15 Threshold 15/16 Points 15/16. Points. Retired Replaced by NM82/AF007. Replacement NO CHANGE
 SUMMARY OF CHANGES TO QOF 2015/1 - ENGLAND KEY No change Retired/replaced Wording and/or change Point or threshold change Indicator ID change 14/15 QOF ID 15/1 QOF ID NICE ID Indicator wording Changes
National Paediatric Diabetes Audit
 National Paediatric Diabetes Audit Parent and Carers Report 2015-16 Commissioned by the Healthcare Quality Improvement Partnership Managed by the Royal College of Paediatrics and Child Health National
Diabetes in England NHS Medical Directorate. Dr Rowan Hillson MBE National Clinical Director for Diabetes
 Diabetes in England 2010 Dr Rowan Hillson MBE National Clinical Director for Diabetes I strongly believe that Everyone with diabetes deserves the highest standards of personalised diabetes care, no matter
Placename CCG. Policies for the Commissioning of Healthcare
 Placename CCG Policies for the Commissioning of Healthcare Policy for the funding of insulin pumps and continuous glucose monitoring devices for patients with diabetes 1 Introduction 1.1 This document
Diabetes is a lifelong, chronic. Survey on the quality of diabetes care in prison settings across the UK. Keith Booles
 Survey on the quality of diabetes care in prison settings across the UK Article points 1. The Royal College of Nursing Diabetes Forum conducted an audit of prisons within the UK to determine the level
Medtech Training Guide
 Medtech Training Guide Clinical Audit Tool Copyright Medtech Limited Page 1 of 80 Clinical Audit Tool v4.0 Contents Chapter 1: Getting Started... 3 Logging In... 3 Logging Out... 3 Setting the Preliminary
SERVICE SPECIFICATION 6 Conservative Management & End of Life Care
 SERVICE SPECIFICATION 6 Conservative Management & End of Life Care Table of Contents Page 1 Key Messages 2 2 Introduction & Background 2 3 Relevant Guidelines & Standards 2 4 Scope of Service 3 5 Interdependencies
Volume 2; Number 14 September 2008 NICE CLINICAL GUIDELINE 66: TYPE 2 DIABETES THE MANAGEMENT OF TYPE 2 DIABETES (MAY 2008)
") Volume 2; Number 14 September 2008 NICE CLINICAL GUIDELINE 66: TYPE 2 DIABETES THE MANAGEMENT OF TYPE 2 DIABETES (MAY 2008) The purpose of this special edition of the PACE Bulletin is to summarize the
Volume 2; Number 14 September 2008 NICE CLINICAL GUIDELINE 66: TYPE 2 DIABETES THE MANAGEMENT OF TYPE 2 DIABETES (MAY 2008) The purpose of this special edition of the PACE Bulletin is to summarize the
NHS Leeds CCG. Policy for the Funding of Flash Glucose Monitoring (FlashGM) in Paediatrics and Adults
 in Paediatrics and Adults") NHS Leeds CCG Policy for the Funding of Flash Glucose Monitoring (FlashGM) in Paediatrics and Adults Produced by: Jo Alldred, Medicines Effectiveness Lead, NHS Leeds CCG Dr Bryan Power, Long Term Conditions
NHS Leeds CCG Policy for the Funding of Flash Glucose Monitoring (FlashGM) in Paediatrics and Adults Produced by: Jo Alldred, Medicines Effectiveness Lead, NHS Leeds CCG Dr Bryan Power, Long Term Conditions
ESSENTIAL SHARED CARE AGREEMENT FOR Risperidone, Olanzapine, Quetiapine, Aripiprazole, Amisulpride (South Staffordshire Only)
") E099 ESSENTIAL SHARED CARE AGREEMENT FOR Risperidone, Olanzapine, Quetiapine, Aripiprazole, Amisulpride (South Staffordshire Only) NOTE: Please complete details on P1 &3 Send one copy to GP, Patient and
E099 ESSENTIAL SHARED CARE AGREEMENT FOR Risperidone, Olanzapine, Quetiapine, Aripiprazole, Amisulpride (South Staffordshire Only) NOTE: Please complete details on P1 &3 Send one copy to GP, Patient and
Delivery of An Evolving Well Established Community Diabetes Service in South Sefton
 Delivery of An Evolving Well Established Community Diabetes Service in South Sefton Dr Nigel Taylor Clinical Lead for Diabetes South Sefton CCG Margaret Daley Lead Diabetes Specialist Nurse South Sefton
SystmOne Technical Guidance
 SystmOne Technical Guidance Updated February 2018 1 Dementia 18-19 Technical Solution SystmOne Implementation Guide Summary A resource to provide system support to clinicians and CCGs to: Data cleansing
GOVERNING BODY REPORT
 GOVERNING BODY REPORT DATE OF MEETING: 20th September 2012 TITLE OF REPORT: KEY MESSAGES: NHS West Cheshire Clinical Commissioning Group has identified heart disease as one of its six strategic clinical
Guidelines to assist General Practitioners in the Management of Type 2 Diabetes. April 2010
 Guidelines to assist General Practitioners in the Management of Type 2 Diabetes April 2010 Foreword The guidelines were devised by the Diabetes Day Centre in Beaumont Hospital in consultation with a number
Summary of 2012/13 QOF Changes
 Summary of QOF Changes Retirements 2011/12 CHD13 AF4 QP1 QP2 QP3 QP4 QP5 2011/12 Indicator Wording Threshold For patients with newly diagnosed angina (diagnosed after 1 April 2011), the percentage who
Optimising Hypertension Management Clair Huckerby Pharmaceutical Adviser- Medicines Optimisation Lead
 Optimising Hypertension Management Clair Huckerby Pharmaceutical Adviser- Medicines Optimisation Lead Pharmaceutical Public Health Team The Office of Public Health and Dudley CCG Dudley - doing things
Survey Scottish Diabetes. Survey Monitoring Group
 Scottish Diabetes Survey 2009 Scottish Diabetes Survey Monitoring Group 2 Foreword The Scottish Diabetes Survey is now in its ninth year. This 2009 Survey, as with previous versions, continues to demonstrate
User Guide for Classification of Diabetes: A search tool for identifying miscoded, misclassified or misdiagnosed patients
 User Guide for Classification of Diabetes: A search tool for identifying miscoded, misclassified or misdiagnosed patients For use with isoft Premiere Synergy Produced by André Ring 1 Table of Contents
Number of people with diabetes
 Written evidence from Diabetes UK DIABETES: THE BIGGEST HEALTH CHALLENGE OF OUR TIME A SYSTEM IN CRISIS 1. The Rising Tide of Diabetes and the Challenge for the NHS 2.1 Diabetes has become one of the biggest
BlueBayCT - Warfarin User Guide
 BlueBayCT - Warfarin User Guide December 2012 Help Desk 0845 5211241 Contents Getting Started... 1 Before you start... 1 About this guide... 1 Conventions... 1 Notes... 1 Warfarin Management... 2 New INR/Warfarin
Hypertension Clinical case scenarios for primary care
 Hypertension Clinical case scenarios for primary care Implementing NICE guidance August 2011 NICE clinical guideline 127 What this presentation covers Five clinical case scenarios, including: presentation
EFFECTIVE SHARE CARE AGREEMENT. FOR THE off license use of GLP1 mimetics in combination with insulin IN DUDLEY
 Specialist details Patient identifier Name Tel: EFFECTIVE SHARE CARE AGREEMENT FOR THE off license use of GLP1 mimetics in combination with insulin IN DUDLEY The aim of Effective Shared Care Guidelines
Directed Enhanced Service (DES) for H1N1 Vaccination Programme JCVI priority groups
 for H1N1 Vaccination Programme JCVI priority groups") Directed Enhanced Service (DES) for H1N1 Vaccination Programme JCVI priority groups October 2009 Introduction NHS Employers and the General Practitioners Committee (GPC) of the BMA have agreed arrangements
Directed Enhanced Service (DES) for H1N1 Vaccination Programme JCVI priority groups October 2009 Introduction NHS Employers and the General Practitioners Committee (GPC) of the BMA have agreed arrangements
National Diabetes Inpatient Audit (NaDIA) 2016
 2016") National Diabetes Inpatient Audit (NaDIA) 2016 DIABETES A summary report for people with diabetes and anyone interested in the quality of care for people with diabetes when they stay in hospital. Based
National Diabetes Inpatient Audit (NaDIA) 2016 DIABETES A summary report for people with diabetes and anyone interested in the quality of care for people with diabetes when they stay in hospital. Based
Sandwell & West Birmingham integrated community care diabetes model (DICE) the future of diabetes services?
 the future of diabetes services?") Sandwell & West Birmingham integrated community care diabetes model (DICE) the future of diabetes services? Dr PARIJAT DE DUK Clinical Champion Clinical Lead for Diabetes & Endocrinology, Sandwell & West
Sandwell & West Birmingham integrated community care diabetes model (DICE) the future of diabetes services? Dr PARIJAT DE DUK Clinical Champion Clinical Lead for Diabetes & Endocrinology, Sandwell & West
OCCG SERVICE SPECIFICATION (2018/19) Improving Physical Health in Patients with a Severe Mental Illness
 Improving Physical Health in Patients with a Severe Mental Illness") OCCG SERVICE SPECIFICATION (2018/19) Improving Physical Health in Patients with a Severe Mental Illness People living with severe mental illness (SMI) face one of the greatest health inequality gaps in
OCCG SERVICE SPECIFICATION (2018/19) Improving Physical Health in Patients with a Severe Mental Illness People living with severe mental illness (SMI) face one of the greatest health inequality gaps in
Policy for Continuous Glucose Monitoring for Type 1 Diabetic Paediatric Patients (<18 years of age)
") Policy for Continuous Glucose Monitoring for Type 1 Diabetic Paediatric Patients (
Policy for Continuous Glucose Monitoring for Type 1 Diabetic Paediatric Patients (
NATIONAL INSTITUTE FOR HEALTH AND CLINICAL EXCELLENCE
 NATIONAL INSTITUTE FOR HEALTH AND CLINICAL EXCELLENCE QUALITY AND OUTCOMES FRAMEWORK (QOF) INDICATOR DEVELOPMENT PROGRAMME QOF indicator area: Diabetes Briefing paper Potential output: Recommendations
Together for Health A Diabetes Delivery Plan
 Welsh Government Together for Health A Diabetes Delivery Plan A Delivery Plan up to 2016 for NHS Wales and its partners Digital ISBN 978 1 4734 0291 1 Crown copyright 2013 WG19785 CONTENTS Foreword by
02/GMS/0030 ADULT EPILEPSY SERVICE CCP for General Medical and Surgical POOLE HOSPITAL NHS FOUNDATION TRUST
 Service Specification No. Service Commissioner Leads 02/GMS/0030 ADULT EPILEPSY SERVICE CCP for General Medical and Surgical Provider Lead POOLE HOSPITAL NHS FOUNDATION TRUST Period 1 April 2013 to 31
Monitoring in Type 2 Diabetes. Learning Outcomes. Type 2 Diabetes. Senga Hunter Community Diabetes Specialist Nurse
 Monitoring in Type 2 Diabetes Senga Hunter Community Diabetes Specialist Nurse Learning Outcomes Understand why blood monitoring is necessary Understand the blood tests for monitoring diabetes Understand
National Institute for Health and Care Excellence. Type 2 diabetes. Stakeholder Comments Draft Guideline
 National Institute for Health and Care Excellence Type 2 diabetes Stakeholder Comments Draft Guideline NOTE: NICE is unable to accept comments from non-registered organisations or individuals. If you wish