Nicholas Robert Heebner. B.S. Kinesiology, The Pennsylvania State University, M.S. Sports Medicine, University of Pittsburgh, 2012
|
|
|
- Patrick Hart
- 5 years ago
- Views:
Transcription
1 THE EFFECT OF JUMP DISTANCE ON BIOMECHANICAL RISK FACTORS FOR ACL INJURY DURING LANDING AND THEIR RELATIONSHIP WITH SENSORIMOTOR CHARACTERISTICS AT THE KNEE by Nicholas Robert Heebner B.S. Kinesiology, The Pennsylvania State University, 2009 M.S. Sports Medicine, University of Pittsburgh, 2012 Submitted to the Graduate Faculty of Health and Rehabilitation Science in partial fulfillment of the requirements for the degree of Doctor of Philosophy University of Pittsburgh 2015
2 UNIVERSITY OF PITTSBURGH SCHOOL OF HEALTH AND REHABILITATION SCIENCE This dissertation was presented by Nicholas Robert Heebner It was defended on November 2, 2015 and approved by Scott M. Lephart, PhD, Dean, College of Health Sciences, University of Kentucky John P. Abt, PhD, ATC, Associate Professor, Athletic Training, University of Kentucky Mita Lovalekar, MBBS, PhD, MPH, Assistant Professor, Sports Medicine and Nutrition David Stone, MD, Assistant Professor, School of Medicine Dissertation Advisor/Committee Chair: Timothy C. Sell, PhD, PT, Associate Professor, Sports Medicine and Nutrition ii
3 Copyright by Nicholas Robert Heebner 2015 iii
4 THE EFFECT OF JUMP DISTANCE ON BIOMECHANICAL RISK FACTORS FOR ACL INJURY DURING LANDING AND THEIR RELATIONSHIP WITH SENSORIMOTOR CHARACTERISTICS AT THE KNEE Nicholas R. Heebner, PhD University of Pittsburgh, 2015 There has been an abundance of research investigating risk factors for anterior cruciate ligament (ACL) injury and demonstrating the importance of biomechanical characteristics, particularly in females. However, there have been many different landing tasks used with varying demands. Previous research has demonstrated that different landing tasks significantly alter demand and biomechanical characteristics. However it is unknown how changes in landing demand using the same task may alter landing biomechanics related to ACL injury. Therefore, the purpose of this study was to examine the effects of jump distance during a double-leg stop-jump on biomechanical risk factors of ACL injury and muscle activation and examine the contribution of sensorimotor characteristics on these biomechanical characteristics. Fifty-three recreationally active healthy females were recruited to participate in this study. Each participant underwent a single test session that included demographic and anthropometric assessment, dominant knee threshold to detect passive motion, landing biomechanics and muscle activation measurement, and dominant knee time to peak torque and peak torque testing. Biomechanical and muscle activation parameters relative to ACL injury were compared between jump distances using repeated measures ANOVA. Multiple linear regression was used to assess the relationship between the biomechanical characteristics and sensorimotor characteristics (threshold to detect passive motion, time to peak torque, and peak torque). iv
5 The results of this study demonstrated that increases in jump distance significantly increased landing demand and significantly impacted risk factors for ACL injury and muscle activation strategies. These findings illustrated that studies utilizing tasks with different demands cannot directly compare results or make inference to injury risk based previous findings. This study suggested that a jump distance of 40% to 60% body height is used during a double-leg stop-jump task to assess landing biomechanics related to ACL injury. Additionally, sensorimotor characteristics had significant relationships with knee flexion angle at initial contact, peak knee flexion, and peak knee abduction moment. Further research is needed to identify sensorimotor characteristics that contribute to frontal plane knee motion during landing. v
6 TABLE OF CONTENTS PREFACE... XVI 1.0 INTRODUCTION ANTERIOR CRUCIATE LIGAMENT INJURY Epidemiology of Anterior Cruciate Ligament Injuries Mechanisms for Non-Contact Anterior Cruciate Ligament Injury SENSORIMOTOR SYSTEM Proprioception Neuromuscular Control Sensorimotor System and Non-Contact Anterior Cruciate Ligament Injury EVALUATING RISK OF ANTERIOR CRUCIATE LIGAMENT INJURY Modifiable Characteristics Predictive of Anterior Cruciate Ligament Injury Modifiable Risk Factors for Anterior Cruciate Ligament Injuries CURRENT ANTERIOR CRUCIATE LIGAMENT INJURY PREVENTION EVALUATION OF LANDING BIOMECHANICS FOR ACL INJURY DEFINITION OF THE PROBLEM vi
7 1.7 PURPOSE SPECIFIC AIMS AND HYPOTHESES STUDY SIGNIFICANCE LITERATURE REVIEW EPIDEMIOLOGY OF ACL INJURIES CONSEQUENCES OF ACL INJURY MECHANISMS OF NON-CONTACT ACL INJURIES Mechanisms of ACL Strain Knee Kinematics of Non-Contact ACL Injury Summary SENSORIMOTOR SYSTEM AND NON-CONTACT ACL INJURY Sensorimotor System Defined Joint Stability Proprioception Neuromuscular Control Neuromuscular control in ACL deficient patients Neuromuscular control differences between males and females Neuromuscular control and landing characteristics Summary RISK FACTORS FOR NON-CONTACT ACL INJURY Predictors of Non-Contact ACL Injury Other Potential Risk for Non-Contact ACL Injury Summary vii
8 2.6 INTERVENTION STRATEGIES AND LANDING BIOMECHANICS METHODOLOGICAL CONSIDERATIONS Threshold to Detect Passive Motion Knee Isokinetic Strength Hamstring and Quadriceps Surface Electromyography Two-Leg Stop-Jump Biomechanics METHODOLOGY DEPENDENT AND INDEPENDENT VARIABLES Specific Aim 1: Effect of Jump Distance Specific Aim 2: Effect of Jump Distance on the Relationship Between Sensorimotor System and Biomechanical Risk Factors for ACL Injury SUBJECT RECRUITMENT SUBJECT CHARACTERISTICS Inclusion Criteria Exclusion Criteria Sample Size Calculation INSTRUMENTATION Three-Dimensional Motion Analysis System Force Platform System Surface Electromyography System Isokinetic Dynamometer Vertical Jump Target TESTING PROCEDURES viii
9 3.5.1 Threshold to Detect Passive Motion and Direction Dynamic Warm-up Maximum Vertical Jump Height Biomechanical Assessment of Landing Characteristics Subject Preparation Stop-Jump Task Knee Flexion and Extension Isokinetic Strength and Time to Peak Torque DATA REDUCTION Threshold to Detect Passive Motion and Direction Landing Kinematics, Kinetics, and Muscle Activation Knee Flexion and Extension Strength and Time to Peak Torque STATISTICAL ANALYSIS RESULTS SUBJECTS WITHIN SUBJECT DIFFERENCES IN LANDING BIOMECHANICS AND MUSCLE ACITIVTY BETWEEN JUMP DISTANCES Potential Outliers Normality Test Results Repeated Measures Between Jump Distances RELATIONSHIP BETWEEN SENSORIMOTOR CHARACTERISTICS AND BIOMECHANICAL RISK FACTORS FOR ACL INJURY Univariate Analysis ix
10 4.3.2 Bivariate Analysis Multiple Linear Regression Models Peak Vertical Ground Reaction Force Peak Anterior-Posterior Ground Reaction Force Knee Flexion at Initial Contact Knee Abduction at Initial Contact Peak Knee Flexion Peak Knee Abduction Peak Knee Abduction Moment Peak Proximal Anterior Tibial Shear Force DISCUSSION SUBJECT CHARACTERISTICS LANDING BIOMECHANICS DURING LANDING Peak Vertical and Anterior-Posterior Ground Reaction Forces Knee Flexion at Initial Contact Knee Abduction at Initial Contact Peak Knee Flexion Peak Knee Abduction Peak Knee Abduction Moment Peak Proximal Anterior Tibial Shear Force MUSCLE ACTIVATION DURING LANDING Quadriceps Activation Hamstrings Activation x
11 5.4 SENSORIMOTOR CHARACTERISTICS Threshold To Detect Passive Motion Time to Peak Torque Peak Torque HYPOTHESIS TESTING AND FINDINGS Effect of Jump Distance on Biomechanical Characteristics Related to ACL Injury Hypothesis 1a: As jump distance increases the demand during landing will also increase as expressed by a significant increase in vertical and posterior ground reaction forces Hypothesis 1b: As jump distance and landing demand increase there will also be a significant increase biomechanical characteristics related to ACL injury Hypothesis 1c: As jump distance and landing demand increase there will be significant changes in kinematic and kinetic measures related to knee joint loading Hypothesis 1d: As jump distance and landing demand increase muscle activation of the quadriceps and hamstrings pre-landing and postlanding activity will also increase Relationship between the sensorimotor system characteristics and landing biomechanics xi
12 Hypothesis 2a: Sensorimotor characteristics at the knee will each independently significantly contribute to the variance of biomechanical risk factors for ACL injury Hypothesis 2b: Sensorimotor characteristics at the knee will together significantly contribute to the variance of biomechanical risk factors for ACL injury STUDY LIMITATIONS FUTURE RESEARCH CONCLUSION APPENDIX A APPENDIX B APPENDIX C APPENDIX D APPENDIX E APPENDIX F APPENDIX G APPENDIX H APPENDIX I BIBLIOGRAPHY xii
13 LIST OF TABLES Table 1. Sample Size Calculation Table 2. Subject Demographic Summary Table 3. Dependent Variable Shapiro-Wilk Normality Test Results Table 4. Descriptive Statistics for the Kinematic, Kinetic, and Muscle Activation Variables for each Jump Distances Table 5. Repeated Measures ANOVA Across Jump Distances Table 6. Post-hoc Pairwise Analysis Between Jump Distances Table 7. Normality of Dependent Variables using Shapiro-Wilk Test Table 8. Descriptive Statistics of Sensorimotor Characteristics Table 9. Normality of Sensorimotor Characteristics Table 10. Correlation of Independent Variables Table 11. Peak Vertical Ground Reaction Force Multiple Linear Regression Results Table 12. Peak Anterior-Posterior Ground Reaction Force Multiple Linear Regression Results 96 Table 13. Knee Flexion at Initial Contact Multiple Linear Regression Results Table 14. Peak Knee Flexion Multiple Linear Regression Results Table 15. Peak Knee Abduction Moment Multiple Linear Regression Results Table 16. Peak Knee Abduction Moment (Square Root) Multiple Linear Regression Results. 105 xiii
14 Table 17. Peak Proximal Anterior Tibial Shear Force Multiple Linear Regression Results xiv
15 LIST OF FIGURES Figure 1. Global Coordinate System and Force Plate Orientation Figure 2: Threshold to Detect Passive Motion and Direction Figure 3: Hamstrings (A) and Quadriceps (B) EMG Electrode Placement Figure 4. Lower Extremity Plug-in-Gait Marker Placement Figure 5: Capture Volume Setup Figure 6. Scatter Plots of Biomechanical Variables vs Subject ID by Jump Distance Figure 7. Biomechanical Characteristics Across Jump Distances Figure 8. Muscle Activation Across Jump Distances Figure 9. Histogram of Peak Knee Abduction Moment Square Root Transformation xv
16 PREFACE Thank you to all who have helped me through this dissertation and my educational career, especially my wife and family. xvi
17 1.0 INTRODUCTION Recreational sports and activities are popular and are growing in interest throughout the United States and the world. The United States Department of Health and Human Services and the American College of Sports Medicine have published position statements and guidelines for the public that advocate the participation in physical activity for a healthy lifestyle. 1-4 However, an unfortunate consequence of sport and recreational activity is unintentional musculoskeletal injury. Almost one quarter of all American high school students report at least one injury due to sports participation. Overall, Americans sustain an estimated seven million musculoskeletal injuries attributed to sports and recreational activities annually. 5 These unintentional musculoskeletal injuries can be a significant obstacle for the continuation of an active lifestyle, potentially affecting the physical, mental, and social aspects of a person s life Some sports related musculoskeletal injuries are also associated with the possible development of long-term disability. 7-9 Due to the implications of sport and recreationally related unintentional musculoskeletal injuries, the prevention of such injuries is a serious concern among medical professionals as the number of people who participate in sports and subsequent injuries increase. 12 Knee injuries are a particular concern within sports medicine due to the higher incidence and morbidity associated with them Injury to the anterior cruciate ligament (ACL) is a specific concern in sports because returning to a similar level of function after an injury to this ligament most often requires surgical intervention and a lengthy rehabilitation process. 6 In United 1
18 States high school sports the knee has the highest prevalence (53.9%) of injuries that require surgical treatment 17 and it is not uncommon for other knee pathologies to develop subsequent to the initial trauma, regardless of surgical or conservative treatment. 7 Patients who undergo ACL reconstructive surgery have a very high incidence of future knee joint osteoarthritis. 7,18-21 Some evidence even suggests that over 50% of patients who sustain injury to the ACL will develop knee osteoarthritis regardless of if reconstructive surgery is performed. 7,9 The morbidity associated with these injuries has created a burden on health care 7,8 and has established the need for extensive research to be done with the aim to minimize the risk of sustaining such an injury. In an effort to determine appropriate methods for preventing ACL injuries research has been trying to target specific characteristics that may place athletes at greater risk Although a range of individual characteristics have been shown to be risk factors for this injury, one of the most widely focused on set of characteristics is landing biomechanics. This high interest in landing biomechanics related to ACL injury is most likely due to the ability to modify these characteristics through training The evaluation of an athlete s movement quality, including the ability to land and change direction safely, is not only relevant to what has been observed as an injury mechanism in video footage, 29,30 but also can provide key information regarding the potential risk of sustaining an ACL injury. 23,31,32 Throughout literature there has been different tasks and variations of the same task used to evaluate landing biomechanics. However, these variations and differences impose a different demand on subjects, which may be a cause of some of the discrepancies seen in biomechanical risk factors for ACL injuries. Additionally, training programs targeting landing biomechanics look to challenge specific landing characteristics based on previous research. Previous research has demonstrated differences in kinematics and kinetics between different jump 2
19 directions 33 and tasks but it is unknown how altering the demand of a landing task by jump distance will affect risk factors for ACL injury or if a linear relationship exists between landing demand and these risk factors. In order to target specific landing characteristics related to ACL injury it is necessary to determine appropriate biomechanical task demands to create the desired challenge. Therefore, in order to better standardize and appropriately use landing tasks to evaluate biomechanical characteristics related to ACL injury we must establish the effect of landing demand on such risk factors for injury. By determining how knee loading and the presentation of risk factors change as landing demand increases researchers and clinicians will be provided with evidence for more appropriate landing standardization for specific characteristics of interest. 1.1 ANTERIOR CRUCIATE LIGAMENT INJURY Epidemiology of Anterior Cruciate Ligament Injuries Anterior cruciate ligament injury is still among the most common serious lower extremity injuries suffered in sports today. 13,34 It has been estimated that approximately eighty thousand ACL injuries occur each year in the United States. 35 Data from the National Collegiate Athletic Association s (NCAA) injury surveillance system has reported an average of over three hundred ACL injuries each year in their sample of only 15% of all NCAA athletes. 13 Although American football has some of the highest rates of ACL injuries reported, other sports such as soccer, basketball, gymnastics, volleyball, and handball are more commonly investigated due to a higher amount of non-contact ACL injuries, which are thought to be more preventable. 13,14,34,36,37 Similarly, epidemiological studies investigating the effect of gender have demonstrated increased 3
20 risk of non-contact ACL injuries in females compared to males in comparative sports. 13,14,34,38 Although there has been a proliferation of risk factor and interventional research regarding the prevention of non-contact ACL injuries in female athletes, there has been no documented decline in ACL injury rates in any large scale injury surveillance system, such as the NCAA. Injuries to the ACL are still a major problem and studies are still needed to investigate potential means of increasing the effectiveness of intervention methods Mechanisms for Non-Contact Anterior Cruciate Ligament Injury Video analysis of non-contact ACL injuries suggests that a common mechanism for these injuries is an abrupt deceleration during a landing or change of direction maneuver with a sudden valgus knee collapse (knee abduction). 29,30,39 This valgus collapse mechanism seems to occur during the very early part of stance phase. 39,40 Although valgus knee displacement is not the most direct loading mechanism of the ACL, the combination of anterior tibial displacement and a abduction moment does produce the highest amount of strain in the ACL. 41 Biomechanical studies have also added that low knee flexion angle and increased posterior ground reaction force produce a high knee flexion moment which increases strain at the ACL via increases in quadriceps force Although these mechanical factors may increase strain at the ACL the effects of the sensorimotor system on landing position needs to be examined as the mechanism by which these factors can be changed. 4
21 1.2 SENSORIMOTOR SYSTEM Riemann and Lephart 46 describe the sensorimotor system as the sensory, motor, and central integration and processing components involved in maintaining joint homeostasis during bodily movements. 46 This maintenance of joint homeostasis can be referred to as functional joint stability. 46,47 Joint stability has been defined as the state of a joint remaining in or promptly returning to proper alignment through an equalization of forces and moments. 46 In order for this to occur, the human body must understand, react to, and prepare for it s external and internal environments. The success of this process is dependent on various forms of sensory input from the visual, vestibular, and somatosensory systems. The most important information from an orthopaedic and injury prevention perspective originates from the somatosensory component of the sensorimotor system. Mechanoreceptors within the cutaneous, muscular, joint, and ligamentous structures are responsible for the sensory information responsible for joint position sense and kinesthesia. 46,47 This afferent information arising from the peripheral areas is referred to as proprioception, a subcomponent of the sensorimotor system Proprioception The roles of proprioception in motor control and the maintenance of functional joint stability have previously been described in two distinct categories. 48 The first category of proprioception is with respect to the external environment in the form of perturbations, such as walking on an uneven surface. 48,49 These perturbations or unexpected environmental changes require a modification to the current motor process to maintain postural control and functional joint 5
22 stability. The second category of proprioception is the planning and modification of internally generated motor commands with the goal of coordinating complex mechanical interactions of specific joint motions. 48,49 Proprioception provides critical information in regards to specific joint position and motion required for coordinated joint motion. This afferent feedback is responsible for providing continuous information pertaining to the external and internal environments as needed to apply appropriate neuromuscular control strategies to regain and maintain joint stability Neuromuscular Control Neuromuscular control is a general term that refers to the nervous system s contribution to task performance. 46,47 Within sports medicine literature this term has been specifically used to define the unconscious activation of dynamic restraints occurring in preparation for and in response to joint motion and loading for the purpose of maintaining and restoring joint stability. 46 Recreational and sport activities impose a range of joint perturbations that range from very small to very large. Through proprioception the body can identify joint perturbations, but through neuromuscular control and motor recruitment an equalization of forces and moments can be achieved, thus restoring and maintaining functional joint stability. Adequate neuromuscular control must include proper timing, magnitude, and pattern in order to most efficiently counter both externally and internally produced joint forces and moments. The success of neuromuscular control at maintaining and restoring functional joint stability is dependent on proper feed-forward and feedback strategies. 6
23 1.2.3 Sensorimotor System and Non-Contact Anterior Cruciate Ligament Injury The sensorimotor system (SMS) is responsible for the gathering of afferent information (proprioception), the processing and integration of this information with regard to previous experience, and the application of corrective actions (neuromuscular control) with the goal of maintaining and restoring functional knee joint stability. 49 When an athlete is performing dynamic and higher risk movements the successful execution of these described pathways is critical for injury prevention. Through adequate integration of afferent sensory input and preemptive and reactive motor output successful joint stability can be achieved. 49 However, if there is a problem, error, or inefficiency at any of these steps there is potential for the loss of functional knee joint stability, and thus the potential for injury. Based on non-contact ACL injury mechanisms seen in video analysis, it appears that these athletes are landing with improper landing strategies and may be using inefficient neuromuscular responses to counteract the landing demand. 29,30,40 Previous research has identified relationships between measurable characteristics of the sensorimotor system and landing characteristics important for knee loading. 50 Additionally, it is possible to enhance these systems and potentially lower the risk of sustaining non-contact knee injuries with specific training Therefore, it is imperative to consider the SMS and its implications on functional knee joint stability when investigating risk factors or developing intervention strategies for non-contact ACL injury. 7
24 1.3 EVALUATING RISK OF ANTERIOR CRUCIATE LIGAMENT INJURY The identification of risk factors is important for the development of injury prevention interventions. 54 The most direct loading mechanism of the ACL is the application of an anteriorly directed shear force causing the proximal tibia to displace anteriorly relative to the femur. 41 Although anterior shear is the most direct loading mechanism Markolf et al. 41 also demonstrated that the addition of other forces, including tibial rotation and abduction moment, further increase forces translated to the ACL. 41 Over the years, potential risk factors including biomechanical, neuromuscular, and anatomical factors, have been associated to non-contact ACL injuries. 23,24,29,30,55-57 From an injury prevention perspective, biomechanical and neuromuscular factors are the most useful as these measures have the potential for modification through interventions such as physical training, which may help decrease forces at the ACL Modifiable Characteristics Predictive of Anterior Cruciate Ligament Injury There is an evidential hierarchy to injury risk factors. Characteristics that are able to significantly predict the occurrence of ACL injuries in prospective cohort studies serve as the highest evidence of a potentially causal relationship between internal characteristics and injury. 54 Although there have been studies that have identified multiple characteristics that are predictive of future ACL injury, very few have demonstrated this relationship with modifiable risk factors. 23,62 Landing biomechanics, specifically knee abduction angle and moment, have been able to predict future occurrence of ACL injury. 23 8
25 1.3.2 Modifiable Risk Factors for Anterior Cruciate Ligament Injuries Predictive risk factors are very important for the creation of preventative actions but it is also very important to consider other characteristics that have demonstrated a relationship with ACL injury. Descriptive studies have offered evidence of other relationships with ACL injury. Laboratory studies have demonstrated that certain landing mechanics increase tibial anterior shear forces at the time of peak ground reaction force. 31 This may be due to an increase in that axial load of the tibia and increased quadriceps pull on the proximal anterior tibia Gender comparative studies have found that females tend to land with greater peak knee abduction angle, smaller peak knee flexion angles and at initial contact, and time to peak knee flexion, suggesting that these characteristics may be risk factors for ACL injury. 31,66-69 These characteristics have face validity as risk factor for knee injury as they result in less than optimal knee loading and may be dissipating more force by using static structures rather than musculature surrounding the knee. 31,70-72 Research has also demonstrated that subjects with ACL deficient and reconstructed knees exhibit different landing mechanics such as lower knee flexion moment less abduction motion that likely results in lower anterior tibial shear force Biomechanical evaluation is a valuable resource for assessing risk of ACL injury, however many of these studies have utilized different tasks or have executed the same task in different manors resulting in different demands placed on the knee. 9
26 1.4 CURRENT ANTERIOR CRUCIATE LIGAMENT INJURY PREVENTION To date there have been a number of studies that have investigated the use of a preventative training program aimed at the reduction of lower extremity injury incidence and a few of these have been aimed specifically toward preventing ACL injuries. 61,76-81 Within this literature there have been mixed results regarding the effectiveness of these training programs on decreasing ACL injury rates among athletes. Anterior cruciate ligament prevention programs have utilized various training techniques including plyometric, balance, strength, and agility training. 23,78,80,82-84 Intervention training programs were completed either in pre-season or during season with a wide range of training session duration ranging from ten to forty-five minutes. 61,83 The majority of ACL injury intervention studies have been conducted using female adolescent to young adult athletes participating in sports such as soccer, volleyball, basketball, or handball 23,61,77,79,83,85,86 and followup durations have a wide range of three months to three years. 59,76 With such a wide array of interventions it is not surprising also to find a similar wide range of positive and negative results. More recently the literature investigating ACL injury prevention has produced multiple meta-analyses to formally compare and contrast existing research, identifying characteristics associated with successful interventions. 58,60,87,88 Similar to many interventions there seems to be an exposure relationship demonstrated by studies with increased training and thus seem to be more effective at preventing injuries. 87 Regarding to specific training components within the interventions, meta-analyses has shown that plyometric and strength training are very beneficial whereas balance training may not be. 60,88 Additionally, technique coaching for biomechanical feedback has demonstrated positive effects on landing biomechanics related to ACL injury. 27,89 The success of plyometric training and landing coaching suggests that training of the 10
27 sensorimotor system and biomechanical characteristics are important components required for ACL intervention protocols. However, there is little research to support and guide clinicians in choosing jump landing parameters that might target specific risk factors for ACL injury. 1.5 EVALUATION OF LANDING BIOMECHANICS FOR ACL INJURY Anterior cruciate ligament injury prevention literature has demonstrated the usefulness and wide range of findings related to landing biomechanical characteristics. The three most commonly used tasks that are selected to evaluate landing biomechanics during a controlled athletic maneuver include drop-landings, 23,26,62,67,90 jump-landings, 27,42,57,66,91,92 cutting maneuvers, 63,93,94 or some combination of these. Each of these tasks is selected to elicit a specific demand to the subject that could be eliciting vertical ground reaction forces, posterior ground reaction forces, or change of direction forces. However, even between studies that have used very similar tasks aimed at eliciting similar demands there are still discrepancies in methodology that may change the actual demand placed on the knee joint during landing. Previous research has demonstrated that by changing a task parameter, such as jump distance, the demand experienced at the knee also changes as demonstrated by increased posterior ground reaction forces and tibial accelerations. 91 Additional research regarding the standardization of biomechanical tasks, such as jump distance, will provide evidence for task standardization leading to better comparisons to be made between research studies and aide in the selection of task parameters to impose more specific demands in future research. 11
28 1.6 DEFINITION OF THE PROBLEM The measurement and evaluation of landing biomechanics is widely used in sports medicine for the purposes of describing mechanisms for injury, establishing risk factors, determining risk for injury, and evaluating interventions and outcomes of injury prevention programs and rehabilitation. The use of biomechanical evaluation of athletic maneuvers can be a critical piece in multiple stages of injury prevention. However, researchers employ a significant number and variety of landing tasks that make between study comparisons difficult and may limit the capability of biomechanical analyses to provide informative data to guide injury prevention and rehabilitation. A well accepted critical piece of performing biomechanical analysis is the standardization of the tasks to ensure similar demand between subjects. Current research has suggested that tasks completed with different demands (i.e. jump distance) do change biomechanical characteristics during landing. 91 How task demand affects specific landing biomechanics related to ACL injury remains unknown. This makes the selection of specific task parameters, such as jump distance, difficult to justify based on evidence. 1.7 PURPOSE There is a need to investigate the relationship between jump distance and biomechanical ACL risk factors to determine specific demands that are more relevant and biomechanically sensitive for specific landing characteristics. To determine the most relevant and biomechanically sensitive task for ACL injury risk factors this dissertation will employ an investigative study with two purposes. The first purpose is to assess the effect of jump distance on biomechanical risk factors 12
29 for ACL injury. The second purpose will be to examine how the relationship between sensorimotor system characteristics and landing biomechanics change throughout increasing jump distance. 1.8 SPECIFIC AIMS AND HYPOTHESES Specific Aim 1: Determine if biomechanical risk factors and characteristics related to ACL injury change as jump distance increases from twenty to eighty percent of the subject s body height. Hypothesis 1a: As jump distance increases the demand during landing will also increase as expressed by a significant increase in vertical and posterior ground reaction forces. Hypothesis 1b: As jump distance and landing demand increase there will also be a significant increase in the expression of ACL risk factors (increase knee abduction angle peak and at initial contact, knee abduction moment, peak vertical and posterior ground reaction forces, and proximal anterior tibial shear force). Hypothesis 1c: As jump distance and landing demand increases there will be significant changes in kinematic and kinetic measures related to knee joint loading (increased knee flexion peak and at initial contact, and proximal anterior tibial shear force). Hypothesis 1d: As jump distance and landing demand increase muscle activation of the quadriceps and hamstrings pre-landing and post-landing activity will also increase. Specific Aim 2: Determine if components of the sensorimotor system (proprioception, time to peak torque, and peak torque) can significantly predict the expression of biomechanical characteristics related to ACL injury and if this relationship changes with jump distance. 13
30 Hypothesis 2a: Threshold to detect passive motion, time to peak torque, and peak torque will each independently contribute to the variance seen in knee flexion and abduction angles at initial contact, peak knee flexion and abduction angles, peak knee flexion moment, peak abduction moment, and peak proximal anterior tibial shear force. Hypothesis 2b: Threshold to detect passive motion, time to peak torque, and peak torque will together significantly contribute to the variance seen in knee flexion and abduction angles at initial contact, peak knee flexion and abduction angles, peak knee flexion moment, peak abduction moment, and peak proximal anterior tibial shear force. 1.9 STUDY SIGNIFICANCE The overall aim of this study is to help determine how using different jump distances to standardize a forward jump and countermovement task, such as the stop-jump, will effect landing biomechanics related to ACL injury. Increasing jump distance during a stop-jump task has previously been shown to increase peak posterior ground reaction force, demonstrating an increase in landing demand. 91 However, current methodology for examining landing biomechanics lacks justification for how landing demand is standardized. Results from this dissertation will determine more relevant and biomechanically sensitive jump distance for specific risk factors for ACL injury. Future research will be able to use these results as evidence based justification for specific jump distance standardization. Clinicians such as athletic trainers or physical therapists will be able to determine appropriate landing demands during rehabilitation to isolate and train specific landing characteristics. 14
31 The second aim of this study is to determine how the relationship between the sensorimotor system and landing characteristics change as jump distance increases. The sensorimotor system and its characteristics are critical components of performance and injury prevention as they are responsible for the detection of joint perturbations and the execution of appropriate motor response. 53,95,96 Results from this aim will determine which components of the sensorimotor system predict specific landing characteristics related to ACL injury and if these relationships hold true as landing demand increases. Clinicians will be able to better determine appropriate training, rehabilitation, and intervention strategies that target specific risk factors related to ACL injury. 15
32 2.0 LITERATURE REVIEW This review of pertinent literature will focus on non-contact ACL epidemiological, basic science, methodological, and intervention research as it applies to biomechanical landing characteristics and the prevention of non-contact ACL injuries. This section will first provide an overview of the incidence and impact of ACL injuries. Next, the mechanisms by which the ACL is injured are introduced and the contributions of the sensorimotor system to the cause and prevention of noncontact ACL injuries will be discussed. The biomechanical risk factors and interventions for noncontact ACL injury will be then reviewed with a focus on landing biomechanics. Lastly, important methodological considerations pertinent to this dissertation will be discussed. 2.1 EPIDEMIOLOGY OF ACL INJURIES Anterior cruciate ligament injury is still one of the most common serious lower extremity injuries suffered in sports today. 34,97 It has been estimated that approximately 80,000 ACL injuries occur each year in the United States. 35 In 1982, the National Collegiate Athletic Association (NCAA) began tracking injury information in intercollegiate sports through the Injury Surveillance System (ISS). Over a period of sixteen academic years ( ), 4,800 cases of confirmed ACL injuries, an average of 313 each year, were reported using this system. 97 This study sample is estimated to represent 15% of the total NCAA player population, equating to a possible 2,000 16
33 ACL injuries each year in the fifteen collegiate sports tracked by this system. 97 Additional proof of the magnitude of ACL injury in athletes is demonstrated by ACL injuries accounting for 31% of claims for an insurance agency specializing in youth recreation. 98 Such high injury rates have created a major financial burden estimated at two billion dollars in medical costs annually. 35 Higher injury rates have raised interest in studying certain competitive sports over others. Sports such as soccer, basketball, gymnastics and handball have shown an increase in ACL injury rates compared to other sports, both in the NCAA and internationally. 34,36,97 Anterior cruciate ligament injury rates as high as 2.29 injuries per 1,000 match hours have been reported in Norwegian team handball for a single season. 99 A unique component to the ACL injuries seen in these sports is that the majority of them occur in a non-contact situation, providing possible avenues for prevention through training and modification of established risk factors. 14,36 Just as certain sports demonstrate a high incidence of non-contact ACL injuries, sports like soccer, basketball, and handball have also shown gender differences in injury rates Four of the five sports with the highest incidences of ACL injuries are female sports. 97 Much of the literature has found that females are at a higher risk of non-contact ACL injuries than males. 14,34,38,97 This difference in gender injury rates has likely been a catalyst for an increase in research regarding injury mechanisms, risk factors, and potential injury prevention programs focused on females. Despite a proliferation of ACL injury mechanistic and intervention research, injury rates have not been shown to diminish. According the NCAA ISS, ACL injury rates have held constant over sixteen years of injury surveillance. 97 In fact, from 1988 to 2004 there was an average 1.3% annual increase in ACL injuries. This seems to suggest some discrepancy between current preventative research and the actual application of injury prevention programs. Although this 17
34 epidemiological study by Hootman et al. 97 was published almost a decade ago there is no recent update to these NCAA ACL injury statistics. 2.2 CONSEQUENCES OF ACL INJURY Anterior cruciate ligament injuries are associated with great time-loss and high morbidity both in short-term and long-term consequences The traumatic injury to the ACL results in typical clinical signs and symptoms of traumatic joint disruption include pain and joint effusion, kinesiophobia, loss of mechanical knee joint stability, as defined by increased anterior joint laxity, loss of neuromuscular control and proprioception, and arguably the most significant acute consequences of this injury, loss of function In some cases, reconstruction of the ACL has been shown to immediately restore mechanical knee joint stability 115,116 but disruptions in the sensory motor system still linger as the patient progresses through rehabilitation. 117,118 Reider et al. 117 demonstrated that diminished proprioception in the ACL reconstructed knee lasted up to six months post-operatively. 117 Similarly, Nagai et al. 119 investigated the restoration of rotational proprioception after anatomical double-bundle reconstruction in patients twelve to fifteen months after surgery. Although most proprioceptive characteristics were restored, there were still deficits in ACL reconstructed limb. 119 Injury and reconstruction of the ACL inherently involves a large amount of time loss due to surgical intervention and rehabilitation before returning to play. There is currently no published data on length of recovery and rehabilitation in adolescent or collegiate sports but data from the National Football League show that the rehabilitation process after ACL injury or surgical intervention lasts an average of 10.8 months. 106 However, that same study reported that only 63% 18
35 of athletes undergoing ACL reconstruction and rehabilitation ever return to the field for game play. 106 A similar study of professional soccer athletes showed that only 71% were still able to participate in competitive soccer after a follow-up of four years after surgery. If professional athletes return to sport participation at a rate of 29 37%, it is likely that adolescent athletes have a much less return to sport rate. There is also a psychological impact on athletes experiencing this injury that may contribute to low return to play numbers Smith and Milliner 120 describe in a literature review how it is possible for athletes who are removed from play to experience depression and suicidal tendencies. 120 Although these studies do not directly look at ACL injury there has been a positive correlation established between severity of injury and emotional state of the injured athletes. 122 The longer rehabilitation process associated with this injury would suggest that ACL injuries might be a higher risk injury for athlete depression. Injury to the ACL, despite surgical repair, has been shown to have long-term consequences even after successful return to sport. Multiple studies have demonstrated that regardless of surgical repair there is a very high incidence of early onset osteoarthritis (OA) following ACL injury. 7,18,20,21,123 Lohmander et al. 20 conducted a twelve-year follow up study examining the long-term effects of ACL injury on OA onset in female soccer players. 82% of women had radiographic changes in knee joint space index on weight-baring x-rays and 75% of women reported symptoms affecting their activities of daily living. 20 Additionally, multivariate analysis showed that having reconstructive surgery was not a significant predictor of the development of knee OA. 20 Kessler et al. also performed a cohort study examining the effects of ACL rupture on the development of knee OA and found conflicting results regarding specific effects of reconstruction. They demonstrated that subjects who underwent ACL reconstruction 19
36 had better knee joint stability but developed higher incidence on knee OA (42% vs. 25%) at an eleven year follow up. However, Kessler et al restricted their definition to knee OA with grade two or higher, leading to lower incidence overall. Understanding the short and long-term consequences of ACL injury is important for establishing a need for specific research related to this injury. ACL injury and subsequent reconstruction imposes multiple physical and mental, and short and long-term effects that will negatively impact the lives of individuals who suffer this injury. Advancements in prevention and rehabilitation of ACL injuries will decrease the impact on the health care system and increase the long-term health of athletes. 2.3 MECHANISMS OF NON-CONTACT ACL INJURIES In the epidemiological processes of disease prevention the identification of specific mechanistic factors is a fundamental step that is the basis for effective prevention programs. 124 This same step is also important for the prevention of non-contact ACL injury because researchers and clinician must first understand how the injury takes place before focused strategies of prevention can be developed. Within ACL injury research studies have investigated both the mechanical cause of ACL strain and injury as well as the functional, or athletic, mechanisms for injury Mechanisms of ACL Strain The ACL is one of the primary stabilizing ligaments of the knee. 125 It originates on the medial aspect of the lateral femoral condyle and inserts on the anterior aspect of the tibial plateau. 125 The 20
37 orientation of the ACL places it in an ideal position to resist anterior tibial translation force. A few studies have investigated specific isolated motions of the knee that cause strain to the ACL. 126,127 Anterior tibial displacement relative to the femur, or an anterior tibial translational force, produces the highest and most direct loading of the ACL. 126,127 Although anterior tibial translation is the most direct loading mechanism, injuries to the ACL occur under various conditions and the addition of combined motion may place further strain on the ACL. Additionally, classic in-vitro ACL strain studies only measure strain at one specific knee position. In an effort to overcome these limitations of previous ACL strain research Markolf et al. 41 conducted another cadaveric study describing the biomechanical loading of the ACL under combined stresses throughout knee flexion. Again, isolated anterior tibial force was the most direct loading mechanism of the ACL, however, the greatest recorded force in the ACL was due to the combined loading of anterior tibial force and internal tibial rotation when the knee was near full extension. 41 In knee flexion, the greatest stress in the ACL occurred with the combined loading of anterior tibial force and abduction moment. 41 Research investigating the specific loading patterns of the ACL are important for determining what specifically applied forces produce strain in the ACL and thus increase risk of injury to the ligament. However, during sport participation forces are not applied to the knee in this manner Knee Kinematics of Non-Contact ACL Injury The use of competition injury video footage has allowed researchers to evaluate movement patterns and landing mechanisms that may cause ACL injury. In 2004 the first study was published that used competition video for actual ACL injury to examine potential injury mechanisms. 128 Olsen et al. 128 analyzed twenty different ACL injuries that occurred in Norwegian 21
38 handball players in the season. A standardized reporting from was used for the coach examiners to evaluate each of the injury videos. Questions/categories ranged from type of activity, contact with another player, speed/intensity, push-off leg, and landing-leg. Physician examiners used another reporting from for the evaluation that asked questions regarding foot position, knee position at foot strike, relative time of injury during landing, movement direction, and weight distribution. The results of this study determined that ACL injuries in team handball most often occur during a plant-and-cut or a one-leg landing from a jump shot. 128 The specific injury mechanism during the cut or landing appeared to be a forceful knee abduction collapse from a position in which the knee is in near full extension with the addition of some sort of knee rotation. 128 In a similar manner, Krosshaug et al. 40 examined ACL injury video to continue examining potential injury mechanisms but also to compare male and female injury mechanics. Twentyseven of the thirty-nine cases occurred during a one-legged landing, two-legged, landing, or cutting maneuver (twelve male and fifteen female). 40 When analyzing the landing positions of these cases they found that females landed with higher knee and hip flexion than did male players at initial contact (15 vs. 9 and 27 vs. 19, respectively, p <0.05). 40 Knee abduction angle was not different at initial contact (4 vs. 3, p = 0.071) but women did show more movement into abduction collapse with larger knee abduction angles at thirty-three milliseconds after initial contact (8 vs. 4, p = 0.018). 40 This study also estimated the time point of rupture ranging from twenty-five to forty-six milliseconds after initial contact. 40 Two additional studies compared ACL injury video during competition with video of a matched control performing similar movements but without injury. Boden et al. 29 used a total of twenty-nine ACL injury videos (eighteen women and eleven men) that included twelve videos in 22
39 the sagittal view, six in the coronal-anterior view, and eleven in the coronal, posterior view. Twenty-seven control videos with athletes performing similar tasks and in similar camera angles were analyzed to compare with injury video data. They found no significant difference in knee flexion angle at initial contact or through the next five frames. Hip flexion data did show a significant difference between injured subjects and controls with the former using greater hip flexion during initial contact as well as the five frames after (52.4 vs. 33.4, p < 0.05). 29 However, there was no gender difference in hip or knee flexion during landing. 29 In the coronal view there were no significant differences in knee abduction angle at initial contact between injured and controls or between genders. However, similar to Krosshaug et al., 40 injured subjects moved into increased abduction angles during the frames after initial contact whereas controls remained in a similar abduction position as initial contact. 29 This same research group published a similar study that aimed to compared ACL injury video data between injured females to male injuries and female controls. 30 Similar results were found for knee flexion and abduction angles during landing with the exception of a significant difference in knee abduction angles at initial contact between injured females and injured males but not female controls Summary The identification of specific mechanisms that cause injury to the ACL is a critical piece of the injury prevention process. Researchers must first know and understand the mechanisms by which an injury occurs before considering potential modifiable risk factors that may be predictive of future injury. Video evidence from ACL injuries has determined common landing mechanisms that occur during injury which may be biomechanical risk factors for ACL injury. 29,30,40 The most common landing characteristic in ACL video analysis seemed to be the movement into greater 23
40 knee abduction angle during landing, or valgus knee collapse. It is important to note that the characteristics discovered from injury video analyses are physical mechanisms of ACL injury. Researchers and clinicians must also consider the contributions of the sensorimotor system that may play a role in the use of such biomechanical characteristics. 2.4 SENSORIMOTOR SYSTEM AND NON-CONTACT ACL INJURY Sensorimotor System Defined The maintenance of joint homeostasis is crucial in the execution of successful joint and body motion. A hierarchy of systems is responsible for such successful motion through finely regulated feedforward and feedback control systems. 46 The feedforward control system describes the anticipatory actions that occur in preparation for an expected event. 129 The feedback system is characterized by the constant processing of afferent information and efferent control responses. 46 These two systems are housed within the sensorimotor system, a subcomponent of the more comprehensive motor control system. 46,47 Lephart and Fu 47 describe the sensorimotor system as the sensory, motor, and central integration and processing components involved in maintaining joint stability during body movements Joint Stability Joint stability is defined as the state of a joint remaining in or promptly returning to proper alignment through equalization of forces and moments. 46 It is common to refer to joint stability in 24
41 regards to its subtypes of mechanical joint stability and functional joint stability. Mechanical, also known as clinical, joint stability refers to the integrity of passive joint components (ligaments, joint capsule, cartilage, and/or bony geometry) that act to limit excessive bony movement and excursion. 46 Clinically, this can be easily measured by assessing passive joint laxity using an arthrometer such as the KT When the ACL is ruptured the knee s ability to resist anterior tibial translation is greatly diminished, and therefore results in an increased tibial translation when measured with the KT This loss of mechanical joint stability due to a torn ACL can cause signs of instability including feelings of giving way, thus limiting the functional joint stability. 105,111,125 Use of the Lysholm knee score has demonstrated that individuals who have sustained a ligamentous rupture and have not had reconstructive surgery have diminished knee function scores and report higher symptoms compared to patients who have received reconstructive treatment. 103,105 Functional joint stability is the complementary relationship between mechanical joint stability and the surrounding dynamic components (musculature) through appropriate feedforward and feedback controls. 46 After rehabilitation it is possible for individuals to restore functional joint stability despite not having the ACL reconstructed and mechanical joint stability completely restored. In these cases mechanical joint stability is still impaired but functional joint stability is still achieved through adapted feedforward and feedback neuromuscular strategies. 113, These individuals have been referred to as copers. 134 However, measurement of the dynamic components of functional joint stability is not as straight forward as ligament laxity testing. We are only able to quantify certain dynamic components, proprioception and neuromuscular control. 46,135 25
42 2.4.3 Proprioception Proprioception is the acquisition and processing of sensory information concerning the external and internal environmental condition of the body and can be separated into two categories. 48,49 The first category involves the use of information from the somatosensory system to adjust and modify motor patterns in response to the external environment, an uneven surface for example. 48,49 The second category involves the use of information from the somatosensory system in the planning and modification of internally generated movements through the determination of segmental motion and position. 48,49 The motor control system is under constant review and modification based on proprioceptive information. 49 Proprioceptive information originates from peripheral mechanoreceptors located in both static and dynamic structures surrounding the joint. 136 When an injury such as ACL rupture occurs, the sensory information that was once provided by the intact ligament is no longer provided for the integration of motor control processes and therefore proprioceptive ability of the joint is diminished. 112, Studies have consistently shown that individuals that are ACL deficient have proprioceptive deficits as measured using threshold to detect passive motion and joint position sense. 138, A recent meta-analysis by Relph et al. 139 determined that ACL deficient knees have significant proprioceptive deficits in joint position sense compared to contralateral knees (std. mean difference = 0.52, p < 0.001), control subjects (std. mean difference = 0.35, p = 0.001), and reconstructed knees (std. mean difference = 0.52, p < 0.001). 139 Similar findings were found when comparing ACL deficient knees with control knees when proprioception was measured using threshold to detect passive motion (std. mean difference = 0.38, p = 0.03). 139 Conversely, Fonseca et al. 144 investigated proprioception using threshold to detect passive motion and position sense to determine that individuals who have good 26
43 performance ratings based on the Cincinnati Knee Rating System do not have proprioceptive deficits compared to healthy controls. 144 This may suggest that individuals who are able to restore function despite being ACL deficient may also be able to restore proprioceptive ability. This study also highlights the potential trainability of proprioception. Proprioception is important for the modification and correction of motor control during movement. This system is thought to be a critical piece of injury prevention because proprioception is an integral part of the sensorimotor system and is the first line of defense in corrective actions for motor control. 47,145 Research has established differences in proprioception between trained and untrained individuals. 146,147 To determine if extensive training has an effect on knee joint proprioception Lephart et al. 147 examined the knee joint proprioception of collegiate gymnasts and untrained healthy non-gymnasts using threshold to detect passive motion testing. 147 This study determined that trained gymnasts had increased proprioception compared to nongymnasts. 112 These results highlight the potential trainability of proprioception, which may increase protective mechanisms for sport related injury. This leads to the question of whether diminished proprioception could also be a risk factor for injury. Proprioceptive deficits likely contribute to the occurrence of sports injury and re-injury through a diminished reflex response, thus less ability for appropriate corrective responses in joint position. 53 In an effort to determine the relationship between proprioception, strength, and landing kinematics Nagai et al. 148 used regression analysis to quantify the relationship between an individual s threshold to detect passive motion, knee flexion and extension peak torque, and landing position during a single-leg stop-jump task. 148 This study determined that even when accounting for strength, proprioception was a significant contributor to knee flexion angle at initial contact (r 2 = 0.274, p = 0.001). 148 The researchers acknowledge that a limitation of this 27
44 study was that only men were used and the results may not be generalizable to a female population. To the author s knowledge this is the only study investigating the relationship between proprioception and landing kinematics. Proprioception provides critical sensory information used to optimize motor control and is necessary for the maintenance of functional joint stability. 49,142 However, it is equally important to consider the efferent side of motor control when evaluation the sensorimotor system Neuromuscular Control Neuromuscular control is a general term that refers to the nervous system s control of muscle activation and is the second half of the sensorimotor system. It is highly dependent on proprioceptive information. 46 The activation of musculature can be conscious or reflexive in nature and, although it is difficult to discern the difference during sport maneuvers such as landing, there is likely a combination of conscious and reflexive activation. 46 The measurement of muscle activation, via electromyography (EMG), during landing is a common practice in ACL injury research that allows investigators to describe the motor recruitment patterns and strategies used during different tasks and how they may vary between different population or demands. 31,63,94,131,133, Neuromuscular control in ACL deficient patients Kalund et al. 133 were among the first to use EMG analysis to describe neuromuscular differences between healthy and ACL-deficient (ACL-D) patients. 133 They found that during level walking there was no significant difference in muscle activation onset time between healthy and ACL-D subjects (differences = sec, p 0.05). 133 However, when the demand of the task 28
45 was changed to up hill walking (25 treadmill angle) ACL-D patients utilized significantly shorter hamstring onset times than the healthy controls did (differences = , p<0.005). 133 There was no significant difference in quadriceps onset time during any speed or treadmill incline. 133 These results were in line with previous research that describes the hamstring musculature as an agonist to the ACL in the restriction of proximal anterior tibial displacement Later, Swanik et al. 150 examined the difference in reactive muscle activation between ACL-D, ACL-reconstructed (ACL-R), and healthy control subjects during four different functional tasks. The ACL-D group demonstrated increased hamstring activation during running compared to the ACL-R and control group. 150 Additionally, the ACL-D group showed significantly decreased quadriceps activation during landing when compared to the control group. 150 These group differences were not significant during the hopping and downhill walking tasks, demonstrating the specificity of neuromuscular strategies to each task and demand. 150 No significant neuromuscular difference was observed between the ACL-R and control groups. In a separate publication, 131 the same research group examined the anticipatory activation between the same groups. There were no significant differences in hamstring activation between groups during the 150ms time period prior to initial contact. 131 However, the ACL-D group did show side-toside differences in quadriceps and gastrocnemius activation compared to the ACL-R and control groups. 131 Together these studies show that ACL-D patients use different neuromuscular strategies to achieve joint stability due to the lack of mechanical joint stability that would be supplied by an intact ACL. These strategies also shed light on neuromuscular strategies that may decrease loading of the ACL in those with an intact ACL. Research has also investigated the difference in 29
46 neuromuscular control strategies between genders due to the gender disparity in the incidence rate of ACL injuries Neuromuscular control differences between males and females Significantly different neuromuscular control strategies related to the ACL have been identified between genders. Palmieri-Smith et al 157 found that during a forward jump hop task females are more likely to have lower quadriceps-to-hamstring (Q:H) co-contraction indices as compared to males. 157 This suggests that females use a more quadriceps dominant landing strategy, which may increase loading of the ACL and lead to higher incidence of ACL injuries among females. This study also found that the medial Q:H index accounted for 0.792% of the observed variance in peak knee abduction moment in women, which is a predictive risk factor of non-contact ACL injury. 23,157 Fujii et al. 158 performed a similar study investigating the influence of hamstring muscle activity on tibial internal rotation during landing. 158 They found that increased lateral hamstring activation resulted in less internal tibial rotation, possibly decreasing loading and injury risk to the ACL. 158 This relationship was only significant in females. 158 Sigward and Powers 159 investigated the gender differences in muscle activation in soccer athletes during a cutting task. 75 Although they were not able to find a difference in cutting kinematics, they were able to demonstrate that females utilized higher quadriceps activation than males (191% vs. 151% maximal voluntary isometric contraction (MVIC)). 159 The authors suggested that this use of increased quadriceps activation is part of an at risk pattern for ACL injury. 159 A similar study by Landry et al. 160 also used soccer players to investigate the gender difference in muscle activation during an unanticipated straight-run or cutting maneuver. 160 Again, differences in hamstring activation were found to show decreased hamstring activation in 30
47 females during the cutting and straight run task. 160 This study also found that females used increased lateral gastrocnemius activation during both tasks. 160 Sell et al. 33 also used an unanticipated change of direction maneuver to investigate gender difference in muscle activation during landing. They again found that females used significantly less hamstring activation and co-contraction values compared to males. 33 These differences among genders suggest that males and females may use different neuromuscular strategies during landing in order to maintain joint stability, which may be a potential factor in the greater injury incidence of ACL injuries seen in females Neuromuscular control and landing characteristics Aside from group comparison research, as the previous sections have discussed, another important aspect of neuromuscular control is how it affects landing. Few studies have attempted to define how different neuromuscular control characteristics relate to different landing characteristics. In 2000 Colby et al. 63 sought to describe the kinematic and muscle activity characteristics that are used during four different sport-like maneuvers (sidestep cutting, cross-cut, stopping, and landing). 63 They found that subjects commonly used increased quadriceps activation compared to hamstring and landed with small knee flexion angles at initial contact. 63 The authors suggested that these kinematic and muscle activation characteristics may contribute to higher risk of sustaining and ACL injury and that changing these patterns may lead to a reduction in injury incidence. 63 Later, Sell et al. 33 determined that the direction and whether the task is reactive or not does not significantly affect hamstring or quadriceps activation. 33 In 2009 Shultz et al. 64 performed a research study investigating the contributions of thigh muscle activation on landing biomechanics but found that quadriceps and hamstring activation were not a significant predictor of landing mechanics. 64 They did find that increased quadriceps 31
48 activation was significantly related to peak proximal tibial shear force during landing when controlling for strength and joint excursions. 64 This finding is interesting when considering gender comparison studies that have identified increased quadriceps activation in females as a potential risk factor for non-acl injury Summary Successful joint stability can be achieved through adequate integration of afferent sensory input and preemptive and reactive motor output. 49 However, deficiencies due to injury or inefficiency will lead to loss of functional knee joint stability and thus increase the potential for injury. Based on non-contact ACL injury mechanisms seen in video analysis it appears that these athletes are landing with improper landing strategies and may be using insufficient neuromuscular responses to counteract the landing demand. 29,30,40 Previous research has identified relationships between measurable characteristics of the sensorimotor system and landing mechanics important for knee loading. 33,50,133,148, Additionally, it is possible to enhance these systems and potentially lower the risk of sustaining non-contact knee injuries with specific training Therefore, it is imperative to consider the SMS and its implications on functional knee joint stability when investigating risk factors or developing intervention strategies for non-contact ACL injury. 2.5 RISK FACTORS FOR NON-CONTACT ACL INJURY The identification of risk factors is arguably the most important piece of injury prevention and is crucial in the development of effective intervention strategies. Various physical, biomechanical, 32
49 neuromuscular, and environmental factors need to be analyzed for possible predisposing factors and causal factors of ACL injury. Biomechanical and neuromuscular factors are among the most useful measurable characteristics because they can be modified through training and rehabilitation. 28,52,78,162,163 However, few research studies have been published that assess the ability of biomechanical characteristics to predict the occurrence of future non-contact ACL injury Predictors of Non-Contact ACL Injury Prospective cohort studies are most effective and reliable for determining causal injury risk factors. 164 Prospective studies are generally more reliable than retrospective because there is greater potential for control of data collection, as it does not rely on subject recall or previous record keeping. 165 These studies are used to compare the outcomes of one or more groups exposed to a risk factor to the outcomes of a control group. 166 The major advantages of this design in comparison to other observational designs are the ability to determine incidence of an injury and establish a temporal sequence between risk factor and outcome. 166 The establishment of temporal sequence is necessary to determine a causal relationship because in order for a factor to cause an injury, it must occur prior to the injury event. 54,167 The disadvantages seen with prospective cohort studies are the need for relatively large sample sizes and that the design can be time consuming. 54 Only a few prospective cohort studies have been used to assess the effect of injury risk factors on ACL injury and fewer have investigated modifiable characteristics. 23, Hewett et al. 23 conducted a prospective study examining potential biomechanical risk factors for non-contact ACL injuries in competitive female athletes. 23 Two hundred and five female soccer, basketball, and volleyball players underwent biomechanical evaluation of a drop 33
50 jump task that involved dropping off of a 31 cm box onto two force plates and immediately performing a maximal vertical jump. 23 During a thirteen-month surveillance period, nine ACL injuries were reported and confirmed (seven during soccer, and two during basketball). 23 Subjects who sustained ACL injury demonstrated significant increases in knee abduction angle and moment and increased ground reaction forces compared to the uninjured group. 23 The stance time was 16% shorter in the injured compared to the uninjured group, suggesting that the injured group experienced motion, forces, and moments more quickly. 23 It was also determined that an increase in abduction moment was a good predictor of ACL injury. 23 Myer et al. 170 investigated the relationship of hamstring and quadriceps strength to ACL injury in female athletes using a matched case control study where strength was measured prior to ACL injury as part of a larger prospective study. 170 From 2002 to 2007, one hundred thirty-two competitive female and male soccer and basketball athletes were prospectively screened with quadriceps and hamstring isokinetic strength testing at 300 /s. 170 There were twenty-two subsequently confirmed female ACL injuries (sixteen during soccer and six during basketball). 170 All uninjured players were used as controls (eighty-eight female controls and thirty-two male controls). 170 Comparisons between the injured and control groups revealed a significant deficit in the hamstring strength in the injured group compared to male controls. 170 Quadriceps strength values in the injured group were not significantly different from that in the male or female control groups. 170 Although this study was not a prospective cohort study, these results still suggest that decreased isokinetic hamstring strength may place an athlete at an increased risk of sustaining an ACL injury. 170 The risk for injury may further increase if this characteristic is compounded with other neuromuscular characteristics such as decreased hamstring activation during landing. 34
51 Lastly, in 2010 Paterno et al. 168 published a prospective study investigation potential risk factors for the occurrence of a second ACL injury. 168 They found that a deficit in postural stability was able to significantly predict the occurrence of a second ACL injury with a sensitivity of 0.92 and specificity of Additionally, increased abduction moment impulse, total twodimensional frontal plane knee excursion, and asymmetries in sagittal plane knee moments at initial contact where significant predictors of second ACL injury when controlling for one another. 168 Although this is focusing on characteristics predictive of re-injury it can still be relevant to first time injuries because this study does suggest that there may still be sensorimotor deficits on the injured side that have not resolves as demonstrated with decreased postural stability. However, there were no proprioceptive or neuromuscular measures included in this analysis. Uhorchak et al. 169 conducted a prospective study to investigate risk factors for non-contact ACL injury. Eight hundred and fifty-nine cadets (739 males, 120 females) at the United States Military Academy underwent a physical (anthropometrics, joint laxity, and flexibility), radiographic (condylar width, notch width, tibial width, and eminence width), and strength (quadriceps and hamstrings) assessment prior to a four year observation period. 169 Of the twentyfour non-contact ACL tears (sixteen males, eight females) seen during this study period, multiple factors were demonstrated to be related to a significant increase in risk of ACL injury. 169 Potentially modifiable risk factors found in both sexes included higher than normal body mass index (BMI) and generalized joint laxity. 169 Although generalized joint laxity is not directly modifiable through training, it has been shown that training can increase proprioception, 171 which could possibly compensate for joint laxity via improved dynamic joint stability. 49 The presence of one or both risk factors greatly increased a persons relative risk for ACL injury
52 Overall, evidence from prospective research studies has demonstrated the importance of landing characteristics as risk factors for future non-contact ACL injury. 23,168 Most notably, frontal plane knee motion, as measured by peak or total knee abduction angle, and peak frontal knee loading, as measured by peak knee abduction moment, are common characteristic show to be risk factors among prospective analyses. 23,168 There is also evidence that decreased hamstring strength will also add to a person s risk of sustaining a non-contact ACL injury Other Potential Risk for Non-Contact ACL Injury Predictive risk factors are very important for the creation of preventative actions but it is also very important to consider other characteristics that have demonstrated a relationship with ACL injury. Descriptive studies have offered evidence of relationships between landing characteristics and ACL injury. Laboratory studies have demonstrated that certain landing mechanics are related to increased anterior tibial shear force. 152 Sell et al. 152 performed a study investigating the predictors of proximal anterior tibial shear force (PATSF) during a stop-jump task and was able to define a significant relationship between PATSF and landing characteristics, such as peak posterior GRF, knee flexion moment, knee flexion angle, and vastus-lateralis activation at the time of peak posterior GRF (adjusted R 2 = ). 152 Gender also was a significant predictor when controlling for landing characteristics. 152 The greatest pairwise correlation was between peak PATSF and knee flexion moment at peak posterior GRF (r = ). 152 This negative coefficient is relative to the increasing knee flexion moment being an increasingly negative value due to the defined anatomical coordinate system joint rotations. This may be due to an increase in axial load of the tibia and increased quadriceps pull on the proximal anterior Previous research has determined 36
53 that increased knee and hip motion reduce knee loading during landing, but increased quadriceps activation during landing is predictive of increased PATSF. 42,172 Gender comparative studies have found that females tend to land with greater peak knee abduction angle, smaller peak knee flexion angles, knee flexion at initial contact, and at initial contact, and time to peak knee flexion, suggesting that these characteristics may be risk factors for ACL injury. 31,66-69 In a study by Lephart et al. 173 the authors describe a deficit between male and female landing strategies during landing. 173 Female subjects used significantly less knee and hip flexion displacement and less time to maximum angular displacement during a drop-landing task. 173 Mclean et al. 174 found that these same gender differences with the addition of peak knee abduction angle exist during a sidestep cutting maneuver. 174 In another gender comparison study Sell et al. 33 determined that during a reactive stop-jump task females again use less favorable kinematics during landing, including decreased peak knee flexion and increased peak knee abduction angles. 33 This study also was able to demonstrate that females exhibit increase PATSF and knee flexion moment with increased medial hamstring activation and co-contraction of the quadriceps and hamstrings. 33 The increased co-contraction value is contradictory to findings of previous studies 64,159 but the authors of this study and previous research suggest that this may be a compensatory mechanisms in response to the increased knee joint loading described. 33,175 The landing characteristics discussed thus far in this section have face validity as risk factors for knee injury because they result in less than optimal knee loading and may be dissipating more force by using static structure rather than musculature surrounding the knee. 31,70-72 Norcross et al. 71 investigated landing characteristics in relation to quantified energy absorption during a drop-jump landing. 71 Subjects that utilized landing strategies that produced high initial 37
54 energy absorption (first 100ms) also displayed significantly higher posterior GRF, PATSF, and knee extension moment. 71 In addition to kinematic measures, a study by Sigward et al. 159 determined that females land with significantly less knee flexor moments, greater knee adductor moments, and greater quadriceps activation during a sidestep cut. 159 Also using a sidestep cut task, Mclean et al. 174 found that greater knee abduction moment was associated with increased hip internal rotation and increased knee abduction angle at initial contact and that this relationship was significantly greater in females. 174 Biomechanical evaluation is a valuable resource for assessing risk of ACL injury, however many of these studies have utilized different tasks or have executed the same task in different manners resulting in different demands placed on the knee Summary As demonstrated, there have been many studies investigating landing characteristics that may be related to the risk for non-contact ACL injury. Many of these have shown positive relationships between landing characteristics and potential for injury. However, these studies have also utilized different biomechanical evaluation methods. Would these relationships and findings have been seen if using a different task or different parameter? These differences are most notably seen in the discrepancies between the tasks that are being evaluated. Throughout the literature there seem to be too many types of landings, including static landings and counter-movement landings. Static landings are those where the subject is asked to jump to or drop onto a landing area and remain still once they have landed. Counter-movement landings include some sort jump or change of direction upon landing. This type of landing includes tasks such as stop-jumps, drop-jumps, and cutting maneuvers. It is well accepted that counter-movement tasks are more sport-like but with 38
55 each difference in the task or demand of that task my challenge the subject in a different way that limits the generalizability of findings. Recent findings from the University of Pittsburgh s Warrior Human Performance Research laboratory have demonstrated that different landing tasks elicit different landing characteristics. Even with-in the same type of task, discrepancies may still exist as the task demand changes with other parameters such as jump distance. These discrepancies between tasks are not just seen in risk factors studies. Prevention research has also utilized different biomechanical tasks for the evaluation of potential intervention strategies aimed to reduce the risk of ACL injury , INTERVENTION STRATEGIES AND LANDING BIOMECHANICS The evaluation of landing biomechanics also has been an important measure in the development of training strategies to establish the effectiveness of potential intervention strategies on landing biomechanics. In 1996 Hewett et al. 26 performed a small-scale intervention study (n=11) to examine the effects of a jump-training program on lower extremity landing biomechanics and strength. 26 This study utilized a vertical jump-landing task to simulate a volleyball block and evaluated landing biomechanics relative to sport. 26 They found that subjects were able to increase their jump height by 10% and decrease their landing impact by an average of 0.8 times body weight (p<0.01) and knee abduction/adduction moment by 1.3 to 2.1 %bodyweight times height (P<0.05). 26 Lephart et al. performed a similar study with a higher sample size of twenty-seven to investigate neuromuscular and biomechanical changes due to a plyometric training program versus a basic resistance program. 51 This study also evaluated landing biomechanics using a landing from a maximal vertical jump task. 51 After an eight-week training period the researchers 39
56 found that there was a significant overall decrease in peak knee flexion moment and peak hip flexion moment but no significant group interaction. 51 Plyometric training significantly lowered the reactivity time for the medial hamstrings during landing. 51 Although these two studies utilized similar methodology with a very similar population (high school female athletes with a mean age of approximately fifteen years) some of the landing characteristics were quite different including vertical GRF (4.2 vs. 2.4 times body weight) and knee abduction moment (0.027 vs Nm / bodyweight x height). 26,51 This discrepancy may be due to the simulated volleyball block that was incorporated into the Hewett et al. 26 protocol which may have altered the relative demand of the task, thus leading to a different biomechanical response. 26,51 In two intervention studies by Myer et al. 176,177 researchers used the identical methodology as a previous risk factor analysis. 23 They used a drop-vertical jump (DVJ) tasks that began with the subject dropping off a thirty-one cm platform and immediately performing a maximal vertical jump upon landing. 176,177 Myer et al. 177 reported similar knee abduction moment values for the pre-test measures as Hewett et al. (0.44 vs Nm/kg*m, respectively). 23,177 A different research study used this same task to evaluate another training program but used a twenty-five cm box. 178 Although there was only a six cm difference in the drop heigh and the procedure was otherwise identical Pfile et al. 178 reported a peak abduction moment of 0.12 Nm/kg*m, 4.5 times lower than what was previously reported by Myer et al. 177 Despite the positive effects on landing characteristics, each of these research studies have demonstrated there is a concern for clinicians or other researchers try to develop efficient and effective means of evaluating athletes for these risk factors. Although each study provides important and relevant findings, there are distinct differences in the type of task and the specific demand of these tasks which may affect the landing characteristics of each subject between 40
57 different studies and especially between research groups. Different landing tasks will elicit different biomechanical responses. However, this comparison also suggests that even though the same task execution is used, different demand of the same task may also change the biomechanical response. 2.7 METHODOLOGICAL CONSIDERATIONS Threshold to Detect Passive Motion There are two common methods for assessing proprioception, they are: 1) threshold to detect passive motion and direction and 2) active joint position sense. Both of these techniques have been used in relation to knee injuries, however, TTDPM has been demonstrated to have higher reliability values compared to active joint position sense. 148,179,180 The test for TTDPM also has been described to target slow-adapting mechanoreceptors due to the slow speeds 53,135 utilized. The test is thought to rely less on ligamentous or articular structures being placed in a state of tension when a starting position of 45 of knee flexion is used. 112 This method has also been shown to be related to knee kinematics during a stop-jump task similar to the aims of this dissertation. 148 For these reasons TTDPM will be used to assess proprioception in this dissertation. A previous study by Lephart et al. 147 determined that TTDPM testing with the knee positioned at 45 is able to distinguish between those with exceptional proprioception (gymnasts) and healthy controls. 147 The reason this specific study is relevant is because this dissertation will use healthy individuals and thus will need a measure that is sensitive enough to measure proprioception in a healthy population. 41
58 This methodology enables targeting of the slow adapting mechanoreceptors such as the Ruffini endings and Golgi like organs. 46,53 Because of this, it is important to ensure that the speed the dynamometer will be moving is slow enough to specifically target these receptors. Previous studies using this methodology have used speeds ranging from 0.25 to 0.5 per second. 112,147,148 The reliability of TTDPM at this speed and a starting position of 45 of knee flexion has yielded good to excellent reliability (ICC [3,k] = , SEM = ). 148 This dissertation will use a testing speed of 0.25 degrees per second and a starting position of 45 of knee flexion. Lastly, there are additional systems that contribute to the sensorimotor system, including the visual system, that will also provide information regarding limb motion that is not originating from the targeted joint mechanoreceptors. Additionally, the motion of the proprioception jig will also induce changes in pressure and contact on the skin (cutaneous stimulus) as the system passively moves that joint. The Biodex system also produces a clicking sound as the dynamometer begins its motion that would provide cueing to the initiation of the test. Therefore, during TTDPM testing it is critical to eliminate the input of the visual, cutaneous, or auditory cues that may confound the testing results. 145 To control for this each subject will be blind folded with earplugs and headphones producing white noise to eliminate any visual or auditory cuing to the motion of the dynamometer or knee joint. A pneumatic sleeve will be placed over the lower leg and will be attached to the proprioception jig to minimize the cutaneous feedback from the proprioception device. Each subject will be required to indicate which direction the knee joint was moving upon detection of motion to minimize guessing and to further assess the proprioceptive ability. 42
59 2.7.2 Knee Isokinetic Strength Isokinetic dynamometry is a common method used to assess muscular performance and time to peak torque (TTPT) as components of the sensorimotor motor system. 153,175 Isokinetic strength testing will hold the speed at which the joint is moving at a constant velocity while the subject performs reciprocal maximal effort motions toward knee flexion and extension. Pilot testing at the Neuromuscular Research Laboratory has established that isokinetic hamstring strength testing has very good to excellent intersession reliability for TTPT torque (ICC (1,2) = 0.99; SEM = 7.5msec) during five reciprocal extension and flexion motions at 240 /s. within a set ROM limit of 0 to Deficits in hamstring strength have been shown to be a predictor of future ACL injury in female athletes. 170 Previous studies also have demonstrated differences in hamstring activation between ACL-D and healthy subjects as well as between males and females during landing and change of direction tasks. 33,160 Therefore, this dissertation will investigate the contribution of hamstring strength and force generating capabilities as measured by peak torque production. This dissertation will also assess the contribution of hamstring TTPT as a measure of neuromuscular control. Previous pilot testing was able to determine that the mean knee velocity in the sagittal and frontal plane occur at much faster speeds than the commonly assessed speed of 60 /s. Knee motion occurs at an approximate speed of 240 /s. Additionally, a prospective risk factor analysis by Myer et al. 170 determined that isokinetic strength measures at 300 /s. were predictive of future ACL injury. Therefore, this dissertation will use an isokinetic testing speed of 240 /s. 43
60 2.7.3 Hamstring and Quadriceps Surface Electromyography This dissertation will measure the muscle activation of the quadriceps and hamstrings prior to and during landing to quantify the neuromuscular control patterns at the knee prior to and during landing. Surface EMG (semg) is a commonly used method for assessing neuromuscular control or the efferent side of the sensorimotor system. 46,135 The measures of preactivity and reactivity in the quadriceps and hamstrings represent the feedforward and feedback control systems of the neuromuscular control system. 135 Previous studies from our laboratory have demonstrated that semg measures of the quadriceps and hamstrings are reliable (ICC (2,1) = , SEM = %MVIC). 182 Previous research has demonstrated that the actions of the quadriceps muscle group applies an anterior translational force on the proximal tibia that causes strain in the ACL By measuring the strain in the ACL, Renstrom et al. 154 determined that significant increases in strain occur due to quadriceps force from zero to forty-five degrees of knee flexion. The same study also determined that simulated hamstring force was protective to the ACL by applying a posterior translational force, but this was only significant in knee flexion angles greater than thirty degrees. 154 Because of these described implication to ACL strain, this dissertation will investigate the muscle activation of both the quadriceps and hamstring groups. Additionally, previous research that has identified muscle activation differences between healthy and ACL-D and between genders has specifically investigated the vastus-medialis, vastus-lateralis, and the medial (semimembranosus and semitendinosus) and lateral (biceps femoris) hamstring groups. 33,118,149,160,183 These muscles are superficial which will allow muscle activity to be measured using semg techniques. The center of the semimembranosus and semitendinosus muscles of the medial hamstring group are very close to one another and therefore run the risk of 44
61 cross-talk when measured using semg. For this reason it is suggested to measure them as one group and refer to the data collected as the medial hamstring group. Therefore, this dissertation will also examine the muscle activation of these four specific locations using semg. Signal processing technique is a critical piece of EMG processing. Previous research has suggested that sampling frequencies of at least 1000 Hz is adequate for semg data collection to avoid the risk of aliasing due to a low sampling frequency. 184 However, more recent guidelines from the International Society of Electromyography and Kinesiology (ISEK) state that a minimum sampling frequency of 800 Hz is adequate using a band pass filter of Hz. 185 The ISEK also states higher sampling frequencies are recommended for increased resolution and accuracy. 185 Additionally, a recent study at the Neuromuscular Research Laboratory utilized a semg sampling frequency of 1500 Hz and found medial hamstring preactivity was a significant predictor of total knee abduction displacement. 181 A 1500 Hz sampling frequency will be used in this dissertation. Another component of semg signal processing is normalization of the signal. It is common practice and recommended by the ISEK to normalize the filtered semg signal to the semg signal collected during a maximal voluntary isometric contraction (MVIC). 33,118,153,159,185 This technique converts the units of measure from volts to %MVIC. Not only does this procedure of normalization make the interpretation of the results more intuitive but it also allows for the comparison of results between subjects. This dissertation will normalize all semg signals to the average muscle activation during a five-second MVIC trial. It is also important to consider the temporal parameters and specific calculations by which preactivity and reactivity will be defined, as this will effect the measures interpretation and relation to the sensorimotor system and neuromuscular control. Preactivity is the muscle 45
62 activation present just prior to initial contact and represents the feedforward activation responsible for increased muscle stiffness. 46,135 A 150-millisecond window will be used to measure muscle preactivity as this timeframe is specific to the feedforward activity in preparation for landing. 46,135 A 150-millisecond window will also be used to measure reactivity. This timeframe is specific to the feedback (reflexive) muscle activation due to initial joint loading during landing. 46,135 During these specific timeframes the integrated semg signal (iemg) will be calculated to describe the muscle activation throughout the window. The iemg is reported in a value of %MVIC*Seconds and is a commonly used to describe muscle activation levels with respect to time. 51,150,152,153,186, Two-Leg Stop-Jump Biomechanics Three-dimensional (3D) kinematic measurements using video based marker trajectory is a commonly used method for assessing lower extremity landing kinematics and kinetics throughout sports medicine literature. 33,42,73,148,152,153,177,188 The Plug-in-Gait 189 biomechanical model used in this dissertation is based on the Helen Hayes ridged segment model developed by Kadaba et al. 190,191 Sixteen 0.014m reflective markers are placed bilaterally throughout anatomical landmarks on the lower extremity (anterior superior iliac spine, posterior superior iliac spine lateral thigh, lateral femoral condyle, lateral shank, lateral malleolus, heel, and head of the second metatarsal). Windolf et al. 192 has determined that the Vicon optical tracking system has an accuracy of 63 ± 5μm and overall precision of 15μm. Camera based motion capture with a similar system and biomechanical model has also been shown to be a reliable measure of lower extremity joint angles (ICC(3,1) = to and coefficient of multiple correlation (CMC) = to 0.982) and joint moments angles (ICC(3,1) = to and CMC = to 0.957)
63 Many different tasks have been used to evaluate landing biomechanics related to ACL injury but counter movement tasks are considered to be more sport-like and thus more relevant to athletic populations. Data from the UPitt Warrior Human Performance Research Center has demonstrated that two-leg landing tasks elicit greater knee abduction angles and moments compared to single-leg tasks. In a prospective ACL injury risk factor study, Hewett et al. 23 used a two-leg landing task followed by a maximal vertical jump. 23 This dissertation will measure 3D kinematics and kinetics during a two-leg stop-jump task as the task has been previously used by a number of studies to evaluate landing biomechanics related to ACL injury. 31,42,152,194 In an attempt to standardize the effort and jump height a previous dissertation by Clark 181 used a VERTEC Jump Trainer (Sports Imports, Columbus, OH) to provide a target for the subject to reach for during the counter movement jump after the initial landing. 181 It is important to ensure that each subject is performing the second jump at a comparable effort and this may influence the initial landing. However, this does not control for the height of the initial jump, which likely will influence the initial landing to a greater extent. Therefore, this dissertation will use a 30.5cm hurdle and specific verbal cueing to attempt to control the jump height of the initial jump, as well as a VERTEC to ensure consistent countermovement jump demand. 47
64 3.0 METHODOLOGY This dissertation is a cross-sectional comparative study further evaluating the validity of current biomechanical risk factors for non-contact ACL injury and assessing the relationship between components of the sensorimotor system and biomechanical risk factors for ACL injury. 3.1 DEPENDENT AND INDEPENDENT VARIABLES Specific Aim 1: Effect of Jump Distance The dependent variables used for this specific aim will be biomechanical landing characteristics that have been associated with ACL injury risk (listed below). Peak vertical ground reaction force (% body weight) Peak posterior ground reaction force (% body weight) Peak knee flexion angle (degrees) Knee flexion angle at initial contact (degrees) Peak knee abduction angle (degrees) Knee abduction angle at initial contact (degrees) Peak knee abduction moment (Newton*meters / bodyweight (kg) * height (m)) 48
65 Peak proximal anterior tibial shear force (% bodyweight) Additional variables that were used to investigate the effect of increasing jump distance are: Pre-landing muscle activation of the vastus lateralis, vastus medialis, lateral hamstring, and medial hamstrings Post-landing muscle activation of the vastus lateralis, vastus medialis, lateral hamstring, and medial hamstrings The independent variable for this specific aim will be jump distance. The jump distances that will be used will be twenty, forty, sixty, and eighty percent of each subject s height from the edge of the force platform Specific Aim 2: Effect of Jump Distance on the Relationship Between Sensorimotor System and Biomechanical Risk Factors for ACL Injury The sensorimotor system is a critical aspect of injury prevention and a target for interventions aimed at preventing ACL injuries. Therefore, each biomechanical risk factor will have a separate regression equation to determine the association between measured aspects of the sensorimotor system and each biomechanical risk factor. The biomechanical variables that will be included in this specific aim are all those listed above in Specific Aim 1. The independent variables that will be used in Specific Aim 2 as predictors of landing biomechanics will be components of the sensorimotor system. These variables include: Threshold to detect passive motion and direction toward knee extension (degrees) Threshold to detect passive motion and direction toward knee flexion (degrees) Knee extension time to peak torque (milliseconds) 49
66 Knee flexion time to peak torque (milliseconds) Knee extension peak torque (Nm/kg) Knee flexion peak torque (Nm/kg) 3.2 SUBJECT RECRUITMENT Ethical approval of this dissertation will be acquired from the University of Pittsburgh s Institutional Review Board (IRB). Potential subjects will be recruited from the University of Pittsburgh population and surrounding institutions and recreational sport organizations with the use of recruitment fliers. To ensure homogeneity of participants all potential subjects will be screened over the phone for inclusion and exclusion criteria as listed in the next section. 3.3 SUBJECT CHARACTERISTICS Females have been at the forefront of non-contact ACL injury research due to the increased incidence of this injury in the female athlete population. 34 Additionally, previous research has demonstrated a gender effect on both landing biomechanics and neuromuscular control strategies. 66,67,94,195,196 Therefore, only females will be recruited for this dissertation. Healthy females that are physically active at least three days per week for a minimum of thirty minutes a session will be recruited to participate in this study. Potential participants will be recruited using flyers posted throughout fitness and activity centers of the University of Pittsburgh. 50
67 3.3.1 Inclusion Criteria Potential subjects will be included in this study if they meet the following criteria: Female Aged 18 to 35 Physically active at least three days per week for at least 30 minutes each session Exclusion Criteria Potential subjects will be excluded from participation in this study if any of the following criteria are true: Known history of ACL injury or reconstruction Known history of surgical procedure involving the lower extremity Previous lower extremity musculoskeletal injury in the last six weeks that required medical attention (i.e. doctor s appointment, physical therapy, emergency room, or urgent care) and has been at least three weeks since the last sign or symptom of initial injury Knowingly pregnant Known history of any other musculoskeletal or neurological condition that may affect muscle function, peripheral sensory input, or the ability to perform the tasks involved in this study 51
68 3.3.3 Sample Size Calculation An a priori power analysis was conducted using G*Power 3 197,198 statistical software to estimate the minimum amount of subjects needed to achieve the desired power. The current studies uses two specific aims with different statistical analyses, thus, two separate power analyses were performed each based on the statistical procedure needed for the two specific aims. Table 1 describes the statistical test parameters that were used in the sample size estimation. To the author s best knowledge the effect of jump distance on biomechanical characteristics has not been previously investigated using a repeated measures ANOVA. Previous studies have demonstrated that increasing jump distance does significantly increase ground reaction forces and tibial accelerations with Pearson correlation coefficients ranging from Therefore, to estimate the needed sample size for the first specific aim a conservative effects size of 0.20 was used yielding an estimated sample size of fifty subjects. Previous research also has investigated the association between strength and proprioception with landing biomechanics and demonstrated R 2 values of (F = , p = 0.001) with a sample size of fifty subjects. 50 Therefore, a effect size of 0.30 was chosen for the regression analysis of this study to ensure adequate power for the second specific aim. Based on the estimated sample size from each analysis the number of subjects needed for the current study is fifty-three. Table 1. Sample Size Calculation Statistical Test Repeated Measures One-way ANOVA Multiple Linear Regression Power Alpha Effect Size # of Measures/ Predictors Corr. Among Measures Nonsphericity Corr. Estimated Sample Size N/A N/A 53 52
69 3.4 INSTRUMENTATION Three-Dimensional Motion Analysis System Lower extremity kinematics and kinetics will be measured using 3D coordinate data and ground reaction force data collected simultaneously. Three-dimensional trajectory data will be collected using a high-speed infrared optical capture system (Vicon Motion Systems Inc, Centennial, CO). This optical capture system is composed of eight wall mounted and two tripod mounted MX+13 high-speed infrared cameras (Vicon Motion Systems Inc, Centennial, CO.). These cameras track infrared light that is reflected off the 14mm retro-reflective markers that will be placed on the subject s lower extremities according to the Plug-in-Gait marker set. 189 Marker trajectory data collected by the camera system will be transferred to Vicon Nexus Software (Vicon Motion Systems Inc, Centennial, CO) at a sampling frequency of 250 Hz. The ten cameras will be oriented in a way that gives the system the best marker visibility throughout the task within a 4m long x 2m wide x 2.5m high capture volume. The camera system will be calibrated using the fivemarker wand technique recommended by the manufacturer s guidelines. The Vicon motion analysis system has a reported accuracy of 117μm. 192 The orientation of the global coordinate system (Figure 1) will be defined by the position of the five-marker wand so that the origin is on the corner of the force place, positive x is toward the anterior direction of the subject, positive y is toward the left side of the subject, and positive z is directed upward. 53

70 Z X Y Figure 1. Global Coordinate System and Force Plate Orientation Force Platform System Ground reaction force data and joint kinetic calculations will use data collected by a 60cm x 40cm force platform (Type 9286BA, Kistler Instrument Corp., Amherst, NY) at a sampling frequency of 1500 Hz. 199 This specific force platform uses four piezoelectric three-component force sensors mounted at each corner of the platform and a built-in charge amplifier. Custom build flooring has been constructed around the force plates to allow for a flush floor surface. The force plate and motion-analysis data will be time synchronized using Vicon Nexus software (Vicon Motion Systems, Inc, Centennial, CO). 200 The orientation of the force plates will be measured and manually entered into the Nexus software so that center of pressure measures will be relative to the global coordinate system for kinetic calculations (Figure 1). 54
71 3.4.3 Surface Electromyography System Muscle activity of the quadriceps and hamstrings will be measured using the Noraxon direct transmission system (DTS) multi-channel telemetric surface electromyography (semg) system (Noraxon U.S.A. Inc., Scottsdale, AZ) 201 along with Ambu Blue Sensor N rectangular (30mm X 22mm X 1.6mm) pre-gelled Ag/AgCl, active, bipolar, self-adhesive surface electrodes (Ambu, Denmark). 202 This is a 16-bit resolution system with an input range of ± 3.5mV and is composed of self-contained semg sensor transmitter units, a belt receiver unit, and a Noraxon 2400R G2 analog output desktop receiver unit. Surface EMG data will be sampled at 1500Hz. Each semg signal will be passed through a single-end 500-gain amplifier and a Hz low-pass filter within a self- contained Noraxon TeleMyo DTS sensor unit. The DTS unit also applies a notch filter at 50-60Hz to dampen noise related to internal electrical components. The sensor units transmit signals to the belt receiver unit, which then transmit signals to the desktop receiver unit. Raw semg signals will then be passed from the desktop receiver to a 32-channel 24-bit analogto-digital board (Vicon Motion Systems LTD, Centennial, CO) to convert the analog signal to digital form. The converted semg signal will then be time synchronized and recorded using Nexus software (Vicon Motion Systems LTD, Centennial, CO) Isokinetic Dynamometer The Biodex System III isokinetic dynamometer (Biodex Medical Systems, Inc., Shirley, NY) will be used to measure both threshold to detect passive motion (TTDPM) and direction, peak torque 55
72 (PT), and time to peak torque (TTPT) for both hamstrings and quadriceps, and provide an isometric resistance to measure muscle activation during maximal voluntary isometric contractions of the hamstrings and quadriceps. This isokinetic dynamometer is a popular tool for the measurement of TTDPM 117,143,148,203 and direction, and TTPT. 148,204,205 Calibration of the Biodex System III dynamometer will be performed as outlined in the manufacturer s service manual Vertical Jump Target A vertical jump target will be used to standardize the effort of the jump required after the initial landing. A VERTEC Jump Trainer (Sports Imports, Columbus, OH) will be used as a physical target positioned at 90% of the subject s measured maximal vertical jump. The VERTEC Jump Trainer has been used in previous research to standardize jump height during counter movement tasks TESTING PROCEDURES All testing will take place at the University of Pittsburgh s Neuromuscular Research Laboratory. Each subject will report to the laboratory for one testing session lasting approximately one hour and thirty minutes. Subjects will be asked to refrain from engaging in exercise or additional physical activity other than their daily living activities for the twenty-four hours prior to the testing session. Upon arrival to the laboratory, inclusion and exclusion criteria will again be confirmed by reviewing the subject-specific phone screen. Once inclusion and exclusion criteria 56
73 are confirmed the investigator will discuss the study s aims and procedures and each subject will be given the opportunity to ask questions or voice any concerns that they may have. After all questions are answered the subject will sign an informed consent document as required by the IRB. Before the beginning of laboratory testing each subject will be required to fill out the Tegner activity score questionnaire (Appendix A) designed by Tegner and Lysholm 206 to rate a person s level of participated activity. This questionnaire has been validated to compliment the symptomatic based scoring by quantifying the amount of recreational and occupational activity that post ACL-reconstruction individuals participate in. 206 A specific testing order will be used for each subject with the intention to minimize the effect of higher- level tasks on proprioception testing and the effect of repeated trials on peripheral muscle fatigue. A specific testing order as outlined below will be used: Threshold to detect passive motion and direction Dynamic warm-up Biomechanical assessment of landing characteristics Knee flexion and extension strength and time to peak torque For the purposes of this dissertation, only the dominant knee of each subject will be tested and analyzed. The dominant leg will be operationally determined as the preferred kicking leg when kicking a soccer ball. All testing will be completed in compression shorts and shirt and the subject s personal athletic shoes, except for threshold to detect passive motion and direction for which shoes were removed. 57
74 3.5.1 Threshold to Detect Passive Motion and Direction Prior to TTDPM testing the Biodex System III will be calibrated as specified by manufacturer s guidelines. Specific subject positioning will be used to minimize variability between subjects and to ensure minimal tactile cueing during the test. The subject will be seated upright in the Biodex chair and mechanical adjustments to the chair will be made to standardize patient positioning. The fore-aft position of the seat back will be adjusted so that the popliteal fossa of the test limb is approximately four centimeters from the edge of the chair to minimize tactile sensation from contact with the chair while the knee joint is rotating. The chair and dynamometer position will be adjusted to align the femoral condyle with the axis of rotation of the dynamometer to ensure consistent joint rotation of the knee. Two shoulder straps and a waist belt will be tightened to keep the subject in the same position throughout testing but still comfortable to the subject. It is also important to minimize any additional input or potential cueing from the visual, auditory, or tactile senses. Therefore, the subject will be fitted with a blindfold, foam earplugs, and over-the-ear headphones that produce white noise during testing to eliminate cueing from these senses and potential confounding of the measurement. To reduce any additional tactile cueing from the moving device a cotton tube sock will be placed over the subject s lower leg and foot before being placed in a pneumatic sleeve that will be inflated to 40 mmhg during testing. Range of motion limits of the device will be set by extending dynamometer attachment jig and the subject s knee to approximately zero degrees of knee flexion pressing the Set Away button on the dynamometer. Similarly, the knee will be moved toward flexion until just before the subject s leg comes in contact with the chair, about ninety degrees, and then pressing the Set Towards button. 58
75 During testing the subject s leg will be positioned to forty-five degrees of knee flexion as measured with a goniometer. The get-position button will be selected within the Biodex Researcher s Toolkit software to get the dynamometer measured angle and will be written down as the zero reference angle and typed into the go-to reference that will be used to instruct the device to return this position after each test. Isometric mode will be selected in the software and the speed values will be zeroed. The researcher will manually select the randomized direction of rotation from a pre-allocated sequence. The subject will be instructed to press the remote button once you are able to sense motion at your knee and you can distinguish the direction of rotation. Once the white noise begins the device will begin to move sometime between zero and one minute. To initiate the testing, white noise will be turned on and the researcher will increase the dynamometer speed to 0.25 /sec in the appropriate direction. Once the subject presses the remote button the dynamometer will stop moving and the end position will be recorded by pressing the get-position button. The test limb will then be returned to the starting position by selecting the go-to button. Each subject will be allowed one practice trial prior to measured tests. Each direction will have three successful trials collected and the order of tests will be randomized and balanced using a Latin Square technique

76 Figure 2: Threshold to Detect Passive Motion and Direction Dynamic Warm-up Before completing the maximal vertical jump and jump-landing tasks, each subject will complete a dynamic warm-up in order to maximize jump performance. 208,209 The content of the dynamic warm-up includes ten walking lunges, ten reverse lunges, ten single-leg Romanian dead lifts, 10 straight leg kicks with each leg, and high knees for a distance of ten meters Maximum Vertical Jump Height Just after the dynamic warm-up and prior to the stop-jump testing participants will have their maximum vertical jump height tested. The subject will line up under the vanes and while keeping 60
77 both feet flat on the ground they will reach up as high as possible and push the vanes away. This measured height will be the subject s standing reach distance. Next the subject will again begin standing directly under the vanes. Without taking a step the subject will perform a countermovement jump and try to touch and push the highest vane possible. This measure will be their raw maximum vertical jump height. This value will be normalized to the subject s standing reach height by subtracting the value of the standing reach height from the raw maximum vertical jump height. Jump height measurements will be performed three times with the highest jump height used as the maximum vertical jump height Biomechanical Assessment of Landing Characteristics Subject Preparation Preparation for biomechanical assessment of landing will begin with anthropometric measurements including weight, height, leg length (standing distance from anterior superior iliac spine to medial malleolus), knee width, and ankle width. These measurements will be entered in the Vicon Nexus software to create a custom model from the 3D coordinate data. 190 This data will also be used during inverse dynamic calculations to determine knee joint forces and moments. After all anthropometric measurements have been taken the quadriceps and hamstring area will be prepped for EMG electrode placement on the subject s dominant limb. Placement and skin preparation of the medial and lateral quadriceps and medial and lateral hamstring electrodes will be in accordance with SENIAM guidelines for EMG placement. 210 While the subject is positioned in a long sitting position the electrodes for vastus-lateralis (VL) will be placed at one-third of the line between the anterior superior iliac spine (ASIS) and the patella. The electrodes over the vastus-medialis (VM) will be placed at the 80% position on the line between the ASIS and the 61


78 medial joint line (i.e. if the distance is measured to be 50cm than the electrodes will be placed at 40cm from the ASIS). The electrodes on the hamstring musculature will be identified with the subject lying prone and their knee positioned in approximately forty-five degrees on flexion. The location for the biceps-femoris (BF) electrode will be identified 50% of the distance following a line between the ischial tuberosity and the lateral epicondyle of the tibia with the thigh slightly externally rotated. The medial hamstrings group (MH) location will be identified as 50% of the line between the ischial tuberosity and the medial epicondyle of the tibia while the thigh is slightly internally rotated. Once the electrode sites have been identified the skin will be prepped by shaving any hair, lightly abrading, and wiping the placement site down with alcohol. The electrodes will then be place parallel to the line of action of the muscle group as shown in Figure 3. The remote sensor units will be connected to each of the electrodes and submaximal contractions (MVIC) of each muscle group will be used to confirm placement of electrodes. Confirmation of each electrode placement will be done by visual inspection of the measured signal in the Nexus software while the subject performs as 50% effort muscle contraction. Each remote sensory unit and electrodes will be secured to the skin using double-sided tape, Transpore tape (3M, St. Paul, MN), and pre-wrap to minimize sensor movement artifact in the EMG signal. A B Figure 3: Hamstrings (A) and Quadriceps (B) EMG Electrode Placement 62
79 Maximal voluntary isometric contractions will be collected using the Biodex system III. The subject will be placed in a seated position with the for-aft chair adjustment set to allow the popliteal fossa three centimeters of space from the front edge of the seat. The rotational axis of the knee will be aligned with the dynamometer axis of rotation and the knee flexion extension attachment pad will be place on the distal lower leg, just above the malleoli. The subject will be secured to the chair using one waist strap and two shoulder straps. Verbal instruction will be given to each subject that include on GO we will ask that you extend your knee by kicking out as hard as you can and maintain it until I say relax. During the contraction, five seconds of EMG data will be recorded. A hamstring MVIC will be conducted in the same position except the subject will be asked to flex their knee by pulling your heel back as hard as you can until I say relax. Once EMG sensors have been attached and MVIC trials have been collected sixteen 14mm retroreflective markers will be placed on the subjects lower extremities according to the lower extremity Plug-in Gait biomechanical model (Figure 4). 189 Markers will be placed bilaterally on the following anatomical locations: ASIS, posterior superior iliac spine (PSIS), lateral thigh, lateral femoral epicondyle, lateral shank, lateral malleolus, posterior aspect of the heel, and second metatarsal head. 63


80 Figure 4. Lower Extremity Plug-in-Gait Marker Placement Stop-Jump Task The camera system will be calibrated using the manufacturers recommended guidelines and the global coordinate system will be defined prior to the testing session with the subject. Once subject-preparation has concluded a calibration trial will be collected with the subject standing on the force plate in the anatomic neutral position with their arms abducted to ninety degrees and palms facing forward. Verbal instruction will be given to Point your toes forward, place your feet directly under your hips, keep your knee and hips as straight as possible, and hold still. More specific segment position instructions will be given if needed upon visual inspection. A three second calibration trial will be collected while the subject remains still in this position. This trial will then be labeled and processed in the Nexus software to establish segmental coordinate systems specific to the subject s biomechanical model. 64
81 Subjects will begin by standing at a distance of 20%, 40%, 60%, or 80% of their height from the edge of the force platform. The jump distance order will be randomized for each subject prior to the testing session using a random number generator and Latin square. 207 A six-inch hurdle will be placed half the distance from the starting line to the force plate to standardize the jump height to the force plate. To standardize the jump after the initial landing the VERTEC Jump Trainer will be positioned with the target vanes directly above the center of the force platform with the bottom vane equal to the subject s maximal vertical jump height. Each subject will be given verbal instruction and a visual demonstration of the task. Subjects will be asked to begin with both toes on the line, after a count down of three-two-one-jump perform and double-leg broad jump forward over the hurdle landing with one foot on each force platform. Immediately after landing, perform a maximal vertical jump to touch the bottom vane on the VERTEC Jump Trainer. One practice trial at each jump distance will be required so that each subject has a minimum of five practice trials. Trials will be excluded and repeated if the subject does not take off with both legs, each foot does not completely land on the force plate, does not clear the hurdle, or misses the target vane during the vertical jump. Kinematic, force platform, and EMG data will be visually inspected after each trial and repeated if insufficient data (such as EMG signal drop-out) was collected. 65


82 Figure 5: Capture Volume Setup Knee Flexion and Extension Isokinetic Strength and Time to Peak Torque Knee flexion and extension strength and time to peak torque of the dominant knee will be measured simultaneously on the Biodex system III isokinetic dynamometer. Subjects again will be seated in the Biodex chair in the same position as MVIC trials. Isokinetic strength testing will be completed at 240 /s for both flexion and extension between zero and sixty degrees of knee flexion. Our laboratory has demonstrated that isokinetic strength testing of knee extension and flexion between zero and sixty degrees is a reliable measure (ICC (2,1) = 0.99, SEM = 7.5ms). 181 Subjects will be positioned in the Biodex chair as described during the MVIC testing. The range of motion limits on the Biodex dynamometer will then be set to zero and sixty degrees of 66
83 knee flexion. The tester will visually set the subject s knee in zero degrees of flexion for the away limit and confirm the joint position with a goniometer. This procedure will be done again at sixty degrees of knee flexion to set the towards limit. The tester will then place the subject s knee at forty-five degrees of knee flexion and pause the dynamometer to record the limb weight. After verification of the subject s body position and dynamometer settings the subject will be given two sets of three-repetition practice/warm-up trials, one at 50% effort and one at 100% effort. The tester will instruct the subject to begin with their knee bent as far back as possible (ninety degrees of knee flexion) and begin reciprocal contractions of pushing out and pulling as hard and as fast as you can after a countdown of GO. The practice / warm-up trials will include one set of three repetitions at 50% of the subjects perceived maximal effort followed by one set of three repetitions at 100% of the subject perceived maximal effort. After a oneminute resting period the subject will be asked to perform one set of five maximal repetitions, instructed as as hard and as fast as you can which will be used as measured trials. 3.6 DATA REDUCTION Threshold to Detect Passive Motion and Direction Threshold to detect passive motion and direction is a measure of joint excursion. During testing the starting position is constant for each trial at forty-five degrees of knee flexion. The subject will press a trigger that stops the dynamometer and the final joint angle is recorded. The measure of TTDPM is the difference between the ending joint angle and the beginning joint angle (as 67
84 described in equation below). This measure will be calculated and averaged together for three successful trials toward knee extension and three trials toward flexion. TTDPM = θ end - θ Begin Landing Kinematics, Kinetics, and Muscle Activation All marker trajectory, ground reaction force, and EMG data will be recorded using the Vicon Nexus software. Raw marker trajectory data will be filtered using a cross-validation Woltring filtering routine (quantic spline filter) within the Nexus software. 211 Ground reaction force data will be filtered using a low-pass, zero-lag fourth-order Butterworth filter with cutoff frequency of 47, 128 in Matlab (R2014a, Mathworks Inc., Natick, MA). The Plug-In-Gait model is a rigid segment biomechanical model, based on the Helen Hayes biomechanical model, and will be used to calculate joint angles, forces, and moments within the Nexus software. The estimation of hip, knee, and ankle joint centers and the definition of segmental coordinate systems will use subjectspecific anthropometric data according to the procedures described by Kadaba et al. 190 and Davis et al. 212 Three-dimensional joint angle data will be calculated with Euler angle rotational decomposition using the right-hand rule in a sequence of X, Y, Z. Joint forces and moments will be calculated using inverse dynamics as described by Davis et al. 212 Further Data reduction will be completed using a custom written Matlab (R2014a, Mathworks Inc., Natick, MA) script. Initial contact will be defined as the time point where the vertical ground reaction force exceeds a threshold of 5% of the subject s body weight. Knee flexion and abduction angles will be identified at this time point. Peak knee flexion, knee abduction, and hip flexion will be defined at the maximal joint excursion in the specified direction during the landing phase. Landing phase will be defined as the time between initial contact and 68
85 the change in knee joint power from negative to positive. Peak knee flexion and abduction moment will be defined as the maximal vector moment in the respective plane of motion throughout landing phase. Peak PATSF will be defined as the maximal knee joint force in the X (anterior) direction during the landing phase, normalized to the subject s body weight, and reported as N/kg. Peak vertical and posterior GRF during landing will be normalized to the subject s body weight and reported as % body weight. Raw EMG data will be synchronized and recorded with the Nexus software, exported to an ASCII file, and processed using a custom written Matlab script. A fourth-order low-pass Butterworth filter with a cut-off frequency of 12 Hz will be used to filter the raw EMG signal. The mean EMG signal (V) from middle four seconds of the respective MVIC trial (Quadriceps or Hamstrings MVIC) will be used to normalize the EMG signal throughout the stop-jump trials and reported as %MVIC. The integrated EMG (iemg) signal of each channel during the 150ms leading up to initial contact and the 150ms following initial contact will be expressed as the area under the curve (%MVIC x s) Knee Flexion and Extension Strength and Time to Peak Torque Knee extension strength will be defined as the average peak torque normalized to body weight (%body weight) during the five reciprocal trials toward knee extension. Knee flexion strength will be calculated the same way using the normalized average peak torque toward knee flexion. Time to peak torque will be defined as the time from the initiation of motion in the respective direction to the recorded peak torque for each repetition. Knee extension and flexion time to peak torque will be the average time to peak torque toward knee extension or flexion, respectively. 69
86 3.7 STATISTICAL ANALYSIS All statistical analyses were performed in STATA 13 (Statacorp LP, College Station, TX). Descriptive statistics were calculated for all variables. Plots were generated and each variable was examined for outliers. The first specific aim of this dissertation was to examine the effect of jump distance on biomechanical landing characteristics. Repeated measures ANOVA analysis was used to examine the with-in subject differences between jump distance. First, normality was assessed for all kinematic, kinetic, GRF, and muscle activation. All normally distributed variables were also tested to determine if the assumption of sphericity was met. If sphericity it is not met the Greenhouse-Geisser adjusted ANOVA results were be used. For all variables that are not normally distributed, the Freidman s ANOVA was used to test for within-in subject difference by jump distance. Post-hoc pairwise analyses used the Bonferroni p-value adjustment. The second specific aim of the dissertation was to examine the effect of jump distance on the relationship between biomechanical landing characteristics and the sensorimotor system. Separate sets of multiple linear regression equations by jump distance were created for each of the previously mentioned biomechanical landing characteristics. Bivariate analyses included a correlation matrix of the independent variables and potential collinearity was assessed. The full model was fit and a backward stepping technique was be used to remove non-significant predictors from each regression equation. Residual analyses were completed to examine linearity, heteroscedasticity, outliers, and potential leverage points. Statistical significance for both specific aims was set to This procedure was repeated for each jump distance, creating a separate regression equation for each jump distance and each dependent variable. 70
87 4.0 RESULTS The purpose of this study was to assess the effect of jump distance on biomechanical risk factors for ACL injury and muscle activation. Landing biomechanics related to ACL injury were assessed during a double-leg stop-jump maneuver completed at four jump distances (20%, 40%, 60%, and 80% of the subject s body height) using a video-based motion analysis system. Repeated measures analysis of variance (ANOVA) was used to test the within subject differences of landing biomechanical characteristics and muscle activation among different jump distances. Secondly, this study aimed to evaluate the relationship between sensorimotor characteristics at the knee and biomechanical risk factors for ACL injury. Univariate analyses of the independent and dependent variables are presented first. Bivariate statistics are then presented to assess the pairwise relationship between each independent and dependent variable. Multiple linear regression models were created and tested for each dependent variable by jump distance. 4.1 SUBJECTS Fifty-six female subjects volunteered to participate in this study, however three did not meet study eligibility criteria due to previous history of ACL injury. This left a total of fifty-three subjects who were consented and participated in the study. Two subjects were not able to successfully complete the stop-jump task at a distance of 80% of their body height and were excluded from the 71
88 repeated measures ANOVA of Hypothesis 1. However, data for these subjects were used for multiple linear regression models at the 20%, 40%, and 60% distances. Subjects came from a wide variety of activity levels and sport backgrounds. For inclusion, subjects met a minimum activity level of exercising at least three days per week for at least thirty minutes each session, however a questionnaire was still used to quantify activity related to the knee. The Tegner activity score questionnaire (Appendix A) was used to rate each subject s level of activity relative to the knee. 206 Table 2. Subject Demographic Summary n = 53 Mean SD Min Max Age (years) Height (cm) Weight (kg) Activity level (0-10) Abbreviations: number of subjects (n), standard deviation (SD), Minimum (Min), Maximum (Max), centimeters (cm), kilograms (kg) 4.2 WITHIN SUBJECT DIFFERENCES IN LANDING BIOMECHANICS AND MUSCLE ACITIVTY BETWEEN JUMP DISTANCES The first specific aim of this study was to assess if each jump distance would elicit different responses in biomechanical risk factors for ACL injury and different muscle activation levels of the quadriceps and hamstrings. Repeated measures ANOVA were used to test for differences in landing kinematics, kinetics, and muscle activation. 72


89 4.2.1 Potential Outliers Figure 6 includes scatter plots of each biomechanical variable against subject ID for each jump distance. Based on visual inspection of the data there were some potential outliers that warranted investigation. Peak vertical ground reaction force (Figure 6A) displayed a high point at a jump distance of 80% for subject 21. Based on further data review within the motion analysis software there was no evidence that this data point was incorrect. Also associated with this increase in vertical ground reaction force is an increase in knee abduction moment at a jump distance of 80% for the same subject (Figure 6H). No other extreme points were identified that warranted further review. 73

 determined that peak vertical ground reaction force,")


90 Figure 6. Scatter Plots of Biomechanical Variables vs Subject ID by Jump Distance Normality Test Results Normality testing was completed to determine appropriate testing methods. Shapiro-Wilk test results (Table 3) determined that peak vertical ground reaction force, peak anterior-posterior ground reaction force, peak knee flexion, peak knee abduction moment, peak PATSF and all muscle activation measures were not normally distributed for at least one jump distance. However, evaluation of histograms for each of the variables showed that only peak knee abduction moment had obvious deviation from normality. Because ANOVA has been demonstrated to be a robust test for deviations from normality, 213 standard repeated measures 74
91 ANOVA was used to analyze the within subject differences between jump distances except for peak knee abduction moment and muscle activation measures. The only muscle activation measure that did not have any obvious deviations from normality based on histogram plots was reactivity of the vastus lateralis, therefore, repeated measure ANOVA tests were used. Table 3. Dependent Variable Shapiro-Wilk Normality Test Results 20% 40% 60% 80% p-value p-value p-value p-value Biomechanics Peak vgrf (%BW) * * Peak apgrf (%BW) * * Knee Flexion at IC (degrees) Knee Abduction at IC (degrees) Peak Knee Flexion (degrees) * * Peak Knee ABD (degrees) Peak Knee ABDmom (Nm/kg*m) * * * Peak PATSF (%BW) * EMG Preactivity VL (%MVIC) <0.0001* <0.0001* <0.0001* <0.0001* Preactivity VM (%MVIC) <0.0001* <0.0001* <0.0001* <0.0001* Preactivity MH (%MVIC) * * * * Preactivity LH (%MVIC) * <0.0001* * * Reactivity VL (%MVIC) * * * Reactivity VM (%MVIC) * * * * Reactivity MH (%MVIC) * * * * Reactivity LH (%MVIC) <0.0001* * * * Abbreviations: vertical ground reaction force (vgrf), anterior-posterior ground reaction force (apgrf), body weight (BW), initial contact (IC), abduction (ABD), abduction moment (ABDmom), proximal anterior tibial shear force (PATSF), threshold to detect passive motion (TTDPM), peak torque (PT), flexion (flex), extension (ext) *Significant (p < 0.05) 75
92 4.2.3 Repeated Measures Between Jump Distances Summary statistics for each variable at each jump distance are reported in Table 4. Repeated measures ANOVA revealed significant differences among jump distances for all variables except knee flexion and abduction at initial contact, and peak proximal anterior tibial shear force (Table 5). Post-hoc pairwise testing (Table 6) revealed vertical and anterior-posterior ground reaction force significantly increased with each increase in jump distance, which demonstrated increased landing demand as jump distance increased. Among the biomechanical characteristics only peak knee flexion was significantly different between jump distances of 20% and 40%. It steadily increased as jump distance increased from 79.4 at 20% to 89.8 at 80% (p <0.0001) (Figure 7E). Peak knee abduction angle also showed significant increases as jump distance increased but only between 20% vs, 60%, 20% vs. 80%, 40% vs. 60%, and 40% vs. 80% (p = , p = , p = , p = , respectively) (Figure 7F). Peak knee abduction moment during landing remained consistent between the 20% and 40% jump distances (0.661 and Nm/kg*m, respectively) but significantly increased to and Nm/kg*m at 60% and 80% jump distances, respectively (Figure 6G). There was no significant difference in preactivity and reactivity of the quadriceps or hamstrings between jump distances of 20% and 40% body height. However, there was a steady increase in preactivity of the quadriceps and hamstrings as jump distance increased from 40% to 60% to 80% body height (p < , Figure 7A-D). Muscle reactivity also exhibited increases with increases in jump distance (Figure 7E-H). Significant differences in reactivity were seen between jump distances of 20% and 60% (p = ) and between 20% and 80% jump distances (p = ). Reactivity of the lateral hamstring was the only muscle that did 76
93 not show a significant increase between jump distances of 20% and 80% body height (50% compared to 53.5 %MVIC, p = ). Table 4. Descriptive Statistics for the Kinematic, Kinetic, and Muscle Activation Variables for each Jump Distances (A) 20% Height Jump Distance Mean SD Median 25th%tile 75th%tile Biomechanics Peak vgrf (%BW) Peak apgrf (%BW) Knee Flexion at IC (degrees) Knee Abduction at IC (degrees) Peak Knee Flexion (degrees) Peak Knee ABD (degrees) Peak Knee ABDmom (Nm/kg*m) Peak PATSF (%BW) EMG Preactivity VL (%MVIC) Preactivity VM (%MVIC) Preactivity MH (%MVIC) Preactivity LH (%MVIC) Reactivity VL (%MVIC) Reactivity VM (%MVIC) Reactivity MH (%MVIC) Reactivity LH (%MVIC) Abbreviations: vertical ground reaction force (vgrf), anterior-posterior ground reaction force (apgrf), body weight (BW), initial contact (IC), abduction (ABD), abduction moment (ABDmom), maximum voluntary isometric contraction (MVIC), vastus lateralis (VL), vastus medialis (VM), medial Hamstring (MH), lateral hamstring (LH), standard deviation (SD) 77
94 Table 4 (Continued) (B) 40% Height Jump Distance Mean SD Median 25th%tile 75th%tile Biomechanics Peak vgrf (%BW) Peak apgrf (%BW) Knee Flexion at IC (degrees) Knee Abduction at IC (degrees) Peak Knee Flexion (degrees) Peak Knee ABD (degrees) Peak Knee ABDmom (Nm/kg*m) Peak PATSF (%BW) EMG Preactivity VL (%MVIC) Preactivity VM (%MVIC) Preactivity MH (%MVIC) Preactivity LH (%MVIC) Reactivity VL (%MVIC) Reactivity VM (%MVIC) Reactivity MH (%MVIC) Reactivity LH (%MVIC) Abbreviations: vertical ground reaction force (vgrf), anterior-posterior ground reaction force (apgrf), body weight (BW), initial contact (IC), abduction (ABD), abduction moment (ABDmom), maximum voluntary isometric contraction (MVIC), vastus lateralis (VL), vastus medialis (VM), medial Hamstring (MH), lateral hamstring (LH), standard deviation (SD) 78
95 Table 4 (Continued) (C) 60% Height Jump Distance Mean SD Median 25th%tile 75th%tile Biomechanics Peak vgrf (%BW) Peak apgrf (%BW) Knee Flexion at IC (degrees) Knee Abduction at IC (degrees) Peak Knee Flexion (degrees) Peak Knee ABD (degrees) Peak Knee ABDmom (Nm/kg*m) Peak PATSF (%BW) EMG Preactivity VL (%MVIC) Preactivity VM (%MVIC) Preactivity MH (%MVIC) Preactivity LH (%MVIC) Reactivity VL (%MVIC) Reactivity VM (%MVIC) Reactivity MH (%MVIC) Reactivity LH (%MVIC) Abbreviations: vertical ground reaction force (vgrf), anterior-posterior ground reaction force (apgrf), body weight (BW), initial contact (IC), abduction (ABD), abduction moment (ABDmom), maximum voluntary isometric contraction (MVIC), vastus lateralis (VL), vastus medialis (VM), medial Hamstring (MH), lateral hamstring (LH), standard deviation (SD) 79
96 Table 4 (Continued) (D) 80% Height Jump Distance Mean SD Median 25th%tile 75th%tile Biomechanics Peak vgrf (%BW) Peak apgrf (%BW) Knee Flexion at IC (degrees) Knee Abduction at IC (degrees) Peak Knee Flexion (degrees) Peak Knee ABD (degrees) Peak Knee ABDmom (Nm/kg*m) Peak PATSF (%BW) EMG Preactivity VL (%MVIC) Preactivity VM (%MVIC) Preactivity MH (%MVIC) Preactivity LH (%MVIC) Reactivity VL (%MVIC) Reactivity VM (%MVIC) Reactivity MH (%MVIC) Reactivity LH (%MVIC) Abbreviations: vertical ground reaction force (vgrf), anterior-posterior ground reaction force (apgrf), body weight (BW), initial contact (IC), abduction (ABD), abduction moment (ABDmom), maximum voluntary isometric contraction (MVIC), vastus lateralis (VL), vastus medialis (VM), medial Hamstring (MH), lateral hamstring (LH), standard deviation (SD) 80
97 Table 5. Repeated Measures ANOVA Across Jump Distances ANOVA Results Variable F-value Chi-Squared b p-value Biomechanics Peak vgrf (%BW) a <0.0001* Peak apgrf (%BW) a <0.0001* Knee Flexion at IC (degrees) a Knee Abduction at IC (degrees) a Peak Knee Flexion (degrees) <0.0001* Peak Knee ABD (degrees) a * Peak Knee ABDmom (Nm/kg*m) <0.0001* Peak PATSF (%BW) a EMG Preactivity VL (%MVIC) <0.0001* Preactivity VM (%MVIC) <0.0001* Preactivity MH (%MVIC) <0.0001* Preactivity LH (%MVIC) <0.0001* Reactivity VL (%MVIC) * Reactivity VM (%MVIC) * Reactivity MH (%MVIC) * Reactivity LH (%MVIC) * Abbreviations: vertical ground reaction force (vgrf), anterior-posterior ground reaction force (apgrf), body weight (BW), initial contact (IC), abduction (ABD), abduction moment (ABDmom), maximum voluntary isometric contraction (MVIC), vastus lateralis (VL), vastus medialis (VM), medial Hamstring (MH), lateral hamstring (LH), standard deviation (SD) a Greenhouse-Geisser adjustment for sphearisity violation b Chi-squared values reported for Friedman ANOVA results *Significant difference 81
98 Table 6. Post-hoc Pairwise Analysis Between Jump Distances (A) 20% vs 40% 20% vs 60% Variable Test Statistic b p-value Test Statistic b p-value Biomechanics Peak vgrf (%BW) * <0.0001* Peak apgrf (%BW) <0.0001* <0.0001* Knee Flexion at IC (degrees) * Knee Abduction at IC (degrees) Peak Knee Flexion (degrees) <0.0001* <0.0001* Peak Knee ABD (degrees) * Peak Knee ABDmom (Nm/kg*m) a <0.0001* Peak PATSF (%BW) EMG Preactivity VL (%MVIC) a <0.0001* Preactivity VM (%MVIC) a <0.0001* Preactivity MH (%MVIC) a <0.0001* Preactivity LH (%MVIC) a <0.0001* Reactivity VL (%MVIC) * Reactivity VM (%MVIC) a * Reactivity MH (%MVIC) a * Reactivity LH (%MVIC) a * Abbreviations: vertical ground reaction force (vgrf), anterior-posterior ground reaction force (apgrf), body weight (BW), initial contact (IC), abduction (ABD), abduction moment (ABDmom), maximum voluntary isometric contraction (MVIC), vastus lateralis (VL), vastus medialis (VM), medial Hamstring (MH), lateral hamstring (LH), standard deviation (SD) a Z statistic and Bonferonni manually adjusted p-value criteria (p<0.0083) shown b Test statistic is either t statistic or z statistic based on ANOVA test used, Bonferonni adjustment used for all p-values * Significant difference 82
99 Table 6 (Continued) (B) 20% vs 80% 40% vs 60% Variable Test Statistic b p-value Test Statistic b p-value Biomechanics Peak vgrf (%BW) <0.0001* <0.0001* Peak apgrf (%BW) <0.0001* <0.0001* Knee Flexion at IC (degrees) * Knee Abduction at IC (degrees) Peak Knee Flexion (degrees) <0.0001* <0.0001* Peak Knee ABD (degrees) * * Peak Knee ABDmom (Nm/kg*m) a <0.0001* <0.0001* Peak PATSF (%BW) EMG Preactivity VL (%MVIC) a <0.0001* <0.0001* Preactivity VM (%MVIC) a <0.0001* <0.0001* Preactivity MH (%MVIC) a <0.0001* <0.0001* Preactivity LH (%MVIC) a <0.0001* <0.0001* Reactivity VL (%MVIC) Reactivity VM (%MVIC) a * Reactivity MH (%MVIC) a * Reactivity LH (%MVIC) a Abbreviations: vertical ground reaction force (vgrf), anterior-posterior ground reaction force (apgrf), body weight (BW), initial contact (IC), abduction (ABD), abduction moment (ABDmom), maximum voluntary isometric contraction (MVIC), vastus lateralis (VL), vastus medialis (VM), medial Hamstring (MH), lateral hamstring (LH), standard deviation (SD) a Z statistic and Bonferonni manually adjusted p-value criteria (p<0.0083) shown b Test statistic is either t statistic or z statistic based on ANOVA test used, Bonferonni adjustment used for all p-values * Significant difference 83
100 Table 6 (Continued) (C) 40% vs 80% 60% vs 80% Variable Test Statistic b p-value Test Statistic b p-value Biomechanics Peak vgrf (%BW) <0.0001* <0.0001* Peak apgrf (%BW) <0.0001* <0.0001* Knee Flexion at IC (degrees) Knee Abduction at IC (degrees) * Peak Knee Flexion (degrees) <0.0001* <0.0001* Peak Knee ABD (degrees) * Peak Knee ABDmom (Nm/kg*m) a <0.0001* * Peak PATSF (%BW) EMG Preactivity VL (%MVIC) a <0.0001* <0.0001* Preactivity VM (%MVIC) a <0.0001* <0.0001* Preactivity MH (%MVIC) a <0.0001* <0.0001* Preactivity LH (%MVIC) a <0.0001* <0.0001* Reactivity VL (%MVIC) Reactivity VM (%MVIC) a Reactivity MH (%MVIC) a Reactivity LH (%MVIC) a Abbreviations: vertical ground reaction force (vgrf), anterior-posterior ground reaction force (apgrf), body weight (BW), initial contact (IC), abduction (ABD), abduction moment (ABDmom), maximum voluntary isometric contraction (MVIC), vastus lateralis (VL), vastus medialis (VM), medial Hamstring (MH), lateral hamstring (LH), standard deviation (SD) a Z statistic and Bonferonni manually adjusted p-value criteria (p<0.0083) shown b Test statistic is either t statistic or z statistic based on ANOVA test used, Bonferonni adjustment used for all p-values * Significant difference 84
101 *Median Values Reported Figure 7. Biomechanical Characteristics Across Jump Distances 85
102 *Median Values Reported *Median Values Reported *Median Values Reported *Median Values Reported *Median Values Reported *Median Values Reported *Median Values Reported Figure 8. Muscle Activation Across Jump Distances 86
103 4.3 RELATIONSHIP BETWEEN SENSORIMOTOR CHARACTERISTICS AND BIOMECHANICAL RISK FACTORS FOR ACL INJURY The second specific aim of this study was to determine if components of the sensorimotor system could significantly predict the expression of biomechanical characteristics related to ACL injury and if this relationship changes with jump distance. Multiple linear regression analyses were used to assess the linear relationship between sensorimotor characteristics and biomechanical characteristics during landing and to determine sensorimotor characteristics that have a significant linear relationship with each of the biomechanical variables related to ACL injury. To appropriately assess these analyses, univariate statistics were first calculated to present point estimate and distributive characteristics of the dependent and independent variables. Bivariate analyses were then completed to assess correlation, simple regression, and assumptions of linearity, homoscedasticity, and potential outliers. Lastly, multiple linear regression models were used to obtain the final multiple linear regression models for each dependent variable at each jump distance Univariate Analysis The dependent variables that were used in this specific aim were the eight biomechanical characteristics related to ACL injury; these variables included vertical ground reaction force, anterior-posterior ground reaction force, knee flexion angle at initial contact, knee abduction angle at initial contact, peak knee flexion angle during landing, peak knee abduction angle during landing, peak knee abduction moment during landing, and peak proximal anterior tibial shear force during landing. Descriptive statistics of the dependent variables are presented for each jump 87
104 distance in Table 4. Normality testing revealed that only knee flexion at initial contact, knee abduction at initial contact, and peak knee abduction were normally distributed at all jump distances (Table 7). However, based on the distribution of the dependent variable shown in histograms (Appendix B) the only variable to show possible deviation from normality was peak knee abduction moment. All others did not show any obvious deviations from normality. Although Normality of the raw data is not an assumption of regression, the normality of the residuals will be assessed and addressed at a later point, after the model is applied. Table 7. Normality of Dependent Variables using Shapiro-Wilk Test Jump Distance 20% 40% 60% 80% p-value p-value p-value p-value Peak vgrf (%BW) Peak apgrf (%BW) * Knee Flexion at IC (degrees) Knee Abduction at IC (degrees) Peak Knee Flexion (degrees) Peak Knee ABD (degrees) Peak Knee ABDmom (Nm/kg*m) Peak PATSF (%BW) Abbreviations: vertical ground reaction force (vgrf), anterior-posterior ground reaction force (apgrf), body weight (BW), initial contact (IC), abduction (ABD), abduction moment (ABDmom), proximal anterior tibial shear force (PATSF), threshold to detect passive motion (TTDPM), peak torque (PT), flexion (flex), extension (ext) Transformation of peak knee abduction moment was attempted to account for the deviation from normality in the original data. Log transformation was unsuccessful in restoring normality, however, using the square root of peak knee abduction moment worked well. Shapiro- Wilk test results (p = ) and histograms (Figure 9) showed no obvious deviations from normality. 88
,")
105 Figure 9. Histogram of Peak Knee Abduction Moment Square Root Transformation Independent variables assessed for this specific aim included knee threshold to detect passive motion toward extension (TTDPMext), knee threshold to detect passive motion toward flexion (TTDPMflex), knee extension time to peak torque (TTPText), knee flexion time to peak torque (TTPTflex), knee extension peak torque (PText), knee flexion peak torque (PTflex). Descriptive statistics of these independent variables are presented in Table 8. Normality testing revealed that TTDPMext, TTDPMflex, and TTPTflex were not normally distributed (Table 9). 89
106 Table 8. Descriptive Statistics of Sensorimotor Characteristics Mean SD Median IQR 25th% 75th% TTDPMext ( ) TTDPMflex ( ) TTPText (ms) TTPTflex (ms) PText (%Body Weight) PTflex (%Body Weight) Abbreviations: threshold to detect passive motion toward extension (TTDPMext), threshold to detect passive motion toward flexion (TTDPMflex), knee extension time to peak torque (TTPText), knee flexion time to peak torque (TTPTflex), milliseconds (ms), knee extension peak torque (PText), knee flexion peak torque (PTflex), standard deviation (SD), inter quartile range (IQR) Table 9. Normality of Sensorimotor Characteristics p - value TTDPMext ( ) * TTDPMflex ( ) * TTPText (ms) TTPTflex (ms) * PText (%Body Weight) PTflex (%Body Weight) Abbreviations: threshold to detect passive motion toward extension (TTDPMext), threshold to detect passive motion toward flexion (TTDPMflex), knee extension time to peak torque (TTPText), knee flexion time to peak torque (TTPTflex), milliseconds (ms), knee extension peak torque (PText), knee flexion peak torque (PTflex) *Significant (p < 0.05) 90
107 4.3.2 Bivariate Analysis Two-way scatter plots were created for each of the dependent and independent variable pairs to assess linearity of the relationship, homoscedasticity, and any potential outliers within the data (Appendix C). Scatter plots of TTDPMext (Appendix C.1) did not show any signs of a nonlinear relationship or violations of homoscedasticity but there was an outlier in the data. Subject 21 demonstrated extremely high TTDPMext and TTPMflex (Appendix C.2) values, however TTDPMext was much worse. These data points were verified in the hand written subject report and there was no reason to assume that the data from this subject was incorrect or should be omitted. Plots of the TTDPMflex comparison do not suggest any non-linear relationships but a few TTDPMflex data points are skewed to the right throughout each jump distance, which may influence homoscedasticity. TTPText (Appendix C.3) plots did not show any obvious signs of non-linear relationships, violations of homoscedasticity, or outliers. TTPTflex (Appendix C.4) did appear to be separated into three approximate groups. To account for this TTPTflex needed to be redefined into tertiles. The three groups appear to best be defined by three distinct criteria (TTPTflex G1 <50ms; TTPTflex G2 50, 200; and TTPTflex G3 <200). The effect of this transformation will be assessed later, after the model is applied. Lastly, plots of PText (Appendix C.5) and PTflex (Appendix C.6) did not show any sign of non-linear relationships, violations of homoscedasticity, or outliers. Pairwise correlations between each independent variable were assessed to determine the potential for any multicollinearity issues that may occur (Table 10). There were a few significant correlations between the pairs of independent variables TTDPM, TTPT, and PT. However, the correlation between TTDPMext and TTDPMflex was the only comparison that had a strong 91
108 enough correlation that may have caused issues during the multiple linear regression modeling (r = 0.833, p = 0.000). Table 10. Correlation of Independent Variables TTDPMext TTDPMflex TTPText TTPTflex PText TTDPMflex a 1 TTPText a a 1 TTPTflex a a a 1 PText a a PTflex a a Abbreviations: Threshold to detect passive motion (TTDPM), peak torque (PT), flexion (flex), extension (ext) a Spearman correlation coefficient Pairwise correlations between each of these variables were also calculated to assess the strength of their linear relationship. These correlations are reported in Appendix D. Knee flexion angle at initial contact had by far the most number of significant correlations with sensorimotor characteristics at the knee. At a jump distance of 20% body height, knee flexion at initial contact was significantly correlated with TTDPMflex and TTPTflex (r = -.319, p =.020 and r =.400, p =.003, respectively). At a jump distance of 40% body height only TTPTflex was significantly correlated with knee flexion at initial contact (r = 0.328, p = 0.017). At a jump distance of 60% body height, knee flexion at initial contact was again significantly correlated with TTDPMflex and TTPTflex (r = -.273, p =.048 and r =.358, p =.009, respectively). At a jump distance of 80% body height, knee flexion at initial contact was significantly correlated with TTDPMext, TTDPMflex, PText, and PTflex (r = -.418, p =.002; r = -.397, p =.004; r =.324, p =.020; and r =.318, p =.023, respectively). Peak knee flexion also displayed significant correlations at jump distances of 40% body height with PText (r = 0.291, p = 0.035) and at 80% body height with TTDPMext (r = -.279, p = 0.047). 92
109 Simple linear regression models were completed to assess the linear relationship of each of the independent variables with the dependent variables (Appendix E). Jackknife residual plots (predicted values versus jackknife residuals) were created to evaluate potential outliers and homoscedasticity of the simple regression models (Appendix F). Overall the residual plots are central to zero for the jackknife residuals. However, there are significant outliers in the residual plots (> 3 or < -3) of peak vertical ground reaction force, peak anterior-posterior ground reaction force, peak knee abduction moment, and peak proximal anterior tibial shear force for simple linear regression models. These outliers were confirmed using Cook s D by demonstrating values greater than 1. Therefore robust regression was run on these specific models (Appendix G). Similar to the correlation results, knee flexion at initial contact displayed significant linear relationships at all jump distances. At a jump distance of 20% body height, the only significant linear relationships with knee flexion at initial contact were with TTDPMflex and TTPTflex (R 2 = and R 2 = ). Peak knee flexion and PText was also shown to have a significant linear relationship (R 2 = ) at this jump distance. TTPTflex was significantly related to knee flexion at initial contact (R 2 = ) at a jump distance of 60% body height. At a jump distance of 80% body height, knee flexion at initial contact had a significantly linear relationship with TTDPMext, TTDPMflex, PText and PTflex (R 2 = , R 2 = , R 2 = , R 2 = , respectively). TTDPMext was also significantly related to peak knee flexion at a jump distance of 80% body height (R 2 = ). Peak knee abduction moment showed significant relationships with TTPTflex grouped variable at jump distances of 20% and 40% body height (Appendix E.7). Although the transformed variable (square root of the peak knee abduction moment) showed similar results (Appendix E.9), the transformed variable demonstrated lower MSE values and higher adjusted R 2 values for TTPTflex compared to the raw data, suggesting a better model fit. 93
110 Similarly, The transformation of TTPTflex was successful as is resulted in significant relationships, lower MSE values, and higher adjusted R 2 values as compared to the raw data Multiple Linear Regression Models Separate multiple linear regression equations were constructed for each of the dependent variables at each of the four jump distances using a backwards-stepwise technique. Variance inflation factor (VIF) tables were created for each multivariate linear regression equation (full model and candidate model) to assess for multicollinearity. Histograms and scatterplots of residual vs. fitted values were created to assess normality of residuals and homoscedasticity Peak Vertical Ground Reaction Force The candidate models at each of the jump distances for peak vertical ground reaction force are shown in Table 11. No independent variables were retained in the model at a jump distance of 20% body height. Although TTPTflex was retained for the model at distances of 40%, 60%, and 80%, none were statistically significant. Peak vertical ground reaction force did not have a significant linear relationship with the examined sensorimotor characteristics of the knee. No significant outliers or leverage points were detected using residual or Cooks D analysis. 94
111 Table 11. Peak Vertical Ground Reaction Force Multiple Linear Regression Results (A) Vertical GRF at 40% Body Height Source SS df MS Observations 53 Model F (1, 2) 1.73 Residual Prob > F Total R Adjusted R MSE Predictor Variables Coefficients t p-value TTPTflex G Constant (B) Vertical GRF at 60% Body Height Source SS df MS Observations 53 Model F (1, 2) 3.77 Residual Prob > F Total R Adjusted R MSE Predictor Variables Coefficients t p-value TTPTflex G Constant (C) Vertical GRF at 80% Body Height Source SS df MS Observations 51 Model F (1, 2) 3.35 Residual Prob > F Total R Adjusted R MSE Predictor Variables Coefficients t p-value TTPTflex G Constant
112 Peak Anterior-Posterior Ground Reaction Force The candidate models at each of the jump distances for peak anterior-posterior ground reaction force are shown in Table 12. No independent variables were retained in the model at a jump distance of 20% body height. TTPTflex was retained for the model at distance of 40% and 60%, but neither model was statistically significant. At a jump distance of 80% body height, TTDPMext, TTDPMflex, PText and TTPTflex (group 2) were retained in the model, however, the overall model was not statistically significant. Peak anterior-posterior ground reaction force did not have a significant linear relationship with the examined sensorimotor characteristics of the knee. No significant outliers or leverage points were detected using residual or Cooks D analysis. Table 12. Peak Anterior-Posterior Ground Reaction Force Multiple Linear Regression Results (A) Anterior-Posterior GRF at 40% Source SS df MS Observations 53 Model F (1, 2) 1.83 Residual Prob > F Total R Adjusted R MSE Predictor Variables Coefficients t p-value TTPTflex G Constant (B) Anterior-Posterior GRF at 60% Source SS df MS Observations 53 Model F (1, 2) 3.41 Residual Prob > F Total R Adjusted R MSE Predictor Variables Coefficients t p-value TTPTflex G Constant
113 Table 12 (Continued) (C) Anterior-Posterior GRF at 80% Source SS df MS Observations 51 Model F (1, 2) 1.63 Residual Prob > F Total R Adjusted R MSE Predictor Variables Coefficients t p-value TTDPMext TTDPMflex PTflex TTPTflex G Constant Knee Flexion at Initial Contact Multiple regression models created for knee flexion at initial contact were significant at each jump distance (Table 13). Sensorimotor characteristics TTDPMext, TTDPMflex, TTDPM, and TTPTflex (group 3) significantly accounted for 26.84% of the variance of knee flexion at initial contact at a jump distance of 20% body height (p = ). Only TTPTflex (group 3) was retained at a jump distance of 40% body height but significantly accounted for 8.16% of the variance of knee flexion at initial contact (p = ). TTDPMflex and TTPTflex (group 3) significantly accounted for 18.65% of the variance of knee flexion at initial contact at a jump distance of 60% body height (p = ). Lastly, TTDPMext, PText and TTPText significantly accounted for 26.72% of the variance of knee flexion at initial contact at a jump distance of 80% body height (p = 0.002). Variance inflation factors (VIFs) ranged from 1.00 to 5.13 showing no signs of multicollinearity in the final model. The residuals of all four models show no obvious 97
114 deviation from normality (Appendix I.3). No significant outliers or leverage points were detected using residual or Cooks D analysis. Final Models: Knee flexion at initial contact at 20% jump distance = 0.992(TTDPMext) (TTDPMflex) (TTPTflexG3) Knee flexion at initial contact at 40% jump distance = (TTPTflexG3) Knee flexion at initial contact at 60% jump distance = (TTDPMflex) (TTPTflexG3) Knee flexion at initial contact at 80% jump distance = (TTDPMext) (TTPText) (PText) Table 13. Knee Flexion at Initial Contact Multiple Linear Regression Results (A) Knee Flexion at Initial Contact at 20% Source SS df MS Observations 53 Model F (1, 2) 5.99 Residual Prob > F Total R Adjusted R MSE Predictor Variables Coefficients t p-value TTDPMext TTDPMflex TTPTflex G Constant
115 Table 13 (Continued) (B) Knee Flexion at Initial Contact at 40% Source SS df MS Observations 53 Model F (1, 2) 4.53 Residual Prob > F Total R Adjusted R MSE Predictor Variables Coefficients t p-value TTPTflex G Constant (C) Knee Flexion at Initial Contact at 60% Source SS df MS Observations 53 Model F (1, 2) 5.73 Residual Prob > F Total R Adjusted R MSE Predictor Variables Coefficients t p-value TTPTflex G TTDPMflex Constant (D) Knee Flexion at Initial Contact at 80% Source SS df MS Observations 51 Model F (1, 2) 5.71 Residual Prob > F Total R Adjusted R MSE Predictor Variables Coefficients t p-value TTDPMext PText TTPText Constant
116 Knee Abduction at Initial Contact None of the multiple linear regression models at any jump distance retained any of the sensorimotor characteristics Peak Knee Flexion Multiple regression models created for peak knee flexion were significant only at 40% and 80% body height (Table 14). PText significantly accounted for 8.44% of the variance of knee flexion at initial contact at a jump distance of 20% body height (p = ). PText was also the only independent variable retained at 80% body height and accounted for 7.81% variance in peak knee flexion (p = ). The residuals from jump distances of 40%, 60%, and 80% showed no obvious deviation from normality but residuals at 20% may have been problematic (Appendix I.4). Transformation of peak knee flexion was performed using the reciprocal (1/peak knee flexion) (Appendix I.4). However, multiple linear regression model results from the transformed dependent variable did not change the results of the original data. Therefore, final models were constructed using the original dependent variable data. No significant outliers or leverage points were detected using residual or Cooks D analysis. Final Models: Peak knee flexion at 40% jump distance = (PText) Peak knee flexion at 80% jump distance = (TTDPMext)
117 Table 14. Peak Knee Flexion Multiple Linear Regression Results (A) Peak Knee Flexion at 20% Source SS df MS Observations 53 Model F (1, 2) 3.95 Residual Prob > F Total R Adjusted R MSE Predictor Variables Coefficients t p-value PText Constant (B) Peak Knee Flexion at 40% Source SS df MS Observations 53 Model F (1, 2) 4.7 Residual Prob > F Total R Adjusted R MSE Predictor Variables Coefficients t p-value PText Constant (C) Peak Knee Flexion at 60% Source SS df MS Observations 53 Model F (1, 2) 1.72 Residual Prob > F Total R Adjusted R MSE Predictor Variables Coefficients t p-value PText Constant
118 Table 14 (Continued) (D) Peak Knee Flexion at 80% Source SS df MS Observations 51 Model F (1, 2) 4.15 Residual Prob > F Total R Adjusted R MSE Predictor Variables Coefficients t p-value TTDPMext Constant Peak Knee Abduction Linear regression models for peak knee abduction retained no independent variables at any jump distance Peak Knee Abduction Moment Multiple linear regression model outputs from all jump distances except 80% body height were significant. At a jump distance of 20% body height TTPTflex (group 2) was the only independent variable retained and accounted for 11.31% on the variance of peak knee abduction moment (p = ). At a jump distance of 40% body height, TTDPMext, TTDPMflex, and TTPTflex (group 2) accounted for 21.67% of the variance of peak knee abduction moment (p = ). TTDPMext, TTDPMflex, and TTPTflex (group 2) were also retained at 60% body height but only accounted for 16.44% of the variance of peak knee abduction moment (p = ). VIFs ranged from 1.00 to 5.22 showing no obvious signs of multicollinearity. However, histograms of the residuals at 80% body height did seem to significantly skew to the right (Appendix I.7). This deviation from normality was identified as a potential problem earlier and transformations to the 102
119 square root of peak knee abduction moment were performed and shown in Table 16. These models did not change the results of what independent variables were retained but it did result in lower MSE values and the model at 80% body height was significant. Additionally, the residuals at all four distances of the transformed models showed no obvious deviation from normality (Appendix I.7). Therefore, the final models were constructed using the results from the square root of peak knee abduction moment. Further analysis of potential outliers and leverage points using residual scatterplot analysis and Cook s D revealed that the final model at a jump distance of 60% body height did have a significant outlier. Robust regression model was run using the same predictor variables. This model still showed a significant relationship (R 2 = adjusted R 2 = , p = ) Final Models: Square root (peak knee abduction moment) at 20% jump distance = (TTPTflexG2) Square root (peak knee abduction moment) at 40% jump distance = (TTDPMext) (TTDPMflex) (TTPTflexG2) Square root (peak knee abduction moment) at 60% jump distance = (TTDPMext) (TTDPMflex) (TTPTflexG2) Square root (peak knee abduction moment) at 60% jump distance (Robust Regression) = (TTDPMext) (TTDPMflex) (TTPTflexG1) (TTPTflexG2) Square root (peak knee abduction moment) at 80% jump distance = (TTPTflexG2)
120 Table 15. Peak Knee Abduction Moment Multiple Linear Regression Results (A) Peak Knee Abduction Moment at 20% Source SS df MS Observations 53 Model F (1, 2) 6.5 Residual Prob > F Total R Adjusted R MSE Predictor Variables Coefficients t p-value TTPTflex G Constant (B) Peak Knee Abduction Moment at 40% Source SS df MS Observations 53 Model F (1, 2) 4.52 Residual Prob > F Total R Adjusted R MSE Predictor Variables Coefficients t p-value TTDPMext TTDPMflex TTPTflex G Constant (C) Peak Knee Abduction Moment at 60% Source SS df MS Observations 53 Model F (1, 2) 3.21 Residual Prob > F Total R Adjusted R MSE Predictor Variables Coefficients t p-value TTDPMext TTDPMflex TTPTflex G Constant
121 Table 15 (Continued) (D) Peak Knee Abduction Moment at 80% Source SS df MS Observations 51 Model F (1, 2) 1.93 Residual Prob > F Total R Adjusted R MSE Predictor Variables Coefficients t p-value TTPTflex G Constant Table 16. Peak Knee Abduction Moment (Square Root) Multiple Linear Regression Results (A) Peak Knee Abduction (Square Root) at 20% Source SS df MS Observations 53 Model F (1, 2) 6.31 Residual Prob > F Total R Adjusted R MSE Predictor Variables Coefficients t p-value TTPTflex G Constant (B) Peak Knee Abduction (Square Root) at 40% Source SS df MS Observations 53 Model F (1, 2) 6.99 Residual Prob > F Total R Adjusted R MSE Predictor Variables Coefficients t p-value TTDPMext TTDPMflex TTPTflex G Constant
122 Table 16 (Continued) (C) Peak Knee Abduction (Square Root) at 60% Source SS df MS Observations 53 Model F (1, 2) 4.17 Residual Prob > F Total R Adjusted R MSE Predictor Variables Coefficients t p-value TTDPMext TTDPMflex TTPT G Constant (D) Peak Knee Abduction (Square Root) at 80% Source SS df MS Observations 51 Model F (1, 2) 4.3 Residual Prob > F Total R Adjusted R MSE Predictor Variables Coefficients t p-value TTPTflex G Constant Peak Proximal Anterior Tibial Shear Force Multiple linear regression models constructed for peak proximal anterior tibial shear force did not result in any significant models at any jump distance (Table 17). Histograms were constructed for each of these models to examine the residuals but there was no obvious sign of deviation from normality (Appendix I.8). No significant outliers or leverage points were detected using residual or Cooks D analysis. 106
123 Table 17. Peak Proximal Anterior Tibial Shear Force Multiple Linear Regression Results (A) Peak PATSF at 20% Source SS df MS Observations 53 Model F (1, 2) 1.72 Residual Prob > F Total R Adjusted R MSE Predictor Variables Coefficients t p-value PTflex Constant (B) Peak PATSF at 40% Source SS df MS Observations 53 Model F (1, 2) 2.36 Residual Prob > F Total R Adjusted R MSE Predictor Variables Coefficients t p-value PTflex Constant (C) Peak PATSF at 60% Source SS df MS Observations 53 Model F (1, 2) 2.71 Residual Prob > F Total R Adjusted R MSE Predictor Variables Coefficients t p-value PTflex Constant
124 Table 17 (Continued) (D) Peak PATSF at 80% Source SS df MS Observations 51 Model F (1, 2) 3.72 Residual Prob > F Total R Adjusted R MSE Predictor Variables Coefficients t p-value TTPTflex G Constant
125 5.0 DISCUSSION Current research suggests that similar tasks completed with different demands (i.e. jump distance) result in significantly different biomechanical characteristics during landing. 91 Therefore, there is a need to investigate the relationship between jump distance and biomechanical ACL risk factors to determine specific demands that are more relevant and biomechanically sensitive to specific landing characteristics. The purpose of this study was to assess the effect of jump distance on biomechanical risk factors for ACL injury and examine how the relationship between sensorimotor system characteristics and landing biomechanics change throughout jump distances. Hypothesis 1: As jump distance increases the demand during landing will also increase, as expressed by a significant increase in vertical and posterior ground reaction forces. Secondly, as jump distance and landing demand increase there will also be a significant increase in the expression of ACL risk factors (increased peak knee abduction angle, knee abduction angle at initial contact, knee abduction moment, peak vertical and posterior ground reaction forces, and proximal anterior tibial shear force) and changes in knee joint loading patterns (increased peak knee flexion peak and knee flexion at initial contact, knee flexion moment, and proximal anterior tibial shear force). Lastly, it was hypothesized that as jump distance and landing demand increase muscle activation of the quadriceps and hamstrings during both preactivity and reactivity will also increase. 109
126 Hypothesis 2: Threshold to detect passive motion, time to peak torque, and peak torque will each independently contribute to the variance seen in knee flexion and abduction angles at initial contact, peak knee flexion and abduction angles, peak knee flexion moment, peak abduction moment, and peak proximal anterior tibial shear force. It was also hypothesized that threshold to detect passive motion, time to peak torque, and peak torque will together significantly contribute to the variance seen in knee flexion and abduction angles at initial contact, peak knee flexion and abduction angles, peak knee flexion moment, peak abduction moment, and peak proximal anterior tibial shear force. 5.1 SUBJECT CHARACTERISTICS The subject recruitment aim of this study was to recruit healthy females with a variety of activity levels. Based on the reporting results from the Tegner activity scale this aim was successful. Subjects reported activity levels between three and nine reflecting low to very high activity levels related to the knee. Most commonly, previous studies investigating contributing factors to ACL injuries have focused on female team sports or a general healthy population. 31,177,214,215 The current population is similar to previous studies investigating landing biomechanics related to female ACL injury. 194,216,217 The only other study that has investigated the relationship between landing kinematics and sensorimotor characteristics at the knee used healthy male subjects
127 5.2 LANDING BIOMECHANICS DURING LANDING Landing biomechanics were collected during a double-leg stop-jump task at four different jump distances. Peak ground reaction forces, knee kinematics and knee kinetics were collected during the initial landing phase of the stop-jump maneuver. Knee flexion and abduction angles were also collected at the time of initial contact with the force platform Peak Vertical and Anterior-Posterior Ground Reaction Forces The average peak vertical ground reaction force seen in this study ranged from 192.3% to 303.6% body weight across the four different jump distances. Average peak anterior-posterior ground reaction forces ranged between 42.1% and 84.2% body weight. A study by Sell et al. 33 examined the effect of stop-jump direction on landing biomechanics and found fairly similar results dependent on jumping direction. Peak vertical ground reaction forces ranged from 145% to 292% body weight and peak anterior-posterior ground reaction forces ranged from 24% to 38% body weight. 33 Although vertical ground reaction forces and anterior-posterior ground reaction forces were higher in the current study, increased jump distance used in the current study likely produced increased landing demand and thus increased vertical and anterior-posterior ground reaction forces. The study by Sell et al. 33 used a constant jump distance of 40% body height whereas this study increased jump distance from 20% to 80% body height, effectively increasing landing intensity. A study by Norcross et al. 71 reported average peak vertical ground reaction forces during a double-leg drop-jump of 286% to 294% body weight. 71 These values are on the higher end compared to the range that the current study observed. However, the drop-jump task involves the subject beginning by jumping off of a 30-cm high box that is placed at 50% of the 111
128 subject s body height away from the landing area. 71 This increased height likely instills a higher vertical landing demand. Average peak anterior-posterior ground reaction forces were seen up to 96% body weight, higher than the anterior-posterior ground reaction forces seen in the current study. 71 This increase in anterior-posterior ground reaction force is also likely a result of the same mechanism Knee Flexion at Initial Contact The current study observed a range of average knee flexion angles at initial contact of 24 to 26. These values are consistent with what has previously been reported in the literature in an active female population. 42,71 Norcross et al. 71 reported values of 23 during a double-leg drop-jump maneuver in females. 71 Yu et al. 42 reported knee flexion at initial contact values of during a similar task as the one used in the current study. 42 The stop-jump protocol in Yu et al. 42 used a three step approach where the current study used a single broad-jump approach. 42 However, using this same landing protocol and a similar population that research group found only slightly different results. In 2007 Chappel et al. 31 reported that recreationally active females landed with 17 of knee flexion at initial contact using this three step approach stop-jump maneuver Knee Abduction at Initial Contact The current study found that knee abduction angles at initial contact in a healthy recreationally active female population were between -4.3 and This negative abduction value represents an average adduction (varus) knee angle at initial contact. Previous research has mixed results regarding this variable. Norcross et al. 71 reported an average knee abduction angle between
129 and 7.7 (valgus). 71 This difference seen between the current study results and Norcross et al. 71 may be partially due to differences in data collection and biomechanical model methodology. The current study utilized a camera-based motion analysis system and the Plug-in-Gait biomechanical model with an Euler angle decomposition sequence of XYZ. Norcross et al. 71 used electromagnetic tracking and motion monitor with different Euler angle sequence (YXZ), calculating the motion in the frontal plane first. 71 Additionally, the task employed by Norcross et al. 71 was a drop-jump task. This combination of task difference and differences in the biomechanical modeling may explain the difference seen between these results. Chappell et al. 31 used a more similar task and biomechanical model and reported similar knee abduction angles at initial contact (-5.0 ) Peak Knee Flexion The current study found that average peak knee flexion ranged from 79.4 to 89.7 between the different jump distances. These values are similar to those reported in previous studies. Norcross et al. 71 reported average peak knee flexion values during a drop jump, ranging from 87.9 to However, studies by Sell et al. 33 and Yu et al. 42 reported lower average peak knee flexion values (62.9 to 78.9 and 68.5 respectively). Additionally, Sell et al. 33 and Yu et al. 42 both used a stop-jump task, however, they did not control for the height of the initial jump. 33,42 The current study used a six-inch hurdle to ensure each subject was consistently jumping with a similar vertical height at each jump distance. This controlling factor may have produced more similar knee flexion responses to the drop-jump task used by Norcross et. al. 71 by ensuring a standard amount of vertical trajectory during the flight phase. 113
130 5.2.5 Peak Knee Abduction The current study found that females landed with a range of average peak knee abduction angle between -0.2 and 1.4, demonstrating a fairly neutral knee position during landing. However, this average neutral knee position varied by about 7 implying there were some subjects who landed in a knee abducted position (valgus) and some who landed in a knee adducted position (varus). Previous studies have reported average peak knee abduction values up to 18.1 degrees. 71 Sell et al. 33 used a similar stop-jump task and reported knee abduction angles ranging from 3.9 to 8.0 and Norcross et al. 71 reported average values ranging from 14.5 to ,71 Although the current study had subjects who exhibited similar knee abduction angles to Sell et al., 33 there were also subjects that demonstrated knee adduction angles that resulted in the central statistic being close to zero. Several aspects of the current study were different and may help explain this difference. The current study used a similar camera based system and biomechanical model as compared to Sell et al., 33 however the marker sets that were used were slightly different and even slight variations in the calculated knee coordinate system may account for the differences between these two studies. 33 Both marker sets are susceptible to knee axis rotation error due to thigh marker position. 218 The difference between the current study findings and those of Norcross et al. 71 was much greater. This larger difference may be partially explained by the data collection method differences (electromagnetic tracking vs. passive marker based) but the difference in the task used is likely the most prevalent cause. 71 Our laboratory has recently determined that differences in landing tasks can significantly alter landing mechanics, including peak knee abduction angle. 219 Lastly, the differences between previous research and the current study could be due to task-based instruction. In the current study, subjects were not urged to make sure their feet were separated so that each foot was in the center of the adjacent force platforms. Although 114
131 trials where each foot was not completely on the individual force platforms were discarded and recollected, instructions to separate feet during landing may unintentionally force the use of a wide stance during landing, which may result in a greater likelihood of increased knee abduction angles in subjects. The current study made every effort to not influence landing strategy through instructions Peak Knee Abduction Moment The current study found that females landed with an average peak knee abduction moment ranging from Nm/kg*m. These results were similar to the values reported by Hewett et al. 23 in their prospective risk factor analysis for ACL injuries. 23 Hewett et al. 23 reported average peak knee abduction moments of 15 Nm (0.41 Nm/kg*m) for the uninjured group and 35 Nm (0.97 Nm/kg*m) for the injured group. 23 At a jump distance of 20% body height subjects in the current study exhibited an average peak valgus moment that fell between the injured and uninjured group. The current study demonstrated an increase in average peak knee abduction moment to 1.4 Nm/kg*m as jump distance increased, higher than the average peak knee abduction moment reported for the injured group in the Hewett et al. 23 study. However, the higher value reported in the current study was expected because the current study used a jump distance up to 80% body height where Hewett et al. 23 used a jump distance of 50% body height during a drop-jump task. 23 Additionally, although the subjects who participated in the current study did not have a history of ACL injury, they were not assessed for injury risk. 115
132 5.2.7 Peak Proximal Anterior Tibial Shear Force Results from the current study found an average peak PATSF ranging from 82.5 to 85.8% body weight. This range is consistent with previous studies reporting peak PATSF in recreationally active females. 33,71 Between different jump directions Sell et al. 33 reported a range of peak PATSF of 75 to 111% body weight. 33 Norcross et al. 71 reported an average peak PATSF of 87% body weight and Yu et al. 42 reported 79% body weight as an average peak PATSF. 42,71 Although each of these studies had variances between the task used, peak PATSF remained fairly similar in a comparable population of recreationally active females. 5.3 MUSCLE ACTIVATION DURING LANDING Muscle activity of the vastus medialis, vastus lateralis, medial hamstring, and lateral hamstring was collected just prior to and directly after initial contact of the landing phase of the stop-jump maneuver. Muscle activity was collected during the 150ms time frame prior to landing (preactivity) and just after initial contact (reactivity) Quadriceps Activation The current study reported average preactivity of the vastus medialis muscle to be 12.2 to 21.3% MVIC*s. Average vastus medialis reactivity was found to be 55.5 to 60.4% MVIC*s. Average muscle preactivity of the vastus lateralis muscle was found to be % MVIC*s while average reactivity was % MVIC*s. Although preactivity values were similar, muscle 116
133 activation values for reactivity were much higher than the values reported by Sell et al. 33 (5.7% to 13.9% MVIC*s). 33 The difference between these results is likely due to three reasons. Sell et al. 33 began the 150ms window at the time of peak posterior ground reaction force whereas the current study started the reactivity window the time of initial contact with the force platform. 33 Secondly, the current study utilized much greater jump distance that caused higher demand during landing, likely leading to increased muscle activation to accommodate increased ground reaction forces during landing. Lastly, the current study used a visual target to ensure that each trial the subject performed a high effort (90% max vertical jump) during the countermovement jump, possibly inducing higher activation levels. A study by Sigward et al. 159 reported quadriceps muscle activation during landing to be 150% MVIC. 159 However, this study utilized a single-leg cutting task, requiring much more muscle activation to control the initial loading. 159 During a double-leg drop jump Shultz et al. 64 reported the average quadriceps preactivity to be 18% and reactivity to be 90% MVIC. 64 These values were much more comparable to the current study, likely due to a similar landing demand, however, ground reaction force values were not provided to compare Hamstrings Activation The current study reported average preactivity of the medial hamstring muscle as 7.7 to 12.8% MVIC*s. Average medial hamstring reactivity activity was 13.8 to 37.5% MVIC*s. Average preactivity of the lateral hamstring was found to be % MVIC*s while average reactivity was % MVIC*s. Again, similar differences between the current study results and previous literature can be seen. The current study reported much higher reactivity as compared to Sell et al. 33 who reported medial hamstring activation to the 6.8 to 8.1% MVIC*s
134 This difference is likely due to the same reasons described in the quadriceps muscle activation section above. Additionally, the study population used by Sell et al. 33 was younger (high-school basketball players). 33 It may be possible that with increased age and exposure to activity some adaptations may occur that affect muscle activation during landing. Shultz et al. 64 also reported similar results for the hamstrings at preactivity (18% MVIC) and reactivity (50% MVIC). 64 However, contrary to the finding in quadriceps activation, Sigward et al. 159 reported similar hamstring reactivity despite using a single-leg task (medial hamstrings = 40% MVIC and lateral hamstring = 55% MVIC). 159 This unexpected comparison may be due to the cutting task that was used by Sigward et al. 159 The task used in the current study may not have produced a stimulus that required increased hamstring activation similar to the increase in quadriceps activation. 5.4 SENSORIMOTOR CHARACTERISTICS Sensorimotor characteristics were collected using three different techniques. Proprioception was collected for knee extension and flexion using threshold to detect passive motion. Neuromuscular performance was collected using two techniques, time to peak torque and peak torque. These tests were collected in both knee extension and flexion at a constant angular velocity of 240 /s Threshold To Detect Passive Motion The current study found threshold to detect passive motion to be 2.48 toward knee extension and 1.75 toward knee flexion. A previous study by Lephart et al. 147 reported threshold to detect passive motion values in healthy active females to be 1.9 toward knee extension, similar but 118
135 lower than the current findings. 147 The current study used a speed of 0.25 /s where Lephart et al. 147 used a speed of 0.5 /s, which may account for the slight difference in findings. A study by Nagai et al. 148 reported threshold to detect passive motion using the same speed as the current study but only in males. 148 They reported values of 1.7 toward extension and 1.4 toward flexion. 148 Previous literature has suggested gender differences in proprioception which may explain these differences Time to Peak Torque The current study found time to peak torque to be ms toward knee extension and ms toward knee flexion. The only other study that has used a similar measurement protocol for time to peak torque or peak torque at 240 /s was Clark. 181 In this study time to peak torque toward flexion was reported to be 231.9ms for females. This is very similar to what was found in the current study. However, time to peak toward extension was not reported. The current study also found a categorical distribution of time to peak torque towards flexion that required transforming the data into a categorical variable with three distinct groups. There was a wide range of time to peak torque values toward flexion and the sensitivity of the machine may not have been high enough. However, the transformed data still allowed comparisons to be made across jump distances and its relation to biomechanical risk factors for ACL injury. 119
136 5.4.3 Peak Torque The current study found peak torque to be %body weight toward knee extension and %body weight toward knee flexion. To the author s best knowledge, this is the first study to report knee extension peak torque in healthy females at 240 /s. A study by Allison et al. 220 reported peak torque values at the knee to be and 93.0 %body weight toward extension and flexion, respectively. 220 However, the study by Allison et al. 220 used a much slower dynamometer speed (60 /s) 220 where the current study used 240 /s. Although it cannot be determine if these two cohorts of healthy females would have performed similarly using the same dynamometer speed, the muscle strength force-velocity relationship theory does help explain the discrepancy in peak torque values seen between the two studies. Previous literature using the same dynamometer speed is not available to directly compare the values reported, however, these peak torque measures reported in the current study are consistent with previous measures of peak torque within our laboratory. 5.5 HYPOTHESIS TESTING AND FINDINGS Effect of Jump Distance on Biomechanical Characteristics Related to ACL Injury The first aim of this study was to determine if biomechanical risk factors and characteristics related to ACL injury change as jump distance increases from twenty to eighty percent of the subject s body height. Measurement of biomechanical characteristics during landing tasks is a widely used technique for assessing potential risk for ACL injury 23,168 and exploring other 120
137 potential mechanistic relationships to the expressions of specific biomechanical characteristics. 31,70,216 Biomechanical evaluation can be a critical piece of injury prevention initiatives, specifically in the identification of risk factors 23,205 and assessing the effectiveness of an intervention at modifying these characteristics. 61,89,221 However, a critical piece of biomechanical assessments is the standardization of the task being analyzed. Our laboratory has demonstrated that simple variations in landing task parameters can significantly alter landing kinematics and kinetics. 219 t is not know if and/or how increased landing demand during the same task may change biomechanical characteristics related to ACL injury Hypothesis 1a: As jump distance increases the demand during landing will also increase as expressed by a significant increase in vertical and posterior ground reaction forces It was first hypothesized that by increasing jump distance during the double-leg stop-jump an incremental increase the landing demand would be seen. For the purpose of this study an increase in landing demand was characterized by an observed increase in peak vertical and/or anteriorposterior ground reaction force. Previous research has demonstrated that increases in ground reaction forces correspond to increases in knee joint moments and powers during landing. 216 Our hypothesis was supported by the results of the current study that showed increases in jump distances resulted in significant increases in both vertical and anterior-posterior ground reaction forces (Table 5). Figure 7a and 7b illustrate the incremental increase in peak ground reaction forces as jump distance increases from 20% to 80% body height. From 20% body height to 80% body height there was a 100% body weight increase in peak vertical ground reaction force and 42.1% increase in peak anterior-posterior ground reaction force. Sell et al. 91 reported similar a similar difference in peak anterior posterior ground reaction force from 20% to 80% body height 121
138 jump distance (283.8N to 661.5N, p < 0.001). 91 Sell et al. 91 were also able to report a significant linear relationship between peak anterior-posterior ground reaction force and jump distance (r = 0.682, p < 0.001). 91 Although not an increase in jump distance, Dickin et al. 216 reported significant increases in peak vertical ground reaction forces with increasing drop height during a drop-jump maneuver from 75% body weight at 0.3m to 116% body weight at 0.5 meters. 216 The incremental increase in ground reaction forces during landing demonstrates that the increase in jump distance during the double-leg stop-jump task used in the current study significantly increases landing demand for each 20% increase in jump distance. These findings support the current hypothesis and help to substantiate the following results because inferences on the overall aim of investigating the effect of increased landing demand on biomechanical characteristics would be impossible without first demonstrating that increased jump distance produced increased demand during landing Hypothesis 1b: As jump distance and landing demand increase there will also be a significant increase biomechanical characteristics related to ACL injury The second hypothesis of the current aim was that as jump distance increased, biomechanical characteristics that have been shown to be related to ACL injury would also increase. An increase in biomechanical characteristics related to ACL injury is defined as a change in magnitude of the characteristic in a direction thought to be associated with increase risk of ACL injury. Biomechanical characteristics related to ACL injury include knee abduction angle at initial contact, 23 peak knee abduction angle, 23 knee abduction moment, 23 peak vertical ground reaction force, 23,71 peak anterior-posterior ground reaction force, 152 and peak proximal anterior tibial shear force. 33,152 This hypothesis was partially supported by the results of the current study. 122
139 Both peak vertical and peak anterior posterior ground reaction forces demonstrated significant increases with increased jump distance. Results from the current study showed that there was a significant effect of jump distance on peak knee abduction angle (Table 5). Post-hoc results for peak knee abduction angle revealed no significant change between 20% and 40% body height or between 60% and 80% jump distance, however, there was a significant increase from 40% to 60% body height. Figure 7f illustrates this increase in peak knee abduction angle used at higher jump distances. Although there was a significant increase from the smallest jump distance to the largest jump distance the actual difference in peak knee abduction angle was only 1.7 and on average, subjects maintained a fairly neutral knee position across all four distances (-0.28, , 0.8, and 1.4 ). Knee abduction position at initial contact was not significantly affected by jump distance. Despite increase ground reaction forces subjects maintained the knee position at initial contact, not only in the frontal plane but also the sagittal plane. This suggests that as subjects were exposed to varying degrees of landing intensity their knee position at initial contact remained stable. In relation to the aims of this study, this finding may also suggest that comparison between knee positions at initial contact may be possible between studies that utilized different landing intensity. However, previous research has demonstrated that once the demand or goal of the task changes, lower extremity position is not consistent at initial contact. 219 The most predictive characteristic for future ACL injury is peak knee abduction moment during landing. 23 During jump distances of 60% body height or greater subjects in the current study landed with greater peak knee abduction moment than those in the injured group of a prospective risk factor study for ACL injuries. 23 Despite the consistent knee adduction angle at initial contact, and a neutral peak knee abduction position the results of the current study 123
140 demonstrated a significant effect of jump distance on peak knee abduction moment. Subjects in the current study went from a knee abduction moment that has been reported in healthy females to exceeding what a previous study demonstrated to be a risk factor for ACL injury, simply by increasing the intensity of the landing task. 23 A study by Myer et al. 222 found complimentary results that demonstrated the height of the subject s center of mass was predictive of peak knee abduction moment. 222 The higher the center of mass of the subject the higher the peak knee abduction moment experience during landing. 222 Although this study did not normalize jump distance or height, the relative demand did significantly contribute to the peak knee abduction moment experienced during landing. 222 This relates to the findings of the current study that found as jump distance increases so does the peak knee abduction moment during landing. Knee abduction moment, an identified risk factor of ACL injury, is significantly affected by landing intensity. There was no significant effect of jump distance on peak proximal anterior tibial shear force in the current study. Both Table 6 and Figure 7h illustrate how peak proximal anterior tibial shear force remained fairly consistent across jump distances. Although anterior-posterior ground reaction force increased with jump distance so did peak knee flexion. It is possible that subjects absorbed the ground reaction forces using increased knee flexion during landing, subjects and thus were able to maintain peak proximal anterior tibial shear force across jump distances. Previous studies have demonstrated the relationship between anterior-posterior ground reaction force and proximal anterior tibial shear force and the effect of increased knee flexion in the absorption of sagittal plane loading. 71,152 Jump distance and subsequent landing intensity has a significant effect on biomechanics related to ACL injury except for knee abduction angle at initial contact and peak proximal 124
141 anterior tibial shear force. Although the subjects in the current study did not exhibit risky kinematics during landing, the results clearly demonstrate that changes in landing intensity can significantly alter the magnitude of biomechanical characteristics related to ACL injury. Simply by changing the demand of the task used to evaluate biomechanical characteristics, subjects may be characterized differently as at risk or not at risk. These finding suggest that comparison between study results that utilize landing tasks of varying intensities or demand should be done with caution Hypothesis 1c: As jump distance and landing demand increase there will be significant changes in kinematic and kinetic measures related to knee joint loading The third hypothesis of the current aim was that as jump distance increases there would be a significant increase in knee kinematics and kinetics related to knee loading. For the purposes of this study, an increase in knee loading was characterized by an increase in peak knee flexion angle and at initial contact, and peak proximal anterior tibial shear force. This hypothesis was partially supported by the results of the current study. Results showed a significant effect of jump distance on peak knee flexion angle but not knee flexion angle at initial contact (Table 5). Post-hoc analysis showed a significant within subject increase of peak knee flexion between each jump distance increase. However, knee flexion at initial contact remained consistent across each of the jump distances. Although knee flexion excursion was not directly measured the increase in peak knee flexion angle with consistent knee flexion angle at initial contact corresponds to an increase in overall knee flexion excursion during landing as jump distance increases. Previous studies have demonstrated that increases in peak knee flexion with consistent knee flexion at initial contact result in increased loading and energy absorption during landing. 71,
142 As stated in the previous hypothesis discussion, increases in jump distances did not result in increases in peak proximal anterior tibial shear force. Peak proximal anterior tibial shear force remained similar across all jump distances. This estimated measure of directional knee force is thought to correspond to the forces applied in the direction of action of the ACL. 41 Perhaps subjects utilized the observed increase in knee flexion to absorb the increase in round reaction forces across jump distances, maintaining consistent proximal anterior tibial shear force. Previous studies have demonstrated that alterations in sagittal plain kinematics are associated with changes in proximal anterior tibial shear force. 71,152 Increases in jump distance have a significant effect on peak knee flexion angle and possibly knee flexion excursion but not on other knee loading characteristics such as peak proximal anterior tibial shear force. It is possible that this specific population (healthy adult female population) utilizes increased knee flexion to accommodate increased landing intensity. Another aspect of the task that may be important is the post-landing goal of a vertical jump to reach and touch a target. This countermovement task immediately following the landing may have contributed to the use of increased knee flexion during landing as a performance modulator. It is unknown if by removing the countermovement aspect of the task and asking subjects to land if these results would remain the same Hypothesis 1d: As jump distance and landing demand increase muscle activation of the quadriceps and hamstrings pre-landing and post-landing activity will also increase The fourth hypothesis of the current aim was that as jump distance increased there would also be an increase in quadriceps and hamstrings activation, both during preactivity and reactivity windows. This hypothesis was partially supported by the results of the current study. Jump 126
143 distance had a significant effect on all muscle activation characteristics, both preactivity and reactivity. Preactivity of both the quadriceps and hamstrings show a fairly linear increase with increasing jump distance (Figure 8a-d). Post-hoc analyses showed that both the quadriceps and hamstring muscles did not significantly increase from 20% body height to 40% body-height but each subsequent increase in jump distance after that did yield significant increases in preactivity of the quadriceps and hamstrings. Preactivity had increases from 20% to 80% body height of 8.1%, 6.1%, 4.3%, and 8.7% MVIC for the vastus lateralis, vastus medialis, medial hamstring, and lateral hamstring, respectively (p < 0.001). This systematic increase in both quadriceps and hamstring muscle activation may be the result of an increased preparatory co-activation strategy prior to landing. In the current study subjects were required to take at least one practice jump at each jump distance but could take as many as they would like. This familiarization with each jump distance, along with the task being planned in nature, may have been enough for subjects to develop a neuromuscular preparatory response for the task. Chappell et al. 31 investigated the preparatory response to landing and found that females had significantly greater quadriceps and hamstrings preactivity compared to males. 31 Although the current study only assessed this in females it appears that there may be a gender trend in preparatory muscle activation but it is unknown if males would have a similar preactivity response to jump distance as females. Overall there was again a significant effect of jump distance on quadriceps and hamstrings muscle activation reactivity. However, the results do not support the same linear relationship that was seen in the preactivity (Figure 8e-h). Interestingly, the jump distance of 40% body height elicited the greatest amount of muscle activation for the vastus medialis, medial hamstring, and lateral hamstring. A jump distance of 80% was greatest in the vastus lateralis, however, this 127
144 change was not statistically significant. Post-hoc analyses showed that the only significant differences in reactivity of all muscles were between jump distances of 20% and 60% body height. Vastus medialis and medial hamstring activation between jump distances of 20% and 80% body height were also significantly different. These results suggest that landings from shorter jump distances elicit significantly less muscle activation during landing than the longer distances. However, an unexpected finding was that the central tendency of the vastus medialis, medial hamstring, and lateral hamstring was the decrease in activation levels between jump distances of 60% and 80% body height. This may suggest that the subjects were no longer adjusting their neuromuscular response to landing above the demand of 60% body height jump distance. Increases in jump distance do have a significant effect on muscle activation strategies. This effect seems to be more linear in preactivity, however, reactivity measures were much more variable. Jump distances of 60% body height elicit the greatest increase in neuromuscular demand during landing. Regardless, comparison between studies that utilize tasks of different landing intensity or demand is not suggested Relationship between the sensorimotor system characteristics and landing biomechanics The second aim of this study was to determine if sensorimotor characteristics (proprioception, time to peak torque, and peak torque) can significantly predict the expression of biomechanical characteristics related to ACL injury and if this relationship changes with jump distance. The sensorimotor system is a critical component of performance and injury prevention because of its responsibility for the detection of joint perturbations and the execution of appropriate motor responses to execute tasks. 53,95,96 A previous study has suggested that there may be a relationship 128
145 between landing biomechanical characteristics and measures of the sensorimotor system, however, this study utilized only men. 148 Additionally, it is unknown how landing intensity affects this relationship. If the components of the sensorimotor system do have a significant influence on the landing biomechanics, then significant relationships should be observed across all jump distances Hypothesis 2a: Sensorimotor characteristics at the knee will each independently significantly contribute to the variance of biomechanical risk factors for ACL injury. The first hypothesis of the current aim and prerequisite for the second aim was that sensorimotor characteristics would have simple linear relationships and would independently explain the variability associated with biomechanical characteristics related to ACL injury. The results of the current study partially support this hypothesis. Sensorimotor characteristics had no significant correlation with either peak vertical ground reaction force or peak anterior-posterior ground reaction force (Table 11A-B). Additionally, there were no significant relationship between sensorimotor characteristics and ground reaction force measures using simple linear regression (Table 12A-B). Sensorimotor characteristics do not independently explain the variance of peak vertical or anterior-posterior ground reaction forces during landing at any of the four jump distances. Knee flexion angle at initial contact did show significant linear relationships with some sensorimotor characteristics across different jump distances. Threshold to detect passive motion and time to peak torque toward flexion both were significantly related to knee flexion at initial contact at jump distances of 20% to 60% body height. However, at 80% jump height, threshold to detect passive motion toward extension and flexion and peak torque toward extension and flexion were significantly related to knee flexion at initial contact. Simple linear regression showed 129
146 similar results. Threshold to detect passive motion toward flexion significantly explained 10.17% and 7.04% of the variance of knee flexion at initial contact at jump distances of 20% and 60% body height, respectively. Time to peak torque toward flexion also significantly explained 15.43% and 12.62% of the variance of knee flexion at initial contact at jump distances of 20% and 60% body height, respectively. No sensorimotor characteristics were able to significantly explain the variance of knee flexion at initial contact at a jump distance of 40% body height. At a jump distance of 80% body height, threshold to detect passive motion toward extension and flexion and time to peak torque toward extension and flexion significantly explained 17.49%, 15.78%, 10.50%, and 10.13%, respectively. The highest independent relationship with knee flexion at initial contact occurred at a jump distance of 80% body height. Nagai et al. 148 also found that better threshold to detect passive motion and higher peak torque accounted for a significant amount of the variance in knee flexion at initial contact. 148 Results also showed significant relationships between sensorimotor characteristics and peak knee flexion during landing. The only significant linear relationships with peak knee flexion were with peak torque toward extension at a jump distance of 40% body height and threshold to detect passive motion toward extension at 80% body height. These characteristics accounted for only 8.44% and 7.81% of the variance of peak knee flexion. Similarly, Nagai et al. 148 found that at a jump distance of 40% peak torque toward extension significantly accounted for 7.8% of the variance of knee flexion excursion. Although this study did not measure knee flexion excursion, the fact that this study demonstrated no significant change in knee flexion at initial contact, peak knee flexion would be related to total knee flexion excursion. 148 Additionally Shultz et al. 64 demonstrated that peak torque values were not independently related to knee flexion excursion during drop landings. 64 This discrepancy with the current study and Nagai et al. 148 may be due to 130
147 the task used as both the current study and Nagai et al. 148 used a stop-jump task at 40% body height. 148 Overall, sensorimotor characteristics do not seem to have a strong relationship with peak knee flexion used during landing, however the relationship is significant. Sensorimotor characteristics showed no significant linear relationship with frontal plane kinematics (knee abduction at initial contact and peak knee abduction) through either correlation or simple linear regression. To the author s best knowledge this is the first study to investigate the relationship between sensorimotor characteristics and frontal plane kinematics. The observed lack of independent linear relationship may be due to the evaluation of sensorimotor characteristics specific to sagittal plane knee motion and strength. As new research continues to establish a potential relationship between frontal plane knee motion with hip characteristics 223,224 it may be useful to evaluate this relationship using sensorimotor characteristic at the hip. Peak knee abduction moment was not normally distributed so a transformation was done to achieve normally distributed residuals. In the case of peak knee abduction moment the transformation that was successful was using the square root. However, despite normally distributed residuals, sensorimotor characteristics were not correlated to the original or the transformed dependent variables. Simple regression analyses resulted in the same findings. Sensorimotor characteristics did not account for a significant amount of the variance in the original or transformed peak knee abduction moment. Similar to peak knee abduction and at initial contact, the lack of relationship between sensorimotor characteristics may be partially due to the sagittal plane biased sensorimotor characteristics at the knee. The current study failed to demonstrate any significant linear relationship between sensorimotor characteristics and peak proximal anterior tibial shear force using correlations. Results also showed that individual sensorimotor characteristics were not able to account for a 131
148 significant amount of peak knee abduction moment, original or transformed. Although proximal anterior tibial shear force is specific to the sagittal plane, similar to the sensorimotor characteristics, previous research has demonstrated that posterior ground reaction force is the best predictor of proximal anterior tibial shear force. 152 The current study did not assess the correlation between these two variables, however sensorimotor characteristics did not significantly predict posterior ground reaction forces. Although a few biomechanical characteristics were not related to the individual characteristics, knee flexion at initial contact and peak knee flexion had a few significant relationships with individual sensorimotor characteristics. Further analyses using multiple linear regression allow the evaluation of a linear relationship between biomechanical characteristics and multiple sensorimotor characteristics Hypothesis 2b: Sensorimotor characteristics at the knee will together significantly contribute to the variance of biomechanical risk factors for ACL injury. The second hypothesis of the current aim was that sensorimotor characteristics would together explain a significant amount of variability associated with biomechanical characteristics related to ACL injury. The results of the current study partially support this hypothesis as some dependent variables showed no significant relationship with sensorimotor characteristics while others did. Multiple linear regression models for both peak vertical ground reaction force and peak anterior-posterior ground reaction force yielded no significant models. Considering these finding with those of the previous aim, the results suggest that sensorimotor characteristics are not related to peak ground reaction force measured during double leg stop-jumps. Multiple linear regression models did significantly predict knee flexion at initial contact at all four jump distances. Although models from each jump distance did not contain the same final 132
149 predictor variables there was a noticeable pattern that sensorimotor characteristics toward flexion were significant predictors at jump distances of 20%, 40%, and 60% body height. The most common prediction among these jump distance was time to peak torque toward flexion. Model results suggest that subjects with increased time to peak torque values utilize greater knee flexion at initial contact. At a jump distance of 20% body height, threshold to detect passive motion was also a significant predictor suggesting that subjects with more acute proprioception (less positional error) also used greater knee flexion at initial contact. The only other study examining the relationship between landing biomechanics and sensorimotor characteristics also found that threshold to detect passive motion toward flexion, with peak flexion torque, significantly accounted for 27.4% of the variance of knee flexion at initial contact. 148 Although the current study did not find peak torque toward flexion to be a significant predictor from jump distances of 20% - 60% body height, Nagai et al. 148 used a single-leg stop-jump task and male subjects. 148 However, contrary to findings at closer jump distances, results from the current study demonstrated sensorimotor characteristics directed toward extension significantly accounted for the variance of knee flexion at initial contact at a jump distance of 80% body height (R 2 = , MSE = 4.70). This model at 80% body height was the best model fit for knee flexion at initial contact based on R 2 and MSE values. This model demonstrated that more acute proprioception and greater peak toque toward extension resulted in greater knee flexion at initial contact. This is an interesting finding that may suggest that the challenge and focus of the sensorimotor system may shift during tasks of different difficulties. Multiple linear regression models for peak knee flexion resulted in significant findings for models of 40% and 80% jump distance. Sensorimotor characteristics did not account for a significant amount of variance at jump distance of 20% and 60% body height. At a jump distance 133
150 of 40% body height peak torque toward extension was able to account for 8.44% of the variance of peak knee flexion. At a jump distance of 80% body height, threshold to detect passive motion toward extension was able to account for 7.81% of the variance of peak knee flexion. Even when considering the MSE values (8.71 vs respectively) both models have a similar goodness of fit. These results suggested that sensorimotor characteristics directed toward extension are most related to peak knee flexion during landing. The study by Nagai et al. 148 also reported peak torque toward extension to be the only significant predictor of knee flexion excursion during landing. 148 The findings of the current study add that there may be a shift in sensorimotor characteristics demand and/or influence as landing demand increases. Multiple linear regression models were not able to significantly predict peak knee abduction angle or knee abduction angle at initial contact. Additionally, no significant relationships were identified with sensorimotor characteristic using simple regression or correlation. These results suggest that sensorimotor characteristics do not have a linear relationship with frontal plane knee motion at initial contact or peak values. As stated previously, this lack of relationship could be due to the sagittal plane bias sensorimotor measures used in this study. However, a previous study by Wild et al. 225 reported that adolescent females with lower hamstring strength (< 45 Nm) displayed significantly more peak knee abduction angles. 225 This prepubescent female sample was between the ages of 10 and 13 years of age where the current study used healthy adult females with a mean age of 23.2 and a ranged between 18 to 31 years of age. It may be that prepubescent females are at greater risk of utilizing these dangerous kinematic characteristics unlike the sample from the current study who demonstrated a mean peak knee abduction angle of 1.4 at a jump distance of 80% body height. Additionally, subjects in the current study demonstrated mean hamstring strength (peak torque toward flexion) of
151 %body weight where the average value reported in the study by Wild et al. 225 for lower hamstring strength was 1.17 %body weight, higher than the mean hamstring strength reported in the current study. 225 However, the study by Wild et al. 225 used a dynamometer speed of 180 /s, much slower than the speed used in the current study. Sensorimotor characteristics were able to account for a significant amount of the variance in peak knee abduction moment during all four jump distances. Time to peak torque toward flexion was a significant predictor in the final models at all four jump distances. This finding is consistent with findings reported by Myer et al. 222 who demonstrated that peak hamstring torque (peak torque toward flexion) was a significant predictor of knee abduction moment along with knee valgus motion, center of mass height and percent body fat. 222 The study by Myer et al. 222 used an isokinetic dynamometer speed similar to what was used in this current study (300 /s vs 240 / sec). At jump distances of 40% and 60% body height, threshold to detect passive motion, both toward extension and flexion, were also significant predictors of peak knee abduction moment. Based on the results of the current study it appears that at very close or very far distances only peak torque toward flexion significantly accounts for the variance of peak knee abduction moment. However, at mid distances both peak torque toward flexion and proprioceptive measure were predictive of peak knee abduction moment. It may be that landing intensities that are too low do not stimulate the neuromuscular control system enough to require significant input from all systems but intensities that are too great may overload the system and/or require greater contribution by strength components of the neuromuscular control system. This suggests that evaluation of the neuromuscular control system as it relates to its effect on peak knee abduction moment, a prospective risk factor for ACL injury, should be performed at landing intensities of mid range (between 40% and 60% body height for a double-leg stop-jump task). It is 135
152 still unknown if this relationship or application would hold true for other biomechanical evaluation tasks. Lastly, results from the current study demonstrated that sensorimotor characteristics did not account for a significant amount of variance seen in peak proximal anterior tibial shear force. A previous study by Sell et al. 152 performed an analysis to determine predictors of proximal anterior tibial shear force. 152 That study did not include any of the same variables that were included in this particular analysis of the current study but they were able to determine that peak posterior ground reaction force, knee flexion moment, knee flexion angle, vastus lateralis activation, and sex significantly accounted for 86.09% of the variance of peak proximal anterior tibial shear force. 152 These findings along with those of the current study suggest that proximal anterior tibial shear force is best predicted by factors that are concurrent to the specific landing mechanics (other kinematic and kinetic measures) rather than measures of the current state of neuromuscular control and muscle performance (proprioception, time to peak torque, and peak torque). 5.6 STUDY LIMITATIONS The current study has some limitations that are worth noting. First, the current study used a healthy adult female population and therefore the results cannot be extrapolated to an adolescent or prepubescent female population who may not have undergone the same maturation process at the currently used young adult population. We also cannot assume that male subjects would respond the same way to changes in landing intensity as females. Many studies have identified biomechanical differences and ACL injury risk factors between genders. 56,94,159,173,195,226,
153 Additionally, the population sampled in the current study was healthy and free from ACL injury. Athletes reported a variety of activity levels relative to the knee and they were not evaluated for risk of ACL injury, therefore we cannot make conclusions related to the specific effect landing intensity has on injury risk classification, nor was this the purpose of the current study. Similarly, the current study did not specifically recruit individuals with a deficit in sensorimotor system characteristics. The chosen task itself also introduces some limitations on the generalizability of the findings from the current study. First, previous research has demonstrated that different landing tasks elicit different biomechanical characteristics relative to the specific demand of the task. 33,75,219,228 Therefore, we cannot assume the same changes in biomechanical characteristics would occur if another task were used. However, the task used in the current study was specifically chosen because of its use in previous ACL injury risk factor studies 31,42,152,194 and because it has been demonstrated to elicit greater knee abduction angles and moments compared to single-leg tasks. 31,42,152,194 Another limitation relative to the jump landing task was that it was a planned task. Previous studies have identified that the addition of a reaction component to a landing task significantly affects landing biomechanics. 33,94,160 It is possible that if the subjects in the current study were exposed to a reaction component such as jump direction it may have modulated the effect of landing demand or may have altered the contributions of the sensorimotor system on landing biomechanics. Additionally, the curent study normalized the jump distance by body height because this practice is a very common method to normalize task demand between subjects. 23,33,42,71 However, this method does not account for individual abilities. As seen in the current study, two subjects were not able to perform a distance of 80% of their body height. Therefore, the landing intensity between subjects may not be perfectly consistent. This is not a 137
154 large concern in the current study because the current study utilized within subject analysis. However, studies using statistical analyses of the central statistic need to consider that adjusting the jump landing demand based on body height may result in different relative landing demands based on individual ability. Three measures of sensorimotor characteristics were used to investigate the relationship between the sensorimotor system and landing biomechanics associated with ACL injury. These included threshold to detect passive motion, time to peak torque, and peak torque. These measures are all specific to sagittal plane of motion, assessing a person s ability to detect and perform only in the sagittal plane. These measures were chosen because of their use in previous research that has identified the effect of ACL injury on the sensorimotor system. 117,119,144,148,180,181 Some recent research suggests that the hip may also be a contributor to biomechanical measures associated with ACL injury 223,224 and may warrant further investigation into sensorimotor characteristics at the hip to help explain frontal plane kinematics that were not explained by the sensorimotor characteristic in the current study. Lastly, the current study used a cross-sectional study design comparing biomechanical characteristics across different jump distances and between biomechanical and sensorimotor characteristics at a similar point in time. Results from this study cannot explain how time or fatigue may affect these relationships. The results of the relationship are relevant to each individual s current physical state. It is still unknown how changes in a person s physical state, such as fatigue, illness, or concurrent injury may affect these relationships. Previous research has demonstrated that physical state, such as fatigue, does significantly affect lower extremity landing biomechanics and sensorimotor characteristics. 216,
155 5.7 FUTURE RESEARCH Based on the finding of the current study there are a few considerations that future studies should explore. First, future studies need to determine standardized methods for assessing biomechanical risk factors for ACL injury during landing tasks. Additionally, these studies should seek to determine what is the optimal method to standardize jump landing tasks among individuals with varying landing ability, such as using a percentage of a person s maximum broad jump. Future studies should also look to investigate if and how individual changes in biomechanics and a person s adaptability across different landing demands may influence injury risk. Individuals with a more adaptive sensorimotor system to control risk factors for injury, such as peak knee abduction moment, across different demands may be at a reduced risk of injury. Lastly, the current study demonstrates a lack of relationship between the sensorimotor system characteristics that were measured and knee abduction angle, both at initial contact and peak angles. Future studies should investigate how sensorimotor characteristics at the hip, such as hip internal rotation, might better influence frontal plane landing biomechanics related to ACL injury. 5.8 CONCLUSION The purpose of this study was to determine the effects of jump distance on biomechanical risk factors for ACL injury and to examine the relationship between sensorimotor system characteristics and landing biomechanics throughout different jump distances. The results of this study demonstrated that increases in jump distance resulted in significant increases in landing demand and significant changes in landing biomechanics relevant to ACL injury. These findings 139
156 first illustrate that studies utilizing tasks with different demands cannot compare landing biomechanics or make inference to injury risk based on findings from studies that have utilized different task demands. Additionally, this suggests that researchers and clinicians need to determine a standardized approach to measure landing biomechanics for the assessment of injury risk that ensures similar demand within and between subjects. Lastly, the results of the current study illustrate that as landing demand (jump distance) changes the contributions of the sensorimotor system also change. Based on these findings it is suggested that double-leg stopjump tasks be performed at a jump distance of 40% - 60% body height. This range of distance did elicit biomechanical risk factors for ACL injury and sensorimotor characteristics were shown to have a significant contribution to these risk factors. Researchers and clinicians that attempt to use landing biomechanics to assess the integrity or function of the sensorimotor system as it relates to ACL injury risk or prevention need to be aware that sensorimotor system characteristics are most related to knee flexion at initial contact, peak knee flexion, and peak knee abduction moment and have the strongest relationship at mid-range landing demand. The contribution of the sensorimotor system is less related to these biomechanical characteristics at very short and very long jump distances. 140
157 APPENDIX A TEGNER ACTIVITY SCORE QUESTIONNAIRE 141

158 APPENDIX B HISTOGRAMS OF BIOMECHANICAL RISK FACTORS OF ACL INJURY B.1 PEAK VERTICAL GROUND REACTION FORCE 142


159 B.2 PEAK ANTERIOR-POSTERIOR GROUND REACTION FORCE B.3 KNEE FLEXION AT INITIAL CONTACT 143


160 B.4 KNEE ABDUCTION AT INITIAL CONTACT B.5 PEAK KNEE FLEXION 144


161 B.6 PEAK KNEE ABDUCTION B.7 PEAK KNEE ABDUCTION MOMENT 145

162 B.8 PEAK PROXIMAL ANTERIOR TIBIAL SHEAR FORCE 146


163 APPENDIX C BIVARIATE ANALYSIS: PAIRWISE SCATTER PLOTS C.1 SCATTER PLOTS OF TTDPMEXT VERSUS DEPENDENT VARIABLES FOR EACH JUMP DISTANCE 147
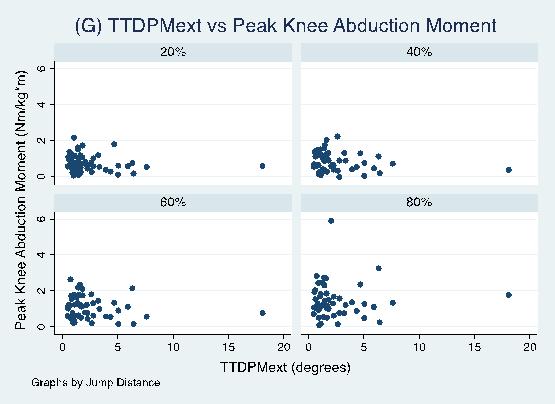
164 148

165 C.2 SCATTER PLOTS OF TTDPMFLEX VERSUS DEPENDENT VARIABLES FOR EACH JUMP DISTANCE 149


166 C.3 SCATTER PLOTS OF TTPTEXT VERSUS DEPENDENT VARIABLES FOR EACH JUMP DISTANCE 150


167 C.4 SCATTER PLOTS OF TTPTFLEX VERSUS DEPENDENT VARIABLES FOR EACH JUMP DISTANCE 151


168 C.5 SCATTER PLOTS OF PTEXT VERSUS DEPENDENT VARIABLES FOR EACH JUMP DISTANCE 152
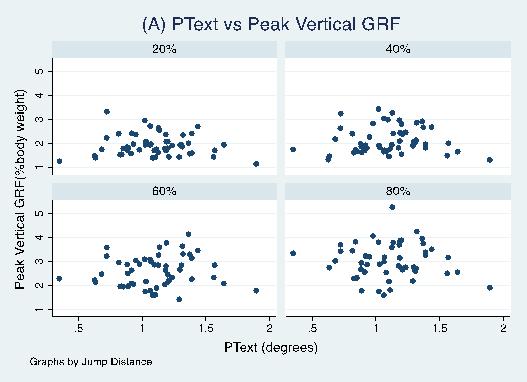
169 153


170 C.6 SCATTER PLOTS OF PTFLEX VERSUS DEPENDENT VARIABLES FOR EACH JUMP DISTANCE 154
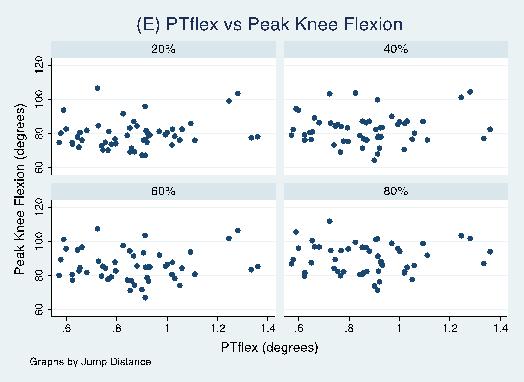
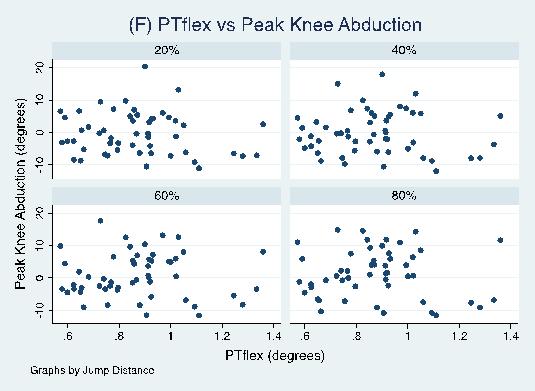
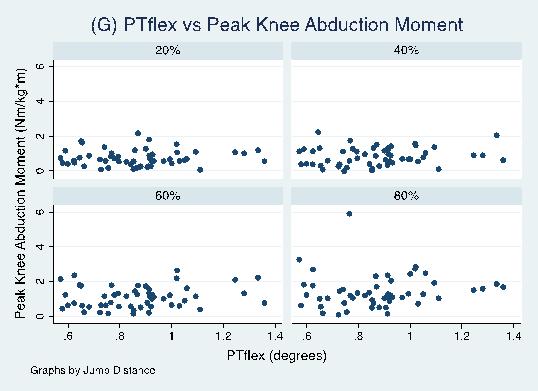
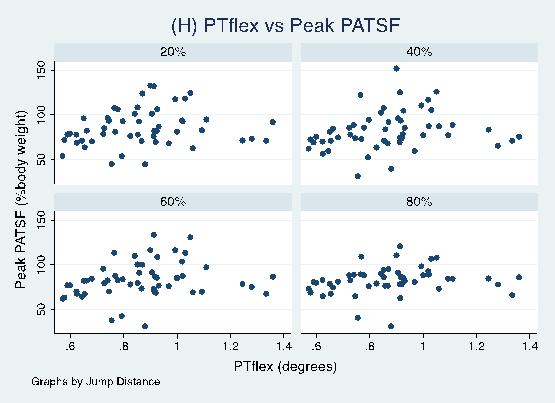
171 155
172 APPENDIX D BIVARIATE ANALYSIS: PAIRWISE CORRELATION RESULTS D.1 PEAK VERTICAL GRF VS. SENSORIMOTOR CHARACTERISTICS BY JUMP DISTANCE 20% Body Height 40% Body Height 60% Body Height 80% Body Height r p-value r p-value r p-value r p-value TTDPMext TTDPMflex TTPText TTPTflex PText PTflex
173 D.2 PEAK ANTERIOR-POSTERIOR GRF VS. SENSORIMOTOR CHARACTERISTICS BY JUMP DISTANCE 20% Body Height 40% Body Height 60% Body Height 80% Body Height r p-value r p-value r p-value r p-value TTDPMext TTDPMflex TTPText TTPTflex PText PTflex D.3 KNEE FLEXION AT INITIAL CONTACT VS. SENSORIMOTOR CHARACTERISTICS BY JUMP DISTANCE 20% Body Height 40% Body Height 60% Body Height 80% Body Height r p-value r p-value r p-value r p-value TTDPMext * TTDPMflex * * * TTPText TTPTflex * * * PText * PTflex * 157
174 D.4 KNEE ABDUCTION AT INITIAL CONTACT VS. SENSORIMOTOR CHARACTERISTICS BY JUMP DISTANCE 20% Body Height 40% Body Height 60% Body Height 80% Body Height r p-value r p-value r p-value r p-value TTDPMext TTDPMflex TTPText TTPTflex PText PTflex D.5 PEAK KNEE FLEXION VS. SENSORIMOTOR CHARACTERISTICS BY JUMP DISTANCE 20% Body Height 40% Body Height 60% Body Height 80% Body Height r p-value r p-value r p-value r p-value TTDPMext * TTDPMflex TTPText TTPTflex PText * PTflex
175 D.6 PEAK KNEE ABDUCTION VS. SENSORIMOTOR CHARACTERISTICS BY JUMP DISTANCE 20% Body Height 40% Body Height 60% Body Height 80% Body Height r p-value r p-value r p-value r p-value TTDPMext TTDPMflex TTPText TTPTflex PText PTflex D.7 PEAK KNEE ABDUCTION MOMENT VS. SENSORIMOTOR CHARACTERISTICS BY JUMP DISTANCE 20% Body Height 40% Body Height 60% Body Height 80% Body Height r p-value r p-value r p-value r p-value TTDPMext TTDPMflex TTPText TTPTflex PText PTflex
176 D.8 PEAK PATSF VS. SENSORIMOTOR CHARACTERISTICS BY JUMP DISTANCE 20% Body Height 40% Body Height 60% Body Height 80% Body Height r p-value r p-value r p-value r p-value TTDPMext TTDPMflex TTPText TTPTflex PText PTflex D.9 PEAK KNEE ABDUCTION MOMENT (SQUARE ROOT) VS. SENSORIMOTOR CHARACTERISTICS BY JUMP DISTANCE 20% Body Height 40% Body Height 60% Body Height 80% Body Height r p-value r p-value r p-value r p-value TTDPMext TTDPMflex TTPText TTPTflex PText PTflex Abbreviations: vertical ground reaction force (vgrf), anterior-posterior ground reaction force (apgrf), body weight (BW), initial contact (IC), abduction (ABD), abduction moment (ABDmom), proximal anterior tibial shear force (PATSF), threshold to detect passive motion toward extension (TTDPMext), threshold to detect passive motion toward flexion (TTDPMflex), time to peak torque toward extension (TTPText), time to peak torque toward flexion (TTPTflex), peak torque toward extension (PText), peak torque toward flexion (PT flex), Pearson's rho (r) * p <
177 APPENDIX E SIMPLE LINEAR REGRESSION: MODEL RESULTS 161
178 E.1 PEAK VERTICAL GRF MODELS BY JUMP DISTANCE n R 2 F (df1, df2) MSE p-value 20% Body Height TTDPMext (1, 51) TTDPMflex (1, 51) TTPText (1, 51) TTPTflex (1, 51) TTPTflex a (2, 50) PText (1, 51) PTflex (1, 51) % Body Height TTDPMext (1, 51) TTDPMflex (1, 51) TTPText (1, 51) TTPTflex (1, 51) TTPTflex a (2, 50) PText (1, 51) PTflex (1, 51) % Body Height 53 TTDPMext (1, 51) TTDPMflex (1, 51) TTPText (1, 51) TTPTflex (1, 51) TTPTflex a (2, 50) PText (1, 51) PTflex (1, 51) % Body Height TTDPMext (1, 49) TTDPMflex (1, 49) TTPText (1, 49) TTPTflex (1, 49) TTPTflex a (2, 48) PText (1, 49) PTflex (1, 49) a Grouped variable (three groups) 162
179 E.2 PEAK ANTERIOR-POSTERIOR GRF MODELS BY JUMP DISTANCE n R 2 F (df1, df2) MSE p-value 20% Body Height TTDPMext (1, 51) TTDPMflex (1, 51) TTPText (1, 51) TTPTflex (1, 51) TTPTflex a (2, 50) PText (1, 51) PTflex (1, 51) % Body Height TTDPMext (1, 51) TTDPMflex (1, 51) TTPText (1, 51) TTPTflex (1, 51) TTPTflex a (2, 50) PText (1, 51) PTflex (1, 51) % Body Height TTDPMext (1, 51) TTDPMflex (1, 51) TTPText (1, 51) TTPTflex (1, 51) TTPTflex a (2, 50) PText (1, 51) PTflex (1, 51) % Body Height TTDPMext (1, 49) TTDPMflex (1, 49) TTPText (1, 49) TTPTflex (1, 49) TTPTflex a (2, 48) PText (1, 49) PTflex (1, 49) a Grouped variable (three groups) 163
180 E.3 KNEE FLEXION AT INITIAL CONTACT MODELS BY JUMP DISTANCE n R 2 F (df1, df2) MSE p-value 20% Body Height TTDPMext (1, 51) TTDPMflex* (1, 51) TTPText (1, 51) TTPTflex* (1, 51) TTPTflex* a (2, 50) PText (1, 51) PTflex (1, 51) % Body Height TTDPMext (1, 51) TTDPMflex (1, 51) TTPText (1, 51) TTPTflex* (1, 51) TTPTflex a (2, 50) PText (1, 51) PTflex (1, 51) % Body Height TTDPMext (1, 51) TTDPMflex* (1, 51) TTPText (1, 51) TTPTflex* (1, 51) TTPTflex* a (2, 50) PText (1, 51) PTflex (1, 51) % Body Height TTDPMext* (1, 49) TTDPMflex* (1, 49) TTPText (1, 49) TTPTflex (1, 49) TTPTflex a (2, 48) PText* (1, 49) PTflex* (1, 49) a Grouped variable (three groups) 164
181 E.4 KNEE ABDUCTION AT INITIAL CONTACT MODELS BY JUMP DISTANCE n R 2 F (df1, df2) MSE p-value 20% Body Height TTDPMext (1, 51) TTDPMflex (1, 51) TTPText (1, 51) TTPTflex (1, 51) TTPTflex a (2, 50) PText (1, 51) PTflex (1, 51) % Body Height TTDPMext (1, 51) TTDPMflex (1, 51) TTPText (1, 51) TTPTflex (1, 51) TTPTflex a (2, 50) PText (1, 51) PTflex (1, 51) % Body Height TTDPMext (1, 51) TTDPMflex (1, 51) TTPText (1, 51) TTPTflex (1, 51) TTPTflex a (2, 50) PText (1, 51) PTflex (1, 51) % Body Height TTDPMext (1, 49) TTDPMflex (1, 49) TTPText (1, 49) TTPTflex (1, 49) TTPTflex a (2, 48) PText (1, 49) PTflex (1, 49) a Grouped variable (three groups), dummy coding was used for regression models 165
182 E.5 PEAK KNEE FLEXION MODELS BY JUMP DISTANCE n R 2 F (df1, df2) MSE p-value 20% Body Height TTDPMext (1, 51) TTDPMflex (1, 51) TTPText (1, 51) TTPTflex (1, 51) TTPTflex a (2, 50) PText (1, 51) PTflex (1, 51) % Body Height TTDPMext (1, 51) TTDPMflex (1, 51) TTPText (1, 51) TTPTflex (1, 51) TTPTflex a (2, 50) PText* (1, 51) PTflex (1, 51) % Body Height TTDPMext (1, 51) TTDPMflex (1, 51) TTPText (1, 51) TTPTflex (1, 51) TTPTflex a (2, 50) PText (1, 51) PTflex (1, 51) % Body Height TTDPMext* (1, 49) TTDPMflex (1, 49) TTPText (1, 49) TTPTflex (1, 49) TTPTflex a (2, 48) PText (1, 49) PTflex (1, 49) a Grouped variable (three groups) 166
183 E.6 PEAK KNEE ABDUCTION MODELS BY JUMP DISTANCE n R 2 F (df1, df2) MSE p-value 20% Body Height TTDPMext (1, 51) TTDPMflex (1, 51) TTPText (1, 51) TTPTflex (1, 51) TTPTflex a (2, 50) PText (1, 51) PTflex (1, 51) % Body Height TTDPMext (1, 51) TTDPMflex (1, 51) TTPText (1, 51) TTPTflex (1, 51) TTPTflex a (2, 50) PText (1, 51) PTflex (1, 51) % Body Height TTDPMext (1, 51) TTDPMflex (1, 51) TTPText (1, 51) TTPTflex (1, 51) TTPTflex a (2, 50) PText (1, 51) PTflex (1, 51) % Body Height TTDPMext (1, 49) TTDPMflex (1, 49) TTPText (1, 49) TTPTflex (1, 49) TTPTflex a (2, 48) PText (1, 49) PTflex (1, 49) a Grouped variable (three groups) 167
184 E.7 PEAK KNEE ABDUCTION MOMENT MODELS BY JUMP DISTANCE n R 2 Adj R 2* F (df1, df2) MSE p-value 20% Body Height TTDPMext (1, 51) TTDPMflex (1, 51) TTPText (1, 51) TTPTflex (1, 51) TTPTflex a (2, 50) PText (1, 51) PTflex (1, 51) % Body Height TTDPMext (1, 51) TTDPMflex (1, 51) TTPText (1, 51) TTPTflex (1, 51) TTPTflex a (2, 50) PText (1, 51) PTflex (1, 51) % Body Height TTDPMext (1, 51) TTDPMflex (1, 51) TTPText (1, 51) TTPTflex (1, 51) TTPTflex a (2, 50) PText (1, 51) PTflex (1, 51) % Body Height TTDPMext (1, 49) TTDPMflex (1, 49) TTPText (1, 49) TTPTflex (1, 49) TTPTflex a (2, 48) PText (1, 49) PTflex (1, 49) a Grouped variable (three groups) * Adjusted R2 reported to compare between raw and transformed data (E.10) 168
185 E.8 PEAK PATSF MODELS BY JUMP DISTANCE n R 2 F (df1, df2) MSE p-value 20% Body Height TTDPMext (1, 51) TTDPMflex (1, 51) TTPText (1, 51) TTPTflex (1, 51) TTPTflex a (2, 50) PText (1, 51) PTflex (1, 51) % Body Height TTDPMext (1, 51) TTDPMflex (1, 51) TTPText (1, 51) TTPTflex (1, 51) TTPTflex a (2, 50) PText (1, 51) PTflex (1, 51) % Body Height TTDPMext (1, 51) TTDPMflex (1, 51) TTPText (1, 51) TTPTflex (1, 51) TTPTflex a (2, 50) PText (1, 51) PTflex (1, 51) % Body Height TTDPMext (1, 49) TTDPMflex (1, 49) TTPText (1, 49) TTPTflex (1, 49) TTPTflex a (2, 48) PText (1, 49) PTflex (1, 49) a Grouped variable (three groups) 169
186 E.9 PEAK KNEE ABDUCTION MOMENT (SQUARE ROOT) BY JUMP DISTANCE n R 2 Adj R 2 F (df1, df2) MSE p-value 20% Body Height TTDPMext (1, 51) TTDPMflex (1, 51) TTPText (1, 51) TTPTflex (1, 51) TTPTflex a (2, 50) PText (1, 51) PTflex (1, 51) % Body Height TTDPMext (1, 51) TTDPMflex (1, 51) TTPText (1, 51) TTPTflex (1, 51) TTPTflex a (2, 50) PText (1, 51) PTflex (1, 51) % Body Height TTDPMext (1, 51) TTDPMflex (1, 51) TTPText (1, 51) TTPTflex (1, 51) TTPTflex a (2, 50) PText (1, 51) PTflex (1, 51) % Body Height TTDPMext (1, 49) TTDPMflex (1, 49) TTPText (1, 49) TTPTflex (1, 49) TTPTflex a (2, 48) PText (1, 49) PTflex (1, 49)
187 APPENDIX F SIMPLE REGRESSION: JACKKNIFE RESIDUAL VS FITTED VALUES PLOTS F.1 VERTICAL GROUND REACTION FORCE Peak Vertical Ground Reaction Force vs. TTDPMext 171

188 Peak Vertical Ground Reaction Force vs. TTDPMflex Peak Vertical Ground Reaction Force vs. TTPText 172


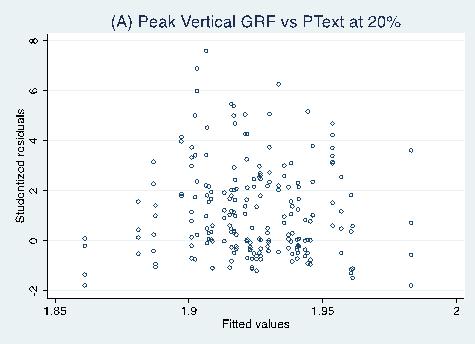
189 Peak Vertical Ground Reaction Force vs. TTPTflex Peak Vertical Ground Reaction Force vs. PText 173


190 Peak Vertical Ground Reaction Force vs. PTflex 174
191 F.2 ANTERIOR-POSTERIOR GROUND REACTION FORCE Peak Anterior-Posterior Ground Reaction Force vs. TTDPMext 175
192 Peak Anterior-Posterior Ground Reaction Force vs. TTDPMflex Peak Anterior-Posterior Ground Reaction Force vs. TTPText 176

193 Peak Anterior-Posterior Ground Reaction Force vs. TTPTflex Peak Anterior-Posterior Ground Reaction Force vs. PText 177

194 Peak Anterior-Posterior Ground Reaction Force vs. PTflex 178
195 F.3 KNEE FLEXION AT INITIAL CONTACT Knee Flexion at Initial Contact vs. TTDPMext 179

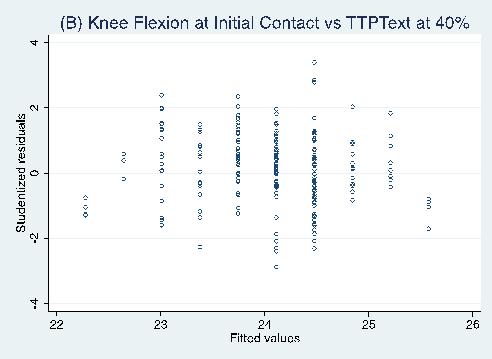
196 Knee Flexion at Initial Contact vs. TTDPMflex Knee Flexion at Initial Contact vs. TTPText 180


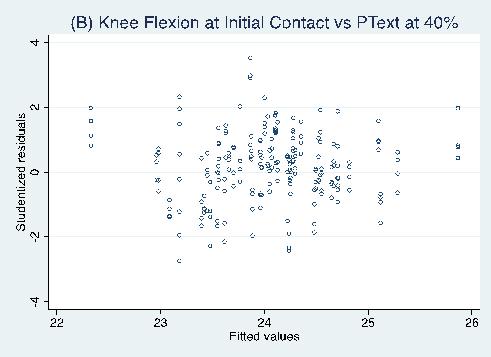
197 Knee Flexion at Initial Contact vs. TTPTflex Knee Flexion at Initial Contact vs. PText 181


198 Knee Flexion at Initial Contact vs. PTflex F.4 KNEE ABDUCTION AT INITIAL CONTACT Knee Abduction at Initial Contact vs. TTDPMext 182

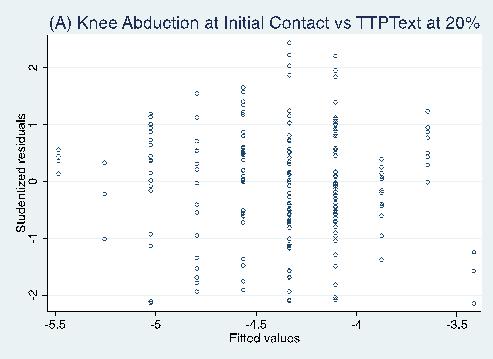
199 Knee Abduction at Initial Contact vs. TTDPMflex Knee Abduction at Initial Contact vs. TTPText 183


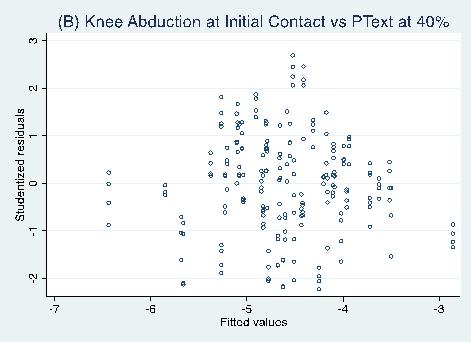
200 Knee Abduction at Initial Contact vs. TTPTflex Knee Abduction at Initial Contact vs. PText 184


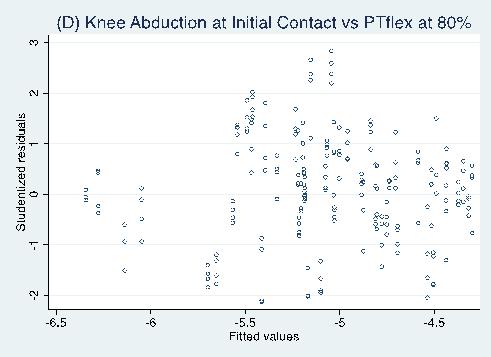
201 Knee Abduction at Initial Contact vs. PTflex 185
202 F.5 PEAK KNEE FLEXION Peak Knee Flexion vs. TTDPMext Peak Knee Flexion vs. TTDPMflex 186

203 Peak Knee Flexion vs. TTPText Peak Knee Flexion vs. TTPTflex 187


204 Peak Knee Flexion vs. PText Peak Knee Flexion vs. PTflex 188


205 F.6 PEAK KNEE ABDUCTION Peak Knee Abduction vs. TTDPMext 189
206 Peak Knee Abduction vs. TTDPMflex Peak Knee Abduction vs. TTPText 190


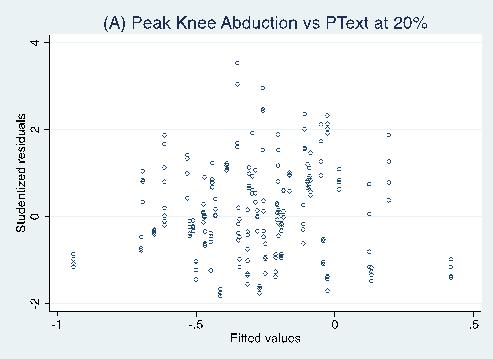
207 Peak Knee Abduction vs. TTPTflex Peak Knee Abduction vs. PText 191


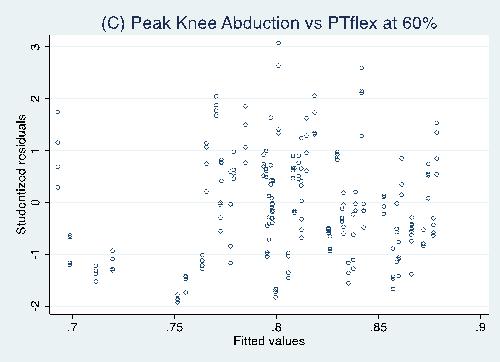
208 Peak Knee Abduction vs. PTflex 192


209 F.7 PEAK KNEE ABDUCTION MOMENT Peak Knee Abduction Moment vs. TTDPMext Peak Knee Abduction Moment vs. TTDPMflex 193


210 Peak Knee Abduction Moment vs. TTPText Peak Knee Abduction Moment vs. TTPTflex 194

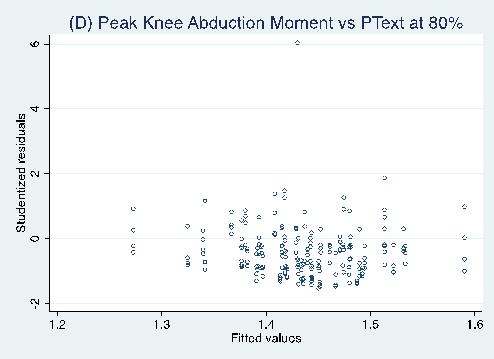
211 Peak Knee Abduction Moment vs. PText Peak Knee Abduction Moment vs. PTflex 195
212 196

213 F.8 PEAK PROXIMAL ANTERIOR TIBIAL SHEAR FORCE Peak Proximal Anterior Tibial Shear Force vs. TTDPMext Peak Proximal Anterior Tibial Shear Force vs. TTDPMflex 197

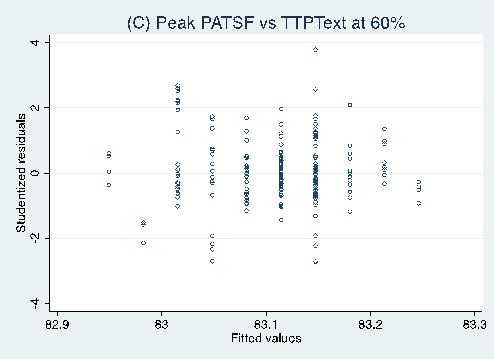
214 Peak Proximal Anterior Tibial Shear Force vs. TTPText Peak Proximal Anterior Tibial Shear Force vs. TTPTflex 198


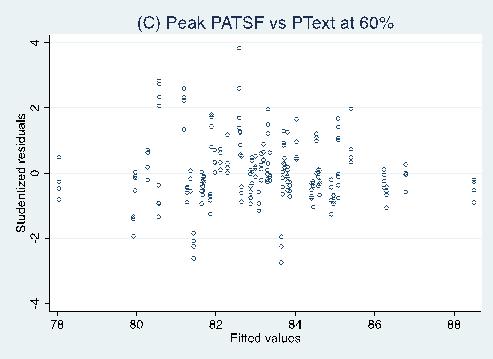
215 Peak Proximal Anterior Tibial Shear Force vs. PText Peak Proximal Anterior Tibial Shear Force vs. PTflex 199
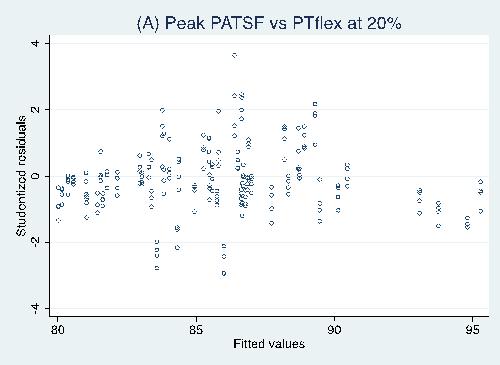
216 200
217 APPENDIX G ROBUST SIMPLE REGRESSION RESULTS 201
218 G.1 PEAK VERTICAL GROUND REACTION FORCE BY JUMP DISTANCE n R 2 Adj R 2 F (df1, df2) p-value 20% Body Height TTDPMext (1, 51) TTDPMflex (1, 51) TTPText (1, 51) TTPTflex (1, 51) TTPTflex a PText (1, 51) PTflex (1, 51) % Body Height TTDPMext (1, 51) TTDPMflex (1, 51) TTPText (1, 51) TTPTflex (1, 51) TTPTflex a PText PTflex % Body Height TTDPMext (1, 51) TTDPMflex (1, 51) TTPText (1, 51) TTPTflex (1, 51) TTPTflex a PText PTflex % Body Height TTDPMext (1, 49) TTDPMflex (1, 49) TTPText (1, 49) TTPTflex (1, 49) TTPTflex a PText PTflex a Grouped variable (three groups) Blank cells did not require robust regression analysis 202
219 G.2 PEAK ANTERIOR-POSTERIOR GROUND REACTION FORCE BY JUMP DISTANCE n R 2 Adj R 2 F (df1, df2) p-value 20% Body Height TTDPMext (1, 51) TTDPMflex (1, 51) TTPText (1, 51) TTPTflex (1, 51) TTPTflex a PText (1, 51) PTflex (1, 51) % Body Height TTDPMext (1, 51) TTDPMflex (1, 51) TTPText (1, 51) TTPTflex (1, 51) TTPTflex a PText (1, 51) PTflex (1, 51) % Body Height TTDPMext (1, 51) TTDPMflex (1, 51) TTPText TTPTflex (1, 51) TTPTflex a PText PTflex % Body Height TTDPMext (1, 49) TTDPMflex (1, 49) TTPText TTPTflex TTPTflex a PText PTflex a Grouped variable (three groups) Blank cells did not require robust regression analysis 203
220 G.3 KNEE FLEXION AT INITIAL CONTACT BY JUMP DISTANCE n R 2 Adj R 2 F (df1, df2) p-value 20% Body Height TTDPMext (1, 51) TTDPMflex (1, 51) TTPText TTPTflex TTPTflex a PText PTflex % Body Height TTDPMext (1, 51) TTDPMflex TTPText TTPTflex TTPTflex a PText PTflex % Body Height TTDPMext (1, 51) TTDPMflex (1, 51) TTPText TTPTflex TTPTflex a PText PTflex % Body Height TTDPMext (1, 49) TTDPMflex (1, 49) TTPText TTPTflex TTPTflex a PText PTflex a Grouped variable (three groups) Blank cells did not require robust regression analysis 204
221 G.4 PEAK KNEE ABDUCTION MOMENT BY JUMP DISTANCE n R 2 Adj R 2 F (df1, df2) p-value 20% Body Height TTDPMext (1, 51) TTDPMflex (1, 51) TTPText (1, 51) TTPTflex (1, 51) TTPTflex a PText (1, 51) PTflex (1, 51) % Body Height TTDPMext (1, 51) TTDPMflex (1, 51) TTPText TTPTflex (1, 51) TTPTflex a PText (1, 51) PTflex (1, 51) % Body Height TTDPMext (1, 51) TTDPMflex (1, 51) TTPText TTPTflex TTPTflex a PText PTflex % Body Height TTDPMext (1, 49) TTDPMflex TTPText TTPTflex TTPTflex a PText PTflex a Grouped variable (three groups) Blank cells did not require robust regression analysis 205
222 G.5 PEAK KNEE ABDUCTION MOMENT (SQUARE ROOT) BY JUMP DISTANCE n R 2 Adj R 2 F (df1, df2) p-value 20% Body Height TTDPMext (1, 51) TTDPMflex (1, 51) TTPText TTPTflex TTPTflex a PText PTflex % Body Height TTDPMext (1, 51) TTDPMflex (1, 51) TTPText TTPTflex TTPTflex a PText PTflex % Body Height TTDPMext (1, 51) TTDPMflex (1, 51) TTPText TTPTflex TTPTflex a PText PTflex % Body Height TTDPMext (1, 49) TTDPMflex (1, 49) TTPText TTPTflex TTPTflex a PText PTflex a Grouped variable (three groups) Blank cells did not require robust regression analysis 206

223 APPENDIX H MULTIPLE LINEAR REGRESSION: JACKKNIFE RESIDUALS VS. FITTED VALUES H.1 VERTICAL GROUND REACTION FORCE 207
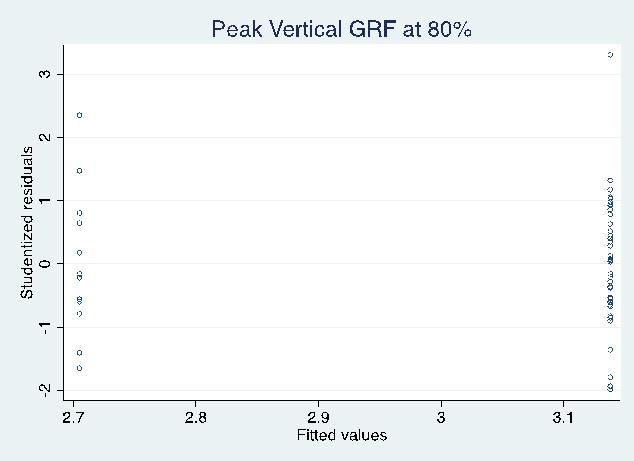
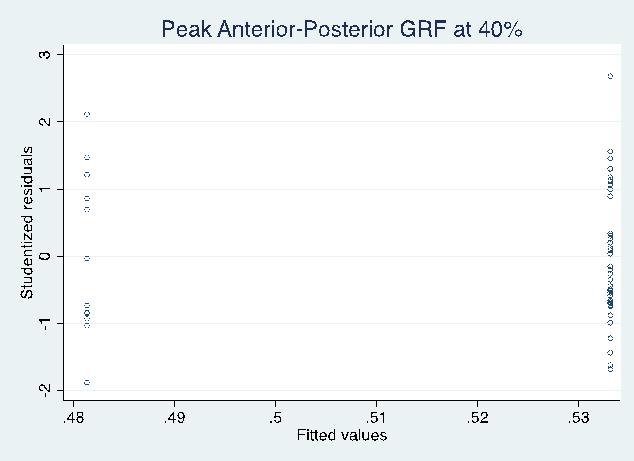
224 H.2 ANTERIOR-POSTERIOR GROUND REACTION FORCE 208

225 H.3 KNEE FLEXION AT INITIAL CONTACT 209
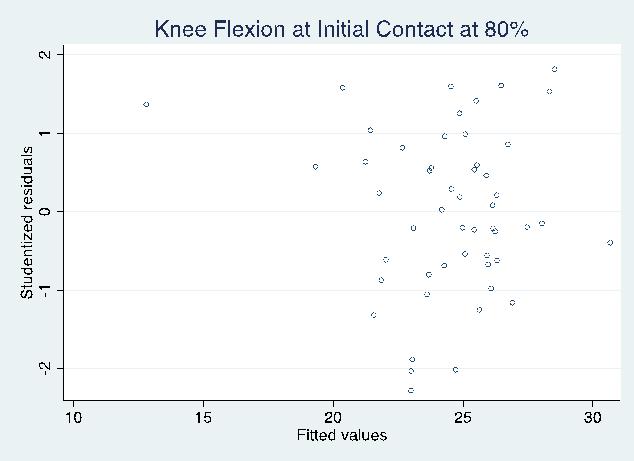
226 210

227 H.4 PEAK KNEE FLEXION 211

228 H.5 PEAK KNEE ABDUCTION MOMENT 212
229 213


230 H.6 PEAK KNEE ABDUCTION MOMENT (SQUARE ROOT) 214

231 H.7 PEAK PROXIMAL ANTERIOR TIBIAL SHEAR FORCE 215
232 216

233 APPENDIX I MULTIPLE LINEAR REGRESSION: JACKKNIFE RESIDUAL NORMALITY I.1 PEAK VERTICAL GROUND REACTION FORCE 217


234 I.2 PEAK ANTERIOR-POSTERIOR GROUND REACTION FORCE I.3 KNEE FLEXION AT INITIAL CONTACT 218

235 I.4 KNEE ABDUCTION AT INITIAL CONTACT No independent variables were retained in any of the linear regression models. I.5 PEAK KNEE FLEXION 219
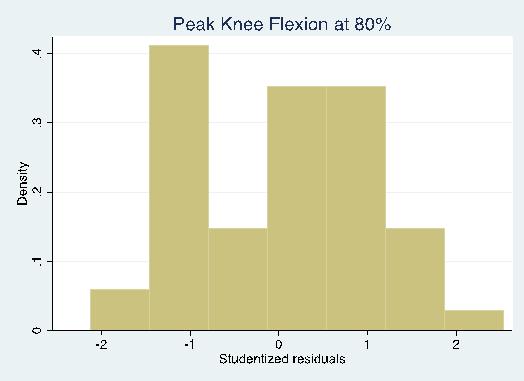
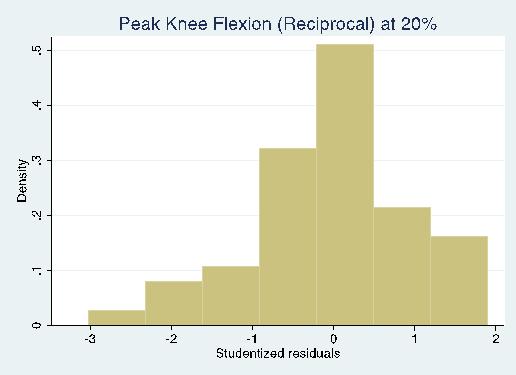
236 220


237 I.6 PEAK KNEE ABDUCTION No independent variables were retained in any of the linear regression models. I.7 PEAK KNEE ABDUCTION MOMENT 221


238 I.8 PEAK PROXIMAL ANTERIOR TIBIAL SHEAR FORCE 222
Rotational Dynamic Postural Stability Test. Megan Hufnagel. Submitted to the Graduate Faculty of the. University of Pittsburgh in partial fulfillment
 Rotational Dynamic Postural Stability Test by Megan Hufnagel Submitted to the Graduate Faculty of the University of Pittsburgh in partial fulfillment of the requirements for the degree of Bachelor of Philosophy
Mallory Sell Faherty. Bachelor of Science, The Ohio State University, Master of Science, University of Pittsburgh, 2013
 A DESCRIPTION OF LOWER EXTREMITY MUSCULOSKELETAL CHARACTERISTICS, INJURY, AND INJURY RISK FACTORS IN NCAA DIVISION I ATHLETES PARTICIPATING IN LOWER EXTREMITY DOMINANT SPORTS by Mallory Sell Faherty Bachelor
5/13/2016. ACL I Risk Factors AAP Position Statement. Anterior Cruciate Ligament Injuries: Diagnosis, Treatment and Prevention.
 ACL I Risk Factors AAP Position Statement Timothy E. Hewett, PhD 2016 Chicago Sports Medicine Symposium Chicago, Illinois August 5-7, 2016 2015 MFMER slide-1 Anterior Cruciate Ligament Injuries: Diagnosis,
DIFFERENCES IN THE MECHANICS BETWEEN THE DOMINANT AND NON-DOMINANT PLANT LIMB DURING INSTEP SOCCER KICKING. Cassidy M. Berlin.
 DIFFERENCES IN THE MECHANICS BETWEEN THE DOMINANT AND NON-DOMINANT PLANT LIMB DURING INSTEP SOCCER KICKING by Cassidy M. Berlin A thesis submitted in partial fulfillment of the requirements for the degree
ACL Rehabilitation and Return To Play
 ACL Rehabilitation and Return To Play Seth Gasser, MD Director of Sports Medicine Florida Orthopaedic Institute Introduction Return to Play: the point in recovery from an injury when a person is safely
Diane Vives, MS, CSCS, *D Owner, Fit4Austin, Austin, TX Member of the Board of Directors, NSCA
 Diane Vives, MS, CSCS, *D Owner, Fit4Austin, Austin, TX Member of the Board of Directors, NSCA 1. Introduction a. Through my experience as a strength coach over the last 11 years, I have often been faced
ACL and Knee Injury Prevention. Presented by: Zach Kirkpatrick, PT, MPT, SCS
 ACL and Knee Injury Prevention Presented by: Zach Kirkpatrick, PT, MPT, SCS ACL Anatomy ACL Mechanism of Injury Contact ACL Tear Noncontact ACL Tear ACL MOI and Pathology Common in young individual who
ACL Injury Prevention: Considerations for Children and Adolescents
 ACL Injury Prevention: Considerations for Children and Adolescents Susan Sigward PhD, PT, ATC Human Performance Laboratory University of Southern California 1 ACL Injury Season ending/ Career ending 82%
Re-establishing establishing Neuromuscular
 Re-establishing establishing Neuromuscular Control Why is NMC Critical? What is NMC? Physiology of Mechanoreceptors Elements of NMC Lower-Extremity Techniques Upper-Extremity Techniques Readings Chapter
When are athletes ready for return to sports??? Functional Testing for Return to Sports. Important Factors Involved in Return to Sport
 Functional Testing for Return to Sports Meg Jacobs PT Momentum Physical Therapy and Sports Rehab Mjacobs@wegetyouhealthy.com When are athletes ready for return to sports??? Post ACL reconstruction, average
Dynamic Trunk Control Influence on Run-to-Cut Maneuver: A Risk Factor for ACL Rupture
 Dynamic Trunk Control Influence on Run-to-Cut Maneuver: A Risk Factor for ACL Rupture By: Steve Jamison 1 INTRODUCTION Anterior cruciate ligament (ACL) rupture is one of the most common knee injuries for
THE RELATIONSHIP BETWEEN TWO TASKS OF DYNAMIC POSTURAL STABILITY. Beth Abbott. BS Athletic Training, University of Pittsburgh, 2010
 THE RELATIONSHIP BETWEEN TWO TASKS OF DYNAMIC POSTURAL STABILITY by Beth Abbott BS Athletic Training, University of Pittsburgh, 2010 Submitted to the Graduate Faculty of School of Health and Rehabilitation
CHANGES IN LOWER-LIMB MUSCLE FORCES WITH PROPHYLACTIC KNEE BRACING DURING LANDING AND STOP-JUMP TASKS
 CHANGES IN LOWER-LIMB MUSCLE FORCES WITH PROPHYLACTIC KNEE BRACING DURING LANDING AND STOP-JUMP TASKS Katie Ewing 1, Rezaul Begg 2, Peter Lee 1 Department of Mechanical Engineering, University of Melbourne,
Current trends in ACL Rehab. James Kelley, MDS, PT
 Current trends in ACL Rehab James Kelley, MDS, PT Objectives Provide etiological information Discuss the criteria for having an ACL reconstruction Review the basic rehabilitation principles behind ACL
Post Operative Knee Rehab: Return to Play after ACLR
 Post Operative Knee Rehab: Return to Play after ACLR Fall Session 2016 Mary Lloyd Ireland, M.D. Associate Professor University of Kentucky Dept. of Orthopaedic Surgery & Sports Medicine, Lexington, KY
Managing life s multi-tasking with kids; and the need for self care.
 Lessons on Staying in Shape After the Olympics While Working and being a Mom Deborah Saint-Phard, M.D. Director, CU Women's Sports Medicine Program at University of Colorado Hospital Associate Professor
HAMSTRING NEUROMECHANICAL PROPERTIES AND BIOMECHANICS IN AN ACL INJURED POPULATION. David Robert Bell
 HAMSTRING NEUROMECHANICAL PROPERTIES AND BIOMECHANICS IN AN ACL INJURED POPULATION David Robert Bell A dissertation submitted to the faculty of the University of North Carolina at Chapel Hill in partial
Mechanisms of ACL Injury: Implications for Rehabilitation, Injury Prevention & Return to Sport Decisions. Overarching research theme:
 Mechanisms of ACL Injury: Implications for Rehabilitation, Injury Prevention & Return to Sport Decisions Associate Professor Co Director, Musculoskeletal Biomechanics Research Laboratory University of
University of Kentucky Doctoral Dissertations
 University of Kentucky UKnowledge University of Kentucky Doctoral Dissertations Graduate School 2009 CHANGES IN LONGITUDINALLY ASSESSED BIOMECHANICAL PARAMETERS RELATED TO INCREASED RISK OF ANTERIOR CRUCIATE
ACL Prevention. ACL Prevention. Neuromuscular Enhancement. Theories and Proposed Action. Non-Contact ACL. ACL Tears Landing
 ACL Prevention ACL Prevention Neuromuscular Enhancement Russ Paine, PT ISMI Memorial Hermann Hospital Houston, Texas Much interest recent years Identification of possible factors Testing to demonstrate
The Inter- and Intra-Rater Reliability of Athletic Trainers at Identifying ACL Injury Risk Factors Using the Cutting Screening Tool
 University of Connecticut DigitalCommons@UConn Master's Theses University of Connecticut Graduate School 12-16-2016 The Inter- and Intra-Rater Reliability of Athletic Trainers at Identifying ACL Injury
The Effectiveness of Injury-Prevention Programs in Reducing the Incidence of Anterior Cruciate Ligament Sprains in Adolescent Athletes
 Critically Appraised Topics Journal of Sport Rehabilitation, 2012, 21, 371-377 2012 Human Kinetics, Inc. The Effectiveness of Injury-Prevention Programs in Reducing the Incidence of Anterior Cruciate Ligament
Rehabilitation Guidelines for Anterior Cruciate Ligament (ACL) Reconstruction
 Reconstruction") Rehabilitation Guidelines for Anterior Cruciate Ligament (ACL) Reconstruction The knee is the body's largest joint, and the place where the femur, tibia, and patella meet to form a hinge-like joint. These
Rehabilitation Guidelines for Anterior Cruciate Ligament (ACL) Reconstruction The knee is the body's largest joint, and the place where the femur, tibia, and patella meet to form a hinge-like joint. These
Knee Movement Coordination Deficits. ICD-9-CM: Sprain of cruciate ligament of knee
 1 Knee Movement Coordination Deficits Anterior Cruciate Ligament ACL Tear ICD-9-CM: 844.2 Sprain of cruciate ligament of knee ACL Insufficiency ICD-9-CM: 717.83 Old disruption of anterior cruciate ligament
Investigation of the Role of Quadriceps Forces and Joint Contact Pressure in Loading of the ACL - In-Vitro Simulation
 Proceedings of the International Conference on Biomedical Engineering and Systems Prague, Czech Republic, August 14-15, 2014 Paper No. 73 Investigation of the Role of Quadriceps Forces and Joint Contact
The Female Athlete: Train Like a Girl. Sarah DoBroka Wilson, PT, SCS Ron Weathers, PT, DPT, ATC, LAT
 The Female Athlete: Train Like a Girl Sarah DoBroka Wilson, PT, SCS Ron Weathers, PT, DPT, ATC, LAT Page 1 of 6 The Female Athlete: Train Like a Girl Sarah DoBroka Wilson PT, SCS Ron Weathers PT, DPT,
Rehabilitation of an ACL injury in a 29 year old male with closed kinetic chain exercises: A case study
 Abstract Objective: This paper will examine a rehabilitation program for a healthy 29 year old male who sustained an incomplete tear of the left ACL. Results: Following a 9 week treatment plan focusing
Re training Movement Behavior for ACL Injury Prevention and Rehabilitation: A Matter of Strength or Motor Control?
 Re training Movement Behavior for ACL Injury Prevention and Rehabilitation: A Matter of Strength or Motor Control? Christopher M. Powers, PT, PhD, FACSM, FAPTA Beth Fisher, PT, PhD, FAPTA Division of Biokinesiology
Preventing Joint Injury & Subsequent Osteoarthritis:
 Preventing Joint Injury & Subsequent Osteoarthritis: A Population Health Prospective Carolyn Emery PT, PhD Public Health Burden of Injury in Alberta The leading cause of death and hospitalization in youth
TREATMENT GUIDELINES FOR GRADE 3 PCL TEAR
 GENERAL CONSIDERATIONS Posterior cruciate ligament (PCL) injuries occur less frequently than anterior cruciate ligament (ACL) injuries, but are much more common than previously thought. The PCL is usually
Commonality of ACL Injuries and Prevention Methods in Women. Anterior cruciate ligament or ACL injuries have become more common in
 4/6/12 Period 2 Commonality of ACL Injuries and Prevention Methods in Women Anterior cruciate ligament or ACL injuries have become more common in the past decade than at any other time in our history.
Anterior Cruciate Ligament (ACL) Injuries
 Injuries") Anterior Cruciate Ligament (ACL) Injuries Mark L. Wood, MD The anterior cruciate ligament (ACL) is one of the most commonly injured ligaments of the knee. The incidence of ACL injuries is currently estimated
Anterior Cruciate Ligament (ACL) Injuries Mark L. Wood, MD The anterior cruciate ligament (ACL) is one of the most commonly injured ligaments of the knee. The incidence of ACL injuries is currently estimated
MEASURING BILATERAL ASYMMETRY IN A LONG TERM ATHLETE MONITORING
 MEASURING BILATERAL ASYMMETRY IN A LONG TERM ATHLETE MONITORING Kimitake Sato Department of Exercise and Sport Science, Center of Excellence for Sport Science and Coach Education, East Tennessee State
Anterior Cruciate Ligament Surgery
 Anatomy Anterior Cruciate Ligament Surgery Roger Ostrander, MD Andrews Institute Anatomy Anatomy Function Primary restraint to anterior tibial translation Secondary restraint to internal tibial rotation
THE EFFECT OF PREVIOUS HAMSTRING INJURIES ON ACL INJURY RISK. Elizabeth Andrews. A Senior Honors Project Presented to the.
 THE EFFECT OF PREVIOUS HAMSTRING INJURIES ON ACL INJURY RISK by Elizabeth Andrews A Senior Honors Project Presented to the Honors College East Carolina University In Partial Fulfillment of the Requirements
ABSTRACT THE EFFECTS OF A 6-WEEK NEUROMUSCULAR TRAINING PROGRAM ON KNEE JOINT MOTOR CONTROL DURING SIDECUTTING IN HIGH-SCHOOL FEMALE ATHLETES
 ABSTRACT THE EFFECTS OF A 6-WEEK NEUROMUSCULAR TRAINING PROGRAM ON KNEE JOINT MOTOR CONTROL DURING SIDECUTTING IN HIGH-SCHOOL FEMALE ATHLETES by Justin Phillip Waxman The purpose of this study was to implement
Research Theme. Cal PT Fund Research Symposium 2015 Christopher Powers. Patellofemoral Pain to Pathology Continuum. Applied Movement System Research
 Evaluation and Treatment of Movement Dysfunction: A Biomechanical Approach Research Theme Christopher M. Powers, PhD, PT, FAPTA Understanding injury mechanisms will lead to the development of more effective
Anatomy and Biomechanics
 Introduction Increased participation= increased injury rates Females were found to be 5.4 times more likely to sustain injury than males. And females injured their ACL ad a rate of 7.8 times more than
Effects of Altered Surface Inclinations on Knee Kinematics During Drop Landing
 Pursuit - The Journal of Undergraduate Research at the University of Tennessee Volume 7 Issue 1 Article 14 April 2016 Effects of Altered Surface Inclinations on Knee Kinematics During Drop Landing Cicily
Biomechanical Risk Factor of Anterior Cruciate Ligament Injury in Adolescent Female Basketball Players: A Prospective Cohort Study
 Biomechanical Risk Factor of Anterior Cruciate Ligament Injury in Adolescent Female Basketball Players: A Prospective Cohort Study kohei koresawa 1, Yumi No 2, Satoshi Kubota 1, Kazuyoshi Gamada 1. 1 Graduate
What is an ACL Tear?...2. Treatment Options...3. Surgical Techniques...4. Preoperative Care...5. Preoperative Requirements...6
 Table of Contents What is an ACL Tear?....2 Treatment Options...3 Surgical Techniques...4 Preoperative Care...5 Preoperative Requirements...6 Postoperative Care...................... 7 Crutch use...8 Initial
female athletes compared to male athletes. However, female dancers who have similar
 PYE, MICHELE LYNETT, Ph.D. Comparison of Neuromuscular Control Strategies between Collegiate Female Dancers and Athletes (2014) Directed by Dr. Sandra J. Shultz. 206 pp. High risk neuromuscular control
Military Movement Training Program Improves Jump-Landing Mechanics Associated With Anterior Cruciate Ligament Injury Risk
 Military Movement Training Program Improves Jump-Landing Mechanics Associated With Anterior Cruciate Ligament Injury Risk Brett D. Owens, MD; Kenneth L. Cameron, PhD, ATC; Michele L. Duffey, MS; Donna
BIOMECHANICS AND CONTEXT OF ACUTE KNEE INJURIES. Uwe Kersting MiniModule Idræt Biomekanik 2. Objectives
 BIOMECHANICS AND CONTEXT OF ACUTE KNEE INJURIES Uwe Kersting MiniModule 06 2011 Idræt Biomekanik 2 1 Objectives Know about the static and dynamic organisation of the knee joint (anatomy & function) Be
Comparative Effectiveness Of Injury Prevention Programs In Female Adolescent Athletes
 University of Connecticut DigitalCommons@UConn Doctoral Dissertations University of Connecticut Graduate School 9-14-2015 Comparative Effectiveness Of Injury Prevention Programs In Female Adolescent Athletes
KNEE GAIT MECHANICS AND CARTILAGE STRESS IN THOSE WITH/WITHOUT MEDIAL COMPARTMENT KNEE OSTEOARTHRITIS FIVE YEARS AFTER ANTERIOR CRUCIATE LIGAMENT
 KNEE GAIT MECHANICS AND CARTILAGE STRESS IN THOSE WITH/WITHOUT MEDIAL COMPARTMENT KNEE OSTEOARTHRITIS FIVE YEARS AFTER ANTERIOR CRUCIATE LIGAMENT RECONSTRUCTION by Ashutosh Khandha A dissertation submitted
UNUSUAL ACL CASE: Tibial Eminence Fracture in a Female Collegiate Basketball Player
 UNUSUAL ACL CASE: Tibial Eminence Fracture in a Female Collegiate Basketball Player Cheri Drysdale, MEd,, ATC Margot Putukian,, MD Jeffery Bechler,, MD Princeton University How many of you have done an
ACL RECONSTRUCTION SPORTS REHABILITATION. Written by Bart Sas, Qatar
 ACL RECONSTRUCTION PREDICTORS AND PROGNOSIS OF OUTCOME POST RECONSTRUCTION Written by Bart Sas, Qatar Injury to the anterior cruciate ligament (ACL) is arguably the most devastating injury that an athlete
Novel Design of an Anterior Cruciate Ligament (ACL) Injury Prevention Brace
 Injury Prevention Brace") Novel Design of an Anterior Cruciate Ligament (ACL) Injury Prevention Brace Daniel Greenshields, Justin Killewald, Rachel Porter Lawrence Technological University BME Projects II Dr. Mansoor Nasir, Spring
Novel Design of an Anterior Cruciate Ligament (ACL) Injury Prevention Brace Daniel Greenshields, Justin Killewald, Rachel Porter Lawrence Technological University BME Projects II Dr. Mansoor Nasir, Spring
An estimated anterior cruciate ligament. Mechanisms of Noncontact Anterior Cruciate Ligament Injury
 Journal of Athletic Training 2008;43(4):396 408 g by the National Athletic Trainers Association, Inc www.nata.org/jat systematic review Mechanisms of Noncontact Anterior Cruciate Ligament Injury Yohei
Girls and Sports. Title IX. You Go Girl! : Female Athlete Hot Topics. Women in Sports
 You Go Girl! : Female Athlete Hot Topics Rebecca A. Demorest, MD Associate Director, Pediatric and Young Adult Sports Medicine Children s Hospital & Research Center Oakland rdemorest@mail.cho.org Girls
ACL Athletic Career. ACL Rupture - Warning Features Intensive pain Immediate swelling Locking Feel a Pop Dead leg Cannot continue to play
 FIMS Ambassador Tour to Eastern Europe, 2004 Belgrade, Serbia Montenegro Acute Knee Injuries - Controversies and Challenges Professor KM Chan OBE, JP President of FIMS Belgrade ACL Athletic Career ACL
BIOMECHANICAL RISK FACTORS ASSOCIATED WITH NON-CONTACT ANTERIOR CRUCIATE LIGAMENT INJURIES DURING LANDING PERFORMANCE
 BIOMECHANICAL RISK FACTORS ASSOCIATED WITH NON-CONTACT ANTERIOR CRUCIATE LIGAMENT INJURIES DURING LANDING PERFORMANCE Thomas W. Kernozek University of Wisconsin-La Crosse, La Crosse, WI, USA Anterior cruciate
Discrepancies in Knee Joint Moments Using Common Anatomical Frames Defined by Different Palpable Landmarks
 Journal of Applied Biomechanics, 2008, 24, 185-190 2008 Human Kinetics, Inc. Discrepancies in Knee Joint Moments Using Common Anatomical Frames Defined by Different Palpable Landmarks Dominic Thewlis,
Takashi Nagai. Bachelor of Science, University of Charleston, Master of Science, University of Utah, Submitted to the Graduate Faculty of
 EFFECTS OF 8-WEEK NONLINEAR PERIODIZED TRAINING PROGRAM ON PHYSICAL FITNESS AND CONTRIBUTORS OF FUNCTIONAL KNEE JOINT STABILITY IN 101ST DIVISION ARMY SOLDIERS by Takashi Nagai Bachelor of Science, University
Skill Development and the Strength & Conditioning Coach. Brian McCormick Boston Sports Medicine and Performance Group
 Skill Development and the Strength & Conditioning Coach Brian McCormick Boston Sports Medicine and Performance Group Purpose Discuss the role of the Strength & Conditioning Coach in skill development with
EFFECTIVENESS OF NEUROMUSCULAR TRAINING IN YOUNG ATHLETES AT RISK OF LOWER EXTREMITY MUSCULOSKELETAL INJURIES
 EFFECTIVENESS OF NEUROMUSCULAR TRAINING IN YOUNG ATHLETES AT RISK OF LOWER EXTREMITY MUSCULOSKELETAL INJURIES Original Research Article ABSTRACT ISSN CODE: 2456-1045 (Online) (ICV-MDS/Impact Value): 3.08
Shimokochi, Y, Shultz SJ. Mechanisms of Non-Contact Anterior Cruciate Ligament Injury. Journal of Athletic Training. 2008;43(4):
:") Mechanisms of Noncontact Anterior Cruciate Ligament Injury By: Yohei Shimokochi, Sandra J Shultz *, Shimokochi, Y, Shultz SJ. Mechanisms of Non-Contact Anterior Cruciate Ligament Injury. Journal of Athletic
Mechanisms of Noncontact Anterior Cruciate Ligament Injury By: Yohei Shimokochi, Sandra J Shultz *, Shimokochi, Y, Shultz SJ. Mechanisms of Non-Contact Anterior Cruciate Ligament Injury. Journal of Athletic
A Prospective Evaluation of the Landing Error Scoring System (LESS) as a Screening Tool for Anterior Cruciate Ligament Injury Risk
 as a Screening Tool for Anterior Cruciate Ligament Injury Risk") A Prospective Evaluation of the Landing Error Scoring System (LESS) as a Screening Tool for Anterior Cruciate Ligament Injury Risk By: Helen C. Smith, Robert J. Johnson, Sandra J. Shultz, Timothy Tourville,
A Prospective Evaluation of the Landing Error Scoring System (LESS) as a Screening Tool for Anterior Cruciate Ligament Injury Risk By: Helen C. Smith, Robert J. Johnson, Sandra J. Shultz, Timothy Tourville,
Female Athlete Knee Injury
 Female Athlete Knee Injury Kelly C. McInnis, DO Physical Medicine and Rehabilitation Massachusetts General Hospital Sports Medicine Center Outline Historical Perspective Gender-specific movement patterns
Integrating Sensorimotor Control Into Rehabilitation
 Integrating Sensorimotor Control Into Rehabilitation BRADY L. TRIPP, PhD, LAT, ATC Florida International University Key Points As evidence accumulates, so does our appreciation of the integral roles that
SKELETAL KINEMATICS OF THE ANTERIOR CRUCIATE LIGAMENT DEFICIENT KNEE WITH AND WITHOUT FUNCTIONAL BRACES
 SKELETAL KINEMATICS OF THE ANTERIOR CRUCIATE LIGAMENT DEFICIENT KNEE WITH AND WITHOUT FUNCTIONAL BRACES Dan K. Ramsey 1, Mario Lamontagne, Per F.Wretenberg 3 and Gunnar Németh 1 School of Human Kinetics,
educate OBJECTIVES AND TAKE-HOME ACL INJURY BY THE NUMBERS 12/4/2011 LIVE ON-SCREEN DEMONSTRATION
 LIVE ON-SCREEN DEMONSTRATION Derek Hirai, MS, ATC Gina Biviano, MA, ATC PRE-EMPTIVE STRIKE: ACL Injury Prevention Techniques OBJECTIVES AND TAKE-HOME Identify risk factors In-office testing/evaluation
Anterior Cruciate Ligament Injuries
 Anterior Cruciate Ligament Injuries One of the most common knee injuries is an anterior cruciate ligament sprain or tear.athletes who participate in high demand sports like soccer, football, and basketball
Knee Ligament Function 3 properties allow ligaments mechanical functions to limit motion: Attachment Location
 29 muscles attach Lumbar Spine Muscles Transversospinalis group Rotatores Interspinales Intertransversarii Semispinalis Multifidus Erector spinae Iliocostalis Longissimus Spinalis Quadratus lumborum Latissimus
EXCERPT ADAPTED FROM CARL PETERSEN S NEW BOOK FIT 2 SKI
 ACL THE ABC S OF PROTECTION EXCERPT ADAPTED FROM CARL PETERSEN S NEW BOOK FIT 2 SKI by CARL PETERSEN BPE, BSc (PT) Injuries to the knee are a regular occurrence for skiing professionals and anterior cruciate
l. Initiate early proprioceptive activity and progress by means of distraction techniques: i. eyes open to eyes closed ii. stable to unstable m.
 Meniscus Repair 1. Defined a. Sutures or bioabsorbable fixation devices (arrows, darts, screws, etc.) bring together and fixate the edges of a tear in the meniscus in order to maintain the shock absorption
educate ACL INJURY BY THE NUMBERS 12/4/2010 LIVE ON-SCREEN DEMONSTRATION ACL INJURY PREVENTION TECHNIQUES
 LIVE ON-SCREEN DEMONSTRATION Joseph Smith, MS, ATC Elise Hammond, ATC Jason Miyamoto, MS, ATC PRE-EMPTIVE STRIKE: ACL Injury Prevention Techniques ACL INJURY PREVENTION TECHNIQUES educate assess train
CONCUSSION AS A RISK FACTOR FOR LOWER EXTREMITY MUSCULOSKELETAL INJURY IN COLLEGIATE ATHLETES. Amy Elisabeth Aggelou
 CONCUSSION AS A RISK FACTOR FOR LOWER EXTREMITY MUSCULOSKELETAL INJURY IN COLLEGIATE ATHLETES by Amy Elisabeth Aggelou Bachelor of Science, University of Pittsburgh, 1994 Master of Arts, University of
Journal of Athletic Training Volume 43 #3, May 2008 CEU Quiz
 Journal of Athletic Training Volume 43 #3, May 2008 CEU Quiz A Weber Type C injury occurs when the fibular fracture is: A. Below the tibiofibular joint line B. Above the tibiofibular joint line C. At the
MSc in Athletic Therapy
 NATIONAL UNIVERSITY OF MEDICAL SCIENCES MSc in Athletic Therapy Research Paper: Sports Strength and Conditioning in conjunction with Therapy Arun Kumar 6/22/2015 Student Number: S140212 Topic: Sports Strength
TOTAL KNEE ARTHROPLASTY (TKA)
") TOTAL KNEE ARTHROPLASTY (TKA) 1 Anatomy, Biomechanics, and Design 2 Femur Medial and lateral condyles Convex, asymmetric Medial larger than lateral 3 Tibia Tibial plateau Medial tibial condyle: concave
TOTAL KNEE ARTHROPLASTY (TKA) 1 Anatomy, Biomechanics, and Design 2 Femur Medial and lateral condyles Convex, asymmetric Medial larger than lateral 3 Tibia Tibial plateau Medial tibial condyle: concave
Anterior Cruciate Ligament (ACL) Reconstruction Protocol. Hamstring Autograft, Allograft, or Revision
 Reconstruction Protocol. Hamstring Autograft, Allograft, or Revision") Anterior Cruciate Ligament (ACL) Reconstruction Protocol Hamstring Autograft, Allograft, or Revision As tolerated should be understood to perform with safety for the reconstruction/repair. Pain, limp,
Anterior Cruciate Ligament (ACL) Reconstruction Protocol Hamstring Autograft, Allograft, or Revision As tolerated should be understood to perform with safety for the reconstruction/repair. Pain, limp,
ENERGETIC ANALYSIS OF LANDING: A NOVEL APPROACH TO UNDERSTANDING ANTERIOR CRUCIATE LIGAMENT INJURIES. Marc Fabian Norcross
 ENERGETIC ANALYSIS OF LANDING: A NOVEL APPROACH TO UNDERSTANDING ANTERIOR CRUCIATE LIGAMENT INJURIES Marc Fabian Norcross A dissertation submitted to the faculty of the University of North Carolina at
Anterior Cruciate Ligament (ACL) Injury Prevention Program at St. Charles Hospital. St.Charles. Sports Medicine
 Injury Prevention Program at St. Charles Hospital. St.Charles. Sports Medicine") Anterior Cruciate Ligament (ACL) Injury Prevention Program at St. Charles Hospital St.Charles Sports Medicine 200 Belle Terre Road Port Jefferson New York 11777 (631) 474-6797 www.stcharles.org www.stcharles.org
Anterior Cruciate Ligament (ACL) Injury Prevention Program at St. Charles Hospital St.Charles Sports Medicine 200 Belle Terre Road Port Jefferson New York 11777 (631) 474-6797 www.stcharles.org www.stcharles.org
Knee-Joint Position Sense: The Relationship Between Open and Closed Kinetic Chain Tests
 J Sport Rehabil. 2005;14:356-362 2005 Human Kinetics, Inc. Knee-Joint Position Sense: The Relationship Between Open and Closed Kinetic Chain Tests Lee Herrington Context: Authors have investigated knee
The Influence of Heel Height on Sagittal Plane Knee Kinematics during Landing Tasks in Recreationally Active Collegiate Females
 Duquesne University Duquesne Scholarship Collection Electronic Theses and Dissertations Fall 2009 The Influence of Heel Height on Sagittal Plane Knee Kinematics during Landing Tasks in Recreationally Active
Grant H Garcia, MD Sports and Shoulder Surgeon
 What to Expect from your Anterior Cruciate Ligament Reconstruction Surgery A Guide for Patients Grant H Garcia, MD Sports and Shoulder Surgeon Important Contact Information Grant Garcia, MD Wallingford:
POST-ACTIVATION POTENTIATION AND VERTICAL JUMP PERFORMANCE. Cody Hardwick
 POST-ACTIVATION POTENTIATION AND VERTICAL JUMP PERFORMANCE Cody Hardwick Submitted in partial fulfillment of the requirements For the degree Master of Science in Kinesiology In the School of Public Health
THE RELATIONSHIP BETWEEN THE HAMSTRINGS TO QUADRICEPS STRENGTH RATIO AND ANTERIOR CRUCIATE LIGAMENT FORCES by. Jeffrey M. Patterson.
 THE RELATIONSHIP BETWEEN THE HAMSTRINGS TO QUADRICEPS STRENGTH RATIO AND ANTERIOR CRUCIATE LIGAMENT FORCES by Director of Thesis: Dr. Anthony S. Kulas Major Department: Kinesiology Jeffrey M. Patterson
Examining the Impact of Adding Gluteal Strengthening Exercises to the FIFA 11+ Warm-Up Program on High School GIrls' Basketball Reported Injuries.
 University of Montana ScholarWorks at University of Montana Graduate Student Theses, Dissertations, & Professional Papers Graduate School 2018 Examining the Impact of Adding Gluteal Strengthening Exercises
The Star Excursion Balance Test (SEBT) is a unilateral, UNILATERAL BALANCE PERFORMANCE IN FEMALE COLLEGIATE SOCCER ATHLETES
 is a unilateral, UNILATERAL BALANCE PERFORMANCE IN FEMALE COLLEGIATE SOCCER ATHLETES") UNILATERAL BALANCE PERFORMANCE IN FEMALE COLLEGIATE SOCCER ATHLETES JENNIFER L. THORPE AND KYLE T. EBERSOLE University of Illinois, Department of Kinesiology and Community Health, Urbana, Illinois ABSTRACT
UNILATERAL BALANCE PERFORMANCE IN FEMALE COLLEGIATE SOCCER ATHLETES JENNIFER L. THORPE AND KYLE T. EBERSOLE University of Illinois, Department of Kinesiology and Community Health, Urbana, Illinois ABSTRACT
Make Good Decisions. General Changes in the Youth Sports World. When Youth Sport Becomes too Serious 5/9/2013. Sports Medicine:
 Make Good Decisions Sports Medicine: The Time for Prevention is Now! Jordan D. Metzl, MD, FAAP Hospital for Special Surgery www.drjordanmetzl.com Role of health provider What is reasonable to expect? What
JAT Vol. 49 #3 CEU Questions
 JAT Vol. 49 #3 CEU Questions Aronson et al 1. According to Aronson et al, which of the following age groups demonstrated less medial knee stiffness than the other age groups? a. 8 10 year olds b. 18 40
Anterior Cruciate Ligament Hamstring Rehabilitation Protocol
 Anterior Cruciate Ligament Hamstring Rehabilitation Protocol 1 / 6 2 / 6 3 / 6 Anterior Cruciate Ligament Hamstring Rehabilitation Level of Evidence: Successful anterior cruciate ligament (ACL) reconstruction
Stephanie Gould Pht, Naudira Stewart P.R.T. i000
 Return to Sport After ACL in the Young Athlete Stephanie Gould Pht, Naudira Stewart P.R.T i000 The ACL epidemic In youth aged 6-18 y.o., ACL injuries occur at a rate of 130/100,000 people per year Rate
New method to identify athletes at high risk of ACL injury using clinic-based measurements and freeware computer analysis
 1 2 3 4 5 6 7 8 9 10 11 12 13 14 15 16 17 18 19 20 21 22 23 24 25 26 27 28 29 30 31 32 33 34 35 36 37 38 39 40 41 42 43 44 45 46 47 48 49 50 51 52 53 54 55 56 57 58 59 60 61 62 63 64 2 1 3 1 Cincinnati
Anterior Cruciate Ligament Hamstring Rehabilitation Protocol
 Anterior Cruciate Ligament Hamstring Rehabilitation Protocol Focus on exercise quality avoid overstressing the donor area while it heals. Typically, isolated hamstring strengthening begins after the 6
Utility of Instrumented Knee Laxity Testing in Diagnosis of Partial Anterior Cruciate Ligament Tears
 Utility of Instrumented Knee Laxity Testing in Diagnosis of Partial Anterior Cruciate Ligament Tears Ata M. Kiapour, Ph.D. 1, Ali Kiapour, Ph.D. 2, Timothy E. Hewett, Ph.D. 3, Vijay K. Goel, Ph.D. 2. 1
Appendix 2: KNGF Evidence Statement for anterior cruciate ligament reconstruction rehabilitation
 Appendix 2: KNGF Evidence Statement for anterior cruciate ligament reconstruction rehabilitation Inclusion and exclusion criteria for rehabilitation according to the Evidence Statement Inclusion of patients
Investigation of Human Whole Body Motion Using a Three-Dimensional Neuromusculoskeletal Model
 Investigation of Human Whole Body Motion Using a Three-Dimensional Neuromusculoskeletal Model 1 Akinori Nagano, 2 Senshi Fukashiro, 1 Ryutaro Himeno a-nagano@riken.jp, fukashiro@idaten.c.u-tokyo.ac.jp,
Lecture 2. Statics & Dynamics of Rigid Bodies: Human body 30 August 2018
 Lecture 2. Statics & Dynamics of Rigid Bodies: Human body 30 August 2018 Wannapong Triampo, Ph.D. Static forces of Human Body Equilibrium and Stability Stability of bodies. Equilibrium and Stability Fulcrum
ACL AND PCL INJURIES OF THE KNEE JOINT
 ACL AND PCL INJURIES OF THE KNEE JOINT Dr.KN Subramanian M.Ch Orth., FRCS (Tr & Orth), CCT Orth(UK) Consultant Orthopaedic Surgeon, Special interest: Orthopaedic Sports Injury, Shoulder and Knee Surgery,
Noncontact Anterior Cruciate Ligament Injuries in Collegiate Female Soccer Players: The Effects of a 4-Week Prevention Program on Landing Kinematics
 Noncontact Anterior Cruciate Ligament Injuries in Collegiate Female Soccer Players: The Effects of a 4-Week Prevention Program on Landing Kinematics Tess Marcordes Dr. Scott Armstrong Introduction 127,000
Biomechanics of the Knee. Valerie Nuñez SpR Frimley Park Hospital
 Biomechanics of the Knee Valerie Nuñez SpR Frimley Park Hospital Knee Biomechanics Kinematics Range of Motion Joint Motion Kinetics Knee Stabilisers Joint Forces Axes The Mechanical Stresses to which
Female Athlete Injury Prevention
 Female Athlete Injury Prevention Startling Facts Huge rise in knee ligament injuries among young females engaging in sport and exercise Females athletes participating in jumping and pivoting sports are
Effect of Verbal Cueing on Sagittal Plane Drop Jump Landing Kinematics and Ground Reaction Forces.
 Effect of Verbal Cueing on Sagittal Plane Drop Jump Landing Kinematics and Ground Reaction Forces. Denn-Thiele T, Lin H, Outar R, Shnider L, Background: The prevalence of lower extremity injuries among
SOCCER INJURY PREVENTION KEY FACTS SOLUTIONS CASE PRESENTATIONS MICHAEL BILLER, PT & KYLE HAMMOND, MD
 SOCCER INJURY PREVENTION KEY FACTS SOLUTIONS CASE PRESENTATIONS MICHAEL BILLER, PT & KYLE HAMMOND, MD Rationale for injury prevention programs Rate of injuries is increasing in many sports and injury types