Delaying Progression of Renal Complications of Autosomal Dominant Polycystic Kidney Disease by Tolvaptan Inhibition of Arginine Vasopressin
|
|
|
- Julian Brown
- 5 years ago
- Views:
Transcription
1 Delaying Progression of Renal Complications of Autosomal Dominant Polycystic Kidney Disease by Tolvaptan Inhibition of Arginine Vasopressin Briefing Document for 5 August 2013 Advisory Committee Meeting of the Cardiovascular and Renal Drugs Division of the US Food and Drug Administration Otsuka Pharmaceutical Development & Commercialization, Inc Research Boulevard Rockville, Maryland Issued 3 July 2013 THIS DOCUMENT IS AVAILABLE FOR PUBLIC DISCLOSURE WITHOUT REDACTION Page 1 of 224
2 Executive Summary Tolvaptan is a selective vasopressin V 2 receptor antagonist proposed to slow kidney disease in adults at risk of rapidly progressing autosomal dominant polycystic kidney disease (ADPKD). This document provides information on tolvaptan relevant to the Center for Drug Evaluation and Research Cardiovascular and Renal Drugs Advisory Committee Meeting on Monday, 05 August The sponsor has been asked to provide information to support informed decisions and recommendations on the following: Evidence supporting the efficacy of tolvaptan in the chronic treatment of ADPKD. Evidence supporting the safe-use of tolvaptan for chronic treatment of ADPKD. Basis for believing the observed and expected benefits of tolvaptan may reasonably outweigh the potential for observed or expected harm when given chronically to patients with ADPKD. Autosomal Dominant Polycystic Kidney Disease is a Progressive Syndrome with No Existing Therapy Autosomal dominant polycystic kidney disease leads to progressive destruction of normal kidney structure leading to end-stage renal disease (ESRD). The disease affects the structure of the kidneys through proliferation and growth of numerous fluid-filled cysts. The expanding cysts compress normal tissue and blood vessels resulting in ischemia, inflammation and fibrosis leading to progressive nephron loss. The remaining nephrons are initially able to compensate through glomerular hyperfiltration up to a point when nephron loss is so great that compensatory hyperfiltration of remaining nephrons is no longer adequate and renal function begins to decline. Clinical manifestations of kidney disease may be sporadic (hematuria, infections, pain) or chronic (hypertension, albuminuria, renal insufficiency) and indicate ongoing and cumulative damage to the kidney. There are currently no therapies which can slow the deterioration of kidney function in ADPKD. Current management focuses on ameliorating symptoms of pain, control of blood pressure, and treatment of infections with antibiotics. None of these treatments target the underlying cause of the disease. Parents with ADPKD have a 50% chance of passing a mutated PKD1 or PKD2 gene to their children. Development of cysts appears to require a second mutation in the paired normal allele (second hit hypothesis). Patients carrying the mutated PKD1 gene have Page 2 of 224
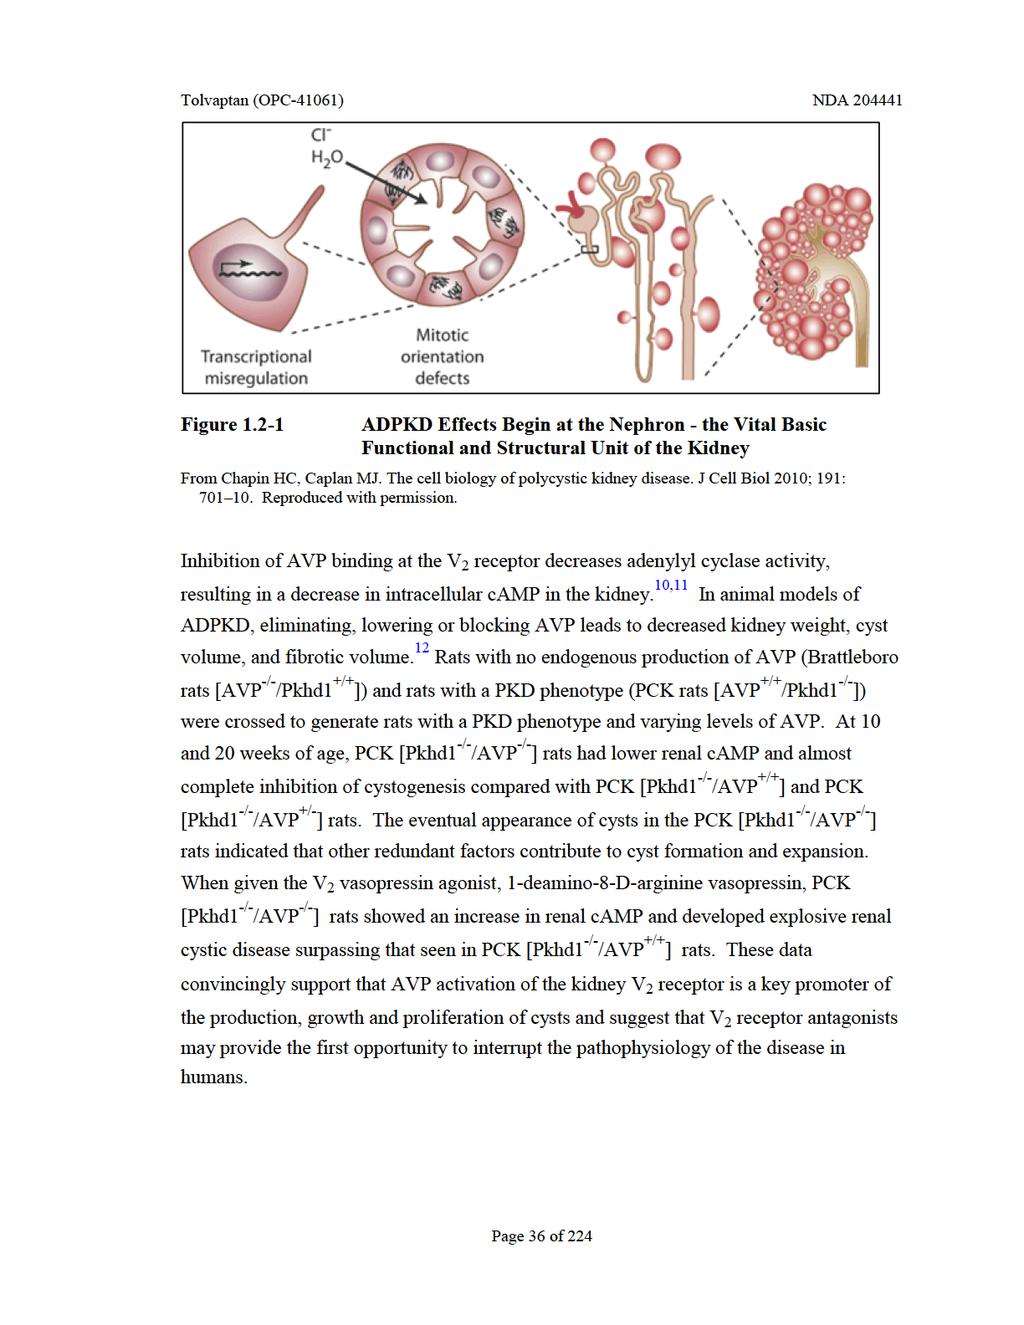
3 more cysts than those with PKD2 mutations which accounts for their progression to ESRD at an earlier age. The number of diagnosed ADPKD cases was estimated at 116,228 in the US in 2009 which qualified tolvaptan for an orphan designation. Though a rare genetic disease, it ranks as the sixth leading cause of ESRD in the US (2.3% of the new ESRD cases). 1 An estimated 45% to 70% of patients with ADPKD progress to ESRD by age Over the past 30 years, the age of onset for ESRD among ADPKD patients has remained the same (median age of 54). In contrast, effective therapy has delayed the onset of ESRD in patients with nephropathy due to hypertension, diabetes and glomerulonephritis. Autosomal dominant polycystic kidney disease patients fear the physical and emotional burdens of dialysis while holding out hope for receiving a kidney transplantation. This disease has a devastating physical, emotional, and financial toll on patients and their families (Section 1). Arginine Vasopressin Promotes Structural Damage in ADPKD Arginine vasopressin (AVP) promotes ADPKD structural damage by increasing the rate of cyst growth (Section 1.2). AVP stimulates the V 2 vasopressin receptor, thereby increasing camp intracellular signaling; increased camp leads to fluid secretion into the cysts and cyst cell proliferation. 9 Cyst formation and expansion disrupts normal kidney structure, impacting hemodynamic flow, leading to ischemia, fibrosis and decreased nephron number and function. Inhibition of AVP binding at the V 2 receptor decreases adenylyl cyclase activity, resulting in a decrease in intracellular camp in the kidney. 10,11 In animal models of ADPKD, eliminating, lowering or blocking AVP leads to decreased kidney weight, cyst volume, and fibrotic volume. 12 Rats with no endogenous production of AVP (Brattleboro rats [AVP -/- /Pkhd1 +/+ ]) and rats with a PKD phenotype (PCK rats [AVP +/+ /Pkhd1 -/- ]) were crossed to generate rats with a PKD phenotype and varying levels of AVP. At 10 and 20 weeks of age, PCK [Pkhd1 -/- /AVP -/- ] rats had lower renal camp and almost complete inhibition of cystogenesis compared with PCK [Pkhd1 -/- /AVP +/+ ] and PCK [Pkhd1 -/- /AVP +/- ] rats. The eventual appearance of cysts in the PCK [Pkhd1 -/- /AVP -/- ] rats indicated that other redundant factors contribute to cyst formation and expansion. When given the V 2 vasopressin agonist, 1-deamino-8-D-arginine vasopressin, PCK [Pkhd1 -/- /AVP -/- ] rats showed an increase in renal camp and developed explosive renal Page 3 of 224
4 cystic disease surpassing that seen in PCK [Pkhd1 -/- /AVP +/+ ] rats. These data convincingly support that AVP activation of the kidney V 2 receptor is a key promoter of the production, growth and proliferation of cysts and suggest that V 2 receptor antagonists may provide the first opportunity to interrupt the pathophysiology of the disease in humans. Tolvaptan s Mechanism of Action Slows ADPKD Progression and Causes Aquaresis Tolvaptan blocks the kidney V 2 receptor, thereby reducing intracellular camp. This results in two physiologic consequences. The first is to prevent the insertion of aquaporin channels into the apical membrane of the distal tubules and collecting ducts, resulting in decreased reabsorption of water. This effect, referred to as aquaresis, is the physiologic basis of tolvaptan s therapeutic effects for the treatment of hyponatremia. The second is unique to the dysregulated cells of ADPKD. Here, lowering camp production slows cyst cell proliferation and secretion, resulting in decreased cyst growth and fibrosis (Section 2.1). The animal model discussed above and other animal models where tolvaptan was administered in food or via gavage (twice daily) suggest that tolvaptan treatment is most effective when initiated at an early stage in disease progression and given chronically. This provides the greatest benefit in reducing cyst growth before it begins to adversely affect renal function. These animal data supported early phase clinical trials. Dose-ranging clinical phase 2 PK/PD trials indicated that a split-dose regimen of tolvaptan administered as 45/15 mg, 60/30 mg or 90/30 mg would be effective in continuously blocking AVP (as measured by suppressed urine osmolality; Section 3.3) in a majority of patients with ADPKD, therefore affording the greatest potential to slow the progression of the disease. Endpoint Selection for the Pivotal ADPKD Trial The tolvaptan program in ADPKD focuses on important aspects of the progression of ADPKD: kidney structure kidney events of ADPKD progression kidney function Page 4 of 224
5 Experts provided the best, available scientific and clinical evidence at the time, which in concert with regulatory advice, contributed to the design of the pivotal tolvaptan ADPKD trial. This, added to extensive clinical experience with tolvaptan from other indications, guided the design, dosing regimen, population, and endpoint selection of the pivotal tolvaptan ADPKD trial (Section 3.2). Clinical researchers working with the National Institutes of Health (NIH) proposed total kidney volume (TKV) as a practical endpoint for measuring ADPKD renal cyst burden and progression (when measured with magnetic resonance imaging [MRI]). Trial was therefore designed to measure change in total kidney volume (TKV) as the primary endpoint for kidney structure Section To assess clinically significant events marking the progression of ADPKD kidney damage, a key secondary composite endpoint focused on events of progression of ADPKD (significantly (30%) worsening renal function, renal pain, hypertension, and albuminuria) Section An exploratory measure of all subject-reported ADPKD outcomes supported this endpoint (Section 5.9.1). Given the importance of understanding how tolvaptan could preserve kidney function, the rate of loss of glomerular filtration (1/serum creatinine or egfr slope) served as the next, hierarchically ordered secondary endpoint (Section 5.7.1). Evaluation of renal function as a continuous change (in contrast to a threshold-event) allowed interpretation of efficacy across the range of all enrolled subjects. This included those whose function was relatively preserved due to hyperfiltration, and were unlikely to reach a threshold event in a span of 3 years. Other secondary, exploratory and pharmacodynamic endpoints were prespecified to further the understanding of tolvaptan's effects on the primary endpoint of TKV and the key secondary composite endpoint and its components. These also provided a broader picture of the overall clinical impact of ADPKD progression. Current collaborations between FDA and the PKD Outcomes and CKD Progression Consortia have led to a better appreciation of how TKV and egfr thresholds (eg, 30%) can be used to predict risk of progression to ESRD. These efforts support the choice of ADPKD clinical trial endpoints, particularly when targeting subjects with early disease. The population studied in the tolvaptan pivotal trial included those at risk of rapidly progressing ADPKD (TKV at least 750 ml), but whose renal function was largely preserved (ecrcl 60 ml/min). The hypothesis was that this population of patients would have measurable and clinically-relevant progression of ADPKD in a reasonable timeframe. Page 5 of 224
6 Regulatory Communications Regarding Endpoints and Design of Pivotal Trial For the efficacy endpoints, there were extensive communications between the FDA and Otsuka. The FDA consistently stated that the Agency would not currently accept changes in kidney volume as a surrogate endpoint and thus would place emphasis on the findings for the key secondary composite endpoint at Pre-Investigational New Drug Meeting (16 Mar 2005), Special Protocol Assessment (SPA) meeting (15 Nov 2005), Statistical meeting (10 June 2009) and pre-nda meeting (19 July 2012). The Agency and Otsuka both agreed on the study endpoint structure: total kidney volume for the primary endpoint and a composite for the key secondary endpoint. The FDA indicated that the key secondary composite endpoint must provide evidence of effectiveness. There was agreement that if the primary endpoint and the composite endpoint are both statistically significant with other endpoints supportive, the single phase 3 trial would be sufficient to support a New Drug Application (NDA) approval (SPA meeting, 15 Nov 2005). In order to provide convincing evidence of treatment benefit, the key secondary composite endpoint would need a p-value of < 0.01 (Statistical meeting, 10 Jun 2009). Based on the trial findings, the Agency reiterated at the pre-nda meeting that the single, pivotal trial was adequate to support a filing; and that they do not currently accept changes in kidney volume as a surrogate endpoint and thus will place [review] emphasis on the findings for the key secondary composite endpoint. For the trial design, it was agreed that the best use of available subjects would be to titrate them to the highest dose. Pivotal Trial Trial was a 3-year, multinational, randomized (2:1), double-blind, placebocontrolled trial in 1445 subjects (tolvaptan n = 961, placebo n = 484 [1 randomized placebo subject was not dosed]) assessing the long-term efficacy and safety of tolvaptan with oral split-dose regimens (titrated between 60 mg/day [45/15 mg], 90 mg/day [60/30 mg], and 120 mg/day [90/30 mg] with the first dose to be taken upon awakening and the second to be taken 8 hours later). Primary Efficacy Endpoint: Tolvaptan Reduced TKV Growth Tolvaptan reduced the rate of TKV growth (primary trial endpoint) over 3 years in comparison with placebo, with an absolute difference of 2.71%/year (p < ) Page 6 of 224
7 (Section 5.5.2). This reduction represented a 49.2% decrease in the growth rate of kidneys (Table 1). Table 1 Primary Endpoint (Random Effect Intercept) in Trial : Total Kidney Volume Rate of Growth (%/year), ITT, Within Treatment Period Parameter Tolvaptan Placebo Rate of percent growth per year Number of subjects Mean Median SD Minimum Maximum Estimated slope Treatment effect Difference (%) % CI 3.269, Slope reduction (%) 49.2 Ratio of geometric mean % CI 0.969, p-value < CI = confidence interval; IMP = investigational medicinal product; ITT = intent-to-treat; MRI = magnetic resonance imaging; SD = standard deviation; TKV = total kidney volume. For additional details of analysis, see Table A mixed-model repeated measures (MMRM) analysis showed the treatment effect for TKV in Trial to be greatest in the first year, but the beneficial effects of tolvaptan were clearly evident in the second and third year, indicating continued incremental separation from treatment with placebo (see Figure 1) at approximately 30% per year. These findings were confirmed by additional sensitivity and supportive analyses (Section ). Analyses addressing potential bias due to missing data are addressed in Section All confirmed the primary endpoint result with a statistically significant difference between groups favoring tolvaptan. Page 7 of 224
8 Figure 1 MMRM Analysis of Percent Change from Baseline in TKV in Trial These effects resulted in a cumulative increase in TKV of 9.6% in tolvaptan treated patients over the course of the 3-year pivotal trial, compared to a cumulative increase of 18.6% in patients receiving placebo (MMRM analysis, p<0.0001). Integration of ontreatment data from the 3-year Trial with short-term data suggests a reduction of TKV growth by approximately 6% in year one and an additional 2% per year thereafter in tolvaptan subjects, versus an average growth rate of 6% per year in placebo subjects (Section ). This represents a nearly 50% reduction in the rate of increase of TKV over the first three years. A long-term clinical benefit in TKV would reasonably be expected given a 30% (ie, 4% versus 6%) reduction of kidney growth in each subsequent year of trial treatment. This effect size is clinically relevant and similar to that seen for the rate of renal function decline (Section 5.7.2). Key Composite Secondary Endpoint: Tolvaptan Reduced the Rate of the Events Associated with Clinical Progression of ADPKD (Including Incidence of Worsening Renal Function and Incidence of Clinically Relevant Renal Pain) The findings of the key secondary composite endpoint from Trial were consistent with the results of the primary endpoint (Section 5.6.2). The key secondary composite endpoint measured tolvaptan s effects on 4 clinically relevant complications important to ADPKD patients and their physicians (worsening of renal function, renal pain, hypertension, and albuminuria). Tolvaptan reduced the time to multiple events of the pooled composite endpoints by 13.5%. These findings were robust (p = , see Page 8 of 224
9
10 Figure 3 Cumulative Intensity Plot of Time to Multiple Events of Worsening Renal Function in Trial Figure 4 Cumulative Intensity Plot of Time to Multiple Events of Renal Pain in Trial Comparing the temporal incidence of worsening renal function (Figure 3) and renal pain events (Figure 4), the beneficial separation in renal function required at least 16 months of tolvaptan therapy, whereas a reduced number of medically significant renal pain Page 10 of 224
11 events were apparent earlier than the Month 4 visit. Separation from placebo grew over the course of the trial for both of these component measures. Supporting these results, analyses of subject-reported outcomes indicated that renal pain was the most frequent event leading to hospitalizations. Tolvaptan led to nominally significant reduction in hospitalizations for renal pain odds Ratio = 0.23, 95% CI 0.09 to 0.54, p = , demonstrating the importance of this key secondary composite component (Section 5.9.2). First Hierarchically Ordered Secondary Endpoint: Tolvaptan Slowed Renal Function Decline by Approximately 30% The key secondary composite component of events of worsening renal function is better suited to capture progression of subjects with rapidly progressing disease who already have a lowered egfr. The slope of renal function decline assesses the effects of therapy in all subjects. This endpoint (using 1/serum creatinine) favored tolvaptan treatment with a slope of versus a slope for placebo of for a treatment effect of (mg/ml) 1 year 1 (95% CI to 1.783, p < ) (Section 5.7). This equates to a 32% treatment effect and is supportive of the 61% hazard reduction for worsening renal function events. Renal function slope analyses in subgroups of subjects with CKD Stage 1, CKD Stage 2 or CKD Stage 3 at baseline showed consistent effects favoring tolvaptan, with a 30-33%. reduction in rate of change. This observation demonstrates a consistent benefit of tolvaptan across the earlier phases of ADPKD and is consistent with our understanding of the progression of the illness. Another sensitivity analysis was aimed at understanding the impact of hemodynamic responses of GFR before, during, and after tolvaptan treatment. Tolvaptan results in an acute and reversible decrease in GFR which produces an acute increase in serum creatinine (Section , Figure 5). Therefore, sensitivity analyses calculating slopes incorporating all pretreatment and post-treatment data points (Analysis 1 in Table 2) or using only pretreatment and post-treatment data points (Analysis 2 in Table 2) were performed. Both of these analyses were highly statistically significant (p <0.0001) and in close agreement with the prespecified on-treatment analysis. Page 11 of 224
12 Figure 5 Mean Change in Renal Function by Reciprocal of Serum Creatinine in Trial EOT = end of treatment; GFR = glomerular filtration rate. Filled symbols = on treatment, Empty symbols = pre- or post-treatment. Table 2 Analyses of Slope of Reciprocal of Serum Creatinine in Trial Analysis Slope (mg/ml) -1 year -1 p-value Placebo Group Tolvaptan Group Treatment Effect (95% CI) Pre-specified on-treatment analysis: Week 3/EOT to Month 36 Sensitivity Analysis 1: All data, Baseline to Last Follow-up ( ) ( ) < < Sensitivity Analysis 2: Off -drug data points only, Baseline and Follow-up Visits CI = confidence interval; EOT = end of titration ( ) The primary analysis used change from a post-titration, on-treatment, steady-state value (Week 3/EOT). There are precedents for use of this approach to account for acute, Page 12 of 224
13 reversible changes in serum creatinine when evaluating long-term trends for renal function (refer to Section 5.15). 6,13,14,15,16,17 Additional sensitivity and supportive analyses were performed to test the robustness of the renal function slope results (Section ). Analyses addressing potential bias due to missing data are addressed in Section Each of these analyses produced results consistent with the primary analysis. Among the sensitivity analyses, correlation analyses demonstrated an association between TKV growth and renal function decline and TKV growth and renal pain events (Section 5.10). This supports the hypothesis that preservation of renal function by tolvaptan may be related to its reduction of cyst growth. The Pivotal Trial Results are Consistent and Convincing Tolvaptan slowed the progression of both TKV growth and renal function decline across the 3-year duration of the pivotal trial. Effects on continuous variables (TKV and egfr) were associated with parallel effects on discrete clinical outcomes of ADPKD (worsening renal function and renal pain events). These clinical outcomes are relevant as indicative of the current risk of hospitalization (due to renal pain) and the future risk of ESRD (30% decrease in egfr). Total kidney volume data from patients whose treatment with tolvaptan was interrupted and then re-initiated suggest that the benefits of tolvaptan accumulate only during treatment (Section 5.13). Treatment interruptions reduce the opportunity for maximizing clinical benefit over a patient s lifetime. Sensitivity analyses (Section 10.4) and the impact of missing data (Section 5.11) on the results of the first 3 trial endpoints (rate of change in TKV, key secondary composite, and renal function rate of change) was investigated. Results for sensitivity analyses were consistent with the endpoints primary analysis. Missing data from subjects withdrawing from Trial (23% tolvaptan versus 14% placebo) was treated as missing at random (MAR) since the imbalance was entirely accounted for by adverse events related to aquaresis or hepatic enzyme abnormalities and not due to disease progression. Additional analyses accounting for data missing not at random (MNAR) collectively suggest the preservation of a significant effect and demonstrated that missing data did not lead to false positive conclusions. Consistent results of subgroup analyses (Section 5.14) across the first 3 trial endpoints support applicability of these efficacy results to entirety of the population studied. Page 13 of 224
14 Explorations of ADPKD-related outcomes (Section 5.9) showed that subjects receiving tolvaptan reported less renal pain, nephrolithiasis, hematuria, UTI, and anemia compared with subjects on placebo. Tolvaptan reduced medical resource utilization and lost productivity due to these complications. Overall, observed benefits for ADPKD subjects are consistent with tolvaptan s expected mechanism of action, are clinically relevant and are robustly significant. Benefits for patients are expected to accrue with long-term therapy. Tolvaptan is the first therapy to be shown in a well-controlled, randomized, clinical trial to alter the course of ADPKD, potentially leading to a delay in the onset of ESRD. SAFETY Extensive Safety Database As of February 1, 2013, the safety profile of tolvaptan in the ADPKD program is based on clinical experience in 1682 subjects, nearly half of whom were exposed for at least 3 years. To date, 7551 adult subjects worldwide have been exposed to oral tolvaptan in single- and multiple-dose clinical trials in ADPKD and other indications (Section 6.1). Common AEs are Primarily Aquaretic-related The most commonly occurring AEs in Trial were related to the mechanism of action and did not often lead to discontinuation (Section 6.5). Despite these effects, approximately 75% of subjects receiving tolvaptan were able to maintain on therapy for 3 years, with approximately 50% of those who completed the trial maintaining the highest dose of 120 mg/day. Tolvaptan is a potent, specific AVP V 2 receptor antagonist that produces free water clearance (aquaresis), an ideal treatment effect for conditions such as hyponatremia and fluid overload. In subjects with ADPKD, tolvaptan s aquaretic action was associated with expected treatment-emergent adverse events (TEAEs) of thirst, dry mouth, pollakiuria, and polyuria. Discontinuations in the tolvaptan treatment group were higher due to these side effects, which presented no grave risk or persistent injury. The most frequently reported TEAEs in tolvaptan subjects in Trial (ie, reported at an incidence > 10% and at least twice that of placebo subjects) were Thirst (55.3% vs 20.5%), Polyuria (38.3% vs 17.2%), Nocturia (29.1% vs 13.0%), Pollakiuria (23.2% vs 5.4%), and Polydipsia (10.4% vs 3.5%) Page 14 of 224
15 Adverse Events of Special Interest Using data from the 3-year pivotal trial, 3 new safety signals were identified and recognized in the proposed tolvaptan label: risk for hepatic injury is listed as a Boxed Warning ; and risks for skin neoplasm (esp. basal cell carcinoma) and glaucoma are described in Warnings and Precautions. These risks are important patient management issues for a disease that requires life-long treatment and are discussed in greater detail below. Increased incidence of elevation of transaminases was observed in tolvaptan-treated subjects. Elevation (>3 x upper limit of normal [ULN]) of ALT (alanine transaminase) was observed in 4.4% (42/958) of patients on tolvaptan and 1.0% (5/484) of patients on placebo, while elevation (>3xULN) of AST (aspartate transaminase) was observed in 3.1% (30/958) of patients on tolvaptan and 0.8% (4/484) patients on placebo. An independent, expert, adjudication committee conducted a blinded review of all subjects who experienced significant elevations after tolvaptan exposure was conducted. Significant elevations were present only in ADPKD subjects, and a number of cases were adjudicated as highly likely or probable in their relationship to tolvaptan therapy. The committee identified a period of susceptibility to elevated transaminases ranging from 3 to 14 months from the beginning of treatment, suggesting the potential for mitigation in the signal through early identification with frequent monitoring. Withdrawal from treatment led to resolution of transaminase elevations to below 3xULN within 1 to 4 months. Among those identified, 2 subjects from Study met Hy s laboratory criteria (ie ALT > 3xULN and total bilirubin > 2xULN for drug-induced liver injury; a third such subject was identified from an open-label extension trial All three subjects were adjudicated as probable or highly likely due to tolvaptan, all returned to below 1xULN, and none experienced fulminant liver failure or permanent livery injury or dysfunction. Liver enzyme abnormalities were not found to be related to baseline characteristics, tolvaptan dose, or total exposure. Their pattern points to an idiosyncratic mechanism rather than direct toxicity (Section 6.8.2). Based on these findings, a theoretical estimate of the risk of observing drug-induced liver failure in patients with ADPKD is 1:3000. The committee also evaluated subjects with elevations in liver enzymes from studies in other indications with tolvaptan (eg, hyponatremia and congestive heart failure). No cases were identified that were causally related to tolvaptan suggesting that the signal for liver injury was specific to the ADPKD population. Page 15 of 224
16 Based on these findings, Otsuka has proposed warning of the risk of potential liver injury in labeling. In addition, Otsuka has proposed a REMS (risk evaluation mitigation strategy) that would mandate that physicians regularly attest that their patients are completing monthly liver monitoring for the first 18 months of therapy and periodically thereafter. If patients do not comply with monthly liver monitoring, they will not receive continued distribution of tolvaptan (Table 3). Table 3 Certification REMS Elements Physician Patients Information communicated Specialty Pharmacy Patient Registry Assurance of regular liver function tests LFT=liver function test. Proposed Risk Evaluation and Mitigation Strategy Description Physicians are required to demonstrate their knowledge of safe use to prescribe Tolvaptan Patients are educated for the safe use of Tolvaptan with the medication guide and product labeling The risk of hepatotoxicity of Tolvaptan Requirements of LFTs, prior to initiation and thereafter every month for the first 18 months (then at regular 3-6 month intervals) Only certified specialty pharmacy can dispense Tolvaptan directly to the patient All patients and their information are entered into the privacyprotected database (eg, frequency of LFT ) Physicians are required to attest every 2 months that they have ordered and reviewed the completed LFTs, and that the patient is still an appropriate candidate to continue Tolvaptan therapy The attestation is required for Tolvaptan to be shipped to patient Malignant tumors were also reported more frequently in tolvaptan-treated subjects than in placebo-treated patients (1.7% versus 0.4%) (Section ). This imbalance was primarily driven by skin neoplasms, in particular basal cell carcinomas; a finding that had not been observed in prior placebo-controlled, non-adpkd trials. While skin cancers were not clearly attributable to treatment, a causal relationship could not be excluded. Therefore, Otsuka has proposed that a new Warning and Precaution be included in product labeling for ADPKD. Finally, an imbalance was also noted in the incidence of glaucoma for tolvaptan vs. placebo treated patients in Trial (0.8% vs 0.4%, respectively). Glaucoma was observed as a very rare event in earlier clinical studies, but was not previously included in labeling. While these AEs were not clearly attributable to treatment, and a causal relationship could not be ruled out, Otsuka has again recommended that a new Warning and Precaution be included in product labeling for ADPKD. Page 16 of 224
17 BENEFIT-RISK In subjects with ADPKD, tolvaptan treatment was shown to significantly slow cyst growth (TKV) and the associated decline in renal function (egfr), as well as to provide significant reductions in the incidence of events of worsening kidney function and renal pain. Observed benefits of treatment included a nearly 50% reduction in the rate of kidney growth over 3 years, a significant delay in renal function decline across CKD stages 1-3, and a significant reduction in renal pain events leading to fewer hospitalizations. When taken together, these data suggest that tolvaptan will substantially delay the time to onset of ESRD (ie the need for dialysis and/or transplantation). Observed risks include aquaretic side-effects and the potential for liver injury, indicating the need to monitor clinical laboratory results. The potential risk for irreversible liver damage indicates careful monitoring to identify and mitigate potential harm. Otsuka is committed to working with FDA, physicians and patients to develop a REMS to address the risk of hepatic injury, including monthly monitoring of hepatic transaminases (Section 7). Tolvaptan has a favorable benefit-risk profile. ADPKD s unmet medical needs are benefited by robust efficacy on meaningful clinical endpoints. These benefits, combined with strategies to address tolvaptan s observed and expected risks, support the approval of tolvaptan for the treatment of rapidly progressing ADPKD. Page 17 of 224
18 Tolvaptan (OPC-41061) NDA Table of Contents Executive Summary...2 Table of Contents...18 List of In-text Tables...25 List of In-text Figures...28 List of Abbreviations Autosomal Dominant Polycystic Kidney Disease: An Unmet Medical Need Background on Autosomal Dominant Polycystic Kidney Disease Role of Arginine Vasopressin as a Promoter of ADPKD Epidemiology Unmet Medical Need Tolvaptan as a Treatment for ADPKD Mechanism of Action Efforts Toward Development of a Treatment for ADPKD Regulatory Milestones in the ADPKD Development Program Tolvaptan Clinical Development Program in ADPKD Overview of Clinical Development Program Pivotal Trial Design, Trial Pivotal Trial Endpoints Total Kidney Volume Composite Endpoint Other Endpoints Pivotal Trial Dose Selection and Administration Statistical Analysis Methods for Trial Sample Size Calculation Blinded Sample Size Re-calculation Analysis Datasets Prespecified Hierarchical Test Procedure Analysis of the Slope of Total Kidney Volume Growth...57 Page 18 of 224
19 Tolvaptan (OPC-41061) NDA Analysis of the Key Secondary Composite Endpoint and Its Components Analysis of the Slope of Renal Function (Reciprocal of Serum Creatinine) Other Sequentially Ordered Secondary Endpoints Analysis of the Composite PKD Outcomes Endpoint Clinical Pharmacology Pharmacokinetics Pharmacodynamics Acute Effect on Renal Function Acute Effects on Total Kidney Volume Effect on Pharmacodynamic Serum and Plasma Concentration Endpoints Effect on Free Water Clearance and Urine Volume Fluid Balance/Serum Sodium Mean Arterial Pressure Clinical Efficacy of Tolvaptan Subject Disposition in Trial Demographics, Baseline Characteristics, and Medical History in Trial Dose Titration Pattern in Trial Datasets Analyzed for Efficacy in Trial Primary Endpoint: Total Kidney Volume Slope Description of the First (Primary) Endpoint - Total Kidney Volume Slope Results of the Primary Endpoint Sensitivity Analyses of the Primary Endpoint Key Secondary Composite Endpoint Description of the Second (Key Secondary Composite) Endpoint and its Components Worsening Renal Function Event Component Renal Pain Event Component Hypertension Event Component Albuminuria Event Component...85 Page 19 of 224
20 Tolvaptan (OPC-41061) NDA Analysis Method for the Key Secondary Composite Endpoint Results of the Key Secondary Composite Analysis Sensitivity Analyses of the Key Secondary Composite Endpoint Analyses of the Individual Components of the Key Secondary Composite Endpoint Sensitivity Analyses of Components of the Key Secondary Composite Endpoint Third Endpoint: Renal Function Slope Description of the Third (Renal Function Slope) Endpoint Results of the Slope of Renal Function Sensitivity Analyses of the Slope of Renal Function Other Secondary Trial Endpoints Fourth Endpoint: Blood Pressure in Non-hypertensive Subjects Fifth Endpoint: Renal Pain Score in Subjects Untreated for Pain at Baseline Sixth Endpoint: Time to Multiple Hypertension Progression Events in Non-hypertensive Subjects Seventh Endpoint: Percentage of Subjects with Sustained Reductions in Antihypertensive Therapy PKD Outcomes Exploratory Endpoint Description of PKD Outcomes Results of PKD Outcomes Overall PKD Outcome Frequency Time to Event Analyses of Common PKD Outcomes Time to Event Analyses for PKD Outcome Composites Clinical Relevance of PKD Outcomes Frequency of Socioeconomic Impact for PKD Outcomes Hospitalizations Due to PKD Outcomes Correlation of Total Kidney Volume with Other Clinical Outcomes Missing Data Dose-Response Relationship Clinical Endpoints Trough Urine Osmolality Suppression of Urine Osmolality and Change in Clinical Outcomes Page 20 of 224
21 Tolvaptan (OPC-41061) NDA Dosing Recommendations Effect of Duration of Dosing Efficacy in Subgroups Summary of Efficacy Clinical Safety of Tolvaptan Exposure Treatment-emergent Adverse Events Serious Adverse Events Deaths Adverse Events Leading to Treatment Discontinuation Clinical Laboratory Tests Vital Signs and Electrocardiogram Events of Special Interest Rare but Clinically Significant Adverse Events Neoplasms Hepatic Injury Hepatic Adjudication Committee Methodology Hepatic Adjudication Committee Outcomes Worldwide Pharmacovigilance Data Safety Conclusions Risk Management and Net Benefit Risk Evaluation Risk Evaluation and Mitigation Strategy Risk-Benefit Analysis Reference List Appendices Table of Studies for the Tolvaptan ADPKD Clinical Program Stages of Chronic Kidney Disease Summaries of Long-term Studies in ADPDK Subjects Open-label Extension Trial Open-label Extension Trial Matched Historical Control Study Page 21 of 224
22 Tolvaptan (OPC-41061) NDA Sensitivity Analyses for the First Three Endpoints of Trial Sensitivity Analyses of the Primary Endpoint - Total Kidney Volume Slope MMRM Analysis for Non-linearity Sensitivity Analysis of Primary Endpoint Analysis Using All Available Data (Regardless of Treatment Period) Non-Parametric Analyses Accounting for Non-normal Distribution Tests Evaluating the Impact of Outlier Data and Error of TKV Measurement Analysis by Modal Dose Analysis by Center or Country Sensitivity Analyses of the Key Secondary Composite Endpoint Independent Adjudication by a Clinical Endpoints Committee Using Time to Multiple Event Sensitivity Analysis Evaluation of Individual Contributions to the Key Secondary Composite Using Time to First Event Sensitivity Analysis Sensitivity Analyses Specifically Requested by the FDA Sensitivity Analyses Restricting Data and Events During the First 3 Weeks of Treatment, During the Treatment Period Sensitivity Analyses Using or Restricting Data and Events During the First 3 Weeks of Treatment, Regardless of Treatment Period Sensitivity Analysis by Center or Country Sensitivity Analyses of Components of the Key Secondary Composite Endpoint Independent Adjudication by a Clinical Endpoints Committee Using Time to Multiple Event Sensitivity Analysis for Composite Components Evaluation of Individual Contributions to Composite Components of Worsening Renal Function and Renal Pain Events Using Time to First Event Sensitivity Analysis Sensitivity Analyses Restricting Data and Events During the First 3 Weeks of Treatment, During the Treatment Period Sensitivity Analyses of the Number of Subjects Meeting a 33.3% Increase in Serum Creatinine at Follow-up Visits from Day 1 Baseline Sensitivity Analyses Using or Restricting Data and Events During the First 3 Weeks of Treatment, Regardless of Treatment Period Page 22 of 224
23 Tolvaptan (OPC-41061) NDA Sensitivity Analysis of Renal Pain Event Component Including Covariates for Renal Pain Disease History Sensitivity Analysis Describing Categories Contributing to Renal Pain Event Component Sensitivity Analysis of Time to Multiple Renal Pain Events Excluding Those Attributed to Paracetamol Use Sensitivity Analysis by Country Sensitivity Analyses of the Slope of Renal Function Sensitivity Analysis Using Alternate Formulae for Estimating Renal Function Using Serum Creatinine Sensitivity Analysis of Slope from Pre-treatment to Post-treatment Renal Function Sensitivity Analysis of Renal Function Effects by Pre-treatment CKD Stage Sensitivity MMRM Analysis of Change from Pretreatment to Posttreatment Renal Function Sensitivity Analysis of Change from Pretreatment to Post-treatment Renal Function Sensitivity Analysis Including Serum Creatinine Data Regardless of Treatment Period Non-Parametric Analyses Accounting for Non-normal Distribution Analysis by Center or Country Analyses on Missing Data Responder Analyses Imputation and Multiple Imputation Analyses Multiple Imputation Analyses Imputation Analyses Sensitivity Analyses of the Key Secondary Composite and Its Components, Including AE Withdrawals as Events Analyses of PKD Outcomes Analyses Adjusting for Demographic and Baseline Characteristics as Covariates in the Model Influence of Demographic and Baseline Characteristics in Completer Subjects Numbers of Subjects Exposed to Immediate-release Tolvaptan Tablets in Completed or Ongoing Trials in the ADPKD Program Page 23 of 224
24 10.7 Narratives for Subjects Meeting Hy s Law Subject Subject Subject Page 24 of 224
25 Tolvaptan (OPC-41061) NDA Table 1 Table 2 Table 3 Table Table Table Table Table Table Table Table Table Table Table List of In-text Tables Primary Endpoint (Random Effect Intercept) in Trial : Total Kidney Volume Rate of Growth (%/year), ITT, Within Treatment Period...7 Analyses of Slope of Reciprocal of Serum Creatinine in Trial Proposed Risk Evaluation and Mitigation Strategy...16 Manifestations of ADPKD...35 Schedule of Assessments for Pivotal Trial Trial Endpoints (and Testing Hierarchy)...49 Percent of Subjects with Urine Osmolality Less Than 300 mosm/kg Following Split-dose Regimens of Tolvaptan; Trial Example Dosing Schedule in Trial Serum Creatinine Concentrations During Renal Function Testing Following Tolvaptan Administration to Subjects with ADPKD and Well-preserved Renal Function; Trial and Trial Subject Disposition in Trial Demographic Characteristics in Trial : Age, Height, Weight, and Race by Sex...71 ADPKD History in Trial Pretitration Baseline Renal Function and Total Kidney Volume in Trial Efficacy Datasets Analyzed (First Three Endpoints) in Trial Table Primary Endpoint (Random Effect Intercept) in Trial : Total Kidney Volume Rate of Growth (%/year), ITT, Within Treatment Period...79 Table Table Supplemental Analysis in Trial : Time to Multiple Events for Components of the Key Secondary Composite Endpoint; ITT, Within Treatment Period...89 Secondary Endpoint: Rate of Change in Renal Function in Trial ; ITT Subjects With at Least 4-month Follow-up, Excluding Observations Deemed Unreliable by Investigators, Within Treatment Period...93 Page 25 of 224
26 Table Analyses of Slope of Reciprocal of Serum Creatinine...95 Table Maximum Change from Baseline in Renal Pain Scale (0-10) in Trial ; ITT Subjects with Post-baseline Renal Pain Scale Observations, Within Treatment Period...98 Table Maximum Change from Baseline in Renal Pain Scale (0-10) by Subjects with or without Renal Pain Events in Trial ; ITT Subjects with Post-baseline Renal Pain Scale Observations, Within Treatment Period...99 Table PKD Outcomes Exploratory Endpoint in Trial : Summary of Number of Subjects with Clinically Significant Outcomes; All Subjects Followed to Trial Medication Discontinuation or Trial Completion Table Table Table Percent of Subjects in Trial with Socioeconomic Outcomes of ADPKD Related Morbidity (Ordered by Decreasing Frequency for Placebo Group Healthcare Visits) Percentage of Subjects in Trial with at Least One ADPKD Clinical Progression Event by Quartiles of Change from Baseline in Urine Osmolality MMRM Analysis of Percent Change from Baseline in Total Kidney Volume in Trial All Subjects - Intent to Treat Table Cumulative Exposure to Tolvaptan by Dose Received Table Table Table Incidence of Treatment-emergent Adverse Events in at Least 5% of Subjects in Any Group by MedDRA System Organ Class and Preferred Term in Trial Incidence of Serious Treatment-emergent Adverse Events by MedDRA System Organ Class and Preferred Term in Trial Incidence of Treatment-emergent Adverse Events Resulting in Discontinuation of Investigational Medicinal Product in at Least 0.3% of Subjects in Any Group by MedDRA System Organ Class and Preferred Term in Trial Table Summary of Laboratory Parameters of Interest in Trial Table Table Incidence of Treatment-emergent Adverse Events in the Neoplasm SMQs by MedDRA System Organ Class and Preferred Term; Trial Elevated Liver Function Tests as Assessed by Central and Local Laboratory Data Combined, All Randomized Subjects in Trial Page 26 of 224
27 Table Table Stages of Chronic Kidney Disease Key Secondary Composite Endpoint: Time to Multiple Composite ADPKD Events in Trial ; ITT, Within Treatment Period Table Categories of Renal Pain Interventions in Trial Table Table Table Table Table Table Table Table Table Table Sensitivity Analysis of Key Secondary Composite Endpoint Re-programmed Renal Pain Component - Time to Multiple Events - ITT, Within Treatment Period Sensitivity Analysis of Key Secondary Composite Endpoint Re-programmed Renal Pain Component with Paracetamol Events Removed - Time to Multiple Events - ITT, Within Treatment Period Rate of Change in Renal Function by CKD Stage Using CKD-EPI Formula in Trial ; ITT, Including Observations at Pretitration Baseline and Follow-up Visit 1 and Sensitivity Analysis: Responder Analysis - ITT, Within Treatment Period Multiple Imputation on MMRM Analysis of Change from Baseline in TKV Growth (%) and Renal Function Decline (Reciprocal of Serum Creatinine) at Month 36; ITT, Regardless of Treatment Period Multiple Imputation on Analysis of Time to Multiple Event (Key Secondary Composite and Renal Pain and Renal Function Components); ITT, Regardless of Treatment Period Time to Event Sensitivity Analyses for the Key Secondary Composite Endpoint and Combined Renal Function/Pain Components Accounting for Missing Data (Withdrawals Due to SAEs or Non-Serious Severe Adverse Events Counted as Events in the Analysis) Demographics, Baseline Characteristics, and ADPKD Medical History in Completer and Early Withdrawn Subjects in Trial Analyses of Demography, Medical Status and Medical History on Primary and Secondary Endpoints of Interest in Trial Numbers of Subjects Exposed to Immediate-release Tolvaptan Tablets in Completed or Ongoing Trials in the ADPKD Program Page 27 of 224
28 Tolvaptan (OPC-41061) NDA List of In-text Figures Figure 1 Figure 2 Figure 3 Figure 4 Figure 5 Figure Figure Figure Figure Figure Figure Figure Figure Figure Figure Figure MMRM Analysis of Percent Change from Baseline in TKV in Trial Forest Plot of the Secondary Key Composite Endpoint and Components in Trial ; ITT, Within the Treatment Period...9 Cumulative Intensity Plot of Time to Multiple Events of Worsening Renal Function in Trial Cumulative Intensity Plot of Time to Multiple Events of Renal Pain in Trial Mean Change in Renal Function by Reciprocal of Serum Creatinine in Trial ADPKD Effects Begin at the Nephron - the Vital Basic Functional and Structural Unit of the Kidney...36 Proposed Mechanistic Action of Tolvaptan in ADPKD Outcomes...39 Tolvaptan ADPKD Clinical Program...44 Trial Design Schematic...46 Mean Tolvaptan Plasma Concentrations (A) and Mean Urine Osmolality Plotted at the End-time of the Collection Interval (B) Following Ascending Single Oral Doses of Tolvaptan in Eight Subjects with ADPKD; Trial Mean Tolvaptan Plasma Concentrations, Median Urine Osmolality and Individual Trough Spot Urine Osmolality at Baseline and Following 90/30 mg Tolvaptan Administered for 7 Days to 12 Subjects with ADPKD; Trial Time Course of Dose Titration by Treatment Group in Trial Distribution of Trial Trial Population by Baseline CKD Stage Classification (Renal Function Estimated by CKD-EPI Formula)...72 Titration Pattern Over Time in Trial Percent Change from Baseline in Total Kidney Volume in Trial ITT, Within Treatment Period...80 Cumulative Hazard Functions of Time to Multiple Events for the Key Secondary Composite Endpoint in Trial ; ITT, Within Treatment Period...87 Page 28 of 224
29 Figure Figure Figure Figure Figure Figure Figure Figure Figure Figure Figure Figure Figure Figure Cumulative Hazard Function of Time to Multiple Events for Components of the Key Secondary Composite Endpoint in Trial Rate of Change in Renal Function in Trial ITT Subjects With at Least 4-month Follow-up, Excluding Observations Deemed Unreliable by Investigators, Within Treatment Period...94 Mean Change in Renal Function by Reciprocal of Serum Creatinine in Trial Cumulative Hazard Functions of Time to Multiple ADPKD Outcomes (All Thirteen Items) Cumulative Hazard Functions of Time to Multiple ADPKD Outcomes (Nine Items) Correlation of Annualized Percent Change in Total Kidney Volume and Change in Kidney Function; Combined Data from Trial and Trial In Comparison with Natural History Data from Two NIH Studies Correlation of Annualized Percent Change in Total Kidney Volume and Change in Kidney Function in Trial Worsening Renal Function Component Events by Height Adjusted Total Kidney Volume in Trial Renal Pain Component Events by Height Adjusted Total Kidney Volume in Trial Box plots of AUCss Values Estimated Using Population Pharmacokinetic Model for Subjects in Trial Kaplan-Meier Plot of Time to Multiple ADPKD Clinical Progression Events in Trial by Quartiles of Change in Urine Osmolality at the Corresponding Time of the Event Percent Change From Predose Baseline in Total Kidney Volume Through Month 36 (All Subjects and Extension Cohort) and Through the Extension (Extension Cohort) in Trial (Using Perceptive Imaging Assessments) Subgroup Analyses of TKV Annualized Rate of Growth (%/year) and 95% Confidence Intervals in Trial Subgroup Analyses of Time to Multiple Events of the Key Secondary Composite Endpoint and 95% CIs in Trial Page 29 of 224
30 Tolvaptan (OPC-41061) Figure Figure Figure Figure Figure Figure Figure Figure Figure Figure Figure Figure Figure Figure Figure Figure Figure Figure NDA Subgroup Analyses of Annualized Change in Renal Function (1/Serum Creatinine [mg/ml] -1 year -1 ) and 95% CIs in Trial Characteristics Predictive of More Rapid Disease Progression Time Course of GFR Before, During and After Withdrawal of Tolvaptan or Placebo Treatment; Trial Time Course of GFR Before, During and After Withdrawal of Antihypertensive Treatment (Published Data) Kaplan-Meier Curves of Time to First Aquaretic-related Treatment-emergent Adverse Events in Trial Process for Screening and Evaluation of Hepatic Safety Data From the ADPKD Program Adjudication Results for the ADPKD Program as of the NDA Cutoff of 31 Mar Kaplan-Meier Curves for Time to First Elevation in ALT of Greater Than 3 Times ULN, Safety Population Subject (Tolvaptan) Adjudicated: Probable (Tolvaptan) Adjudicated: Probable (Tolvaptan) Adjudicated: Highly Likely MMRM Analysis of Percent Change from Baseline in Total Kidney Volume in Trial ; ITT - Within the Treatment Period MMRM Analysis of Percent Change from Baseline in Total Kidney Volume in Trial ; ITT - Regardless of Treatment Period By-Center Analysis of Rate of Growth in TKV in Trial ; ITT, Within Treatment Period By-Center Analysis of Time to Multiple Events of the Key Secondary Composite Endpoint in Trial ; ITT, Within Treatment Period By-Country Analysis of Time to Multiple Events of the Key Secondary Composite Endpoint in Trial ; ITT, Within Treatment Period By-Country Analysis of Time to Multiple Events of the Renal Pain Component of the Key Secondary Composite in Trial ; ITT, Within Treatment Period By-Country Analysis of Time to Multiple Events of the Renal Function Component of the Key Secondary Composite in Trial ; ITT, Within Treatment Period Page 30 of 224
31 Figure Figure Figure MMRM Analysis of Change from Pretitration Baseline in Renal function, Estimated by Reciprocal of Serum Creatinine in Trial ITT Regardless of the Treatment Period By-Center Analysis of Rate of Change in GFR Estimated by CKD-EPI Formula in Trial ; ITT Subjects With at Least 4-month Follow-up, Excluding Observations Deemed Unreliable by Investigators, Within Treatment Period By-Country Analysis of Rate of Change in GFR Estimated by CKD-EPI Formula in Trial ; ITT Subjects With at Least 4-month Follow-up, Excluding Observations Deemed Unreliable by Investigators, Within Treatment Period Page 31 of 224
32 List of Abbreviations ADPKD AE ALT ANCOVA AST AUC AUCss AUC AVP BP BT BUN camp CEC CI CKD CL/F C max C min,ss CMQ CrCL CRISP CSR CYP dbp DILI ecrcl ecrcl CG egfr egfr CKD-EPI egfr MDRD ETASU ESHD ESRD EOT ET Autosomal dominant polycystic kidney disease Adverse event Alanine aminotransferase Analysis of covariance Aspartate aminotransferase Area under the concentration-time curve Area under the concentration-time curve from 0 to 24 hours at steady state Area under the concentration-time curve t steady state Arginine vasopressin Blood pressure Bilirubin, total Blood urea nitrogen 3'-5'-cyclic adenosine monophosphate Clinical Events Committee Confidence interval Chronic kidney disease Apparent total body clearance following extravascular administration Maximum plasma concentration Minimum plasma concentration from 0 to 24 hours at steady state Custom MedDRA query Creatinine clearance Consortium for Radiologic Imaging Studies of Polycystic Kidney Disease Clinical study report Cytochrome P-450 enzyme Diastolic blood pressure Drug induced liver injury Estimated creatinine clearance Estimated creatinine clearance determined using the Cockcroft-Gault formula Estimated glomerular filtration rate Estimated glomerular filtration rate by the Chronic Kidney Disease Epidemiology Collaboration Estimated glomerular filtration rate by the Modification of Diet in Renal Disease formula Elements to Assure Safe Use End stage hepatic disease End stage renal disease End of titration Early termination Page 32 of 224
33 EU FDA FWC GFR HFM HR HTN ICH IM IR IV IVRS ITT LS MAP MAR Max MedDRA mgfr Min MMRM MNAR MRI NDA NIH OC OPC OPDC OTC PD PK PKD PMDA QTc REMS SAE sbp SD SOC SPA t 1/2,z TEAE TKV US UTI European Union Food and Drug Administration Free water clearance Glomerular filtration rate High fat meal Hazard ratio Hypertension International Conference on Harmonisation Intramuscular Immediate release Intravenous Interactive voice response system Intent-to-treat Least squares Mean arterial pressure Missing at random Maximum Medical Dictionary for Regulatory Activities Measured glomerular filtration rate Minimum Mixed model repeated measures Missing not at random Magnetic resonance imaging New drug application National Institutes of Health Observed cases Otsuka Pharmaceutical Company, Ltd Otsuka Pharmaceutical Development & Commercialization, Inc Over-the-counter Pharmacodynamic Pharmacokinetic Polycystic kidney disease Pharmaceuticals and Medical Devices Agency Corrected QT (interval) Risk Evaluation and Mitigations Strategy Serious Adverse Event Systolic blood pressure Standard deviation System organ class Special protocol assessment Elimination half-life during the terminal elimination phase Treatment-emergent adverse event Total kidney volume United States Urinary tract infection Page 33 of 224
34 1 Autosomal Dominant Polycystic Kidney Disease: An Unmet Medical Need 1.1 Background on Autosomal Dominant Polycystic Kidney Disease Autosomal dominant polycystic kidney disease (ADPKD) is a rare, hereditary, systemic disease characterized by progressive development of cysts that impinge on and ultimately disrupt normal kidney architecture. It is the leading monogenic cause of heritable chronic renal failure and demonstrates considerable phenotypic variability. The PKD1 and PKD2 genetic variants of ADPKD appear to differ primarily in the relative number of renal cysts formed at any given age, not in the rate of their growth. 18,19,20,21,22,23 ADPKD gene defects disrupt the normal differentiated phenotype of renal tubular epithelium. The mutations lead to increases in intracellular 3'-5'-cyclic adenosine monophosphate (camp) leading to a loss of mitotic polarity, increased cellular proliferation and apoptosis, and fluid secretion into cysts. 11,24,25,26 Cyst growth displaces and destroys normal kidney tissue, culminating in fibrosis, renal architectural derangement, and ultimately kidney failure. 11,24 An estimated 45% to 70% of patients with ADPKD progress to ESRD by age A cyst-filled kidney can eventually weigh up to 20 pounds or more. 20 This burden may result in intermittent episodes of acute pain, as cysts rupture or hemorrhage. At least one quarter of adults with ADPKD are asymptomatic; however, diagnostic testing for the disease in patients with a family history of the disease may have unintended negative impacts, as denial of health and life insurance for individuals with ADPKD is not uncommon. 27 Studies of ADPKD have shown that it progresses at varying rates, but typically does not manifest as detectable loss of renal function until quite late in the course of the disease, when parenchymal deterioration has reached a point where serious therapeutic interventions are necessary. 28 The number, distribution, and growth rate of cysts determine the timing and severity of related clinical outcomes. 18,27,29 Negative clinical outcomes begin years to decades before declining renal function can be detected, leading to kidney failure for many but not all patients. 3,21,10 Most ADPKD patients present with symptoms such as hypertension, flank pain, urinary tract infection (UTI), nephrolithiasis, gross hematuria or a palpable abdominal mass. 27,30,31 In the later stages of the disease, multiple organs become involved and can manifest as a broad spectrum of complications, as shown in Table Page 34 of 224
35 Table Manifestations of ADPKD Symptoms Observed in Early Stages Outcomes and Consequence of Long-term ADPKD Often Leading to Diagnosis Hypertension Aneurysms Hematuria Seminal Vesicle, Dura, and Arachnoid Cysts Polyuria Vascular Dissections Nocturia Valvular Heart Disease Palpable Kidneys Dilated Cardiomyopathy Kidney Stones Pericardial Effusion Abdominal/Flank Pain Renal Artery/Vein Occlusions Hernia Bile Duct Dilation Diverticulosis Hepatic Cysts Recurrent Urinary Tract Infections Pancreatic Cysts Intraductal Papillary Mucinosis Neoplasms Male Infertility 1.2 Role of Arginine Vasopressin as a Promoter of ADPKD Arginine vasopressin (AVP) is a neuropeptide hormone released from the posterior pituitary. Arginine vasopressin causes vasoconstriction via vascular V 1a receptors and promotes water reabsorption in the kidneys via V 2 receptors, both of which are G proteincoupled transmembrane receptors. A decrease in blood pressure (BP), or an increase in plasma osmolality, leads to an increase in blood AVP concentrations. The cells forming early cysts appear to arise from the collecting duct, a tissue where AVP is a principle stimulator of camp, which appears to stimulate cyst development and growth through proliferation and secretion. 23 Arginine vasopressin, by increasing camp intracellular signaling, leads to chloride transport- mediated fluid secretion into the cysts and, separately, promotes proliferation of the lining cells. 9,21 Cyst formation and expansion disrupts normal kidney structure, impacting hemodynamic flow, leading to ischemia, fibrosis and decreased nephron number and function. As shown in Figure 1.2-1, cysts grow from nephrons, separate from the nephrons, and then continue to enlarge, causing the kidneys to enlarge as well. Page 35 of 224
36
37 1.3 Epidemiology The worldwide prevalence of ADPKD varies between less than 1:2000 to 1:4000. In the United States (US), ADPKD is the fourth leading cause of kidney failure, affecting all races and genders equally. The number of diagnosed ADPKD cases in the US in 2009 was estimated at 116,228, which supported tolvaptan s orphan designation. 29,32,33,34, Unmet Medical Need Currently there is no available pharmacologic therapy that targets the underlying pathophysiology of ADPKD. Existing therapies are palliative, targeting pain, infection, and hypertension. Dialysis, surgical intervention, and transplantation may be necessary. Often, the only definitive intervention for renal complications in ADPKD is kidney transplantation, which typically occurs after years of peritoneal or hemodialysis and complications associated with them. These chronic complications contribute to early and ever increasing life-long morbidity and mortality. ADPKD is the fourth highest cause leading to ESRD. 8 Medical research has made little progress in delaying the time to development of ESRD in the current patient generation versus the previous one. 36 Moreover, once kidney function is compromised beyond an estimated glomerular filtration rate (egfr) < 30 ml/min, healthcare utilization costs incurred by ADPKD patients rise steeply, 8 further underscoring the importance for patients, their families, and society at large for an intervention that slows the progression of ADPKD and delays initiation of renal replacement therapy. 2 Tolvaptan as a Treatment for ADPKD 2.1 Mechanism of Action In 1999, the mechanisms of pathologic response to AVP in PKD animal models were first reported, leading to the initiation of the tolvaptan ADPKD development program. In animal models of ADPKD, endogenous AVP is elevated and elevates renal camp, which leads to increased cyst fluid accumulation and epithelial cell growth. 10,11 In human subjects with ADPKD, elevated plasma AVP concentrations, and/or exaggerated response of AVP to fluid deprivation or a sodium challenge, have been observed. 18,19,23 Tolvaptan is a highly selective AVP V 2 receptor antagonist with an affinity for the human V 2 receptor that is 1.8 times that of native AVP. 37 Tolvaptan affinity for the V 2 receptor Page 37 of 224
38 is 29 times greater than for the V 1a receptor. When taken orally, tolvaptan prevents the binding of AVP at the V 2 receptor in the kidney. The decreased binding of AVP to the V 2 receptor lowers adenylate cyclase activity, resulting in a decrease in intracellular camp concentrations. 11,24 Inhibition of AVP binding at the V 2 receptor was shown to delay development of renal cysts in several models of PKD including human nephronophthisis (pcy mouse), 38 autosomal recessive polycystic kidney disease (ARPKD; PCK rat), 25,39 and ADPKD (PKd2 WS25/ mouse). 40,41 Other models of AVP reduction 12,42 also provided substantive evidence of the critical importance of the role of AVP in the pathogenesis of ADPKD. In human ADPKD cyst epithelial cells, tolvaptan inhibited AVP-stimulated in vitro cyst growth and isosmotic transepithelial secretion of chloride into cysts. 43 As a selective V 2 receptor inhibitor, tolvaptan would act on those cells from which ADPKD cysts appear to arise. As shown in Figure 2.1-1, camp increases secretion and proliferation, which leads to cyst formation and increase in total kidney volume. 18,43 By modulating cyst cell proliferation and secretion of fluids into cysts, tolvaptan was hypothesized to have a beneficial effect on the downstream clinical consequences of ADPKD, ie, egfr, renal pain, hypertension, and albuminuria. Inhibition of the V 2 receptor in the kidney epithelial cells also prevents aquaporin 2 containing vesicles from fusing with the plasma membrane, which, in turn, causes an increase in urine water excretion that results in an increase in free water clearance (aquaresis) and a decrease in urine osmolality. In Figure 2.1-1, aquaresis is shown as a mechanism by which V 2 receptor blockade might increase the incidence of adverse events (AEs) such as polyuria and thirst. V 2 receptor blockade in non-cystic cells, however, produces a physiologic response which can be used to monitor effective AVP blockade, ie, decreases in urine osmolality. Page 38 of 224
39 Figure Proposed Mechanistic Action of Tolvaptan in ADPKD Outcomes egfr = estimated glomerular filtration rate; TKV = total kidney volume; Sx = symptoms. Reprinted (with adaptation) with permission from Evaluation of biomarkers and surrogate endpoints in chronic disease, 2010, 44 by the National Academy of Sciences, Courtesy of the National Academies Press, Washington, D.C. Reduction or blockade of AVP can be assured when the concentration of urine falls below that of plasma (roughly mosm/kg). Continuous inhibition of the V 2 receptor, as evidenced by continuous suppression of urine osmolality, was shown in animal PKD models to be more efficacious in decreasing the rate of TKV. Because tolvaptan acts through blockade of AVP activation of the V 2 receptor, there is no expectation that tolvaptan would confer a benefit in tissues where V 2 receptors are not present, eg, hepatic cholangiocytes. 2.2 Efforts Toward Development of a Treatment for ADPKD Over 30 years of research and collaboration among a broad and diverse group of organizations has culminated in tolvaptan being the first intervention to provide convincing evidence of a favorable impact on the progression of ADPKD. This evidence exists in the demonstration of inhibiting kidney cyst growth, reducing events relating to kidney pain, and slowing the decay of kidney function. Starting in 1982, when the Polycystic Kidney Disease Foundation was established with the goal of finding a treatment, there have been significant advances by organizations including National Institutes of Health (NIH), PKD Foundation, the Food and Drug Administration (FDA; Page 39 of 224
40 the Agency), the PKD Outcomes Consortium/Critical Path Institute, and industry, including companies like Otsuka. Progress has included the identification of the PKD1/PKD2 genes, the identification of the vasopressin receptors as therapeutic targets, the identification of meaningful clinical endpoints for interventional trials, and the execution of the largest clinical program (tolvaptan) for study of an intervention for this disease. 2.3 Regulatory Milestones in the ADPKD Development Program The tolvaptan ADPKD clinical development program began in 2004 concurrent with ongoing hyponatremia and congestive heart failure programs. The ADPKD program is global in scope, with 17 ongoing or completed trials conducted in the 3 major International Conference on Harmonisation (ICH) regions. The trial details are summarized in Section Otsuka held scientific advice meetings regarding the ADPKD development program with the US FDA (March and November 2005), European Medicines Agency (24 Oct 2005), and the Japan Pharmaceuticals and Medical Devices Agency (22 Nov 2005). In the US, the development program for tolvaptan for ADPKD was granted Fast Track designation on 20 Jan 2006 and Orphan Drug designation on 06 Apr In Japan, the program was granted Orphan Drug status on 11 Aug Regulatory input sought and obtained from the US FDA contributed to the design and analysis of the pivotal trial, Certain key aspects of this feedback and how it shaped the development program are described below. A Pre-investigational New Drug Meeting was held on 16 Mar 2005; key points included: Alternative endpoints were suggested, including those that could be measured in a reasonable time, including hypertension, renal function decline, and hematuria. Non-clinical and clinical pharmacology studies are adequate. Dose selection approaches were discussed. A special protocol assessment (SPA) for trial was submitted on 18 Aug 2005, to which the FDA responded on 29 Sept 2005 and discussed in a meeting on 15 Nov Specific protocol recommendations included: Target population in the protocol is reasonable. Titration approach for dosing accepted as the best use of available patients is to titrate them to the highest dose. The design is therefore acceptable. If the hypothesis that early treatment is necessary to affect outcome is correct, we recognize the difficulty in demonstrating the effects in renal function, a late consequence. On the other hand, there is no intervention to alter renal volume that is known to affect renal function, so it is hard to accept renal volume as a Page 40 of 224
41 surrogate. Even if one thought it reasonably likely to predict favorable changes in renal function many years later, patients seem unlikely to remain on placebo for long after the drug is available. It will therefore be possible only to observe the placebo-treated and tolvaptan-treated patients on long-term tolvaptan. It is possible, of course, that the 3-year delay in treatment in the placebo group will lead, years later to earlier development of renal dysfunction. "... keeping volume as the primary endpoint and the suggested composite as a needed endpoint that would be reviewed if the volume effect were favorable. We suggest you craft a composite end-point including the various serious manifestations of the disease - pain requiring surgical decompression, hematuria, infection, nephrolithiasis, and perhaps others. This could be assessed as a time-tofirst event or as a measure of total burden of disease over time. Consider a sequential analysis, with the first endpoint rate of renal volume changes as proposed. The second, tested at p=0.05 if the first is successful, would be the [composite] endpoint... You would need to choose others [endpoints]. Certainly, rate of GFR change would be important. A key secondary composite endpoint must be favorable to provide evidence of effectiveness. Subjects withdrawn for any reason should be followed for outcomes until the end of the study. The analysis of the primary endpoint will need a conservative plan for handling excess withdrawals from the tolvaptan treatment arm. The Agency expressed a willingness to consider different methods for imputing various types of missing data. The Agency agreed if the primary endpoint and composite endpoint are both statistically significant, with other endpoints supportive, the single phase 3 trial would be sufficient to support New Drug Application (NDA) approval. The protocol with detailed statistical methodology was submitted in March 2006 to the FDA. On 10 June 2009, a Statistical Meeting was held with FDA. FDA stated that we do not currently accept changes in kidney volume as a surrogate endpoint and thus will place emphasis on the findings for your key secondary composite endpoint. FDA noted it did not consider changes in renal volume as an irrelevant endpoint and commented that showing an effect of tolvaptan on renal volume provides supportive data. The Agency indicated that were they to consider the primary endpoint of change in TKV as anything more than a gatekeeper, they would agree to a proposed use of mixed-measures repeat model (MMRM) sensitivity analysis. The FDA stated, A p-value < 0.05 from a single trial is acceptable for your primary efficacy endpoint because we do not consider this endpoint a surrogate of benefit. In order to provide convincing evidence of treatment benefit, the composite key secondary endpoint will need a p-value < Page 41 of 224
42 The Agency noted that it is important to establish whether or not tolvaptan s effect on these endpoints (serum creatinine, urinary albumin, blood pressure) persists off treatment. If these benefits persist, it would be easier to believe that tolvaptan therapy led to a change in the underlying renal anatomy/disease process. To help address this issue, the sponsor proposed measuring key endpoints at a follow-up visit 14 days after study subjects have completed therapy. The sponsor agreed to adjudication of the key secondary composite events. Notable correspondence with the Agency dated 23 Mar 2012, prior to trial unblinding, related that the potential consideration of TKV as a surrogate marker, which could lead to a pathway for approval (eg, for Trial ) via the Subpart H regulations, was declined by FDA. A Pre-NDA Meeting was held on 19 Jul Therein, the Agency agreed that the efficacy and safety results of the single, pivotal trial were adequate to support a filing. The Agency reiterated that they do not currently accept changes in kidney volume as a surrogate endpoint and thus will place (review) emphasis on the findings for the key secondary composite endpoint. Otsuka discussed with FDA the new findings for DILI and Otsuka s proposed risk management strategy, including plans for adjudication of suspect cases of liver injury. In November 2012, a meeting was held with FDA to discuss the hepatic adjudication report and the proposed risk mitigation plan. At this point, actions taken to monitor subjects in ongoing clinical trials and methods to disseminate information to patients currently taking Samsca (tolvaptan) were discussed. This culminated in the distribution of Dear Healthcare Provider letters on 22 January 2012 and 01 May Tolvaptan was approved initially in 2009 by the FDA and the European Union (EU) for the treatment of specific forms of hyponatremia and in 2010 by Japan for the adjunct treatment of volume overload in heart failure. It has since been approved in 10 markets (US, EU, Hong Kong, Japan, Taiwan, Canada, Republic of Korea, China, Indonesia, and Australia) for various forms of hyponatremia and also volume overload in heart failure (Japan). With dose ranges of 7.5 to 15 mg/day approved in Japan and 15 to 60 mg/day approved in all other regions, a comprehensive assessment of safety has been submitted in support of prior regulatory approvals. This assessment identified the most common AEs associated with tolvaptan as being related to its mechanism of action (eg, thirst, polyuria). Additionally, a mortality trial in over 4000 acutely decompensated heart failure patients given 30 mg once daily demonstrated that in a best standard of care setting, adjunctive tolvaptan was noninferior to adjunctive placebo for mortality or cardiovascular morbidity. Page 42 of 224
43 3 Tolvaptan Clinical Development Program in ADPKD 3.1 Overview of Clinical Development Program Tolvaptan's clinical development extended from prior programs in other indications to the ADPKD population and its particular needs. The pivotal trial of the ADPKD program consists of a 3-year, multinational, randomized, double-blind, placebo-controlled trial in 1445 subjects (Trial ; also known as the TEMPO 3:4 trial) 45 (see Section 3.2). This trial was developed based on phase 2 confirmation of effective dose range and is supported by trials addressing key safety, efficacy, pharmacokinetic (PK), and pharmacodynamic (PD) questions. The ADPKD clinical program comprises 17 completed or ongoing trials, as shown in Figure (see also Section 10.1). Note that, while a modified-release (MR) formulation of tolvaptan is being studied in ADPKD subjects, the focus of the current marketing application is the immediate-release (IR) formulation. In addition to the pivotal Trial , five phase 2 and 3 open-label extension trials (Trials , , , , and ) in ADPKD subjects were designed to evaluate safety and long-term efficacy outcomes (TKV, egfr) with tolvaptan, including (in Trial ) the effects of interrupted treatment. Combined data from the 2 completed trials, and (N = 63 subjects), were analyzed in comparison with a matched cohort of untreated ADPKD subjects receiving standard of care (analysis designated as Study ). The natural history matched-control data were derived from 2 NIH studies: Modification of Diet in Renal Disease (MDRD) 13 and CRISP I. 3 Refer to Section 10.3 for by-trial summaries of the 2 completed open-label extension trials and , as well as for the matched-control comparison Study In addition to the long-term trials, data on the PK/PD of tolvaptan, including urine osmolality, TKV and/or GFR, are available from 6 clinical pharmacology trials in ADPKD subjects with varying degrees of renal function. In total, 1682 subjects have been exposed to the proposed IR formulation of tolvaptan used in the ADPKD program. Clinical data in other indications (7551 adult subjects worldwide) and marketing experience were also considered in the safety evaluation for use of tolvaptan in patients with ADPKD. Page 43 of 224

44
45 classification (PKD1, PKD2), as the phenotypic expression is more predictive of disease outcome. The trial began with a screening period for baseline evaluation, and proceeded to a treatment period that included an initial titration phase of up to 3 weeks followed by a long-term maintenance phase up to 36 months, and 2 follow up visits after discontinuation of trial medication. Subjects were evaluated weekly during the titration phase and every 4 months (monthly for subjects at Japanese sites) starting from Month 4 through Month 36. Follow up Visit 1 occurred 7 to 21 days after the Month 36 visit, and Follow up Visit 2 occurred 7 to 21 days after Follow up Visit 1. The trial design schematic is shown in Figure Page 45 of 224

46 Figure Trial Design Schematic Page 46 of 224
47 The schedule of assessments is provided in Table Assessments at post-titration and following end of treatment were conducted to assess the anticipated acute effects of tolvaptan on urine osmolality and serum creatinine, and their response to treatment initiation and withdrawal. MRI assessments for evaluation of TKV were performed annually, and assessments of renal function, PKD Outcomes, and safety were performed every 4 months, or at early termination (ET). MRI assessments were performed at ET only if the preceding assessment was performed no less than 6 months earlier, based on an expectation that minimal differences in TKV would require at least 6 months to be detectable. 49 Table Schedule of Assessments for Pivotal Trial Screening Baseline Day -31 to Day Randomization Day 1 Titration Wk 1, 2 Wk 3/ EOT Mo 4, 8, 16, 20, 28, Mo 12, 24 Mo 36/ET a Assessment Informed Consent X X Inclusion/Exclusion X X X Medical/ADPKD X X X X X X X X X History FU Visits (7-21 days after Mo 36/ET and 7-21 days after FU #1) Concomitant meds X X X X X X X X X Adverse Events X X X X X X X X X Tolerability X X X X X Physical Exam b,c D X D D D D D X D VS/weight c X X X X X X X X X ECG X X X X Blood/urine: PK X X X X Blood/urine: PD X X X X Blood/urine: Safety c X X X X X X X X X Urine Pregnancy X X X X X X X X 1 Endpoint MRI X X X d Composite 2 X X X X X X X Efficacy Endpoints Labs/Pain/BP e PKD Outcomes X X X X X X X X Nonfasting spot X X urine osmolality X f Fasting spot urine X osmolality X g Stratify/Randomize X D = directed; EOT = end of titration; ET = early termination; FU = follow-up; Mo = month; Wk = week. a Telephone contact (for outcomes only) occurred through Follow up Visit 2 for randomized subjects who discontinued from investigational product administration. Page 47 of 224
48 b A complete exam was required at Baseline and Month 36/ET. For all other visits, a directed exam should be conducted at the investigators discretion if deemed necessary to assess changes in Medical History, AEs or other medically indicated parameters (D=directed). c In Japan subjects visited study sites monthly ( 2 weeks) to undergo physical examinations, safety laboratory assessments, and measurement of vital signs (heart rate, BP, and body weight). d MRI was performed at, or as near to, a clinical ET visit as was practical. MRI was done only if >6 months had elapsed since the last MRI and was not repeated beyond the ET visit. e Blood required for renal function included serum creatinine; urine for renal function included spot albumin/creatinine ratio; clinic exam for BP; standardized renal pain score to be assessed in conjunction with confirmation of renal origin of pain by exam and/or history. f Nonfasting spot urine osmolality was not done at ET visit. g Performed only at Follow-up Visit 2. If a subject wished to withdraw from the trial or trial medication, they were first asked to give their permission for additional follow up. Follow up minimally consisted of investigators contacting subjects by telephone at trial-specified visit intervals for collection of self-reported PKD Outcomes (ie, clinical outcomes associated with ADPKD disease progression) through Month 36 and the 2 trial follow-up visits. If subjects did not give permission for follow up, they were not followed further. Eligible subjects were randomized to receive either tolvaptan or placebo in a 2:1 ratio. Subjects were stratified by presence of HTN at baseline (systolic BP [sbp] > 139 mmhg and/or diastolic BP [dbp] > 89 mmhg or antihypertensive treatment), baseline ecrcl (< 80 ml/min), and baseline TKV (< 1000 ml). In addition, centralized randomizations were performed in each region independently (the Americas, Japan, and Europe plus Australia) so that there were 24 strata in this trial. Blocks (in size of 3) of randomization code generated by computer were assigned to each of the strata at the beginning of the trial. Subjects were ineligible if they were allergic to tolvaptan or related compounds, were unaware of thirst, had conditions (eg, recent kidney surgery) or therapies (eg, chronic diuretics, experimental therapies) likely to limit successful completion or confound assessments, or had contraindications to MRI imaging. All subjects remained on standard concomitant medications. Concomitant use of potent cytochrome P450 (CYP) 3A4 inhibitors was avoided. In this trial, 3 split-dose regimens of tolvaptan (45/15 mg, 60/30 mg, and 90/30 mg) were selected to provide as constant and complete an inhibition of the AVP V 2 receptor as would likely be tolerated by individuals taking tolvaptan chronically (refer to Section 3.4). Page 48 of 224
49 An IDMC periodically reviewed unblinded trial results provided by a sponsorindependent data analysis center to evaluate the treatments for excess AEs, determine whether the basic trial assumptions remained valid, and judge whether the overall integrity and conduct of the trial remained acceptable. This committee made recommendations to the Steering Committee for the trial, which had the responsibility to accept, reject, or to modify the IDMC s recommendations. Additionally, an independent Clinical Events Committee (CEC) adjudicated data for disease progression events contributing to the key secondary composite endpoint to confirm that they were consistent with clinically relevant levels of progression, providing independent verification of events for sensitivity analysis. 3.3 Pivotal Trial Endpoints A list of the Trial endpoints is provided in Table The endpoints for this trial were selected on the basis of their representing clinically meaningful outcomes that lie on the continuum to ESRD. They were selected as being specific for ADPKD based on available literature and current scientific research. Table Primary (first) Trial Endpoints (and Testing Hierarchy) Rate of kidney volume (total, both kidneys) change (normalized as percentage) from baseline for tolvaptan (combining all doses) relative to placebo Key Time to multiple investigator-reported ADPKD clinical progression events for tolvaptan secondary (combining all doses) relative to placebo while on treatment, including: (second) Onset or progression of HTN (BP measurement, need for HTN treatment), Severe renal pain (requiring medical intervention), Worsening albuminuria (by category), and Worsening renal function (25% decrease in 1/serum creatinine [ie, 33% increase in serum creatinine] between the Week 3/end of titration [EOT] and Month 36 visits ) Other Rate of renal function change from the Week 3/EOT to the last on-drug trial visit. The secondary primary measure was reciprocal of serum creatinine. Additional analyses using other (3rd methods of estimating renal function were performed. through For subjects who were nonhypertensive at baseline, change from baseline for resting 7th) mean arterial pressure (MAP) at scheduled clinic visits until taking antihypertensives. Change from baseline in renal pain as assessed by a 0 to 10 pain scale as average area under the concentration-time curve (AUC) between baseline and the last trial visit or the last visit prior to initiating medical (eg, narcotic or antinociceptives [eg, tricyclic antidepressants]) or surgical therapy for pain. For subjects who were nonhypertensive at baseline, time to progress to a) high-pre-htn (sbp > 129 mmhg and/or dbp > 84 mmhg), b) HTN (sbp > 139 mmhg and/or dbp > 89 mmhg), or c) requiring antihypertensive therapy. For subjects who were taking antihypertensive therapy at baseline, percentage with clinically sustained decreases of BP leading to a sustained reduction in antihypertensive therapy compared with baseline (while taking trial medication) at visits on Months 12, 24, and 36 for hypertensive subjects. Page 49 of 224
50 Table Exploratory (not ordered) Trial Endpoints (and Testing Hierarchy) Change from pretreatment baseline to post-treatment Follow-up Visit 2 in the components of the key secondary composite endpoint to demonstrate the clinical wellbeing of the subjects randomized to the trial. Changes from the Month 36/Early Termination (ET) visit to Follow-up Visit 2 in the components of the key secondary composite endpoint to determine the maintenance of clinical benefit and to exclude acute effects of tolvaptan. Change from pretreatment baseline to post-treatment Follow-up Visit 2 in urine concentrations of trough osmolality and fasting osmolality Time to events that were considered by the subject and/or physician to be clinically significant and potentially related to the progression or manifestations of the disease. Events in this analysis were those checked in the PKD Outcomes (Part 2) case report form (CRF). Only the events starting from the Month 4 visit were included in the analysis, and only subjects who had follow-up to Month 4 were included in the analysis. Two analyses were provided: the first included all 13 PKD-related outcomes as potential events; the second included only the PKD-related outcomes that were more closely related to kidney enlargement as potential events. ADPKD outcomes and medical resource utilization. Analysis of additional events attributed to ADPKD for tolvaptan subjects were to be compared with placebo subjects, including their health-economic outcomes. A detailed discussion of the statistical approach for these clinical efficacy measures is provided in Section for rate of TKV growth, Section 5.6 for key secondary composite (see also Section for the components of the key secondary composite endpoint), and Section for rate of renal function decline Total Kidney Volume Total kidney volume change had been shown to accurately represent the evolution of cyst growth and therefore structural derangement of renal parenchyma. Tolvaptan had been shown in animal models to reduce the development of cystic burden and fibrosis through effect on proliferation and secretion, thereby preserving normal renal architecture. Because cystogenesis is the direct cause of kidney damage, tolvaptan would necessarily have to reduce the rate of TKV growth to provide a benefit in human ADPKD patients. We hypothesized that a reduction in rate of TKV growth would be required to confer measurable clinical benefits and therefore placed TKV growth as our first endpoint Composite Endpoint Given the slowly progressive nature of ADPKD and the episodic nature of clinical manifestations during its progression, the FDA recommended we construct a composite endpoint to capture the effects of treatment. The composite endpoint was constructed to represent clinically meaningful changes in physiologic parameters and symptoms Page 50 of 224
51 reasonably expected to develop or worsen with progressive ADPKD. The components included 1) Events of worsening renal function: in a trial population where renal function is relatively preserved (CKD Stages 1 to 3), cyst growth leads to a deterioration of renal function. Events were counted when a sustained on-treatment increase in serum creatinine of 33.3% was met (inverse serum creatinine decline of 25%), which represents a clinically meaningful change in kidney function at this stage of disease. 2) Events of renal pain: patients experience renal pain when increasing cyst growth stretches the renal capsule and because of kidney-specific ADPKD complications including cyst infection, cyst rupture, cyst hemorrhage, pyelonephritis, and kidney stones. This component included events deemed serious enough by the patient for him/her to bring it to medical attention and by the physician to prescribe varying intensity of medical intervention. 3) Events of worsening blood pressure or hypertension: cyst growth and kidney ischemia lead to hypertension in early ADPKD. Events were considered to have occurred if a prehypertensive subject s blood pressure reproducibly increased or if a hypertensive subject required more intensive therapy. 4) Events of worsening albuminuria: cystic destruction of nephrons leads to compensatory hyperfiltration and glomerular stress. This results in increasing proteinuria in later stages of ADPKD. Events were counted as sustained proteinuria in categorical thresholds from normal to micro- to macro-proteinuria Other Endpoints The remaining secondary and exploratory endpoints represented further approaches to assess the clinical outcomes associated with tolvaptan therapy. 3.4 Pivotal Trial Dose Selection and Administration As AVP regulates concentration of urine, reduction or blockade of AVP can be assured when the concentration of urine falls below that of plasma (roughly mosm/kg). Effective AVP blockade should reduce stimulation of camp and therefore decrease cellular proliferation and fluid secretion into cysts in subjects with ADPKD. Animal models suggested that early intervention and continuous blockade of AVP, as measured by suppression of urine osmolality, would be more efficacious in decreasing the rate of cystic growth. 8,10,32,36 Therefore the objective of tolvaptan therapy in ADPKD is to continuously inhibit AVP binding at the V 2 receptor. During the trial, spot urine osmolality was measured at expected trough levels of tolvaptan, but not reported to investigators, to maintain their blind. At the end of the trial, maintenance of urine osmolality suppression was confirmed through exploratory PK/PD analyses. Page 51 of 224
52 In phase 2 trials, the dose response of urine osmolality in ADPKD subjects was evaluated. Panel B of Figure is a plot of mean urine osmolality in urine samples collected from 0-4, 4-8, 8-12, 12-16, 16-24, and hours at baseline and after single ascending doses of 15, 30, 60, and 120 mg administered 72 hours apart to 8 subjects with ADPKD and well preserved renal function. Panel A of Figure is a plot of corresponding mean tolvaptan concentrations. The lower edge of the gray box in Panel A indicates the minimally effective concentration of tolvaptan and the upper edge indicates the concentration where a maximal increase in urine output is achieved; concentrations above the gray box produce the same rate of urine output. Increasing doses of tolvaptan above 15 mg do not significantly increase the maximal suppression of urine osmolality but extend the duration of time that such suppression occurs. Figure Mean Tolvaptan Plasma Concentrations (A) and Mean Urine Osmolality Plotted at the End-time of the Collection Interval (B) Following Ascending Single Oral Doses of Tolvaptan in Eight Subjects with ADPKD; Trial Note: The lower edge of the gray box in Panel A indicates the minimally effective concentration of tolvaptan and the upper edge indicates the concentration where a maximal increase in urine output is achieved. Page 52 of 224
53 These data also show that there is a rapid rate of offset in AVP inhibition once tolvaptan plasma concentrations drop below the lower threshold of about 25 ng/ml. It would require single daily doses of >120 mg to suppress urine osmolality for 24 hours, ie, produce a trough spot urine osmolality of < 300 mosm/kg. Split-dose regimens (second dose 8 to 9 hours after first dose, rather than the more common every 12 hours regimen) were tested with the goal of prolonging tolvaptan action throughout the night without increasing night-time urine excretion so much that nocturia would be a significant clinical problem. In a clinical trial exploring ascending split-dose regimens (Trial ), ADPKD subjects were titrated weekly from a daily regimen of 30/15 mg to 45/15 mg, 60/30 mg and then 90/30 mg. Each week subjects were asked Could you tolerate taking this dose of tolvaptan for the rest of your life, please answer only yes or no? If subjects answered no, they were down-titrated to the previous dose. Subjects who answered yes were uptitrated to a maximum dose level of 90/30 mg. Urine osmolality was measured in spot samples taken just prior to the first dose (expected trough tolvaptan blood level), prior to the second dose, and prior to bedtime. Table summarizes the percent of subjects with urine osmolality < 300 mosm/kg by sampling time point. As tolvaptan doses increased, urine osmolality prior to the second dose and prior to bedtime were most easily suppressed. The 45/15 mg dose was the lowest dose at which at least 90% of subjects had urine osmolality values < 300 mosm/kg for both the prior to the second dose and prior to bedtime samples, indicating that urine osmolality would be suppressed (AVP would be inhibited) for at least 16 hours per day in a large majority of subjects. Table Percent of Subjects with Urine Osmolality Less Than 300 mosm/kg Following Split-dose Regimens of Tolvaptan; Trial Week of Treatment and Dose Day 0 Week 1 Week 2 Week 3 Week 4 a Time of Day Baseline mg mg mg n=45 b mg n=45 n=43 n=43 n=14 Prior to First Dose Prior to Second Dose Prior to Bedtime Note: Values of n reflect number of subjects with at least 1 osmolality value for the dose. a After Week 3, 27 subjects up-titrated, 15 subjects down-titrated and 1 remained at mg. b Subject 2025 excluded as the subject had no urine osmolality samples at the prescribed doses mg n=27 Page 53 of 224
54 Following the 60/30 mg regimen at Week 3, 77% of subjects had urine osmolality values < 300 mosm/kg at prior to the first dose, the expected nadir of tolvaptan effect. For the subjects that up titrated to the 90/30 mg regimen, 85% were suppressed. Therefore, if the hypothesis that the best efficacy would be observed if AVP was maximally inhibited for the entire 24-hour day, ie, urine osmolality suppressed to its maximal extent, and always below 300 mosm/kg is correct, then a 60/30 mg regimen may be suitable for many subjects but the 90/30 mg regimen would produce additional inhibitory activity in some subjects who would not experience optimal inhibition at lower doses. As an example of tolvaptan concentrations and urine osmolality following multiple dosing with 90/30 mg, Figure presents a plot of mean tolvaptan concentrations following 7 days of dosing at 90/30 mg in 12 subjects with ADPKD and egfr CKD-EPI > 60 ml/min/1.73 m 2. Additionally shown are plots of median urine osmolality at baseline and following treatment along with individual spot trough urine osmolality values at baseline and on Day 8 presented in the insert to the right. Figure Mean Tolvaptan Plasma Concentrations, Median Urine Osmolality and Individual Trough Spot Urine Osmolality at Baseline and Following 90/30 mg Tolvaptan Administered for 7 Days to 12 Subjects with ADPKD; Trial Note: Median urine osmolality values plotted at the end-time of the collection interval. BSL=Baseline. Day 8 is 24 hours after 90 mg dose on Day 7 of treatment regimen. Page 54 of 224
55 For the pivotal trial, split-dose regimens of 45 mg AM/15 mg PM (45/15 mg), 60 mg AM /30 mg PM (60/30 mg) and 90 mg AM /30 mg PM (90/30 mg) were selected based on the titration scheme developed in Trial The twice-daily regimen, with a higher morning dose and a lower dose approximately 9 hours later, produces maximal inhibition during daytime hours with a gradual fall-off of effect to prevent excess urine production during the sleep period. Forced titration to an individual s maximally tolerated dose was required in order to produce a maximal suppression in urine osmolality (inhibition of AVP binding) in an effort to maximize clinical efficacy. A sample titration schedule is presented in Table Subjects began treatment with the lowest dose and on the day following each 1-week safety assessment, doses were titrated to the next higher dose treatment group until either a level of intolerability or the highest dose was reached. If a subject could not tolerate a given dose, the titration phase was over for that subject, and the maintenance phase began at the dose level tolerated and lasted to Month 36. All subjects were encouraged to progress to the highest dose as this was likely to be the most effective. Subjects were to maintain the highest tolerated dose for 3 years, but could interrupt, down- and/or re-uptitrate as clinical circumstances warranted. Drug interruptions were also allowed as needed for intervening illness, with resumption of therapy either at the highest tolerated dose or at lower doses with titration as tolerated. Table Example Dosing Schedule in Trial Trial Day Week 1 (Days 1-7) Week 2 a (Days 8-14) Week 3 a (Days 15-21) Nominal Dose Time 8 AM & 5 PM 45/15 mg taken as three 15 mg tablets every AM and one 15 mg tablet every PM or matching placebo 8 AM & 5 PM 60/30 mg taken as two 30 mg tablets every AM and one 30 mg tablet every PM or matching placebo 8 AM & 5 PM 90/30 mg taken as three 30 mg tablets every AM and one 30 mg tablet every PM or matching placebo Week 3 to Month 36 a 8 AM & 5 PM Highest tolerated regimen a Actual time may have varied depending on sleep cycle. Page 55 of 224
56 3.5 Statistical Analysis Methods for Trial Sample Size Calculation The original sample size calculation for Trial was based on data and/or methodology adapted from the NIH-CRISP and HALT studies. 28,50 With prognostic enrichment, a kidney growth rate of 7%/year was predicted for the placebo arm. A target of one-fifth reduction, equating to a growth rate of 5.6%/year for the tolvaptan group, was regarded as clinically relevant. The total noise standard deviation and the standard deviation of the slope across subjects were respectively assumed to be and (in log10 scale). Using the sample size calculation formula for longitudinal trials provided by J. Lefante, 51 with 85% power and 2:1 randomization, the calculated sample size was 504. With an assumption of 20% withdrawal rate for the trial, about 600 subjects would need to be enrolled. By doubling this number, we effectively attained a power equivalent to two independent studies, while enhancing the ability to evaluate the key secondary composite endpoint, which was expected to require an unknown but higher number of subjects to achieve reasonable power over a period of 3 years. Because the sample size needed for the key secondary composite endpoint was unknown at the planning stage of this protocol, a blinded sample size recalculation was discussed with the Agency Blinded Sample Size Re-calculation The Agency agreed that a blinded sample size recalculation could be performed without statistical penalty. This was conducted on 20 October 2008 based on the available, preliminary data, when 1000 subjects had been enrolled, as prespecified in the protocol. This sample size recalculation suggested that a total sample size of 1400 would be an appropriate for this study. This sample size falls into the sample size range of 1200 to 1500 originally specified in the protocol. Power projection of the key secondary composite endpoint against an alpha of 0.01 was performed in response to guidance received from a Type C Meeting with the FDA on 10 June 2009, after closing of the enrollment in which 1445 subjects were randomized. It was projected that this 3-year trial would have 2074 events; among them, 975 would be first events. Assuming a 20% reduction in the key secondary composite endpoint and following a method provided in Therneau and Grambsch (2000), 52 with an assumption the three non-first recurrent events were equivalent to one first event, it was projected that the trial would have 90% power to detect a treatment difference in the key secondary composite endpoint. The final power of the endpoint would depend on the final number Page 56 of 224
57 of events (as well as first events) in the trial and the conversion ratio of non-first recurrent events to first events Analysis Datasets The SAP-specified primary and sensitivity analyses adhered to the intent-to-treat (ITT) principle. Two datasets were constructed. The first including all data from baseline visit (Day 14 to Day 0) up to 14 days after the last dose of trial medication was designated as the Within Treatment Period dataset. This dataset was prespecified in the SAP and was agreed to by the Agency The second including all data from baseline (Day 14 to Day 0) to Month 36 regardless of last dose of trial medication was designated as the Regardless of Treatment Period dataset (and would include any subject who was randomized but did not receive treatment). This dataset was used for sensitivity analysis. Unless otherwise specified, no imputation of missing data was performed for either dataset Prespecified Hierarchical Test Procedure Statistical test was conducted based on the hierarchical order given in Table with an alpha of The statistical tests on the components of the key secondary composite endpoint were considered as exploratory analyses, with no requirement for adjustment for multiplicity. The composite PKD Outcome endpoints were also exploratory endpoints. No adjustments for multiplicity were set for these or other exploratory analyses Analysis of the Slope of Total Kidney Volume Growth The primary analysis of the first (primary) endpoint used each subject s log-transformed TKV for each time point to estimate their slope of TKV growth. For each treatment group, individual slopes were used to obtain an overall slope estimate. The overall slope estimates were compared between treatments to derive a treatment effect described as a ratio of geometric means. Since the above analysis assumes linearity, a sensitivity analysis of TKV using mixed model repeated measurements (MMRM) was also performed, with treatment, visit, treatment visit interaction, and randomization stratification factors as factors, and baseline and baseline visit interaction as covariates Analysis of the Key Secondary Composite Endpoint and Its Components The primary analysis of the second (key secondary composite) endpoint was an ontreatment analysis of time to multiple events. Time to multiple event analysis was used Page 57 of 224
58 to measure progression of disease and not a single, ultimate outcome. Composite components were treated with equal weight. However, sandwich covariance matrix estimates were used to account for the correlation between multiple events in an individual subject. Time to first event analysis was also provided as a sensitivity analysis for the analysis of time to multiple events. Analyses on the components of the key secondary composite endpoint were identical to the analysis of the endpoint Analysis of the Slope of Renal Function (Reciprocal of Serum Creatinine) Analysis of the third endpoint, renal function slope, as a continuous variable was similar to the analysis of the primary TKV endpoint, except that no log transformation was applied. The primary measure of renal function was reciprocal of serum creatinine. As described in Section , an acute and reversible increase in serum creatinine attributable an acute and fully reversible decrease in GFR was anticipated. This effect is similar to that observed with ACE inhibition and requires analyses which account for these effects (either on-treatment or pre- to post-treatment comparisons). The primary analysis of this endpoint was performed within the treatment period using data between Week 3/EOT and Month 36/ET. Sensitivity analyses included analysis regardless of the treatment period and analyses incorporating pre-titration and post-treatment data points Other Sequentially Ordered Secondary Endpoints The fourth sequential endpoint tested was change in MAP for subjects who had not yet reached hypertensive status or treatment with antihypertensive therapies. The analysis followed that of the primary TKV analysis except that log transformation was not applied, and data were censored once a subject began antihypertensive therapy. The fifth sequential endpoint tested was a time-averaged AUC change in renal pain (0 to 10 Likert scale) between baseline and Month 36 or the last visit prior to initiating medical or surgical therapy. This was analyzed by analysis of covariance (ANCOVA). An MMRM analysis was also applied to this efficacy variable (change in pain scale, not AUC) as a sensitivity analysis. The sixth sequential endpoint tested was a time to multiple event analysis for including nonhypertensive subjects and analyzing their progression to the next prehypertensive or hypertensive state. Analysis was similar to that used for the key secondary composite endpoint. Page 58 of 224
59 The seventh sequential endpoint tested the percentage of hypertensive subjects taking antihypertensive therapy at baseline who had clinically sustained decreases of BP leading to a sustained reduction in antihypertensive therapy compared with baseline. The last observation carried forward dataset was used for this analysis Analysis of the Composite PKD Outcomes Endpoint The analyses of the composite PKD Outcomes endpoint were similar to the analysis of the key secondary composite endpoint. Two analyses were prospectively defined prior to unblinding the treatment codes: the first was a 13-item composite event analysis using all individual recorded PKD-related outcomes as potential ADPKD disease progression events; the second was a 9-item PKD-related outcomes composite of events that were more plausibly related to kidney enlargement. The events having the highest frequency in the blinded population were also analyzed as individual components. These analyses are further described in Section Risk of hospitalization was assessed using the Exact Test to derive the odds ratio and confidence intervals. 4 Biopharmaceutics and Clinical Pharmacology 4.1 Biopharmaceutics and Bioavailability As submitted to the hyponatremia NDA, the oral bioavailability of tolvaptan following administration as the 30-mg clinical tablet was 56% (42% to 80%). Dose strength equivalence of 15 mg, 30 mg, and 60 mg clinical tablets was determined in healthy subjects. The 30-mg clinical tablet was considered equivalent to the 30-mg approved tablet on the basis of dissolution testing. The dose strength equivalence of the 30-mg approved tablet to the 90-mg proposed commercial tablet was determined in healthy subjects. Tolvaptan plasma concentrations following the high-fat meal (HFM) or fasting for 60 and 90 mg doses showed higher initial plasma concentrations in the HFM subjects, but by 6 hours postdose, mean tolvaptan concentrations were similar for both states. In the single ascending dose trials, tolvaptan doses from 60 to 480 mg produced similar mean urine volumes for the first 12 hours postdose as plasma concentrations across this range of doses produced a maximal rate of urine output. Therefore, the increased tolvaptan concentrations observed in the fed state would not be expected to have any additional effect on urine output in the first 6 hours postdose when compared to the fasted state. Otsuka proposes to market tolvaptan tablets of 15-, 30-, 45-, 60- and 90-mg strengths for the ADPKD indication. Tablets of 15-, 30- and 60-mg strengths were previously Page 59 of 224
60 approved for the treatment of hyponatremia. The 45-mg tablet will be approved on the basis of dissolution testing. Dose strength equivalence of the 30-mg approved tablet to the 90-mg proposed commercial tablet was established in a clinical trial. 4.2 Clinical Pharmacology Pharmacokinetics Clinical pharmacology (pharmacokinetic/pharmacodynamic [PK/PD]) trials in healthy subjects using tolvaptan tablets have included single dose trials (2 ascending dose, Japanese-Caucasian bridging), multiple dose trials (age/gender, thorough QTc), fooddrug and drug-drug interaction trials (grapefruit juice, ketoconazole, rifampin, lovastatin, warfarin, amiodarone, furosemide, hydrochlorothiazide, and digoxin), 4 trials in subjects with heart failure and 1 special population trial in subjects with hepatic impairment (multiple ascending doses). Additionally, the sponsor has performed 1 special population trial in subjects without ADPKD but with renal impairment and 6 trials involving subjects with ADPKD with chronic kidney disease (CKD) Stage 1 to 4 (refer to Section 10.2). Trials included a single ascending dose trial, 15 to 120 mg, multiple once daily dosing of 15 or 30 mg and multiple split-dose regimens with comparison of PK and PD in Japan and US subjects, multiple split-dosing trial at 90/30 mg and renal function testing following 7 or 21 days of dosing in subjects with varying degrees of renal function. Tolvaptan is eliminated primarily by metabolism as only about 19% of a tolvaptan dose is excreted unchanged in feces and less than 1% is excreted unchanged in urine. None of the 14 metabolites detected in human plasma have pharmacologic activity at concentrations measured at proposed clinical doses. Tolvaptan is a sensitive cytochrome P450 (CYP) 3A4 (CYP3A4) substrate; concentrations increase 4-fold when administered with strong CYP3A4 inhibitors. A dose reduction to 15 mg or 30 mg once daily is recommended for 45/15mg and 90/30mg regimens, respectively, when tolvaptan is given with strong CYP3A inhibitors. Tolvaptan has no inhibitory activity at CYP3A4 or CYP2C9 and is a P-glycoprotein substrate and inhibitor with no clinically significant inhibitory activity. Following intravenous (IV) administration, the elimination half-life (t 1/2,z ) of tolvaptan is about 3 hours. Following multiple once daily oral doses of 30, 60, and 300 mg or multiple split-dose regimens (second dose 8 to 9 hours after first dose) ranging from 15 mg AM/15 mg PM (15/15mg) to 90 mg AM/30mg PM (90/30mg), accumulation of tolvaptan concentrations was minimal. Page 60 of 224
61 Following single oral doses, maximum plasma concentrations (C max ) show less than dose proportional increases from 30 to 240 mg and then a plateau at doses from 240 to 480 mg. Values of t 1/2,z increase from 3 hours for a 15 mg dose to 12 hours for 120 mg and higher doses. Following 300 mg once daily doses, a reduction in bioavailability was observed as C max and AUC during the dosing interval at steady state (AUC ) were only 4.2- and 6.4-fold higher, respectively, when compared with the 30-mg dose. The plateau in C max with increasing dose and decrease in bioavailability following multiple dosing at 300 mg may be due to saturation of absorption in the upper small intestine and/or dissolution rate-limited absorption as tolvaptan solubility in water is very low, %w/v or mg/l. The increasing values of t 1/2,z are thought to be due to low but continued absorption of tolvaptan from the lower gastrointestinal tract. The human plasma protein binding of tolvaptan is 98% or higher to albumin and 1 -acid glycoprotein; binding is not affected by cardiac function, renal or hepatic impairment. Tolvaptan PK is not significantly affected by age, sex, race, and mild or moderate hepatic impairment. Plasma concentrations in subjects with heart failure are 2-fold higher when compared to healthy subjects. The impact of renal impairment on tolvaptan concentrations was relatively small until creatinine clearance (CrCL) fell below 30 ml/min. In the population PK analysis of subjects with ADPKD, it was determined that as egfr decreases from 72.2 to 9.79 (ml/min/1.73 m 2 ), there is an associated 32% reduction in apparent clearance (CL/F). In subjects with ADPKD and relatively intact renal function, ie, serum creatinine 1.4 mg/dl (males) or 1.2 mg/dl (females) or egfr > 60 ml/min/1.73 m 2, tolvaptan pharmacokinetics are similar to healthy subjects Pharmacodynamics Pharmacodynamics, including the effect on renal function, kidney volume, free water clearance, urine excretion rate, urine osmolality (see Section 3.4), urine volume, fluid balance, serum sodium and uric acid, and hemodynamic parameters, were assessed in a number of clinical trials in subjects with ADPKD and in subjects without ADPKD but with impaired renal function. When matched for renal function, tolvaptan treatment produced similar PD responses in healthy subjects/subjects without ADPKD and impaired renal function and subjects with ADPKD. Pharmacodynamic responses were also similar in US and Japanese ADPKD subjects with relatively intact renal function. In addition to assessment of renal pharmacodynamic parameters, a thorough QTc trial was conducted in healthy male and female subjects given 30 mg or 300 mg tolvaptan once daily for 5 days. Individually corrected QT intervals were unchanged by tolvaptan. Page 61 of 224
62 Acute Effect on Renal Function The acute effect of tolvaptan on renal function (GFR) was assessed in 2 clinical trials in the same subjects who were assessed for changes in TKV (Section ). Results from the 2 trials were similar. Modest (approximately 6% to 10%), but statistically significant, reductions in mean measured GFR (mgfr by iothalamate clearance) were seen in subjects with well preserved (GFR > 60 ml/min) and moderately impaired (GFR 30 to 60 ml/min) renal function; a nonsignificant decrease ( 2.1%) was seen in subjects with poor renal function, GFR < 30 ml/min. Mean creatinine and uric acid clearances were decreased about 12% to16% and 20% to 25%, respectively, and the percent decreases were independent of baseline renal function. As the mgfr results were similar irrespective of duration of tolvaptan exposure (8 days compared to 21 days), it appears that changes in response to tolvaptan administration occur within days after the start of dosing. At 21 days posttreatment, mgfr values were not significantly different from baseline. Although mean mgfr was not significantly decreased in subjects with egfr < 30 ml/min/1.37m 2 (CKD Stage 4), slight nonsignificant decreases were also observed in CrCL, urea clearance and uric acid clearance and the percent decreases were larger than for mgfr at around 8 to 10%. Overall, this indicates that tolvaptan is most likely decreasing GFR in these subjects, but not to the same extent as subjects with better (ie, GFR > 30 ml/min) renal function. Decreased creatinine and uric acid clearances lead to increases in serum creatinine and uric acid. Tolvaptan administered as 60/30 mg or 90/30 mg regimens has a small negative effect on urea nitrogen clearance that is not clinically significant and has no effect on sodium or potassium clearance at any level of renal function. In summary, tolvaptan, at dose regimens of 45/15 mg to 90/30 mg, decreases mgfr 6% to 10% in subjects with CKD Stage 1 to 3 (egfr > 30 ml/min) and changes are reversible after the end of tolvaptan treatment. As discussed by Irazabal et al 53 and hypothesized by Bankir and colleagues, 54,55 GFR is decreased following V 2 inhibition due to the hemodynamic changes that occur in response to the decrease in urine osmolality. As the offset of tolvaptan s action on urine osmolality after discontinuation of treatment is rapid, it would be expected that the decreases observed in GFR would be quickly reversible as well. Page 62 of 224
63 Acute Effects on Total Kidney Volume In a phase 2 trial, , which was started just prior to the pivotal trial, , it was observed that tolvaptan produces an acute and reversible reduction in TKV. In Trial , an acute effect was noted: following 8 weeks on tolvaptan at a splitdose regimen ranging from 15/15 mg to 90/30 mg, the mean percent change in TKV was 1.11%. Three years later, subjects had a treatment interruption of 3-6 months in duration, the increase in TKV observed from treatment withdrawal to just prior to restarting tolvaptan appeared to show an increase in volume consistent with the reversal of this acute effect (see Section 5.13). Subsequently, a post-hoc analysis of Trial TKV data demonstrated that after only 8 days of treatment with 45/15 mg tolvaptan, a statistically significant decrease from baseline in TKV could be observed (mean [SD] change from baseline of 1.9 [2.4]%, p = ). An acute decrease in TKV following initiation of tolvaptan treatment was prospectively confirmed in Trial , where, after 3 weeks of treatment with weekly uptitrated doses of tolvaptan to 90/30 mg, a statistically significant decrease from baseline in TKV was observed (mean [SD] change from baseline of 3.7 [3.0]%, p <0.0001). The reversible nature of this was confirmed when, at 21 days post-treatment, TKV returned toward baseline, but the difference was still significantly lower than baseline: mean (SD) value of 1.7 (2.9)%, p = Effect on Pharmacodynamic Serum and Plasma Concentration Endpoints Serum creatinine concentrations are considered a marker of GFR as creatinine is extensively filtered (cleared) by the kidney. As the result of tolvaptan treatment, GFR is slightly decreased (Section ) and, consequently, creatinine clearance is reduced and increases are observed in serum creatinine. Table summarizes changes in serum creatinine concentrations that were observed during renal function testing following multiple doses of tolvaptan in ADPKD subjects with well-preserved renal function. Values were also obtained during renal function testing at 21 days after the last dose of tolvaptan for subjects treated for 21 days. Similar changes were also observed in cystatin C concentrations, another endogenous compound considered a marker of GFR. Page 63 of 224
64 Table Trial Trial Trial Serum Creatinine Concentrations During Renal Function Testing Following Tolvaptan Administration to Subjects with ADPKD and Well-preserved Renal Function; Trial and Trial ADPKD Population (n) ecrcl CG >60 ml/min, No Hypertension (6) ecrcl CG >60 ml/min, Hypertension treated with ACEi or ARB (6) egfr MDRD >60 ml/min/1.73 m 2 Hypertension treated with ACEi or ARB (9) Regimen 45/15 mg, 7 days 45/15 mg, 7 days 45/15 mg, 7 days; 60/30 mg, 7 days; 90/30 mg, 7 days. 21 days of total treatment 21 days after treatment Time Point Serum Creatinine Mean (SD) (mg/dl) Change (SD) From Baseline Baseline 0.80 (0.25) - Day (0.30) 0.08 (0.06) Baseline 0.95 (0.16) - Day (0.23) 0.09 (0.11) Baseline 0.78 (0.14) - Day (0.13) 0.05 (0.05) egfr MDRD >60 ml/min/1.73 m 2 Hypertension treated withdrawal Day (0.13) 0.00 (0.04) with ACEi or ARB (9) ecrcl CG = estimated creatinine clearance by Cockcroft-Gault, egfr MDRD = estimated glomerular filtration rate by MDRD, ACEi =angiotensin converting enzyme inhibitor, ARB=angiotensin receptor blocker Tolvaptan blockade of V 2 receptors produces an increase in free water clearance (aquaresis), a negative shift in fluid balance and increases serum sodium and osmolality. It is known that uric acid secretion is decreased and AVP concentrations are increased as volume status decreases and serum osmolality increases. Therefore, the increases also observed in uric acid, AVP concentrations, and its peptide precursors AVP-neurophysin and copeptin, following tolvaptan administration are consistent with expected physiological changes. Mean AVP concentration increases ranged from 2 to 9 pg/ml (and upper limit of normal being 5 pg/ml), and were not dose dependent; the increases in AVP did not cause measurable increases in V 1 -mediated effects such as blood pressure. Increases in serum sodium and osmolality can be minimized if subjects maintain a neutral fluid balance (Section ). Subjects in the pivotal trial were encouraged to drink water and minimal, 1-2 mmol/l, mean increases in serum sodium were observed. Page 64 of 224
65 Concentrations of serum sodium, osmolality, creatinine, cystatin C, uric acid, AVP, AVP-neurophysin, and copeptin returned to baseline after discontinuation of tolvaptan, demonstrating the reversible nature of the changes. Tolvaptan treatment does not meaningfully change urea nitrogen, potassium, albumin, aldosterone, renin, camp, calcium, or parathyroid hormone concentrations Effect on Free Water Clearance and Urine Volume Tolvaptan administration increases free water clearance (FWC) and consequently increases urine excretion rates, ie, changes in FWC are paralleled by changes in urine excretion rate. Maximal increases in urine excretion rates, 3 to 5 times baseline, were observed as tolvaptan concentrations reached 100 to 125 ng/ml; following a 45-mg dose, tolvaptan concentrations reach this level at about 1 hour postdose. Marked elevations of tolvaptan plasma concentrations produced a sustained, but not greater, magnitude of response, as active concentrations of tolvaptan were present for longer periods of time. The offset of tolvaptan action is rapid, and no increase in excretion rate is observed when tolvaptan concentrations decrease to below 25 ng/ml. The 90/30 mg regimen was the highest daily dose used in the pivotal Trial ; in 2 clinical pharmacology trials (Trial and Trial ) in subjects with ADPKD and estimated glomerular filtration rate by the Modification of Diet in Renal Disease formula (egfr MDRD ) > 60 ml/min/1.73 m 2 administered a 90/30 mg dose regimen for at least 7 days, mean (SD) 24-hour urine volumes for each respective trial were 7464 (2103) ml (compared to baseline 3644 [1467] ml) and 6532 (2036) ml (compared to baseline 1982 [553] ml) Fluid Balance/Serum Sodium Fluid balance was studied extensively in phase 2 trials that were conducted under carefully controlled conditions. These studies suggested that a new set-point for fluid balance is established after the first days of treatment. By treatment Day 5, subjects are mildly fluid contracted relative to baseline but typically adapt to a stable balance of intake/output. This is readily monitored by serum sodium concentration. While fluid balance was not measured in the pivotal trial, serum sodium reflected rapid equilibrium with modest increases in serum sodium in most subjects and with few transient excursions into the hypernatremic range. In some cases, persistent hypernatremia can indicate when a subject cannot manage the prescribed dose of tolvaptan and should lead to down-titration or treatment discontinuation. Based on the known mechanism of action of tolvaptan and consistency with previous data, the observed changes in sodium concentration (ie, hypernatremia) are attributable to Page 65 of 224
66 tolvaptan and should be managed clinically through appropriate guidance to a patient regarding fluid intake Mean Arterial Pressure In ADPKD subjects with varying degrees of renal function, mean arterial pressure (MAP) was unchanged after 3 weeks of tolvaptan treatment. Hypertension was evaluated as part of the key secondary composite endpoint in the pivotal Trial , and BP was collected as a vital sign safety measure. Section provides additional detail on results showing that tolvaptan treatment had no significant effect on BP compared to placebo. 5 Clinical Efficacy of Tolvaptan 5.1 Subject Disposition in Trial In the pivotal trial, 2122 subjects were screened, and 1445 subjects were randomized to receive trial medication: 961 to tolvaptan and 484 to placebo. All but 1 subject (randomized to placebo) received at least 1 dose of trial medication. Seventy-seven percent (740/961; 77.0%) of tolvaptan subjects and 86.2% (417/484) of placebo subjects completed scheduled visits in the trial through Month 36 (Table 5.1-1), a relatively high rate of completion for a 3-year trial. PKD Outcomes data were used in sensitivity analyses to account for potentially missing data from early-withdrawing subjects in Trial : 102/961 (10.6%) tolvaptan subjects and 27/484 (5.6%) placebo subjects agreed to further follow-up of PKD Outcomes via telephone after withdrawing from study medication. In contrast, 119/961 (12.4%) tolvaptan subjects and 40/484 (8.3%) placebo subjects refused any additional follow-up after terminating from the trial. Cumulatively, 87.6% (842/961) of tolvaptan subjects and 91.7% (444/484) of placebo subjects were followed for PKD Outcomes. Page 66 of 224
67
68 Figure Time Course of Dose Titration by Treatment Group in Trial M = month; W = Week. The percentages at the far right represent the proportion of subjects in each category at the Month 36 visit/telephone call. In the tolvaptan group, 23.0% of subjects withdrew from study medication early, compared with 13.8% of subjects in the placebo group. The imbalance was driven by a greater number of withdrawals due to AEs in the tolvaptan versus placebo group (148/961 [15.4%] subjects versus 24/484 [5.0%] subjects, respectively), entirely due to aquaretic AEs related to tolvaptan s mechanism of action and hepatic AEs potentially related to off-target effects, as discussed in Section 6.5. In contrast to the placebo group, approximately half of the withdrawals in the tolvaptan group occurred before Month 4 (10.3% tolvaptan, 2.3% placebo withdrawals up to Month 4). This affected the numbers of subjects having both a baseline and postbaseline MRI assessment for the primary efficacy analysis, as MRIs were performed at early termination visits only if at least 6 months had elapsed since the last MRI. For tolvaptan, 842/961 (87.6%) subjects and for placebo 465/484 (96.1%) subjects were analyzed for the primary efficacy sensitivity analysis (regardless of treatment period). All 1445/1445 (100%) subjects were included in the secondary efficacy analyses. However, the average duration of follow up at visits where secondary efficacy evaluations could be completed was 2.51 years for tolvaptan and 2.77 years for placebo. Analyses to determine if missing data affected the study conclusions are described in Section Page 68 of 224
69 All subjects receiving at least 1 dose of trial medication (1444/1445 [99.9%]) were included in the safety analyses. One subject randomized to placebo did not receive trial medication and therefore was excluded from safety analyses. A total of 87 subjects withdrew consent to participate further in the trial (80/1445; 5.5%) or were withdrawn by the investigator (7/1445; 0.5%). An independent physician reviewed and classified the reasons for discontinuation. Of the 7 subjects withdrawn by the investigator, 3 (3/961; 0.3%) subjects in the tolvaptan treatment group and 4 (4/484; 0.8%) in the placebo treatment group were removed for noncompliance or inability to comply with the visit schedule. Of the 80 subjects who withdrew consent, 50 (50/961; 5.2%) subjects were in the tolvaptan treatment group and 30 (30/484; 6.2%) subjects were in the placebo group. The type of reasons given by the subjects for withdrawing were: Personal/family reason not otherwise specified (eg, personal reason, at his will, at his request, did not want to continue, unwilling to return to clinic ) for a total of 30 (30/1445; 2.1%) subjects, including 21 (21/961; 2.2%) subjects in the tolvaptan group and 9 (9/484; 1.9%) subjects in the placebo group Trial burden/logistical issues (eg, too long driving distance, too time consuming, interference with job ) for a total of 24 (24/1445; 1.7%) subjects, including 16 (16/961; 1.7%) subjects in the tolvaptan treatment group and 8 (8/484; 1.7%) in the placebo treatment group Transfer/relocation (6/961; 0.6% tolvaptan; 4/484; 0.8% placebo) Planning pregnancy (4/961; 0.4% tolvaptan; 3/484; 0.6% placebo) Various others for a total of 3 (3/961; 0.3%) subjects in the tolvaptan treatment group (eg, incarceration, to avoid an eventual asthenia, AEs interfering with work ) and 6 (6/484; 1.2%) subjects in the placebo group ( not motivated anymore, wants second opinion, concerned about new consent form mentioning heart clots, forgetting to take pills too often, after stopping study drug for surgery, due to worsening kidney function ) Out of the 80 subjects above who discontinued due to withdrawal of consent, 4 subjects are further described below because the specified reason for withdrawal of consent could be interpreted as an AE: Subject in the tolvaptan treatment group experienced moderate Thirst (onset on Day 1) and severe Pollakiuria (onset on Day 2) that prompted a dose reduction. However, the events did not immediately resolve, and the subject withdrew consent due to AEs interfering with work. The last dose of trial medication was taken on Day 21, both events resolved on Day 41, and both events were assessed as definitely related to the use of trial medication. Subject in the placebo treatment group withdrew consent after stopping trial medication for surgery. The site recorded an AE of surgery elective Page 69 of 224
70 brain aneurysm, with onset on Day 105. The last dose of trial medication was taken on Day 102, the event resolved on Day 108, and was assessed as unrelated to the use of trial medication. Subject in the placebo treatment group withdrew consent due to worsening of kidney function. The site recorded AEs of mild hyperuricemia with onset on Day 842 and mild kidney pain with onset on Day 858. The last dose of trial medication was taken on Day 860. The event of hyperuricemia was continuing at the time the subject withdrew from the trial (Day 977); the event of kidney pain resolved on day of trial termination. Both events were considered unrelated to trial medication. Subject in the tolvaptan treatment group withdrew consent due to personal reasons. The site recorded a serious AE of severe new-onset glaucoma on Day 521. Visual field tests were done on Day 562, Day 604, and Day 637, which revealed highly reproducible glaucomatous damage in the right eye and no or very mild damage in the left eye. The subject was treated with bimatoprost drops. Tolvaptan was interrupted due to the event starting on Day 606 and was not restarted. As of Day 1278, the investigator reported that the subject s intraocular pressures (IOPs) were still elevated and he was still receiving treatment (not specified). The investigator assessed the event of glaucoma as possibly related to tolvaptan. 5.2 Demographics, Baseline Characteristics, and Medical History in Trial Demographics, baseline characteristics, and medical history were well balanced between treatment groups in Trial The mean age was 38.7 years and ranged from 18 to 51 years. The majority of subjects were Caucasian (84.3%), and approximately half were male (51.6%). Relative to the US population, there was disproportionate over-representation of Asian (Japanese) subjects and under-representation of African-American and Hispanic-American subjects (Table 5.2-1). Page 70 of 224
71 Table Demographic Characteristics in Trial : Age, Height, Weight, and Race by Sex Tolvaptan Placebo Total Female Total Male Female Total Male Female (N = 466) (N = 961) (N = 251) (N = 233) (N = 484) (N = 746) (N = 699) Demographic Characteristic Male (N = 495) Age (years) Number of subjects Mean SD Median Minimum Maximum Height (cm) Number of subjects Mean SD Median Minimum Maximum Weight (kg) Number of subjects Mean SD Median Minimum Maximum Total (N = 1445) Race, a n (%) Caucasian 418 (84.4) 392 (84.1) 810 (84.3) 204 (81.3) 204 (87.6) 408 (84.3) 622 (83.4) 596 (85.3) 1218 (84.3) Black 7 (1.4) 9 (1.9) 16 (1.7) 3 (1.2) 0 3 (0.6) 10 (1.3) 9 (1.3) 19 (1.3) Hispanic 8 (1.6) 5 (1.1) 13 (1.4) 6 (2.4) 3 (1.3) 9 (1.9) 14 (1.9) 8 (1.1) 22 (1.5) Asian 61 (12.3) 60 (12.9) 121 (12.6) 37 (14.7) 25 (10.7) 62 (12.8) 98 (13.1) 85 (12.2) 183 (12.7) Other 1 (0.2) 0 1 (0.1) 1 (0.4) 1 (0.4) 2 (0.4) 2 (0.3) 1 (0.1) 3 (0.2) a Percentages are based on the number of male, female, or total randomized subjects. Page 71 of 224
72 The pivotal Trial population represents subjects in the mid-range of ADPKD disease who were enriched based on prognosis for rapid progression. At baseline, approximately 34% of subjects were CKD Stage 1, 49% CKD Stage 2, and 17% CKD Stage 3 based on egfr calculated using the CKD-EPI formula (refer to Figure 5.2-1). These subjects were expected to represent the core of a population appropriate for therapy. Prognostic indicators based on risk of future progression to ESRD (hypertension, renal function, and renal volume) guided appropriate patient selection, were also used as stratification factors in the trial, and were designated as prespecified subgroups for further analysis. Figure Distribution of Trial Trial Population by Baseline CKD Stage Classification (Renal Function Estimated by CKD- EPI Formula) CKD-EPI = Chronic Kidney Disease-Epidemiology Collaboration; egfr = estimated glomerular filtration rate; ESRD = end=stage renal disease; TKV = total kidney volume. The mean age at first diagnosis of ADPKD was 27.4 years (range = 0 to 50 years; Table 5.2-2). The presenting symptoms leading to the ADPKD diagnosis were high BP (334/1445, 23.1%), renal pain (218/1445, 15.1%), blood in urine (143/1445, 9.9%), and UTI (109/1445, 7.5%); for the remainder of subjects, the reason for diagnosis was other Page 72 of 224
73 (839/1445, 58.1%) or unknown (60/1445, 4.2%). Due to limitations of the CRFs in Trial , the other reasons for diagnosis were not collected. An independent examination of data from subjects from Trial who enrolled in Trial with other reasons for their ADPKD diagnosis (as of 17 Jul 2012; 289 subjects) found that: 59.5% were asymptomatic at screening but had a family history of ADPKD, 23.5% experienced signs and symptoms that were related to ADPKD, 14.5% were asymptomatic with an incidental finding of ADPKD identified during routine care, 2.4% experienced signs and symptoms that were unrelated to ADPKD. History of hypertension and hematuria, which are known indicators of rapid progression of ADPKD, were well balanced between treatment groups. The mean (SD) baseline egfr CKD-EPI was (21.60) ml/min/1.73 m 2. Mean (SD) TVK was (905.31) ml (Table 5.2-3). At baseline, a total of 1157 (1157/1445, 80.1%) subjects had a history of hypertension and 735 (735/1445, 50.9%) subjects had a history of renal pain. Additionally, 53.3% (770/1445) and 5.3% (76/1445) of subjects had microalbuminuria and overt proteinuria, respectively, in their baseline labs. An identical proportion (76.9%) of subjects in both treatment groups used hypertension medications before the start of trial medication. The proportion of subjects taking medications for renal pain was similar at the start of the trial (5.1% for the tolvaptan group vs 5.8% for the placebo group). Overall, 10.2% (148/1445) of subjects were taking analgesics (including an additional 4.8% [69/1445] specifically for kidney pain). At baseline, 23.1% of subjects were taking no antihypertensive medications while 71.3% (1031/1445) were taking agents acting on the renin-angiotensin system, 19.9% (287/1445) were taking calcium channel blockers, and 18.1% (262/1445) were taking beta blockers. The overall use of other concomitant medications (medications not for HTN or renal pain) was comparable between the tolvaptan group (58.8%) and the placebo group (53.3%) prior to the trial. Page 73 of 224
74 Table ADPKD History in Trial Parameter Tolvaptan (N = 961) Placebo (N = 484) Total (N = 1445) Age of diagnosis (years) Number of subjects Mean SD Median Minimum Maximum Diagnosis due to, n (%): High blood pressure 228 (23.7) 106 (21.9) 334 (23.1) Blood in urine 96 (10.0) 47 (9.7) 143 (9.9) UTI 76 (7.9) 33 (6.8) 109 (7.5) Renal pain 141 (14.7) 77 (15.9) 218 (15.1) Unknown 37 (3.9) 23 (4.8) 60 (4.2) Other 553 (57.5) 286 (59.1) 839 (58.1) History of, n(%): Hepatic cysts 571 (59.4) 291 (60.1) 862 (59.7) Non-hepato-renal cysts 121 (12.6) 50 (10.3) 171 (11.8) Hematuria 338 (35.2) 164 (33.9) 502 (34.7) Proteinuria 233 (24.2) 116 (24.0) 349 (24.2) Nephrolithiasis 187 (19.5) 109 (22.5) 296 (20.5) Upper urinary tract infection 290 (30.2) 164 (33.9) 454 (31.4) Anemia 105 (10.9) 48 (9.9) 153 (10.6) Colonic diverticuli 23 (2.4) 7 (1.4) 30 (2.1) Vascular/cardiac abnormalities 116 (12.1) 51 (10.5) 167 (11.6) Abdominal hernia 107 (11.1) 43 (8.9) 150 (10.4) ADPKD = autosomal dominant polycystic kidney disease; SD = standard deviation; UTI = urinary tract infection. Table Parameter Pretitration Baseline Renal Function and Total Kidney Volume in Trial Tolvaptan (N = 961) Placebo (N = 484) Total (N = 1445) 1/serum creatinine ([mg/ml] -1 ) Number of subjects Mean SD Median Minimum Maximum egfr CKD-EPI (ml/min/1.73 m 2 ) Number of subjects Mean SD Median Minimum Maximum Page 74 of 224
75 Table Parameter Pretitration Baseline Renal Function and Total Kidney Volume in Trial Tolvaptan (N = 961) Placebo (N = 484) Total (N = 1445) TKV (ml) Number of subjects Mean SD Median Minimum Maximum Height-adjusted TKV (ml/m) Number of subjects Mean SD Median Minimum Maximum CKD-EPI = Chronic Kidney Disease-Epidemiology Collaboration; egfr = estimated glomerular filtration rate; SD = standard deviation; TKV = total kidney volume. 5.3 Dose Titration Pattern in Trial Modal analysis was used in Trial to identify the pattern of dosing over the trial course, as illustrated in Figure Modal dose reflects the dose taken most frequently within the specified time period. At the Week 3/EOT visit, the majority of subjects in the tolvaptan and placebo groups (80.9% [752/929] and 93.8% [450/480], respectively) had titrated to the highest 90/30 mg dose. Dose reduction was more common in the tolvaptan group, primarily during the initial 12 months, when approximately 20% and 6% of tolvaptan and placebo subjects, respectively, down-titrated from the 90/30 mg dose (since Week 3/EOT). By Month 36, the proportion of tolvaptan subjects receiving the highest dose was 54.4% (404/742), while 21.2% (157/742) were receiving a 60/30 mg dose, and 24.1% (179/742) were receiving a 45/15 mg dose. The proportion of placebo subjects at the highest dose by Month 36 was 83.3% (348/418), at 60/30 mg was 9.1% (38/418), and at 45/15 mg was 7.7% (32/418). At Month 36, the average daily doses in the tolvaptan and placebo groups, respectively, were 96.5 mg and mg. These data, coupled with the subject discontinuation data, indicate tolerability of the higher doses is maintained over the long-term for subjects who persist beyond the first 4 to 12 months of therapy. Page 75 of 224
76 Figure Titration Pattern Over Time in Trial EOT = end of titration; W = week. Represents modal dose since prior visit. 5.4 Datasets Analyzed for Efficacy in Trial Table summarizes the datasets used for the prospectively defined primary (TKV slope), key secondary composite endpoint, and third (renal function slope) endpoint analyses. Analyses followed ITT principles for the primary and secondary endpoints. Based on the nature of the analyses to be performed, subjects having both baseline and postbaseline data were evaluated for efficacy during the treatment period (from start of the first dose to 14 days following last dose of trial medication). Results of the sensitivity analyses are described in Section Page 76 of 224
77 Table Number of Subjects Efficacy Datasets Analyzed (First Three Endpoints) in Trial Tolvaptan (N = 961) n (%) Placebo (N = 484) n (%) Total (N = 1445) n (%) Randomized (ITT) 961 (100.0) 484 (100.0) 1445 (100.0) Analyzed for primary efficacy: TKV a ITT, within the treatment period (primary analysis) 819 (85.2) 458 (94.6) 1277 (88.4) ITT, regardless of the treatment period 842 (87.6) 465 (96.1) 1307 (90.4) Analyzed for key secondary efficacy: composite b ITT, within the treatment period (primary analysis) 961 (100.0) 483 (99.8) 1444 (99.9) ITT, within the treatment period using Week 3/EOT as 922 (95.9) 478 (98.8) 1400 (96.9) baseline ITT, regardless of the treatment period 961 (100.0) 484 (100.0) 1445 (100.0) Analyzed for secondary efficacy: renal function using reciprocal of serum creatinine ITT, subjects with at least 4 months of follow-up, within treatment period using Week 3/EOT as baseline and excluding observations deemed unreliable by the investigator (primary analysis) 842 (87.6) 464 (95.9) 1306 (90.4) ITT, subjects with at least 4 months of follow-up, within 870 (90.5) 472 (97.5) 1342 (92.9) treatment period using Wk 3/EOT as baseline ITT, regardless of the treatment period 909 (94.6) 476 (98.3) 1385 (95.8) EOT = end of titration; ET = early termination; ITT = intent-to-treat;tkv = total kidney volume; MRI = magnetic resonance imaging. Note: Within the treatment period was defined as the period starting from the first dosing day to 14 days after the last dose of trial medication. a Subjects were analyzed for the primary efficacy endpoint if they were randomized and had baseline and postbaseline observations on TKV. Subjects withdrawing from the trial early would have an MRI during the ET visit only if the subject s most recent MRI was greater than 6 months prior to withdrawal. b Subjects were analyzed for the key secondary composite endpoint if they were randomized. 5.5 Primary Endpoint: Total Kidney Volume Slope Description of the First (Primary) Endpoint - Total Kidney Volume Slope At the initiation of the pivotal trial, the only completed interventional trials in ADPKD had involved fewer than 200 subjects treated for a period of 2 to 3 years. 48 Little had been published on the disease's characteristic progression and no interventions had been successful. Total kidney volume was selected as an endpoint most directly tied to tolvaptan s anticipated effects on cyst proliferation and expansion. Total kidney volume had also been evaluated and found to be a uniquely valuable measure of the disease's progression. Its ability to detect changes over a relatively short (3-year) period of the disease's slow course of progression permitted estimation of power for what would be a clinically relevant degree of change (20% reduction). While the sponsor acknowledges Page 77 of 224
78 that TKV is an unvalidated surrogate, TKV was chosen as the primary endpoint for this trial because if no effect were seen in TKV, it was believed no other clinical benefits would be conveyed to patients. The TKV endpoint methodology established in the NIH CRISP program was adapted for the pivotal study and validated. 5 Total kidney volume also served as a mechanism for prognostic enrichment: data available during protocol design supported an association of larger TKV with more rapid progression of TKV growth and possibly the advance of renal dysfunction. Therefore, a minimum TKV of 750 ml was selected to enrich the population. Because ADPKD has no definitive therapy that can demonstrate an effect on disease progression or outcome, finding a concordance between an effect on TKV and other clinically accepted endpoints was considered the most practical way of developing support of tolvaptan s mechanism of action in this disease. Additionally, enrichment of the population was anticipated to be useful in evaluating the endpoints over a 3-year period in subjects with early ADPKD (defined as having an estimated creatinine clearance of at least 60 ml/min using Cockcroft-Gault equation). The prospectively defined primary endpoint in this trial was the rate of TKV (both kidneys) change (normalized as percentage) from baseline. In order to derive the primary endpoint, MRI was performed to evaluate TKV at baseline (31 to approximately 14 days prior to randomization) and at Month 12, 24, and 36/ET visits. Contemporary reports suggested TKV rate of change was slow and would require as much as 6 months to detect a change. 49 Therefore, a minimum of 6 months between ET and the previous MRI assessment was required. For the purpose of statistical modeling, time to MRI from randomization was treated as a continuous variable, expressed as years from the date of the Baseline MRI visit to the date of the MRI visit, ie, (date of MRI visit date of MRI visit at Baseline)/365.25, instead of a class variable with values of 0, 1, 2, or 3. In addition, to reduce heterogeneity in variance and achieve linearity over time, log 10 transformation was applied to the TKV data Results of the Primary Endpoint In the pivotal Trial , tolvaptan reduced the rate of TKV growth (primary trial endpoint), and by extension cystogenesis, by approximately half in comparison with placebo (2.78% vs 5.61%/year), for a difference of 2.71%/year (p < ). This represented a 49.2% reduction of growth rate (Table , Figure ). These data are displayed graphically in Panel A as a scatter plot of individual subject TKV percent change from baseline values, at actual time from first dose, overlaid with lines Page 78 of 224
79 representing the slopes for each treatment group. Panel B is a box and whisker plot of the same values grouped by trial visit. Table Primary Endpoint (Random Effect Intercept) in Trial : Total Kidney Volume Rate of Growth (%/year), ITT, Within Treatment Period Parameter Tolvaptan Placebo Rate of percent growth per year a Number of subjects Mean Median SD Minimum Maximum Estimated slope b Treatment effect Difference (%) % CI c 3.269, Slope reduction (%) 49.2 Ratio of geometric mean d % CI 0.969, p-value e < CI = confidence interval; ITT = intent-to-treat; MRI = magnetic resonance imaging; SD = standard deviation. Note - Subjects with baseline and postbaseline MRI results are included in the primary analysis. Within treatment period is defined as the period starting from the first dosing day to 14 days after the last dose of trial medication. a Summary statistics are derived by regressing logarithm-transformed kidney volume data against time, then displaying regression-slope exponentials. Time variable used in the regression is equal to (MRI date - baseline MRI date)/ b Slope is estimated by subtracting 1 from the geometric mean of annualized growth rate. c Derived from delta method assuming independence between the estimates of the slope between the 2 treatments. Difference in slope produced post-hoc to facilitate clinical interpretation. d An estimate of the ratio of geometric mean of annualized growth rate of tolvaptan and placebo. e Derived from testing the time treatment interaction using linear mixed model in which both intercept and slope are fixed and random effects. Page 79 of 224
80 B Figure Percent Change from Baseline in Total Kidney Volume in Trial ITT, Within Treatment Period Effect of tolvaptan on annual slope of kidney volume Slopes of total kidney volume growth (% change from baseline), ITT within treatment period and individual patient data included in slope calculations; Page 80 of 224
81 6 of 1315 placebo and 3 of 2370 tolvaptan outlier data points are not shown in the figure; Ratio of geometric mean = 0.97 (95% CI = ); P <0.001 (Panel A). Box and whisker plot of the same data grouped by visit, showing mean, median, and percentiles by treatment group (1st, 25th, 75th, 99th; Panel B). Panel A from: NEJM. Torres VE, Chapman AB, Devuyst O, Gansevoort RT, Grantham JJ, Higashihara E, et al. Tolvaptan in patients with autosomal dominant polycystic kidney disease. 367 (25): Copyright (2012) Massachusetts Medical Society. Reprinted with permission. The above analysis was prespecified in the protocol with both intercept and slope as random effects; however, the variance of the random effect intercept was zero, resulting in a non-positive definite variance-covariance matrix for the random effects. Therefore, a post-hoc analysis of the primary endpoint was performed using a linear mixed model in which the intercept was a fixed effect and the slope was fixed and random effect. The results of the revised analysis were consistent with the SAP-specified analysis, with a 49.9% reduction in TKV growth rate in the tolvaptan group compared with the placebo group (estimated slope of 2.75% and 5.49% per year, respectively). The inference statistics of these 2 analyses were similar, and both of them had a p-value < Sensitivity Analyses of the Primary Endpoint Measurement of total kidney volume is a unique and novel endpoint for clinical trials. Relatively little information was available regarding the potential for an intervention s effects on TKV. As an example, acute effects which might lead to a non-linear time course were not anticipated when the protocol was written; however, advice led us to include a number of sensitivity and exploratory analyses which are important in a fuller understanding of this endpoint and tolvapan s actions on it. These sensitivity and exploratory analyses are presented in Section while analyses focusing on specific approaches to missing data are discussed in Section While all sensitivity analyses were consistent with the primary analyses, the prospectively defined MMRM analysis which can handle non-linearity revealed that the effect of tolvaptan was greatest in the first year with smaller and similar, but still statistically significant, effects for Year 2 and Year 3 (Section ). A by-center analysis showed tolvaptan was favored for a majority of centers (Section ). A bycountry analysis favored tolvaptan in all countries. Page 81 of 224
82 5.6 Key Secondary Composite Endpoint Description of the Second (Key Secondary Composite) Endpoint and its Components The concept of a key secondary composite endpoint was recommended by the FDA as a measure of time to multiple ADPKD clinically relevant, investigator-reported progression events for tolvaptan (combining all doses) relative to placebo while on treatment. This endpoint was designed to measure outcomes which are clinically relevant to the patient, and provide evidence of the effects of events related to the ongoing destruction of kidney tissue and progression of kidney disease. Components of the composite are not definitive outcomes (eg, albuminuria); they each represent measures of new, ongoing or worsening pathophysiological processes in the kidney. The four composite components selected were measures of the disease which were believed to be likely related to cyst expansion and which might be measurable over a 3-year period Worsening Renal Function Event Component Cyst growth gradually decreases renal function through physical destruction of nephrons. Ongoing, progressive and irreversible reduction in egfr, creatinine clearance, or GFR, was considered reliable evidence of meaningful disease progression. In previous trials of therapies for diabetic nephropathy a 100% increase in serum creatinine was used as an acceptable threshold. Since FDA agreed that this degree of change was not likely to be reached in early ADPKD within a reasonable time, a 25% decline in the reciprocal of serum creatinine (1/serum creatinine), which is equivalent to a 33% increase in serum creatinine, was used. A worsening renal function event was defined as a reduction of renal function of at least 25% reduction in the reciprocal serum creatinine from baseline, and each subsequent further 25% reduction based on the reciprocal serum creatinine observed at the previous event. A 25% reduction in the reciprocal serum creatinine had to be confirmed by a second visit which was at least 14 days apart to be considered as a worsening renal function event. If a second visit was less than 14 days apart, the visit would be discarded and the next visit which was at least 14 days apart would be used for confirmation. If confirmed, the first visit of 25% reduction was the date at which the event occurred, and the reciprocal serum creatinine of the event was defined as the reciprocal serum creatinine which was less severe between these two visits. Serum creatinine measurements for calculation of renal function were taken at Screening, Baseline, Week 3 (or EOT), Months 4, 8, 12, 16, 20, 24, 28, 32, 36/ET, Follow-up Visit 1, and Follow-up Visit 2. For the consideration of the renal function component, Page 82 of 224
83 the baseline was defined as Week 3/EOT due to the known acute and reversible hemodynamic effects on GFR and serum creatinine (see Section ) Renal Pain Event Component Cyst expansion could lead to pain due to stretching of the renal capsule, cyst rupture, cyst hemorrhage, infection, etc. All these underlying processes are themselves events which represent acute-on-chronic injury to the kidney. Therefore the frequency of intermittent acute kidney pain can be a reliable sign of meaningful disease progression. Since no accepted patient-reported outcomes for ADPKD pain existed, an event defined by a subject complaint which on assessment led to a prescription for medical intervention for pain relief was used (eg, nerve block, use of narcotic or other prescription and nonprescription nociceptive agents, or requirement for medical leave). This is much less sensitive than a typical pain scale, but since the pain events were likely to be intermittent, it was felt to be more specific. Interventions at 3 levels were included such that a lower level intervention could not be an event once a higher level intervention had occurred. The component of renal pain counted events arising from all causes of renal pain associated with ADPKD (infection, cyst rupture, hemorrhage, nephrolithiasis, etc) but was limited to interventions specifically aimed at reducing pain, eg, not including lithotripsy or antibiotics. To meet this endpoint, pain was required to satisfy 2 criteria: 1) in the judgment of the principal investigator (PI), the pain had to originate from the kidney or upper urinary tract 2) in the judgment of the PI, the pain had to be significant enough to require a medical intervention. In the construction and analysis of this endpoint, the level of intervention used was further categorized based on 3 levels of intervention (listed below in decreasing order of intensity). 1) use of invasive surgical or radiological procedures 2) use of prescription narcotic or antinociceptive agents which are centrally acting (eg, tricyclic antidepressants) 3) use of prescription or non-prescription non-narcotic analgesics or antinociceptive agents or the prescription of medical leave or limitations on activities. Investigators learned of pain events via subject self-report during scheduled or unscheduled trial visits, or through a report from the subject s primary care physician. The occurrence of such events was recorded on special case report forms (CRFs). The investigator was to document whether a medication or intervention was used in management of renal pain. The date of the event was the date the intervention was Page 83 of 224
84 prescribed. If the prescription date was missing or partially reported on the CRF for medication-related events, the medication start date was utilized as the event date Hypertension Event Component Presence or degree of hypertension has been accepted as a validated surrogate of cardiovascular risk. Progression of BP increase or difficulty in management of hypertension represent a novel and untested method for assessing the progress of CKD, however these characteristics are theoretically reasonable surrogates of progressive renal ischemia due to cyst growth. In untreated, pre-hypertensive patients, BP itself could serve as an endpoint with various thresholds leading to categorical changes. There were two kinds of events for worsening hypertension: events based on BP for non-hypertensive subjects not taking hypertensive medication, and events based on increased doses or new medications for worsening hypertension in hypertensive subjects already taking hypertensive medication. Once treated, the intensity of treatment was used as a measure of progression of hypertension. Subjects who became hypertensive during the trial could have both kinds of hypertensive events. Blood pressures were grouped into four categories (in increasing order of significance): normotensive (sbp < 120 and dbp < 80 mmhg and off therapy) low-pre-hypertensive (sbp 129 and dbp 84 mmhg but not normotensive and off therapy) high-pre-hypertensive (sbp 139 and dbp 89 mmhg but not normotensive/lowpre-hypertensive and off therapy) hypertensive (sbp >139 and/or dbp > 89 mmhg or on anti-hypertensive therapy). Subjects whose BP shifted to a higher category in two consecutive visits compared to baseline category (or the category of their most recent previous BP events) were considered to have a BP event. In this case, the first of the two consecutive visits was considered as the visit of the event, and the less severe category among the two consecutive visits was considered as the category of the event. Based on these BP event categories, a subject could have at most three BP events. A subject could have as many hypertensive medication events as possible, if each of them was an introduction or dose increase of hypertensive medication, as compared to their most recent previous hypertensive medication events. An IV and intramuscular (IM) route of hypertensive medication for treating worsening hypertension was always considered as a hypertensive medication event. Page 84 of 224
85 Blood pressure measurements were taken at Screening, Baseline, Day 1, Weeks 1, 2, and 3 (or End of Titration [EOT]), Months 4, 8, 12, 16, 20, 24, 28, 32, 36/ET, Follow-up Visit 1, and Follow-up Visit Albuminuria Event Component Although not typically associated with ADPKD, as cysts grow and renal function continues to deteriorate, stress on the remaining normal nephrons (due to hyperfiltration, fibrosis and hemodynamic changes) are believed to be associated with progressively higher levels of proteinuria. The endpoint counted an event defined by persistent clinically relevant shifts in thresholds (no proteinuria, micro-, macro-albuminuria) defined by central laboratory thresholds for each gender. Categories of albuminuria based on urine albumin/creatinine ratio were grouped in the following in increasing order of significance (see below). At most, 2 events could occur. normal (urine albumin/ creatinine of < 2.8 mg/mmol female or < 2.0 mg/mmol male) microalbuminuria (urine albumin/ creatinine of mg/mmol female or mg/mmol male) overt proteinuria (urine albumin/ creatinine of >28 mg/mmol female or >20 mg/mmol male) Albuminuria was assessed using spot urine albumin/creatinine ratio measurements determined for urine samples collected at the clinic during visits at Screening, Baseline, Week 3 (or EOT), Months, 4, 8, 12, 20, 24, 28, 32, 36/ET, Follow-up Visit 1, and Follow-up Visit 2. Urine samples were collected using second morning urine after awaking, collected using "clean-catch, mid-stream" technique Analysis Method for the Key Secondary Composite Endpoint Because tolvaptan was believed to act through reduction of cyst expansion and its consequences, the key secondary composite endpoint was placed after the primary TKV endpoint. This order was selected since the hypothesis requires cyst growth as an earlier step in disease progression. Success in the key secondary composite endpoint was presumed to be dependent of the success of the TKV endpoint. For the primary analysis of the key secondary composite endpoint, all the clinical ADPKD progression events occurring during the double-blind treatment period from a) the date of the first dose of trial medication (for HTN, proteinuria, and renal pain) or b) the completion of the titration phase (for renal function) to the date of trial completion/et were included in the analysis for all ITT subjects. Page 85 of 224
86 By agreement with the FDA, this primary analysis did not include data from visits for subjects who had withdrawn from trial medication administration but continued to have telephone contact on PKD Outcomes. These data were added to sensitivity analyses for exploratory purposes. The double-blind treatment period was typically defined as a period from the first dose of trial medication to the end of a 14-day window of the last dose of trial medication. For this endpoint, events occurring within the first 2 days of trial medication initiation were excluded from analysis, because they were considered to be due to baseline conditions. Analysis of time to multiple (recurrent) events using proportional rate and mean model was used for the analysis of the key secondary composite endpoint to provide a point estimate of the hazard ratio (which for time to multiple event analyses may be more appropriately considered to be an intensity ratio ) and its p-value. This analysis of rate and mean model was identical to the analysis of the intensity model (Andersen-Gill model) using the sandwich covariance matrix estimate to derive standard errors for the Wald test. Two analyses of the key secondary composite endpoint were conducted: 1) The first analysis included all events observed during the double-blind treatment period as defined in the previous paragraph, using Day 1 as the baseline value for all components other than worsening renal function. This analysis was the primary analysis of the key secondary composite endpoint. 2) The second analysis included a sensitivity analysis of all events observed during the double-blind treatment period from Week 3/EOT to the end of the double blind treatment period, using Week 3/EOT as the new baseline value for all components. This sensitivity analysis was proposed to reduce the possible noise from BP measures taken during a period of acclimation to the trial, the trial medication, and while other antihypertensive medications were being stabilized or titrated, as diuretics were discontinued as required per protocol in the screening and titration period. A significance level of 0.05 (two-sided) was used to declare statistical significance for the key secondary composite endpoint, for the purpose of subsequent sequential analysis. Additional considerations for these analyses included the following: Follow-up Visit 1 was used to confirm events whose first occurrence was reported as Month 36. if an event was first reported at the ET visit, no confirmation was required. dates of events were mapped to the next scheduled or unscheduled visit. multiple events mapping to a single visit were collapsed to a single event. Page 86 of 224
87 subjects reaching their Month 36/ET visit without having an event at that visit were censored at that point Results of the Key Secondary Composite Analysis For the primary analysis of the key secondary composite endpoint, all the clinical ADPKD progression events occurring during the double-blind treatment period from the date of first dose (Day1) of study medication for all ITT subjects were included in the within treatment period analysis. In this analysis, tolvaptan reduced the rate of the pooled composite events by 13.5% (p = ), meeting the FDA-prescribed level of significance (Figure ). Cumulative Hazard TLV N = PLC N = Placebo Tolvaptan Cox Model P = Hazard Ratio: % CI: (0.775, 0.965) MONTHS IN STUDY Figure PLC = placebo; TLV = tolvaptan. Cumulative Hazard Functions of Time to Multiple Events for the Key Secondary Composite Endpoint in Trial ; ITT, Within Treatment Period The second analysis using Week 3/EOT visit as baseline was also significant (HR 0.877, 95% CI , p = ) Sensitivity Analyses of the Key Secondary Composite Endpoint The key secondary composite endpoint was a composite of unique and novel events representing ADPKD disease progression. Relatively little information was available regarding the frequency of these events in early ADPKD patients. To gain a better Page 87 of 224
88 understanding of this endpoint and its components, a variety of sensitivity and exploratory analyses were conducted for each. These analyses for the overall key secondary composite endpoint are presented in Section while analyses focusing on specific approaches to missing data are discussed in Section While all sensitivity analyses, including an analysis using events considered clinically meaningful for disease progression by a clinical events committee (CEC), were consistent with primary analysis (Section ), the by-center analysis of the key secondary composite endpoint demonstrated that treatment effect came from most of the centers, not just from a few large centers (Section ). The by-country analysis showed 9 out of 15 countries demonstrated a treatment effect in favor of tolvaptan with the US result nominally favorable for tolvaptan and consistent with the overall result Analyses of the Individual Components of the Key Secondary Composite Endpoint The key secondary composite endpoint was constructed to provide adequate power to detect an effect on measures related to clinically important disease progression. If an overall effect on the composite was shown, it would be important to evaluate tolvaptan s effects on each of its components. If the effect was driven by a single component of uncertain clinical significance (eg, albuminuria), FDA might consider the composite to have little clinical value. These components were analyzed prospectively without need for adjustment for multiplicity, as agreed by the FDA. The component analysis revealed that the positive composite result was driven by worsening renal function events and renal pain events (Table ). Page 88 of 224
89 Table Supplemental Analysis in Trial : Time to Multiple Events for Components of the Key Secondary Composite Endpoint; ITT, Within Treatment Period Parameter Worsening Renal Function Renal Pain Worsening Hypertension Worsening Albuminuria Tolvaptan (N = 961) Placebo (N = 483) Tolvaptan (N = 961) Placebo (N = 483) Tolvaptan (N = 961) Placebo (N = 483) Tolvaptan (N = 961) Placebo (N = 483) Number of subjects Number of events Total follow-up years E/100 follow-up years Mean follow-up years HR a % CI a 0.263, , , , p-value a < CI = confidence interval; E = event; EOT = end of titration; HR = hazard ratio; ITT = intent-to-treat. a Derived from rate and mean model of time to recurrent event analysis with factor treatment. All endpoints are assessed from pretreatment baseline except for Worsening Renal Function, which uses the Week 3/EOT as baseline. Page 89 of 224
90 These results reflect a relative improvement of 61.4% for events of worsening renal function and 35.8% for renal pain events. Treatment did not impact worsening hypertension or albuminuria events (at bottom of Figure ). The beneficial reduction in worsening renal function events was evident after the first year of tolvaptan therapy, whereas separation between treatment groups for the reduction in renal pain events was observed early in the treatment period. This difference in pattern was likely due to the relatively slow rate of renal function decline required to produce a reproducible increase in serum creatinine of 33%. The observed rate of worsening renal function events in the placebo group is consistent with the relative risk for a 30% decline in renal function for ADPKD when matched to baseline kidney volume. This risk estimate was derived from a model using retrospective data from ADPKD patients which was recently presented to FDA by the PKD Outcomes Consortium (28 Jun 2013). This degree of change is associated with a clinically and statistically meaningful increased risk of progression to ESRD in a dataset consisting of non-adpkd patients with chronic kidney disease (CKD Progression Consortium meeting on 3 Dec 2012, Baltimore, MD). Page 90 of 224
91 Placebo Cox Model P = < 0001 Tolvaptan Hazard Ratio: % CI: (0.263, 0.566) 0 3 Placebo Tolvaptan Cox Model P = Hazard Ratio: % CI: (0.466, 0.887) Cumula ive Hazard Cumulative Hazard TLV N = TLV N = PLC N = PLC N = MONTHS IN STUDY Worsening Renal Function MONTHS IN STUDY Renal Pain Cumulative Hazard TLV N = PLC N = Placebo Tolvaptan Cox Model P = Hazard Ratio: % CI: (0.814, 1.090) Cumulative Hazard TLV N = PLC N = Placebo Tolvaptan Cox Model P = Hazard Ratio: % CI: (0.837, 1.284) MONTHS IN STUDY MONTHS IN STUDY Figure Worsening Hypertension Worsening Albuminuria Cumulative Hazard Function of Time to Multiple Events for Components of the Key Secondary Composite Endpoint in Trial CI = confidence interval; PLC = placebo; TLV = tolvaptan. Page 91 of 224
92 5.6.5 Sensitivity Analyses of Components of the Key Secondary Composite Endpoint Further sensitivity analyses of all components of the key secondary composite were performed to test the robustness of results. The sensitivity analyses for events of worsening renal function and renal pain are described in Section Where appropriate, results for worsening hypertension and albuminuria event components are also described. The analyses assessing the impact of missing data on the conclusions of the key secondary endpoint component analyses for renal pain and worsening renal function events are provided in Section Related analyses are available from patientreported renal pain intensity (0 to 10 Likert scale) and PKD Outcomes, reported in Section and Section 5.9, respectively. Consistent with the key secondary composite endpoint sensitivity analysis using adjudicated events, the sensitivity analysis using adjudicated events of only renal pain and worsening renal function were consistent with primary analysis (Section ). A by-country analysis of time to multiple renal pain events and worsening of renal function events revealed that 12 countries favored tolvaptan numerically, one country had no event in either treatment group, and 2 countries favored placebo numerically (Section ). In the US, renal pain events trended toward significance. There were not enough events for a by-center analysis to be performed. 5.7 Third Endpoint: Renal Function Slope Description of the Third (Renal Function Slope) Endpoint The change in the slope of renal function, the third sequentially tested endpoint in Trial , points to the entire population s trend for kidney disease progression. Use of estimated GFR slope assesses the continuous overall effects of an intervention on function in contrast to the composite component of worsening renal function events which is driven by those subjects whose disease is progressing most rapidly. The reciprocal of serum creatinine has a linear relationship with GFR, unlike the serum creatinine level that has a curvilinear relationship, and approximates GFR values when expressed as (mg/ml) -1. Since acute, consistent and reversible increases in serum creatinine concentration are produced by tolvaptan through a known hemodynamic effect (refer to Section ), the change from a post-titration, on-treatment, steady-state value (Week 3/EOT) was prospectively defined to be used for renal function change assessments. Additional details are presented in Section Page 92 of 224
93 To be consistent with the key secondary composite endpoint, GFR estimates based on serum creatinine data that were considered unreliable by the investigators were excluded from the primary analysis of the egfr endpoint. Sensitivity analysis using all available was also provided Results of the Slope of Renal Function The renal function decline (using 1/serum creatinine slope) was slowed by tolvaptan -1 treatment by approximately 32%: estimated slope of (mg/ml) -1 year versus placebo (mg/ml) -1 year -1 for a treatment effect of (mg/ml) -1 year -1 (95% CI to 1.783, p < ) (see Table ). These data are displayed graphically in Figure as a scatter plot of the individual subject change from Week 3/EOT in 1/serum creatinine, at actual time after first dose, overlaid with lines representing the slopes for each treatment group. Table Secondary Endpoint: Rate of Change in Renal Function in Trial ; ITT Subjects With at Least 4-month Followup, Excluding Observations Deemed Unreliable by Investigators, Within Treatment Period Endpoint Tolvaptan Placebo 1/serum creatinine ([mg/ml] -1 ) Number of subjects Mean rate of change per year a Estimated slope b Treatment effect c % CI 0.622, p-value b < egfr CKD-EPI (ml/min/1.73 m 2 ) Number of subjects Mean rate of change per year a Estimated slope b Treatment effect c % CI 0.597, p-value b < CI = confidence interval; EOT = end of titration; ITT = intent-to-treat; a Summary statistics were based on slope of change, obtained by regressing renal function data (Week 3/EOT and beyond) against time by subject. Time variable used in the regression was equal to (observation date - Week 3/EOT date)/ b Derived from testing the time treatment interaction using linear mixed model in which both intercept and slope are fixed and random effects. c An estimate of the difference between the slopes of tolvaptan and placebo. Page 93 of 224
94 Change in Kidney Function (Reciprocal Serum Creatinine [mg/ml] -1 ) EOT/ Week Time (Months) Figure Rate of Change in Renal Function in Trial ITT Subjects With at Least 4-month Follow-up, Excluding Observations Deemed Unreliable by Investigators, Within Treatment Period Effect of tolvaptan on annual slope of kidney function. Solid line represents tolvaptan; dotted line represents placebo. Slopes of kidney function estimated by reciprocal serum creatinine (mg/ml) -1, ITT, within treatment period using on-treatment baseline (Week 3/end of titration) and individual patient data included in slope calculations; 19 of 4759 placebo and 16 of 8564 tolvaptan outlier data points are not shown in the Figure; annual difference in slope= (mg/ml) -1 /year (95% CI = ); P < From: NEJM. Torres VE, Chapman AB, Devuyst O, Gansevoort RT, Grantham JJ, Higashihara E, et al. Tolvaptan in patients with autosomal dominant polycystic kidney disease. 367 (25): Copyright (2012) Massachusetts Medical Society. Reprinted with permission. The 32% effect size in the trial for tolvaptan in ADPKD doubles that seen in the RENAAL trial for losartan in diabetic nephropathy, which produced a relative treatment effect of 16% ( 4.2 versus 5.0 ml/min/1.73m 2 /year) (Section 5.7.3) Sensitivity Analyses of the Slope of Renal Function The most important sensitivity analysis for renal function slope was aimed at understanding the impact of hemodynamic responses of GFR before, during, and after tolvaptan treatment. Tolvaptan results in an acute and reversible decrease in GFR which produces an acute increase in serum creatinine (Section ,Figure ). Therefore, sensitivity analyses calculating slopes incorporating all pretreatment and Page 94 of 224
95 posttreatment data points (Analysis 1 in Table ) or using only pretreatment and posttreatment data points (Analysis 2 in Table ) were performed. Both of these analyses were highly statistically significant (p <0.0001) and in close agreement with the prespecified on-treatment analysis. Figure Mean Change in Renal Function by Reciprocal of Serum Creatinine in Trial EOT = end of treatment; GFR = glomerular filtration rate. Filled symbols = on treatment, Empty symbols = pre- or post-treatment. Table Analyses of Slope of Reciprocal of Serum Creatinine Analysis Slope (mg/ml) -1 year -1 p-value Placebo Group Tolvaptan Group Treatment Effect (95% CI) Pre-specified on-treatment analysis: Week 3/EOT to Month ( ) < Sensitivity Analysis 1: All data, Baseline to Last Follow-up ( ) < Sensitivity Analysis 2: Off -drug data points only, Baseline and Follow-up Visits CI = confidence interval; EOT = end of titration ( ) Page 95 of 224
96 The primary analysis used change from a post-titration, on-treatment, steady-state value (Week 3/EOT). There are precedents for use of this approach to account for acute, reversible changes in serum creatinine when evaluating long-term trends for renal function (refer to Section 5.15). 6,13,14,15,16, 17 Other sensitivity analyses were performed to evaluate the robustness of this endpoint and to further examine the effects of applying the analyses using various alternative formulas for estimating renal function (egfr CKD-EPI, egfr MDRD, and ecrcl CG ), various tests for non-linearity, non-normality, and to test the effects of including additional data (eg, serum creatinine measures deemed unreliable by the investigator) or data points (pre- and post-treatment values). The results of these sensitivity analyses are described in Section Analyses employing various methodologies to explore the impact of missing data are described in Section All sensitivity analyses were consistent with the primary analysis but two analyses were of particular interest. The first was the analysis using the CKD-EPI formula for estimation of GFR. The CKD-EPI formula was not available at the time of protocol initiation but is now considered the most accurate formula for estimation of GFR from serum creatinine, as it does not systematically underestimate measured GFR at higher values 56 (Section ). A by-center analysis of the rate of decline for egfr CKD-EPI demonstrated that the treatment effects of the rate of renal function change favored tolvaptan for the majority of the trial centers. A by-country analysis of the rate of egfr CKD-EPI change showed that in 12 out of 14 countries tolvaptan demonstrated a favorable treatment effect (not evaluable in 1 country, Denmark) with the US result nominally favorable for tolvaptan and consistent with the overall result (Section ). 5.8 Other Secondary Trial Endpoints Control of potential error due to multiplicity was managed through pre-specified hierarchical testing of endpoints (Section 3.5.4). Beyond the third endpoint above, the 4th through 7th secondary endpoints each failed to reach the p <0.05 level of significance required for formal inferential statistical testing. Any subsequent sensitivity, exploratory, subgroup and PK/PD endpoints were subjected to inferential analyses, even if prespecified, only to provide nominal descriptions of variances of estimates of difference between treatment groups. Page 96 of 224
97 5.8.1 Fourth Endpoint: Blood Pressure in Non-hypertensive Subjects The potential effects of tolvaptan on MAP were evaluated in subjects not receiving antihypertensive therapy. The primary analysis included subjects who had completed at least 4 months of follow up prior to receiving antihypertensive medication to mitigate the effects of early withdrawal and improve accuracy of annualized slope estimates. Results of this analysis were not statistically different between groups. The estimated slope of MAP increased by mmhg/year for tolvaptan and mmhg/year for placebo, for an estimated treatment effect of (95% CI to , p = ). Additional sensitivity analyses were performed, including analyses of subjects using all available observations, MMRM by-visit analyses and analyses of each component of MAP (sbp and dbp). None of these analyses yielded significantly different overall results, but each suggested an overall trend for decreased slope of BP increase in the tolvaptan group. The lack of significant difference in this endpoint may be attributed to the slow progression of MAP (3.7 mmhg over 3 years for placebo), modest treatment effect on BP (0.5 mmhg over 3 years) and the relatively small number (around 200) of subjects available for un-confounded BP assessment. Additionally, subjects in both treatment groups trended towards a slight improvement in sbp during the trial (mean change ranging from 0.9 to 2.9 mmhg for tolvaptan and 0.6 to 2.2 mmhg for placebo) likely reflecting better overall clinical management of hypertension during the trial. The relatively high prevalence of treated hypertension seen in the population at baseline may have limited the power to assess effects on MAP progression Fifth Endpoint: Renal Pain Score in Subjects Untreated for Pain at Baseline The potential effects of tolvaptan on renal pain were examined using the secondary endpoint of time-averaged AUC of renal pain score (Lickert scale from 0-10 for no to worst pain) for subjects not taking pain medications at baseline. The primary prespecified analysis included all subjects not taking pain medications and included all scores received during treatment up to the initiation of medication or therapy for pain. The results of this analysis were not different between groups (least squares mean AUC of 0.00 for tolvaptan and 0.08 for placebo, difference of 0.08, 95% CI 0.20 to +0.03, p = ). Additional sensitivity analyses included a by-visit MMRM analysis and analyses restricted to those with baseline pain (a pain score > 0). Neither analysis reached significance. Results of the MMRM analysis varied widely by visit, typically favoring Page 97 of 224
98 tolvaptan, but rarely trending or reaching nominal significance. Analyses of subjects with baseline pain were limited by the relatively small number (less than 350) of subjects who were not taking pain medications at baseline. Both sets of analyses were hampered by the fact that in most subjects, pain appeared to be reported intermittently, and this instrument had an unusually long recall period of 4 months, which was likely insensitive to scoring intermittent pain. Nevertheless, these results generally support the key composite component results for renal pain. In response to an FDA request relating to the key secondary composite renal pain event component, additional analyses of the renal pain scale were generated to understand the nature of pain leading to these events. An alternative post-hoc analysis which measures the maximum change in pain for these intermittent events is provided below. Data presented in Table indicate that the tolvaptan group of subjects reported a nominally lower average maximum change in pain score. Table Maximum Change from Baseline in Renal Pain Scale (0-10) in Trial ; ITT Subjects with Post-baseline Renal Pain Scale Observations, Within Treatment Period Baseline N Mean SD Min Max Diff (95% CI) P-value Tolvaptan Placebo Maximum Change from Baseline Tolvaptan ( ) Placebo CI = confidence interval; Diff = difference; ITT = intent-to-treat; SD = standard deviation. The difference in results between the maximum change analysis and the AUC analysis was believed to be due to the nature (acute intensity versus chronicity) of pain being reported. We next evaluated whether this shift was attributable to the subgroup who reported renal pain events to the key secondary composite component of renal pain events (Table ). Subjects without renal pain events had a lower baseline and lower maximum change in score for both treatment groups. Similarly, when comparing scores between those without renal pain events and those with events, the latter group s higher baseline and maximum change in renal pain scores were no different between tolvaptan and placebo subjects. Therefore subjects who reported renal pain events differed from those without events. Page 98 of 224
99 Table Maximum Change from Baseline in Renal Pain Scale (0-10) by Subjects with or without Renal Pain Events in Trial ; ITT Subjects with Post-baseline Renal Pain Scale Observations, Within Treatment Period Subjects without Renal Pain Events Baseline N Mean SD Min Max Tolvaptan Placebo Maximum Change from Baseline Tolvaptan Placebo Subjects with Renal Pain Events Baseline N Mean SD Min Max Tolvaptan Placebo Maximum Change from Baseline Tolvaptan Placebo ITT = intent-to-treat; SD = standard deviation; max = maximum; min = minimum. Results of this patient-reported pain intensity scale are concordant with the results of the key secondary composite component of renal pain. They also provide insight into the subjects perceived level of pain which was associated with triggering events of renal pain. In order to capture a pain event, as was done in the key secondary composite endpoint, a significant difference in patient-reported pain appears to be required. Tolvaptan treatment did not lower the maximum pain score as an anti-nociceptive; it reduced the incidence of renal pain adequate to trigger an event necessitating medical intervention. The reduction by tolvaptan in the relative frequency of these events is described in Section The medical significance of this reduction is also discussed in Section where renal pain captured as a clinically relevant PKD Outcome contributed to lower overall rates of hospitalization and other patient outcomes Sixth Endpoint: Time to Multiple Hypertension Progression Events in Non-hypertensive Subjects It was possible that hypertension progression events (defined by categorical BP change or prescription of a new antihypertensive treatment) would more sensitively discriminate an effect of tolvaptan in patients who were not yet hypertensive. For this analysis, hypertension progression was evaluated on a time to multiple event basis in subjects nonhypertensive at baseline. Neither this analysis nor a sensitivity analysis for time to first event revealed a significant effect of tolvaptan (HR 0.996, 95% CI to 1.233, p = and HR 0.941, 95% CI to 1.306, p = , respectively). As noted previously, analysis was limited by the small numbers within the non-hypertensive subpopulation (around 250 subjects). Page 99 of 224
100 5.8.4 Seventh Endpoint: Percentage of Subjects with Sustained Reductions in Antihypertensive Therapy Effects on blood pressure control were also evaluated in subjects who were already hypertensive and taking antihypertensive medications. This analysis measured the frequency of subjects who were already receiving antihypertensives and achieved a sustained reduction of anti-hypertensive therapy attributable to lowered MAP. Reductions meeting these criteria were infrequent (< 10% of eligible subjects). The results of a last observation carried forward (LOCF) analysis and an observed case (OC) analysis were nominally in favor of tolvaptan at every visit tested (Months 12, 24, and 36, or Follow-up Visits 1 or 2), yet neither analysis reached statistical significance nor a trend at any time during treatment or post-treatment. One explanation for the lack of statistical significance could be the small number of subjects achieving such a response. 5.9 PKD Outcomes Exploratory Endpoint Description of PKD Outcomes A prespecified, exploratory endpoint, PKD Outcomes, in Trial addressed relevant medical, social, and economic consequences of new and ongoing ADPKDrelated morbidities. In addition to outcomes related to the 4 component events of the key secondary composite endpoint, other outcomes that may or may not be related to renal cystogenesis were examined. Complications of ADPKD were assessed by subjects and investigators at each trial visit (or by telephone contact for those subjects who withdrew from treatment, but agreed to be followed), and were recorded when they rose to a clinically significant level. Additionally, important health care consequences (time off work, clinic or emergency room visits, hospitalizations and procedures) which resulted from these events were recorded. Prior to unblinding, the FDA had communicated that it would be important to identify any additional outcomes which might support efficacy. Therefore, the pooled data were evaluated while still blinded, and the SAP was modified to include analyses of 1) the overall 13-item ADPKD Outcomes composite (13 items: renal pain, hematuria, albuminuria, nephrolithiasis, upper urinary tract infection [UTI], anemia, abdominal/inguinal hernia, significant drop in renal function [eg, dialysis], hypertension, colonic diverticuli, vascular/cardiac abnormalities, hepatic cysts, and cysts in other organs), 2) subset composite of 9 items reasonably related to kidney enlargement (9 items: renal pain, hematuria, albuminuria, nephrolithiasis, UTI, significant drop in renal function, hypertension, anemia, abdominal/inguinal hernia), and 3) individual event rates Page 100 of 224
101 for the 4 prespecified most frequent components of PKD Outcomes (hypertension, renal pain, UTI, and hematuria). PKD Outcomes data were requested from subjects who withdrew from treatment, as a means of obtaining more complete data for analysis. The subjects who agreed to have at least these telephone calls increased overall follow up from 77.0% to 87.6% for tolvaptan subjects (mean follow up of 2.66 years) and from 86.2% to 91.8% for placebo (mean follow up of 2.80 years) Results of PKD Outcomes While exploratory, the PKD Outcomes analyses support findings of the key secondary composite endpoint and the effect of tolvaptan on ADPKD physiology Overall PKD Outcome Frequency The frequency of these ADPKD outcomes were consistent with the pattern of results observed in the key secondary composite endpoint (eg, while outcomes relating to renal pain were significantly reduced, those for hypertension were not) and suggest tolvaptan favorably delays ADPKD kidney progression in a number of ways meaningful to patients and their physicians. Overall event frequency is depicted in Table Table PKD Outcomes Exploratory Endpoint in Trial : Summary of Number of Subjects with Clinically Significant Outcomes; All Subjects Followed to Trial Medication Discontinuation or Trial Completion Clinically Significant Event Tolvaptan (N=961) a Placebo (N=484) a n b (%) n b (%) Hypertension 336 (34.9) 173 (35.7) Renal pain 252 (26.2) 184 (38.0) Urinary tract infection 95 (9.8) 71 (14.6) Hematuria 73 (7.5) 67 (13.8) Anemia 22 (2.2) 22 (4.5) Abdominal or inguinal hernia 30 (3.1) 18 (3.7) Nephrolithiasis 17 (1.7) 17 (3.5) Significant drop in renal function 9 (0.9) 5 (1.0) Albuminuria 5 (0.5) 7 (1.4) Vascular/cardiac abnormality c 42 (4.3) 22 (4.5) Hepatic cysts c 17 (1.7) 8 (1.6) Other organ cysts c 13 (1.3) 9 (1.8) Colonic diverticuli c 4 (0.4) 0 PKD = polycystic kidney disease. a Total number of subjects who answered the outcome survey. Page 101 of 224
102 b Total number of subjects with a clinically significant outcome. c Outcomes pre-specified as unlikely to be related to ADPKD renal progression (size/function) which were excluded from the 9-item composite Time to Event Analyses of Common PKD Outcomes Prior to unblinding, but after the overall event rates were known and based on knowledge of all events with a rate of approximately 5% or greater, analyses of time to multiple events and time to first event of renal pain, UTI, hematuria, and HTN were pre-specified. The analyses of the time to multiple events and to first events of renal pain, UTI, and hematuria were individually nominally significantly different (fewer events on tolvaptan; time to multiple event data shown): Renal pain outcomes: versus events per 100 follow-up years Hazard ratio = 0.666, 95% CI to 0.825, p = Upper UTI outcomes: 4.21 versus 6.62 events per 100 follow-up years Hazard ratio = 0.636, 95% CI to 0.917, p = Hematuria Outcomes: 2.69 versus 4.97 events per 100 follow-up years Hazard ratio = 0.542, 95% CI to 0.797, p = No differences were observed in the analysis of time to multiple and first events of HTN (time to multiple event data shown): Hypertension outcomes: versus Events per 100 follow-up years Hazard ratio = 0.925, 95% CI to 1.124, p = Time to Event Analyses for PKD Outcome Composites For each of the 13 individual PKD Outcomes components, the proportion of subjects in the tolvaptan group that experienced each outcome was either less than or similar to the proportion of subjects in the placebo group that experienced that outcome (Table ), consistent with the primary and secondary endpoints. Notably, in analysis of the 13-item composite of complications related to ADPKD progression, tolvaptan reduced the rate of complications by 20.8% on a time-to-multipleevent basis, a significant difference between groups (p = ) (Figure ). Results were consistent and nominally significant for time to first event. Page 102 of 224
103 TLV N = Cumulative Hazard PLC N = Placebo Tolvaptan Cox Model P = Hazard Ratio: % CI: (0.697, 0.899) DAYS IN STUDY Figure Cumulative Hazard Functions of Time to Multiple ADPKD Outcomes (All Thirteen Items) PLC = placebo; TLV = tolvaptan. Note: Within treatment period and subjects followed at least to Month 4. Time-to-multiple-event analysis of the 9-item composite of complications believed to be related to kidney enlargement supported the hypothesized relationship between the primary and key secondary composite endpoints, with a reduced events rate of 23.0% (p = ) (Figure ). Results were consistent and nominally significant for time to first event. Page 103 of 224
104 TLV N = Cumulative Hazard PLC N = Placebo Tolvaptan Cox Model P = Hazard Ratio: % CI: (0.674, 0.878) DAYS IN STUDY Figure Cumulative Hazard Functions Outcomes (Nine Items) PLC = placebo; TLV = tolvaptan. Note: Within treatment period and subjects followed at least to Month Clinical Relevance of PKD Outcomes of Time to Multiple ADPKD Frequency of Socioeconomic Impact for PKD Outcomes Tolvaptan subjects were found to have experienced fewer socioeconomic outcomes (lost productivity) and decreased resource utilization (healthcare visits, medical procedures), most notably in relation to kidney pain, hematuria, and urinary tract infection (Table ). A smaller reduction in healthcare visits was seen for hypertension, consistent with the frequency of these outcome events. The frequency of health care visits reported was highest for kidney pain and other outcomes which are directly attributable to the cystic pathophysiology of ADPKD (upper UTI, hematuria, nephrolithiasis, and abdominal/inguinal hernia). The impact of tolvaptan was apparent for those events which occur intermittently, but less so for events which take years to manifest (like hernia and hypertension). Page 104 of 224
105 Table Percent of Subjects in Trial with Socioeconomic Outcomes of ADPKD Related Morbidity (Ordered by Decreasing Frequency for Placebo Group Healthcare Visits) Healthcare Visit (Office, ER, Hospital) Medical Procedure Lost Productivity Event Type (At any Visit) Tolvaptan Placebo Tolvaptan Placebo Tolvaptan Placebo Kidney pain Upper UTI Hypertension Hematuria Vascular/cardiac abnormalities* Nephrolithiasis Abdominal/inguinal hernia Anemia Other organ cysts* Renal function event (eg, dialysis) Hepatic cysts* Albuminuria Colonic diverticuli* ADPKD = autosomal dominant polycystic kidney disease; ER = emergency room; UTI = urinary tract infection. *Excluded in 9-item ADPKD Outcomes Composite Hospitalizations Due to PKD Outcomes FDA had also indicated that reductions in health care utilization, specifically hospitalizations, would lend support to a clinical benefit for an intervention. We therefore examined the frequency of these events in a post-hoc analysis using Fisher s Exact Test. The likelihood of being hospitalized for the 13-item PKD Outcomes was lower for tolvaptan treatment (odds ratio = 0.56, 95% CI 0.36 to 0.88, p = ). This appeared to be driven largely by tolvaptan s reduction in the odds of being hospitalized for renal pain (odds ratio = 0.23, 95% CI 0.09 to 0.54, p = ). These post-hoc results support the clinical importance of findings related to renal pain events and outcomes as collected by this trial. Tolvaptan has generated a clinically significant reduction in one of the more important early outcomes of ADPKD Correlation of Total Kidney Volume with Other Clinical Outcomes The tolvaptan clinical program s design is based on the hypothesis that renal cystogenesis is a proximate cause of most of the renal consequences of the disease. The relationship of cyst growth to renal function and other clinical complications (renal pain, hematuria, infection, hypertension and proteinuria) was described in a white paper published by Grantham, Chapman and Torres. 18 In addition to demonstrating the correlation between Page 105 of 224
106 total kidney volume and renal function in humans, this article also summarized then available evidence in more than a dozen animal models for interventions slowing both kidney growth and deterioration of kidney function. Included among those interventions effective in animal models were vasopressin antagonists. The earliest evidence for a clinical intervention favorably affecting both cystogenesis and renal function arose from tolvaptan s initial phase 2 trials. Subjects contributing to these early clinical pharmacology trials were offered participation in 3-year open-label extension trials in the USA ( ) and Japan ( ) conducted in parallel with the global pivotal trial. Historical control data for renal function (egfr) and/or TKV were available from two NIH studies, permitting a matched-control comparison between the effect of tolvaptan therapy and the disease s natural course. Tolvaptan subjects TKV changed an average of 1.7%/year compared with a 5.8%/year change for matched controls (p < 0.01). Tolvaptan subjects change in renal function, as assessed by egfr MDRD, was similarly reduced 0.7 versus 2.1 ml/min/1.73m 2 /year (p < 0.02). The results of this comparison are displayed graphically in Figure The correlation of change in annualized % change in TKV and change in egfr was observed (r = 0.21, p < 0.01). The natural tendency of most untreated subjects with ADPKD is rightward and downward progression. This trajectory was disrupted for both by tolvaptan therapy where subjects remained clustered nearer the intersection of lines indicating zero change. Page 106 of 224
107
108
109 Figure Worsening Renal Function Component Events by Height Adjusted Total Kidney Volume in Trial Correlation of renal pain events with the percent change in TKV and TKV slope showed that while the correlation with TKV slope was nominally statistically significant for the placebo group (p = ), the slope correlation within the tolvaptan group (p = ) was not. Neither correlation with TKV percent change (p = and ) was significant. For the placebo group, every 1% increase in TKV slope was associated with a further 4% increase in HR for renal pain events. The association between baseline height - adjusted TKV and renal pain events was less evident and seemed to follow more of a threshold pattern for the placebo group (Figure ). Page 109 of 224
110 Figure Renal Pain Component Events by Height Adjusted Total Kidney Volume in Trial These preliminary correlation analyses support a relationship between TKV and other ADPKD outcomes. Further, while the continued increase of TKV in subjects treated with placebo is more strongly correlated with progression of renal dysfunction and renal pain outcomes, this association is diminished in the group treated with tolvaptan. Such disassociation would be expected for an intervention having an effect on the progression of both outcomes. Tolvaptan's proposed mechanism of action involves slowed cyst cell proliferation and fluid secretion, which are directly linked to TKV growth, and local destruction of nephrons. Alternate mechanisms for improvement in renal function through other means could exist, but would not explain the correlations with cystogenesis and TKV Missing Data This section addresses the potential for missing data to influence the trial conclusions. In general, 2 types of statistical analyses were performed in Trial : 1) likelihood-based analyses such as slope analysis and MMRM analysis conducted for endpoints of TKV and renal function, and 2) analyses based on a semi-parametric approach such as (extended) Cox model for time to (multiple) event analysis for the key secondary composite endpoint and its components. Page 110 of 224
111 As likelihood-based analyses, slope analysis and MMRM analysis are still valid if the data are missing at random (MAR), ie, if missing data only depend on the previous observation. However, an assumption of MAR cannot be taken for granted, especially for the TKV variable, in which about 10% of subjects who did not have post-baseline TKV observations due to early discontinuation, and the renal function slope variable, in which there were a smaller number of subjects who discontinued before reaching the post-treatment baseline Week 3/EOT and hence excluded from the analysis. Since baseline characteristics were not included in the model of slope analysis for the TKV and renal function slope endpoints and it s well established that certain baseline ADPKD characteristics are predictive of more rapid disease progression, the impact of missing data deserved a further review. For the time to multiple event analyses, censoring a subject who dropped out of the trial provided a natural way to handle missing data. However, because of the difference in dropout rates (23.0% [221/961] in the tolvaptan group versus 13.8% [67/484] in the placebo group), missing data remained an issue. Because baseline-adjusted analyses are performed under the assumption of data MAR, sensitivity analyses under the assumption of data missing not at random (MNAR) were necessary and were additionally performed. Various analytical approaches to address the issue of data MNAR were employed in Trial These approaches comprised 1) responder analyses that classified withdrawn subjects as non-responders in the analysis, with response defined as at least a 20% improvement in rates of both TKV growth and renal function decline over the placebo response; 2) multiple imputation and placebo imputation of MMRM change from baseline analyses where placebo response and worse-than-placebo response were imputed for TKV and renal function slope missing data; 3) multiple imputation of time to event analyses where placebo response was imputed for missing data in the key secondary composite and its two positive components; 4) sensitivity analyses of the key secondary composite endpoint and its two positive components where events of AE withdrawal additionally contributed as events in the analysis; 5) renal pain event analyses that incorporated data, where possible, collected from subjects terminating trial medication early who were followed for PKD Outcomes; 6) in addition, baseline inference characteristics were evaluated in two approaches: Page 111 of 224
112 a. analyses adjusting for demographic and baseline characteristics as covariates in the model; and b. review of the baseline characteristics predictive of ADPKD disease progression for subjects completing the trial to infer how results may have been impacted for tolvaptan subjects withdrawing from the trial early. The results of these analyses are described in Section The most sensitive analysis accounting for data MNAR, the responder analysis (Section ), which treated withdrawn subjects as non-responders, demonstrated a near doubling of the responder rate in the tolvaptan group for subjects showing at least 20% improvement in both TKV growth and renal function decline slopes in comparison to the placebo response (31.4% tolvaptan, 18.6% placebo; odds ratio 2.006; 95% CI ; p < ). This effect size as well as statistical significance were maintained as progressively restrictive responder criteria were applied, ie, no events in the key secondary composite components of renal pain or worsening renal function added to the original responder definition (p < ), or no events in any of the 4 components of the key secondary composite added to the original responder definition (p = ). In a more stringent analysis that penalized as non-responders any withdrawn subjects in the tolvaptan group but not in the placebo group, results on tolvaptan remained statistically favorable (31.4% tolvaptan, 19.8% placebo; odds ratio 1.852; 95% CI ; p < ), including on application of the more restrictive responder definitions (no renal pain or worsening renal function events, p < ; or no events in the key secondary composite, p = ). Equally compelling results were achieved for analyses evaluating the effect of data MNAR through multiple (30x) imputation of placebo response and worse-than-placebo response (Section ). The analyses for TKV and renal function slope were significant, favoring tolvaptan and consistent with the prespecified primary analyses, at up to 210% and 150% of placebo risk, respectively. For the key secondary composite endpoint, significance was maintained at up to 110% of placebo risk, which includes up to 120% and 190% of placebo risk for the components of renal pain and worsening renal function, respectively. Taken together with the other analyses described in Section 10.5, these analyses strongly suggest that missing data, no matter under the assumption of MAR or in reasonable sensitivity scenarios under MNAR, do not affect the validity of the trial outcomes based on the original, prespecified endpoint analyses. Page 112 of 224
113 5.12 Dose-Response Relationship While the titration scheme employed in Trial precluded direct dose comparison, a nominal trend for slower TKV growth in the high dose group (60/30 mg) compared to the low dose group (45/15 mg) was observed over the ~3-year fixed-dose treatment period of supportive open-label Trial Population PK/PD analyses were performed to explore both modal dose-response and exposure-response analyses on four clinical endpoints and one PD endpoint assessed during the double-blinded treatment period in the pivotal trial; only subjects with estimated PK parameters and/or values for each endpoint being analyzed were included in the respective analyses. The clinical endpoints were: Change in total kidney volume (TKV); Time to multiple ADPKD clinical progression events defined as either severe renal pain or worsening of renal function (25% reduction in reciprocal serum creatinine value); The rate of egfr CKD-EPI change with time, also referred to as egfr slope ; The rate of log-transformed percentage TKV change with time, also referred to as TKV slope. The PD endpoint was: change in urine osmolality at trough Clinical Endpoints Tolvaptan treatment, but not tolvaptan dose, demonstrated a significant effect for all clinical endpoints: The mean ratio of TKV at Month 36 to the baseline was 1.18 for placebo, and 1.09, 1.07 and 1.09 for 45/15 mg, 60/30 mg, 90/30 mg split-dose regimens, respectively. The mean value of TKV slope, representing the rate of log-transformed percentage TKV change with time, in subjects treated with tolvaptan was year -1 versus a mean value of year -1 in placebo subject. The rate of decline in renal function, expressed using egfr CKD-EPI, in ADPKD subjects treated with tolvaptan was reduced to a mean value of 2.68 ml min -1 year -1 /1.73 m 2 from a mean value of 3.57 ml min -1 year -1 /1.73 m 2 in placebo subjects. Significant tolvaptan effect, a greater than 44% reduction in the Page 113 of 224
114 rate of egfr decline, was observed for subjects with egfr CKD-EPI less than 76.6 ml/min/1.73 m 2 at baseline. The percent of subjects with at least one ADPKD clinical progression event dropped from 25.1 in the placebo group to 10.5, 7.5, and 16.5 following 45/15 mg, 60/30 mg, and 90/30 mg treatment, respectively. In order to perform exposure response analysis, the population PK model was used to derive individual estimates of tolvaptan exposure (AUC ss [AUC 0-24h at steady state], C max, minimum concentration from 0 24h [C min,ss ]) based on the modal dose reported for each subject. Each of the parameters was highly correlated with the others so only correlations with AUC ss are presented below. Figure is a box plot of the calculated AUC ss values for each dose regimen; the width of the gray bars represents the relative number of subjects on each dose. This plot confirmed that subjects grouped by model dose had significant overlap in exposures. 90/30 mg 60/30 mg 45/15 mg Figure Tolvaptan AUC ( g/ml x h) Box plots of AUCss Values Estimated Using Population Pharmacokinetic Model for Subjects in Trial Gray boxes represent 25 th to 75 th percentile, error bars represent 10 th and 90 th percentiles, black dots represent 5 th and 95 th percentiles. Vertical line in gray box is median value. The width of the gray bars represents the relative number of subjects on each dose There was no clear exposure response for the clinical endpoints. Subjects in the highest tolvaptan exposure quartile often had the least response in the endpoint. As observed in the renal impairment trial and confirmed in the population PK analysis, lower GFR results in slower clearance of tolvaptan and produces higher plasma concentrations, thus Page 114 of 224
115 confounding exposure-efficacy response analysis. Upon review, it was confirmed that subjects with highest tolvaptan exposure had higher TKV and lower egfr values than subjects with lowest tolvaptan exposure Trough Urine Osmolality In Trial , tolvaptan treatment significantly reduced mean trough urine osmolality when compared with placebo, by about 250 mosm/kg at Week 3/EOT and by about 190 mosm/kg at Month 36. The decrease in urine osmolality in tolvaptan subjects at Month 36 indicates that no significant tolerance to tolvaptan inhibition develops even after 3 years of treatment. Significantly more tolvaptan subjects, 76% to 85%, had urine osmolality decreased to below 300 mosm/kg during the trial, compared with 22% to 24% of placebo subjects. There was a significant relationship between tolvaptan exposure and the pharmacodynamic endpoint of change in urine osmolality. A direct response model, Hill equation, best described the relationship. The maximum effect was estimated to be 70% reduction from baseline urine osmolality (-432 mosm/kg). The AUC ss value associated with a 50% reduction in urine osmolality was 4.50 μg/ml h, a value between the geometric mean AUC ss values for 45/15mg, 3.7 μg/ml h, and 60/30mg, 5.5 μg/ml h. The AUC ss geometric mean value at the 90/30mg split-dose regimen was 7.5 μg/ml h, corresponding to 88% of the maximum effect Suppression of Urine Osmolality and Change in Clinical Outcomes For placebo and tolvaptan subjects combined, a positive significant (p-value <0.001) correlation between TKV slope and change in urine osmolality was observed, with a regression coefficient of year -1 mosm -1 kg, suggesting that reduction in urine osmolality translates into slower growth in TKV. In an analysis of only placebo subjects, lower urine osmolality was associated with a slower rate of kidney growth. In an analysis of tolvaptan-treated subjects, subjects with the greatest mean changes from baseline in urine osmolality ( 252 to 300 mosm/kg) were more likely to achieve a complete response, meaning no change in TKV or renal function. Similar analyses using urine specific gravity, another indirect measure of urine concentrating ability, yielded similar results. Time to multiple ADPKD clinical progression events (composite component endpoints of renal pain and worsening renal function) was investigated as a function of change in urine osmolality. The percentage of subjects with at least one event is presented in Table Page 115 of 224
116 , by quartiles of urine osmolality change at the corresponding time of the event. Figure presents a Kaplan-Meier plot of time to multiple ADPKD clinical progression events by quartiles of change in urine osmolality at the corresponding time of the event. Table Percentage of Subjects in Trial with at Least One ADPKD Clinical Progression Event by Quartiles of Change from Baseline in Urine Osmolality Quartile of change from baseline in urine osmolality (mosm/kg) Subjects with at least one ADPKD clinical progression event (%) [-1119, -300] 12.1 (-300, -105] 19.5 (-105, 0] 19.2 (0, 548] 23.3 Figure Kaplan-Meier Plot of Time to Multiple ADPKD Clinical Progression Events in Trial by Quartiles of Change in Urine Osmolality at the Corresponding Time of the Event In descending order at 1092 days, grey, orange, blue and green dots and lines represent increasing quartiles of change in urine osmolality: [-1190;-300], (-300;-105], (-105;0], (0;548] mosm/kg. These data suggest greater efficacy is achieved when urine osmolality is reduced by 250 to 300 mosm/kg, regardless of baseline. On the basis of the Hill equation, only half of the subjects receiving the 45/15 mg split-dose regimen were receiving an optimal dose, as Page 116 of 224
117 defined by suppression of urine osmolality. In contrast, the majority of subjects receiving the 90/30 mg split-dose regimen were receiving an optimal dose. It is considered likely that monitoring urine osmolality (or urine specific gravity, which is highly correlated with urine osmolality and a measure easily performed in a clinician s office or patient s home) could provide guidance to physicians and their patients during tolvaptan titration and maintenance. Lesser degrees of suppression may also be beneficial, but less optimal Dosing Recommendations The initial dosage of tolvaptan in the pivotal trial was 60 mg per day as a split-dose regimen of 45/15 mg (45 mg taken on waking and 15 mg taken 8 hours later). The initial dose should be titrated upward to a split-dose regimen of 90 mg (60/30 mg) then to a target split-dose regimen of 120 mg (90/30 mg) if tolerated with at least weekly intervals between titrations. Patients may down titrate to lower doses based on tolerability. Patients should be maintained on the highest tolerated dose. Tolvaptan may be taken with or without meals. The aim of dose escalation is to block the activity of AVP at the renal V 2 receptor as completely and constantly as possible while maintaining adequate fluid balance. Urine osmolality measurement can be used to monitor the adequacy of AVP inhibition at a given dose. While the minimal dose required to produce an effective response can be determined by a reduction in urine osmolality below a set threshold, it is not clear at this time to what degree further reductions in urine osmolality will translate into additional clinical benefits. Dose reduction of tolvaptan is recommended for patients prescribed strong CYP 3A inhibitors. The split-dose regimen of 90/30 mg should be adjusted to 30 mg once daily upon waking, and the split-dose regimen of 45/15 mg should be adjusted to 15 mg once daily upon waking. There is no clinically significant effect of age, gender or race on tolvaptan exposure. The effect of heart failure or severe hepatic impairment on tolvaptan exposure in ADPKD patients has not been studied but would be expected to increase tolvaptan concentrations. If a patient misses a dose of tolvaptan, the patient should take their next dose at its scheduled time and prescribed dose level Effect of Duration of Dosing Physiological changes due to inhibition of AVP at the V 2 receptor (ie, increased urine volume, decreased urine osmolality) can be detected within 2 hours following a single oral administration of tolvaptan. Increases in serum creatinine, reflective of a decrease in Page 117 of 224
118 GFR, are measurable by 6 hours postdose. The continued suppression of trough urine osmolality at Month 36 in Trial indicates that tolvaptan is still efficacious in inhibiting AVP at the V 2 receptor after 3 years of treatment. Also, after 3 years of treatment the inhibition of V 2 receptors is reversible, as demonstrated by the return of trough urine osmolality to baseline levels and a mean decrease of 0.05 mg/dl in serum creatinine concentrations within 14 days of treatment withdrawal (Follow-up Visit 2). A reduction in mean TKV was observed as early as 8 and 21 days after start of tolvaptan treatment (Section ). In the open-label treatment Trial , when using an MMRM analysis, the mean change (SD) from baseline in TKV after 2 months of dosing was 0.96% (5.17%) for the tolvaptan 45/15 mg group and 1.26% (5.31%) for the tolvaptan 60/30 mg group, and the reduction persisted for the first year of treatment in the 45/15 mg group (Table ). From 12 months to 36 months of treatment, TKV increased, with the higher dose group (60/30 mg) showing smaller percent increases from baseline compared to the lower dose group (45/15 mg). Table MMRM Analysis of Percent Change from Baseline in Total Kidney Volume in Trial All Subjects - Intent to Treat Visit Tolvaptan Kidney Volume a Percent Change Treatment 95% CI P-value Treatment (ml) from Baseline Group N Mean (SD) N Mean (SD) Effect b Baseline mg (730) mg (1012) Month mg (713) (5.17) [-4.67, mg (1030) (5.31) 4.05] Month mg (765) (6.04) 2.41 [-2.19, mg (1036) (6.62) 7.00] Month mg (859) (8.43) [-7.44, mg (1078) (8.86) 1.85] Month mg (947) (11.81) [-9.26, mg (1132) (9.77) 0.11] CI = confidence interval; SD = standard deviation. a MRI data obtained from Early Term were mapped to visits of Month 12, Month 24 and Month 36 based on 6-month visit windows. b Derived from MMRM with factors of treatment, visit, treatment visit interaction, and covariate baseline. Inference statistics were derived from contrasts from each visit. The pattern of increase in TKV shown in the table above was also observed in tolvaptan subjects treated for 3 years in Trial (Figure ). Page 118 of 224
119
120 Over the course of 3 years, the pivotal Trial has shown that tolvaptan not only measurably slows TKV growth but also decreases the rate of renal function decline and improves related clinical symptoms that are markers of ADPKD disease progression. Tolvaptan s effects on secretion and cystogenesis appeared to translate into an almost immediate benefit for reduced rate of renal pain (36%). Within 16 months of starting treatment, a reduced rate of worsening renal function events (61%) was also observed. Benefit was also observed in reduced rates of UTI and hematuria for subjects on tolvaptan treatment. While the results from Trial cannot be definitively extrapolated beyond 3 years, the observed effect of tolvaptan on urine osmolality and kidney volume even at 3 years makes it reasonable to expect continued reductions in TKV slope and egfr slope with continued treatment Efficacy in Subgroups Data on the first 3 endpoints of pivotal Trial were analyzed by subgroups based on demographic characteristics, disease stage, comorbidities, or concomitant therapy to evaluate the effect of tolvaptan across the trial population. Characteristics like TKV, egfr, hypertension, gender and albuminuria were selected because of their prognostic value for progression of ADPKD renal disease. 59 It should be noted that tolvaptan was studied primarily in subjects with ADPKD whose renal function was preserved (ie, CKD Stages 1 to 3). The subject population was enriched on the basis of TKV 750 ml, a larger cyst burden being a predictor for more rapid progression. As shown in the figures that follow, consistent results of subgroup analyses across the first 3 trial endpoints, TKV rate of change (Figure ), key secondary composite (Figure ), and renal function rate of change (Figure ), support broad applicability of the efficacy results to patients with ADPKD. Tolvaptan efficacy was nominally consistent, with either a statistically significant difference or a favorable trend in all subgroups evaluated. Page 120 of 224
121 Figure Subgroup Analyses of TKV Annualized Rate of Growth (%/year) and 95% Confidence Intervals in Trial CrCl = creatinine clearance; ITT = intent-to-treat; ROW = rest of world; TKV = total kidney volume. Note: Estimated slope is represented as a percentage of change over 1 year. Page 121 of 224
122

123
Cost-effectiveness of tolvaptan (Jinarc ) for the treatment of autosomal dominant polycystic kidney disease (ADPKD)
 for the treatment of autosomal dominant polycystic kidney disease (ADPKD)") Cost-effectiveness of tolvaptan (Jinarc ) for the treatment of autosomal dominant polycystic kidney disease (ADPKD) The NCPE has issued a recommendation regarding the cost-effectiveness of tolvaptan (Jinarc
Cost-effectiveness of tolvaptan (Jinarc ) for the treatment of autosomal dominant polycystic kidney disease (ADPKD) The NCPE has issued a recommendation regarding the cost-effectiveness of tolvaptan (Jinarc
Tolvaptan: Slowing Progression of Autosomal Dominant Polycystic Kidney Disease (ADPKD)
") Tolvaptan: Slowing Progression of Autosomal Dominant Polycystic Kidney Disease (ADPKD) Cardiovascular and Renal Drugs Advisory Committee August 5, 2013 Introduction Robert McQuade, PhD Executive Vice President
Tolvaptan: Slowing Progression of Autosomal Dominant Polycystic Kidney Disease (ADPKD) Cardiovascular and Renal Drugs Advisory Committee August 5, 2013 Introduction Robert McQuade, PhD Executive Vice President
Technology appraisal guidance Published: 28 October 2015 nice.org.uk/guidance/ta358
 Tolvaptan for treating autosomal dominant polycystic kidney disease Technology appraisal guidance Published: 28 October 2015 nice.org.uk/guidance/ta358 NICE 2017. All rights reserved. Subject to Notice
Tolvaptan for treating autosomal dominant polycystic kidney disease
 in collaboration with: ERRATUM TO Tolvaptan for treating autosomal dominant polycystic kidney disease 1. The word ********* has been marked as commercial in confidence. a. Section 1.4 (page 13): Hence,
Protocol. This trial protocol has been provided by the authors to give readers additional information about their work.
 Protocol This trial protocol has been provided by the authors to give readers additional information about their work. Protocol for: Torres VE, Chapman AB, Devuyst O, et al. Tolvaptan in later-stage autosomal
Autosomal Dominant Polycystic Kidney Disease. Dr. Sameena Iqbal Nephrologist CIUSSS West Island
 Autosomal Dominant Polycystic Kidney Disease Dr. Sameena Iqbal Nephrologist CIUSSS West Island Disclosure Honorarium for Consulting on the Reprise trial from Otsuka Mayo clinic preceptorship for PKD with
tolvaptan 15mg, 30mg, 45mg, 60mg and 90mg tablets (Jinarc ) Otsuka Pharmaceuticals (UK) Ltd SMC No. (1114/15)
 Otsuka Pharmaceuticals (UK) Ltd SMC No. (1114/15)") tolvaptan 15mg, 30mg, 45mg, 60mg and 90mg tablets (Jinarc ) Otsuka Pharmaceuticals (UK) Ltd SMC No. (1114/15) 04 December 2015 The Scottish Medicines Consortium (SMC) has completed its assessment of the
tolvaptan 15mg, 30mg, 45mg, 60mg and 90mg tablets (Jinarc ) Otsuka Pharmaceuticals (UK) Ltd SMC No. (1114/15) 04 December 2015 The Scottish Medicines Consortium (SMC) has completed its assessment of the
SUISSE ADPKD Cohort Treatment and Outcomes with Tolvaptan, first in class Vasopressin V2 Antagonist. Hirslanden, 22 March 2018 Stefan Russmann
 SUISSE ADPKD Cohort Treatment and Outcomes with Tolvaptan, first in class Vasopressin V2 Antagonist Hirslanden, 22 March 2018 Stefan Russmann 4 th of July 2004 Database development with outcomes and safety
Briefing Document. FDA Pulmonary - Allergy Drugs Advisory Committee
 FDA Advisory Committee Briefing Materials Page 1 of 157 Briefing Document FDA Pulmonary - Allergy Drugs Advisory Committee Ivacaftor for the Treatment of Cystic Fibrosis in Patients Age 6 Years and Older
PRODUCT MONOGRAPH JINARC. (tolvaptan) Tablets, 15 mg, 30 mg, 45 mg, 60 mg and 90 mg. Vasopressin V2-receptor Antagonist
 Tablets, 15 mg, 30 mg, 45 mg, 60 mg and 90 mg. Vasopressin V2-receptor Antagonist") PRODUCT MONOGRAPH Pr JINARC (tolvaptan) Tablets, 15 mg, 30 mg, 45 mg, 60 mg and 90 mg Vasopressin V2-receptor Antagonist Otsuka Pharmaceutical Co., Ltd. Tokyo, Japan 101-8535 Imported and distributed by
PRODUCT MONOGRAPH Pr JINARC (tolvaptan) Tablets, 15 mg, 30 mg, 45 mg, 60 mg and 90 mg Vasopressin V2-receptor Antagonist Otsuka Pharmaceutical Co., Ltd. Tokyo, Japan 101-8535 Imported and distributed by
PRODUCT MONOGRAPH. (tolvaptan) Tablets, 15 mg, 30 mg, 45 mg, 60 mg and 90 mg. Vasopressin V 2 -receptor Antagonist
 Tablets, 15 mg, 30 mg, 45 mg, 60 mg and 90 mg. Vasopressin V 2 -receptor Antagonist") PRODUCT MONOGRAPH Pr JINARC (tolvaptan) Tablets, 15 mg, 30 mg, 45 mg, 60 mg and 90 mg Vasopressin V 2 -receptor Antagonist Otsuka Pharmaceutical Co., Ltd. Tokyo, Japan 101-8535 Date of Preparation: February
PRODUCT MONOGRAPH Pr JINARC (tolvaptan) Tablets, 15 mg, 30 mg, 45 mg, 60 mg and 90 mg Vasopressin V 2 -receptor Antagonist Otsuka Pharmaceutical Co., Ltd. Tokyo, Japan 101-8535 Date of Preparation: February
Report on the Deliberation Results
 Report on the Deliberation Results March 3, 2014 Evaluation and Licensing Division, Pharmaceutical and Food Safety Bureau Ministry of Health, Labour and Welfare [Brand name] (a) Samsca Tablets 7.5 mg (b)
MANAGEMENT CALL TO DISCUSS LONGER-TERM IMPROVEMENTS IN KIDNEY FUNCTION WITH BARDOXOLONE
 MANAGEMENT CALL TO DISCUSS LONGER-TERM IMPROVEMENTS IN KIDNEY FUNCTION WITH BARDOXOLONE Introduction Substantial body of prior CKD clinical data characterizes Bard s unique profile Bard has demonstrated
Samsca. Samsca (tolvaptan) Description
 Description") Subject: Samsca Page: 1 of 5 Federal Employee Program 1310 G Street, N.W. Washington, D.C. 20005 202.942.1000 Fax 202.942.1125 Last Review Date: September 20, 2018 Samsca Description Samsca (tolvaptan)
Subject: Samsca Page: 1 of 5 Federal Employee Program 1310 G Street, N.W. Washington, D.C. 20005 202.942.1000 Fax 202.942.1125 Last Review Date: September 20, 2018 Samsca Description Samsca (tolvaptan)
Shuma Hirashio 1,2, Shigehiro Doi 1 and Takao Masaki 1*
 Hirashio et al. Renal Replacement Therapy (2018) 4:24 https://doi.org/10.1186/s41100-018-0164-9 CASE REPORT Open Access Magnetic resonance imaging is effective for evaluating the therapeutic effect of
This was a randomized, double-blind, placebo-controlled, fixed-dose, parallel-group study.
 The study listed may include approved and non-approved uses, formulations or treatment regimens. The results reported in any single study may not reflect the overall results obtained on studies of a product.
microrna Therapeutics Harnessing the power of micrornas to target multiple pathways of disease
 microrna Therapeutics Harnessing the power of micrornas to target multiple pathways of disease January 2018 Safe Harbor Statement Statements contained in this presentation regarding matters that are not
Nephrology Grand Rounds. Vasishta Tatapudi, MD January 24 th, 2013
 Nephrology Grand Rounds Vasishta Tatapudi, MD January 24 th, 2013 Case Summary Chief complaint: A twenty-six year old African American female veteran presented to ER with left flank pain for two days.
3 generations of ADPKD. 1 long-awaited treatment.
 3 generations of ADPKD. 1 long-awaited treatment. HOPE is finally here now that treatment is available for people with autosomal dominant polycystic kidney disease (ADPKD). JYNARQUE is proven to slow kidney
Rimegepant Pivotal Phase 3 Trial Results - Conference Call March 26, Biohaven
 Rimegepant Pivotal Phase 3 Trial Results - Conference Call March 26, 2018 1 Forward-Looking Statement This presentation contains forward-looking statements, including: statements about our plans to develop
INDICATIONS AND USAGE JYNARQUE is a selective vasopressin V 2
 HIGHLIGHTS OF PRESCRIBING INFORMATION These highlights do not include all the information needed to use JYNARQUE safely and effectively. See full prescribing information for JYNARQUE. tablets for oral
February 20, 2019 MANAGEMENT CALL TO DISCUSS PHASE 2 PHOENIX RESULTS AND CKD PROGRAM UPDATES
 February 20, 209 MANAGEMENT CALL TO DISCUSS PHASE 2 PHOENIX RESULTS AND CKD PROGRAM UPDATES Forward-Looking Statements This presentation contains certain forward-looking statements that are made pursuant
JYNARQUE REMS (RISK EVALUATION AND MITIGATION STRATEGY) PATIENT GUIDE
 PATIENT GUIDE") JYNARQUE REMS (RISK EVALUATION AND MITIGATION STRATEGY) PATIENT GUIDE Patients: Your healthcare provider will go over this patient guide with you. It is important to ask any questions you may have. Keep
JYNARQUE REMS (RISK EVALUATION AND MITIGATION STRATEGY) PATIENT GUIDE Patients: Your healthcare provider will go over this patient guide with you. It is important to ask any questions you may have. Keep
ANNEX I SUMMARY OF PRODUCT CHARACTERISTICS
 ANNEX I SUMMARY OF PRODUCT CHARACTERISTICS 1 This medicinal product is subject to additional monitoring. This will allow quick identification of new safety information. Healthcare professionals are asked
JINARC (tolvaptan) Healthcare professional educational guide
 Healthcare professional educational guide") JINARC (tolvaptan) Healthcare professional educational guide Contents Abbreviations 3 What is the purpose of this brochure? 4 What is JINARC? What is JINARC indicated for? When should treatment not be
JINARC (tolvaptan) Healthcare professional educational guide Contents Abbreviations 3 What is the purpose of this brochure? 4 What is JINARC? What is JINARC indicated for? When should treatment not be
SYNOPSIS. Publications No publications at the time of writing this report.
 Drug product: TOPROL-XL Drug substance(s): Metoprolol succinate Study code: D4020C00033 (307A) Date: 8 February 2006 SYNOPSIS Dose Ranging, Safety and Tolerability of TOPROL-XL (metoprolol succinate) Extended-release
Synopsis Style Clinical Study Report SAR ACT sarilumab Version number : 1 (electronic 1.0)
") SYNOPSIS Title of the study: A randomized, double-blind, parallel-group, placebo- and active calibrator-controlled study assessing the clinical benefit of SAR153191 subcutaneous (SC) on top of methotrexate
SYNOPSIS Title of the study: A randomized, double-blind, parallel-group, placebo- and active calibrator-controlled study assessing the clinical benefit of SAR153191 subcutaneous (SC) on top of methotrexate
The clinical trial information provided in this public disclosure synopsis is supplied for informational purposes only.
 The clinical trial information provided in this public disclosure synopsis is supplied for informational purposes only. Please note that the results reported in any single trial may not reflect the overall
Study Center(s): The study was conducted at 39 study sites in Japan.
: The study was conducted at 39 study sites in Japan.") SYNOPSIS Issue Date: 20 NOVEMBER 2012 Name of Sponsor/Company Janssen Pharmaceutical K. K. Name of Finished Product CONCERTA Name of Active Ingredient(s) Methylphenidate HCl Protocol No.: JNS001-JPN-A01
SYNOPSIS Issue Date: 20 NOVEMBER 2012 Name of Sponsor/Company Janssen Pharmaceutical K. K. Name of Finished Product CONCERTA Name of Active Ingredient(s) Methylphenidate HCl Protocol No.: JNS001-JPN-A01
The clinical trial information provided in this public disclosure synopsis is supplied for informational purposes only.
 The clinical trial information provided in this public disclosure synopsis is supplied for informational purposes only. Please note that the results reported in any single trial may not reflect the overall
Copyright information:
 Pharmacokinetics and Pharmacodynamics of Tolvaptan in Autosomal Dominant Polycystic Kidney Disease: Phase 2 Trials for Dose Selection in the Pivotal Phase 3 Trial. Susan E. Shoaf, Otsuka Pharmaceutical
Clinical Study Synopsis
 Clinical Study Synopsis This Clinical Study Synopsis is provided for patients and healthcare professionals to increase the transparency of Bayer's clinical research. This document is not intended to replace
PFIZER INC. THERAPEUTIC AREA AND FDA APPROVED INDICATIONS: See United States Package Insert (USPI)
") PFIZER INC. These results are supplied for informational purposes only. Prescribing decisions should be made based on the approved package insert. For publications based on this study, see associated bibliography.
PFIZER INC. These results are supplied for informational purposes only. Prescribing decisions should be made based on the approved package insert. For publications based on this study, see associated bibliography.
Summary ID#7029. Clinical Study Summary: Study F1D-MC-HGKQ
 CT Registry ID# 7029 Page 1 Summary ID#7029 Clinical Study Summary: Study F1D-MC-HGKQ Clinical Study Report: Versus Divalproex and Placebo in the Treatment of Mild to Moderate Mania Associated with Bipolar
SYNOPSIS. Clinical Study Report IM Double-blind Period
 Name of Sponsor/Company: Bristol-Myers Squibb Name of Finished Product: Abatacept () Name of Active Ingredient: Abatacept () Individual Study Table Referring to the Dossier SYNOPSIS (For National Authority
Individual Study Table Referring to Part of Dossier: Volume: Page:
 Synopsis Abbott Laboratories Name of Study Drug: Paricalcitol Capsules (ABT-358) (Zemplar ) Name of Active Ingredient: Paricalcitol Individual Study Table Referring to Part of Dossier: Volume: Page: (For
Bardoxolone Methyl Prevents egfr Decline in Patients with Chronic Kidney Disease Stage 4 and Type 2 Diabetes Post-hoc Analyses from BEACON
 Bardoxolone Methyl Prevents egfr Decline in Patients with Chronic Kidney Disease Stage 4 and Type 2 Diabetes Post-hoc Analyses from BEACON Christoph Wanner, MD; George Bakris, MD; Geoffrey A. Block, MD;
The clinical trial information provided in this public disclosure synopsis is supplied for informational purposes only.
 The clinical trial information provided in this public disclosure synopsis is supplied for informational purposes only. Please note that the results reported in any single trial may not reflect the overall
Annex IV Scientific conclusions
 Annex IV Scientific conclusions 56 Scientific conclusions On 7 June 2017, the European Commission (EC) was informed of a fatal case of fulminant liver failure in a patient treated with daclizumab in an
Advancing Innovative Therapies for Neurological Diseases
 Advancing Innovative Therapies for Neurological Diseases Phase 3 Topline Rimegepant 75 mg Zydis ODT December 03, 2018 NYSE: BHVN 2018 Biohaven Pharmaceuticals. All rights reserved. Disclaimer This presentation
Outline. Outline CHRONIC KIDNEY DISEASE UPDATE: WHAT THE GENERALIST NEEDS TO KNOW 7/23/2013. Question 1: Which of these patients has CKD?
 CHRONIC KIDNEY DISEASE UPDATE: WHAT THE GENERALIST NEEDS TO KNOW MICHAEL G. SHLIPAK, MD, MPH CHIEF-GENERAL INTERNAL MEDICINE, SAN FRANCISCO VA MEDICAL CENTER PROFESSOR OF MEDICINE, EPIDEMIOLOGY AND BIOSTATISTICS,
Mipomersen (ISIS ) Page 2 of 1979 Clinical Study Report ISIS CS3
 Page 2 of 1979 Clinical Study Report ISIS CS3") (ISIS 301012) Page 2 of 1979 2 SYNOPSIS ISIS 301012-CS3 synopsis Page 1 Title of Study: A Phase 2, Randomized, Double-Blind, Placebo-Controlled Study to Assess the Safety, Tolerability, Pharmacokinetics,
(ISIS 301012) Page 2 of 1979 2 SYNOPSIS ISIS 301012-CS3 synopsis Page 1 Title of Study: A Phase 2, Randomized, Double-Blind, Placebo-Controlled Study to Assess the Safety, Tolerability, Pharmacokinetics,
Clinical Study Synopsis
 Clinical Study Synopsis This Clinical Study Synopsis is provided for patients and healthcare professionals to increase the transparency of Bayer's clinical research. This document is not intended to replace
Clinical Study Synopsis
 Clinical Study Synopsis This Clinical Study Synopsis is provided for patients and healthcare professionals to increase the transparency of Bayer's clinical research. This document is not intended to replace
This clinical study synopsis is provided in line with Boehringer Ingelheim s Policy on Transparency and Publication of Clinical Study Data.
 abcd Clinical Study Synopsis for Public Disclosure This clinical study synopsis is provided in line with s Policy on Transparency and Publication of Clinical Study Data. The synopsis which is part of the
ANNEX I SUMMARY OF PRODUCT CHARACTERISTICS
 ANNEX I SUMMARY OF PRODUCT CHARACTERISTICS 1 This medicinal product is subject to additional monitoring. This will allow quick identification of new safety information. Healthcare professionals are asked
Objectives. Pre-dialysis CKD: The Problem. Pre-dialysis CKD: The Problem. Objectives
 The Role of the Primary Physician and the Nephrologist in the Management of Chronic Kidney Disease () By Brian Young, M.D. Assistant Clinical Professor of Medicine David Geffen School of Medicine at UCLA
Lesinurad in Combination With a Xanthine Oxidase Inhibitor for Treatment of Hyperuricemia Associated With Gout
 Lesinurad in Combination With a Xanthine Oxidase Inhibitor for Treatment of Hyperuricemia Associated With Gout Briefing Document for the Arthritis Advisory Committee Meeting Date: 23 October 215 Ardea
PFIZER INC. These results are supplied for informational purposes only. Prescribing decisions should be made based on the approved package insert.
 PFIZER INC. These results are supplied for informational purposes only. Prescribing decisions should be made based on the approved package insert. PROPRIETARY DRUG NAME / GENERIC DRUG NAME: Advil / Ibuprofen
Product: Omecamtiv Mecarbil Clinical Study Report: Date: 02 April 2014 Page 1
 Date: 02 April 2014 Page 1. 2. SYNOPSIS Name of Sponsor: Amgen Inc. Name of Finished Product: Omecamtiv mecarbil injection Name of Active Ingredient: Omecamtiv mecarbil (AMG 423) Title of Study: A double-blind,
Nocdurna (desmopressin acetate) NEW PRODUCT SLIDESHOW
 NEW PRODUCT SLIDESHOW") Nocdurna (desmopressin acetate) NEW PRODUCT SLIDESHOW Introduction Brand name: Nocdurna Generic name: Desmopressin acetate Pharmacological class: Vasopressin (synthetic) Strength and Formulation: 27.7mcg,
Nocdurna (desmopressin acetate) NEW PRODUCT SLIDESHOW Introduction Brand name: Nocdurna Generic name: Desmopressin acetate Pharmacological class: Vasopressin (synthetic) Strength and Formulation: 27.7mcg,
Sponsor / Company: Sanofi Drug substance(s): Docetaxel (Taxotere )
: Docetaxel (Taxotere )") These results are supplied for informational purposes only. Prescribing decisions should be made based on the approved package insert in the country of prescription. Sponsor / Company: Sanofi Drug substance(s):
These results are supplied for informational purposes only. Prescribing decisions should be made based on the approved package insert in the country of prescription. Sponsor / Company: Sanofi Drug substance(s):
Clinical Experience with Tolvaptan. Prof. Dr. med. O. Devuyst
 Clinical Experience with Tolvaptan Prof. Dr. med. O. Devuyst 1 Outline 1. ADPKD generalities and tolvaptan in ADPKD 2. Who to treat with tolvaptan? How to start? 3. Clinical experience with tolvaptan in
Sponsor Novartis. Generic Drug Name Vildagliptin/Metformin. Therapeutic Area of Trial Type 2 diabetes. Approved Indication Type 2 diabetes
 Clinical Trial Results Database Page 1 Sponsor Novartis Generic Drug Name Vildagliptin/Metformin Therapeutic Area of Trial Type 2 diabetes Approved Indication Type 2 diabetes Study Number CLMF237A2309
PRIMARY PHASE 2 ANALYSES FROM CARDINAL: A PHASE 2/3 STUDY OF BARDOXOLONE METHYL IN PATIENTS WITH ALPORT SYNDROME
 PRIMARY PHASE 2 ANALYSES FROM CARDINAL: A PHASE 2/3 STUDY OF BARDOXOLONE METHYL IN PATIENTS WITH ALPORT SYNDROME 217 American Society of Nephrology Meeting Geoffrey A. Block 1, Pablo E. Pergola 2, Lesley
Review of Tolvaptan s Pharmacokinetic and Pharmacodynamic Properties and Drug Interactions
 J. Clin. Med. 2014, 3, 1276-1290; doi:10.3390/jcm3041276 Review OPEN ACCESS Journal of Clinical Medicine ISSN 2077-0383 www.mdpi.com/journal/jcm Review of Tolvaptan s Pharmacokinetic and Pharmacodynamic
Summary ID# Clinical Study Summary: Study B4Z-JE-LYBC
 CT Registry ID# 5285 Page 1 Summary ID# 5285 Clinical Study Summary: Study B4Z-JE-LYBC A Randomized, Double-Blind, Placebo-Controlled Efficacy and Safety Comparison of Fixed-Dose Ranges of Hydrochloride
Each tablet contains:
 Composition: Each tablet contains: Tolvaptan 15/30mg Pharmacokinetic properties: In healthy subjects the pharmacokinetics of tolvaptan after single doses of up to 480 mg and multiple doses up to 300 mg
PFIZER INC. THERAPEUTIC AREA AND FDA APPROVED INDICATIONS: See USPI
 PFIZER INC. These results are supplied for informational purposes only. Prescribing decisions should be made based on the approved package insert. For publications based on this study, see associated bibliography.
Chapter 2: Identification and Care of Patients With Chronic Kidney Disease
 Chapter 2: Identification and Care of Patients With Chronic Kidney Disease Introduction The examination of care in patients with chronic kidney disease (CKD) is a significant challenge, as most large datasets
BRL /RSD-101C0D/1/CPMS-704. Report Synopsis
 Report Synopsis Study Title: A Randomized, Multicenter, 10-Week, Double-Blind, Placebo- Controlled, Flexible-Dose Study to Evaluate the Efficacy and Safety of Paroxetine in Children and Adolescents with
Treatment A Placebo to match COREG CR 20 mg OD + Lisinopril 10 mg OD (Days 1-7) Placebo to match COREG CR 40 mg OD + Lisinopril 10 mg OD (Days 8-14)
 Placebo to match COREG CR 40 mg OD + Lisinopril 10 mg OD (Days 8-14)") The study listed may include approved and non-approved uses, formulations or treatment regimens. The results reported in any single study may not reflect the overall results obtained on studies of a product.
The study listed may include approved and non-approved uses, formulations or treatment regimens. The results reported in any single study may not reflect the overall results obtained on studies of a product.
Clinical Trial Synopsis TL-OPI-518, NCT#
 Clinical Trial Synopsis, NCT# 00225264 Title of Study: A Double-Blind, Randomized, Comparator-Controlled Study in Subjects With Type 2 Diabetes Mellitus Comparing the Effects of Pioglitazone HCl vs Glimepiride
Study Code: Date: 27 July 2007
 These results are supplied for informational purposes only. Prescribing decisions should be made based on the approved package insert in the country of prescription Sponsor/company: Generic drug name:
Study No.:MPX Title: Rationale: Phase: IIB Study Period: Study Design: Centres: Indication: Treatment: Objectives:
 The study listed may include approved and non-approved uses, formulations or treatment regimens. The results reported in any single study may not reflect the overall results obtained on studies of a product.
Clinical Study Synopsis for Public Disclosure
 abcd Clinical Study Synopsis for Public Disclosure This clinical study synopsis is provided in line with s Policy on Transparency and Publication of Clinical Study Data. The synopsis - which is part of
Tolvaptan in Patients with Autosomal Dominant Polycystic Kidney Disease
 T h e n e w e ngl a nd j o u r na l o f m e dic i n e original article in Patients with Autosomal Dominant Polycystic Kidney Disease Vicente E. Torres, M.D., Ph.D., Arlene B. Chapman, M.D., Olivier Devuyst,
GSK Medicine: Study Number: Title: Rationale: Phase: Study Period: Study Design: Centres: Indication: Treatment: Objectives:
 The study listed may include approved and non-approved uses, formulations or treatment regimens. The results reported in any single study may not reflect the overall results obtained on studies of a product.
2. SYNOPSIS. Clinical Study Report CD-LAQ-201. November 2012
 2. SYNOPSIS Protocol No.: Study Title A Phase IIA, Multicenter, Randomized, Double-Blind, Placebo-Controlled, Sequential Cohorts, Dose Range Finding Study to Evaluate the Safety, Tolerability and Clinical
Summary. 20 May 2014 EMA/CHMP/SAWP/298348/2014 Procedure No.: EMEA/H/SAB/037/1/Q/2013/SME Product Development Scientific Support Department
 20 May 2014 EMA/CHMP/SAWP/298348/2014 Procedure No.: EMEA/H/SAB/037/1/Q/2013/SME Product Development Scientific Support Department evaluating patients with Autosomal Dominant Polycystic Kidney Disease
BRL /RSD-101C0F/1/CPMS-716. Report Synopsis
 Report Synopsis Study Title: A Multicenter, Open-label, Six-Month Extension Study to Assess the Long-Term Safety of Paroxetine in Children and Adolescents with Major Depressive Disorder (MDD) or Obsessive-Compulsive
A Study To Evaluate The Efficacy Of Tolvaptan In Correction Of Hyponatremia And Its Effect On..
 IOSR Journal of Dental and Medical Sciences (IOSR-JDMS) e-issn: 2279-0853, p-issn: 2279-0861.Volume 17, Issue 5 Ver. 11 (May. 2018), PP 29-34 www.iosrjournals.org A Study To Evaluate The Efficacy Of Tolvaptan
Re-Purposing Drugs for the Treatment of Polycystic Kidney Disease:
 Re-Purposing Drugs for the Treatment of Polycystic Kidney Disease: Partnership with the Polycystic Kidney Disease Foundation PKD Models: pcy and jck Mice, PCK Rat PreClinOmics, Inc. 1 PKDF Goals The Accelerating
Outline. Outline CHRONIC KIDNEY DISEASE UPDATE: WHAT THE GENERALIST NEEDS TO KNOW. Question 1: Which of these patients has CKD?
 CHRONIC KIDNEY DISEASE UPDATE: WHAT THE GENERALIST NEEDS TO KNOW MICHAEL G. SHLIPAK, MD, MPH CHIEF-GENERAL INTERNAL MEDICINE, SAN FRANCISCO VA MEDICAL CENTER PROFESSOR OF MEDICINE, EPIDEMIOLOGY AND BIOSTATISTICS,
SYNOPSIS. Issue Date: 04 February 2009 Document No.: EDMS -USRA
 SYNOPSIS Issue Date: 04 February 2009 Document No.: EDMS -USRA-10751204 Name of Sponsor/Company Name of Finished Product Name of Active Ingredient(s) Johnson & Johnson Pharmaceutical Research & Development,
Bristol-Myers Squibb
 A Study of the Safety and Efficacy of plus Tenofovir in Adults with Chronic Hepatitis B Virus Infection with Previous Nucleoside/Nucleotide Treatment Failure () FINAL CLINICAL STUDY REPORT EUDRACT Number:
Sponsor / Company: Sanofi Drug substance(s): HOE901-U300 (insulin glargine) According to template: QSD VERSION N 4.0 (07-JUN-2012) Page 1
: HOE901-U300 (insulin glargine) According to template: QSD VERSION N 4.0 (07-JUN-2012) Page 1") These results are supplied for informational purposes only. Prescribing decisions should be made based on the approved package insert in the country of prescription. Sponsor / Company: Sanofi Drug substance(s):
These results are supplied for informational purposes only. Prescribing decisions should be made based on the approved package insert in the country of prescription. Sponsor / Company: Sanofi Drug substance(s):
Academic Insights for Biomarker Priorities and Candidate Pilot Project(s)
") Academic Panel Session Academic Insights for Biomarker Priorities and Candidate Pilot Project(s) Moderators: Dr. Chirag Parikh (Yale) Dr. Kumar Sharma (UCSD) Panelists: Dr. Ronald Perrone (Tufts Medical
Academic Panel Session Academic Insights for Biomarker Priorities and Candidate Pilot Project(s) Moderators: Dr. Chirag Parikh (Yale) Dr. Kumar Sharma (UCSD) Panelists: Dr. Ronald Perrone (Tufts Medical
Clinical Study Synopsis
 Clinical Study Synopsis This Clinical Study Synopsis is provided for patients and healthcare professionals to increase the transparency of Bayer's clinical research. This document is not intended to replace
Lilly Diabetes: Pipeline Update
 Lilly Diabetes: Pipeline Update June 16, 2014 Safe Harbor Provision This presentation contains forward-looking statements that are based on management's current expectations, but actual results may differ
SMC briefing note. The following medicines were accepted for use: Contact details. About SMC. Media contact. Number 98 January 2016
 Monthly briefings are produced in order to help members of the media and other interested people understand the work and advice of the Scottish Medicines Consortium. The detailed advice for each medicine
SYNOPSIS A two-stage randomized, open-label, parallel group, phase III, multicenter, 7-month study to assess the efficacy and safety of SYMBICORT
 Drug product: Drug substance(s): Edition No.: Study code: SYMBICORT pmdi 160/4.5 g Budesonide/formoterol D5896C00005 Date: 8 May 2006 SYNOPSIS A two-stage randomized, open-label, parallel group, phase
Prescriber and Pharmacy Guide for the Tracleer REMS Program
 Prescriber and Pharmacy Guide for the Tracleer REMS Program Please see accompanying full Prescribing Information, including BOXED WARNING for hepatotoxicity and teratogenicity. Introduction to Tracleer
Clinical Trial Study Synopsis
 Clinical Trial Study Synopsis This file is posted on the Bayer HealthCare Clinical Trials Registry and Results website and is provided for patients and healthcare professionals to increase the transparency
Sponsor / Company: Sanofi Drug substance(s): AMARYL M (1/250 mg) / HOE490
: AMARYL M (1/250 mg) / HOE490") These results are supplied for informational purposes only. Prescribing decisions should be made based on the approved package insert in the country of prescription. Sponsor / Company: Sanofi Drug substance(s):
These results are supplied for informational purposes only. Prescribing decisions should be made based on the approved package insert in the country of prescription. Sponsor / Company: Sanofi Drug substance(s):
New Treatments for ADPKD how close are we?
 New Treatments for ADPKD how close are we? Leicester General Hospital 28 Jan 2012 Professor Albert Ong a.ong@sheffield.ac.uk The cystic degeneration of the kidneys, once it reaches the point where it can
New Evidence reports on presentations given at EULAR Safety and Efficacy of Tocilizumab as Monotherapy and in Combination with Methotrexate
 New Evidence reports on presentations given at EULAR 2009 Safety and Efficacy of Tocilizumab as Monotherapy and in Combination with Methotrexate Report on EULAR 2009 presentations Tocilizumab inhibits
Protocol. This trial protocol has been provided by the authors to give readers additional information about their work.
 Protocol This trial protocol has been provided by the authors to give readers additional information about their work. Protocol for: Torres VE, Chapman AB, Devuyst O, et al. Tolvaptan in patients with
Clinical Study Synopsis
 Clinical Study Synopsis This Clinical Study Synopsis is provided for patients and healthcare professionals to increase the transparency of Bayer's clinical research. This document is not intended to replace
REATA PHARMACEUTICALS, INC. ANNOUNCES SECOND QUARTER 2018 FINANCIAL RESULTS AND AN UPDATE ON DEVELOPMENT PROGRAMS
 REATA PHARMACEUTICALS, INC. ANNOUNCES SECOND QUARTER 2018 FINANCIAL RESULTS AND AN UPDATE ON DEVELOPMENT PROGRAMS IRVING, Texas August 8, 2018 Reata Pharmaceuticals, Inc. (Nasdaq: RETA), a clinical-stage
Tolvaptan bei ADPKD: Kritische Beurteilung der Studien
 Tolvaptan bei ADPKD: Kritische Beurteilung der Studien Johannes Mann & Stewart Lambie * KfH Nierenzentrum München Schwabing, Klinik für Nieren- & Hochdruckkrankheiten, Friedrich Alexander Univ. Erlangen-Nürnberg
Clinical Study Report AI Final 28 Feb Volume: Page:
 Study Design, Continued Electrocardiogram (ECG) and vital sign assessments were done at select times during the study. Blood and urine samples for clinical laboratory evaluations were collected at specified
The Cardiorenal Syndrome in Heart Failure
 The Cardiorenal Syndrome in Heart Failure Van N Selby, MD Assistant Professor of Medicine Advanced Heart Failure Program, UCSF October 9, 2015 Disclosures None 1 Cardiorenal Syndrome (CRS) A pathophysiologic
GSK Medicine: Study Number: Title: Rationale: Phase: Study Period: Study Design: Centres: Indication: Treatment:
 The study listed may include approved and non-approved uses, formulations or treatment regimens. The results reported in any single study may not reflect the overall results obtained on studies of a product.
SAMSCA (tolvaptan) oral tablet
 oral tablet") SAMSCA (tolvaptan) oral tablet Coverage for services, procedures, medical devices and drugs are dependent upon benefit eligibility as outlined in the member's specific benefit plan. This Pharmacy Coverage
SAMSCA (tolvaptan) oral tablet Coverage for services, procedures, medical devices and drugs are dependent upon benefit eligibility as outlined in the member's specific benefit plan. This Pharmacy Coverage
ClinialTrials.gov Identifier: Sponsor/company: sanofi-aventis
 These results are supplied for informational purposes only. Prescribing decisions should be made based on the approved package insert in the country of prescription Sponsor/company: sanofi-aventis ClinialTrials.gov
Supplementary Appendix
 Supplementary Appendix This appendix has been provided by the authors to give readers additional information about their work. Supplement to: Wanner C, Inzucchi SE, Lachin JM, et al. Empagliflozin and
Study No.: Title: Rationale: Phase: Study Period: Study Design: Centers: Indication: Treatment: Objectives: Primary Outcome/Efficacy Variable:
 The study listed may include approved and non-approved uses, formulations or treatment regimens. The results reported in any single study may not reflect the overall results obtained on studies of a product.
The clinical trial information provided in this public disclosure synopsis is supplied for informational purposes only.
 The clinical trial information provided in this public disclosure synopsis is supplied for informational purposes only. Please note that the results reported in any single trial may not reflect the overall
Final Clinical Study Report. to the Dossier SYNOPSIS. Final Clinical Study Report for Study AI463110
 BMS-475 AI463 Name of Sponsor/Company: Bristol-Myers Squibb Individual Study Table Referring to the Dossier For National Authority Use Only) Name of Finished Product: Baraclude Name of Active Ingredient: