SHASHIKANT S. UDIKERI DEPARTMENT OF AGRICULTURAL ENTOMOLOGY COLLEGE OF AGRICULTURE, DHARWAD UNIVERSITY OF AGRICULTURAL SCIENCES, DHARWAD
|
|
|
- Sharon Marshall
- 5 years ago
- Views:
Transcription
1 EVALUATION OF NEW GENERATION Bt GENOTYPES, SUSTAINABILITY OF Cry PROTEIN EXPRESSION, COMPUTATION OF ETL, EFFECT ON APHID PREDATORS AND DEVELOPMENT OF IPM MODULE FOR Bt COTTON UNDER RAINFED CONDITIONS SHASHIKANT S. UDIKERI DEPARTMENT OF AGRICULTURAL ENTOMOLOGY COLLEGE OF AGRICULTURE, DHARWAD UNIVERSITY OF AGRICULTURAL SCIENCES, DHARWAD JULY, 2006
2 EVALUATION OF NEW GENERATION Bt GENOTYPES, SUSTAINABILITY OF Cry PROTEIN EXPRESSION, COMPUTATION OF ETL, EFFECT ON APHID PREDATORS AND DEVELOPMENT OF IPM MODULE FOR Bt COTTON UNDER RAINFED CONDITIONS Thesis submitted to the University of Agricultural Sciences, Dharwad In partial fulfillment of the requirement for the Degree of DOCTOR OF PHILOSOPHY In AGRICULTURAL ENTOMOLOGY By SHASHIKANT S. UDIKERI DEPARTMENT OF AGRICULTURAL ENTOMOLOGY COLLEGE OF AGRICULTURE, DHARWAD UNIVERSITY OF AGRICULTURAL SCIENCES, DHARWAD JULY, 2006
3 ADVISOR COMMITTEE (B.V.PATIL) MAJOR ADVISOR Approved by : Chairman : (B.V.PATIL) Members : 1 (K.A.KULKARNI) 2 (K. BASAVANA GOUD) 3 (B.M.KHADI) 4 (H.M.VAMADEVAIAH)
4 CONTENTS Chapter No. Title Page No. I INTRODUCTION II REVIEW OF LITERATURE III MATERIALS AND METHODS IV EXPERIMENTAL RESULTS V DISCUSSION VI SUMMARY VII REFERENCES APPENDICES
5 LIST OF TABLES Table No. Title 1. Details of Bt cotton genotypes evaluated for comparative performance 2. Treatment details for calculation of EIL in Bt cotton 3. Components of different IPM modules for Bt cotton 4. Incidence of spotted bollworm Earias vittella larvae in different Bt cotton genotypes under protected and un protected conditions during Incidence of American bollworm Helicoverpa armigera larvae in different Bt cotton genotypes under protected and un protected conditions during Fruiting body damage due to bollworms in different genotypes under protected and unprotected conditions during Incidence and damage due to pink bollworm Pectinophora gossypiella in different Bt cotton genotypes under protected and unprotected conditions during Boll opening and seed cotton yield in different Bt cotton genotypes under protected and unprotected conditions during Incidence of spotted bollworm E. vittella larvae in different Bt cotton genotypes under protected and unprotected conditions during Page No. 10. Incidence of American bollworm H. armigera larvae in different Bt cotton genotypes under protected and un protected conditions during Fruiting body damage due to bollworms in different Bt cotton genotypes under protected and unprotected conditions during Incidence and damage due to pink bollworm P. gossypiella in different Bt cotton genotypes under protected and unprotected conditions during Boll opening and seed cotton yield in different Bt cotton genotypes under protected and unprotected conditions during Pooled data of E. vittella, H. armigera larvae and per cent fruiting body damage for two seasons 15. Pooled data of PBW larvae, per cent rosetting and locule damage for two seasons 16. Pooled data of GOB, BOB and Seed cotton yield for two seasons 17. Season long bio-efficacy of Cry1Ac (RCH-2 Bt) against bollworms Season long bio-efficacy of Cry1Ac (RCH-2 Bt) against bollworms Season long bio-efficacy of Cry1Ac + Cry2Ab (RCH-2 Bt-BG-II) against bollworms Temporal variation in Cry1Ac toxin expression in RCH-2 Bt 21. Temporal variation in Cry1Ac and Cry2Ab toxins expression in RCH-2 Bt BG-II 22. Intra plant variation in Cry1Ac toxin expression and bio-efficacy (RCH- 2Bt)
6 23. Intra plant variation in Cry1Ac + Cry2Ab toxin expression and bio-efficacy (RCH-2 Bt BG-II) 24. Fruiting body damage as influenced by different levels of H. armigera larval incidence at different stages during Survival of H. armigera larvae at different stages of crop growth during Boll opening and seed cotton yield as influenced by varied level of H. armigera larval infestation during Fruiting body damage as influenced by different level of H. armigera larval incidence at different stages during Survival of H. armigera larvae at different stages of crop growth during Boll opening and seed cotton yield as influenced by varied level of H. armigera larval infestation during Correlation matrix for larval H. armigera incidence v/s damage and yield in RCH-2 Bt 31. Economic Injury Level for different stages of H. armigera infestation 32. Economic advantage due to protection at different levels of H. armigera infestation 33. Relative season long abundance of aphids and predatory insects on RCH-2 Bt and Non- Bt cotton hybrid during Relative season long abundance of Aphids and predatory insects on RCH-2 Bt and Non- Bt cotton hybrid during Relative season long abundance of Aphids and predatory insects on RCH-2 Bt and Non- Bt cotton hybrid (pooled) 36. Test statistics for relative abundance of Aphids and insect predators on RCH-2 Bt and Non-Bt cotton 37. Correlation matrix for aphid incidence and predatory population on Bt and Non Bt cultivar (r value) 38. Comparative biology of C. carnea reared on cotton aphids 39. Incidence of sucking pests in different IPM modules on Bt cotton 40. Incidence of spotted bollworm larvae in different IPM modules on Bt cotton 41. Incidence of H. armigera larvae in different IPM modules on Bt cotton 42. Per cent fruiting body damage caused by bollworm complex in different IPM modules on Bt cotton 43. Incidence of Pink bollworm, P. gossypiella in different modules on Bt cotton 44. Population of natural enemies (Predators) in different modules on Bt cotton 45. Boll opening and yield of seed cotton in different modules on Bt cotton 46. Economics of IPM modules developed for RCH-2Bt
7 LIST OF FIGURES Figure No. Title Between Pages 1. Fruiting body damage in different Bt cotton genotypes by boll worms under protected condition 2. Fruiting body damage in Bt cotton genotypes by bollworms under unprotected condition 3. Number of sprays and seed cotton yield in different genotypes 4. Season long bioefficacy of Cry1Ac (2004) 5. Season long bioefficacy of Cry1Ac (2005) 6. Season long bioefficacy of Cry 1Ac + Cry2Ab 7. Intra plant variation of Cry1Ac in bioefficacy of Bt cotton 8. Intra plant variation in Cry1Ac + Cry2Ab bioefficacy in Bt cotton 9. Dynamics of predatory insect population in Bt and non Bt cotton 10. Damage due to bollworms and seed cotton yield in different IPM modules 11. Economic advantage in different IPM modules of Bt cotton
8 LIST OF PLATES Plate No. Title Between Pages 1. Bio- assay procedure for boll worms 2. A view of field experiment on computation of EIL for H. armigera in Bt cotton 3. Field view of IPM module 4. Components of IPM modules
9 LIST OF APPENDICES Appendix No. I II III IV V VI VII Title Meteorological data Diet for long term rearing of H. armigera Diet composition of semi synthetic diet for H. armigera Composition of synthetic diet for E. vittella Composition of synthetic diet for P. gossypiella Calculation of cost of protection to work out EIL Cost of IPM components Page No.
10 I. INTRODUCTION Its time to decide whether to harvest from soil or from insect mouth Dr. M. S. Swaminathan (1994) Cultivation of cotton (Gossypium spp) has assumed worldwide importance for fulfillment of civilized population needs. By far, cotton the most important natural fibre or vegetable wool has been in the cultivation commercially for domestic consumption and export needs in about 111 countries world wide and hence called King of fibres or White gold. On ceremonial sentiments people call it as Queen of fibres also. The use of cotton, world over has been on the upswing despite competition from synthetic and animal origin fibres. According to the latest estimates from International Cotton Advisory Committee, Washington DC. USA, world cotton consumption rose from m tonnes in to 23.66m tonnes in During the current year the expected consumption has been estimated to reach 24.0m tonnes. Even for fashion fabric cotton is being most preferred world over gradually. India occupies one of the prime positions among cotton growing countries with 22.0 per cent area and 13.0 per cent production of global scene. Since two years production of cotton in India has been in excess of domestic needs. A record production of lakh bales has been witnessed in the cotton season closed on 31 September The latest figures on area, production and productivity stalled at lakh ha, lakh bales and kg/ha respectively (Anonymous, 2006) positioning India as largest grower and second runner up in production. No other cultivated crop species so far reported to be as susceptible to insect pests as cotton the world over. About 130 different species of insects and mites found to devour cotton at different stages of crop growth in India (Agarwal et al., 1984). A complex of sucking pests viz., green leaf hoppers, Amrasca biguttala biguttala (Ishida), thrips, Thrips tabai (Linnman), aphids, Aphis gossypii (Glover), whitefly, Bemisia tabaci (Gennadius), red cotton bug, Dysdersus koenigii (Fabricius) and Dusky cotton bug, Oxycarenus hyalinipennis (Costa) and bollworms viz., Helicoverpa armigera (Hubner) the American bollworm, Earias vittella (Fabricius), Earias insulana (Biosdual) the spotted bollworms and Pectinophora gossypiella (Saunders) the pink bollworm occupy major pest status contributing to lower yields. A recent estimation indicated that the loss caused by H. armigera and leaf hopper (A. biguttula biguttala) was 31.0 and 18.0 per cent respectively (Grover and Pental, 2003). A loss of US $ 1.0 billion worth cotton has been accounted for the dreaded pest, H. armigera every year (Gujar et al, 2000). Therefore containing the insect pests throughout the season has become a major activity in cotton crop husbandry everywhere. The cost of protection has a lion share in total cost of production in cotton. The Indian sub-continent has unique distinction of growing all cultivar types of cotton ranging from short to extra long staple fibre. Though cotton occupies only 5.0 percent of the cropped area, on an average it receives 48.0 per cent of the total pesticide used for agriculture purpose in India. Its share in total pesticide consumption world wide estimated to be 22.5 per cent (Saiyed et al. 2005). Kannan et al. (2004) reports that bollworm control takes a heavy toll up to Rs. 1,200 crores in a year by Indian farming community. The intensive (and extensive too) investment on insecticide to get rid of bollworms could not pay due dividend for longer time. The sole reliance of this hardware technology created significant agro-ecological problems like resurgence and insecticide resistance. The safety of environment, sparing of natural control factors and pollution problem would remain apart. Thus insect control in cotton reached disaster status surpassing crisis phase with in a decade of pyrethroids invention. Therefore insect pest management in cotton created psychosocio-economic calamities in the Indian farming community. The experience worldwide also matched to the Indian situation on a scale neutral comparison. Hence, integrated pest management and biological control concept gained priority worldwide. Though current IPM technologies developed based on location specific needs have been economically and
11 ecologically reliable (Patil et al., 1991, Patil et al., 1995, Narula et al., 2001 and Kulkarni et al., 2003,) its complexity and non-availability of critical components hinders the complete adoption of IPM package among the farming community on large scale basis. Greater success through IPM or IRM always remained with area wide educative and supportive programmes. However regular follow up of IPM/ IRM practices found dwindling for obvious reasons. Thus pest management in cotton warranted for a silver lining technology deserving least or no technocratic approach by the end user. Biological control programmes those based on insect pathogens particularly bacterium, Bacillus thuringiensis (Bt) (Berliner) have shown phenomenal feasibility and success mitigating the resistance problem, however the broad spectrum activity, production cost and slow action limited the use of Bt based formulations on wide scale commercially. Since last 20 years several research organizations are engaged in exploiting the insecticidal properties of this gram positive soil bacterium in meaningful way. The transgenic Bt technology appeared to be a outcome of couple of greatest advances in biotechnology viz., recombinant DNA, plasmid constructions, PCR amplifications and of course tissue culture techniques. Thus ultimately, GMO s (Genetically modified organisms) have been developed to which class Bt genotypes also belongs. These plants have in-built ability to express or produce crystal (Cry) protein toxic to the target pests. The largely exploited protein is Cry1Ac having specific action against lepidopteran insects and most widely to Heliothine. The crop plants bio-engineered to produce insect specific toxins are termed plant incorporated protectants (PIPs) by the United States Environmental Protection Agency (EPA). Transgenic technologies have proven to be one of the fastest and most effective means of insect control ever developed and Bt considered to be a natural choice for this role, as it produces a large variety of toxins very specific for certain orders of insect pests. Hence, there were continuous efforts to develop Bt transgenic crops viz., potato, rice, maize, canola, cotton, brinjal, tobacco etc to combat dreaded pests belonging to Lepidoptera, Diptera and Coleopteran orders. Past or present commercialized Bt crop and their respective genes include cotton (Cry1Ac, Cry2Ab2, Cry1Fa2), maize (Cry1Ab, Cry1Ac, Cry1Fa2, CryBb1, Cry9c) and potato (Cry3Aa) as reported by Federici (2002), and Shelton et al. (2002). Thus for commercial transgenic including Bt cotton have only one gene to produce Cry toxin to contain the target pest. Hence, they have been referred to as first generation Bt transgenic. After green revolution, development of Bt transgenic cotton has been regarded as most significant advancement in the field of world agriculture. Bt δ-endotoxin produced in transgenic plants when enters into the gut system of lepidopteran pests (having alkaline condition), the protoxin gets activated into toxin and binds to the specific receptor sites of the gut. The toxin ruptures the gut wall and later causes paralysis and death. Thus, Cry protein produced in transgenic cotton was found to be toxic to bollworms (Tabashnik, 1994). In the world scenario Bt cotton (Bollgard ) offered high level of resistance against cotton bollworm complex ie., tobacco budworm, Heliothis virescens (F.) and cotton bollworm, H. zea in US, pink bollworm, P. gossypiella throughout the cotton producing areas and Texas in U.S. and H. armigera in rest of the world (Shelton et al., 2002). Under Indian conditions, the transgenic cotton showed great resistance against American cotton bollworm, H. armigera, pink bollworm, P. gossypiella, spotted bollworm, E. vittella and spiny bollworm E. insulana both under laboratory and field conditions (Khadi et al., 2001; Ghosh, 2002; Kranthi, 2002, Venugopal et al., 2002 and Kranthi and Kranthi, 2004). The first broadly successful commercial Bt or PIP crop, Bollgard (NuCotn) cotton was marketed in US in Then the transgenic cotton entered Australia, Argentina, China, initially and South Africa, India, Mexico, Columbia and many other countries slowly. At present more than 540 million ha area is under transgenic crops expanded to 21 countries. Starting from 1996 currently 50 million ha area has been engulfed by Bt cotton. In the past, two years the area expansion is 11.0 per cent. In other terms, cotton occupies 35.0 per cent cropped area globally of which 20 per cent has been let of for Bt cotton (James, 2006) and the area in other counties estimated to be more than 4.50 m ha (US), 1.4 m ha (China) and 0.20 m ha (Australia). Based on the demand for technical solution to the quite intense bollworm problem in India the country resorted for adoption of Bt transgenic cultivars. Bollgard cotton the
12 proprietary gene product of Monsanto Co. entered Indian cotton scenario with approval of GEAC (Genetic Engineering Approval Committee) of Dept. of Biotechnology, Govt. of India on March 26, Three hybrids of Maharastra Hybrids Seeds Co. (MAHYCO) MECH-12, MECH-162 and MECH-184 converted into Bt versions commercialized for Central and South zone cotton growing states based on conclusive evidences of public and private sector trials. The approximate planting initially (2002) was 24,000 ha. Later during 2003 GEAC approved three more Bt hybrids developed by Rasi Seeds Ltd., Atur (TN). Since then plenty of Bt hybrids being approved every year by GEAC based on public sector (ICAR/SAU) research and private sector large scale demonstrations (Jayaraman, 2004, Anonymous, 2006a). Thus the area under Bt cotton kept on expanding and India gained status of mega biotech country with 7.8 m ha coverage. New cultivars are also being developed for regions of India that experience colder temperature or shorter growing season to tap maximum possible area. Preliminary figures on Bt hybrid performance in India are just becoming available now (Surulivelu et al., 2003, Udikeri et al., 2003a, Patil et al., 2004 and Bhosle et al., 2004). The data suggest that the Bt cultivars have an edge over conventional cotton both in terms of yield and economic advantage apart from satisfactory pest control. A survey conducted by MARG indicated that Bt cotton produced 22.0 percent better yields (18.98 q/ha) over conventional cotton (14.73 q/ha) with 78.0 per cent incremental benefit. Despite red carpet welcome to the novel technology, initiation and expansion of Bt cotton cultivation could not experience a cake walk. The issues of environmental safety, gene flow/ out crossing threats, impact on soil fauna and safety to non target organisms especially natural enemies have become critical factors leading to have second thought, now and then, before adaptation of Bt cotton. The major threat has been the possible development of resistance to Cry proteins as bollworms pass through high selection pressure owing to widespread, season long and year after year exposure to one toxin i.e. Cry1Ac. Therefore it has been conditional from EPA to put 20 per cent non Bt refugia around each unit of Bt cotton. Similar conditions have been adopted or drafted conveniently in all the countries including India. The cotton situation in India differ from the rest of the world with no regulated cultivation and hybrid cultivars (HH, HB) occupying approximately 70 per cent area. Further, India is the only country where all cultivated species of cotton are commercially grown. The yarn needs of Indian textile industry ranges from 20s to s counts and therefore cultivation of genotypes belonging to all four species and their hybrids is in practice. This has created a demand for Bt cotton genotypes in all types of cultivars (Khadi et al., 2003). The seed industry presently dominated by private sector keeping a high intensity flow of new genotypes into Bt cotton scenario. On the other hand the necessity of Bt inter specific cultivar has been urged by farmers, industry and trade linked people to bring back glory of cotton cultivation matching to DCH-32 era. In US and Australia s second generation Bt s coding for Cry1Ac + Cry2Ab genes have been cleared since, 2002 (Anonymous, 2003) as most convenient option for resistance management. Recently, a couple of (MRC-7201 and 7453) BG-II hybrids have been cleared by GEAC (Anonymous, 2006a) in India. Though Bt cottons offer inherent toxicity against insect pests the expression appear not to be uniform at definite stages. The variations in overall expression levels of Cry1Ac among bollgards have been correlated to survival of various lepidopteran pests indicating that cultivar do not provide the same level of control (Adamczyk and Meredith, 2003). Similar effect has been noticed by Greenplate (1999), Sun et al. (2002) and Olsen et al. (2005) in different Bt cotton genotypes. The spatio-temporal variations in eight Indian Bt cultivars have been reported by Kranthi et al. (2005). The possible survival of insect population and its contribution to development of resistance can t be ignored (Kannan, 2004). The application of insecticide to protect the crop from insect attacking / developing Bt cotton at later stage depends on the possible yield loss. However the proper guidelines in terms of economic injury levels or intervention thresholds separately worked out for Bt crops would help in better exploitation of transgenic technology. Further, it has been conditional approval in India from GEAC (Anonymous, 2004) for Bt cottons to develop IPM packages soon after release. Largely Bt cotton cultivars have been considered to be best tools of IPM (Patil et al., 2003, Patil et al., 2004a and Bambawale et al., 2004). The impact of Cry toxins on incidence of sucking pests and predators depending on them need to be explored for incorporation of biorationals in IPM.
13 The critical factors viz., suitability of newer genotypes with Cry1Ac or Cry1Ac + 2 Ab background in terms of profitability, in plant and in season variability in Cry protein expression, critical intervention thresholds for insecticide action, significance of transgenic predator interaction and easy to adopt location specific IPM modules have been considered as priority issues for sustainability of the best bet technology. Encompassing these issues the present investigation on transgenic Bt cotton was taken up with the following objectives. 1. Evaluation of different transgenic genotypes having Cry1Ac and Cry1Ac + Cry2Ab genes. 2. Assessment of changes in Cry protein expression of transgenic plants at different stages of growth. 3. Assessment of Cry protein expression and concentration in different parts of transgenic plants. 4. Computation of EIL and ETL for Helicoverpa armigera incidence in transgenic cotton. 5. Studies on impact of transgenic cotton cultivars on insect predators. 6. Development of IPM module for cotton pests with Bt genotype under rainfed conditions.
14 II. REVIEW OF LITERATURE Transgenic crops offer the state of the art and yet simple to use technology for agricultural productivity especially for bollworm management in cotton. Development of Bt transgenic technology for protection against dreaded pests appear to be the culmination of research temper since invention of insecticidal properties in the soil bacterium, Bacillus thuringiensis (Berliner) at the beginning of 20 th century. Deployment of Bt cotton cultivars on commercial scale worldwide since 1996 invited many researchable issues further. Thorough scanning of literature pertaining to the objectives of present investigation as well as related aspects are presented here under. 2.1 DISCOVERY AND DEVELOPMENT OF Bt COTTON In 1911, a German Scientist, Ernst Berliner, isolated rod shaped bacterium from diseased larvae of Ephestia kuhniella (Zell) found in Thuringia, Germany (Berliner, 1911). He named the bacterium as Bacillus thuringiensis Berliner. Earlier in 1901, Japanese scientist, Sigetane Ishiwata, reported the isolation of similar bacterium from silkworm, Bombyx mori larvae (Ishiwata, 1901). Bt is a soil bacterium that produces insecticidal proteins during it s sporulation. Further, research on Bt by Edward Steinhaus in the 1950 s at the University of California, lead to renewed interest in biopesticides and as a result, the more potent products such as Thuricide and Dipel were introduced for commercial use (Steinhaus, 1951). Since, then Bt is being used as insecticidal spray under different trade names (Thuricide, Agree, Dipel, Javelin, Condor, Foil and Biobit). With the advancement in the field of genetic engineering the δ-endotoxin gene of Bt became an attractive candidate to be among the first genes transferred into plants. The transgenic cotton containing Cry genes responsible for crystalline δ-endotoxin production in Bt var. kurstaki were transferred to cotton via. Agrobacterium with CaMV 35 S promoter (Umbeck et al., 1987). It was Perlak et al. (1990) for the first time expressed truncated forms of insect control protein genes of Bt var. kurstaki strain HD-1 (Cry1Ab) and strain HD-73 (Cry1Ac) in cotton plants. Transgenic Bt-cotton plants inturn expressed insect control protein to the extent of 0.05 to 0.10 per cent of total soluble protein thereby provided effective square and boll protection (70 to 87%) under high Helicoverpa zea (Boddie) pest pressure. Bt δ-endotoxin produced in transgenic plants when enters into the gut system of lepidopteran pests (having alkaline conditions), the toxin gets converted into protoxin and binds to the specific receptor sites of the gut. The toxin ruptures the gut wall and later causes paralysis and death. Thus, cry protein produced in transgenic cotton was found to be toxic to bollworms (Tabashnik, 1994). In the world scenario, Bt-cotton (Bollgard) offered high level of resistance against cotton bollworm (Shelton et al., 2002). Under Indian conditions, the transgenic cotton showed great resistance against H. armigera (Hubner) both under laboratory and field conditions (Ghosh, 2002; Kranthi, 2002 and Venugopal et al., 2002). 2.2 PERFORMANCE OF Bt TRANSGENIC COTTON HYBRIDS Wilson et al. (1992) observed that the number of rosette blooms caused by pink bollworm, P. gossypiella was 95 per cent lower on transgenic lines viz., 62 Bt and 65 Bt than on non-transgenic lines. Live larvae recovered from incubated bolls and per cent seed damage were reduced by 97 to 99 per cent in transgenic lines compared with the nontransgenic lines. Benedict et al. (1996) evaluated the field performance of transgenic cotton carrying a Cry1Ab gene (Mon 65 and Mon 81) and Cry1Ac gene (MON 247 and MON 249) to naturally occurring bollworm. The bollworm eggs were significantly more on two non-transgenic cotton lines (Cok-312 and Stoneville 453) in one season and on the two Cry1Ab lines in another season compared to others. Significantly less larvae were recorded in Bt cotton lines carrying either Cry1Ac or Cry1Ab (<0.55/60 plants) when compared to non-bt cotton lines (>198 larvae/60 plants). Similarly, significantly lower flower bud and square injury was recorded in Bt cotton lines carrying either Cry1Ac or Cry1Ab gene (<4.07 and <1.04%, respectively) when
15 compared to non-bt cotton lines (>20.60 and 11.77% respectively). An average yield of 1460 kg per ha was recorded in all Bt cotton lines compared to Coker 312 (1050 kg/ha). Harris et al. (1996) conducted studies to determine efficacy of Bt cotton cultivars against cotton pests in Mississippi during Transgenic cotton provided excellent control of bollworm, H. zea. Bachelar et al. (1997) compared the efficacy of Bollgard cotton, (NuCOTN-33B) and various commercial conventionally protected (with pyrethroids) varieties for boll damage and found that Bollgard fields sustained about 50 per cent less damage by bollworms than non- Bt conventional cotton and pyrethroid protected conventional cotton (2.30% vs. 4.62%). Hardee and Bryan (1997) noticed no significant differences in bollworm eggs between Bt and nectariless cotton. Bt cultivars, 757 Bt and NuCOTN 33 B recorded significantly lowest square damage (1.46 and 1.63%, respectively) and least Heliothis/ Helicoverpa population. Ghosh (2001) stated that Bt cotton provides no control during the egg laying stage of lepidopteron pests. Allen et al. (1998) studied the performance of several bollgard cotton cultivars in south eastern Arkansas and concluded that Bt cotton, although not immune to bollworm damage, are resistant to boll damage. Leonard et al. (1998) evaluated transgenic Bt cotton lines against Heliothinae and reported that all BTK cotton lines controlled the bollworm complex at par with the BTK standard cultivars, NuCOTN-35 B. All BTK lines produced seed cotton yields on par with the BTK standard in both sprayed and unsprayed treatments regimes. Bt cotton played an important role in preventing crop failure when tobacco budworm, H. virescens was at high pressure. Among the Bt cotton cultivars, DP-33B had recorded highest yield under Chihuahua state conditions (Stewart et al., 1998). Obando et al. (1999) reported that Bt cotton varieties (DP-33 B and DP-35 B) provided good control of bollworm compared to conventional variety (DP-5690) in Mexico. In addition, Bt cotton varieties required one less insecticide application compared to non-bt cotton. Burd et al. (1999) tested the performance of selected Bt cotton genotypes against bollworm and reported that among the genotypes, ST 4740-BG had significantly least per cent opened bolls compared to other varieties. It showed that non-pyrethroid treated Bt cotton sustained a yield loss of 6.6 to 31.7 per cent compared to pyrethroid treated Bt cotton genotypes. Sieglaff et al. (1999) assessed the efficacy of Bt cotton against pink bollworm (PBW) at the end of the season and results indicated that live PBW larvae and exit holes were observed only in DP 50 but, not in Bt cotton lines (MONS-1 and MONS-2). However, there was no significant difference among varieties in number of PBW hits on carpel wall. Overall, the lepidopteran pressure during the season was low, so no significant difference in yield was observed among the varieties. Gianessi and Carpenter (1999) found that the average loss in yield before Bt cotton introduction ( ) was 3.7 per cent, whereas the average loss in yield after Bt cotton introduction was 2.3 per cent ( ). In the United States, a significant yield increase for Bt cotton has been documented in studies across the cotton belt. Specifically, Kerby (1996) in a 75 field comparison of three Bt cotton varieties and their non-bt near-isogenic parents, showed a lint yield increase of as much as kg per ha which represented a 20 per cent improvement in yield. In a 109-field comparison in the southern and south-eastern United States, Mullins and Mills (1999) demonstrated a yield advantage of 22.4 kg per ha that resulted from adoption of Bt cotton. In Mississippi, Bt cotton out yielded the non-bt cotton varieties examined by 103, 51.5 and 94 kg per ha on average in 1995, 1996 and 1997 respectively (Wier et al., 1998). Benedict and Altman (2001) showed a yield increase of approximately 14 per cent (174.8 kg/ha). The U.S. results were further supported by the experiences in countries such as China, India and Spain. The average gross yields from Bt
16 cotton increased by 15 per cent over conventional strains in China (Buranakanonda, 1999). In India, a study conducted at 30 locations showed a 14 to 38 per cent increase in cotton yield without a single spray of insecticide for arthropod species (Anon., 2000). Zhao et al. (2000) compared the insecticidal activity of transgenic cotton GK-12, GK-1 and R-108 developed in China and NuCOTN-33B developed by Monsanto Co. Among the four Bt-cotton lines, GK-12 and NuCOTN-33B showed much higher insecticidal activity against H. armigera both in laboratory and field studies. Henneberry and Jech (2000) showed that, the average PBW entrance holes on Bt cotton (NuCOTN 33B) and non-bt cotton (DPL 5415) was to the extent of 19.6 and 14.4 per boll, respectively under artificial infestation. No larval exit holes were found in Bt cotton bolls and an average of 1.8 exit holes per boll occurred in DPL 5415 cotton bolls. PBW infestation in open mature and immature green bolls was 17.2 and 10.5 per cent, respectively on DPL 5415, and 0.0 and 1.7 per cent, respectively on Bt cotton. Larval survival was 21.5 per cent in DPL 5415 and less than 0.1 per cent in Bt cotton. Extremely low larval survival in Bt cotton from more than entrance holes suggested a high level of pink bollworm susceptibility to Bt cotton. Efficacy of NuCOTN 33B against pink bollworm was studied (Henneberry et al., 2000) under artificially induced pink bollworm infestation. Percentage of bolls with larval entrance holes in the carpel walls showed no difference for both Bt (80 to 100%) and non-bt cotton (65 to 100%). Percentage of cotton bolls with live PBW larvae was less in Bt cotton (<1%) compared to non-bt cotton (>70%). Bt cotton bolls expressed high level of resistance to PBW infestation till the late-season second fruiting cycle (up to 180 days), indicating reduced concentration of Bt toxin protein during later stages of the crop growth. Wu et al. (2000) evaluated the transgenic cotton cultivars developed by CAAS, China against cotton bollworm, H. armigera in Hebei and Henan provinces of China and found that GK-1 and GK12 cultivars are highly resistant to cotton bollworm throughout the growing season. The control efficacy of GK-1 and GK-12 to the second, third and fourth generation cotton bollworms were up to to per cent, to per cent, and per cent, respectively. Bt cotton cultivars recorded the damage rate of 6.53 per cent to cotton squares and yield increase of to per cent. The major parts damaged by first and second instar cotton bollworm larvae were squares (41.91%) and flowers (45.16%), but observed no significant difference in feeding behaviour of H. armigera between Bt-cotton and non-bt cotton. Bollgard and Bollgard II bolls had consistently fewer PBW larvae. The transgenic line, 985 BX (Cry1Ac + Cry2Ab) showed better (at least 10-fold) efficacy than the single gene lines, DP50 B (Cry1Ac), 985 B (Cry1Ac) and 985X (Cry2Ab). Second pick yields of all Bt varieties were significantly higher than the non-bt, suggesting a high degree of efficacy against typically high PBW densities during the late season (Marchosky et al., 2001). Qaim and Zilberman (2002) reported that Bt cotton contains Cry1Ac gene which provides a fairly high degree of resistance to H. armigera, Earias vittella, and P. gossypiella, all of which are major insects pests in India. Evaluation of Bt cotton hybrids, in Andhra Pradesh (Rao et al., 2002) revealed that Helicoverpa bollworm was suppressed up to 100 DAS. Bt cotton field experiments in India (Venugopal et al., 2002) showed that Bt cotton hybrids viz., MECH-184 Bt, MECH-162 Bt and MECH-12 Bt recorded significantly lower population of bollworms especially Helicoverpa compared to non-bt and check hybrids. Among the Bt hybrids, MECH-162 Bt was superior in central zone (13.3 q/ha) and MECH-184 Bt in south zone (20.09/ha). Rui et al. (2002) evaluated three transgenic cotton cultivars viz., NuCOTN-33B (Cry1Ac), GK-12 (Cry1A) and SGK-321 (Cry1Ac+CpTI) and observed decreased insecticidal activity against cotton bollworm, H. armigera with plant age. Insecticidal activity in leaves was highest in the early growing season (June and July), but bolls and squares showed higher activity in the middle or late growing season (August and September). Cultivar SGK-321
17 displayed significantly more consistent activity to both resistant and susceptible strains of cotton bollworm compared to single gene cultivars. Gore et al. (2002) evaluated the performance of Bollgard II with artificial bollworm infestation. Larvae injured a total of 6.4 fruiting forms per 10 plants on Bollgard II, 11.5 fruiting forms on Bollgard and 25.0 fruiting forms on non-bollgard cotton. Mean fruiting forms injury per bollworm larvae was 0.8 on Bollgard II, 3.5 on Bollgard and 6.6 on non- Bollgard cotton lines. Chitkowski et al. (2003) evaluated the performance of Bollgard II (containing Cry1Ac+ Cry2Ab genes) against noctuid pests. The results indicated that number of large bollworm larvae in Bollgard II cotton did not reach the treatment threshold of 3 per 100 plants on any of the sampling dates, while, it was on one or two sampling dates in Bollgard (Cry1Ac) cotton and several times in conventional cotton. Damaged fruiting bodies by H. zea in Bollgard II were negligible, whereas Bollgard had an average of 4.3 per 3 m of row. Overall the damaged fruiting structures in Bollgard were higher than in Bollgard II on all sampling dates, but significant differences occurred in only one location. On the contrary, damage to fruiting bodies in conventional cotton was significantly higher than in either Bollgard or Bollgard II. Among the MECH Bt hybrids, Helicoverpa larvae were least in MECH-184 Bt (0.45/plant) with lower damage to the fruiting bodies in MECH-162 Bt (4.36%) and MECH-12 Bt (5.66%). Highest seed cotton yield of q per ha was recorded in MECH-184 Bt which was on par with MECH-162 Bt and MECH-12 Bt (Udikeri et al., 2003). Under unprotected conditions, Bt cotton hybrids, recorded lower H. armigera larvae compared to check and non versions, with least being in MECH-184 Bt (0.91/ plant). Spotted bollworms were significantly lower in Bt hybrids (0.06 to 0.08/ plant) compared to non-bt hybrids. Per cent fruiting bodies damage was significantly least in MECH-184 Bt (4.04%) followed by MECH-162 Bt (5.02%) and MECH-12 Bt (6.84%). Highest seed cotton yield was recorded in MECH-184 Bt (12.13 q/ha) followed by MECH-162 Bt (8.44 q/ha) and MECH-12 Bt (6.71 q/ha) (Udikeri et al., 2003a). Bt cotton hybrids recorded significantly lower square, green boll, open boll and locule damage than the conventional and commercial Bt cotton hybrids. Among the cotton hybrids RCH-20, RCH-134, RCH-138 and RCH-144 Bt hybrids recorded significantly lower damage. However, Bt cotton hybrids did not show significant difference in yield among themselves (Vennila et al., 2004). Incidence of H. armigera and boll damage in Bt cotton hybrids was lower under both protected ( larvae/ plant and %, respectively) and unprotected ( larvae/ plant, and % respectively) conditions compared to their non-bt version checks. MECH-184 Bt recorded highest yield (14.89 kg/ ha) which was on par with other Bt hybrids but, significantly higher than non-bt versions and checks (Radhika et al., 2004). Pink bollworm larvae in green bolls at boll maturation stage ( DAS) was significantly low (0 to 0.5 / 20 green bolls) in Bt cotton hybrids viz., RCH-2 Bt, RCH-20 Bt, RCH-144 Bt and MECH-162 Bt while, it was 1.5 to 2.2 and 1.3 per 20 green bolls in non-bt counterparts and check hybrid (Savita), respectively. During the harvest completion stage (190 DAS), RCH-20 Bt and RCH-144 Bt recorded lower live larvae ( / 20 green bolls) than in RCH-2 Bt and MECH-162 Bt. During later stage ( DAS) also Bt entries supported significantly low population of live PBW larvae as compared to non Bt counter parts and check hybrids. Bt cotton hybrids, viz., RCH 2 Bt and RCH 20 Bt cotton hybrids recorded 22.2 to 31.8 per cent higher yield over their non-bt counterparts and 57.9 to 72.5 per cent higher yield over the check hybrid (Surulivelu et al., 2004a). MECH-184 Bt recorded damage in open boll of per cent in comparison to non- Bt version (35.54%). Overall, the percentage of damage in Bt cultivars ranged between to per cent. Among the hybrids tested, MECH-184 Bt recorded highest seed cotton
18 yield of 1651 kg per ha with lowest cost of plant protections. Further, the open boll and locule damage was very low i.e., to and 9.14 to per cent, respectively in Bt cotton hybrids which were almost double in the conventional hybrids (Bhosle et al., 2004). Wan et al. (2004) compared the performance of two transgenic cotton lines, BG (Monsanto Co.) and GH-19 (Chinese Academy of Agricultural Sciences) with conventional cotton for their resistance to bollworm in Yangtze River valley of China. There were no significant differences in egg density which was significantly lower in both the Bt cotton lines than in conventional cotton line. Hegde et al. (2004) conducted an experiment at Agricultural Research Station, Siruguppa, Karnataka State to study the performance of Bt and non Bt cotton hybrids under irrigated condition. The cotton hybrids under the study were MECH-12, 162, 184 Bt and their non-bt counterparts and Savita (Regional check) and NHH-44 (National check). The lowest boll damage was recorded in MECH-162 Bt (15.67 %) and was at par with MECH-184 Bt (19.12 %), MECH-12 Bt and significantly superior to the rest of the hybrids. Bolls per plant was highest in NHH-44 which was at par with MECH-162 Bt, MECH-184 Bt and significantly superior to rest of treatments. Maximum GOB of per plant was harvested from MECH- 184 Bt which was significantly superior to the check hybrids. Significantly highest yield (782 kg/ ha) was harvested from MECH-184 Bt. The next best yield was recorded in NHH-44 which was at par with MECH-12 Bt, MECH-162 Bt and MECH-184 non Bt and superior to remaining hybrids in the trial. Jackson et al. (2004) reported that bollworm, H. zea larval population was statistically on par between Bollgard and conventional cotton varieties under untreated conditions. However, Bollgard II (encoding Cry1AC + Cry2Ab genes) genotype reduced larval population by 91 and 94 per cent compared to Bollgard and conventional varieties, respectively. Both Bollgard and Bollgard II cotton genotypes reduced bollworm damage significantly below that of the conventional variety. While, Bollgard II in turn had significantly fewer damaged bolls than Bollgard variety. 2.3 SPATIO-TEMPORAL VARIATION IN Cry PROTEIN EXPRESSION OR SYNTHESIS The variation in the expression of insecticidal crystal proteins (1 Ac and others) has been well documented. The variations as well as factors responsible have been dealt in detail Variation due to biotic factors The type of the genotype converted as transgenic, its genetic background, generation, various parts of the plant, age of the crops have been considered as important biotic factors related to expression of Cry protein and performance of the gene as well as crop against target pests Genotype and generation effect Cry1Ab protein concentration in the middle leaf samples of transgenic tobacco lines developed found to be varying (Warren et al., 1992) and the lines with higher concentrations (>27 ng/g) showed no plants with economic damage in first season and the same lines required > 15 ng/g Cry protein for complete suppression of pests in second season. Thus cultivars as good carriers of genes play important role. Adamczyk and Meredith (2003) have clearly shown the importance of genotypes for better expression of genes as well as allelic interaction. The F 1 and F 2 progenies of crosses and reciprocal crosses of genotypes with differential expression of Cry protein viz., NuCOTN 33 B (9.15 ppm) and ST 469 1B (2.54 ppm) have shown the additive gene effect. The assessment of variance due to environment was less and that due to genetic environment was high indicating the importance of genotype factor.
19 Since the seeds of parent genotypes have to be maintained over years for their original characters the generation effect if any also play important role. However within available meager information there appeared contradiction. According to Adamczyk and Doughlas (2001) generation effect on Cry protein expression was significant. There was significant reduction in Cry protein content in seeds of two cultivars and from first generation to the next generation. However in other parts of the plant viz., terminal leaves and cotyledons such changes was not noticed. On the other hand there was no change in the mortality of H. armigera larvae reared on leaves of R-19 Bt cotton between two seasons where three generation seeds were used during 1997 and four generation seeds in This study (Sun et al., 2002) ruled out the possible generation effect on expression of Cry proteins Expression in plant parts The expression of crystal protein producing gene in different parts of the plants also vary and this factor appeared to be more critical as the larvae feed or prefer different parts. According to Greenplate (1999) terminal foliage showed very high level of expression compared to proximal fruiting structures i.e., 9 th main stem branch from bottom in Bt cotton plants. Even there was significant reduction in expression amongst different stages of crop growth. At 53 DAS both parts showed high expression which reduced significantly by 74 DAS. It remained at par level from 74 DAS in foliage and from 95 DAS in fruiting structures. In two Bt cotton cultivars (NuCOTN and DP) the Cry protein concentration was maximum in square bract followed by white flower, square buds and least in bolls as reported by Adamczyk et al. (2003). Such variable expression was also noticed in stages with very narrow difference in age i.e., normal bolls tips and boll tips with flower corolla attached in five Bt cotton varieties (Abel and Adamczyk, 2004). This was evident where Cry1Ac appeared to be lower in boll tips where flower had remained attached (1.47 ppm) compared to normal bolls (1.68 ppm) owing to the lower chlorophyll content. This was true with all varieties tested. This study also attributed post transcription changes as cause for decline in expression. Further Sun et al. (2002) reported higher mortality of neonate H. armigera larvae on 3 rd -13 th leaves of Shanxi line of Bt cotton. The mortality was least in top leaves. Correspondingly survival of II instar larvae was highest in fruiting bodies and that of III rd instars was absolutely nil on 3 rd to 17 th leaves Age of the crop or maturity effect As the crop gets aged or matured with advancement of season the changes in the expression of Cry protein levels found to be significant as evidenced by many reports. In general, the expression decreases with advancement of the season and age of the crop. Therefore at later stage of the growth crops failed to offer a good resistance. Ahmed et al. (2000) studied different Lemhri russet and Atlantic Bt potato events for their efficacy against larvae of tuber moths. The mortality of larvae due to presence of Cry5 was more in newly harvested tubers of Lemhi russet lines and 11 months stored tubers in Atlantic Bt events. The seasonal pattern of neonate mortality due to feeding on transgenic Bt cotton indicated decline in Cry protein after 85 DAS. The corrected mortality was 98 per cent at 55 DAS which reached 20 per cent by 95 DAS from there onwards mortality couldn t raise to heavy toll, instead reached zero level at 125 DAS (Daly and Fitt, 1998). Similarly there was seasonal variation in expression of Cry2 Aa 2 as well as Cry1Ac levels (ppm) in DP50 B-11 (Adamczyk et al., 2001) Bt cotton. From 10.5 ppm initial expression with slight decrease with age of the plants it reached maximum (13 ppm) by 50 DAS and then went on declining. Similarly the Cry1Ac level also dwindled up and down reaching 1.0 ppm at the end from initial 5.0 ppm level. They have also indicated the decline in concentration of delta-endotoxin (ppm) measured in leaves from two Bt varieties through out the season in Mississippi when sampling was done at different Julian dates from sowing. Further the investigations of Horwitz et al. (2003) showed marked increase in neonate mortality of H. armigera. In DP 5415 mortality was too less at any stage. In NuCOTN 33B mortality was more than 90 per cent on 26/5/98, 2/6/98 and just 6.0 per cent on 1/10/98 when observed from the crop sown during first week of April. The study indicated high level expression between DAS of the crop.
20 The population of pink bollworm larvae in RCH-2 Bt, RCH-20 Bt and RCH-144 Bt at 128,190 and 212 DAS indicated numerical variations. The population of PBW larvae in all the three Bt hybrids increased from 148 DAS to 190 DAS in all cases (Surulivelu et al., 2004a). This was related to changes in the concentration of Cry1Ac endotoxin. The concentration of Cry1Ac declined with advancement of the season. Initial concentration was more than 1.5 ppm and declined later irrespective of cultivars tested (Adamczyk et al., 2004). It was also evident that there was decline in endotoxin production with the age of the crop wherein Olsen et al. (2003) demonstrated it in terms of LC 50 requirements. From 47 DAS to 110 DAS there was an increase in LC 50 requirements of H. armigera larvae from initial 1.0 per cent Bt leaf in diet from DAS to 80 of Bt leaf in diet at 110 DAS. Similarly there was decline in total protein (38 to 18%) as well as endotoxin protein (20 to 15%). The possible cause for decline in delta endotoxin concentration with maturity was attributed to interaction by proanthocynin. The seize in proanthocynin concentration by addition of PEG (polyethylene glycol) lead to reduced LC 50 which otherwise was very high in absence of PEG. PEG arrests proanthocynin and hence allowed maximum expression of Cry toxin as opined by Olsen et al. (2003). The changes in the expression/ production of Cry proteins has been indirectly exhibited by larval density of H. armigera in two Bt (GK 12 and BG 1560) plants. The population per 100 plants was almost zero till 50 DAS in Bts as reported by Wan et al. (2005). In non Bt variety Shimian 3 population assumed increasing trend by 35 DAS and reached 70/100 plants at 85 DAS and reduced to zero by 120 DAS. A detailed investigation in China with four transgenic Bt cotton cultivars on expression of Cry proteins also supported the fact that expression decline with age of plant (Sun et al., 2002a). Concentration of Bt protein (ng/g) also varied amongst plants sown at different dates. The assessment of mortality as well as Cry concentration assessed on 30 th September from leaves harvested from plants sown at 9 different dates from 1 st March. The concentration was found to be high in 45 days old plants and less in 150 days old plants with decline in trend. Correspondingly mortality also varied. The decline in the concentration of endotoxin appeared to be significant as indicated by Olsen et al. (2005) through their studies in two seasons with varieties Siokra V-151 and Sicale V-2i Bt cotton. The comparison of LC 50 values for H. armigera between sampling dates for these Bt cotton leaves sampled at third node showed significant increase. The LC 50 which was 0.11 per cent of Bt leaf in diet on 15 th November reached per cent by 6 th March in Sikora. Such changes were from 0.63 to per cent in Sicale from first to last date of observation. Few reports are also available on the impact of various biotic factors discussed so far above which also indicate more than one cause. Olsen et al. (2005) showed Cry1Ac as well as total protein concentration levels in Bt cotton leaf samples during growing season. Both found to be decreasing in Vi Zi as well as Vi 15 Bt cottons. The peak expression was noticed during 21/9/1996 and least after 6/2/1997. They also showed the least (<0.1) neonate survival during pre square and square stage. This proportion of neonate survival increased and reached to 1.0 in square stage with further decreased during flowering and boll formation stage. This was true when plants were raised in three different growing conditions viz., two glass houses and a cabinet. The RNA isolates in the studies of Olsen et al. (2005) also confirmed the fact that the gene expression vary from pre square stage to square stage. This was confirmed by Cry1Ac profile, NPT-II marker transcript and promoter (GUS) gene expression profile also. Further Alinia et al. (2000) also showed differential expression and impact of Cry1Ab in transgenic paddy cultivars. It was evident that mortality of neonates of both Chilo suppressalis and Scirpophaga incertulas vary significantly amongst Bt and non-bt cultivars with higher mortality in Bts at vegetative stage. There was no significant variation in mortality of 10 d old larvae of both pests. Further, at flowering stage neither neonates nor 10 d old larvae of either of the pest react sensitively to Cry1Ab indicating its decline. They also showed changes in mean per cent survival of Cnaphalocrosis medinalis (Gn.) on leaves in vegetative and flowering stage at 3 days after infestation. At vegetative stage there was no survival of C. medinalis and no change from non Bt plants in mortality at flowering stage. The expression profiles confirmed the fact that at vegetative stage Cry1Ab expression was high in Bt rice plants with relatively higher concentration in leaf blade than leaf sheath. Adamczyk and Doughlas (2001) studied expression of Cry1Ac in terminal leaves across growing season in 13 cultivars. NuCOTN 33B and DP 458 B/RR had high level expression compared to other 13 varieties. The peak expression was around 50 DAS (>2.0 ppm) which declined to 1.0 ppm by 110 DAS in the
21 above two varieties. Though expression level was low in other 11 varieties the trend and peak incidence period remained same. A study conducted at CICR, Nagpur by Kranthi et al. (2005) with eight Bt cotton hybrids also indicated variable expression in different parts of plants which declined with advancement of season. The various parts tested for expression were leaf (top, middle, bottom), square bract and square bud. The high level concentration was noticed in bottom leaf ( µg /g fresh weight) followed by middle ( µg/g) and top leaves ( µg/g) and low level in square bracts as well as buds. In all parts, peak expression was noticed at 75 DAS and drastically reduced around 104 DAS reaching almost zero by 152 DAS. Thus the economically significant parts and stage of crop growth suffered from dearth of endotoxin. Similarly, there was deceasing trend in mortality over season in larvae of H. armigera restricted on leaves, squares and bolls in a field bioassay. On leaf and squares the onset of decline was from 70 DAS itself with marked reduction by 130 DAS. On bolls the mortality itself was lower compared to leaf and squares and by 50 DAS itself there was declining trend (Shelkar and Regupathy, 2004). A report of Bollgard-II initial evaluations in Australia (Anonymous, 2002) showed good evidence for variable expression of Cry genes not only for one gene but also for two genes-a pyramid case. Expression of Cry2Ab in Bollgard-II was as high as 43.2 µg /g in seed, 23.8 µg /g in leaves, 8.87 µg /g in whole plant and < 0.25 µg /g in pollen during In Ingard this gene was absent and the Cry1Ac trends were also similar in both Ingard and Bollgard-II with slightly higher concentration in later one. The studies in 1999 were confirmative for previously disclosed facts. Further, levels of Cry2Ab protein in Bollgard-II leaf samples at different dates of sampling in the season showed maximum concentration at 55 DAS in 1998 (40 µg /g) as well as 1999 (14.3 µg /g). By 108 DAS expression reached to 16 or 11 µg /g of tissue. The concentration of Cry1Ac in top leaf was and ng/g at square forming stage in GK-19 and BG-1560 Bt cottons respectively and least during boll setting. At this stage of crop growth squares also showed and ng /g toxin content in respective Bt varieties which was maximum for the parts. Petals, stamens, ovules had more concentration during flowering and boll setting as reported by Wan et al. (2005) Abiotic factors As the crop growth and yield performance was much influenced by environmental factors, the abiotic factors could play important role in expression also and thus performance of Bt transgenic. The experimental evidences for the influence of abiotic factors on cry protein expression are meager compared to influence of biotic factors. However concluding remarks on various factors made by different researchers would appear as guardstones in this study area. Of these, effect of soil/ experimental site, nutrition, temperature, CO 2 and various stress are found to be important Site effect Efforts were made by Adamczyk and Doughlas (2001) to asses effect of site on expression of Cry1Ac concentrations in 13 Bt cotton varieties. Though there was slight variation in concentration expressed throughout season in these cultivars grown as groups in silt loam and clay soils separately these changes were said to be non significant barring the effect of site. Contradiction to this the effect of field site on mean Cry1Ac levels in different parts of the cotton plants was significant as reported by Greenplate (1999). The concentration of Cry protein (µg/g) was 47.2 in proximal fruiting structure and in terminal foliage in crop raised at Louisiana State University, Bossier city (MS). This level of expression was on par to crop raised at Texas and Arkansas and significantly superior to that of crops raised at Jamesville and Loxley (least expression sites). Thus a clear cut influence of site/soil types has been documented in USA.
22 Nutrition As nutrients play significant role in overall performance of the crop growth, the influence of fertilizer supplementation on synthesis of Cry proteins would be considerable. Vegetative stage Cry1Ab transgenic rice plants at all three fertilizer levels were highly resistant to C. suppressalis in comparison with control plants. In the cut stem and whole plant assays with C. suppressalis and C. medinalis the fertilizer x variety interaction and the fertilizer effect were not significant (Alinia et al., 2000) in Bt rice line 827. The interaction principally caused by higher larval survival on control plants that received fertilizer compared to plants with no fertilizer. Another study on nitrogen fertility effect on Bt delta endotoxin and nitrogen concentrations on maize during early growth was conducted by Bruns and Abel (2003). It was evident that available N likely increased the Bt toxin synthesizing proteins and thus increased the concentration of Cry protein also. At zero N level available nitrogen was 25.8 mg/g of tissue and endotoxin was 350 µg/ kg. By application of N at various doses (112 to 336 kg/ha) available N concentration significantly increased with steady enhancement in Bt-endotoxin from 367 to 534 µg/ kg of tissues. Upon correlation establishments there was significant and positive relationship between endotoxin production and fertilizer levels at 0.05 levels and with that of whole plant N concentration at 0.01 levels. Hosamath et al. (2004) while exploring influence of N sources on endotoxin production concluded that application of recommended NPK dosage straight way through inorganic fertilizer forms contribute for Cry1Ac concentrations. The Cry1Ac level 2.3 µg/ g in seeds harvested from plants met with RDF which was more compared to concentration in the seeds that were supplemented with FYM, vermicompost and green manure crops to meet equivalent nutrient especially N that too in straight way in available form contribute to Cry protein production via synthesis of amino acids and nitrogen accumulation in plants Stress effect The expression of Bt gene and synthesis of delta endotoxin also had relationship with the stress that crop suffers during crop growth conditions and stages. The effect of moisture stress on two Bt maize varieties (CIBA and NK) was quite significant on expression of Cry1Ac which was indicated in terms of prevention of tunneling by European corn borer. Tunneling was less in both non Bt versions in both generation larvae due to presence of DIMBOA a natural antibiotic chemical in maize. As plants grown to a month old and DIMBOA concentration reduced and there was significant difference among Bt and N Bt plants in tunneling with least in the presence of Cry1Ac endotoxin (Traore et al., 2000). It was evident that Cry1Ac toxin synthesis altered significantly in Bt cotton stems and leaves when salinity increased. At 2000 mm NaCl concentration Cry portion was more in stem and least in leaves compared to 50 and 100 mm. However there was no change in the mortality of neonates as reported by Jaing et al. (2004) Effect of environment (Temperature and CO 2 ) Coviella et al. (2000) reported marked reduction in Bt toxin production under elevated concentrations of CO 2. Bt cotton plants raised at low and high levels of nitrogen under ambient as well as elevated CO 2 concentrations when analyzed for plant nitrogen (%) C:N and Bt toxin (ng/g) revealed changes in these factors. Exposure of plants with lower N fertilization to elevated CO 2 levels showed lower plant N, wider C: N and significant reduction in Cry1Ac toxin. The effect of temperature on Cry protein concentration in plants grown under cool (14-22 o C) and warm (22-32 o C) temperature situation was quite convincing in the studies carried out with Bt cotton in Australia as reported by Mahon et al. (2002). The mortality of H. armigera larvae was 38 and 44 per cent on leaves plucked from node 4 and 5 of plants grown under cool temperature which appeared significantly less against 80 and 77 per cent mortality on leaves from warm temperature plants used for similar assay. The effect of high temperature on the insecticidal properties of Bt cotton varieties has been studied in detail by Chen et al. (2005) in China. When Kumain No. 1 and Xingyang 822 plants were exposed to high temperature (37 o C) for one day at 77, 106 and 129 DAS, the
23 concentration of delta endotoxin was significantly reduced at all stages of test compared to control i.e., exposure to normal temperature (24-30 o c). Under such exposures the concentration of glutamic-pyruvic transaminase (GPT), total free amino acids, proteases activity and soluble protein in leaf showed relatively little changes. Further exposure to 37 o c temperature at 0, 12, 24, 36 and 48 hours revealed decreasing toxin as well as increased amino acid concentration both at flowering and boll period analysis with increased duration of exposure. This was in relation to decrease in leaf soluble protein concentration under all situations of assessment. Thus temperature as well as duration of exposure plays significant role in Cry toxin production Growth regulator effect Oosterhuis and Brown (2003) showed increased efficacy of Bt cotton plants due to the application of chaperone (Atonic) a plant growth regulator. The concentration of endotoxin increased significantly in squares due to its application. The mortality of neonates of H. armigera reared on leaves and squares enhanced significantly due to application of 5 oz and 10 oz compared to control, which was due to increased photosynthetic activity and enhanced physiological activities favoring the synthesis of insecticidal proteins. 2.4 ECONOMIC THRESHOLD / ECONOMIC INJURY LEVELS FOR Bt TRANSGENIC COTTON The fact that transgenic cotton also require sprays against bollworms after certain stage of growth owing to reduction in Cry protein synthesis / expression in the plant has been evident from literature presented in 2.2 and 2.3 chapters. The spray requirement based on ETL (1.0 larva / plant) was 1, 2 and 3 rounds for MECH-184, 162 and 12 Bt hybrids compared to 4 sprays in non Bt versions of respective Bt (Bhosle et al., 2004). MECH-162 Bt crop crossed ETL by 99,111, 123 DAS and both MECH-12 Bt and 184 Bt by 123 days after sowing (Surulivelu et al., 2003). This has been the experience of worldwide farmers. So far no ETL has been worked out separately for Bt cotton. Application of insecticides or imposition of any treatment against pests either in IPM practices or in insecticide reliance has been broadly based on ETL of 1 larvae or egg per plant or 10 per cent damage in India. Panchabavi and Sudhindra (1996) worked out an intervention threshold of 1 larva / plant for hybrid cottons. A 10.0 per cent damage based ETL has been recommended by CICR Nagpur after thorough experimentation (Mayee et al., 2001). Similarly one larva / plant has been recommended in Tamil Nadu (Surulivelu et al., 2003) It has been mentioned in the cotton insect scouting guide (Anonymous, 2006b) that three live second stage bollworms per 100 squares or two second stage bollworms on two consecutive scouting or one second stage bollworm on three scouting trips or 6.0 per cent damage or eggs / 100 terminals as EIL for transgenic Bt cotton. Further, it has been suggested to give a gap period of at least a week between consecutive scoutings. Similarly 2 larvae / m row observed in two consecutive checks could be EIL for bollworms in Bt cotton (Anonymous, 1997) Research to define spray thresholds for H. armigera conducted at Kununurra between 1998 and 2001 revealed 2.0 larvae / m row as EIL on a comparative account of graded infestation on lower side (Strickland et al., 2003)
24 2.5 THE IMPACT OF Bt COTTON CULTIVARS ON THE INCIDENCE OF SUCKING PESTS AND NATURALLY OCCURRING PREDATORS Impact of Bt transgenic cotton on sucking pests of cotton The transgenic cotton cultivars tested did not show either attraction or susceptibility to cotton aphid, A. gossypii (Harris et al., 1996). The Bollgard (NuCOTN-33B) fields expressed about 4-fold higher levels of stink bugs, primarily Acrosternum hilare (Say) and Eushistus servus (Say) damage than the conventional fields (3.03% vs. 0.75%) (Bacheler et al., 1997). Tarnished plant bug population was significantly less in nectariless cotton (MD51) and significantly more in 757 Bt and Coker-312 (parent of 757 Bt) than other varieties. So, Bt gene insertion had no effect on tarnished plant bug incidence (Hardee and Bryan, 1997). Bt cotton fields recorded higher incidence of tarnished plant bugs (Lygus spp.) and boll weevils, Anthonomus grandis Boheman presumably due to the reduction of insecticidal inputs (Stewart et al., 1998). Cui and Xia (1998) reported that in Bt cotton fields where natural and integrated control was used, aphids increased by 33.1 per cent and decreased by per cent, respectively and red spider mite, Panonychus ulmi increased by per cent and decreased by 18.5 per cent, respectively. Thrips tabaci Lindeman, Trialeurodes vaporariorum Westwood and Empoasca biguttula Shida increased by 346.0, 68.3 and 11.5 per cent, respectively in unprotected Bt cotton and 315.3, 29.0, and 14.2 per cent, respectively in integrated control Bt cotton plots. Lygus lucorum Meyer increased by 57.1 per cent and decreased by 18.9 per cent, respectively. Sieglaff et al. (1999) observed that the two Bt cotton lines, MONS 1 and MONS 2 recorded lower whitefly population during mid cropping season compared to other non Bt lines DP 50, DP 50B and Lepidoptera control DP-50 Bu. Cui and Xia (2000) noticed that the red spider mite, Tetranychus urticae (Koch) and thrips as dominant pests in Bt cotton (R 93-6). Sharma and Ortiz (2000) opined that reduced pesticide application leads to increase in some minor pests. So, it was proved that management of phytophagous stink bugs was necessary in Bt cotton. But, Reed et al. (2000) observed no difference in tarnished plant bug infestation, heliothine egg deposition and aphid population between Bt cotton and non-bt cotton Sun et al. (2002) reported that Aphis gossypii Glover, T. tabaci, and L. lucorum populations increased in Bt cotton field of either natural control or chemical control, compared to non-bt cotton fields. Investigations carried out by Deng et al. (2002) in China indicated that population densities of some non-target pests were greater in transgenic Bt cotton than in non-transgenic plot. The population of non-target pests in transgenic cotton plots was significantly higher than those in normal cotton plots. The population of A. gossypii, E. biguttula and Bemisia tabaci were significantly lower in bivalent cotton (SGK321), containing Cry1Ac + CpTI compared to univalent cotton (GK321), containing the Cry1Ac by 33.0, 50.6, and 22.7 per cent, respectively. While, the population of T. tabaci and L. lucorum was higher by and 18.4 per cent, respectively (Sun et al., 2003). A season-long survey of Bt cotton in two villages in Warangal district of Andhra Pradesh revealed moderate to heavy infestation of aphids and whiteflies during 80 to 90 day old crop (early October) throughout the area, more prominently on Bt cotton (MECH-162Bt) than on non-bt cotton (Qayum and Sakkhari, 2003). Wu and Guo (2003) studied the influence of Bt cotton, GK-12 on population dynamics of cotton aphid, A. gossypii under unprotected and H. armigera protected plots. The results indicate that population density of cotton aphid was significantly higher in pyrethroid treated
25 plots followed by organophosphorus treated plots of both Bt cotton and conventional cotton as compared to unsprayed Bt and conventional cotton. Population densities of cotton aphids were significantly higher in insecticide treated conventional cotton than in Bt cotton plots. It was due to lower predator population in late June and early July because of early insecticide use in conventional cotton. So, this suggested that Bt cotton not only played an important role in the control of H. armigera, but also prevented cotton aphid resurgence in response to insecticide use Impact of Bt transgenic cotton on the dynamics of beneficial insects The dynamics of major predators in Bt cotton and conventional cotton fields were almost same, while, dynamics of larval parasitoids showed significant differences. Egg parasitization of third generation noctuid eggs was lower in Bt transgenic cotton than in conventional cotton (Wang and Xia, 1997). The predator, Propylea japonica (Thunberg) increased by 11.8, and 45.5 per cent in Bt cotton fields with natural and integrated control, respectively. While, Erigonidium graminicola Sundevall decreased by 3.6 per cent in both natural and integrated controls, Chrysopa sp. decreased by 20.0 and increased by 38.7 per cent, respectively, and Orius minutus L. decreased by 30.4 and 9.0 per cent, respectively. In natural and integrated control Bt cotton fields the parasitoid, Campoletis chlorideae (Uchida) abundance decreased by 79.2 and 87.5 per cent, respectively. While Micropletis sp. decreased by 88.9 and 90 per cent, respectively and activity of Lysiphlebia japonica increased by 85.1 and 90.2 per cent, respectively (Cui and Xia, 1998). However, Tol et al. (1998) noticed no significant differences in beneficial arthropod populations between Bt and non-bt cotton sites in 1996 and Gould (1998) opined that Bt-transgenic cultivars do not directly affect most of the natural enemies. But, a drastic drop in the pest density could cause local extinction of species-specific parasitoids and pathogens, so any resistant pests could be free of their suppressive effect. However, density independent factor can check resistant pest population. Cui and Xia (1999) observed that except P. japonica, the population of predatory arthropods in the Bt cotton field was not increased significantly. Whereas the population of parasitoid was influenced by the decrease in cotton bollworm (H. armigera) larvae. Xia et al. (1999) observed no change in dominant predator species, but the number of dominant parasitoids of H. armigera decreased. The number of predators increased by 24 per cent in Bt cotton fields. Liu et al. (2000) reported that Campylomma diversicornis was a dominant predator in Bt cotton preying on eggs and newly hatched larvae of H. armigera. So, it played important role in the control of H. armigera in mid to late cotton growing season. The population of the natural enemy, Chrysopa formosa Brauer increased in Bt cotton fields. While, O. minutus, Deraeocoris punctualatus (Uhler) and several parasitoids decreased in transgenic cotton fields (Sun et al., 2002). Deng et al. (2002) recorded significantly greater population of natural enemies in the transgenic Bt cotton plots in China. Population of spiders in insecticide treated and untreated Bt cotton plots were 66.3 to 95.1 per cent and to per cent higher, respectively, than those recorded in non-bt IPM plot. Population of P. japonica in treated and untreated Bt cotton plots were 37.2 to per cent and to per cent higher, respectively than those recorded in non-bt IPM plot. Geocoris pallidipennis Costa, recorded as an important natural enemy in the Bt cotton and was virtually undetectable in the non-bt cotton plot. Naranjo and Ellsworth (2002) recorded significantly lower seasonal densities of Nabis alternatus Parshley, Zelus renardii Kolenati and large predators in Bt cotton plots compared to non-bt cotton plots in However, no differences in densities of these predators were found between Bt and non-bt cotton plots in They also found no differences in the
26 season-long density of parasitoids. Level of predation and parasitism on eggs of P. gossypiella and B. tabaci nymphs did not differ between Bt and non-bt cotton plots. Sun et al. (2003) reported that the population density of natural enemies was significantly lower in transgenic cotton plots than in normal cotton plots. The population of P. japonica, L. japonica and Allothrombium ovatum were lower by 30.4, 42.8, and 46.8 per cent, respectively in bivalent cotton (SGK321), containing Cry1Ac + CpTI compared to univalent cotton (GK321), containing the Cry1Ac. Whereas, the density of the eggs of Chrysopa sinica Tjedar and Araneida was lower by 20.0 and 27.4 per cent and that of O. minutus was higher by 8.9 per cent in bivalent cotton compared to univalent cotton. Liu et al. (2003) showed that number of spiders in Bt cotton field was 398 per 100 plants, accounting 49.7 per cent of the total predators. Achaearnea tepidariorum, (Koch) Pardosa tinsignata (Bosenberg and Strand) and Erigonidium graminicolum (Sundervall) were dominant spiders and accounted for 53.6, 16.7, and 18.6 per cent of the total spiders, respectively. The seasonal dynamics of spider population showed that they were low in the early stages of the Bt cotton but built up quickly in the middle and late stages, reaching a peak of 454 spiders per 100 plants. Liu et al. (2003a) observed that, natural parasitism by Trichogramma chilonis Ishii in both Bt and non-bt cotton fields gradually increased from 13.3 to 14.3 per cent in the second generation to 26.7 to 28.2 per cent in third generation and 60.8 to 61.4 per cent in the fourth generation. Egg parasitoids, Trichogrammatoidea lutea Giraultand, and Telenomus ullyetti Nixon females made no distinction between bollworm eggs oviposited on Bt cotton (NuOpal), unsprayed and sprayed non-bt cotton plants, until 110 days after planting (DAP). However, percentage of bollworm eggs parasitized was much lower in the Bt cotton than in the unsprayed and sprayed non-bt cotton during the last two sampling events. This was probably not the result of the presence of Bt toxin because the expression of endotoxin decreased towards the end of the season (Mellet and Schoeman, 2004) Natural enemy abundance in row mixture plots (Bt cotton: Non Bt cotton) was on par with sole non-bt plot but, significantly higher than in sole Bt cotton plots. However, egg predation or abundance of egg predators was not affected by the Bt (Sisterson et al., 2004). Hegde et al. (2004) observed no difference in the population of Chrysoperla and coccinellids between Bt, non-bt, and local hybrids Effect of transgenic crops on bio-potentiality predatory insects Berry et al. (1996) exposed larval and adult Hippodamia convergens (Gucin Menevilli) convergent lady-bird beetle to Myzus persicae (sulzer), green peach aphid, reared on potatoes expressing δ-endotoxin of Bacillus thurigiensis tenebrionis hoping that toxin may be ingested by the aphid and the beetle may inturn be exposed to the toxin. However, no significant effect on survival, aphid consumption, development or reproduction in beetles was found. There was no difference with respect to distribution of predators like Orius insidiosus, coccinellids and lacewing between transgenic and isogenic corn fields as reported by Orr and Landis (1997). Pilcher (1997) studied the distribution of predators in Bt corn and non-bt corn fields at different stages of crop growth i.e., before pollen shedding, at the time of pollen shedding and after pollen shedding. He found that there was no difference in the distribution of predators between the transgenic and non-transgenic corn fields. In another study, where Chysoperla carnea were fed prey feeding on transgenic Bt-corn pollen no significant difference was found with respect to development period or adult longevity. In a similar study wherein different life stages of Colomegilla maculate were fed with prey feeding on transgenic or non-transgenic corn pollen showed no advance effect on the developmental time or adult longevity of the predators. Hilbeck et al. (1998) reported that there was no effect on the mortality of C. carnea which was fed with larvae of Ostrinia nubialis and Spodoptera littoralis feeding on Bt and non- Bt corn diet.
27 Riddick et al. (1998) reported that as the proportion of transgenic plants increased in the field where mixture of transgenic and non-transgenic crops were grown there was a significant reduction in the number of predators like Lebia grandis and C. maculate and this was due to low availability of prey in the transgenic field. Mohammed et al. (2001) reported that there was no significant difference in the mean mortality body weight, length and number of days to adult hood for Orius insidiosus feeding on European corn borer larvae fed with Bt or non-bt diet. There was also no significant difference with respect to Orius insidiosus nymphs and adults on Bt and non-bt corn fields. Fred and Shelton (2003) studied the impact of transgenic Bt sweet corn and insecticides applied to non-transgenic sweet corn on predator population during silk, blister stage of early and late planted corn and it was found that among different treatments highest number of predators was found in spinosad treated plot followed by Bt corn plot at silk early stage and vice versa in blister early stage. However, in late planted corn, the Orius adults were highest on Bt corn plots. Highest predators of Ostrinia nubalalis egg was seen in spinosad treated plot followed by Bt corn plot. 2.6 INTEGRATED MANAGEMENT OF INSECT PESTS IN Bt TRANSGENIC COTTON Non pesticidal approaches for pest management in Bt cotton Luttrell and Herzog (1994) reported that the transgenic cotton expressing endotoxin proteins of Bt could reduce the input of chemical insecticides and create ecologically sound breeding programmes without reducing cotton yield as a part of an IPM strategy. Transgenic lines of cotton which carry one or two insect control protein genes from Bacillus thuringiensis race Kurstaki (Berliner), Cry1Ab and Cry1Ac showed high levels of resistance to several lepidopteran insects (Benedict et al., 1996) whereas, Lambert et al. (1997) opined that pyrethroid treated Bt plots had significantly higher yield than untreated Bt cotton. Yield in Bt plots were increased by 23 per cent when pyrethroids significantly reduced the bollworm population, Tracer and pyrethroid treatment reduced the stink bug population in Bt cotton compared to untreated plots as reported by Bell et al. (1999). Early season application of acephate 75 SP to Bt cotton fields resulted in disruption of predatory arthropods, ants and coccinellids and increases the population of bollworms, armyworms and aphids (Turnipseed and Sullivan, 1997). Beet armyworm (Spodoptera exigua) was effectively managed by using diflubenzuron in combination with Bt cotton than either diflubenzuron or Bt cotton alone (Welland et al., 1997). Whereas, Roberts (1998) reported that supplemental sprays with methyl parathion, Tracer and Karate during late July and early August to Bt cotton fields has produced lint yield of 1003, 1025 and b acre respectively compared to the untreated control yield which registered only 951 1b per acre. Allen et al. (1998) conducted a field study to test the varietal performance. The results indicated that Bt cotton although not immune to bollworm damage, were resistant to damage. Economic benefits were gained by scouting and spraying Bt cotton as needed. Tol et al. (1998) evaluated crop terminal to detect Heliothine (Heliothis virescens and Heliothis zea) populations. Results showed significantly less number of larvae and damage to squares in Bt cotton fields as compared to non-bt cultivars. Further, Hilbeck et al. (1998) showed minor effects of the life history traits of Chrysoperla carnea Stephens feeding on intoxicated Spodoptera littoralis (Biosduval) and Ostrinia nubilalis (Hubner). Antilla et al. (1999) demonstrated the alternative in-field refuge strategy for the control of pink bollworm in Bt transgenic cotton. Single rows of conventional cotton were planted within separate Bt transgenic fields at the rates of one non-bt row in four, six and eight rows of Bt cotton respectively. This study suggested that crop losses incurred on an in-field of 25per cent non-bt cotton produced less negative economic impact than chemical control.
28 Cotton seed oil was used in conjunction with Bt as a control agent in an IPM programme for cotton in Israel (Broza et al., 1999). Brickle et al. (1999) evaluated the efficacy of six insecticides of different chemistries against cotton bollworm in transgenic Bt cotton (Nucotn 33B). Among these insecticides, Karate was found to be highly effective al lower rates. Reduced rates of certain insecticides showed considerable promise for bollworm control of Bt cotton. Understanding the new technology and knowing how to mange Bt cotton varieties could improve cotton pest management and increase both profits and yield was opined by Capps et al. (1999). Further, they reported that timely insecticide treatments were needed for Bt cotton when insect pests reach economically damaging levels. Similarly, Xia et al. (1999) reported that the use of insecticides for the control of Helicoverpa armigera in Bt cotton fields decreased by per cent and the number of predators increased by 24 per cent compared to the conventional cotton. Thus they opined that the transgenic cotton fits well in the insect management. All Bt cotton varieties achieved good control of bollworm and had less insecticide application compared to conventional varieties. Therefore it was felt that Bollgard cotton act as an alternative for Integrated Pest Management (Obando et al., 1999). Nava et al. (1999) evaluated the performance of Bt cotton by sampling and quantifying pink bollworm infestations in four locations of the Comerca Lagurera, Mexico and reported that Bt cotton was highly effective against PBW in the Comerca Lagurera, which has caused a significant reduction in the number of insecticide applications. Armstrong et al. (2000) noticed piercing and sucking predators such as minute pirate bug, Orius tristicolor (White), big eyed bug, Geocoris punctipes (Say), cotton fleahopper, Pseudatomoscelis seriatus (Reuter) and spiders and concluded that Bt cotton might act as a refuge for predatory insects and spiders in large scale. Whereas, Fitt et al. (2000) opined that transgenic Bt cotton acts as a foundation for integrated pest management in terms of integration with beneficial insects, selective chemicals, host plant resistance, cultural control and other tactics. Similarly, Streett et al. (2000) observed the reduced growth rate, higher mortality and lower survival of cotton bollworms when treated with Gemstar (Helicoverpa zea nucleopolyhedro virus) at lower rates on Bt transgenic cotton. The different management practices for Helicoverpa armigera which was resistant to Bt cotton includes, improvement of transgenic Bt crop regulation, protection of natural refuges or non-cotton host plants, use of transgenic cotton with two insecticidal genes and use of IPM tactics with different mode of action in Bt cotton fields (Zhao et al., 2000). Agi et al. (2001) reported that early planted Bollgard cotton had lower bollworm larval population and gives significantly higher yields than late-planted cotton. Thus early planting may be an effective management strategy for Bollgard cotton in North Carolina. Further, Ning et al. (2001) reported that the egg masses in the field of Bt cotton was not different from that in the field of conventional cotton, indicating that the Bt toxin could not avoid oviposition. Integration of Bt cotton as an IPM component has many benefits like reduced broad spectrum insecticide usage, improved control of target pests, better yield and profitability, safer to benefitial insects, humans and environment and lower production cost (Edge et al., 2001). Likewise, Cui et al. (2002) reported that Bt cotton was highly resistant to cotton bollworm and cotton semilooper, but was not effective against aphids, thrips, whitefly, jassids and spider mites. Thus they concluded that through implementation of integrated pest management strategies in Bt transgenic cotton field, non-target pests were controlled effectively owing to the preservation and propagation of natural enemies. Fan Zheng Wang et al. (2002) studied the effect of different sowing dates on the growth and bollworm resistance of cotton variety Bollgard 32B. Results indicated that late sowing during April 22 nd will ensure the nutritional balance, prevents the bollworm resistance and improves the lint yield than in early sowing cotton in Yangty River valley.
29 Patil et al. (2003) reported that growing of genetically modified cotton genotypes with genes for bollworm management (Cry1Ac) have created opportunity for development of efficient IPM strategy to combat the pests successfully. Among the genotypes tested, Bt genotype MECH-184 is well suited for existing adoptable IPM module which involves seed treatment with imidacloprid, application of acetamaprid 20 SP (0.1g/1), okra as a trap crop, Trichogramma release, spraying of 5% NSKE, use of HaNPV and pheromone traps. Tann et al. (2002) demonstrated the use of refuges to reduce the rate at which the moth develops resistance to Bt cotton crops. They identified the refuge options that are economically and logistically feasible under Australian conditions. Moar et al. (2002) noticed more number of beneficial arthropods (Geocoris spp., Orius spp., spiders, parasitic wasps, green and brown lacewings and Nabis spp.) on Bt cotton when compared to conventional cotton, which received synthetic insecticides treatments for controlling tobacco budworm. The seasonal abundance of natural enemies estimated with sweep nets was not significantly affected by Bt cotton in comparison to non-bt cotton and it revealed that no change in the level of predation of eggs of Pectinophora gossypiella and no parasitism was observed in both unsprayed fields of Bt and non-bt cotton as reported by Naranjo and Ellsworth (2002). Naranjo (2002) reported that the natural enemies abundance and overall arthropod diversity was affected by the use of additional insecticides for other pests but not directly by transgenic cotton in comparison with non-transgenic cottons. The population densities of predators in Bt cotton such as lady beetles (Coccinella septumpunctata), Propylea japonica, lacewing (Chrysoperla carnea, Chrysoperla nipponensis and Chrysopa formosa), spiders (Erigonidium graminicolum and Misumenops tricuspidata) and Orius similes were significantly higher than those in conventional cotton fields with insecticide use for the control of H. armigera in mid season (Wan et al., 2002 and Wu et al., 2003). Deng et al. (2003) observed peak population of spiders which increased by per cent, Propylea japonica (Knight) by per cent and Geocoris pallidipennis (Say) by per cent in transgenic Bt cotton+ natural enemies (FNEC) plot. These results suggest that utilization of natural enemies in transgenic Bt cotton would be a valuable addition to the existing IPM technique. Bt cotton expressing Cry1Ac toxic protein would effectively control pink bollworm population which is a key pest in the cotton growing areas of Arizona and Sourthern California for almost 40 years (Henneberry, 2003). Further, he opined that Bt technology is a key stone in IPM component for the eradication effort of PBW. Supporting research and development of highly effective resistance management technology are essential for guarding against the loss of this important technology. Huang et al. (2003) reported that Bt cotton significantly reduced the number of sprayings, the quantity of pesticides used, the level of pesticide expenditure, labour savings, more efficient overall production as well as positive health and environmental impacts in North China. Liu et al. (2003a) reported total number of spiders (3984/100 plants) found in Bt cotton fields. Among them, Erigonidium graminicolum Tickader recorded the highest control of bollworm followed by Achaearanea tepidariorum (Kerch) and Pardosa tinsignata (Simpn). Liu et al. (2003a) studied the ecological effects of mass releasing of Trichogramma chilonis in cotton fields, the biological control effects of this parasite were examined in two transgenic Bt cotton fields. One in which T. chilonios had been released and another in which it has not. The result revealed that the transgenic Bt cotton fields in which T. chilonis had been released, recorded parasitism upto 73.7% and the total number of cotton bollworm larvae, buds and bolls injured were decreased by 61.8 and 33.3 per cent rapidly compared to non-release transgenic Bt fields.
30 Murugan et al. (2003) conducted the laboratory experiment to know the role of Indian transgenic Bt cotton cultivars (MECH-12Bt, 162Bt and 184Bt) in the management of Helicoverpa armigera. The result showed that after 72 hours of feeding on Bt cotton cultivars, the early instars of bollworm recorded 92.8, 66.7 and 51.7 per cent mortality at I, II and III instar stages respectively. These results concluded that, Bt cotton could be an effective strategy in the management of Helicoverpa armigera where it fits into the IPM module. Ma et al. (2003) reported the effect of fertilizer application rate on the major insect population in fields of bivalent transgenic cotton. Results revealed that, oviposition of bollworm (Helicoverpa zea) and larval population in the fields of transgenic cotton tend to be increased with increasing nitrogen application rate, while the population of aphids and spider mites decreased. Vacher et al. (2003) studied High-Dose-Refuge (HDR) strategy, which involves cultivating non-toxic plants (refuges) in close proximity to crops producing a high Bt toxin in order to delay the pest adaptation to transgenic crops. Using population genetic model of selection in a spatially heterogenous environment there was an existence of optimal spatial configuration of refuge that could prevent the evolution of resistance. Bambawale et al. (2004) evaluated the performance of Bt cotton hybrid MECH-162 under integrated pest management (IPM) and compared it with conventional cotton hybrids grown under with and without IPM. The number of bollworm larvae per plant, fruiting bodies damage was lowest in Bt cotton IPM plot. Seven sprays of pesticide were applied for the control of insect pests in conventional cotton without IPM as against three on MECH-162Bt with IPM in a farmer s participatory field trial conducted in Nanded district of Central India. In another study conducted by same group of scientists in 2004 reported that the natural enemies (green lacewing eggs and lady bird beetle adult) population was less in MECH-162 Bt (0.37 and 2.06), lowest in non-ipm conventional cotton (0.26 and 0.69) and almost same (0.37 and 1.23) in MECH-162 non-bt respectively in farmer s participatory field trial at Nandad district of Central India. Bhosle et al. (2004b) reported that under IPM module Bt cotton recorded lower infestation of leafhoppers, thrips, bollworm damage and locule damage and recorded higher predatory populations. The study clearly indicated that Bt cotton is an extremely valuable pest management tool when blended with IPM practices. it will be an essential component in IPM module which will increase the yield substantially in a sustainable way. Further, Bhosle et al. (2004a) opined that one to three sprays were required for Bt cotton throughout the cropping season in managing the bollworms and sucking pests below ETL. They also concluded that need based application of insecticides for pest management in Bt cotton is necessary for harvesting maximum seed cotton yield. Kannan et al. (2004) reported that seed treatment of transgenic cotton with imidacloprid 70 5g/ kg of seeds was more effective than other treatments in keeping the population of leafhoppers, aphids, thrips and whiteflies below economic threshold level upto 40 days after sowing apart from encouraging population of predators viz., coccinellids, Chrysoperla and spiders in transgenic cotton. Biointensive Integrated Pest Management (BIPM) module for Bt cotton was evaluated against sucking pests and bollworms in comparison with recommended insecticidal schedule at Main Agricultural Research Station (MARS) Dharwad. BIPM package includes seed treatment with Trichoderma harzianum (5g/kg of seeds) and release of three days old grubs of Chrysoperla 14,000 ha -1 has recorded the higher natural enemy population and less bollworm damage (12.16%) compared to recommended package (14.58 per cent) (Kulkarni et al., 2004). They also observed the natural enemies population viz., syrphids (9.93%), coccinellids (8.56%) and Chrysoperla carnea (8.56%) and per cent parasitization was significantly higher in Biointensive Integrate Pest Management (BIPM) for Bt cotton compared to recommended insecticidal schedule. Kranthi and Kranthi (2004) developed a stochastic model, the Bt-adapt, to simulate the rate of Helicoverpa armigera resistance development. Lavekar et al. (2004) reported that
31 seeds of three genetically modified cultivars of cotton (MECH-184, MECH-162, MECH-12) and their non-bt counterparts when treated with 7g/kg of seed before sowing could result in reduced jassids and thrips population in all the three Bt hybrids upto 45 days after sowing compared to their non-bt counterparts. Lawrence and Dillon (2004) reported the use of honeybees to deliver baculovisuses (HaNPV) to genetically modified cotton crops to protect flowers from attack by Helicoverpa armigera larvae. During the study, they have modified some changes in the bee hive and bees were forced to pick up a load of HaNPV dust and carry it with them when they visit the cotton flowers thereby protecting the plants from larval attack. Patil et al. (2004a) imposed IPM schedule for both Bt cotton (MECH-184) and popular hybrid (NCS-145) and they indicated that for Bt cotton, IPM components like, seed treatment against sucking pests, pheromone traps, yellow sticky trap for whitefly, installing bird perches, mechanical collection of grown up larvae, use of HaNPV, spraying of botanicals and selective pesticides based on ETL for sucking pests and bollworms were needed under irrigated conditions. The results also revealed that predatory population was relatively high in Bt cotton i.e., 0.40 and 0.27 per plant as compared to 0.29 and 0.14 in NCS-145 hybrid at the above locations. Vennila et al. (2004) reported that cover sprays on 45, 90 and 100 days after seedling emergence with 300 g methyldemeton, 100 g thimethoxam and 825 g endosulfan ha -1 respectively to five RCH transgenic cottons (RCH 12 Bt, RCH 20 Bt, RCH 134 Bt, RCH 138 Bt and RCH 144 Bt) recorded lesser incidence of jassids, whiteflies and bollworm population in RCH 134 Bt, whereas RCH-138 Bt recorded lesser incidence of thrips, whiteflies and bollworms compared to other Bt cotton hybrids. An experiment was conducted to evaluate maize as a refuge for management of resistance to Bt cotton by Helicoverpa armigera (Hubner) in the yellow river farming region of China. The result indicated that maize typically has much higher larval densities than on Bt cotton. Data revealed that maize is probably serving as an effective refuge for third and fourth generation of H. armigera (Wu et al., 2004). Bagade et al. (2005) reported that there was 100 per cent reduction in insecticidal sprays for bollworm control in MECH-184 Bt and MECH-12 Bt as compared to five to seven sprays in non-bt and check hybrid under rainfed conditions. These results indicated that Bt cotton itself could be an IPM tool for the management of bollworms. Lambert et al. (1996) studied the effect of natural enemy disruption in different Bt and non-bt cotton seed blends and reported that larval infestation and damaged fruiting bodies were higher in natural enemy disrupted plots than conserved plots. As the percentage of transgenic cotton increased in seed blends number of live larvae and damaged fruiting bodies decreased and yield increased. Over spraying sole transgenic cotton with λ-cyhalothrin resulted in no significant reduction in larval infestation and damaged fruiting bodies. A green house test by All and Treacy (1997) with transgenic NuCOTN 33B showed that the insect polyhedrosis virus AcNPV-Aalt acted additively with NuCOTN 33B in reducing the cotton bollworm damage. Whereas, the transgenic cotton itself was sufficient to control tobacco budworm infestation. Lambert (1997) observed that Bt cotton, NuCOTN 33B under unusually heavy cotton bollworm, H. zea populations, feeding of 1-4 days old cotton bollworm larvae on bolls of 1 inch or younger far exceeded presumed economic injury thresholds for boll damage. Therefore, synthetic pyrethroid applications were required in order to prevent damage to NuCOTN 33B. Harris et al. (1998) showed that insects such as H. virescens, H. zea, T. ni and S. exigua which survived a prior exposure to Bt were many times more sensitive to a subsequent Karate spray treatment.
32 Roberts and Dugger (1998) recorded bollworm, H. zea, fall armyworm, S. frugiperda and stink bugs as primary insect pests of Bt cotton in Georgia. Applications of Penncap (methyl parathion), Tracer (spinosad) and Karate (λ-cyhalothrin) in late July and early August effectively controlled the insect pests and produced lint yield of 1003, 1025, and 1134 lb per acre, respectively, as against 951 lb per acre in untreated Bt cotton. Hopkins et al. (1998) demonstrated that supplemental application of insecticides like cyfluthrin, azinphosmethyl for boll weevil and imidacloprid for plant bug and aphids gave positive yield response in either Bollard or non-bt cotton. Sadras (1998) opined that incorporation of Bt gene into cotton did not reduce considerable capacity of the crop to tolerate insect damage. This attribute coupled with consistent decline in the efficacy of Bt toxin during the later part of the crop growth and obvious need to protect against non lepidopteran pests necessitated the development of pest management strategies for Bt cotton. Layton et al. (1999) conducted field survey at Mississippi to compare performance of Bt and non-bt varieties. In 1998 Bt fields sustained significantly less boll damage than non-bt fields i.e., 1.86 per cent vs 2.73 per cent and received fewer treatments targeting bollworms, H. zea and tobacco budworm, H. virescens (0.86 vs foliar sprays per acre). However, Bt fields required more treatments for the control of tarnished plant bugs (Lygus sp.) and boll weevil (A. grandis). Other, less common pests that were observed more frequently in Bt cotton include stink bugs and fall armyworm, S. frugiperda. Forty one per cent of the Bt cotton fields in the survey received at least one foliar treatment for control of bollworms. Supplemental foliar treatment of Bt-cotton fields for control of bollworms was more common in the Delta region of the state than the Hills. Sullivan et al. (1998) established treatment threshold of 75 eggs or 30 small larvae (< 0.25 inch) or 3 large larvae (> 0.25 inch) or 5 per cent boll damage per 100 plants in Bt cotton. It was tested in two sets of studies i.e., one with insecticide application in early July to disrupt beneficial species and the other undisturbed. Yield data from disrupted and undisrupted sets indicated that the egg threshold increased the lint yield by 58 and 83 lb per acre, respectively, when compared to the escaped worm threshold. Field survey conducted at Mississippi (Layton et al., 2000), revealed that Bt cotton fields sustained significantly less boll damage by lepidopteran larvae (2.55 % vs 4.81% in non-bt fields) and received significantly fewer foliar insecticide treatments for control of bollworm (H. zea) and tobacco budworm (H. virescens) (1.22 vs 5.18 sprays in non-bt fields). Whereas, in Delta, Bt fields sustained significantly more boll damage due to tarnished plant bug (L. lineolaris) and also received significantly more treatments for control of boll weevil (A. grandis). Similar opinion was reported by Teague et al. (1999). Turnipseed et al. (1999) compared the application of λ-cyhalothrin (Karate ) for bollworm control in conventional cotton and spinosad (Tracer ) as a supplemental control in Bt cotton just prior to the bollworm flight in mid- July. They noticed better control of tarnished plant bugs but, disrupted natural enemies causing season long reduction in geocorids and ants (most abundant predacious arthropod groups). By late July, there was an average of 3.0 large bollworm per foot of row following three applications of Karate to previously treated (disrupted) conventional plots compared to 1.5 large bollworm per foot of row following two applications to previously undisrupted plots. On the other hand, in Bt cotton, there were 6 times more bollworms (0.75 larvae / ft) in disrupted plots after two applications of Tracer than in non-disrupted plots after only one application. Obviously, it was concluded that the use of hard insecticides just prior to bollworm flight should be avoided in both conventional and Bt cotton because their use destroys predacious arthropods, which resulted in more crop damage even with more intensive spraying for bollworm control. Xia et al. (1999) studied, the role of transgenic Bt cotton in integrated pest management in China and reported Bt cotton was highly resistant to H. armigera, but the degree of resistance fluctuated in time and space. Tetranychus cinnabarinus, A. gossypii and T. tabaci replaced H. armigera as the dominant pests.
33 Bell et al. (1999) noticed that the application of pyrethroids (λ-cyhalothrin and cyfluthrin) twice to Bt cotton significantly reduced the bollworm population when compared to the untreated plot. In addition, application of Spinosad (Tracer ) or pyrethroids to Bt cotton numerically reduced the fall armyworm, S. frugiperda when compared to the unsprayed Bt cotton plots. Methyl-parathion and pyrethroid treatments significantly reduced the stink bug population when compared to Tracer and untreated plots. Yield increase was observed in all the three insecticide treatment plots over untreated plot, but the pyrethroid treatment showed a significant increase in yield over the other three treatments. Benson et al. (1999) compared insecticide treated conventional cotton and untreated Bt cotton and reported that input costs were higher in the conventional cotton grown with Tracer / Karate ( $ /ac) as against untreated Bt cotton ($ per acre). Conventional cotton with insecticide application recorded higher yield and given additional income of $27.75 per acre. It was concluded that in an year of heavy insect pressure, Tracer / Karate programme on conventional cotton provided higher return than Bt cotton. Capps et al. (1999) opined that insecticide application to Bt cotton at economically damaging levels of pests provided yield protection. Fitt et al. (2000) opined that transgenic Bt cotton must be viewed as a foundation for integrated pest management (IPM) by blending with beneficial insects and selective chemicals. Hutchison (1999) opined that use of Bt-cotton is likely to be preserved longer if it is implemented within the context of an integrated pest management program rather than as a single tactic. North and Dugger (2000) compared the efficacy of Leverage (cyfluthrin + imidacloprid) and combination of Baythroid (cyfluthrin), and Orthene (acephate) on a multipest complex on Bt cotton and found that both the treatments gave good control of bollworm (H. zea) and tarnished plant bug (L. lineolaris). However, Leverage also gave better control of cotton aphid (A. gossypii) and banded winged whitefly, {Trialeurodes abutiloea (Haldeman)}. Streett et al. (2000) assessed the effect of Bt cotton and H. zea NPV (Gemstar LC ) interaction on cotton bollworm. Bt cotton caused an additive mortality response in cotton bollworm, H. zea when combined with H. zea NPV (Gemstar LC ). Field studies revealed that larval counts of H. zea were significantly lowest in Bt cotton + virus treatments compared to Bt cotton or NPV treatments alone. Micinski (2001) demonstrated the relationship between bollworm pheromone trap catches and yield differences in Bt cotton and found highly significant linear correlations for July, July through August, and June through August periods. Significant quadratic relationship between yield differences and trap catches existed for the August time period. So, the study demonstrated the importance of bollworm control in Bt cotton during the periods of high bollworm pressure. Brickle et al. (2001) studied the efficacy of insecticides of different chemistries against H. zea in Bt cotton (NuCOTN-33B and DP-458 B/RR) and conventional cotton (DP-4515 and DP-4515RR) and opined that only spinosad and thiodicarb controlled H. zea in non-bt cotton, whereas, other insecticides were less effective. However, H. zea which showed high resistance to pyrethroid insecticides was effectively controlled with λ-cyhalothrin, in dryland Bt-cotton. Even the reduced rates of λ- cyhalothrin, spinosad and thiodicarb were effective for the control of H. zea in dryland Bt cotton. Under protected conditions, MECH-184 Bt recorded significantly higher seed cotton yield (28.47 q/ha) compared to other Bt cotton hybrids (Khadi et al., 2002). Patil et al. (2003) evaluated the adoption of Bt cotton hybrids with IPM modules under rainfed cotton. Sucking pests were lowest in all Bt cotton hybrids with IPM module compared to recommended package of practices (RPP). Per cent fruiting bodies damage and locule damage in Bt cotton hybrids was lower under IPM compared to RPP. The least fruiting bodies damage and locule damage of 5.01 and 5.59 per cent, respectively was recorded in
34 MECH-184 Bt with IPM. The highest seed cotton yield of q per ha was recorded in MECH-184 Bt under IPM module (24.65 q/ha) followed by MECH-184 Bt under RPP (22.38 q/ha). In Trichogramma chilonis (Ishii) released Bt-cotton, parasitization of the third generation of cotton bollworm eggs reached 73.7 per cent, similar to that in the non-bt cotton IPM field. The total number of cotton bollworm larval injury to buds and bolls in T. chilonis released Bt-cotton field was decreased by 61.8 and 33.3 per cent, respectively compared to the non-release transgenic Bt cotton field (Liu et al., 2003). Gore et al. (2003) while evaluating Bollgard II against bollworms indicated that the supplemental insecticide applications may be necessary to prevent yield losses on Bollgard cotton but, Bollgard II require minimal or no insecticide against bollworms. Ghosh (2001) opined that Bt cotton provided very effective control when target pest populations are normal or low, when pest infestation was high, one to two supplemental sprays for target pests were required based on ETL. A report from Maharashtra indicated an average of 5 to10 per cent infestation of leafhopper, aphids, and whiteflies and 3 to 5 per cent infestation of thrips both on Bt and non- Bt cotton varieties. Bollworm infestation was marginally less on Bt cotton than on non-bt cotton versions. Bt cotton varieties recorded lower incidence of American bollworm (1.5 to 2.0 larvae / plant) and pink bollworm (0.07 to 0.1 larvae / plant) compared to non-bt cotton varieties. Bt cotton varieties recorded 16 to 60 per cent increase in yield over its non-bt versions (Anonymous, 2004a). 2.7 SOCIO-ECONOMIC ADVANTAGE OF Bt COTTON CULTIVATION Luttrell and Herzog (1994) opined that transgenic Bt cotton could reduce input of chemical insecticides but the amount of reduction will vary from region to region. Further, they stated that the combined influence of boll weevil eradication and commercial release of Bt cotton would be a major opportunity to produce cotton with reduced insecticide inputs as part of an integrated pest management (IPM) strategy. Davis et al. (1995) evaluated the performance of Bt cotton (DPL-5415) against budworm, H. virescens and bollworm, H. zea and compared it with insecticide treated non-bt cotton (DPL-5690). The results showed that non-bt cotton received an average of 5.5 insecticide treatments for the budworm / bollworm complex. Bt cotton had an average reduction of $ in control costs and an average of 198 lb per acre more lint yield than the insecticide treated non-bt cotton. Based upon the grower survey it was reported that number of insecticide application (pyrethroids) was 0.58 times in Bollgard (NuCOTN-33B ) fields as against 3.06 times in conventional fields (Bacheler et al., 1997). Carlson et al. (1998) reported that in USA, Bt cotton growers produced 11.4 per cent higher yield than conventional cotton growers. In addition, Bt cotton plots require 72 per cent less insecticide and resulted in 155 per cent higher return on the seed investment. Greene et al. (1998) demonstrated that treatment with methyl parathion at a threshold of one stink bug per six feet of row provided adequate protection to developing bolls in Bt cotton and produced significantly higher seed cotton yield of 2588 lbs per acre than untreated control (662 lb/acre). Field studies in Mississippi by Stewart et al. (1998) revealed that Bt cotton cultivars recorded higher yield and lower insect control costs than the conventional cultivars. Compared to conventional cotton the usage of insecticides in Bt cotton was decreased by 60 to 80 per cent (Xia et al.,1999). Cooke et al. (2000) reported that difference in insect control costs was slight between conventional cotton and Bt cotton during 1999, when insect pressure was less. During 1998, a heavier tobacco budworm incidence resulted in significant reduction in insect control costs for Bt cotton. Layton et al. (2000) reported that Bt cotton fields in Mississippi sustained significantly less boll damage of 1.48 per cent compared to 3.44 per cent in non-bt
35 cotton fields. Bt cotton fields, received fewer foliar insecticide treatments of 0.44 compared to 2.47 treatments in non-bt cotton fields for the control of bollworm and tobacco budworm. Venugopal et al. (2002) reported that Bt cotton (MECH-184 Bt, MECH-162 Bt and MECH-12 Bt) required only one or two insecticidal sprays thus, saving plant protection cost to the extent of Rs per ha. The total economic benefit from Bt cotton hybrids, MECH-184 Bt and MECH-162 Bt was around Rs.10,000 per ha. The data collected by Qaim and Zilberman (2002) from 157 farms in India during 2001 revealed that on an average Bt hybrids were sprayed three times less against bollworms than non-bt counterparts and popular checks. There was no significant difference in the number of sprays against sucking pests such as aphids, leafhoppers, and whiteflies. Overall, Bt cotton plots required 70 per cent less insecticide load, saving US $ 30 per hectare. Under Indian conditions, bollworms pressure was very high with an average crop damage of 60 per cent on the conventional trial plots in So, the average increase in yield of Bt cotton hybrids over their non-bt counterpart and popular check was 80 and 87 per cent, respectively. Five years survey of Bt cotton growers in Yellow river cotton growing region in China by Pray et al. (2002) indicated an increase in yields of Bt cotton. Yield of Bt cotton during 1999, 2000 and 2001 was 3371, 2941 and 3481 kg per ha, respectively as against 3186, 1901 and 3138 kg per ha in non-bt cotton varieties. Pesticide applications were 11.8, 20.5 and 32.9 kg per ha in Bt cotton plots as against 60.7, 48.5 and 87.5 kg per ha in non-bt cotton plots during 1999, 2000 and 2001, respectively. The total production cost for Bt cotton was much less than in non-bt cotton, there by Bt cotton varieties recorded higher net revenue. The overall reduction in use of insecticides for the bollworm / tobacco budworm complex and pink bollworm was more than 2 million lbs in 1998 and 2.7 million lbs in The reduction was to the extent of 1.5 to 3.0 treatments per acre. Overall, insecticide reduction in Bt cotton was 60 per cent in Arizona, Albama, Lousiana states, 60 to 80 per cent in China and 43 to 57 per cent in Australia. There was a nine per cent increase in yield with Bt cotton and inturn $ 99 million increase in revenue. In China, economic benefit of Bt cotton was about $ 250 per ha (Shelton et al., 2002). Fitt (2003) assessed the impact of transgenic Bt cotton (Ingard ) in Australia over a period of six years. Overall, Bt cotton has reduced pesticide application against bollworm, H. armigera and H. punctigera to an average of 56 per cent. There has been no significant change in pesticide applications for minor pest groups. On an average, the greatest reduction in sprays has been during the squaring (flower bud) and flowering stage of crop development (50-67%). Whereas, reduction during boll filling and opening have been more modest (20.35%). He also recorded significant increase in yield potential and fiber quality in Bt cotton (Ingard ) (6.83 to 9.21 bales / ha) compared to conventional cotton. Economic benefit from Bt cotton was similar to conventional cotton initially. In the last two years net economic returns from Ingard varieties have been considerably higher at over $ 300 per ha due to better performance of variety and better management experience. Bryant et al. (2003) studied the performance of different transgenic and nontransgenic cultivars and reported that in three of the five site-years, yield was not statistically different for most or all of the cultivars tested. So, the cultivar with the least cost resulted in the greatest returns. Among the cultivars, cost of production was least in glyphosate-resistant cultivar followed by the conventional cultivar, stacked gene cultivar (Bt gene + glyphosateresistant gene) and Bt cultivar. So, profit maximization was associated primarily with yield and secondarily with cost of pest control. Patil et al. (2004a) compared the performance and economics of Bt cotton cultivation (MECH-162 Bt in and MECH-184 Bt in ) in irrigated ecosystem. Population of sucking pests such as aphids, leaf hoppers, whiteflies and thrips did not vary much amongst Bt and non-bt hybrids so, they required 2-3 foliar sprays in addition to seed treatment in both Research Station and farmers field. Number of H. armigera larvae, per cent fruiting bodies damage and per cent rosette flowers due to pink bollworm was significantly low on Bt cotton hybrids in both the seasons. Hence, the number of interventions required against
36 bollworms was nil and one spray in Bt cotton, as against 2 to 6 and 9 sprays in non Bt / local hybrids during and , respectively. As a result of less pesticidal application Bt cotton fields recorded more predatory populations compared to non-bt and local hybrids. During , MECH-162 Bt recorded significantly higher yield of q per ha with a net profit of Rs. 35,000 in Research Station and significantly higher yield of q per ha with a net profit of Rs. 33,802 in the farmer s field than non-bt and local hybrid. Similarly, during , MECH-184 Bt recorded cotton yield of q per ha with a net profit of Rs. 41,332 in Research Station and q per ha with a net profit of Rs. 40,090 in the farmer s field.
37 III. MATERIAL AND METHODS The hypothesis and the objectives considered for investigations in transgenic Bt cotton involved both field and laboratory studies. All the experiments were carried out at Agricultural Research Station, Dharwad (Hebballi) farm, Dharwad during and seasons. Agricultural Research Station, Dharwad is situated in the northern transitional region (zone-8) of Karnataka between 15 07' N latitude 76 06' E longitude with an altitude of 678 on above MSL. The total rainfall received during 2004 was mm with 56 rainy days, which was equal to last 68 years average. During 2005, mm precipitation was distributed in 80 rainy days which was higher than previous 24 years average (729.7mm). Meteorological conditions prevailing for experimentation period has been presented in Appendix-I. The soil of the experimental site was medium deep black and clayey in nature well suited for cotton cultivation and termed as Russian carpet. In general the crop growth was good and the incidence of insect pests was moderate to high depending on rainfall. The crop husbandry practices remained uniform for all field experiments during both the seasons and were as per the standard package of practices recommended by the University (Anonymous., 2004b) except for protection against insect pests. The rest of the details pertaining to different experiments have been presented clearly with material details and methodology objective wise here under. 3.1 EVALUATION OF DIFFERENT Bt COTTON GENOTYPES WITH ONE AND TWO CRYSTAL PROTEIN GENES The experiment consisted of seven different new Bt transgenic plant incorporated protectant cotton with genes coding for either Cry1Ac or Cry1Ac + Cry2Ab. These genotypes were compared for their reaction against bollworms both in unprotected (UP) and ETL based protection (P) conditions in comparison with conventional (non-bt) commercial cotton hybrids DHH-11 and DCH-32 as well as commercial transgenic cotton hybrid RCH-2 Bt. The test genotypes used for the investigations were interspecific and intraspecific hybrids. The details of genotypes have been presented in Table Design and layout The experiment was laid out in split-plot design with three replications. There were 2 main plots (Un protected-up and protected-p) each comprising of 10 genotypes as sub plots. The main plot was having 45 x 5.4 m2 size accommodating 10 sub plots with 4.5 m x 5.4 m each. The space between each main plot was 2.4m. The replications were placed 3.0 m apart Sowing, crop maintenance and harvest Different genotypes under experimentation were dibbled 90 cm apart with intra row spacing of 60 cm on and for respective seasons. In each sub-plot 60 plants were maintained with gap filling and thinning after a week of initial sowing. The fertilizer application was at the rate of 80:40:40 in the form of Urea, DAP and MOP with two splits of N. Crop was kept weed free through regular intercultural operations and hand weeding. Harvesting of seed cotton from each subplot was done as a single picking on and for respective seasons.
38 Table 1: Details of Bt cotton genotypes evaluated for comparative performance Sl. No. Genotypes Cultivar type Transgenic Generation Insecticida l Gene Proprietary Sector 1. RCH 368 Bt H x H I Cry1Ac Rasi seeds Co Ltd Atur (TN) Private 2. RCH 362 Bt H x H I Cry1Ac Rasi seeds Co Ltd Atur (TN) Private 3. MRC 6322 Bt H x H I Cry1Ac Mahyco Jalna (MS) Private 4. MRC 7201 Bt H x H II Cry1Ac + Cry2Ab Mahyco Jalna (MS) Private 5. MRC 6322 Bt BG-II H x H II Cry1Ac + Cry2Ab Mahyco Jalna (MS) Private 6. MRC 6918 Bt H x B I Cry1Ac Mahyco Jalna (MS) Private 7. RCH-708 H x B I Cry1Ac Rasi seeds Co Ltd Atur (TN) Private 8. RCH-2Bt (check) H x H I Cry1Ac Rasi seeds Co Ltd Atur (TN) Private 9. DHH-11 (check) H x H UAS, Dharwad Public 10. DHH-32 (check) H x B UAS, Dharwad Public
39 3.1.3 Plant protection against sucking pests The plant protection measures for entire experimental setup was uniform for both years against sucking pests. Before sowing the seeds of each genotype was treated with Imidacloprid g /kg to check the incidence of sucking pests. Later one application of acetamiprid g ai/ha was given between DAS to check the buildup of thrips and also to take care of trace incidence of leaf hoppers and aphids in both main plots based on ETL Plant protection against bollworms There was absolutely no protection rendered against bollworms for any genotype in un protected (UP) main plot with an aim to know the season long incidence and damage due to bollworms and its influence on yield of seed cotton under zero protection. In the protected main plot (P) the protection against bollworms was offered based on ETL (1.0 larvae/plant) in each genotype. The insecticides preferred for protection were in the consecutive order of cypermethrin g ai/ha (first spray). profenophos g ai/ha (second spray) and quinalphos g ai/ha (Third spray) as per ETL based warranty in each Bt genotype. In conventional hybrids, the sequence of protection remained endosulfan g ai/ha, chlorpyriphos g ai/ha, indoxacarb g ai/ha, cypermethrin g ai/ha, profenophos g ai/ha and quninalphos g ai/ha. The protection rendered in this main plot was aimed to know the number of sprays required to get the maximum possible yield from each genotype with ETL based protection. The spray volume requirement was 1000 l/ha, which was applied through knap-sac sprayer operated manually Data collection and presentation Comparative performance of different genotypes for their resistance to bollworms deserved various season long observations on different insect related parameters in each genotype irrespective of protected condition. All the observations were made on randomly selected 10 plants per genotype avoiding border row plants Larval incidence The larval incidence of spotted bollworm (Earias vitella F.) was recorded on 50 and 65 DAS (days after sowing) on whole plant basis in each genotype and presented as number of larvae/ plant at respective day of observation and average of all observation as seasonal mean. Similarly incidence of H. armigera (Hubner) larvae was also made on whole plant basis at 65, 80, 95, 110, 125 and 140 DAS. The data have been presented as number of larvae/ plant for respective days as well as average (seasonal mean) incidence Fruiting body damage (%) The damage to fruiting structure (squares/ flowers/ bolls) was recorded at 50, 65, 80, 95, 110, 125 and 140 DAS based on the number of total as well as damaged fruiting bodies on each plant. The fruiting structures both shed and intact were taken into account to calculate the damage. The damage was expressed in percentage and presented for each date of observation and seasonal average. Damaged fruiting bodies Fruiting body damage (%) = 100 Total number of fruiting bodies
40 Observation on pink bollworm incidence Flower rosetting was observed at peak flowering (60-75 DAS) for each genotype by counting the total of number of flowers per ten plants and the number of rosetted flowers amongst them. Data was presented as per cent flower rosetting. The number of PBW larvae per 10 green bolls was recorded by actually plucking 50 bolls randomly from the subplots and counting the number of larvae in each boll by dissecting the boll. The destructive sampling for larvae has been done around 115 DAS of the crop. Similarly, immediately after harvesting the crop 50 bolls from each genotype were collected and counted for total and damaged locules due to PBW infestation. The data has been presented as per cent locule damage to each genotype Yield parameters and seed cotton Before picking of seed cotton, number of good opened bolls (GOB s) and badly opened bolls (BOB s) were recorded from 10 randomly selected plants. The data have been averaged to per plant and presented as GOB / plant and BOB / plant. The seed cotton harvested from each sub-plot (genotype) excluding border rows was extrapolated and presented as seed cotton yield (q/ha) for respective treatment. The data generation on larval incidence and damage to fruiting structures over season with respect to each bollworm species and its presentation remained same for both seasons. The data on average larval incidence, damage, PBW parameters, GOB, BOB and yield were only considered for pooled analysis. 3.2 ASSESSMENT OF CHANGES IN Cry PROTEIN EXPRESSION IN Bt TRANSGENIC PLANTS The experiment involved raising of RCH-2 Bt (BG-I and BG-II) crops in the field and assessment of expression through bio-assay as well as estimation by ELISA (enzyme linked immuno sorbent assay) method over the season Insect culture Test insect culture of H. armigera, E. vittella, Pectinophora gossypiella (Saunders). and Spodoptera litura (Fabricius) was established by following standard procedures developed by different authors and laboratories American bollworm, Helicoverpa armigera The larvae of H. armigera were collected in TNAU model 32 well tray during October- November 2003 and 2004 from farmers field surrounding ARS, Dharwad to initiate the culture. The larvae were reared on squares (natural diet) of cotton plucked from unsprayed crop maintained at research farm. Once the larvae reached prepupal stage, all of them were placed in bread box having sand and saw dust mix bedding material for pupation. Later pupae were collected and washed in 0.2 per cent sodium hypochlorite solution and rinsed with distilled water. Then pupae were placed in large sized plate (9 dia) with wet sand at the bottom and shifted to cages of 45X45X45 cm for adult emergence. Adult diet containing honey (5%) sucrose (5%) ascorbic acid (0.02%) and methyl hydroxy parabenzote (0.02%) was prepared and furnished in sterile glass vial plugged with sterile absorbent cotton swab. Five pairs of healthy adults were released for oviposition in PDBC model cylindrical cage enclosed in cloth cover (Kumar and Ballal, 1990). Four such oviposition cages were maintained. The cages were checked daily and cloth containing eggs were dipped in small bucket containing pure water added with 0.1 percent sodium hypoclorite solution. Then water containing eggs poured to another bucket through a sterile muslin cloths. The muslin cloth containing eggs was spread inverted over a wide mouth plastic box with help of rubber band. Once larval emergence started, the neonates were shifted to multicellular insect rearing tray (50 well) at the rate of two/ well containing semi synthetic wheat germ based diet (Appendix- II). Once the larvae reach third instar, then reared individually in similar trays in semi synthetic
41 chickpea based diet (Appendix-III). Thus, healthy and disease free laboratory culture was initiated from the field collection. After rearing for two generations in laboratory, the culture was used for bio assay studies Spotted bollworm, Earias vittella The rearing procedure for E. vittella remained same as that of H. armigera with limited variations. Stock culture was developed by collecting the larvae from farmer field growing conventional cotton or okra during May-June 2004 and Larvae were washed with sodium hypochlorite solution (0.2%) and maintained through feeding on tender okra fruits till pupation. The pupae were placed in small plastic container (10.0 x 25.0 cm) with multilayer semi-wet filter paper bed for oviposition. Two cotton swab rolls dipped in 10 percent honey solution were provided as food. Then eggs were washed down to muslin cloth after dipping in pure water having 0.1 percent sodium hypochlorite solution. Further cloth with eggs was spread on a container having slices of okra fruit so that immediately after hatching larvae could move to natural diet. These neonates were transferred to culture trays containing semisynthetic diet (Appendix-IV). The larvae were maintained on the diet for a week and then transferred to okra for feeding till pupation. Again emerging moths were released in oviposition jars and allowed to lay egg in cloth strips. Eggs were harvested daily and subjected for consecutive rearing steps. Due to absence of cannibalism larvae were handled in large group initially and groups of 2-5 at late stage. The larvae from F 2 generation onwards were used for bioassay. The procedures adopted were as per Tamhankar et al., (1992) and Deeba et al. (2003) with partial modifications as per convenience Pink bollworm, Pectinophora gossypiella The culture of pink bollworm was maintained by collecting the non-diapausing larvae from the field during November-December months of 2003 and 2004 and reared up to pupation in bolls of DCH-32. Then the pupae were washed in 0.1 per cent sodium hypochlorite solution followed by distilled water wash and placed in emergence cage with adult diet provision. The cage was provided with twigs of cotton seedlings nipped and inserted in bottle containing water. Adults after emergence and mating laid eggs and the larvae were shifted to a petriplate tightly secured with lid lined with non absorbent cotton wool along the circular edge of the plate. The petriplate was provided with semisynthetic casein rich diet specially prepared for PBW (Appendix-V). The larvae reached pupation in days. Pupae were collected again and subjected for next generation rearing. Larvae from F1 and F2 generations were used for bio-assay studies. The procedure suggested by Adkisson et al. (1960), Navarajan Paul et al. (1987) were followed to rear pink bollworm Tobacco caterpillar, Spodoptera litura Culturing of S. litura was done by establishing initial stock culture from the larvae collected from groundnut fields during Feb-March The procedure remained same as that of H. armigera, however the handling of the larvae was in masses for early instars and in individually in late instars. Leaves of castor were provided as food throughout rearing. The initial stages were reared on bouquets of castor leaves and after a week transferred to pet jars containing castor leaves till pupation. The oviposition, egg brushing and other procedures remained same. Here the eggs were deposited in mass and each mass was placed in large size (3.0 x 10.0 cm) Naveen box having netted lid. Each day fresh leaf was placed over the leaf containing egg mass. Immediately after hatching the larvae crowded on fresh leaf and shifted for further rearing in small jars/ buckets. The larvae of F 1 and F 2 generation were used for bio-assay.
42 3.2.2 Bio-assay for assessment of changes in expression pattern of Cry1Ac and Cry1Ac + Cry2Ab Season long changes in the expression of Cry protein was assessed using bio-assay method for both the seasons. The crop was raised separately in 6.3 x 6.0 m block without any plant protection measures but for seed treatment with imidacloprid 10 g/ kg. For Cry1Ac, RCH-2 Bt was used for both seasons and seeds were sown on and for respective seasons. The seeds of RCH-2 (non-bt) were also sown for control treatments. The expression studies for second generation transgenic RCH-2 BG-II with Cry1Ac + Cry2Ab genes was sown on The part of the plant required for study were collected at definite interval and carried to laboratory for bio-assay. The bio-assay was carried out in laboratory by leaf feeding method for H. armigera and S. litura. Squares were used for E. vittella and tiny bolls for P. gossypiella. In all cases, 2 days old neonates were used for bio-assay (Plate-1). The larvae were released (1/well) on leaf disc of 2.0 cm diameter and closed tight with serene wrap and lid. The discs were changed on each day. The leaf discs were placed on semi-wet filter paper disc of similar size to avoid drying of test material. Rearing trays of 12 and 50 well were used for bio-assay. Small plastic cups and pet jars were used for assessment with squares and bolls. The squares and bolls were placed in the jars/ cup having 0.5 percent solidified agar solution at the bottom for maintenance of moisture. The lid of the jar/ cup was closed tight after releasing the larvae at the rate of one per square or boll. The mortality of the larvae at 24 hours interval till seven days was recorded and converted as percent mortality. This value of mortality was corrected using mortality in the control treatment (RCH-2 non-bt) and only corrected mortality in each treatment were considered for analysis. In each treatment there were 10 larvae replicated 4 times. The bioassay was carried out at 45, 60, 75, 90, 105, 120 and 135 DAS during 2004 and at 40, 60, 80, 105 and 120 DAS during Quantification of Cry1Ac and Cry2Ab proteins Quantification of Cry1Ac in RCH-2 Bt and Cry1Ac as well as Cry2Ab in RCH-2 Bt BG-II was done using commercially available Quan-T ELISA plate kits from Desi-Gen, Jalna, Maharashtra. The samples viz., third leaf from the top attached to main stem, square and bolls (both from top canopy) were collected (from the crop raised for bio assay purpose) in ice box and carried to laboratory. About mg of each sample was trimmed off and separated for further analysis. Weighed samples were taken in microfuge by adding standard extraction buffer 500 µl (furnished in the kit) and then macerated for 10 minutes. Macerated samples were subjected for centrifugation at 3000 rpm for 30 seconds, after 10 min time gap same sample was subjected for second round centrifugation at 8000 rpm for 30 sec. Then the supernatant was extracted and stored at 4 C. Before loading the sample extract to plate the positive and negative standards were diluted with standard buffer (both provided in kit). Before loading, ELISA plate was washed 2-3 times with standard buffer with multi channel pipette. Then standards were loaded to the plate (three each). Later samples stored at 4 C were diluted 1:1000 with standard buffer and loaded to plate (250 µl each sample). Then the sample in the plate was washed with conjugate buffer and the plate was incubated at room temperature for 30 min for colour development. Then the plate was subjected to ELISA reader. Based on absorption values the quantification of Cry protein was assessed with help of sigma plot version 8.01 programme.


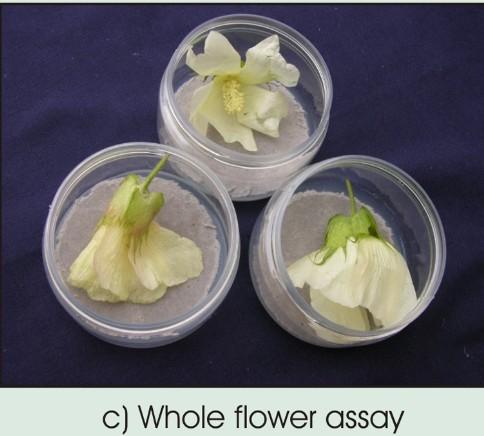
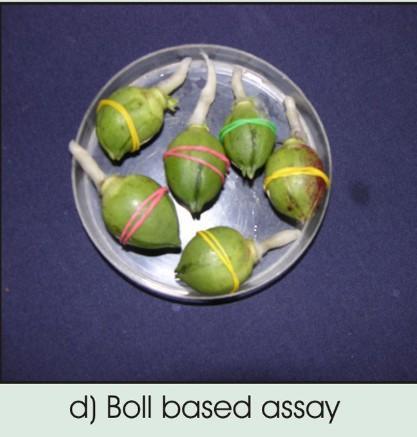
43 Plate 1 : Bioassay procedure for bollworms
44 3.3 ASSESSMENT OF Cry PROTEIN EXPRESSION AND CONCENTRATION IN DIFFERENT PARTS OF TRANSGENIC PLANTS The assessment of intra plant variation in expression of insecticidal protein was assessed through bioassay and ELISA methods as explained in 3.2. The various parts used for the study were leaf (top, middle and bottom), square (45-60 days) flower (60-70 days) boll rind (70-90 days) and terminal portion of stem (45-50 days). The test insects were first instar larvae H. armigera and E. vittella. For each treatment 10 larvae were used and was replicated four times. The data was presented as percent corrected mortality with respect to RCH-2 non- Bt fed control assay. 3.4 COMPUTATION OF EIL FOR Helicoverpa armigera INCIDENCE FOR Bt COTTON Experimental lay out Working out of economic injury level (EIL) for H. armigera involved caged condition field experiment involving split plot design. The cultivar used for computation of EIL was commercially available largely adopted transgenic hybrid cotton RCH-2 Bt. Seeds were treated with imidacloprid 70 WS 10 g/kg before sowing. One application of acetamiprid g ai/ha was done at 30 DAS. Crop was sown at 90 cm x 60 cm spacing in four series of 14 small blocks of 2.7 m x 1.8 m size each accommodating 16 plants. The date of sowing was and for respective seasons. In each block 12 plots were sown with RCH-2 Bt and rest two with RCH-2 non-bt hybrid seeds. This each block was considered as a replication and each small plots were taken into account for imposing 14 different treatments. Out of these four blocks, a set of two blocks was considered as a replication. Within replication (set of two blocks) one block was earmarked for unprotected condition (UP) where no protection against bollworm rendered. The other block was earmarked for protection in each treatment based on ETL (10% damage) against bollworms. The treatment details of experiments have been given in Table Experimental unit. Though each plot was having 16 plants only, four plants centrally located (with in plot) were considered as a unit for each treatment. These plants were caged together under a nylon mesh of 2.0x2.0x2.5 m size (Plate-2) supported on bamboo sticks. Caging was done on 35 DAS and maintained till harvest of the crop.
45 Table 2: Treatment details for calculation of EIL in Bt cotton Treatment No. T1 T2 T3 T4 T5 T6 T7 T8 T9 T10 T11 T12 T13 T14 Treatment detail (Population level) 0.50 larva /pl (ES) on RCH-2 Bt 1.00 larva /pl (ES) on RCH-2 Bt 2.00 larvae /pl (ES) on RCH-2 Bt 3.00 larvae /pl (ES) on RCH-2 Bt 4.00 larvae /pl (ES) on RCH-2 Bt 5.00 larvae /pl (ES) on RCH-2 Bt 0.25 larva /pl (LS) on RCH-2 Bt 0.50 larva /pl (LS) on RCH-2 Bt 0.75 larva /pl (LS) on RCH-2 Bt 1.00 larva /pl (LS) on RCH-2 Bt 1.50 larvae /pl (LS) on RCH-2 Bt 2.00 larvae /pl (LS) on RCH-2 Bt 1.00 larva /pl (ES) on RCH-2 Bt non-bt 1.00 larva /pl (LS) on RCH-2 Bt non-bt * ES: Early Stage LS: Late Stage Larval instars under experiment for computation of EIL There were two stages of larval instars considered for working out of EIL of H. armigera. Early instar larvae termed here as ES (Early stage) were used for graded infestation per plant starting from 0.5 larvae to 5.0 larvae/ pl. Thus, ES accounted for 6 treatments (T1 to T6) in the experiment. The exact stage of larvae considered for treatment were two day old larvae measuring 2.00 mm approximately with dark coloured body. Similarly late instar larvae (called LS) also considered for working out EIL which accounted for another 6 treatments (T7 to T12) starting from 0.25 to 2.0 larvae/plant. The exact stage considered for late instar treatments was early fourth instar measuring approximately 10.0 mm with yellow/ green slender body Non-Bt component for comparison. The treatments 1 to 12 were imposed on RCH-2 Bt crop. There were two more treatments in the experiment one with early stage larvae (T-13) and other with late instar larvae (T-14) released on RCH-2 non-bt. Thus treatment 13 and 14 were included for having data on damage rendered by early and late stage larvae at currently adopted standard ETL for cotton i.e., 1.0 larvae/ plant. At any stage of the crop or for total impact T1 to T6 could be compared with T-13 and similarly T7 to T12 with T-14.
46 3.4.4 Hypothesis considered for working out EIL The hypothesis considered for working out EIL with respect to H. armigera larvae on Bt cotton (RCH-2Bt as candidate) was based on the graded infestation of early and late stage larvae and the damage to fruiting bodies. At present in principle, the EIL has been either 1.0 larva or 1 egg per plant or 10.0 percent damage to fruiting bodies. It has been quite convincing and accepted so far that Cry1Ac protein is most effective against early instar larvae compared to late instar. Further the fall in expression led to survival and growth of bollworm at later part of the season. Thus it could be quite possible that the EIL requirement change with stage of the larvae and age of the crop. Thus, an incidence level from 0.50 to 5.00 larvae of early instar and 0.25 to 2.00 larvae of late instar have been considered. Due weightage for feeding potentiality of late instars has been given and maximum allowed larval incidence was limited to 2.0/ plant Critical factor in the hypothesis and experimentation At a given stage of larval incidence created artificially and crop stage irrespective of treatment, 10.0 per cent damage to fruiting bodies has been considered as limiting factor. Any treatment crossing this limit warranted for control measure and gained protection in protected block (main plot-p) only. Respective treatment in unprotected block was allowed to witness maximum possible damage at given level of incidence Treatment and observation procedure The larvae (from lab culture) of respective stage as per the requisites of each treatment were released with the help of zero number camel hair brush slowly on to a square bud, precisely between bud and bract. Such releases were made at 45, 60, 75, 90, 105 and 125 DAS in all treatments (T1 to T14) and in both unprotected (UP) and protected (P) blocks. Then a convenient period of 10 days was allowed to cause damage in each treatment. Exactly after 10 days of each release, observations were recorded for total fruiting bodies and damaged fruiting bodies (both intact and shed) for all the four plants in the cage. This was converted into per cent damage for that day of observation. At the same time, observations on number of larvae living (surviving) in each treatment was also recorded. The larvae thus found were removed from the treatments to avoid accrued effect with subsequent release. The data on number of larvae were presented as per cent survival with respect to released number. Further all the damaged bodies were removed from the treatment plot (cage) and the crop in each treatment was allowed to bear undamaged fruiting bodies only at the time of subsequent release. Thus there was 10 days action time between release of larvae and impact assessment i.e., observation on damage and survival. Five days of clean up time was also there between subsequent releases. Therefore, period of observation fixed was 55, 70, 85, 100, 115 and 135 DAS. Observations were also made at harvest for number of good opened bolls in all four plants of each treatment and presented as GOB/ pl. The yield of seed cotton from all the four plants were harvested together and presented as g/ plant as well as q/ha after extrapolation which was essential for further calculations.
47 3.4.6 Correlation between pest incidence and damage and yield The correlation coefficient between the variables, population level of the pest and yield (in unprotected block) were worked out using the formula r = N Σxy Σx Σy [NΣx 2 (Σx) 2 ] [NΣy 2 -(Σy) 2 ] Where N - The total number of observations x - The population levels of larvae/ plant y - The yield of seed cotton EIL based on graded infestation and gain threshold Gain threshold and loss per larva were worked as per the procedure given by Stone and Pedigo (1972) and modified by Ogunlana and Pedigo (1974) Gain threshold = Management cost (Rs/ha) Market value of the produce (Rs/q) The management cost was calculated using the cost of protection based on insecticide application and cost of host plant resistance of Bt seeds which accounted to be Rs.2,025/ ha as given in appendix VI. The market value of the produce was considered as Rs 2,100/ q based on two seasons market price prevailing at APMC, Dharwad. Thus gain threshold was 0.79 irrespective of stage of the instars used under study. The regression coefficient (b) between the variables, population level of the pest and yield in unprotected block were worked out using the formula, Σ xy - b = Σx 2 - Σx. Σy N (Σx ) 2 N Where x = Number of H. armigera larvae released per plant Y - Seed cotton yield (q/ha) N- Number of observations Then, the EIL was computed based on the formula EIL = Gain threshold (GT) Yield reduction (q/ha) per larva (b)


48 Plate 2 : A view of field experiment for computation of EIL for H. armigera in Bt cotton Plate 3 : Field view of IPM module for Bt cotton
49 3.4.8 Economic advantage due to pest control The economic advantage due to management of H. armigera whenever it has crossed 10.0 per cent damage in protected block was computed to know the profitability. For any given treatment economic advantage should be more than cost incurred for protection. Thus net returns in protected and unprotected plots of each treatment have been compared as per suggestions of Dent (1991). 3.5 STUDIES ON IMPACT OF TRANSGENIC CULTIVARS ON NATURAL ENEMIES OF COTTON PESTS Impact of Bt cotton on natural incidence of insect predators The studies on natural incidence of insect predators and aphids were carried out through field experiments conducted during and using RCH-2Bt. The crop was sown on and for respective seasons in an un replicated block of 10.8 X 6.0 m 2 size with 90 cm x 60 cm spacing. Similarly a block of RCH-2 non-bt was sown at the same time for comparative study. Including seed treatment no plant protection measures were imposed on any block or any period of crop growth during both the seasons. Between Bt and non-bt blocks an isolation distance of 10 meters was maintained to avoid migration effect. Observations were recorded from 10 randomly selected plants at weekly interval from July to December (28 th to 51 st SW) for incidence of aphids (host insect) predators viz., coccinellids, green lace wing and hover flies. The population of aphids was recorded by counting the nymphs on three leaves, one each from top, middle and bottom portion of plant and then averaged as population per leaf. Similarly adults and nymphs of coccinellids, grubs of Chrysoperla carnea Step. and maggots of syrphids were recorded on whole plant basis and averaged to population per plant. The observation procedure remained same for both years. Further, season long incidence of aphids and the three predators was averaged as seasonal mean for comparison of incidence among RCH-2 Bt and non-bt. The mean population was subjected for paired t-test to assess the impact and correlation for aphid incidence with each predator population for both seasons as well as for pooled analysis Impact of Bt cotton cultivar on feeding potential and biology of Chrysoperla carnea Seedlings and food host A laboratory study was done during 2004 for assessing the impact of Bt cotton on commercial scale insect predator C. carnea. The seedlings of RCH-2Bt and non-bt cotton were raised by sowing seeds (without treatment of imidacloprid) in pots on Ten pots were maintained for both RCH-2 Bt and non-bt. Late sowing was done to coincide the aphid incidence on the plants with optimum expression period for Cry1Ac i.e., DAS to have proper impact (if any) on aphids. The aphid colonies developed on these plants were used to feed C. carnea grubs in the laboratory Culture maintenance for predator Before starting the experiment, the late instar grubs of C. carnea infesting conventional (DHH-11) cotton hybrid were grown under unprotected conditions for population dynamics study under AICCIP experiments sown on The grubs were maintained in small rearing cage of 0.3 x 0.3 x 0.3 m till pupation on aphids collected from DHH-11 plants only. Once adults emerged 10% honey solution in cotton swab was provided as food. Black cloth piece pinned to thermocol plate was provided for oviposition. Eggs after hatching were trimmed and brushed to transfer to glass vials (0.5 x 2.5 cm) for hatching. Once the first instar grubs emerged they were shifted for actual experimental setup.
50 Feeding potential and biology on cotton aphids collected from RCH-2 Bt and non-bt Feeding potentiality and impact on growth and development was assessed by rearing C. carnea from hatching to pupation on aphids infesting potted plants of RCH-2 Bt and non- Bt. All the instars were reared in specimen tubes (1.0 x3.5 cm) till pupation by feeding known number of nymphs of aphids each day. For each treatment there were 10 grubs and each set replicated five times. After every 24 hours, grubs were shifted with brush tip to new specimen tube marked for same treatment and replication. The old specimen tube was taken for counting the aphids remaining in the tube to know each day feeding potential. Host material i.e., nymphs of aphids from RCH-2 Bt and non-bt plants for respective treatments were increased gradually as instar advanced. After pupation and emergence of adults, pairs of males and females for each ten treatment were isolated (2 pairs from each replication) and released separately for mating and oviposition. Adult food (10% honey) was provided in each oviposition cage. The observations for days taken to complete different instar stage, prepupal stage, adult longevity, sex ratio, fecundity, incubation period and total aphid consumed were recorded and presented as comparative figures between two cultivars. 3.6 DEVELOPMENT OF IPM MODULES FOR Bt COTTON Development of integrated pest management modules for the management of insect pests was done using RCH-2Bt as test hybrid Components of IPM modules Three modules having different components were designed and tested for their efficacy in toto with respect to incidence of sucking pests as well as bollworms. The components included in each module revolved around management or suppression of pest population below ETL through integration of different techniques. The unified package of three modules are presented in Table Experimental procedure Sowings (RCH-2Bt) were taken up on ( ) and ( ) for two seasons over an area of 0.3 ha in each module under 90 cm x 60 cm spacing. Each module was separated by a row of maize and 5.0 m buffer area distance. Each module was divided into eight equal blocks to serve as replication. The treatments in each modules were imposed based on ETL of the pest at respective stage (bollworm: 1.0 larva/plant, aphids/thrips: 10/leaf, leafhopper: 2 nymphs /leaf). A line of refuge crop was maintained in each module (Plate-3) Observations For observation 10 plants were selected in each replication of every module. Thus modules served as treatment and blocks served as replication satisfying one way ANOVA requirement. Observations were recorded on incidence of sucking pests (aphids/ thrips / leaf hoppers), bollworms (larvae of H. armigera and E. vittella), damage to fruiting bodies, PBW parameters and predatory populations viz., coccinellids (adults and grubs), C. carnea (grubs) and syrphids (maggots) as explained earlier in this chapter. Boll opening parameter (GOB and BOB) were taken on plant basis. Seed cotton yield / block was harvested on and for respective seasons. The yield was extrapolated to q/ha and subjected for analysis. The cost of protection and total cost of cultivation was worked for each module considering cost of every input as detailed in appendix-vii. The economic advantage in each module was also worked out after pooled analysis.
51 Table 3: Components of different IPM modules in Bt cotton Target Module-I Module-II Module-III Sucking pests (Sowing) Seed treatment with imidacloprid g /kg Seed treatment with imidacloprid g /kg Seed treatment with imidacloprid g /kg Sucking pests (At DAS) (Specially for thrips incidence) Acetamiprid g ai/ha (spray) NSKE 5% Stem smearing (1ml imidacloprid 17.8 SL + 20 ml water) Bollworm eggs (Trap crop during sowing) Bollworm eggs (Trap crop at 70 DAS) Bollworms /aphids ( DAS) Okra as trap crop Okra as trap crop Okra as trap crop -- Nipping Nipping -- Pink bollworm PB Rope-L at 40 DAS PB Rope-L at 70 DAS Cypermethrin 10 EC at 90 DAS Bollworm (at DAS) Endosulfan 1050 g ai/ha Ha NPV@ 500 LE /ha Spinosad g ai/ha Bollworm and aphids Quinalphos g ai/ha Endosulfan g ai/ha Quinalphos g ai/ha Non-Bt Refuge 20% 20% 20% Monitoring of moth activity 5/ha 5/ha 5/ha 3.7 STATISTICAL ANALYSIS The data averaged into respective parameter requisites was subjected to suitable transformation. After proper analysis, data was accommodated in the tables as per the needs of objectives for interpretation of results. Computer software packages MSTATC and Drysoft were made use of. The standard procedures in agriculture statistics given by Gomez and Gomez (1976) were consulted throughout.
52 IV. EXPERIMENTAL RESULTS The results of the field investigations under rainfed conditions and laboratory experiments carried out at Agricultural Research Station, Dharwad Farm, Dharwad during and are presented in this chapter. The detailed results of individual experiments year wise as well as pooled data have been given for thorough exploration of treatment impact as per the experiments planned and put for validation. 4.1 EVALUATION OF DIFFERENT TRANSGENIC CULTIVARS HAVING Cry1Ac AND Cry1Ac + Cry2Ab GENES The experiment comprised of three new Bt cotton genotypes (RCH-368, RCH-362 and MRC 6322) with Cry1Ac encoding genes, two second generation Bt genotypes (MRC- 7201, MRC-6322) expressing Cry1Ac as well as Cry2Ab and two inter specific Bt hybrids (MRC-6918, RCH-708) for comparative performance with standard Bt check RCH-2 Bt and conventional hybrid checks DHH-11 and DCH-32. All the hybrids were grown in both unprotected (UP) and ETL based protection (P) condition placed in split plot design. The data on insect pest incidence, damage and yield has been presented year wise and pooled analysis for selected parameters has been presented hereunder Performance of different Bt genotypes during Incidence of spotted bollworm, E. vittella The larval incidence of E. vittella in unprotected condition (UP) at 50 DAS was absolutely nil in BG-II genotypes MRC-7201 and MRC All other Bt genotypes also had less infestation and the figures remained on par to BG-II types excluding RCH-2 Bt check. However spotted bollworm (SBW) incidence was significantly high in conventional checks viz., DHH-11 (1.90 larvae /plant) and DCH-32 (2.70 larvae /plant) compared to all Bt genotypes (Table 4). At this stage to all Bt genotypes, similar trend of incidence was noticed in protected main plot also (P). In Bt genotypes, incidence ranged from (BG-II genotypes) to 0.27 larvae / plant (RCH-2 Bt) all being statistically on par and differing significantly with DHH-11 (1.57 larvae / plant) and DCH-32 (3.43 larvae / plant). There was no significant difference among same genotype put under protected or unprotected plot at this stage of the crop growth (50 DAS) but for DCH-32. Further by 65 DAS (Table 4) the incidence of E. vittella reached zero in almost all Bt genotypes but for RCH-362 Bt (0.05 larvae / plant) under unprotected condition which was numerical variation only. However, there was significant difference among conventional hybrids both way (main plot and sub plot) comparison. Thus at 65 DAS all Bt genotypes harboured significantly less incidence of spotted bollworms compared to conventional hybrids. Seasonal average incidence of E. vittella revealed that there was significant difference among Bt genotypes in both main plots with absolutely zero incidence in second generation Bt transgenics (MRC 7201 and 6322). The incidence in Bt genotypes was significantly least over DHH-11 and DCH-32 which had more incidence in both protected and unprotected main plots. The population varied significantly in the same genotypes (DCH-32 or DHH-11) grown under protected and unprotected plots.
53 Table 4: Incidence of spotted bollworm Earias vittella larvae in different Bt cotton genotypes under protected and unprotected conditions during No. of larvae /plant Genotypes 50 DAS 65 DAS Average UP P Mean UP P Mean UP P Mean RCH-368 Bt 0.13 (1.06) 0.20 (1.09) 0.17 (1.08) 0.07 (1.03) 0.10 (1.04) 0.09 (1.03) RCH-362 Bt 0.23 (1.11) 0.12 (1.05) 0.18 (1.08) 0.05 (1.02) 0.03 (1.01) 0.14 (1.06) 0.06 (1.02) 0.10 (1.02) MRC-6322 Bt 0.20 (1.09) 0.15 (1.07) 0.18 (1.08) 0.10 (1.04) 0.07 (1.03) 0.09 (1.03) MRC-7201 Bt (BG-II) MRC-6322 Bt (BG-II) MRC-6918 Bt 0.13 (1.06) 0.17 (1.08) 0.15 (1.07) 0.07 (1.03) 0.08 (1.03) 0.08 (1.03) RCH-708 Bt 0.07 (1.03) 0.07 (1.03) 0.07 (1.03) (1.01) 0.03 (1.01) RCH-2Bt 0.30 (1.14) 0.27 (1.12) 0.29 (1.13) 0.15 (1.07) 0.13 (1.06) 0.14 (1.06) DHH (1.70) 1.57 (1.60) 1.73 (1.65) 2.67 (1.91) 0.77 (1.32) 1.72 (1.62) 2.28 (1.80) 1.17 (1.46) 1.72 (1.64) DCH (1.92) 3.43 (2.10) 3.06 (2.01) 4.00 (2.23) 1.07 (1.43) 2.54 (1.83) 3.35 (2.08) 2.25 (1.76) 2.80 (1.92) Mean (1.25) (1.26) (1.32) (1.07) (1.27) (1.14) SEm± CD at 5% SEm± CD at 5% SEm± CD at 5% Protection -- NS -- NS -- NS Genotypes Interaction Interaction DAS: Days after sowing UP: Unprotected condition P: Protected condition Figures in the parentheses are x + 1 transformation Interaction 1: CD for comparison between two genotype means at the same protection Interaction 2: CD for comparison between two protection means at the same or different genotypes
54 Incidence of American bollworm, Helicoverpa armigera The incidence of H. armigera larvae at 65, 80, 95, 110, 125, 140 DAS has been presented in Table 5, along with seasonal average. At 65 DAS there was no incidence in MRC-7201 and 6322 (both BG II) and rest of Bt genotypes were also having less incidence which remained significantly on par to BG II hybrids in both main (UP and P) plots. All Bt genotypes remained significantly superior over conventional hybrids DHH-11 and DCH-32 in terms of H. armigera larval incidence. The difference among each genotypes across protection could not indicate any statistical superiority in Bt genotypes as well as conventional hybrids. At 80 DAS the incidence in MRC 6918 Bt (interspecific hybrid) was significantly superior compared to the least incidence bearing genotypes i.e. MRC 7201 and 6322 ( larvae / plant), rest of the Bt genotypes being on par. Under unprotected conditions, however, there was no such difference observed. However, Bt genotypes remained statistically superior to conventional hybrids. There was significant difference in main plots between DHH-11 and DCH-32, latter bearing more incidence. At 95 DAS (Table 5) in unprotected main plot the larval incidence was least (0.07 larvae / plant) in MRC-7201 followed by MRC-6322 BG-II (0.10 larvae /plant) (both at par). Other Bt genotypes were also on par to these BG-II genotypes except RCH-368 Bt and two interspecific Bt hybrids MRC-6918 and RCH-708 which had higher incidence. The condition was similar in protected main plot also indicating differential reaction of Bt hybrids to H. armigera from this stage (95 DAS) of crop growth. The incidence in conventional hybrids remained statistically superior in Bt hybrids despite of protection through insecticides. By 110 DAS there was clear cut difference among first and second generation Bt genotypes (Table 5) in unprotected main plot. Least incidence was noticed in MRC 7201 (0.23 larvae / plant) and MRC 6322 BG-II (0.43 / plant) which found to be statistically superior treatments compared to the rest, in all other Bt genotypes including RCH-2 Bt (check) population crossed ETL and warranted control measures. At this stage all first generation Bt genotypes (Cry1Ac) became on par to conventional check DHH-11 as far as H. armigera larval incidence (1.61/ plant) was concerned and the rest had still higher incidence. The trend was same in protected main plot also where all the genotypes with Cry1Ac became on par even to DCH-32 also, with incidence above ETL (1.0 / plant) but for BG-II hybrids where population remained statistically least from the rest. There was no difference between two main plots, but for conventional hybrids. From the continued columns of Table 5 it was evident that in unprotected condition at 125 DAS also BG-II hybrids MRC and 6322 (BG-II) could not allow H. armigera to cross ETL. However, the incidence remained above ETL in Bt genotypes RCH-368 (1.43 / plant), RCH-362 (1.70 / plant), MRC-6322 (1.50 / plant), MRC-6918 (2.17 / plant) and RCH-708 (1.50 / plant). The incidence in RCH-2 Bt was significantly less (0.83 / plant) compared to these genotypes except RCH-368 Bt which was on par to it. At this stage when the incidence of larvae in same genotype compared across protected and unprotected condition (CD: 0.26). All genotypes have shown significantly lower incidence in protected main plot indicating insecticide intervention effect. The main plots mean also varied significantly at 120 DAS in terms of H. armigera larval incidence. Conventional hybrids found to sustain the larval incidence above ETL in both protected as well as unprotected conditions.
55 Table 5: Incidence of American bollworm Helicoverpa armigera larvae in different Bt cotton genotypes under protected and unprotected conditions during No. of larvae/ plant Genotypes RCH-368 Bt RCH-362 Bt MRC-6322 Bt MRC-7201 Bt (BG-II) MRC-6322 Bt (BG-II) MRC-6918 Bt RCH-708 Bt RCH-2Bt DHH-11 DCH-32 Mean 65 DAS 80 DAS 95 DAS 110 DAS UP P Mean UP P Mean UP P Mean UP P Mean 0.07 (1.03) 0.10 (1.05) 0.09 (1.04) 0.13 (1.06) 0.07 (1.03) 0.10 (1.05) 0.40 (1.18) 0.36 (1.16) 0.38 (1.17) (1.01) (1.01) (1.05) (1.04) (1.05) (1.14) (1.12) (1.13) (1.06) (1.08) (1.07) (1.06) (1.05) (1.06) (1.15) (1.10) (1.13) (1.03) (1.02) (1.03) (1.05) (1.03) (1.03) (1.01) (1.02) (1.09) (1.06) (1.08) (1.22) (1.28) (1.25) (1.03) (1.02) (1.06) (1.05) (1.06) (1.18) (1.15) (1.17) (1.06) (1.03) (1.05) (1.03) (1.03) (1.03) (1.08) (1.05) (1.07) (1.24) (1.18) (1.21) (1.42) (1.43) (1.43) (1.62) (1.40) (1.51) (1.41) (1.37) (1.39) (1.73) (1.76) (1.75) (1.81) (1.75) (1.78) (1.08) (1.10) (1.15) (1.14) (1.25) (1.20) 1.25 (1.49) 1.77 (1.66) 1.20 (1.48) 0.23 (1.20) 0.43 (1.18) 1.57 (1.59) 1.80 (1.67) 1.10 (1.44) 1.61 (1.60) 2.83 (1.95) 1.38 (1.51) 1.68 (1.63) 1.36 (1.53) 1.53 (1.59) 0.30 (1.14) 0.21 (1.13) 1.87 (1.64) 1.90 (1.70) 1.52 (1.58) 1.13 (1.45) 2.03 (1.73) 1.36 (1.50) 1.46 (1.56) 1.55 (1.59) 1.36 (1.53) 0.26 (1.12) 0.36 (1.15) 1.35 (1.64) 1.85 (1.64) 1.31 (1.51) 1.37 (1.53) 2.43 (1.84) SEm± CD at 5% SEm± CD at 5% SEm± CD at 5% SEm± CD at 5% Protection -- NS -- NS -- NS -- NS Genotypes Interaction Interaction DAS: Days after sowing UP: Unprotected condition P: Protected condition Figures in the parentheses are x + 1 transformation Interaction 1: CD for comparison between two genotype means at the same protection Interaction 2: CD for comparison between two protection means at the same or different genotypes
56 Table 5: (contd.) Genotypes RCH-368 Bt 1.43 No. of larvae/ plant 125 DAS 140 DAS Average UP P Mean UP P Mean UP P Mean (1.55) RCH-362 Bt 1.70 (1.64) MRC-6322 Bt 1.50 MRC-7201 Bt (BG-II) MRC-6322 Bt (BG-II) (1.57) 0.52 (1.23) 0.66 (1.28) MRC-6918 Bt 2.17 (1.77) RCH-708 Bt 1.50 (1.52) RCH-2Bt 0.83 (1.34) DHH (1.87) DCH Mean (2.00) 1.59 (1.57) 0.27 (1.12) 0.10 (1.05) 0.17 (1.08) 0.59 (1.26) 0.60 (1.26) 0.23 (1.11) 0.17 (1.08) 0.13 (1.06) 1.03 (1.42) 1.97 (1.72) 0.52 (1.21) 0.85 (1.34) 0.90 (1.35) 0.84 (1.33) 0.55 (1.24) 0.63 (1.27) 1.20 (1.44) 0.84 (1.30) 0.48 (1.20) 1.78 (1.65) 2.50 (1.86) 0.57 (1.24) 0.37 (1.16) 0.37 (1.16) 0.13 (1.06) 0.23 (1.10) 0.90 (1.37) 0.97 (1.40) 0.57 (1.24) 0.63 (1.27) 1.23 (1.49) 0.60 (1.25) 0.33 (1.15) 0.27 (1.12) 0.30 (1.13) 0.07 (1.03) 0.50 (1.22) 0.47 (1.20) 0.23 (1.11) 0.67 (1.28) 0.93 (1.39) 0.38 (1.16) 0.45 (1.20) 0.32 (1.14) 0.34 (1.15) 0.07 (1.03) 0.15 (1.07) 0.70 (1.30) 0.72 (1.30) 0.40 (1.18) 0.65 (1.28) 1.08 (1.44) 0.64 (1.28) 0.71 (1.31) 0.61 (1.27) 0.16 (1.08) 0.24 (1.11) 0.90 (1.38) 0.80 (1.34) 0.48 (1.22) 1.33 (1.53) 2.07 (1.75) 0.79 (1.34) 0.47 (1.21) 0.35 (1.16) 0.42 (1.19) 0.16 (1.07) 0.15 (1.07) 0.57 (1.25) 0.51 (1.23) 0.36 (1.16) 0.88 (1.37) 1.67 (1.63) 0.55 (1.25) SEm± CD at 5% SEm± CD at 5% SEm± CD at 5% Protection NS genotypes Interaction Interaction (1.25) 0.53 (1.24) 0.51 (1.23) 0.16 (1.08) 0.19 (1.09) 0.74 (1.32) 0.65 (1.28) 0.42 (1.19) 1.11 (1.45) 1.87 (1.69) DAS: Days after sowing UP: Unprotected condition P: Protected condition Figures in the parentheses are x + 1 transformation Interaction 1: CD for comparison between two genotype means at the same protection Interaction 2: CD for comparison between two protection means at the same or different genotypes
57 At 140 DAS larval incidence reduced in both protected and unprotected main plots due to natural reduction in the pest status as well as complete maturity of crop. The population was 0.13 / plant in MRC-7201 BG-II which was least and on par with MRC-6322 BG-II, RCH-362 Bt and MRC-6322 Bt in unprotected main plot. The other genotypes viz., RCH-368, MRC- 6918, RCH-708 and RCH-2 Bt had significantly more incidence than BG-II hybrids. Similar trend of larval incidence was observed in protected main plot also where both BG-II hybrids remained statistically superior to the rest of Bt genotypes except RCH-2 Bt. DCH-32 had incidence above ETL in unprotected block which could not vary among main plots, but remained statistically highest with rest of the genotypes under any comparisons. The average of all the six observations (Table 5) revealed that under unprotected condition, MRC 7201 Bt (BG-II) was the best recording the lowest (0.16/ plant) number of H. armigera larvae/ plant which was followed by MRC 6322 Bt BG II (0.24 larvae/ plant). Highest larval incidence was noticed in MRC 6918 Bt recording 0.90 larva/ plant. Under protected conditions, also same trend was observed where, both MRC-7201 Bt and MRC 6322 Bt BG II performed better than all other genotypes under study and recorded only 0.16 and 0.15 larvae/ plant respectively. The non-bt genotypes (DHH-11 and DCH-32) recorded 1.33 and 2.07 larvae/ plant under unprotected conditions as against 0.88 and 1.67 under protected condition Fruiting damage due to bollworms. The damage to fruiting bodies viz., flowers, squares and bolls considered together as in unprotected and protected conditions as influenced in different genotypes recorded at 50,65, 80, 95, 110, 125 and 140 DAS has been presented in Table 6 along with seasonal average at the end of the table. At 50 DAS the damage was negligible in all genotypes limiting to less then 0.50 percent in both protected and unprotected conditions. All the Bt genotypes including BG-II hybrids remained on par in both way interaction analysis of the data and found superior to conventional hybrids which recorded damage up to per cent (DCH-32 protected plot). The damage was least (0.23%) in MRC-7201 and RCH-2 Bt (check) in unprotected main plot, rest Bt hybrids found on par to these two hybrids. At 65 DAS (Table 6) also there was no significant difference among Bt genotypes in terms of damage to fruiting bodies, in unprotected conditions however least (0.43%) damage was noticed in RCH-368 Bt. Similarly in protected main plot also there was no significant difference in Bt genotypes. Least damage (0.53%) being recorded in MRC 6322 BG II. Conventional hybrid checks for the damage were significantly higher compared to Bt genotypes in both protected and unprotected conditions. The damage was 7.53 per cent for DHH-11 and per cent for DCH-32 in protected conditions which could not vary statistically to the damage level in respective hybrids at unprotected conditions. The trend remained completely similar at 80 DAS also when interaction comparison were made both way. However, least damage recorded emerged from MRC-7201 (3.37% P, 3.47% UP) closely followed by another second generation hybrid MRC 6322 BG-II. The maximum damage was noticed again in DHH-11 and DCH-32 hybrids. At 95 DAS there was significant difference among Bt genotypes in terms of damage sustained. In unprotected plots, least damage (5.20%) was recorded in MRC-7201 followed by 6.67 per cent in MRC-6322 BG-II both being on par to each other. RCH-368, RCH-362, MRC-6322 and RCH-2 Bt remained statistically on par with MRC-6322 BG-II as far as fruiting body damage was considered. Interspecific Bt hybrids MRC-6918 and RCH-708 recorded significantly higher damage (12.20 and 10.37%, respectively) compared to rest of the Bt genotypes. However, DHH-11 (16.00%) and DCH-32 (25.07%) indicated highest damage over rest of the genotypes in unprotected condition. Under protected condition the trend remained same, however the damage was significantly more in RCH-368 Bt and RCH-2 Bt (check) compared to BG-II hybrids. The conventional hybrids recorded significantly higher damage in both main plots over Bt genotypes. Though damage was in increasing trend so far, in none of the Bt genotypes except MRC6918 Bt and RCH708 Bt the damage crossed ETL i.e., 10.0 per cent damage.
58 Table 6: Fruiting body damage due to bollworms in different genotypes under protected and unprotected conditions during Genotypes RCH-368 Bt RCH-362 Bt MRC-6322 Bt MRC-7201 Bt (BG-II) MRC-6322 Bt (BG-II) MRC-6918 Bt RCH-708 Bt RCH-2Bt DHH-11 DCH-32 Mean Damage to fruiting bodies (%) 50 DAS 65 DAS 80 DAS 95 DAS UP P Mean UP P Mean UP P Mean UP 0.43 (3.66) 0.33 (3.13) 0.63 (4.44) 0.23 (2.66) 0.30 (3.06) 0.43 (3.02) 0.27 (2.91) 0.23 (2.66) 9.83 (18.22) (19.31) 2.36 (6.31) 0.47 (3.88) 0.27 (2.81) 0.60 (4.41) 0.17 (1.35) 0.27 (2.94) 0.40 (3.50) 0.27 (2.86) 0.20 (2.06) 9.33 (17.87) (19.82) 2.35 (6.15) 0.45 (3.77) 0.30 (2.97) 0.62 (4.43) 0.20 (2.01) 0.29 (3.00) 0.42 (3.26) 0.27 (2.89) 0.22 (2.36) 9.58 (18.05) (19.57) 0.43 (3.75) 0.93 (5.45) 1.10 (6.01) 0.90 (5.26) 1.10 (5.97) 1.23 (6.03) 1.23 (6.14) 5.03 (12.91) (18.67) (22.56) 3.69 (9.27) 0.63 (4.40) 0.77 (4.97) 1.03 (5.76) 0.70 (3.89) 0.53 (4.02) 1.00 (4.68) 1.20 (6.04) 0.67 (4.43) 7.53 (15.93) (19.03) 2.47 (7.31) 0.53 (4.08) 0.85 (5.21) 1.07 (5.89) 0.80 (4.58) 0.82 (5.00) 1.12 (5.36) 1.22 (6.09) 2.85 (8.67) 8.90 ( (20.80) 4.43 (12.03) 4.77 (12.55) 5.00 (12.78) 3.47 (10.62) 3.97 (11.48) 5.87 (13.92) 4.73 (12.55) 4.73 (12.51) (20.37) (27.85) 7.09 (14.66) 4.67 (12.36) 4.83 (12.60) 5.47 (13.52) 3.37 (10.54) 3.80 (11.21) 5.80 (13.92) 4.97 (12.86) 4.27 (11.88) (20.18) (22.94) 6.42 (14.20) 4.55 (12.20) 4.80 (12.58) 5.24 (13.15) 3.42 (10.58) 3.89 (11.35) 5.84 (13.92) 4.85 (12.71) 4.50 (12.20) (20.28) (25.40) 7.23 (15.59) 7.20 (15.56) 8.20 ( (13.17) 6.67 (14.96) (20.44) (18.79) 7.17 (15.52) (23.57) (30.04) (18.43) P 8.50 (16.95) 7.13 (15.49) 8.03 (16.46) 4.87 (12.74) 5.80 (13.92) (19.63) (18.66) 7.33 (15.67) (22.25) (26.23) 9.71 (17.79) Mean 7.86 (16.27) 7.17 (11.35) 8.12 (12.33) 5.04 (8.97) 6.24 (10.30) (15.92) (14.52) 7.25 (11.42) (19.13) (25.65) Protection SEm± CD at 5% SEm± CD at 5% SEm± CD at 5% SEm± CD at 5% -- NS -- NS -- NS -- NS Genotypes Interaction Interaction DAS: Days after sowing UP: Unprotected condition P: Protected condition Figures in the parentheses are arc sine transformations Interaction 1: CD for comparison between two genotype means at the same protection Interaction 2: CD for comparison between two protection means at the same or different genotypes contd
59 Table 6: (contd.) Genotypes RCH-368 Bt (20.23) RCH-362 Bt (20.84) MRC-6322 Bt (21.80) MRC-7201 Bt (BG-II) 7.73 (16.14) MRC-6322 Bt (BG-II) 8.73 (17.18) MRC-6918 Bt (27.02) RCH-708 Bt (27.31) RCH-2Bt (20.52) DHH (25.60) DCH (31.93) Mean (22.86) Damage to fruiting bodies (%) 110 DAS 125 DAS 140 DAS Average UP P Mean UP P Mean UP P Mean UP (18.84) (20.23) (20.62) 7.60 (16.00) 8.63 (17.09) (21.80) (20.63) (18.66) (24.12) (29.21) (20.72) (19.54) (20.54) (21.21) 7.67 (16.07) 8.68 (17.14) (24.41) (23.97) (19.59) (24.86) (30.57) (21.68) (22.23) (24.51) 6.52 (14.81) 8.35 (16.79) (29.03) (25.54) (22.29) (29.95) (35.43) (26.23) 5.55 (13.63) 6.98 (15.33) 7.30 (15.68) 5.90 (14.06) 8.90 (17.37) (18.57) (22.31) 6.68 (14.99) (18.51) (24.57) 9.32 (17.50) 9.59 (17.65) (18.78) (2010) 6.21 (14.43) 8.62 (17.08) (23.80) (23.93) (18.64) (24.23) (30.30) 12.7 (20.89) 13.8 (21.82) (23.96) 7.25 (15.63) 9.10 (17.57) 15.2 (2.96) (23.33) 12.6 (20.80) 20.9 (27.22) (32.27) (22.65) 4.70 (12.53) 5.32 (13.34) 6.51 (14.79) 8.43 (16.89) 8.07 (16.51) 8.40 (16.86) 7.10 (15.46) 4.9 (12.80) (23.41) 22.7 (28.47) 9.19 (17.10) 8.70 (16.71) 9.56 (17.58) (19.37) 7.84 (16.26) 8.59 (17.04) (19.91) (19.40) 8.75 (16.80) (25.31) (30.42) 7.26 (15.64) 7.71 (16.13) 8.92 (17.38) 4.47 (12.21) 5.46 (13.52) (19.65) (18.70) 8.06 (16.50) (23.67) (28.85) (18.71) P 4.99 (12.92) 5.32 (13.35) 5.91 (14.08) 4.43 (12.16) 5.14 (13.11) 7.26 (15.64) 7.23 (15.60) 4.90 (12.79) (20.48) (24.55) 7.47 (15.87) Mean 6.13 (14.28) 6.52 (14.74) 7.41 (15.73) 4.45 (12.19) 5.30 (13.32) 9.28 (17.65) 8.75 (17.15) 6.48 (14.64) (22.08) (26.70) Protection SEm± CD at 5% SEm± CD at 5% SEm± CD at 5% SEm± CD at 5% -- NS genotypes Interaction Interaction DAS: Days after sowing UP: Unprotected condition P: Protected condition Figures in the parentheses are arc sine transformations Interaction 1: CD for comparison between two genotype means at the same protection Interaction 2: CD for comparison between two protection means at the same or different genotypes
60 From Table 6 (continued) it was evident that the damage due to bollworms in unprotected plots crossed ETL in all Bt genotypes except BG-II hybrids at 110 days. Least damage was noticed in MRC 7201 (7.73%) and MRC 6322 BG-II (8.73%) both being statistically on par. All other Bt genotypes had significantly higher damage over BG-II hybrids and remained on par with each other. Within these genotypes, interspecific hybrids MRC-6918 (20.63%) and RCH-708 (21.07%) remained on par to each other and exhibited significant higher damage compared to rest of the Bt genotypes. Similarly in protected main plot also the trend of damage remained least in BG-II hybrids with statistical superiority, followed by intraspecific Bt hybrids (RCH-368, RCH-62, MRC-6322 and RCH-2) with significant edge over interspecific Bt hybrids in terms of damage. At 125 DAS the damage recorded in unprotected main plot was found to follow the trend revealed at 110 DAS in same treatments. i.e., least being BG-II hybrids followed by others. However under protected conditions the damage was least in RCH-368 Bt (5.55%) followed by MRC-7201 Bt and RCH-2 Bt with no significant variation. The damage in other genotypes was higher especially in MRC (10.13%) and RCH-708 (14.40%) which was superior to other Bt genotypes and DHH-11 also. At this stage mean value of all genotypes under same level of protection was found to be significantly higher (17.48%) in unprotected condition compared to protected (9.32%) condition indicating variation in damage irrespective of genotypes due to protection rendered. Further at 140 DAS the damage in unprotected condition was found to be slightly higher in all genotypes compared to preceding stage of observation with similar statistical trend set. But in protected condition the damage was least in RCH- 368 Bt (4.70%) which was on par to RCH-362 Bt and RCH-2 Bt bearing slightly higher damage. BG-II genotypes MRC-7201 (8.43%) and MRC-6322 (8.07%) had significantly higher damage compared to genotypes expressing Cry1Ac toxin only. The damage was per cent in DHH-11 and 22.7 per cent in DCH-32. In seasonal mean damage (Table 6) per cent fruiting damage was lowest in MRC 7201 Bt (4.47%) which was significantly superior to all other genotypes followed by MRC 6322 Bt (BG-II) (5.46%). Highest per cent fruiting body damage (11.30%) was observed in MRC 6918 Bt under unprotected conditions. Under protected conditions, also, MRC-7201 revealed its superiority by recording the lowest per cent damage to fruiting bodies (4.43%) which was on par with RCH 368 Bt (4.99%) and RCH-2Bt (4.90%). This was followed by MRC 6322 Bt (5.14%). The genotypes DHH-11 and DCH-32 recorded significantly higher per cent fruiting body damage of and per cent in unprotected condition as against and per cent in protected condition Incidence of Pink bollworm, P. gossypiella. Flower rosetting (Table 7) was significantly least in MRC-6322 BG-II (%) in unprotected plots which was on par to MRC-7201 (0.13%) and superior over rest of genotypes. In RCH-708 (1.50%) and MRC-6918 (2.03%) rosette flower differed significantly from other Bt genotypes. The trend remained similar to protected main plot for Bt genotypes. DHH-11 and DCH-32 which recorded significantly higher damage compared to Bt genotypes in both main plots, however there was significant reduction in each genotype in protected plots in terms of rosette flowers. The infestation of PBW in green bolls was high in MRC-6918 (1.43 larvae / 10 bolls) and RCH- 708 (1.10 larvae /10 bolls) Bt interspecific hybrids compared to other Bt genotypes in unprotected plots. This difference prevailed despite the protection as revealed by significantly higher incidence of PBW larvae in these two genotypes compared to the rest. Second generation Bt genotypes MRC-7201 and MRC-6322 found to be best genotypes in containing PBW incidence as revealed by significantly least locule damage in both main plots. Under unprotected condition MRC-6322 BG-II recorded 2.37 percent locule damage (MRC-7201 on par to it) and even in protected condition too they could suppress PBW to maximum
61 Table 7: Incidence and damage due to pink bollworm Pectinophora gossypiella in different Bt cotton genotypes under protected and unprotected conditions during Genotypes RCH-368 Bt RCH-362 Bt MRC-6322 Bt MRC-7201 Bt (BG-II) MRC-6322 Bt (BG-II) MRC-6918 Bt RCH-708 Bt RCH-2Bt DHH-11 DCH-32 Mean Flower rosetting (%)* PBW larvae / 10 bolls** Locule damage (%)* UP P Mean UP P Mean UP P Mean 0.40 (2.86) 0.43 (3.68) 0.42 (3.27) 0.37 (1.16) (4.53) (4.29) (4.41) (1.20) (3.61) (2.75) (3.18) (1.19) (1.70) (1.04) (1.37) (1.11) () (1.20) (0.60) (1.06) (8.19) (8.58) (8.39) (1.56) (7.03) (7.10) (7.07) (1.44) (4.38) (3.26) (3.82) (1.24) (16.55) (12.68) (14.62) (1.40) (23.25) (16.35) (19.80) (1.56) (7.21) (6.09) (1.29) 0.13 (1.06) 0.25 (1.11) 9.33 (17.60) 6.70 (15.00) (1.09) (1.15) (18.99) (11.33) (1.12) (1.16) (16.19) (11.34) (1.04) (1.08) (8.99) (8.32) (1.05) (1.06) (8.45) (9.41) (1.32) (1.44) (24.09) (20.68) (1.26) (1.35) (22.81) (20.82) (1.10) (1.17) (19.80) (9.20) (1.13) (1.27) (28.08) (20.89) (1.41) (1.49) (41.77) (32.17) (1.16) (20.67) (15.91) 8.02 (16.30) 7.27 (15.16) 5.92 (13.77) 2.28 (8.65) 2.53 (8.93) (22.39) (21.82) 7.06 (14.50) (24.49) (36.97) SEm± CD at 5% SEm± CD at 5% SEm± CD at 5% Protection -- NS -- NS genotypes Interaction Interaction UP: Unprotected condition P: Protected condition *Figures in the parentheses are arc sine transformation **Figures in the parentheses are x + 1 transformation Interaction 1: CD for comparison between two genotype means at the same protection Interaction 2: CD for comparison between two protection means at the same or different genotypes
62 extent. The locule damage among Bt genotypes was significantly higher in MRC-6918 (16.67%) and RCH-708 (15.03%) both being on par to each other and differing statistically with rest in unprotected condition. In protected also the trend remained same as unprotected mean for locule damage Boll opening The average number of good opened bolls (Table 8) / plant in MRC-7201 BG-II which was significantly highest compared to all other genotypes in unprotected condition. It was followed by another BG-II i.e., MRC-6322 (24.25 GOB / plant). Among other Bt genotypes commercial Bt hybrid RCH-2 Bt had higher number of GOBs (16.11 /plant) and RCH-368, RCH-362, MRC-6918 and RCH- 708 Bt genotypes remained statistically at par to it with slightly reduced boll retention. On the other hand protection through chemical intervention above Cry1Ac toxin resulted in higher GOB s in all first generation Bt genotypes RCH-368 Bt recorded highest (22.36 / plant) GOB s followed by all other Bt genotypes except MRC-6322 (18.13 / plant). All the genotypes including DHH-11 and DCH-32 had significantly higher GOB s in protected main plot. However, highest bearing appeared in BG-II genotypes and in any of interaction comparisons the mean number of GOB s did not vary significantly for MRC-7201 and MRC-6322 BG-II. The least number of bad opened bolls in unprotected condition recorded (Table 8) in MRC BG-II (2.10 / plant) and MRC-7201, MRC-6322 (BG-I), RCH-362, RCH-2 Bt were found on par to it. DHH-11 had significantly higher number of bad opened bolls. More or less similar trend was noticed in protected condition. However, there was no significant difference between each genotype compared between protected and unprotected condition (unlike GOB s) except conventional hybrids.
63 Table 8: Boll opening and seed cotton yield in different Bt cotton genotypes under protected and unprotected conditions during Genotypes Good opened bolls/plant Bad opened bolls/plant Seed cotton yield (q/ha) UP P Mean UP P Mean UP P Mean RCH-368 Bt RCH-362 Bt MRC-6322 Bt MRC-7201 Bt (BG-II) MRC-6322 Bt (BG-II) MRC-6918 Bt RCH-708 Bt RCH-2Bt DHH DCH Mean SEm± CD at 5% SEm± CD at 5% SEm± CD at 5% Protection NS genotypes Interaction Interaction UP: Unprotected condition P: Protected condition Interaction 1: CD for comparison between two genotype means at the same protection Interaction 2: CD for comparison between two protection means at the same or different genotypes Yield of seed cotton It was quite evident from the (Table 8) comparative figures of seed cotton that second generation Bt genotypes MRC-7201 produced higher yield in both unprotected (19.90 q / ha) and protected (20.50 q / ha) conditions. There was no significant difference between these two figures. Similarly, MRC-6322 BG-II also recorded and quintal seed cotton yield per ha in unprotected and protected conditions respectively with no statistical inference on variation among two main plots or amongst both BG-II genotypes, as both couldn t receive any insecticide intervention. Otherwise kapas harvested always remained significantly higher in protected main plots in all genotypes. New Bt genotype RCH-368 Bt could produce q/ha which was significantly higher than MRC-6322, MRC-6918, and RCH-708 Bt genotypes and numerically slightly lesser than check RCH-2 Bt. In both situations (UP and P) Bt genotypes yielded better than conventional hybrids DHH-11 and DCH-32.
64 4.1.2 Performance of different Bt genotypes during Incidence of spotted bollworm, E. vittella The incidence of E.vittella was slightly less compared to previous season. From Table 9 it was evident that like first season, second generation Bt genotypes received no larval population in both protected and unprotected plots at 50 DAS. In other genotypes also the trend remained same with significant incidence in DHH-11 and DCH-32 only warranting control measures. Further by 65 DAS the incidence was still reduced in all most all Bt genotypes (both UP and P main plots) population reached negligible level. In conventional checks the larval load of spotted bollworm reached significantly low compared to unprotected plots owing to the chemical intervention offered. Seasonal average incidence also remained matching to the incidence pattern noticed at 65 DAS indicating complete suppression of E. vittella larval incidence by transgenic genotypes under test Incidence of American bollworm, H. armigera Since from first observation at 65 DAS to till last observation (Table 10) the trend in incidence of H. armigera larvae remained similar to that of previous season indicating consistency in the expression of Crytoxin (s). Upto 110 DAS none of the Bt genotypes indicated larval incidence calling chemical intervention in protected plots. Thus population was below 1.0 larvae/ plant in both main plots in all Bt genotypes at 65, 80 and 95 DAS. However, least incidence recorded was absolutely nil population in BG-II genotypes and in rest of the Bt genotypes population was slightly (no statistical superiority) more. But incidence was consistently high in DCH-32 since 65 DAS warranting control measures. At 80 DAS, incidence in protected and unprotected plots of DHH-11 and DCH-32 found to be at par since there was no protection at 65 DAS and protection offered on DCH-32 could not reduce the population much due to rain fall and increasing trend of incidence. At 95 DAS also despite of protection in both population remained above economic thresholds. It was quite striking to notice a significantly higher incidence of H. armigera larvae in all genotypes at 110 DAS (Table 10) except BG-II hybrids. Thus all genotypes with population more than 1.0 larvae / plant (both main plots) indicated fall in host plant resistance and called for control measure. In MRC-7201 and 6322 (BG-II) population was 0.13 and 0.63 per plant respectively in unprotected plots. In protected plots also the incidence was more or less same in these genotypes. Further at 125 DAS, due to chemical intervention, the incidence reduced drastically (Table 10 contd) in all Bt genotypes under protected condition. RCH-362 recorded least (0.30 larvae / plant) population and rest of the Bt genotypes remained on par to it except RCH 368 Bt and RCH 708 Bt. However in unprotected condition incidence appeared to be significantly higher in all genotypes (except BG-II) compared to the same genotypes under protected condition indicating the impact of protection offered through insecticides. The least incidence among BG-1 genotypes was noticed in RCH-2 Bt (1.33 larvae / plant). By 140 DAS (Table 10 contd) incidence of H. armigera in all Bt genotypes and both main plots reduced further. In protected plots MRC-7201 revealed 0.07 /plant larval incidence followed by 0.13 larvae /plant in MRC-6322 BG-II. Rest of the genotypes had significantly more incidence, but remained at par to each other except MRC-6918 (0.93 larvae / plant) and RCH-708 (0.90 larvae / plant) both being at par. In unprotected main plot though none of Bt genotypes had incidence more than 1.0 larvae / plant, significantly lower incidence was noticed in MRC-7201, MRC-6322 BG-II, RCH-362 and MRC-6322 BG-I Bt all being statistically at par with 0.27 to 0.53 larvae per plant. The trend was extendable to even to conventional check DHH-11 with 1.13 larvae/ plant in unprotected condition. The seasonal mean incidence of H. armigera larvae deduced from six observations indicated that (Table 10) second generation Bt genotypes could record least incidence in both protected and unprotected conditions differing significantly with rest of the genotypes. In protected condition the least incidence was noticed in MRC 7201 (0.11 larvae / plant) and highest in MRC-6918 (0.71 larvae / plant) among Bt genotypes. Conventional hybrid checks could record significantly higher incidence in both protected and unprotected plots like previous season.
65 Table 9: Incidence of spotted bollworm Earias vittella larvae in different Bt cotton genotypes under protected and unprotected conditions during No. of larvae/ plant Genotypes RCH-368 Bt RCH-362 Bt MRC-6322 Bt MRC-7201 Bt (BG-II) MRC-6322 Bt (BG-II) MRC-6918 Bt RCH-708 Bt RCH-2Bt DHH-11 DCH-32 Mean 50 DAS 65 DAS Average UP P Mean UP P Mean UP P Mean 0.23 (1.11) 0.20 (1.09) 0.21 (1.10) (1.13) (1.09) (1.11) (1.10) (1.12) (1.11) (1.08) (1.10) (1.07) (1.01) (1.01) (1.08) (1.10) (1.09) (1.11) (1.11) (1.11) (1.72) (1.43) (1.58) (2.21) (1.33) (1.77) (1.69) (1.80) (1.74) (2.55) (1.48) (2.02) (1.19) (1.18) (1.27) (1.08) 0.15 (1.07) 0.10 (1.04) 0.12 (1.06) (1.07) (1.05) (1.06) (1.05) (1.06) (1.06) (1.04) (1.05) (1.04) (1.04) (1.05) (1.04) (1.05) (1.06) (1.06) (1.99) (1.39) (1.69) (1.97) (1.59) (1.88) (1.31) (1.15) SEm± CD at 5% SEm± CD at 5% SEm± CD at 5% Protection -- NS -- NS -- NS Genotypes Interaction Interaction DAS: Days after sowing UP: Unprotected condition P: Protected condition Figures in the parentheses are x + 1 transformation Interaction 1: CD for comparison between two genotype means at the same protection Interaction 2: CD for comparison between two protection means at the same or different genotypes
66 Table 10: Incidence of American bollworm Helicoverpa armigera larvae in different Bt cotton genotypes under protected and unprotected conditions during No. of larvae/ plant Genotypes 65 DAS 80 DAS 95 DAS 110 DAS UP P Mean UP P Mean UP P Mean UP P Mean RCH-368 Bt (1.14) (1.12) (1.13) (1.06) (1.06) (1.06) (1.16) (1.18) (1.17) (1.61) (1.66) (1.63) RCH-362 Bt (1.15) (1.17) (1.16) (1.06) (1.03) (1.05) (1.13) (1.15) (1.14) (1.46) (1.57) (1.51) MRC-6322 Bt 0.47 (1.20) 0.47 (1.20) 0.47 (1.20) 0.07 (1.03) 0.03 (1.02) 0.50 (1.22) 0.33 (1.15) 0.41 (1.19) 1.30 (1.50) 1.60 (1.61) 1.45 (1.55) MRC-7201 Bt (BG-II) 0.13 (1.06) 0.06 (1.03) 0.13 (1.06) 0.40 (1.18) 0.26 (1.12) MRC-6322 Bt (BG-II) 0.17 (1.08) 0.07 (1.03) 0.12 (1.06) 0.60 (1.25) 0.30 (1.14) 0.45 (1.20) MRC-6918 Bt 0.23 (1.11) 0.07 (1.03) 0.15 (1.07) 0.23 (1.11) 0.13 (1.06) 0.18 (1.09) 0.67 (1.28) 0.40 (1.18) 0.53 (1.23) 1.10 (1.44) 1.47 (1.56) 1.28 (1.50) RCH-708 Bt (1.10) (1.05) (1.08) (1.11) (1.08) (1.10) (1.23) (1.19) (1.21) (1.63) (1.48) (1.56) RCH-2Bt (1.05) (1.10) (1.08) (1.03) (1.05) (1.04) (1.16) (1.14) (1.15) (1.48) (1.61) (1.54) DHH-11 (1.26) (1.24) (1.25) (1.60) (1.60) (1.60) (1.86) (1.44) (1.65) (1.65) (1.60) (1.63) DCH-32 (1.49) (1.45) (1.47) (1.82) (1.85) (1.84) (2.12) (1.78) (2.08) (2.10) (1.88) (1.99) Mean (1.15) (1.13) (1.18) (1.17) (1.33) (1.22) (1.52) (1.53) SEm± CD at 5% SEm± CD at 5% SEm± CD at 5% SEm± CD at 5% Protection -- NS -- NS -- NS -- NS genotypes Interaction Interaction DAS: Days after sowing UP: Unprotected condition P: Protected condition Figures in the parentheses are x + 1 transformation Interaction 1: CD for comparison between two genotype means at the same protection Interaction 2: CD for comparison between two protection means at the same or different genotypes contd
67 Table 10: (contd.) No. of larvae/ plant Genotypes RCH-368 Bt RCH-362 Bt MRC-6322 Bt MRC-7201 Bt (BG-II) MRC-6322 Bt (BG-II) MRC-6918 Bt RCH-708 Bt RCH-2Bt DHH-11 DCH-32 Mean 125 DAS 140 DAS Average UP P Mean UP P Mean UP P Mean (1.57) (1.31) (1.44) (1.36) (1.16) (1.26) (1.35) (1.27) ( (1.69) (1.14) (1.42) (1.22) (1.14) (1.18) (1.31) (1.22) ( (1.77) (1.19) (1.48) (1.23) (1.16) (1.20) (1.35) (1.24) (1.06) (1.09) (1.07) (1.12) (1.03) (1.08) (1.05) (1.05) ( (1.27) (1.12) (1.19) (1.15) (1.06) (1.11) (1.14) (1.06) ( (2.08) (1.49) (1.79) (1.48) (1.39) (1.44) (1.46) (1.31) ( (2.15) (1.44) (1.80) (1.43) (1.37) (1.40) (1.50) (1.290 ( (1.51) (1.20) (1.36) (1.36) (1.14) (1.25) (1.29) (1.22) ( (1.84) (1.51) (1.68) (1.46) (1.36) (1.41) (1.63) (1.47) ( (2.16) (1.88) (2.02) (1.66) (1.43) (1.55) (1.91) (1.73) ( (1.71) (1.42) (1.35) (1.22) (1.42) (1.30) SEm± CD at 5% SEm± CD at 5% SEm± CD at 5(% Protection NS genotypes Interaction Interaction DAS: Days after sowing UP: Unprotected condition P: Protected condition Figures in the parentheses are x + 1 transformation Interaction 1: CD for comparison between two genotype means at the same protection Interaction 2: CD for comparison between two protection means at the same or different genotypes
68 Fruiting body damage due to bollworms From Table 11, it is evident that at 50 DAS none of the Bt genotypes could present a considerable damage to fruiting bodies due to bollworm attack. Only in DCH-32 and DHH-11 (> 10 %) the damage was high warranting control measures. By 65 DAS, the damage found to increase only in DCH-32, sparing Bt genotypes. The damage found to increase considerably by 80 DAS in all genotypes. However, there was no significant difference among Bt genotypes within main plot or between main plots. The damage was more in DHH-11 and DCH-32 conventional checks. At 95 DAS the damage due to bollworms in interspecific Bt genotypes MRC-6918 and RCH-708 was and percent respectively in unprotected condition which is significantly more over other Bt genotypes. Similar trend was noticed in protected main plot also. Thus by 95 DAS interspecific Bt hybrids crossed the threshold limit of 10.0 percent damage warranting control measures. The damage found to cross ETL in RCH-362 Bt (10.57%) and MRC-6322 Bt (10.73%) also in both main plots indicating fall in the toxicity. Conventional hybrids sustained severe damage. Further by 110 DAS (Table 11 contd) all the Bt genotypes indicated higher incidence except BG-II genotypes MRC-7201 and MRC-6322 in which the damage has not crossed 1 per cent in both protected and unprotected main plots. The damage in interspecific Bt hybrids MRC-6918 (22.67%) and RCH-708 (22.03%) was significantly higher compared to other Bt genotypes in unprotected main plot. However, in protected main plot these two genotypes remained statistically on par to other Bt genotypes (except BG-II) owing to protection measures rendered at previous stage of observation. Despite protection conventional hybrids could record maximum damage. Thus at 110 DAS all Bt genotypes except BG-II hybrids required control measure. There fore at 125 DAS in protected main plots the damage in RCH-368 (6.83%) RCH-362 (5.70%), MRC-6322 (7.20%) and RCH-2 Bt (5.51%) was significantly less compared to respective genotypes in unprotected plots. Despite protection interspecific Bt hybrids MRC-6918 (15.33%) and RCH- 708 (14.71%) revealed significant higher damage over rest of Bt genotypes. In the subsequent observation (140 DAS) the damage was found below ETL (<10.0%) in RCH-368, RCH-362, MRC-6322 and RCH-2Bt in protected plots. Interestingly for the first time in both seasons the damage was significant in BG-II genotypes MRC-7201 (10.90% P and 11.60% UP) and MRC-6322 (12.50%-P and 12.31%-UP) in both main plots. The damage in interspecific Bt hybrids was also high in both main plots, however with significant reduction in protected condition. The average of six observations over season (Table 11) indicated least damage due to bollworms in MRC-7201 (6.06%) followed by MRC-6322 BG-II (6.17%), both being on par to each other in unprotected conditions. The damage was significantly more in inter specific Bt hybrids (MRC-6918 and RCH-708) over other Bt genotypes. In protected conditions the damage was found to be uniform among first and second generation Bt genotypes except inter specific Bt genotypes viz., MRC-6918 (9.29%) and RCH-708 (8.39%) which recorded highest damage. At any given comparison among genotypes or protected conditions the damage varied significantly indicating insecticide intervention effect in Bt genotypes as well as commercial conventional checks.
69 Table 11: Fruiting body damage due to bollworms in different Bt cotton genotypes under protected and unprotected conditions during Genotypes RCH-368 Bt RCH-362 Bt MRC-6322 Bt MRC-7201 Bt (BG-II) MRC-6322 Bt (BG-II) MRC-6918 Bt RCH-708 Bt RCH-2Bt DHH-11 DCH-32 Mean Damage to fruiting bodies (%) 50 DAS 65 DAS 80 DAS 95 DAS UP P Mean UP P Mean UP P Mean UP 0.37 (2.81) 0.40 (2.92) 0.97 (5.57) 0.57 (4.27) 0.37 (2.75) 0.37 (3.38) 0.47 (3.90) 0.37 (3.38) (18.45) (21.64) 2.75 (6.90) 0.27 (2.81) 0.30 (3.00) 0.97 (5.58) 0.40 (3.57) 0.30 (2.56) 0.60 (4.31) 0.43 (3.68) 0.33 (3.16) (18.89) (21.47) 2.75 ( (2.81) 0.35 (2.96) 0.97 (5.58) 0.48 (3.92) 0.33 (2.66) 0.48 (3.85) 0.45 (3.79) 0.35 (3.27) (18.67) (21.56) 0.53 (3.80) 0.30 (3.00) 1.13 (6.09) 0.47 (3.90) 0.53 (4.11) 1.90 (7.91) 1.80 (7.68) 3.47 (10.68) 7.43 (15.79) (21.10) 3.05 ( (3.80) 0.23 (2.20) 1.07 (5.92) 0.37 (3.46) 0.30 (2.93) 1.83 (7.75) 1.67 (7.41) 3.37 (10.55) 7.63 (16.01) (19.93) 2.85 (7.99) 0.50 (3.80) 0.26 (2.60) 1.10 (6.01) 0.42 (3.68) 0.41 (3.52) 1.86 (7.83) 1.73 (7.55) 3.42 (10.62) 7.53 (15.90) (20.52) 6.17 (14.36) 6.03 (14.20) 6.33 (14.56) 3.67 (11.00) 4.50 (12.23) 6.97 (15.31) 7.23 (15.59) 4.87 (12.72) (22.39) (29.63) 8.47 (16.20) 6.13 (14.31) 5.90 (14.01) 6.23 (14.44) 3.63 (10.96) 4.03 (11.52) 7.10 (15.45) 5.53 (13.60) 4.80 (12.64) (20.72) (24.20) 7.27 (15.18) 6.15 (14.34) 5.96 (14.11) 6.28 (14.50) 3.65 (10.98) 4.26 (11.88) 7.03 (15.38) 6.38 (14.60) 4.83 (12.68) (21.56) (26.92) 8.90 (17.36) (18.97) (19.12) 8.07 (16.50) 7.20 (15.55) (22.22) (19.94) 9.20 (17.66) (27.33) (30.19) (20.48) P 9.13 (17.59) (18.66) 9.73 (18.14) 6.53 (14.81) 6.73 (15.04) (21.31) (19.21) 8.07 (16.49) (24.83) (27.39) (19.34) Mean 9.01 (17.48) 10.4 (18.82) (18.63) 7.30 (15.66) 6.96 (15.30) (21.77) (19.58) 8.63 (17.08) (26.08) (28.79) SEm± CD at 5% SEm± CD at 5% SEm± CD at 5% SEm± CD at 5% Protection -- NS -- NS -- NS -- NS genotypes Interaction Interaction DAS: Days after sowing UP: Unprotected condition P: Protected condition Figures in the parentheses are arc sine transformations Interaction 1: CD for comparison between two genotype means at the same protection Interaction 2: CD for comparison between two protection means at the same or different genotypes contd
70 Table 11: (contd...) Genotypes RCH-368 Bt RCH-362 Bt MRC-6322 Bt MRC-7201 Bt (BG-II) MRC-6322 Bt (BG-II) MRC-6918 Bt RCH-708 Bt RCH-2Bt DHH-11 DCH-32 Mean Damage to fruiting bodies (%) 110 DAS 125 DAS 140 DAS Average UP P Mean UP P Mean UP P Mean UP (22.73) (21.67) (21.02) 8.83 (17.29) 9.33 (17.77) (28.44) (27.99) (21.73) (29.66) (42.37) (25.06) (21.19) (21.25) (19.58) 8.73 (17.19) 9.17 (17.63) (22.00) (21.31) (19.00) (25.85) (34.24) (21.92) (21.96) (21.46) (20.30) 8.78 (17.24) 9.25 (17.70) (25.22) (24.65) (20.37) (27.76) (38.31) 15.9 (23.51) (23.54) (25.61) 9.20 (17.67) 8.95 (17.42) (32.87) 28.9 (32.54) (22.66) (34.26) 54.8 (47.78) (27.79) 6.83 (15.16) 5.70 (13.82) 7.20 (15.57) 9.65 (18.11) 9.25 (17.72) (23.06) (22.56) 5.51 (13.57) (27.76) (33.50) (20.08) (19.33) (18.68) (20.59) 9.43 (17.89) 9.10 (17.57) (27.97) (27.55) (18.12) (31.01) (40.64) (23.06) (21.65) (23.68) 8.60 (17.04) 8.31 (16.76) (26.05) (26.76) (21.29) (29.63) (44.65) (25.72) 9.37 (17.83) 9.43 (17.89) 9.57 (18.02) 9.10 (17.54) 7.50 (15.87) (21.08) (20.52) 9.23 (17.70) (24.71) (31.71) (20.84) (20.45) (19.77) (20.85) 8.85 (17.27) 7.91 (16.23) (23.57) (23.64) (19.50) (27.17) (38.18) 8.88 (17.34) 8.64 (17.10) 9.55 (18.01) 5.63 (14.16) 5.59 (14.59) (21.62) (21.32) 8.52 (16.98) (25.92) (34.63) (20.80) P 6.47 (14.74) 6.42 (14.69) 6.57 (14.86) 5.44 (13.57) 5.32 (14.33) 9.29 (17.75) 8.39 (16.84) 5.99 (14.17) (22.97) (27.86) 9.19 (17.66) Mean 7.67 (16.04) 7.53 (15.89) 8.06 (16.44) 5.55 (13.86) 5.45 (14.45) (19.69) (19.08) 7.25 (15.58) (24.44) (31.25) SEm± CD at 5% SEm± CD at 5% SEm± CD at 5% SEm± CD at 5% Protection genotypes Interaction Interaction DAS: Days after sowing UP: Unprotected condition P: Protected condition Figures in the parentheses are arc sine transformations Interaction 1: CD for comparison between two genotype means at the same protection Interaction 2: CD for comparison between two protection means at the same or different genotypes
71 Incidence of pink bollworm, Pectinophora gossypiella Flower rosetting caused by incidence of pink bollworm larvae (Table 12) was negligible in MRC-7201 and MRC-6322 BG-II genotypes in both main plots. The percent rosette flower recorded in unprotected conditions was found to be 1.77 and 1.63 per cent in interspecific Bt genotypes MRC-6918 and RCH-708 respectively which was statistically higher compared to other Bt genotypes. There was similar trend in protected main plot also. How ever there was significant difference in rosette flower occurrence as far as DHH-11 and DCH- 32 hybrids were considered and compared among themselves and rest of genotypes irrespective of conditions of protection. The protection offered in conventional hybrids reduced the incidence of PBW larvae infesting flowers. The green boll infestation of PBW was least in MRC-6322 BG-II (0.30 larvae / 10 bolls) and RCH-368 Bt (0.70 larvae / 10 bolls) both being on par in unprotected condition. Interspecific Bt genotypes recorded higher green boll infestation i.e and 1.40 larvae per 10 bolls in MRC-6918 and RCH-708 respectively (both on par) which appeared to be significantly more over other Bt genotypes. However in protected conditions due to inherent toxicity and protection rendered at 110 DAS all genotypes remained statistically on par to each other including DHH-11. Only DCH-32 could record significantly higher (0.90 larvae / 10 bolls) green boll incidence over the rest. The locule damage recorded in unprotected condition was least in BG-II genotypes viz., MRC and MRC-6322 with 1.65 and 2.10 per cent respectively. These two genotypes proved to be significantly superior over rest of the Bt and conventional genotypes in preventing the damage due to PBW. Similarly interspecific Bt genotypes also suffered much due to PBW incidence as indicated by and per cent damage to locules in unprotected condition. Similarly despite of decreased damage in all genotype in protected main plots BG-II genotypes recorded significantly less locule damage compared to other Bt and conventional genotypes. Despite the protection the difference prevailed among interspecific and intraspecifc Bt genotypes, latter i.e. MRC-6918 and RCH-708 recording significantly more damage and per cent locule damage, respectively. There was significant difference in the same genotypes compared for means under protected and unprotected conditions in all the genotypes except two BG-II genotypes.
72 Table 12: Incidence and damage due to pink bollworm Pectinophora gossypiella in different Bt cotton genotypes under protected and unprotected conditions during Genotypes RCH-368 Bt RCH-362 Bt MRC-6322 Bt MRC-7201 Bt (BG-II) MRC-6322 Bt (BG-II) MRC-6918 Bt RCH-708 Bt RCH-2Bt DHH-11 DCH-32 Mean Flower rosetting (%)* PBW larvae / 10 bolls** Locule damage (%)* UP P Mean UP P Mean UP P Mean 0.27 (2.40) 0.53 (3.41) 0.40 (2.92) () 0.05 (0.90) 1.77 (7.61) 1.63 (7.33) 0.40 (3.50) 6.50 (14.75) (20.38) 2.36 (6.32) 0.33 (3.18) 0.47 (3.91) 0.33 (3.30) 0.07 (0.85) () 1.87 (7.77) 1.67 (7.21) 0.33 (2.64) 4.57 (12.22) 4.97 (12.78) 1.41 (5.38) 0.30 (2.79) 0.50 (3.66) 0.37 (3.11) 0.04 (0.43) 0.03 (0.45) 1.82 (7.69) 1.65 (7.27) 0.37 (3.07) 5.54 (13.49) 8.57 (16.58) 0.70 (1.11) 1.50 (1.22) 1.30 (1.19) 0.40 (1.18) 0.30 (1.05) 1.90 (1.27) 1.40 (1.20) 1.60 (1.23) 2.90 (1.40) 4.60 (1.58) 1.66 (1.24) 0.15 (1.07) 0.17 (1.08) 0.13 (1.06) 0.12 (1.05) 0.07 (1.03) 0.23 (1.10) 0.30 (1.14) 0.25 (1.11) 0.26 (1.12) 0.90 (1.37) 0.25 (1.12) 0.43 (1.09) 0.84 (1.15) 0.72 (1.13) 0.26 (1.15) 0.19 (1.04) 1.07 (1.19) 0.85 (1.17) 0.93 (1.17) 1.58 (1.26) 2.75 (1.48) 7.73 (16.14) 9.63 (18.07) 8.27 (16.64) 1.65 (7.39) 2.10 (8.35) (21.86) (23.77) (22.18) (32.08) (37.86) (20.43) 4.73 (12.53) 4.17 (11.75) 5.07 (12.96) 1.83 (7.68) 1.97 (8.05) (19.76) (19.00) 2.50 (8.93) (27.38) (33.83) 9.46 (16.19) SEm± CD at 5% SEm± CD at 5% SEm± CD at 5% Protection -- NS -- NS genotypes Interaction Interaction UP: Unprotected condition P: Protected condition *Figures in the parentheses are arc sine transformation **Figures in the parentheses are x + 1 transformation Interaction 1: CD for comparison between two genotype means at the same protection Interaction 2: CD for comparison between two protection means at the same or different genotypes 6.23 (14.34) 6.90 (14.91) 6.67 (14.80) 1.74 (7.52) 2.03 (8.20) (20.81) (21.39) 8.42 (15.56) (29.73) (35.85)
73 Boll opening From Table -13 it is quite evident that the trend of good opened bolls, bad opened bolls and seed cotton yields in each genotype under protected and unprotected conditions remained similar to that of previous season indicating consistency in the performance. BG-II genotypes MRC-7201 and MRC-6322 had significantly higher GOB/ plant in both main plots differing significantly with rest. There was no much variation in bad opened bolls / plant, but for conventional hybrids bearing more of them with statistical superiority. Table 13: Boll opening and seed cotton yield in different Bt cotton genotypes under protected and unprotected conditions during Genotypes Good opened bolls Bad opened bolls Seed cotton yield (q/ha) UP P Mean UP P Mean UP P Mean RCH-368 Bt RCH-362 Bt MRC-6322 Bt MRC-7201 Bt (BG-II) MRC-6322 Bt (BG-II) MRC-6918 Bt RCH-708 Bt RCH-2Bt DHH DCH Mean SEm± CD at 5% SEm± CD at 5% SEm± CD at 5% Protection NS genotypes Interaction Interaction UP: Unprotected condition P: Protected condition Interaction 1: CD for comparison between two genotype means at the same protection Interaction 2: CD for comparison between two protection means at the same or different genotypes
74 Yield of seed cotton The yield (Table 13) of seed cotton was highest (18.76 q/ ha) in MRC-7201 followed by MRC-6322 BG-II (17.15 q/ ha) both being on par and superior to the rest in unprotected condition. In protected condition highest yield (21.20 q/ ha) was recorded from in RCH-2 Bt (check). Only two genotypes RCH-368 Bt (19.50 q/ ha) and MRC-7201 (20.66 q/ ha) could remain on par to the best treatment (RCH-2 Bt) despite protection rendered. Interspecific Bt hybrids though had significantly less yield compared to other Bt genotypes in both protected or in unprotected condition, exhibited an edge over DCH-32 a conventional interspecific hybrid check Performance of different Bt genotypes (Pooled) Incidence of Earias vittella larvae The number of E. vittella larvae/ plant ranged from to 0.15 among the Bt genotypes in unprotected condition as against to 0.13/ plant in protected condition (Table 14). The genotypes, MRC-7201 Bt and 6322 Bt BG II recorded no larvae of E. vittella in both the conditions of protection. Highest (0.15 larvae/ plant) number of E. vittella larvae was recorded in RCH-362 Bt in unprotected condition which was on par with all other Bt genotypes except MRC 6322 BG II, 7201 and RCH-708 Bt. Similarly in the protected condition, highest larval number (0.13/ plant) was noticed in RCH 2Bt which was not statistically different from other Bt genotypes except MRC BG II and MRC The non-bt genotypes (DHH-11 and DCH-32) recorded significantly higher number of E. vittella larvae compared to Bt genotypes recording 2.62 and 3.53 / plant in unprotected condition as against 1.05 and 1.91/ plant in protected condition respectively.
75 Table 14: Pooled data of E. vittella, H. armigera larvae and per cent fruiting body damage for two seasons. Genotypes RCH-368 Bt RCH-362 Bt MRC-6322 Bt MRC-7201 Bt (BG-II) MRC-6322 Bt (BG-II) MRC-6918 Bt RCH-708 Bt RCH-2Bt DHH-11 DCH-32 E. vittella larvae/ plant** Pooled data of and H. armigera larvae/plant** Fruiting body damage (%)* UP P Mean UP P Mean UP P Mean 0.11 (1.05) 0.15 (1.07) 0.12 (1.05) 0.10 (1.04) 0.06 (1.02) 0.14 (1.06) 2.62 (1.90) 3.53 (2.13) 0.10 (1.05) 0.08 (1.04) 0.10 (1.04) 0.10 (1.05) 0.08 (1.03) 0.13 (1.06) 1.05 (1.43) 1.91 (1.70) 0.11 (1.05) (1.32) 0.72 (1.31) 0.72 (1.31) 0.13 (1.06) 0.26 (1.12) 1.02 (1.42) 1.03 (1.42) 0.57 (1.26) 1.50 (1.58) 2.37 (1.83) 0.54 (1.24) 0.42 (1.19) 0.48 (1.21) 0.13 (1.06) 0.14 (1.06) 0.64 (1.28) 0.58 (1.26) 0.43 (1.19) 1.02 (1.42) 1.83 (1.68) 0.64 (1.28) 0.57 (1.25) 0.60 (1.26) 0.13 (1.06) 0.20 (1.10) 0.83 (1.35) 0.80 (1.34) 0.50 (1.22) 1.26 (1.50) 2.10 (1.76) 8.07 (16.49) 8.18 (16.61) 9.24 (17.69) 5.05 (13.18) 5.32 (14.05) (20.63) (20.01) 8.29 (16.74) (24.79) (31.74) 5.73 (13.83) 5.87 (14.02) 6.24 (14.47) 4.98 (12.86) 5.23 (13.72) 8.28 (16.69) 7.81 (16.22) 5.44 (13.48) (21.72) (26.20) 6.90 (15.16) 7.02 (15.32) 7.74 (16.08) 5.00 (13.86) 5.37 (13.88) (18.67) 9.77 (18.12) 6.87 (15.11) (23.26) (28.97) SEm± CD at 5% SEm± CD at 5% SEm± CD at 5% Interaction Interaction *Figures in the parentheses are arc sine transformation **Figures in the parentheses are x + 1 transformation Interaction 1: CD for comparison between two genotype means at the same protection Interaction 2: CD for comparison between two protection means at the same or different genotypes
76 Incidence of Helicoverpa armigera larvae The interactions and the conditions of protection were non significant in recording the number of H. armigera larvae/ plant. However, among the genotypes, Bt entities had showed their superiority (Table 14) over non-bt by recording lower number of H. armigera larvae / plant. In unprotected condition, lowest (0.13/ plant) number of H. armigera larvae was recorded in MRC-7201 which was significantly superior over all other genotypes. This was followed by RCH-2Bt recording 0.57 larvae/ plant. Highest number (1.03/ plant) of H. armigera larvae was noticed in RCH-708 Bt. In protected condition, MRC-7201 and MRC-6322 Bt BG II recorded lowest (0.13 and 0.14 larvae /plant) H. armigera larvae followed by RCH-362 Bt recording only 0.42 larvae/ plant. Highest number of H. armigera (0.64 larvae / plant) was observed in MRC-6918 Bt. DHH-11 and DCH-32 recorded 1.50 and 2.37 larvae / plant in unprotected condition and 1.02 and 1.83 larvae / plant in protected condition respectively Fruiting body damage The interactions, condition of protection and the genotypes had shown significant differences in registering the per cent damage to fruiting bodies. In the unprotected condition, among the Bt genotypes, lowest fruiting body damage (5.05%) was observed in MRC-7201 Bt (Table 14) which was at par with MRC 6322 BG-II (5.32%) followed by RCH-368 Bt recording 8.07 per cent damage. Highest damage (12.43%) to fruiting bodies was noticed in MRC-6918 Bt. In the protected condition also same trend was observed with MRC-7201 registering the lowest (4.98%) percent damage to fruiting bodies which was on par with MRC-6322 BG-II (5.23%), RCH-2Bt (5.44%), RCH-368 Bt (5.73%), RCH 362 Bt (5.87%) and MRC 6322 Bt (6.24%). The non-bt genotypes DHH-11 and DCH-32 recorded significantly higher per cent fruiting body damage registering and per cent in unprotected conditions as against and per cent in protected condition Pink bollworm incidence Green boll infestation The conditions of protection and the interactions were non significant in recording the number of PBW larvae/10 bolls. However, among the genotypes, there exists significant variation in this parameter (Table 15). In the unprotected condition, lowest number (0.22/ 10 boll) of PBW was observed in the genotype MRC 6322 (BG II) and MRC-7201 Bt (BG-II) recording 0.32 larvae / 10 bolls. Highest number of PBW larvae (1.67/ 10 bolls) was noticed in MRC-6918 Bt. In protected condition also, MRC 6322 (BG-II) recorded the lowest PBW (0.09 larvae/ 10 bolls) which was on par with all other Bt genotypes. Highest number of PBW larvae (0.45 / 10 bolls) was recorded in RCH-708 Bt. The non-bt genotypes, DHH-11 and DCH-32 recorded 0.28 and 0.95 PBW larvae /10 bolls in protected condition while the corresponding values for unprotected condition being 1.94 and 3.04 larvae / 10 bolls respectively Flower Rosetting Among the Bt genotypes in unprotected condition, lowest (Table 15)per cent flower resetting (0.03%) was noticed in MRC-6322 BG-II which was on par with MRC 7201 (0.07%), RCH 368 Bt (0.34%), MRC 6322 Bt (0.40%), RCH-362 Bt (0.60%), RCH 2 Bt (0.50%) and RCH-708 Bt (1.57 %). Highest per cent rosetting (1.90%) was observed in MRC-6918 Bt. In the protected condition also same trend was observed. In the case of non-bt genotypes, DHH-11 and DCH-32 the highest values of this parameter were noticed in both the condition of protection with 7.32 and per cent in unprotected condition and 4.70 and 6.45 per cent in protected condition respectively.
77 Table 15: Pooled data of PBW larvae, per cent rosetting and locule damage for two seasons Genotypes RCH-368 Bt RCH-362 Bt MRC-6322 Bt MRC-7201 Bt (BG-II) MRC-6322 Bt (BG-II) MRC-6918 Bt RCH-708 Bt RCH-2Bt DHH-11 DCH-32 Pooled data of and PBW larvae/ 10 bolls** Rosetting* Locule Damage (%)* UP P UP P UP P (1.24) (1.07) (3.30) (3.53) (16.97) (13.79) (1.40) (1.09) (4.44) (4.13) (18.55) (11.61) (1.36) (1.09) (3.63) (3.39) (16.51) (12.26) (1.15) (1.05) (1.03) (1.66) (8.18) (8.09) (1.10) (1.04) (0.64) (0.76) (8.60) (8.77) (1.63) (1.22) (7.92) (8.27) (22.99) 20.28) (1.50) (1.20) (7.19) (7.32) (23.32) (19.95) (1.43) (1.11) (4.04) (3.68) (21.06) (9.18) (1.69) (1.13) (15.68) (12.53) (30.12) (24.16) (1.97) (1.40) (21.85) (14.63) (39.89) (33.04) SEm± CD at 5% SEm± CD at 5% SEm± CD at 5% Interaction Interaction UP: Unprotected condition P: Protected condition *Figures in the parentheses are arc sine transformation **Figures in the parentheses are x + 1 transformation Interaction 1: CD for comparison between two genotype means at the same protection Interaction 2: CD for comparison between two protection means at the same or different genotypes
78 Locule damage MRC-7201 Bt recorded significantly lowest percent (2.04%) damage to locules which was on par with MRC 6322 Bt (BG-II) (2.24%). All the other genotypes recorded higher per cent locule damage with RCH-708 Bt recording the highest (15.66%) among Bt genotypes under unprotected condition. Under protected condition, MRC 7201 recorded the lowest (1.98%) damage to locules which was on par with MRC-6322 Bt (BG-II) (2.34%), RCH-2Bt (2.55%) and RCH-362 Bt (4.05 %). Highest locule damage (11.65%) was noticed in RCH-708 Bt (Table 15). Similar to the other parameters, the non-bt genotypes were inferior and recorded higher per cent damage to locules. In unprotected condition, and per cent damage to locules was noticed in DHH-11 and DCH-32 as against and per cent in protected condition respectively Boll opening and yield parameters GOB per plant In the unprotected condition, highest GOB/ plant (25.40) was noticed in MRC 7201 Bt (GII) (Table 16) which was on par with MRC-6322 Bt (BG-II) (21.93/ plant) followed by RCH- 2 Bt (17.61/ plant). Lowest number of GOB (12.21/ plant) was recorded in MRC 6322 Bt. In protected condition also MRC-7201 Bt recorded highest number of GOB (27.30/ plant) which was on par with the non-bt genotype DHH-11 (27.23/ plant), MRC-6322 Bt (BG-II) (24.83/ plant) and RCH-2Bt (23.70 / plant). DCH-32 recorded least GOB (8.60 and 13.22/ plant) in unprotected and protected conditions respectively BOB per plant The number of BOB (Table 16) were lowest in MRC 6322 Bt (BG-II) (2.07/ plant) which was on par with MRC-7201 Bt (BG-II) (2.50/ plant), RCH 362 Bt (3.15/ plant) and MRC 6322 Bt (2.98/ plant) and RCH-2 Bt (3.33/ plant) in the unprotected condition all being on par. Highest number of BOB (4.92 / plant) was recorded in MRC-6918 Bt. In the protected condition also same trend was noticed. The non-bt genotypes DHH-11 and DCH-32 recorded significantly higher number of bad opened bolls registering and per plant in unprotected condition as against 8.76 and 7.08 per plant in protected condition respectively Seed cotton yield In unprotected condition, highest (19.33q/ha) seed cotton yield was observed (Table 16) in MRC-7201 Bt (BG-II) which was significantly superior to all other genotypes. This was followed by MRC 6322 Bt (BG-II) recording (17.63 q/ha). Lowest yield was recorded in MRC 6918 Bt (10.11q/ha). In protected condition RCH 2Bt performed well recording highest yield (21.31 q/ha) which was not statistically different from MRC-7201 Bt followed (20.58 q/ha) by RCH-368 Bt (20.34 q / ha) followed by DHH-11 (18.75 q / ha) which in turn was at par with RCH-362 Bt (18.68 q / ha) and MRC 6322 Bt BG-II (18.47 q / ha). The non-bt genotypes, DHH-11 and DCH-32 recorded lower yield in unprotected condition with only 8.96 and 4.57 q / ha respectively. In protected condition DCH-32 recorded the lowest yield of 8.83 q / ha.
79 Table 16: Pooled data of GOB, BOB and Seed cotton yield for two seasons Genotypes Pooled data of and GOB/plant BOB/plant Seed cotton yield(q/ha) UP P Mean UP P Mean UP P Mean RCH-368 Bt RCH-362 Bt MRC-6322 Bt MRC-7201 Bt (BG-II) MRC-6322 Bt (BG-II) MRC-6918 Bt RCH-708 Bt RCH-2Bt DHH DCH Mean SEm± CD at 5% SEm± CD at 5% SEm± CD at 5% Protection Genotypes Interaction Interaction UP: Unprotected condition P: Protected condition Interaction 1: CD for comparison between two genotype means at the same protection Interaction 2: CD for comparison between two protection means at the same or different genotypes 4.2 ASSESSMENT OF CHANGES IN Cry PROTEIN EXPRESSION AT DIFFERENT STAGES OF CROP GROWTH Temporal variation in the expression pattern of Cry1Ac as well as Cry1Ac + Cry2Ab was assessed through bioassay and ELISA in RCH-2 Bt and RCH-2Bt BG-II. The results have been presented here under Temporal variation in bio-efficacy of Cry1Ac during 2004 Season long variation in bio-efficacy of Cry1Ac toxin expressed in RCH-2Bt was assessed against neonates of H. armigera, E. vittella and P. gossypiella from 45 to 135 DAS (Table 17) Mortality of H. armigera larvae
80 The mortality of H. armigera varied significantly at different stages of crop growth. The bio-efficacy of Bt plants appeared to be significantly higher at initial stages of crop growth compared to later part of the season. At 45 DAS mortality of H. armigera fed on top leaves of RCH-2 Bt was percent, which increased significantly (94.10per cent) at 60 DAS. Maximum mortality (98.33%) was noticed at 75 DAS. At 90 DAS mortality though reduced (95.25%), but found to be on par to previous stage. Then at subsequent observations mortality reduced significantly recording the least (20.55%) at 135 DAS Mortality of E. vittella larvae At 45 and 60 DAS there was cent per cent mortality in neonates of E. vittella fed with squares of RCH-2 Bt (Table 17). Further at 75 DAS mortality reduced slightly (98.17%), but remained statistically on par to the effect noticed at previous observation. From 90 DAS onwards there was consistent and significant decrease in the efficacy of Cry1Ac toxin expressed in RCH-2 Bt as indicated by mortality figures at 105 DAS (88.21%) and 135 DAS (64.50%). Table 17: Season long bio-efficacy of Cry1Ac (RCH-2 Bt) against bollworms DAS Neonate mortality (%) H. armigera E. vittella P. gossypiella (73.92)c 10 (9)a (75.91)bc 10 (9)a (82.62)a 98.17(82.22)a 76.77(61.19)b (77.55)b 93.29(74.98)b 89.52(71.14)a (58.39)d 88.21(69.94)c 75.33(60.23)b (38.46)e 71.35(57.64)d 66.17(54.24)c (26.94)f 64.50(53.45)e 52.17(46.21)d 5.0% Figures in the parentheses are arcsine values Figures in the same column with similar alphabets do not differ significantly at P=0.05 by DMRT
81 Mortality P. gossypiella larvae The mortality noticed in case of P. gossypiella larvae (Table 17) was found to be high (89.52%) at 90 DAS, decreasing significantly at 105, 120 and 135 DAS as indicated by a mortality of 75.33, and per cent respectively. However, the mortality considered to be high at initial stages of boll development i.e., 75 to 105 DAS Temporal variation in bio-efficacy of Cry1Ac during Mortality of H. armigera larvae At 40 and 60 DAS there was and percent mortality of H. armigera neonates fed with top canopy leaves of RCH-2 Bt (Table 18). The efficacy was found to be quite high at 80 DAS (96.92%) revealing maximum expression at that stage of the crop growth. Then there was fall in expression, and mortality reached percent at 105 DAS and least of per cent by 120th day of crop growth Mortality E. vittella larvae There was complete mortality (Table 18) in the larvae of E. vittella feeding on squares of RCH-2 Bt at 40 and 60 DAS. The bio-efficacy was found to be quite high till 105 DAS (90.27%) which reduced to per cent by 120 th day crop growth. However, the bioefficacy of Cry toxin expressed in squares was found to be quite lethal to E. vittella throughout the growth period. Table 18: Season long bio-efficacy of Cry1Ac (RCH-2 Bt) against bollworms DAS Neonate mortality (%) H. armigera E. vittella P. gossypiella (75.69)b 10 (9) a (77.58)ab 10 (9) a (79.89)a 96.31(78.90)b 84.35(66.71)a (57.50) c 90.27(71.82)c 78.50(62.35)b (39.92)d 74.32(59.56)d 70.31(56.99)c 5.0% Figures in the parentheses are arcsine values Figures in the same column with similar alphabets do not differ significantly at P=0.05 by DMRT
82 Mortality of P. gossypiella larvae The bio-efficacy of Cry1Ac toxin against pink bollworm appeared to be maximum (84.35%) at 80 DAS followed by per cent at 105 DAS. There was percent mortality when the bolls from 120 DAS old Bt plants were fed to pink bollworm neonates (Table 18) Temporal variation of bio-efficacy of Cry1Ac + Cry2Ab in RCH-2 BG-II Mortality of H. armigera larvae Neonates of H. armigera subjected for bio-assay with top canopy leaves of RCH-2 Bt producing both Cry1Ac + Cry2Ab toxins caused complete mortality at 40 and 60 DAS (Table 19). At 80 DAS also mortality was very high (98.35%) and then the expression was found to reduce causing per cent mortality at 135 DAS. Thus the second generation transgenic revealed enhanced effect of Cry protein pyramid construct on dreaded pest H. armigera In season changes in Cry toxins expression In season changes in Cry1Ac toxin expression in RCH-2 Bt. The expression of Cry1Ac toxin estimated through ELISA at different stages of crop growth has been presented Table 20. During 2004 the expression was quantified in top canopy leaves at 45, 70, 80, 105, 120 and 135 DAS. The concentration of Cry1Ac toxin was 3.49 µg/g fresh weight which was quite higher compared to rest of the estimations in the season. At 70 DAS concentration was 3.17 µg/ g fresh weight. Further, concentration estimated was found to reduce and reach 1.52 µg/g at 80 DAS, 1.35 µg / g at 105 DAS. Estimations at 120 and 135 DAS have shown the concentration below limit of quantification. During 2005, Cry1Ac toxin was estimated in top leaf, squares as well as boll rinds (Table 20) at 40, 45, 60, 75, 80, 105, 120 and 135 DAS. Concentration in leaf at 40 DAS was as high as 5.07 µg/ g fresh weight and was found to reduce there after. However, at 60 DAS (3.33 µg / g) and 80 DAS (2.01 µg / g) also concentration appeared to the high. Further at 105 DAS only 1.24 µg/ g was detected and by 135 DAS estimates could not show values above limit of quantification. Cry1Ac concentration in squares estimated to be 1.27, 2.10, 0.83 and 0.20 µg / g fresh weight at 45, 60, 80 and 105 DAS. The concentration in boll rinds in three estimates (75, 80 and 105 DAS) appeared below limit of quantification.
83 Table 19: Season long bio-efficacy of Cry1Ac + Cry2Ab (RCH-2 Bt-BG-II) against bollworms DAS Neonate mortality (%) H. armigera E. vittella P. gossypiella S.litura (9)a 10 (9)a (61.70)bc (9)a 10 (9)a (64.33)ab (82.70)b 10 (9)a (73.89)a (66.10)a (72.33)c 10 (9)a (72.04)a (59.59)c (66.20)d (77.61)b (68.17)c 71.72(57.87)c (60.91)e (69.95)c (63.68)d 57.77(47.15)d 5.0% Figures in the parentheses are arcsine values Figures in the same column with similar alphabets do not differ significantly at P=0.05 by DMRT Table 20: Temporal variation in Cry1Ac toxin expression in RCH-2 Bt Cry1Ac concentration (µg/ g fresh weight) DAS Leaf Leaf Square Boll rind 40 NA 5.07 NA NA NA NA NA < LOQ < LOQ < LOQ < LOQ < LOQ 135 NA < LOQ NA -- NA : Not assessed LOQ: Limit of quantification
84 In season changes in Cry1Ac and Cry2Ab toxins expression in RCH-2 BG-II Bt Expression of Cry1Ac in two gene RCH-2 Bt leaves was 3.19 µg/ g at 40 DAS and increased to 3.42 µg/ g at 60 DAS(Table 21). Then onwards it started declining. Concentration of Cry2Ab was high compared to Cry1Ac In leaf tissue at 40, 60 and 80 DAS Cry2Ab concentrations was 40.10, and µg/ g respectively with increasing expression. Later it found to reduce. The maximum concentration in squares was (56.90 µg/ g) noticed at 60 DAS. 4.3 ASSESSMENT OF Cry PROTEIN EXPRESSION AND CONCENTRATION IN DIFFERENT PARTS OF TRANSGENIC PLANTS Assessment of Cry1Ac and Cry1Ac + Cry2Ab expression in leaves (top, middle, bottom canopy), squares, flowers, boll rind and shoot tip was carried out through bio-assay and ELISA estimation. The results are presented in Table 22 and 23. Table 21: Temporal variation in Cry1Ac and Cry2Ab toxins expression in RCH-2 Bt BG-II Concentration (µg/ g fresh weight) DAS Cry1Ac Cry2Ab Leaf Square Leaf Square NA NA NA <LOQ NA NA NA NA : Not assessed LOQ: Limit of quantification
85 4.3.1 In plant variation in Cry1Ac toxin in RCH-2 Bt Bio-efficacy against H armigera larvae The concentration of Cry1Ac toxin was found to be higher in leaves compared to other parts of the plants (Table 22) in 2004 bioassay studies. Mortality in neonates of H. armigera was cent per cent when leaves of top and middle canopy were fed. Similarly larval mortality caused by squares (78.29%) and flower (75.15%) was found to be on par statistically indicating that feeding either on squares or flowers would cause similar level of mortality. Bio efficacy expressed by boll rind was least. During 2005 also, bio-assay with H. armigera neonates revealed similar trend recording maximum possible mortality (100%) due to high toxin concentration in top and mid canopy leaves. Next in the order of bio efficacy were squares (79.10%) flowers (76.15%) and boll rind (45.31%) with significant reduction in mortality Bio-efficacy against E. vittella larvae From Table 22 it is evident that mortality of E. vittalla neonates also recorded maximum (100%) mortality when fed on squares (both years). Boll rind concentration of Cry1Ac recorded and percent mortality in 2004 and 2005 laboratory assays respectively. Feeding on shoot tip also caused mortality to the tune of percent (Table 22) Quantification of Cry1Ac toxin in different parts of the plant Quantification of Cry1Ac toxin through ELISA (Table 22) indicated higher concentration in leaves followed by square and boll rind. During 2004 Cry1Ac concentration was 3.80 µg/ g fresh weight in bottom canopy leaf. It was followed by top canopy leaf (2.90 µg / g) and mid-canopy leaf (2.23 µg / g). Estimation of Cry1Ac in squares indicated 1.55 µg/ g toxin accumulation. Similarly, during 2005 estimations revealed a maximum of 4.17 µg / g toxin in bottom canopy leaf followed by top leaf (3.12 µg / g) and mid canopy leaf (2.19 µg / g). In squares 1.60 µg/ g toxin was detected. Further at both seasons toxin expressed in boll rind remained below limit of quantification In plant variation in Cry1Ac + Cry1 Ab toxins in RCH-2 BG II Bio-efficacy against H. armigera larvae Mortality of H. armigera neonates feeding on leaves (irrespective of position in plant) was found to be cent per cent due to two toxins Cry1Ac and Cry2Ab produced together at higher concentration (Table 23). The pyramid gene found to express considerably high concentration of toxin mix in squares also leading to high degree of mortality (93.28%). Similarly feeding on flowers caused per cent mortality indicating higher level of expression. Bio-efficacy was found limiting to percent mortality in boll rinds Bio efficacy against E. vittella larvae In squares and boll rinds the concentration of Cry1Ac and Cry2Ab appeared to be high causing 10 and per cent mortality of E. vittella neonates. Further in shoot tip feeding assay mortality was per cent. The mortality figures for there three parts of the plants i.e., squares, boll and shoot tip varied significantly (Table 23).
86 Table 22: Intraplant variation in Cry1Ac toxin expression and bio-efficacy (RCH-Bt) Parts Neonate mortality (%) H. armigera E. vittella Toxin (µg/ g fresh weight) Leaf (Top) (9)a (9)a NA NA Leaf (Middle) (9)a (9)a NA NA Leaf (Bottom) (82.11)b (79.04)b NA NA Square (62.20)c (68.79)c (9)a (9)a Flower (60.11)c (60.75)d NA NA NA NA Boll rind (43.44)d (42.33)e (52.78)c (53.84)c <LOQ <LOQ Shoot tip NA NA (39.33)b (40.71)b NA NA 5.0 % Figures in the parenthesis are arcsine values Figures in the same column with similar alphabets do not differ significantly at P=0.05 by DMRT NA : Not assessed LOQ: Limit of quantification Quantification of Cry1Ac and Cry2Ab in two gene Bt plants (RCH-2 BG-II). Quantification of Cry1Ac and Cry2Ab expression through ELISA (Table 23) in RCH- 2Bt BG-II indicated variation similar to that plants coding for Cry1Ac toxin only. Highest concentration of Cry1Ac (4.22 µg/ g fresh weight) was expressed in bottom canopy leaves. In top canopy leaves 3.40 µg / g toxin of Cry1Ac was expressed. It was followed by mid-canopy leaf (2.17 µg / g) and squares (1.62 µg / g). Concentration of Cry2Ab was higher compared to Cry1Ac from the same parts of plants used for analysis. Concentration of Cry2Ab was more in leaves compared to other parts i.e. similar to that of Cry1Ac expression pattern. However, within leaves middle canopy leaves expressed highest (95.17 µg / g) concentration followed by bottom canopy leaf (78.50 µg / g) and least (50.36 µg / g) in top leaf. Squares expressed Cry2Ab concentration of µg/ g fresh weight. In this case also, concentration in boll rind remained below limit of quantification.
87 Table 23: Intra plant variation in Cry1Ac + Cry2Ab toxin expression and bio-efficacy (RCH-2 Bt BG-II) Parts H. armigera Neonate mortality (%) Toxin (µg/ g fresh weight) E. vittella S. litura Cry1Ac Cry2Ab Leaf (Top) (9)a NA (60.74)b Leaf (Middle) (9)a NA (66.21)a Leaf (Bottom) (9)a NA (63.54)a Square (74.90)b 10 (9)a (59.29)c Flower (67.50)c NA NA NA NA Boll rind (48.59)d (73.59)c (45.19)d <LOQ <LOQ Shoot tip NA (64.87)b NA NA NA 5.0 % Figures in the parentheses are arcsine values Figures in the same column with similar alphabets do not differ significantly at P=0.05 by DMRT NA : Not assessed LOQ: Limit of quantification 4.4 COMPUTATION OF EIL AND ETL FOR RCH-2 Bt COTTON Damage and yield at different levels of Helicoverpa armigera larval incidence during Damage to fruiting bodies At 55 DAS During the season , at 55 DAS, release of 0.5 to 4.0 early stage (ES) H. armigera larvae rendered no significant result with respect to the damage to fruiting bodies in both protected (p) as well as unprotected (up) conditions. There was no fruiting body damage at all by the release of 0.5, 1.0, 2.0 and 3.0 ES larvae / plant in both protected and unprotected conditions. But, when 4.0 ES larvae were released there was fruiting body damage of 1.70 per cent in protected condition as against 2.30 per cent in unprotected (Table 24). When 5.0 ES larvae/plant were released, the value being 2.90 and 3.20 per cent in protected and unprotected conditions respectively. Similarly, late stage larvae also rendered no damage to fruiting bodies when 0.25, 0.5, 0.75 and 1.0 per plant in both
88 protected and unprotected condition. But the release of 1.5 and 2.0 LS larvae/plant caused fruiting body damage of 1.75 and 2.70 per cent in protected condition as against 2.05 and 2.60 percent in unprotected condition respectively. The release of 1 ES and 1 LS larva to the non-bt genotype recorded the highest fruiting body damage of 7.65 and per cent in protected condition while it was 7.70 and in unprotected conditions respectively. At 70 DAS The release of 0.5 and 1.0 ES larva / plant registered no damage to fruiting bodies in both P and UP condition. But the release of 5.0 ES larvae /plant recorded the highest fruiting body damage of 4.75 and 4.70 per cent in P and UP condition respectively. In protected condition the release of 2.0 and 3.0 ES larvae recorded 1.15 and 3.90 per cent damage to fruiting bodies as against 1.20 and 3.15 per cent in UP conditions. The release of 0.25, 0.5 and 0.75LS larva/plant caused no damage to fruiting bodies in both main plots. But lowest fruiting body damage was caused by 1.0 LS larval release recording 2.80 and 3.60per cent damage in P and UP conditions respectively and highest was recorded by the release of 2.0LS larvae / plant which recorded 5.60 and 5.30 per cent damage in P and UP conditions. Release of 1ES and 1LS larva to non-bt genotype, recorded the highest fruiting body damage of and 8.90 per cent in P conditions where it was and in UP conditions respectively(table 24 ). At 85 DAS The release of 0.5, 1.0 and 2.0 ES larvae / plant recorded no damage to the fruiting bodies in both condition of protection at 85 DAS. The per cent damage to fruiting bodies ranged from 3.70 to 5.75per cent in protected conditions due to the release of ES larva from 3.0 to 5.0, the corresponding range in UP conditions being 3.00 to The release of 0.25, 0.5 and 0.75 LS larva / plant imparted no damage to fruiting bodies in both UP and P condition. But the release of single larva/plant caused the highest damage (5.50per cent) to fruiting bodies in P condition while in UP condition, the release of 2.0 larvae / plant recorded the highest fruiting body damage of 5.05 per cent.
89 Table 24: Fruiting body damage (%) as influenced by different levels of H. armigera larval incidence at different stages during 2004 in RCH-2 Bt cotton Treatment 55 DAS 70 DAS 85 DAS 100 DAS s (Larvae/ plant) P UP Mean P UP Mean P UP Mean P UP Mean 0.5ES () () () () () () () () () () () () 1.0ES () () () () () () () () () 6.05 (14.08) 6.75 (15.00) 6.40 (14.54) 2.0ES () () () 1.15 (6.15) 1.20 (6.27) 1.18 (6.21) () () () (19.00) 1 (18.44) (18.72) 3.0ES () () () 3.90 (11.37) 3.15 (10.21) 3.53 (10.79) 3.70 (11.09) 3.00 (9.97) 3.35 (10.53) (20.72) (21.07) (20.89) 4.0ES 1.70 (7.47) 2.30 (8.59) 2.00 (8.03) 3.35 (10.52) 3.60 (10.93) 3.48 (10.72) 4.95 (12.80) 4.95 (12.86) 4.95 (12.83) (21.48) (21.52) (21.50) 5.0ES 2.90 (9.55) 3.20 (10.31) 3.05 (10.19) 4.75 (12.56) 4.70 (12.52) 4.73 (12.54) 5.75 (13.88) 5.45 (13.50) 5.60 (13.69) (22.95) (23.31) (23.13) 0.25LS () () () () () () () () () () () () 0.5LS () () () () () () () () () () () () 0.75LS () () () () () () () () () 3.95 (11.37) 4.20 (11.83) 4.08 (11.60) 1.0LS () () () 2.80 (9.56) 3.60 (10.89) 3.20 (10.23) 5.50 (13.55) 4.30 (11.97) 4.90 (12.77) (19.42) (19.20) (19.31) 1.5LS 1.75 (7.57) 2.05 (8.23) 1.90 (7.90) 3.95 (11.46) 3.65 (10.88) 3.80 (11.17) 2.20 (8.53) 2.30 (8.69) 2.25 (8.61) (22.87) (23.27) (23.07) 2.0LS 2.70 (9.38) 2.60 (9.10) 2.50 (9.28) 5.60 (13.69) 5.30 (13.31) 5.45 (13.50) 4.45 (12.18) 5.05 (12.99) 4.75 (12.58) (23.86) (24.47) (24.16) 1.0ES (nbt) 7.65 (16.05) 7.70 (16.12) 7.68 (16.08) (19.54) (18.67) (19.11) 5.35 (13.37) (19.79) 8.40 (16.58) 5.05 (12.99) (19.06) 7.85 (16.02) 1.0LS (nbt) (19.53) (19.52) (19.52) 8.90 (17.32) (22.58) (19.95) 6.65 (14.95) (21.36) 9.95 (18.15) 8.20 (16.63) (22.23) (19.43) Mean (4.97) (5.13) (8.01) (8.30) (7.16) (7.93) (14.67) (15.67) SEm± CD at 5 % SEm± CD at 5 % SEm± CD at 5 % SEm± CD at 5 % Condition NS NS NS NS Population level Interaction 1 NS Interaction 2 NS DAS: Days after sowing UP: Unprotected condition P: Protected condition ES = Early stage larvae, LS= Late stage larvae Figures in the parentheses are arc sine transformations Interaction 1: CD for comparison between two population level means at the same protection Interaction 2: CD for comparison between two protection means at the same or different population levels contd
90 Table 24: (contd...) Treatments 115 DAS 135 DAS Average (Larvae/ plant) P UP Mean P UP Mean P UP Mean 0.5ES () () () () () () () () () 1.0ES 8.65 (17.11) 8.35 (16.80) 8.50 (16.95) 9.15 (17.61) 9.10 (17.57) 9.13 (17.59) 3.98 (11.50) 4.03 (11.59) 4.00 (11.54) 2.0ES 2.20 (8.53) 1 (18.43) 6.10 (13.48) 2.85 (9.64) (20.15) 7.35 (14.89) 2.80 (9.63) 5.51 (13.58) 4.15 (11.60) 3.0ES 2.50 (9.09) (22.31) 8.45 (15.70) 4.80 (12.66) (23.00) (17.83) 4.57 (12.34) 8.13 (16.56) 6.35 (14.46) 4.0ES 4.35 (12.02) (23.12) 9.88 (17.57) 6.05 (14.23) (24.96) (19.59) 5.63 (13.73) 9.58 (18.04) 7.61 (15.89) 5.0ES 5.55 (13.63) (24.35) (18.99) 8.10 (16.54) (26.64) (21.59) 7.04 (15.39) (19.34) 9.00 (17.37) 0.25LS () () () () () () () () () 0.5LS () () () 1.75 (7.59) 1.95 (8.03) 1.85 (7.81) 0.29 (3.09) 0.33 (3.27) 0.31 (3.18) 0.75LS 4.20 (11.83) 4.50 (12.25) 4.35 (12.04) 9.05 (17.52) 8.85 (17.30) 8.95 (17.41) 2.87 (9.75) 2.93 (9.85) 2.90 (9.80) 1.0LS 6.45 (14.71) (21.57) 1 (18.14) 6.45 (14.71) (22.96) (18.83) 4.46 (12.19) 7.19 (15.56) 5.83 (13.88) 1.5LS 7.45 (15.85) (24.58) (20.21) 7.65 (16.06) (24.70) (20.38) 6.35 (14.60) 9.73 (18.18) 8.04 (16.39) 2.0LS 7.80 (16.23 ) (26.59) (21.41) 9.20 (17.65) (27.53) (22.59) 7.71 (16.10) (20.21) 9.82 (18.16) 1.0ES (nbt) 6.15 (14.36) (19.97) 8.90 (17.16) 7.50 (15.90) (22.74) (19.32) 7.15 (15.51) (19.47) 9.13 (17.50) 1.0LS (nbt) 8.15 (16.59) (23.04) (19.82) 9.15 (17.61) (25.20) (21.41) 8.72 (17.18) (22.37) (19.78) Mean 4.53 (10.71) (16.64) 5.84 (12.69) (18.63) 4.40 (12.11) 6.85 (15.22) SEm± CD at 5 % SEm± CD at 5 % SEm± CD at 5 % Condition Population level Interaction Interaction DAS: Days after sowing UP: Unprotected condition P: Protected condition ES = Early stage larvae, LS= Late stage larvae Figures in the parentheses are arc sine transformations Interaction 1: CD for comparison between two population level means at the same protection Interaction 2: CD for comparison between two protection means at the same or different population levels
91 At 100DAS At 100 DAS, the lowest damage to fruiting bodies was caused by the release of single ES larva /plant i.e and 6.75 per cent in P and UP conditions respectively. By the Progressive release of 2.0 to 5.0 larvae / plant the per cent damage to fruiting bodies ranged from to in P condition as against 1 to in UP condition. With respect to the LS larvae, release of 0.25 and 0.5 larva /plant caused no damage to fruiting bodies at both conditions of protection. But the release of 0.75 to 2.0 LS larva/plant caused damage to fruiting bodies to range from 3.95 to 16.50per cent in protected conditions as against 4.20 to per cent in unprotected conditions. However, the non-bt genotypes which received 1 ES and LS larva each per plant recorded comparatively lower fruiting body damage recording 5.05 and 8.20 per cent in protected conditions as against and in UP conditions. At 115 DAS At 115 DAS, 0.5 ES larval release per plant was unable to cause any damage to fruiting bodies (Table 24). But the release of 1,2,3,4 and 5 ES larvae /plant recorded 8.65, 2.20, 2.50, 4.35 and 5.55 per cent damage to fruiting bodies in protected conditions while the corresponding values were 8.35, 1, 14.40, and per cent in unprotected conditions. The release of 0.25 and 0.5 LS larva per plant could not cause any damage to the fruiting bodies. But release of 0.75, 1.0, 1.5 and 2.0 LS larvae per plant caused fruiting body damage of 4.20, 6.45, 7.45 and 7.80 per cent in protected condition as against 4.50, 13.55, and per cent in unprotected condition. In the non-bt genotypes which received 1.0 ES and 1.0 LS larva recorded 6.15 and 8.15 per cent damage to fruiting bodies in protected condition as against and per cent in unprotected condition respectively. At 135 DAS Similar to the above observations, at 135 DAS also, the release of 0.5 ES larva was unable to cause any damage to fruiting bodies. But the release of 1.0, 2.0, 3.0, 4.0 and 5.0 ES larva /plant registered 9.15, 2.85, 4.80, 6.05 and 8.10 per cent damage to fruiting bodies in protected condition as against 9.10, 11.85,15.25, and per cent in unprotected conditions. Release of 0.25 LS larva / plant did not cause any damage to fruiting bodies in both the conditions of protection. But the progressive release from 0.5 to 2.0 LS larvae /plant recorded significant damage to fruiting bodies registering 1.75, 8.05, 6.45, 7.65 and 9.20 per cent damage by the release of 0.5, 0.75, 1.0, 1.5 and 2.0 LS larvae per plant respectively in protected condition. But in unprotected condition the corresponding values showed a gradual increase in damage ranging from 1.95 per cent (0.5 LS larva /plant) to per cent damage in 2.0 LS larvae / plant. The non-bt genotypes recorded 7.50 and 9.15 per cent damage in protected condition by the release of 1.0 ES and 1 LS larva as against and per cent in unprotected condition respectively (Table 24). Average The average of all the six observations revealed a clear-cut trend in fruiting body damage by the progressive release of different larval stages. In both the conditions of protection (UP and P), 0.5 ES and 0.25 LS larval release per plant did not cause any damage to fruiting bodies. But the release of ES and LS larvae from 1.0 to 5.0 and 0.5 to 2.0 per plant respectively showed a progressive increase in the damage to fruiting bodies in both the conditions. The release of 1.0, 2.0, 3.0, 4.0 and 5.0 ES larvae recorded 3.98, 2.80, 4.57, 5.63 and 7.04 per cent damage to fruiting bodies in protected conditions as against 4.03, 5.15, 8.13, 9.58 and per cent damage in unprotected condition. Similarly in case of LS larval release of 0.5, 0.75, 1.0, 1.5 and 2.0 larvae /plant recorded 0.29, 2.87, 4.46, 6.35 and 7.71 per cent damage to fruiting bodies in protected conditions whereas the corresponding values in unprotected conditions were 0.33, 2.93, 7.19, 9.73 and per cent. The release of 1.0 ES and 1.0 LS larva in the non-bt genotypes registered 7.15 and 8.72 per cent damage to fruiting bodies in protected conditions as against at11.11 and per cent in unprotected conditions (Table 24)
92 Survival of Helicoverpa armigera larvae At 55 DAS At 55 DAS, various population levels of both early stage (ES) and late stage (LS) larvae were unable to survive on the Bt genotype, RCH-2Bt. However, in non-bt version of RCH-2, 84.4 per cent of the ES and per cent of the LS larvae survived in protected conditions as against and per cent in unprotected conditions respectively (Table 25). At 70 DAS At 70 DAS, in Bt genotype only the treatment which received 2.0 LS larvae per plant survived while all other population levels of ES and LS recorded nil per cent survival. Whereas, 4.88 and per cent of the 2.0 LS larvae released per plant survived in the Bt genotype (RCH-2Bt) in protected as well as unprotected conditions respectively. However, and 6.50 per cent of the ES and LS larvae released in non-bt survived under protected conditions while the corresponding values in unprotected conditions being and per cent respectively. At 85 DAS At 85 DAS, release of 5.0 ES larvae recorded a per cent survival of 4.60 and 5.60 in protected and unprotected conditions while release of 2.0 LS larvae / plant survived to an extent of 5.88 and 6.00 per cent in the same conditions respectively. Remaining all other population levels of ES as well as LS were unable to survive in Bt cotton plants. The non-bt plants that received 1.0 each of ES and LS larva / plant recorded 7.20 and per cent survival in protected conditions while it was and in unprotected conditions. At 100 DAS At 100 DAS, 2.65 per cent of the 4.0 ES larvae released per plant survived under unprotected condition while 3.30 and 7.20 per cent of the 5.0 ES larvae released per plant survived in protected and unprotected conditions respectively. No other population levels of ES larvae survived in RCH-2Bt. Regarding LS larvae, the release of 0.25, 0.50 and 0.75 larva /plant could not survive in Bt cotton while the release of 1.0 and 1.5 LS larva / plant survived under unprotected conditions registering 3.35 and 4.70 per cent survival. However the release of 2.0 LS larvae /plant recorded a per cent survival of 7.18 and 7.60 per cent in protected and unprotected conditions respectively. Similar to the other observations, both ES and L S larvae survived in non-bt genotype with per cent survival of 8.95 and in protected condition as against and per cent in unprotected condition. At 115 DAS Under protected condition (Table 25), the population levels of 0.5, 1.0, 2.0 and 3.0 ES larvae / plant were unable to survive in Bt cotton genotype (RCH-2Bt) while the population levels of 4.0 and 5.0 ES larvae / plant survived in protected condition recording 5.03 and 7.05 per cent survival respectively. Under unprotected condition, 0.5 and 1.0 ES larva / plant were not able to survive while the population levels of 2.0, 3.0, 4.0 and 5.0 ES larvae / plant survived to the extent of 3.35, 5.73, and per cent respectively. The first three population levels (0.25, 0.5 and 0.75 larva / plant) of LS were unable to survive in Bt genotype under both condition of protection while under unprotected condition, 5.85 and per cent of the 1.0 and 1.5 LS larvae / plant survived respectively in the Bt genotype. Out of 2.0 LS larvae released / plant, 3.5 per cent survived in protected condition and per cent in unprotected condition. In the non-bt version, and per cent of the ES larvae survived in protected condition while and per cent of the LS larvae survived in unprotected condition.
93 Treatments (Larvae /plant) 0.5ES 1.0ES 2.0ES 3.0ES 4.0ES 5.0ES 0.25LS 0.5LS 0.75LS 1.0LS 1.5LS 2.0LS 1.0ES (nbt) 1.0LS (nbt) Mean Table 25: Per cent survival of H. armigera larvae at different stages of crop growth during DAS 70 DAS 85 DAS 100 DAS P UP Mean P UP Mean P UP Mean P UP Mean () () () () () () () () () () () () (66.87) (56.15) (8.74) () () () () () () () () () () () () (64.57) (50.37) (8.21) () () () () () () () () () () () () (65.72) (53.26) () () () () () () () () () () () 4.88 (12.64) (53.93) (23.96) 6.19 (6.47) () () () () () () () () () () () (35.70) (56.15) (35.46) (9.09) () () () () () () () () () () () (24.17) (55.04) (29.71) () () () () () 4.60 (12.33) () () () () () 5.88 (14.03) 7.20 (15.55) (20.71) 2.16 (4.47) () () () () () 5.60 (13.56) () () () () () 6.00 (14.17) (55.41) (52.42) (9.68) () () () () () 5.10 (12.95) () () () () () 5.94 (14.10) (35.48) (36.57) () () () () () 3.30 (10.40) () () () () () 7.18 (15.51) 8.95 (17.41) (21.47) 2.34 (4.63) () () () () 2.65 (9.34) 7.20 (15.54) () () () 3.35 (10.52) 4.70 (12.52) 7.60 (15.97) (47.61) (47.64) 9.61 (11.37) SEm± CD at 5 % SEm± CD at 5 % SEm± CD at 5 % SEm± CD at 5 % Condition NS NS Population level Interaction Interaction DAS: Days after sowing UP: Unprotected condition P: Protected condition ES = Early stage larvae, LS= Late stage larvae Figures in the parentheses are arc sine transformations Interaction 1: CD for comparison between two population level means at the same protection Interaction 2: CD for comparison between two protection means at the same or different population levels contd () () () () 1.33 (4.67) 5.25 (12.97) () () () 1.68 (5.26) 2.35 (6.26) 7.39 (15.74) (32.51) (34.56)
94 Table 25: (contd...) Treatments 115 DAS 135 DAS Average (Larvae/plant) P UP Mean P UP Mean P UP Mean 0.5ES () () () () () () () () () 1.0ES () () () () () () () () () 2.0ES () 3.35 (10.47) 1.68 (5.23) () 7.10 (15.41) 3.55 (7.70) () 1.74 (7.58) 0.87 (3.79) 3.0ES () 5.73 (13.84) 2.86 (6.92) 3.25 (10.19) (19.15) 7.05 (14.67) 0.54 (4.14) 2.76 (9.54) 1.65 (6.84) 4.0ES 5.03 (12.87) (19.00) 7.85 (15.93) 7.85 (16.28) (25.54) (20.91) 2.15 (8.41) 5.33 (13.35) 3.74 (10.88) 5.0ES 7.05 (15.40) (21.35) (18.38) (19.64) (32.24) (25.94) 4.38 (12.07) 9.08 (17.55) 6.73 (14.81) 0.25LS () () () () () () () () () 0.5LS () () () () () () () () () 0.75LS () () () () () () () () () 1.0LS () 5.85 (13.91) 2.93 (6.96) 3.25 (7.39) (19.83) 7.40 (13.61) 0.54 (2.99) 3.46 (10.72) 2.00 (6.85) 1.5LS () (19.97) 5.83 (9.98) 5.45 (13.50) (26.91) (20.21) 0.91 (5.46) 6.14 (14.35) 3.53 (9.91) 2.0LS 3.50 (10.72) (23.66) 9.80 (17.19) 9.00 (17.47) (33.28) (25.38) 5.07 (13.02) (23.49) (18.26) 1.0ES (nbt) (18.88) (42.71) (30.79) 1 (18.44) (43.67) (31.06) (33.88) (51.36) (42.62) 1.0LS (nbt) (20.89) (48.56) (34.72) 8.10 (16.54) (43.79) (30.17) (27.97) (46.74) (37.35) Mean 2.78 (5.63) (15.25) 4.16 (8.53) (18.56) 4.76 (12.53) (19.65) SEm± CD at 5 % SEm± CD at 5 % SEm± CD at 5 % Condition Population level Interaction Interaction DAS: Days after sowing UP: Unprotected condition P: Protected condition ES = Early stage larvae, LS= Late stage larvae Figures in the parentheses are arc sine transformations Interaction 1: CD for comparison between two population level means at the same protection Interaction 2: CD for comparison between two protection means at the same or different population levels
95 At 135 DAS The trend revealed from the observations of 115 days holds good for 135 days also. 3.25, 7.85 and per cent of the ES larvae survived in protected condition for the respective population levels of 3.0, 4.0 and 5.0 larvae / plant where as the corresponding values for unprotected condition being 10.85, and per cent. In case of LS larvae, the population levels of only 1.0, 1.5 and 2.0 larvae / plant survived in Bt. Under protected condition, 3.25, 5.45 and 9.00 per cent of the late stage larvae survived when released at 1.0, 1.5 and 2.0 larvae / plant while 11.55, and per cent survived in unprotected condition for the same population levels. 1 and per cent of the ES larvae survived in non-bt under protected and unprotected conditions respectively while 8.10 and per cent of LS larvae survived in the respective conditions. Average The overall picture of six observations viz., 55, 70, , 115 and 135 DAS revealed that larval population levels of 0.5, 1.0 ES and 0.25, 0.5, 0.75 LS larvae were unable to survive in Bt (Table 25..contd). However, under unprotected condition, 1.74 per cent of the 2.0 ES larvae released survived while 0.54, 2.76 and 2.15, 5.33 and 4.38, 9.08 per cent of the 3.0, 4.0 and 5.0 larvae / plant released survived in the protected and unprotected conditions respectively. Of the 1.0, 1.5 and 2.0 LS larvae released per plant, 0.54, 0.91 and 5.07 per cent survived under protected condition as against 3.46, 6.14 and per cent survived under unprotected condition. In non-bt, and per cent of the ES larvae per plant survived in protected and unprotected conditions respectively while the corresponding values for LS larvae being and per cent Boll opening and yield The number of good opened bolls (GOB) in the Bt genotype (RCH-2Bt) as influenced by the different population levels of larvae revealed (Table 26) significant difference with respect to the conditions (unprotected and protected) as well as population levels. In protected situation, the number of GOB / plant ranged from to / plant when the six population levels viz., 0.5, 1.0, 2.0, 3.0, 4.0 and 5.0 ES larvae were released. Lowest GOB was recorded when 1.0 ES larva was released and highest when 2.0 ES larvae were released. With respect to the LS larvae the GOB / plant ranged from to when 1.0 and 0.25 LS larvae / plant were released in protected condition. However the non-bt genotype with 1 ES and 1 LS larvae recorded least number of GOB (19.19 and / plant) respectively. In unprotected condition, lowest GOB (12.98 / plant) was recorded when 5.0 ES larvae were released while a higher GOB of / plant was recorded when 0.5 ES larva / plant was released which was on par with the release of 1.0 ES larva / plant and 2.0 ES larvae / plant recording and GOB/ plant respectively. Among the population levels of LS larvae, highest (20.97 /plant) was recorded when 0.25 larva was released which was on par with the release of 0.5, 0.75 and 1.0 larva / plant recording 20.79, and / plant respectively. Lowest (12.58 / plant) GOB was recorded when 2.0 LS larvae / plant were released in non-bt. An average of 5.34 and 5.05/plant were only recorded when 1ES and 1LS larva/plant were released.
96 Table 26: Boll opening and seed cotton yield as influenced by varied level of H. armigera larval infestation during 2004 Treatments (Larvae/plant) GOB/plant g/plant Seed Cotton Yield q/ha P UP Mean P UP Mean P UP Mean 0.5ES ES ES ES ES ES LS LS LS LS LS LS ES (nbt) LS (nbt) Mean SEm± CD at 5 % SEm± CD at 5 % SEm± CD at 5 % condition population level Interaction Interaction UP: Unprotected condition P: Protected condition ES = Early stage larvae, LS= Late stage larvae Interaction 1: CD for comparison between two population level means at the same protection Interaction 2: CD for comparison between two protection means at the same or different population levels
97 Seed cotton yield In general, all the population levels of early stage larvae recorded higher seed cotton yield (Table 26) compared to later stage. In protected condition, highest yield of g/plant (20.70 q/ha) was recorded when 2.0 early stage larvae / plant were released which was significantly superior over all other levels of early stage larval population. This was followed by the release of 3.0 ES larvae / plant recording g/plant (19.55 q/ha) which was on par with the population level of 4.0 ES larvae / plant recording g/plant (19.30q/ha). Lowest yield of g/plant (18.55 q/ha) was recorded when 1.0 early stage larva / plant was released. Among the population levels of LS larvae, highest yield was recorded when 0.25 LS larva / plant was released recording g/ plant (18.45 q/ha) which was on par with the release of 0.5 LS larva / plant (98.54 g/ plant i.e q/ha) and 1.5 LS larvae (99.35 g/plant i.e q/ ha). Lowest yield was recorded when 1.0 LS larva /plant was released (94.49 g /plant i.e q/ha). Non-Bt genotype recorded lower yields viz., and g/plant (16.70 and q/ha) when 1 ES and 1 LS larva / plant were released. In unprotected condition, highest yield of g/plant (18.75 q/ha) was recorded when 0.5 ES larva was released to the Bt genotype while lowest yield was observed when 5.0 ES larvae / plant was released recording g/ plant (11.30 q/ha). All the population levels recorded yields, which were statistically different from each other (Table 26). Regarding the late instars, highest (98.54 g/ plant i.e q/ ha) seed cotton yield was recorded when 0.25 LS larva was released which was not statistically different from the population levels of 0.5 LS larva / plant recording g/plant (18.10 q/ha). Lowest yield of g/plant (10.95 q/ha) was recorded when 2.0 LS larvae /plant were released. The non-bt genotype that received 1 ES and 1 LS larva / plant recorded only g/plant and g/ plant (4.65 and 4.40 q/ha) respectively Damage and yield at different levels of Hecoverpa armigera larval incidence during Damage to fruiting bodies The damage observed at different days of crop growth found to be similar to that of fruiting bodies at different levels of early and late instar larvae did not damage more than 10.0 per cent till 110 DAS (Table 27). The damage caused by population levels of early stage H. armigera 0.5 and 1.0 larvae per plant remained below 10.0 per cent throughout experiment. At 100 DAS 2.0 larvae / plant caused and per cent damage in protected and unprotected plots respectively warranting for control measures. Damage in elevated populations of early instars was found to be in increasing trend. At 5.0 larvae / plant the damage in protected plot was per cent and in unprotected plot per cent. Thus after 100 DAS the treatments having 2.0, 3.0, 4.0 and 5.0 early stage larvae plant received insecticide spray. Further, (Table 27 contd) the damage in protected plots of these treatments was less then 10.0 per cent and in unprotected plots it was above this limit. Similarly population level of 1.5, 2.0 and 2.0 late stage larvae only caused considerable damage (>10.0%) at 100 DAS. In all treatment damage was less then 10.0 per cent at 55,70 and 85 DAS (Table 27). Further, at 115 and 135 DAS the damage recorded in protected plots of 1.5, 2.0 and 2.0 larvae/ plant was found to be less then 10.0 per cent due to chemical intervention at 100 DAS in these treatments.
98 Table 27: Fruiting body damage (%) as influenced by different levels of H. armigera larval incidence at different stages during 2005 in RCH-2 Bt cotton Treatments 55 DAS 70 DAS 85 DAS 100 DAS P UP Mean P UP Mean P UP Mean P UP Mean 0.5ES () () () () () () () () () () () () 1.0ES () () () 5.95 (14.09) 6.70 (15.01) 6.33 (14.55) () () () 5.95 (14.09) 6.70 (15.01) 6.33 (14.55) 2.0ES () () () (19.01) (19.47) (19.24) () () () (19.01) (19.47) (19.24) 3.0ES () () () (20.63) (21.31) (20.97) 3.45 (10.70) 3.55 (10.83) 3.50 (10.77) (20.63) (21.31) (20.97) 4.0ES 1.95 (8.01) 1.70 (7.48) 1.82 (7.74) (20.92) (20.97) (20.95) 4.95 (12.85) 4.30 (11.95) 4.63 (12.40) (20.92) (20.97) (20.95) 5.0ES 2.75 (9.54) 3.20 (10.30) 2.98 (9.92) (22.80) (22.91) (22.85) 6.10 (14.30) 6.10 (14.28) 6.10 (14.29) (22.80) (22.91) (22.85) 0.25LS () () () () () () (() () () () () () 0.5LS () () () () () () () () () () () () 0.75LS () () () 3.85 (11.31) 4.15 (11.75) 4.00 (11.53) 3.12 (10.15) 3.55 (10.94) ) 3.85 (11.31) 4.15 (11.75) 4.00 (11.53) 1.0LS () () () 4.35 (11.97) 5.65 (13.69) 5.00 (12.28) ) ) 8.34 (16.74) (19.52) (19.05) (19.28) 1.5LS 1.70 (7.49) 1.40 (6.78) 1.55 (7.12) 5.00 (12.80) 4.65 (12.51) 4.83 (12.66) 7.31 (15.67) 8.20 (16.64) 7.55 (15.89) (22.80) (22.51) (22.66) 2.0LS 2.60 (9.27) 2.65 (9.41) 2.63 (9.34) 3.45 (10.70) 4.65 (12.83) 4.05 (11.77) 7.55 (15.99) 7.85 (16.30) 7.80 (12.52) (16.22) (24.83) (24.77) 1.0ES (nbt) 7.45 (15.74) 7.40 (15.78) 7.43 (15.76) (18.38) (20.07) (19.42) 4.00 (11.50) (18.78) 7.18 (15.14) 5.35 (13.38) (19.47) 8.23 (16.42) 1.0LS (nbt) (18.60) 9.95 (19.58) (19.09) 7.55 (15.93) (21.78) (18.86) 6.05 (14.25) (21.94) 1 (18.09) 7.55 (15.93) (21.78) (18.86) Mean 1.90 (4.90) 1.87 (4.95) 3.07 (7.73) 3.53 (8.28) 2.21 (5.99) 3.24 (7.07) 8.36 (14.65) 9.35 (15.65) SEm± CD at 5 % SEm± CD at 5 % SEm± CD at 5 % SEm± CD at 5 % Condition NS NS Populatio n level Interaction Interaction DAS: Days after sowing UP: Unprotected condition P: Protected condition ES = Early stage larvae, LS= Late stage larvae Figures in the parentheses are arc sine transformations Interaction 1: CD for comparison between two population level means at the same protection Interaction 2: CD for comparison between two protection means at the same or different population levels contd.
99 Table 27: (contd...). Treatments 115 DAS 135 DAS Average P UP Mean P UP Mean P UP Mean 0.5ES ) () ) () () ) () () () 1.0ES 8.95 (17.42) 8.60 (17.06) 8.78 (17.24) 8.90 (17.36) 8.85 (17.32) 8.88 (17.34) 3.97 (11.49) 4.03 (11.58) 4.00 (11.54) 2.0ES 1.35 (6.62) (18.68) 5.80 (12.65) 3.25 (10.35) (20.14) 7.55 (15.25) 2.68 (9.43) 5.73 (13.85) 4.20 (11.64) 3.0ES 2.35 (8.82) (21.82) 8.08 (15.32) 4.55 (12.31) (23.24) (17.77) 4.31 (11.98) 8.34 (16.80) 6.33 (14.39) 4.0ES 5.00 (12.92) (23.00) (17.96) 6.05 (14.25) (24.89) (19.57) 5.66 (13.76) 9.26 (17.72) 7.46 (15.75) 5.0ES 5.80 (13.91) (24.36) (19.14) 7.55 (15.95) (26.25) (21.10) 6.98 (15.32) (19.35) 8.98 (17.34) 0.25LS () () () () () () () () () 0.5LS () () () 1.95 (8.03) 1.95 (8.01) 1.95 (8.02) 0.33 (3.26) 0.33 (3.26) 0.33 (3.27) 0.75LS 4.20 (11.83) 4.25 (11.90) 4.23 (11.86) 8.85 (17.32) 8.75 (17.21) 8.80 (17.26) 2.82 (9.66) 2.86 (9.74) 2.84 (9.70) 1.0LS 5.35 (13.37) (21.43) 9.35 (17.40) 6.25 (14.48) (22.76) (18.62) 4.28 (11.95) 7.07 (15.42) 5.68 (13.69) 1.5LS 7.05 (15.40) (24.40) (19.90) 7.25 (15.63) (24.82) (20.22) 6.03 (14.22) 9.43 (17.89) 7.73 (16.06) 2.0LS 8.20 (16.65) (26.25) (21.45) 8.40 (16.85) (26.79) (21.82) 7.70 (16.11) (20.03) 9.71 (18.07) 1.0ES (nbt) 6.60 (14.89) (21.09) 9.78 (17.99) 7.35 (15.74) (22.67) (19.21) 6.97 (15.30) (19.45) 9.03 (17.38) 1.0LS (nbt) 7.90 (16.32) (23.24) (19.78) 8.80 (17.26) (24.97) (21.11) 8.23 (16.67) (22.05) (19.36) Mean (10.58) (16.66) (12.54) (18.50) (11.97) (15.12 SEm± CD at 5 % SEm± CD at 5 % SEm± CD at 5 % Condition Population level Interaction Interaction DAS: Days after sowing UP: Unprotected condition P: Protected condition ES = Early stage larvae, LS= Late stage larvae Figures in the parentheses are arc sine transformations Interaction 1: CD for comparison between two population level means at the same protection Interaction 2: CD for comparison between two protection means at the same or different population levels
100 In RCH-2 non-bt, at 1.0 larvae / plant, early stage H. armigera the damage was more than 10.0 per cent from 70 DAS onwards and at 1.0 larvae/ plant, late stage larvae damage was above 10.0 per cent since 55 DAS itself warranting control measures. Thus under uniform level of population (1.0 larvae/ plant) Bt and non-bt reactions varying and Bt crop did not require any spray for early stage larval release, and required spray only at 100 DAS for late stage larval release Survival per cent The survival (%) of larvae was absolutely zero for early instar release at 0.50, 1.0, 2.0 and 2.0 larvae/ plant till 85 DAS of observation. About 5.15 to 6.13 per cent larvae found living at 85 DAS at 5.0 larvae/ plant release. Further, the survival slowly increased following previous year trend (Table 28). In late instars release, survival was 3.13 per cent in 2.0 larvae/ plant treatment at 70 DAS. Here also the survival trend followed previous year observation in general including for non-bt plots Seed cotton yield The seed cotton yield was found to different significantly (Table 29) between protected plots particularly at higher levels of larval release. The yield of seed cotton decreased with increasing level of larval incidence in unprotected plots with 5.0 early stage larvae per plant the yield was q/ ha in unprotected condition against q /ha in protected plots where a spray at 100 DAS was given. Similarly there was decreasing trend in yield with increased level of late instar larval release. At 2.0 larvae / plant the seed cotton yield in protected and unprotected plots was and q/ ha. However among protected plots maximum yield (21.49 q/ ha) was recorded in 1.5 late stage larval treatment. And in unprotected q/ ha yield was obtained with 0.5 early instar larval release throughout season. The yield of both protected and unprotected plots was further averaged for two seasons and considered for ETL calculation based on economic advantage. Economic injury was calculated considering the yield of unprotected plots Correlation for Helicoverpa armigera larval incidence v/s damage and yield The correlation between larval incidence and damage (at different days of observation) revealed a significant positive relationship with respect to both early as well as late instars (Table 30). The correlation between larval incidence and yield also showed a highly significant negative correlation of 0.85 and 0.90 with respect to early as well as late instars respectively during Further, the correlation was positive and significant with 0.79 and 0.97 of r value during 2005.
101 Table 28: Per cent survival of H. armigera larvae at different stages of crop growth during 2005 Treatments 55 DAS 70 DAS 85 DAS 100 DAS P UP Mean P UP Mean P UP Mean P UP Mean 0.5ES () () () () () () () () () () () () 1.0ES () () () () () () () () () () () () 2.0ES () () () () () () () () () () () () 3.0ES () () () () () () () () () () () () 4.0ES () () () () () () () () () () 2.70 (9.36) 1.35 (4.68) ES () () () () () () (13.01) (14.34) (13.67) (9.56) (14.57) (12.07) 0.25LS () () () () () () () () () () () () 0.5LS () () () () () () () () () () () () 0.75LS () () () () () () () () () () () () 1.0LS () () () () () () () () () () 2.90 (9.76) 1.45 (4.88) 1.5LS () () () () () () () () () () 4.00 (11.54) 2.00 (5.77) LS () () () (7.24) (12.53) (9.88) (14.57) (15.24) (14.90) (15.08) (15.46) (15.27) 1.0ES (nbt) (57.59) (66.85) (62.22) (58.04) (56.15) (57.09) (15.00) (58.04) (36.52) (16.56) (50.22) (33.39) 1.0LS (nbt) (50.43) (49.12) (49.77) (22.92) (57.98) (40.45) (20.78) (50.72) (35.75) (19.00) (48.71) (33.85) Mean 9.33 (7.72) (8.28) 6.45 (6.30) (9.05) 2.21 (4.53) (9.88) 2.04 (4.30) 9.87 (11.40) SEm± CD at 5 % SEm± CD at 5 % SEm± CD at 5 % SEm± CD at 5 % Condition Populatio n level Interactio n Interactio n DAS: Days after sowing UP: Unprotected condition P: Protected condition ES = Early stage larvae, LS= Late stage larvae Figures in the parentheses are arc sine transformations Interaction 1: CD for comparison between two population level means at the same protection Interaction 2: CD for comparison between two protection means at the same or different population levels contd.
102 Table 28: (contd...) Treatments 115 DAS 135 DAS Average P UP Mean P UP Mean P UP Mean 0.5ES () () () () () () () () () 1.0ES () () () () () () () () () 2.0ES () 3.25 (10.35) 1.63 (5.18) () 4.85 (12.54) 2.43 (6.27) 1.35 (6.61) () 0.68 (3.31) 3.0ES () 5.38 (13.37) 2.69 (6.68) 2.90 (9.80) 9.80 (18.23) 6.35 (14.02) 2.53 (9.15) 0.48 (3.98) 1.51 (6.57) 4.0ES 4.60 (12.38) 9.35 (17.78) 6.98 (15.08) 7.35 (15.74) (25.73) (20.73) 5.15 (13.10) 1.99 (8.11) 3.57 (10.61) 5.0ES 6.58 (14.86) (20.18) 9.26 (17.52) (18.53) (28.71) (23.62) 7.92 (16.35) 4.10 (11.68) 6.01 (14.01) 0.25LS () () () () () () () () () 0.5LS () () () () () () () () () 0.75LS () () () () () () () () () 1.0LS () 5.63 (13.71) 2.81 (6.85) 1.60 (5.16) (19.90) 6.60 (12.53) 3.35 (10.54) 0.27 (2.09) 1.81 (6.32) 1.5LS () (19.76) 5.73 (9.88) 4.95 (12.86) (28.38) (20.62) 6.34 (14.59) 0.83 (5.21) 3.58 (9.90) 2.0LS 1.75 (5.39) (23.91) 9.10 (14.65) 7.33 (15.67) (33.29) (24.48) (19.26) 4.22 (11.83) 7.55 (15.55) 1.0ES (nbt) (19.60) (43.85) (31.72) (18.46) (43.87) (31.17) (52.76) (33.16) (42.96) 1.0LS (nbt) (21.92) (42.92) (32.42) 8.90 (17.37) (42.38) (29.87) (48.50) (26.66) (37.58) Mean (5.30) (14.70) (8.11) (18.07) (19.55) (12.12) SEm± CD at 5 % SEm± CD at 5 % SEm± CD at 5 % Condition Population level Interaction Interaction DAS: Days after sowing UP: Unprotected condition P: Protected condition ES = Early stage larvae, LS= Late stage larvae Figures in the parentheses are arc sine transformations Interaction 1: CD for comparison between two population level means at the same protection Interaction 2: CD for comparison between two protection means at the same or different population levels
103 Table 29: Boll opening and seed cotton yield as influenced by varied level of H. armigera larval infestation during 2005 Treatments (Larvae/ plant) Seed Cotton Yield GOB/plant g/plant q/ha P UP Mean P UP Mean P UP Mean 0.5ES ES ES ES ES ES LS LS LS LS LS LS ES (nbt) LS (nbt) Mean SEm± CD at 5 % SEm± CD at 5 % SEm± CD at 5 % condition population level Interaction Interaction UP: Unprotected condition P: Protected condition ES = Early stage larvae, LS= Late stage larvae Interaction 1: CD for comparison between two population level means at the same protection Interaction 2: CD for comparison between two protection means at the same or different population levels
104 4.4.4 Economic injury level Based on consistency in the damage and survival trend between two years, the EIL was worked out separately (Table 31) for early and late instars. In both the years the damage crossed 10.0 per cent of predetermined damage threshold only once i.e. at 110 DAS and one application of profenofos 1250 gai/ ha was given. The chemical and application cost together accounted for Rs.1425/-/ ha. The cost of protection was calculated considering cost of host plant resistance also which appeared to be Rs.625/ ha. Therefore total cost of plant protection against bollworms was Rs.2025/ ha. The cost of produce was Rs. 2100/ha considering average market price prevailed over two seasons. The gain threshold was worked as given below. Cost of protection (Rs./ha) Gain threshold = = = 0.97 (GT) Cost of produce (Rs./q) Further, regression value b was worked out as given below considering average yield of two years in respective treatments. Regression value b was worked out separately considering the modified population level. The b value was 0.27 for early instars and 0.70 for late instars. EIL = GT b appeared to be Early instar = Late instar = = 3.55 larvae/ plant = 1.42 larvae/ plant Table 30: Correlation matrix for larval incidence (H. armigera) v/s damage and yield in RCH-2 Bt Larval incidence 55DAS 70DAS 85DAS 100DAS 115DAS 135DAS Mean yield Larval incidence v/s damage Early instar 0.86** 0.94** 0.93** 0.78** 0.79** 0.81** 0.93** -0.85** Late instar 0.92** 0.89** 0.92** 0.92** 0.91** 0.89** 0.93** -0.90** Larval incidence v/s damage Early instar 0.86** 0.95** 0.93** 0.81** 0.80** 0.82** 0.93** -0.79** Late instar 0.90** 0.88** 0.92** 0.91** 0.91** 0.90** 0.96** -0.97** ** Significant at P = 0.05 and 0.01
105 Table 31: Economic Injury Level for different stages of H. armigera infestation Year Gain threshold (GT) Regression coefficient (b) EIL = GT/b Early instar Late instar Early instar Late instar Mean For practical consideration 3.50 / plant 1.50/ plant Economic threshold level For infestation of each population level of early and later stage instars, gross income has been worked out separately for protected and unprotected conditions considering seed cotton yield and market value of the produce. Further, cost of protection at each population level was deducted from respective treatments to calculate net income (Table 32). While calculating the cost of protection only cost of chemical and its application was considered. Since, the yield of both unprotected and protected condition in respective treatments was necessary for calculation of ETL, the cost of host plant resistance was not taken into account which is otherwise common to both. The level of larval release at which net income (Rs./ha) from protected condition was equal (approximately) to the unprotected condition has been considered as ETL (larvae/ plant) for respective stage of larvae. Hence, from Table 32 it was evident that the ETL for early stage H. armigera intervention was 2.0 larvae/ plant and that for late stage it remained as 1.0 larvae/ plant. Thus either 2.0 early stage or 1.0 late stage H. armigera larvae could be considered as ETL for transgenic cotton.
106 Table 32: Economic advantage due to protection at different levels of H. armigera infestation Population level (larvae/ plant) Yield (q/ha)* Gross Income (Rs /ha) (a) Protected crop Cost of protection (Rs /ha) (b) Net Income (Rs /ha) (c) Unprotected crop Yield (q/ha)* Net Income (Rs /ha) (c')** Economic advantage (cc') (Rs./ha) Remark on ETL 0.5ES X 1.0ES X 2.0ES ES X 4.0ES X 5.0ES X 0.25LS X 0.5LS X 0.75LS X 1.0LS LS X 2.0LS X *Mean yield of 2004 and 2005 ** In unprotected condition net income = gross income due to no cost of protection ES Early instar larvae LS Late instar larvae
107 4.5 STUDIES ON IMPACT OF TRANSGENIC Bt COTTON ON INSECT PREDATORS OF COTTON INSECT PESTS The study was carried out for two seasons considering RCH-2 Bt as candidate crop with RCH-2 non-bt as check for comparison of incidence of aphids as well as three naturally occurring predators viz., coccinellids (Coccinella septumpunctata Linnaeus (Coccinellidae : Coleoptera), green lacewings, Chrysoperla carnea Step (Chrysopidae: Nueroptera) and syrphids, Ischidon scutellaris Fabraceus (Syrphidae : Diptera) preying mainly on cotton aphids Aphis gossypii (Glover) Relative season long abundance of aphids and predators during 2004 on RCH-2 Bt and RCH-2 non-bt cotton hybrids Incidence of Aphids, Aphis gossypii The incidence of aphids starting from July second fortnight to December end (28-51 ISW) indicated a mean of nymphs/ leaf on RCH-2Bt and 21.74/ leaf on its non-bt version. The population ranged from a minimum of 1.53 aphids/ leaf (35 ISW) to maximum aphids/ leaf (43 ISW) in RCH-2 Bt. Similarly the range was 2.44 to aphids/ leaf in non-bt crop (Table 33). From the begining of the season there was no much variation in abundance of aphids among Bt and non-bt crop, but the population was slightly more in RCH- 2 Bt particularly at the end of the season Incidence of predatory population The incidence of adults and grubs (Table 33) of coccinellids started from 30 th ISW in both Bt and non-bt plots. The mean incidence was 0.95/plant in RCH-2 Bt with a range of 0.20 to 2.20 coccinellids per plant being maximum at 47 th ISW, similarly mean coccinellid population was 1.02/ plant in non-bt crop with a range of 0.37 to 2.35/ plant. The grub population of green lacewing (chrysopa) recorded was 0.85 and 0.88 per plant (mean) respectively in Bt and non-bt plots. The incidence varied from 0.01 (32 ISW) to 2.53 (48 ISW) per plant in RCH-2 Bt and 0.04 to 2.52 per plant in RCH-2 non-bt. Thus the variation in Chrysoperla carnea incidence was not striking amongst Bt and non-bt version of RCH-2 cotton hybrids. The maggots of syrphids appeared from October in both RCH-2 Bt and non-bt with a mean incidence of 1.02 and 1.05 per/ plant respectively (Table 33). The population ranged from 0.10 to 3.50 per plant in Bt crop and 0.22 to 3.30 per plant in non-bt crop.
108 Table 33: Relative season long abundance of aphids and predatory insects on RCH-2 Bt and Non- Bt cotton hybrid during Month ISW Aphids/ leaf Coccinellids/ plant Crysoperla / plant Syrphids / plant Bt NBt Bt NBt Bt NBt Bt NBt Jul (3.89) (3.58) (5.35) (4.95) Aug (6.29) (6.02) 0.50 (1.22) 0.37 (1.17) (2.51) 2.44 (1.85) 0.20 (1.10) 0.39 (1.18) 0.04 (1.02) 0.06 (1.03) (3.07) 6.20 (2.68) 0.70 (1.30) 0.58 (1.26) (2.35) 4.20 (2.28) 0.30 (1.14) 0.49 (1.22) (2.12) 3.80 (2.19) 0.70 (1.30) 0.67 (1.29) 0.03 (1.01) 0.04 (1.02) Sep (1.59) 4.50 (2.35) 0.70 (1.30) 0.58 (1.26) 0.19 (1.09) 0.15 (1.07) (1.94) 3.30 (2.07) 1.00 (1.41) 0.92 (1.39) 0.25 (1.12) 0.29 (1.14) (3.60) 8.90 (3.15) 0.62 (1.27) 1.30 (1.52) 0.42 (1.19) 0.55 (1.24) (3.71) (3.39) 0.38 (1.17) 1.12 (1.46) 0.38 (1.17) 0.42 (1.19) Oct (4.06) 8.50 (3.08) 0.52 (1.23) 0.82 (1.35) 0.30 (1.14) 0.17 (1.08) 0.22 (1.10) (4.42) (4.09) 0.35 (1.16) 0.43 (1.20) 0.27 (1.13) 0.25 (1.12) 0.10 (1.05) 0.30 (1.14) (5.24) (4.94) 0.47 (1.21) 0.50 (1.22) 0.56 (1.25) 0.38 (1.17) 0.52 (1.23) 0.44 (1.20) (6.05) (5.45) 0.92 (1.39) 0.66 (1.29) 0.72 (1.31) 0.59 (1.26) 0.98 (1.41) 0.86 (1.36) (6.80) (6.38) 1.30 (1.52) 0.83 (1.35) 1.38 (1.54) 0.92 (1.39) 1.82 (1.68) 1.54 (1.59) Nov (6.01) (6.60) 1.57 (1.60) 1.13 (1.46) 1.56 (1.60) 1.42 (1.56) 1.94 (1.71) 2.30 (1.82) (5.83) (6.77) 1.62 (1.62) 1.47 (1.57) 1.72 (1.65) 1.85 (1.69) 1.75 (1.66) 1.87 (1.69) (6.34) (6.81) 1.79 (1.67) 1.82 (1.68) 1.98 (1.73) 2.13 (1.77) 2.21 (1.79) 2.22 (1.79) (5.71) (6.21) 2.20 (1.79) 1.95 (1.72) 2.23 (1.80) 2.27 (1.81) 2.63 (1.91) 2.82 (1.95) Dec (5.76) (5.87) 1.85 (1.69) 2.31 (1.82) 2.53 (1.88) 2.44 (1.85) 2.92 (1.98) 3.10 (2.02) (6.05) (5.58) 1.57 (1.60) 2.35 (1.83) 1.91 (1.71) 2.52 (1.88) 3.30 (2.07) 3.30 (2.07) (6.23) (5.42) 1.92 (1.71) 2.01 (1.73) 1.62 (1.62) 2.31 (1.82) 3.50 (2.12) 3.20 (2.05) (6.67) (5.46) 1.73 (1.65) 1.82 (1.68) 2.21 (1.79) 2.35 (1.83) 2.70 (1.92) 3.00 (2.00) Mean (4.93) (4.77) 0.95 (1.40) 1.02 (1.42) 0.85 (1.36) 0.88 (1.37) 1.02 (1.42) 1.05 (1.43)
109 4.5.2 Relative season long abundance of aphids and predators during 2005 on RCH-2 Bt and RCH-2 non-bt cotton hybrids Incidence of Aphids, Aphis gossypii As presented in the Table 34, the incidence of aphids ranged from 7.26 to per leaf on RCH- 2 Bt and 7.53 to per leaf in RCH-2 non-bt with a mean of and 21.01aphids per leaf in respective plots. The population though could not vary much, numerically was more in Bt than on non-bt crop. Since August, aphid incidence remained above ETL in both plots and during December the population was quite high Incidence of predatory population The incidence of coccinellids (grubs + adults) ranged from 0.20 to 3.50 and 0.17 to 3.41 per plant in Bt and non-bt crop respectively with seasonal mean of 0.83 /plant and 0.80 /plant. In both, the incidence started from August and gradually increased with a peak during second fortnight of December. There was no much variation in the incidence of green lacewing population (Table 34) among Bt and non-bt crop. The incidence started with 0.01 grub/ plant (32 ISW) in RCH- 2 Bt which reached a maximum of 1.64 at 48 th ISW. The seasonal mean incidence was 0.68/ plant. On the other hand the mean incidence was slightly less (0.66/ plant) in RCH-2 non-bt with a range of 0.02 to 1.50 per plant. The incidence of syrphids restricted between October and December months and average population was 0.99/ plant (RCH-2 Bt) and 1.03/ plant (RCH-2 Bt). The range of population was / plant in RCH-2 Bt and / plant in non-bt crop with up swing mode since begining of the incidence.
110 Table 34: Relative season long abundance of Aphids and predatory insects on RCH-2 Bt and Non- Bt cotton hybrid during Month ISW Aphids/leaf Coccinellids/plant Crysoperla / plant Syrphids / plant Bt NBt Bt NBt Bt NBt Bt NBt Jul l (2.87) 7.53 (2.92) (3.04) 7.80 (2.97) Aug (3.81) (3.89) 0.90 (1.38) 0.87 (1.37) (3.93) (3.86) 0.70 (1.30) 0.55 (1.24) (4.94) (4.46) 0.50 (1.22) 0.42 (1.19) (1.02) (4.53) (3.63) 0.20 (1.10) 0.31 (1.14) 0.03 (1.01) 0.02 (1.01) (3.83) 8.63 (3.10) 0.40 (1.18) 0.28 (1.13) 0.07 (1.03) 0.04 (1.02) Sep (3.37) (3.44) 0.50 (1.22) 0.45 (1.20) 0.12 (1.06) 0.09 (1.04) (4.40) (3.54) 0.40 (1.18) 0.56 (1.25) 0.37 (1.17) 0.24 (1.11) (3.95) (3.45) 0.30 (1.14) 0.30 (1.14) 0.52 (1.23) 0.62 (1.27) (4.04) (3.77) 0.20 (1.10) 0.17 (1.08) 0.98 (1.41) 0.83 (1.35) Oct (4.43) (4.32) 0.30 (1.14) 0.22 (1.10) 0.75 (1.32) 0.75 (1.32) 0.64 (1.28) 0.57 (1.25) (4.58) (4.42) 0.30 (1.14) 0.17 (1.08) 0.69 (1.30) 0.72 (1.31) 0.82 (1.35) 0.75 (1.32) (5.10) (5.34) 0.50 (1.22) 0.38 (1.17) 0.58 (1.26) 0.55 (1.24) 1.50 (1.58) 1.38 (1.54) (5.32) (5.38) 0.76 (1.33) 0.85 (1.36) 0.75 (1.32) 0.64 (1.28) 1.32 (1.52) 1.67 (1.63) (5.25) (5.17) 0.88 (1.37) 0.82 (1.35) 0.97 (1.40) 0.86 (1.36) 1.47 (1.57) 1.73 (1.65) (Nov (5.82) (4.99) 0.69 (1.30) 0.81 (1.35) 1.30 (1.52) 0.99 (1.41) 1.81 (1.68) 1.79 (1.67) (5.43) (5.03) 0.92 (1.39) 0.89 (1.37) 1.27 (1.51) 1.17 (1.47) 1.62 (1.62) 1.84 (1.69) (6.13) (5.46) 0.99 (1.41) 0.92 (1.39) 1.42 (1.56) 1.20 (1.48) 1.92 (1.71) 1.89 (1.70) (6.03) (5.55) 1.32 (1.52) 1.11 (1.45) 1.55 (1.60) 1.38 (1.54) 2.01 (1.73) 1.95 (1.72) Dec (6.87) (6.31) 1.57 (1.60) 1.35 (1.53) 1.64 (1.62) 1.67 (1.63) 2.57 (1.89) 2.43 (1.85) (6.47) (6.18) 1.93 (1.71) 2.17 (1.78) 1.23 (1.49) 1.50 (1.58) 2.29 (1.81) 2.67 (1.92) (6.89) (6.08) 2.20 (1.79) 3.41 (2.10) 1.01 (1.42) 1.32 (1.52) 2.83 (1.96) 2.78 (1.94) (6.38) (6.28) 3.50 (2.12) 2.29 (1.81) 0.95 (1.40) 1.12 (1.46) 2.90 (1.97) 3.20 (2.05) Mean (5.03) (4.69) 0.83 (1.35) 0.80 (1.34) 0.68 (1.29) 0.66 (1.29) 0.99 (1.41) 1.03 (1.42) Figures in the parentheses are x + 1 transformation
111 4.5.3 Pooled analysis of aphids and predatory population incidence in RCH-2Bt and RCH-2 non-bt cotton hybrid The relative abundance of aphids and three predators viz., coccinellids, chrysopa and syrphids could not vary much between Bt and non-bt crops and the trend in pooled analysis (Table -35) matched with two season data. The population of aphids ranged between 8.58/ leaf (34 th ISW) to 42.15/ leaf (50 th ISW) with a mean of 23.82/ leaf in RCH-2 Bt. Since the begining of the incidence at 28 th ISW (July) population remained above ETL (>10.0/ leaf) till end of the season and with increasing trend and heavy buildup was noticed during December. Population dwindled to below ETL during 31 st, 34 th and 35 th ISW. This incidence appeared to be numerically more in respective weeks compared to the incidence in non-bt crop, which supported the buildup of aphids to thresholds and above from September onwards only. Prior to that the incidence was found to vary much on weekly observation basis. The range of incidence was 7.43/ leaf (36 th ISW) to 37.08/ leaf (46 th ISW) with a mean of 21.37/ leaf). The incidence of predators also followed the trend of two seasons upon pooled analysis. A density dependent variation with respect to prey was shown by all the three predators after their appearance in the season. Pooled analysis (Table 35) for predators also appeared as validity of two season dynamics. Mean population of coccinellids, Chrysoperla and syrphids was 0.89, 0.78 and 1.0 per plant in RCH-2 Bt and 0.91, 0.75 and 1.04 per plant in RCH-2 non-bt respectively. The range of incidence also could not show convincing variation over individual years as viewed in pooled figures. Despite numerical variations to limited extent, RCH-2 Bt supported the incidence of aphids as well as predators similarly to that of its non-bt version. The statistical analysis (Table36) of all these parameters could not show any significant difference in a paired row t- test. Thus the theoretic possible impact of Cry protein on predators through passive exposure was not supported by the two season and pooled data as for as the way in which naturally they occur in the cotton ecosystem.
112 Table 35: Relative season long abundance of Aphids and predatory insects on RCH-2 Bt and Non- Bt cotton hybrid (pooled) Month ISW Aphids/leaf Coccinellids/plant Chrysoperla / plant Syrphids / plant Bt NBt Bt NBt Bt NBt Bt NBt Jul (3.42) 9.67 (3.27) (4.35) (4.08) Aug (5.20) (5.07) 0.70 (1.30) 0.62 (1.27) (3.30) 8.17 (3.03) 0.45 (1.20) 0.47 (1.21) 0.03 (1.01) 0.02 (1.01) (4.11) (3.68) 0.60 (1.26) 0.50 (1.22) (1.01) (3.61) 8.18 (3.03) 0.25 (1.12) 0.40 (1.18) 0.02 (1.01) (3.10) 6.22 (2.69) 0.55 (1.24) 0.48 (1.21) 0.06 (1.03) 0.04 (1.02) Sep (2.63) 7.67 (2.94) 0.60 (1.26) 0.52 (1.23) 0.14 (1.07) 0.14 (1.07) (3.40) 7.43 (2.90) 0.70 (1.30) 0.74 (1.32) 0.33 (1.15) 0.25 (1.12) (3.78) 9.92 (3.30) 0.46 (1.21) 0.80 (1.34) 0.54 (1.24) 0.52 (1.23) (3.88) (3.59) 0.29 (1.14) 0.65 (1.28) 0.70 (1.30) 0.61 (1.27) Oct (4.25) (3.75) 0.41 (1.19) 0.52 (1.23) 0.46 (1.21) 0.53 (1.23) 0.32 (1.15) 0.40 (1.18) (4.50) (4.26) 0.33 (1.15) 0.30 (1.14) 0.47 (1.21) 0.50 (1.22) 0.46 (1.21) 0.53 (1.23) (5.17) (5.14) 0.49 (1.22) 0.44 (1.20) 0.48 (1.22) 0.56 (1.25) 1.01 (1.42) 0.91 (1.38) (5.69) (5.41) 0.84 (1.36) 0.76 (1.32) 0.67 (1.29) 0.68 (1.30) 1.15 (1.47) 1.27 (1.50) (6.08) (5.81) 1.09 (1.45) 0.83 (1.35) 0.95 (1.39) 1.12 (1.46) 1.65 (1.63) 1.64 (1.62) Nov (5.92) (5.85) 1.13 (1.46) 0.97 (1.40) 1.36 (1.54) 1.28 (1.51) 1.88 (1.70) 2.05 (1.74) (5.63) (5.97) 1.27 (1.51) 1.18 (1.48) 1.56 (1.60) 1.45 (1.56) 1.69 (1.64) 1.86 (1.69) (6.24) (6.17) 1.39 (1.55) 1.37 (1.54) 1.78 (1.67) 1.59 (1.61) 2.07 (1.75) 2.06 (1.75) (5.87) (5.89) 1.76 (1.66) 1.53 (1.59) 1.91 (1.71) 1.81 (1.67) 2.32 (1.82) 2.39 (1.84) Dec (6.34) (6.10) 1.71 (1.65) 1.83 (1.68) 2.04 (1.74) 2.10 (1.76) 2.75 (1.94) 2.77 (1.94) (6.26) (5.88) 1.75 (1.66) 2.26 (1.81) 1.88 (1.70) 1.71 (1.64) 2.80 (1.95) 2.99 (2.00) (6.57) (5.76) 2.06 (1.75) 2.71 (1.93) 1.66 (1.63) 1.47 (1.57) 3.17 (2.04) 2.99 (2.00) (6.53) (5.88) 2.62 (1.90) 2.06 (1.75) 1.65 (1.63) 1.67 (1.63) 2.80 (1.95) 3.10 (2.02) Mean (4.98) (4.73) 0.89 (1.38) 0.91 (1.38) 0.78 (1.33) 0.75 (1.32) 1.00 (1.41) 1.04 (1.43) Figures in the parentheses are x + 1 transformation
113 Table 36: Test statistics for relative abundance of Aphids and insect predators on RCH-2 Bt and Non-Bt cotton Year Test of significance between Bt and Non-Bt cultivar for incidence of Aphids /plant Coccinellids/plant Crysoperla / plant Syrphids / plant t-test t-test t-test RCH2 Bt Non-Bt RCH2 Bt Non-Bt RCH2 Bt Non-Bt RCH2 Bt Non-Bt t-test (4.93) (4.77) NS 0.95 (1.40) 1.02 (1.42) NS 0.85 (1.36) 0.88 (1.37) NS 1.02 (1.42) 1.05 (1.43) NS (5.03) (4.69) NS 0.83 (1.35) 0.80 (1.34) NS 0.68 (1.29) 0.66 (1.29) NS 0.99 (1.41) 1.03 (1.42) NS Pooled (4.98) (4.73) NS 0.89 (1.38) 0.91 (1.38) NS 0.78 (1.33) 0.75 (1.32) NS 1.00 (1.41) 1.04 (1.43) NS Table t = 2.08 Figures in the parentheses are x + 1 transformation Table 37: Correlation matrix for aphid incidence and predatory population on Bt and Non Bt cultivar (r value) Year Coccinellids/plant Crysoperla / plant Syrphids / plant RCH2 Bt Non-Bt RCH2 Bt Non-Bt RCH2 Bt Non-Bt * 0.50* 0.72* 0.70* 0.74* 0.73* * 0.79* 0.81* 0.85* 0.94* 0.96* * Significant at P = 0.01
114 4.5.4 Correlation between aphid incidence and predatory population From Table 37 it was evident that highly significant positive correlation appears between aphids with all the three predators. The correlation co-efficient r was positive for both RCH-2 Bt and non-bt and even for both seasons under consideration. Amongst three predators syrphids exhibited a high degree of host dependent, poulation build up (r = 0.94 and 0.96) followed by chrysopa and coccinellids Comparative biology of Chrysoperla carnea reared on cotton aphids The most potential and commercial scale insect predator Chrysoperla carnea was found to remain unaffected in terms of its potentiality when fed with aphids infesting RCH-2 Bt. The figures of bio-potentiality (Table 38) parameters of C. carnea remained statistically on par for two batches reared on aphids that colonized on Bt and non-bt plants. The incubation period was 3.22 and 3.72 day respectively when aphids host was RCH-2 and RCH-2 non-bt. The time spent in each instar stage was slightly more for the C. carnea reared on aphids with non-bt cotton host. Similarly pupal period (10.65 days), adult longevity (47.23 and days for male and female respectively) was more in non-bt treatment. The fecundity was also high ( / female) in C. carnea population reared on non-bt crop colonized aphids. Thus total aphid consumption was more (523.22) in this treatment. However none of the bio-potential parameter recorded significant variation. Thus bio-potentiality of C. carnea remained same irrespective of aphid host. 4.6 DEVELOPMENT OF IPM MODULES INVOLVING Bt COTTON HYBRIDS Incidence of sucking pests in different modules There was no significant variations in the incidence of early sucking pests viz., leaf hopper and aphid except thrips. However, M-I received numerically less incidence of 0.8 leaf hopper/ leaf as against 1.9 leaf hoppers per leaf in M-III which rendered higher incidence of leaf hopper followed by the M-II (1.4 leaf hopper/ leaf) during crop season. In contrast to , module M-II recorded numerically lowest incidence of leaf hopper (0.8 / leaf) followed by M-I (1.3 leaf hopper / leaf) and highest incidence of 1.5 leaf hopper per leaf was noticed in M-III during cropping season (Table 39)
115 Table 38: Comparative biology of Chrysoperla carnea reared on cotton aphids n = 20 Days Aphids raised on Incubation period I instar II instar III instar Pupal period Adult longevity Male Female Fecundity Aphids consumed per grub. RCH-2 Bt RCH-2 Non Bt t-test NS NS NS NS NS NS NS NS NS
116 Pooled analysis of and crop season indicated no significant difference among modules, however, lowest leaf hopper incidence was noticed in M-I (1.05 leaf hoppers/ leaf) followed by M-II (1.1 leaf hopper/ leaf). M-III recorded maximum leaf hopper incidence of 1.7 / leaf. Similarly, the population of aphids did not differ significantly among the modules while least number of aphid population was recorded in M-II (3.9 aphids/ leaf) followed M-III (4.7 aphids/ leaf), but aphid population was numerically high in M-I during crop season while M-III recorded the highest aphid population of 7.2 /leaf during followed by M-II with 6.8 aphids/ leaf and least number of aphids was noticed in M-I (6.6 aphids/ leaf) (Table 39). Cumulative mean of and showed that the population of aphid was least in M-II (5.35 aphids/ leaf) followed by M-III (5.95 aphids/ leaf) and maximum number of aphids (6.15 aphids/ leaf) was noticed in M-I, but they did not differ statistically with each other. Population of thrips registered significant difference among the modules which was clearly revealed in M-I by registering significantly lowest number of 9.4 thrips / leaf and was at par with 11.3 thrips / leaf in M-III. Whereas M-II recorded significantly more number of thrips (15.7 / leaf) compared to the rest of the modules during Same trend was noticed during with M-I and M-III were on par with each other with a population of 12.7 and 14.5 thrips / leaf respectively as compared to M-II which registered significantly highest number of 18.4 thrips per leaf. Cumulative mean of the two seasons revealed that M-I was superior in reducing the thrips population by registering 11.05/ leaf followed by M-III with 12.9/ leaf but were at par with each other (Table 39), whereas M-II recorded significantly highest thrips population (17.05/ leaf). Table 39: Incidence of sucking pests in different IPM modules on Bt cotton Module Leaf hoppers/ leaf Aphids/ leaf Thrips/ leaf Pooled Pooled Pooled M-I 0.8 (1.33) 1.3 (1.49) 1.05 (1.41) 5.7 (2.59) 6.6 (2.75) 6.15 (2.67) 9.4 a (3.22) 12.7a (3.70) 11.05a (3.46) M-II b 18.4 b (1.52) (1.33) (1.42) (2.20) (2.27) (2.49) (4.08) (4.40) (4.24)b M-III a 14.5 a 12.9 (1.89) (1.57) (1.73) (2.38) (2.86) (2.62) (3.50) (3.93) (3.71)a CD at 5 % NS NS NS NS NS NS Figures in the parentheses are x + 1 transformation Figures with similar alphabets in the column do not differ significantly by DMRT at P = 0.05
117 4.6.2 Incidence of spotted bollworm, Earias vittella larvae in different IPM modules The larval incidence of spotted bollworm was negligible throughout the experiment and incidence did not differ significantly among modules during at 50 DAS. M-II recorded hardly any incidence of spotted bollworm registering zero larva/plant compared to the rest of the modules (Table 40). On the contrary, season witnessed a significant difference in the population of spotted bollworm larvae at 50 DAS which was evidently noticed in M-II by registering the lowest number of larvae (0.14/ plant) followed by M-I (0.80 larva /plant) and which was on par with M-III (1.20 larvae/ plant). The pooled mean of and clearly indicated the significant difference among the modules was evidently registered in M-I (0.66 larvae/ plant) followed by M-III (0.95 larvae/ plant) and were at par with each other. However, significantly lowest number of 0.07 larvae/ plant was recorded in M-II. At 65 DAS no significant variation in larval population was noticed for both years where as there was no record of Earias larvae in M-II ( larvae/ plant) both at 2004 and 2005 and even in cumulative mean. The average population of Earias did not show any significant difference between the modules. Meanwhile, M-II did not record the larval incidence ( larvae/ plant) during Same trend was observed in The cumulative figure of 0.03 larvae per plant was registered in M-II which indicated the superiority of the module. Table 40: Incidence of spotted bollworm larvae in different IPM modules on Bt cotton Module M-I 0.52 Earias vittella larvae/ plant 50 DAS 65 DAS Mean Pooled Pooled Pooled (1.23) M-II M-III 0.70 CD at 5 % (1.29) 0.80b (1.33) 0.14a (1.05) 1.20b (1.47) 0.66ab (1.28) 0.07a (1.02) 0.95b (1.38) 0.60 (1.26) (1.02) 0.25 (1.11) 0.20 (1.26) 0.50 (1.22) 0.40 (1.17) 0.38 (1.16) (1.24) 0.47 (1.21) 0.50 (1.22) 0.07 (1.03) 0.80 (1.34) NS NS NS NS NS NS NS Figures in the parentheses are x + 1 transformation DAS : Days after sowing Figures with similar alphabets in the column do not differ significantly by DMRT at P = (1.23) 0.03 (1.01) 0.64 (1.27)
118 4.6.3 Incidence of Helicoverpa armigera The population of Helicoverpa armigera showed no significant differences among the different IPM modules from to 0.90 larvae per plant during crop season (Table 41). Significant differences in larval population among the IPM modules were evident at 120 DAS. The larval population in M-III and M-I were at par with each other at 120 DAS (0.38 and 0.40 larvae/ plant respectively) and were significantly next best to M-II. However, M-II was found significantly superior by registering larvae/ plant and holding supreme position among the modules. Numerically lower number of average larval population of 0.1 per plant was noticed in M-II over the rest of modules M-III and M-II (0.28 and 0.31 larvae/ plant, respectively). H. armigera larval population did not differ significantly among the modules during except at 105 DAS and ranged from to 0.50 larvae / plant in M-II, 0.08 to 0.90 larvae/ plant in M-III and 0.15 to 0.50 larvae/ plant in M-I. At 105 DAS, significantly lowest larval population of 0.40 per plant was found in the M-II compared to rest of the modules. However, M-I recorded significantly highest larval population (1.30 larvae/ plant) but was at par with M-III (1.10 larvae/ plant). The average larval population of H. armigera did not differ significantly but was comparatively low in M-II (0.29 larvae/ plant) compared to M-I and M-III (0.45 and 0.55 larvae/ plant respectively). Pooled mean of and cropping seasons once again revealed no significant difference in H. armigera larval population except 120 DAS and was ranging from to 1.00 larvae/ plant. At 120 DAS, M-II was found to be significantly superior by registering lowest larval population of 0.25 per plant followed by 0.45 larvae / plant in M-I and were comparable with each other. Whereas significantly highest number of larval population was noticed in M-III (0.64 larvae / plant).
119 Table 41: Incidence of Helicoverpa armigera larvae per plant in different IPM modules on Bt cotton Module 60 DAS 75 DAS 90 DAS 105 DAS 120 DAS 135 DAS Mean M-I b (1.14) (1.01) (1.04) (1.30) (1.18) (1.14) (1.13) M-II a 0.10 (1.09) (1.15) 91.00) (1.03) M-III b 0.28 (1.13) (1.05) (1.37) (1.17) (1.12) CD at 5 % NS NS NS NS 0.13 NS NS DAS 75 DAS 90 DAS 105 DAS 120 DAS 135 DAS Mean M-I b (1.07) (1.05) (1.18) (1.51) (1.22) (1.11) (1.19) M-II a M-III CD at 5 % (1.20) (1.09) (1.18) (1.22) (1.08) b (1.17) (1.03) (1.22) (1.44) (1.36) (1.15 ) NS NS NS 0.30 NS NS (1.12) 0.55 (1.22) Pooled Module 60 DAS 75 DAS 90 DAS 105 DAS 120 DAS 135 DAS Mean M-I ab (1.10) (1.03) (1.11) (1.41) (1.20) (1.12) (1.15) M-II a (1.10) (1.09) (1.16) (1.11) (1.04) (1.07) M-III 0.34 (1.15) 0.04 (1.01) 0.31 (1.13) 1.00 (1.41) 0.64b (1.27) 0.17 (1.07) 0.42 (1.17) CD at 5 % NS NS NS NS 0.14 NS NS Figures in the parentheses are x + 1 transformation DAS : Days after sowing Figures with similar alphabets in the column do not differ significantly by DMRT at P = 0.05 NS Fruiting body damage Fruiting body damage (Table 42) due to bollworm complex during cropping season ranged from 0.5 to 7.2 per cent with no significant difference upto 75 DAS and at 135 DAS. However, at 90 DAS the M-II recorded significantly lowest fruiting body damage of 5.2 per cent followed by M-I (8.3%) and were at par with each other. However significantly highest percentage of fruiting body damage was recorded in M-III (7.1%). Further, M-II was found to be superior by recording significantly lowest percentage of fruiting body damage (5.9%) followed by M-I (8.9%) at 105 DAS, while, the fruiting body damage was significantly highest in M-III and M-II at 120 DAS (8.7 and 7.5%, respectively) compared to M-I which recorded significantly lowest per cent damage of fruiting body (3.4%). No significant difference in average fruiting body damage but numerically lowest percentage of fruiting body damage was observed in M-II with an average of 3.83 per cent as against 5.87 and 6.92 per cent in M-I and M-III respectively.
120 Same trend was also noticed during The per cent fruiting body damage showed significant difference among the module up to 75 DAS and at 135 DAS (Table 42). Significantly highest fruiting body damage of 7.8, 11.5,9.1 and, 9.8 per cent were observed in M-III and M-I at 90 and 105 DAS respectively and were statistically comparable with each other. While, the lowest percentage of 3.8 and 5.6 fruiting body damage was noticed in M-II at 90 and 105 DAS respectively, indicating superiority of the module. Further, M-II stood at prime position by registering 6.8 per cent and was on par with M-I (9.3%). Similarly the average damage was lowest in M-II (4.7%) and was found on par to M-I (7.68%). With concurrence of similar statistical trend for two years, the pooled analysis of data revealed that M-II was superior by registering lowest per cent of damage of 4.50, 5.75 and 5.10 at 90, 105 and 120 DAS respectively. Further average of lowest fruiting body damage of 4.27 per cent was noticed in M-II followed by M-I (6.78%) and significantly highest percentage of 7.37 fruiting body damage was observed in the M-III (Table 42). Table 42: Per cent fruiting body damage caused by bollworm complex in different IPM modules on Bt cotton Module M-I M-II M-III CD at 5 % M-I M-II M-III CD at 5 % DAS 75 DAS 90 DAS 105 DAS 120 DAS 135 DAS Mean ab 8.9ab 7.5b ab (7.48) (10.76) (16.72 (17.35) (15.89) (13.31) (13.58) a 5.9a 3.4a a (4.04) (8.32) (13.18 (14.06) (10.62) (14.06) (10.71) b 12.3b 8.7b b (7.40) (12.51) (15.46 (20.52) (17.16) (15.55) (14.72) NS NS NS DAS 75 DAS 90 DAS 105 DAS 120 DAS 135 DAS Mean b 9.8b 9.3ab ab (9.62) (13.68) (17.55) (18.24) (17.75) (17.94) (15.79) a 5.6a 6.8a a (7.04) (9.97) (11.22) (13.69) (14.87) (15.87) (12.11) b 11.5b 10.9b b1 (10.77) (12.78) (16.21) (19.81) (19.26) (16.73) (5.92) NS NS NS 3.78 Pooled 60 DAS 75 DAS 90 DAS 105 DAS 120 DAS 135 DAS Mean M-I b 9.35b 8.40ab ab (8.55) 1(2.22) (17.13) (17.79) (16.83) (15.62) (14.68) M-II a 5.75a 5.10a a (5.53) (9.14) (12.20) (13.87) (12.74) (14.96) (11.41) M-III ab 11.90b 9.80b b (9.09) (12.64) (15.83) (20.16) (18.21) (16.14) (15.32 CD at 5% NS NS NS 3.76 Figures in the parentheses are arc sine transformation DAS : Days after sowing Figures with similar alphabets in the column do not differ significantly by DMRT at P = 0.05
121 4.6.5 Incidence of pink bollworm Pectinophora gossypiella in different modules Pink bollworm, larval incidence The incidence of pink bollworm larvae showed non-significant difference among the modules during 2004(Table 43). However, M-II was found to be superior by registering significantly lowest number of 0.22 larvae/ 10 bolls followed by M-I (0.5 larvae/ 10 bolls) during The pooled mean of 2004 and 2005 evidently indicated that significantly lowest number of pink bollworm larvae was observed in M-II (0.15 larvae/ 10 bolls) and was at par with M-I (0.50 larvae/ 10 bolls). While M-III recorded significantly highest number pink bollworm larvae (0.65 larvae/ 10 bolls) Green boll damage The percent green boll damage was significantly lowest in M-II by registering 0.95 per cent damage followed by M-I (2.10%) and was at par with each other during Further, the per cent green boll damage did not vary significantly among the modules during 2005 and then in pooled analysis data also numerically lowest per cent of green boll damage was found in M-II (1.39%) over rest of the modules M-I and M-III (2.65 and 3.10 % respectively) Flower resetting Rosetted flower as a result of damage to flower bud by pink bollworm did not differ significantly among the modules during However, significant variation among the modules was evident during 2005 by registering lowest rossetted flowers (0.90 %) in M-I followed by M-II (2.5%) and were comparable to each other. The cumulative mean of 2004 and 2005 showed non-significant difference among the modules (Table 43).
122 Table 43: Incidence of Pink bollworm, Pectinophora gossypiella in different modules on Bt cotton Pectinophora gossypiella incidence Module Larvae/10 bolls * Green boll damage (%)** Flower rosetting (%)** Locule damage (%)** Pooled Pooled Pooled Pooled M-I 0.30 (1.14) 0.70ab (1.29) 0.50ab (1.21) 2.10ab (6.02) 3.20 (10.31) 2.65 (8.16) 1.70 (7.49) 0.90a (5.43) 1.30 (6.43) 4.40b (12.10) 4.90b (12.79) 4.65b (12.44) M-II 0.08 (1.03) 0.22a (1.10) 0.15a (1.06) 0.95a (5.59) 1.83 (8.70) 1.39 (7.14) 2.30 (8.72) 2.50ab (9.10) 2.40 (8.91) 1.80a (7.70) 2.50a (9.10) 2.15a (8.40) M-III 0.50 (1.22) 0.80b (1.34) 0.65b (1.28) 2.40b (8.91) 3.80 (11.24) 3.10 (10.07) 1.20 (6.29) 3.80b (11.24) 2.50 (8.76) 3.90ab (11.38) 4.20ab (11.82) 4.05ab (11.60) CD at 5 % NS NS NS NS 4.70 NS *Figures in the parentheses are x + 1 transformation **Figures in the parentheses are arc sine transformation Figures with similar alphabets in the column do not differ significantly by DMRT at P = 0.05
123 Locule damage Module -II was holding superior position by registering lowest percentage of locule damage (1.80 %) followed by M-III (3.90%) but were at par with each other. Similar trend was observed during 2005 as M-II recorded (Table 43) significantly lowest percentage of locule damage (2.50%) followed by M-III (4.20%). Pooled mean of both years also revealed the same trend with 2.15 and 4.05 per cent locule damage in M-II and M-III respectively with no statistical superiority Population of Natural enemies Coccinellids / plant Statistically no significant variation was found among the different modules with respect to activity of the predator. However, numerically highest activity of coccinellid was noticed in M-II (2.30 and 1.8 coccinellids/ plant) during and respectively (Table 44). The numerically highest number of coccinellid activity was noticed in M-II (2.05/ plant) as evident from the pooled data analysis of both years but did nto show any significant difference among the modules. Table 44: Population of natural enemies (Predators) in different modules on Bt cotton Module Coccinellids/ plant Chrysoperla / plant Syrphids / plant Pooled Pooled Pooled M-I M-II M-III CD at 5% NS NS NS NS NS NS NS NS NS Chrysoperla / plant The activity of chrysoperla was uniform as there was no significant difference among the modules in both years (Table 44). Pooled data analysis from the data of two years showed no significant difference among the modules and indicated uniform distribution of chrysoperla but numerically maximum number of activity was found in M-II (1.35/ plant).
124 Syrphids/ plant It was noticed that no significant variation in the activity of syrphids among modules throughout the experimental period. However, M-II received numerically maximum number of 2.40 and 3.10/ plant during and respectively (Table 44). Similarly pooled mean of and also revealed no significant difference among the module but numerically maximum number of syrphid / plant (2.75/ plant) was noticed in both M-II and M- I Yield parameters GOB/ plant M-II and M-I modules proved to be equally superior by registering significantly highest GOB of and 25.70/ plant respectively during 2004 and M-III was found to be inferior compared to above modules as it recorded GOB/ plant (Table 45). During M- II registered significantly highest GOB of per plant compared to M-III. Thus, M-II was holding prime position among the modules by registering cumulative figure of GOB/ plant followed by M-I (23.90/ plant) BOB/ plant In contrast to the trend observed in GOB, no significant variation was found among the modules, indicating qualitative superiority of module. Module-II occupied the prime position by recording numerically lowest BOB in a cumulative figure of 4.5 per plant (Table 45) Seed cotton yield Results clearly projected the difference indicating the supremacy of M-II module which registered highest of and q/ha of seed cotton during 2004 and 2005 respectively (Table 45). The yield in M-I was on par to M-II module. The consistent performance of M-II was reflected by cumulative yield of two seasons (23.50 q/ha) and was comparable to next best module M-I (21.20 q/ha). The yield in M-III (20.10 q/ha) was least but on par to M-I. Table 45: Boll opening and yield of seed cotton in different modules on Bt cotton Module GOB/ plant BOB/ plant Yield (q/ha) Pooled Pooled Pooled M-I 25.70a 22.10ab 23.90ab ab 20.90ab 21.20ab M-II 26.80a 24.20a 25.50a a 22.80a 23.50a M-III 22.50b 21.60b 22.05b b 19.70b 20.10b CD at 5% NS NS NS Figures with similar alphabets in the column do not differ significantly by DMRT at P = 0.05
125 4.6.8 Economics of cost involvement and profit from different IPM modules IPM modules developed for RCH-2 Bt with different components revealed that the cost of protection in M-I, M-II and M-III was Rs.5577/-, Rs.5949/- and Rs.3713/- per ha respectively (Table 46). The cost of cultivation (excluding protection) in all three modules remained constant (Rs.6100/ha). However, the total cost of cultivation differed in all three modules with Rs.11677/ha in M-I, 12049/ha in M-II and Rs.9813/ha in M-III. Therefore, there exists significant difference in the net returns among the modules in which M-II accounted more net returns (Rs.37301/ha) as compared to M-I (Rs.32843/ha) and M-III (Rs.32397/ha). Table 46: Economics of IPM modules developed for RCH-2 Bt Components M-I (Rs/ha) M-II (Rs/ ha) M-III (Rs/ha) Seeds (Including treatment) Chemical for sucking pest Trap crop (Okra) Nipping PBW management (PB Rope L) Boll worm (at DAS) Boll worm and aphids Total cost of protection Cost of cultivation Total cost of cultivation Yield (q/ha) Gross Returns (Rs/ ha) Net returns (Rs/ ha)
126 V. DISCUSSION Cotton is one among the major commercial crops of India, associated with an important cultivation problem of insect pest menace which stands against achieving yield potential and maximum profit. In Karnataka, during last decade (1990 s on wards) there was sharp decrease in the area of cotton crop. Either failure of the crop or reduced profitability due to heavy spending on plant protection made farming community to rethink about growing cotton. At this crucial juncture Bt cotton was introduced in India and also in the state of Karnataka during the year after seven years of successful profitable cultivation in USA. China is the first developing country to reap the benefit of Bt cotton cultivation. Amidst the protest of environmentalists Bt cotton was introduced in India, after that the area under Bt cotton has been increasing in four folds year after year. Commercial cultivation of Bt cotton for the last three years has indicated higher net profit to farmers with reduced application of insecticides. On the contrary, varied opinions were available regarding its impact on natural enemies, performance of few Bt genotypes with regard to yield itself. Environmentalists raising this doubt and question the profit from Bt cotton. Further, presence of Cry toxin in plant throughout the season needs further investigation. The crop has been successfully cultivated since its introduction. However, there were few reports of failure too. While introducing there was misunderstanding that Bt crop is one stop solution / single window solution for insect pest problems and few critical issue which will ensure better understanding of the crop leading to proper management left untouched. Therefore the present investigations were undertaken at Agriculture Research Station, Dharwad with respect to potentiality of new generation Bt genotypes, spatio-temporal variation in expression, action threshold or ETL for transgenic Bt cotton, impact of transgenic on naturally occurring aphid predators and development of IPM module for Bt cotton under rainfed situation. Better understanding of the above critical issues ensures sustainable utilization of the novel technology. The conclusions drawn based on results obtained during the course of investigation have been discussed here under with relevant literature available on Bt cotton. 5.1 PERFORMANCE OF NEW GENERATION Bt GENOTYPES HAVING Cry1Ac AND Cry1Ac + Cry2Ab GENES UNDER PROTECTED AND UNPROTECTED CONDITIONS Transgenic cotton with Cry1Ac gene to produce δ-endotoxin has single mode of action against lepidopteron pests and known to be effective against H. armigera, E. vittella and Pink bollworm in India. The action of in built toxin in Bt cotton reduced the use of insecticides. Insects are well known for their inherent character of developing resistance against insecticides. The use of refugia crop to mitigate the expected resistance development found to be inconvenient and later two gene concept came into existence. Results obtained from the performance of Bt cotton genotypes with one or two Bt genes are discussed here under Incidence of Earias vittella Incidence of E. vittella was high (>ETL) during both years on conventional cotton (DHH-11 and DCH-32) during square formation to flowering stages (at 50 and 65 DAS) of the crop. Bt genotype with one gene (Cry1Ac) recorded larval population in fraction at the beginning (50 DAS) and later the larvae could not survive. The Bt genotypes with two genes (Cry1Ac + Cry2Ab) did not record larval population throughout the season (Table 4 and 9). Among the Bt genotypes RCH-2 Bt(check) recorded significantly higher number of E. vittella larvae, but the population recorded was low compared to the population on conventional cotton, wherein it crossed ETL and received spray. E. vittella larvae did not cross ETL in any of Bt genotypes under study and hence no spray was given. However, spray was given during both the years on conventional cotton as E. vittella crossed ETL at 50 and 65 DAS. Bt genotypes with one gene and two genes found to be equally effective against E. vittella and hence harbored insignificant number of larvae under both the conditions. It appears that at DAS, the expression of toxin producing gene could be high enough to take care of the
 and Hegde et al. (2004).")
127 pest incidence without any external assistance. The effectiveness of Bt cotton hybrids against E. vittella was endorsed by Gujar (2001), Kranthi (2002), Qaim and Zilberman (2002), Udikeri et al. (2003a) and Hegde et al. (2004). However the superiority of Bt genotypes over conventional cotton hybrids has been proved beyond doubt in biotech countries and does not need any justification by this time Incidence of Helicoverpa armigera H. armigera larval population increased slowly from square formation (50 DAS) to boll maturity stage (120 DAS) across the genotypes and later decreased reaching minimum at 145 days. H. armigera larval population crossed ETL at 110 days to receive first chemical intervention in all Bt genotypes except in BG-II genotype under study (Table 14). Similarly fruiting body damage was also increased slowly from 50 DAS to 125 DAS and decreased later. Second chemical intervention was made on selected genotypes such as MRC-6918 Bt and RCH-708 Bt wherein per cent fruiting body damage crossed ETL. Incidentally these genotypes happened to be interspecific hybrids. Thus interspecific Bt hybrids found to less resistant to bollworms compared to intraspecific Bt hybrids. There was significant H. armigera larval population difference among the Bt genotypes screened over two seasons during the study. The pooled data clearly shows that MRC-7201 (BG-II) recorded lowest H. armigera larval population, which was at par with MRC Bt (BG-II) and significantly superior to all the other Bt genotypes included in the study. The next best genotype was RCH-2 Bt which was at par with RCH 368-Bt, RCH-362 Bt, MRC-6322 Bt and significantly superior to remaining Bt genotypes included in the study. MRC-6918 Bt and RCH-708 Bt recorded higher H. armigera larval population and at par and found to be significantly inferior to all other Bt genotypes used in the study. Among the bollgard (BG) group, BG-II was proved to be superior over BG-I by recording lower H. armigera larval population. Thus second generation plant incorporated protectants (PIPs) or BG-II genotypes have emerged as easy to adopt solution for resistance problem to Cry1Ac. Two gene Bt (Cry1Ac+Cry2Ab)Bt genotypes performance also has been convincingly acceptable in different countries tested. The advantage of Cry1Ac +Cry2Ab observed was 10 folds over Cry1Ac genotypes (Marchosky et al 2001). Performance of BG-II genotypes interms of less damage and more yield compared to BG-I genotypes has been observed by Gore et al. (2002), Anonymous (2003), Jackson et al. (2003 and 2004). Fig. 1. Fruiting body damage in different Bt cotton genotypes by boll worms under protected conditions
128 Except in BG-II genotypes and RCH-2 Bt there was significant difference in the larval population between protected and unprotected treatment of the same Bt genotypes. In protected main plots Bt genotypes registered significantly lower number of larvae compared to same genotypes in unprotected plots indicating the requirement of minimum protection against H. armigera in BG-I genotypes. The results of Rajeshkumar and Stanley (2006) and the present findings are in line with each other. The findings of Jackson et al. (2003) indicated that pyrethroid treatment increased the control of bollworms which survived in Bollgard I and hence produced better results. The reports of Burd et al. (1999) Rao et al. (2002) and Radhika et al. (2004) also justify better results obtained in the Bollgard-I genotypes with one or two spray intervention against no chemical intervention Damage to fruiting bodies The lowest per cent fruiting body damage was observed in MRC-7201 Bt which was at par with MRC-6322 Bt, RCH-368 Bt, RCH-362 Bt and RCH-2 Bt and significantly superior over remaining two Bt genotypes (MRC-6918 Bt and RCH-708 Bt). Per cent fruiting body damage was at par in protected and unprotected plots of BG-II genotypes, on the contrast there was significant difference between the protected and unprotected treatment of all the genotypes belonging to BG-I group having Cry1Ac gene (Fig. 1 and 2). This clearly indicated the superiority of genotypes belonging to BG-II group with Cry1Ac and Cry2Ab toxins. Further, similarity in expression under protected and un protected condition may be treated as true genotypic resistance to the bollworms as opined by Vennila et al. (2004a). Further, inclusion of two genes yielded better results and proved the compatibility of Cry1Ac and Cry2Ab. The inclusion of two genes to combat the resistance resulted in synergestic effect against bollworms (Chakrabarti et al., 1998 and Jackson et al., 2003) Incidence of Pink bollworm, Pectinophora gossypiella The lowest flower rosetting was observed in BG-II genotypes which has found to be significantly superior to rest of the BG-I Bt genotypes. Among BG-I, MRC-6322 Bt recorded lowest rosetting and was at par with RCH-368 Bt, RCH-362 Bt and RCH-2 Bt and significantly superior to MRC-6918 Bt and RCH-708 Bt. BG-I Bt genotypes sprayed with insecticide had significantly less PBW larvae. MRC-7201 Bt recorded least per cent locule damage which was at par with MRC-6322 Bt, RCH-362 Bt and RCH-2 Bt and significantly superior to remaining genotypes in the study (Table 15). The effectiveness of Bt genotypes (Cry1Ac) against PBW has been reported by Bhosle et al. (2004) (less locule damage), Henneberry and Jech. (2000) (no exit holes), Henneberry et al. (2000) (less green boll infestation) and Willson et al. (1992 (least rosetting) in Bt cotton plants. There was no significant per cent locule damage difference between chemical sprayed and unsprayed BG-II genotypes which further confirmed the superiority of BG-II genotypes by expressing the true resistance. The results of Jackson et al. (2003) are in line with the present findings.
.")
129 Fig. 2. Fruiting body damage in Bt cotton genotypes by bollworms under unprotected condition Seed cotton yield The Bt genotypes have significantly higher yield over conventional hybrids (Fig.3). Superiority of Bt genotypes over conventional hybrids needs no testimony (Udikeri et al., 2003, Hegde et al., 2004, Patil et al., 2005, Venkateshalu, 2005 and Rajeshkumar and Stanley, 2006). The Bt genotypes produced significantly higher yield under protected condition over the same genotype under un protected conditions. Among the Bt genotypes RCH-2 Bt produced highest yield. The better performance of Bt genotypes under protected conditions has been also endorsed by Udikeri et al. (2003a), Venugopal et al. (2002) and Lambert et al. (1996 and 1997). The results clearly indicated that far higher yield could be achieved with minimum protection in Bt genotypes (Fitt, 2003 and Pray et al., 2002). In the present study Bt genotypes could save five insecticidal sprays. The Bt genotypes belonging to second generation (BG-II) MRC-7201 Bt and MRC-6322 Bt recorded at par yield under protected and unprotected condition indicating the inclusion of one more toxin producing gene strengthened the protection. Further it could not require any additional protection against bollworms. The advantage of Bt genotypes with two genes has been reported by Adamczyk et al. (2001) and Jackson et al. (2003). They reported that DP 50 B-II, the genotype with Cry1Ac + Cry2Ab was found better than DP 50 B (Cry1Ac) with enhanced efficacy over wide range of lepidopteran pests. Thus, evaluation new generation Bt genotypes in present study clearly revealed advantage of second generation Bt (BG-II) genotypes apart from endorsing per se performance of new Bt genotypes having Cry1Ac. Better performance of interspecific Bt hybrids over DCH-32 raised the hopes of interspecific hybrid cotton era again.

130 Fig. 3. Number of sprays and seed cotton yield in different genotypes 5.2 ASSESSMENT OF CHANGES IN Cry PROTEIN EXPRESSION IN TRANSGENIC PLANTS AT DIFFERENT STAGES OF CROP GROWTH Insect pest management through host plant resistance assumed reality in practical sense with release of transgenic Bt cotton cultivars for commercial cultivation worldwide since Many genotypes of cotton have been converted into Bt transgenics with Monsanto- 351 gene insertion event through back crossing process with common donor parent, Cocker- 312 to have Cry1Ac toxin producing cassette. Though the container (genotype) varies, the content (Cry toxin gene) remain same in Bt cultivars extending similar impact. There has been considerable yield advantage through avoidance in number of insecticide applications on Bt cotton, especially in China and India. Though the Bt crops offer inherent toxicity against bollworms, the expression doesn t appear to be uniform throughout growing period and warrants chemical control at definite stages, especially in later part of crop growth. Under no circumstances so far, Bt genotypes have shown complete resistance to bollworms any where. Infact, couple of sprays have been given to reap expected benefit from transgenic technology in both developing and developed countries (Huesing and English, 2004). The frontline players of Indian Bt cotton scenario (MECH-162, 184, 12 Bt) also could not remain as an exception to this phenomenon. Surulivelu et al. (2003) and Bhosle (2004) have shown that these hybrids received larval incidence above ETL by 110 DAS. The main causes for variation in performance of Bt transgenic could be either insect related (resistance), or crop performance (decline in expression) and even it could be environment related also. However, resistance to Cry proteins in the field population have not been reported so for. Hence, the decline or change in expression appear to be a significant factor which lead to survival of population at definite stages giving scope for development of resistance or platform for insect control failure, if not addressed properly. This phenomenon has been well predicted and documented in the early ages of Bt crop era (Greenplate 1999, Traore et al., 2000, Sun et al, 2002 and Kranthi, 2002). In the present investigation variation in expression of Bt genotypes with one or two crystal protein producing genes have been studied through bioassay and Cry protein quantification through ELISA. Neonates of H. armigera, E. vittella, P. gossypiella and S. litura

131 were used for bioassay (Fig. 4 and 5). The mortality of H. armigera larvae was high since initial stage of crop growth (45 DAS) till 90 DAS. However, highest mortality was noticed at 70 DAS. Later there was decline in bio-activity reaching 20 per cent by 135 DAS. Thus expression appeared to be fairly high enough to take care of H. armigera till 105 DAS. There was similar trend in mortality of E. vittella and pink bollworm larvae also. The mortality in E. vittella was high compared to H. armigera. At initial stage there was cent per cent suppression of E. vittella neonates and quite high level (90.0 %) mortality noticed even at 105 DAS. The bio-activity of Cry1Ac was sufficient to cause considerable amount of mortality in P. gossypiella also. At DAS the mortality of PBW larvae has been more than 80 per cent. Further, season long bio-activity of two gene Bt cotton plants (RCH-2Bt BG-II) expressing Cry1Ac + Cry2Ab toxins intensified the mortality of H. armigera, E. vittella and P. gossypiella. There was cent per cent mortality upto 60 DAS in H. armigera and 105 DAS in E. vittella indicating quite higher range of bioefficacy or resistance of two gene Bt plants (Fig. 6). Beyond this period also the mortality in both H. armigera and E. vittella was high compared to the effect of Cry1Ac, particularly at later stage of crop growth. The activity Cry1Ac + Cry2Ab was more than Cry1Ac alone against PBW also. There has been additional advantage of two gene Bt cotton with expended horizon of bio-activity being lethal to S. litura also, yet another prolific feeder in cotton ecosystem. Maximum mortality of S. litura was noticed at 60 to 80 DAS declining thereafter. Fig. 4. Season long bioefficacy of Cry1Ac (2004)
 from RCH-2Bt through ELISA endorsed results of bioassay studies.")
. A gradual decrease was observed in expression over the time and by 135 DAS it was negligible.")
132 Fig. 5. Season long bioefficacy of Cry1Ac (2005) Fig. 6. Season long bioefficacy of Cry 1Ac + Cry2Ab Quantification of Cry1Ac in leaves (top canopy) from RCH-2Bt through ELISA endorsed results of bioassay studies. In leaf, concentration of Cry1Ac was high (5.07 µg/ g) at 40 DAS and was found to decline slowly. At 60 DAS expression was 3.17 and 3.30 µg/ g fresh weight of tissue during 2004 and 2005 respectively (Table 20). A gradual decrease was observed in expression over the time and by 135 DAS it was negligible. In squares buds the expression was high at 60 DAS (2.10 µg/ g) and less afterwards. In two gene plants (RCH-2 Bt BG-II) the expression of Cry1Ac was high in leaf (3.42 µg/ g) and square (0.62 µg/ g) at 60 DAS, later found at reduced concentrations (Table 21). The expression of Cry2Ab was also high at this stage (60DAS) in squares (56.9 µg/ g). However in leaf tissues Cry2Ab was found to be more at 80 DAS (71.02 µg/ g). Prior and later to this period it was less. Thus the decline
133 in expression with the age or maturity of the crop was quite evident in the present study through bioassay as well as quantification of protein. Though no complaints of crop failure or insect control failure in Bt cotton due to variation in expression have been reported so far, the issue often gets much amplified and emerge as hurdle in transgenic farming. By this time it has been well learnt in commercial cultivation that at later stage (approximately 100 DAS onwards) Bt cotton genotypes fail to offer a good deal of resistance against bollworms. The fall in expression and change in bioefficacy over season has been well documented and present findings endorse the early reports on this fact. Daly and Fitt (1998) observed decline in seasonal pattern of neonate mortality due to feeding on Bt cotton indicating decline in protein after 85 DAS. The mortality was 95 per cent at 55 DAS and reached 20.0 per cent by 95 DAS and by 120 DAS there was no effect of Cry toxin. Similarly seasonal variation in Cry1Ac was observed by Adamczyk et al. (2001) where fall in concentration from 5.0 to 1.0 ppm (end of season) was quite evident. They have also shown a steep variation in expression based on julian date of sampling in NuCotn 33 B and DP 451 B/RR Bt cotton genotypes. Efficacy of Bt cotton leaves on H. armigera sampled on different dates varied significantly as reported by Horwitz et al. (2003). Amount of Cry1Ac produced in four Bt genotypes (PM-121 8, AT 4619B, DP458 BR and NuCotn 33B) declined from a range of ppm to ppm within three months. Further studies of Sun et al. (2002) and Wan et al. (2005) also confirmed the fact that expression pattern vary within the season with higher concentration at the beginning and least at the end. Similar temporal variation has also been observed in eight Indian Bt genotypes (Kranthi et al., 2005), Cry1Ac concentration being maximum (mean of 8 genotypes) at 30 DAS and least at 148 DAS with optimum (>1.98 µg/ g) upto 85 DAS. The mortality of neonates also dwindled from per cent at 40 DAS sampling bioassay to 20 per cent by 120 th day leaf feeding. The results of present study and report of Kranthi et al. (2005) are in close conformity where RCH-2 Bt is a common test candidate. However, the test insect in all the studies carried out so far referred found to be H. armigera only. Studies considering E. vittella and P. gossypella are not available for comparison but for Surulivelu et al. (2004) who indicated more PBW larvae/ 20 green bolls in four Bt genotypes (including RCH-2 Bt) at 190 DAS compared to 128 DAS. The decline in toxin over season and its reduced impact on pest control has also been noticed with other lepidopteron pests attacking Bt transgenic paddy (Alinia et al., 2000) tobacco (Warren et al., 1992) and potato (Ahmad et al., 2000). It seems seasonal variation in Cry toxin expression for BG-II genotypes has not been subjected much for investigation. The only study available (Adamczyk et al., 2003) indicated that the addition of Cry2Ab had no significant impact on expression of Cry1Ac in Bollgard-II compared with Cry1Ac expressed in Bollgard-I. Further throughout season Cry2Ab was present at much higher levels in the plant compared with Cry1Ac in BG-II plants. This is in accordance with the findings of the present investigation. Studies on decline/variation in expression in BG-II genotypes are not available probably owing to the befitting performance of second generation Bt cottons (Cry1Ac+ Cry2Ab) over first generation (Cry1Ac) genotypes coupled with enhanced mortality of bollworms even at later stages of crop growth The reasons tagged for decline in expression of Cry-toxins revolved around age factor of the crop, decline intotal protein concentration and increased accumulation of proanthocyanin. Climatic factors like temperature, soil moisture also found to play major role intoxin expression which has been related to damage. Surprisingly, Bt genotypes performed well in irrigated condition than in rainfed because of soil moisture (Chen et al., 2005, Olsen, 2003, Adamczyk et al., 2003, Sun et al., 2002, and Mahon et al., 2002). However, elevation and / or maintenance of Cry toxins at fairly higher level throughout the season by any means have not been reported so far. Instead, the phenomenon of decline intoxin concentration has been convincingly accepted by the farming community and protection at later stage is being offered through chemical intervention. Management of bollworms with insecticide intervention based on incidence of the pest would be an ideal choice than increasing the expression. Enhancing toxin production would lead for increased selection pressure inviting resistance problem. On the other hand insecticide application would offer a cross resistance to bollworms avoiding further scope for resistance development to Cry toxin. Further, as insecticide application would be need based, the choice of ecofriendly and cost effective means remain with end user.
134 5.3 ASSESSMENT OF CRY PROTEIN EXPRESSION AND CONCENTRATION IN DIFFERENT PARTS OF TRANSGENIC Bt COTTON PLANTS Like temporal variation in expression, intra-plant or spatial variability has also been noticed and viewed critically with respect to overall performance of Bt cotton cultivars. Moths of bollworms usually prefer to lay eggs on foliage, square buds, bracts, flowers, bolls and terminal shoots. The larvae after hatching by habit feed at the oviposition site for some time and then crawl towards preferred parts like squares, flowers, and bolls i.e., fruiting structures in cotton. Further feeding preference of bollworms has not been similar in all species. Helicoverpa armigera though feed on all parts, it extends high degree of preference to square and bolls whereas E. vittella relishes on squares. Pink bollworm though initially appear on flowers feeding on anther causing rosetting, restricted itself as an internal feeder on bolls. Spodoptera litura relishes much on foliage, but its voraciousness covers squares and bolls too. Hence, fairly high level expression of toxins has been preferred in all parts to accomplish good control over pests. Unfortunately actual phenomenon deviate from hypothetical expectation and various parts have differential expression. Therefore, variation in expression in different parts of BG-I and BGII plants viz., leaves(top, middle, bottom) squares, flowers, boll rind and shoot tip has been studied in present investigation through bioassay and ELISA based quantification of Cry1Ac and Cry2Ab. The test insects viz., H. armigera, E. vittella and S. litura have been used for excised plant part bioassay based on their natural preference. In assessment of Cry1Ac toxin variation on RCH-2 Bt, neonate mortality of H. armigera was very high (100%) in top and middle leaf disc bioassay followed by bottom leaf assay (Table 22). The average mortality was about 79.0 per cent and per cent on squares and flowers respectively. Bio-activity of boll rind toxin was least (45 to 17.0 per cent) against H. armigera, however it caused more mortality in case of E. vittella neonates indicating high level toxicity. Shoot tip also found to exercise control over E. vittella larvae about 40.0 per cent extent (Fig. 7). Correspondingly the toxin expressed was found to be more in leaves followed by squares and bolls. Among leaves Cry1Ac concentration was found to be more in bottom canopy leaves ( µg /g) followed by top and middle leaves (Table 22). Squares found to contain about 1.60 µg /g toxin. In boll rinds toxin expressed was below limit of quantification. Bio-activity of Cry1Ac + Cry2Ab (in RCH-2 BG-II Bt) was also quite high as it could cause cent per cent mortality of H. armigera neonates when fed with leaves. Irrespective of position in plant, the mortality was uniform as evidenced through bio-activity of leaves. Squares caused about per cent mortality followed by flowers (85%) and boll rinds (Table 23 and Fig. 8). The intra plant variation was quite evident through mortality of E. vittella fed on squares (100%), boll rind (92%) and shoot tip. The variability was also observed in the mortality of S. litura which was higher when middle and bottom canopy leaves used for bioassay, followed by top leaf, squares and boll rinds. The concentration of Cry1Ac in BG-II RCH-2 Bt was 4.22 µg /g in bottom leaf, 3.40 µg /g in top leaf and 2.17 µg /g in middle canopy leaf. On the contrary, Cry2Ab concentrations was more (95.17 µg /g) in middle leaf, followed by bottom (78.80 µg /g) leaf and less in top leaf (50.36 µg /g). Yet another contrast observed in expression was with respect to intra-plant variation, that Cry2Ab concentration was quite high ( µg /g) in squares. This was exception to the general trend of Cry1Ac expression i.e., higher in leaves than squares. Expression in boll rind was below limit of quantification with respect to both Cry1Ac as well as Cry2Ab in RCH-2 Bt BG-II.


135 Fig. 7. Intra plant variation of Cry1Ac in bioefficacy of Bt cotton Fig. 8. Intra plant variation in Cry1Ac + Cry2Ab bioefficacy in Bt cotton
136 Thus there was considerable intraplant variability in expression of Cry toxins and related mortality of bollworms. The studies conducted earlier on spatial expression pattern revealed significant variability but could not present a definite pattern. Thus, though variability exists within parts of the plants and extent of variation was limited to the respective genotypes. Terminal foliage bore very high level of expression compared to proximal fruiting structures (Greenplate, 1999). In two Bt cotton varieties (NuCotn and DP) the Cry protein concentration was maximum in squares bracts, followed by white flowers, squares, buds and least in bolls (Adamczyk et al., 2003). The lower expression in boll rind compared to flower was observed (Abel and Adamczyk, 2004) and it was attributed to post transcription changes. Further, Sun et al. (2002) reported higher mortality of neonate H. armigera larvae on 3 rd -13 th leaves of Shanxi Bt cotton and lower in lower leaves, which was in concordance with findings of present study. The trend of variability in Cry1Ac toxin level in different parts of the plants was similar with the results of Kranthi et al. (2005). Further, a critical limit of 1.9 µg/g has been suggested by Kranthi et al. (2005) below which larvae of H. armigera would be able to survive. Estimation of Cry1Ac in the present study have shown concentration above critical limit in leaf tissues at 45, 60 and 80 DAS. In the squares also concentration was above critical limit at 60 DAS. A field study (Shelkar and Regupathy, 2004) conducted at Coimbatore also indicated higher mortality of H. armigera on leaves, followed by squares and least in bolls. This pattern was observed throughout the season with declining trend. Protein expression levels in tissues of Bollgard-II and Ingard (one gene Bt) indicated higher expression of Cry2Ab in leaf, followed by square. Concentration of Cry1Ac was more in seed than leaf and whole plant as well as pollen in both BG-II and Ingard plants. The concentration of Cry1Ac was high in BG-II in all respective tissues compared to Ingard (Anon., 2002) plants. Thus, variability among the different parts viz., leaves, squares, bolls, bracts, flower and seeds etc. expected to have considerable impact on performance of a Bt transgenic cotton crop. Fruiting structures are economically important parts of cotton, and all the bollworm species prefer to feed on such parts, particularly squares and bolls. Therefore variation in expression in these parts appears to be critical in performance of Bt transgenic genotypes. However the fact that bollworm larvae after hatching will have quite a considerable period of exposure to leaves leading to huge mortality. Thus chances for survival of all larvae that hatch could be meager owing to higher concentration of Cry toxin in leaves and susceptibility of neonates. In reality intra plant variation coupled with seasonal variation in expression would cause reduced mortality of the pest particularly at later stages of crop growth. 5.4 ECONOMIC INJURY LEVEL (EIL) AND ECONOMIC THRESHOLD LEVEL (ETL) FOR Bt COTTON A large percentage of Bt cotton has been receiving insecticide application for bollworms with little information about economic losses from these infestations. The impact of bollworms appearing or surviving in Bt cotton particularly at later stage of crop growth has not been assessed critically. Moreover, ETL based chemical intervention has been an integral part of modern plant protection system. A threshold limit of 1.0 larvae, one or two eggs per plant or 10.0 per cent damage has been largely considered as ETL for bollworm management practices in conventional cotton. (Panchbhavi and Sudhindra 1996, Mayee et al., 2001 and Surulivelu, 2003). Application of these thresholds on Bt cotton have helped in having better control over pests and yield advantage also (Bhosle et al., 2004, Patil et al., 2004 and Yenagi 2006). However considering the factors governing bollworm dynamics in Bt cotton and preciousness of the technology, it was felt that separate EIL and ETL could be ideal for chemical intervention in Bt cottons. Increasing awareness of environmental safety from pesticides is critical consideration here to restrict or to minimize insecticide use in Bt cotton to maximum possible extent. The experiment conducted has many considerations from the earlier works on EIL or ETL (Walker, 1992, Kamath et al., 1999 and Gore and Adamczyk, 2004). The main factors considered in calculating EIL were gain threshold and yield reduction per larvae. The later factor (yield reduction/ larvae) was a significant factor in Bt cotton owing to its host plant resistance against bollworms. With the modification to the formula to calculate regression co-efficient (b), convincing EIL for both early and late stage larvae was worked out. Accordingly, 3.55 early stage or late stage larvae of H. armigera considered to be as EIL in Bt cotton at given stage of plant
137 growth (Table 31). For practical purposes EIL 3.5 and 1.5 larva per plant for early and late instar instars respectively could be convincing. Further, based on economic advantage due to protection rendered, ETL for early instar appeared to 2.0 larvae/ plant and for that of late instar 1.0 larvae/ plant (Table 32). Therefore control measures for bollworms in Bt cotton should be initiated at a level before bollworms cause significant damage and yield loss. Results of this experiment suggest insecticide application before appearance of 3.55 (practically 3.50) early instar larvae per plant. Though it is difficult for farmers to recognize or locate early instar larvae, the infestation allowed to reach this level would take much of the yield. Besides the Bt crop allowing early stage larval incidence to reach 3.5 larvae/plant could be an indication of complete fall in cry toxin level. Therefore insecticide intervention at 2.0 larvae/ plant (ETL) would be ideal to protect and to have economic advantage from BT cotton. Similarly for late instar larvae the EIL of 1.42 could be considered as 1.5 larvae /plant for all practical purposes. From this population the yield loss would be in exponential manner if infestation further persists at or above this level. Hence chemical intervention at ETL of 1.0 larvae per plant would definitely serve the purpose. It would be more convincing to farmers that appearance of one grownup larvae in the Bt cotton field indicates that no more host plant resistance could be expected and without delay chemical intervention should be extended. The present finding though do not have published work for justification or comparison, appear to be ideal for practical significance. Extension agencies suggest 2.0 second stage larvae in two consecutive scouting as ETL for Bt cottons (Anon., 1997, Anon., 2006b). 5.5 STUDIES ON IMPACT OF TRANSGENIC Bt COTTON ON THE PREDATORS OF COTTON APHIDS There was an assumption that feeding on intoxicated host will effect the population of natural enemies. In this context fate of natural enemies were assessed on Bt cotton v/s non- Bt cotton. The population of aphid, coccinellids, Chysoperla, and syrphids were monitored throughout the season during both the years. There was no significant aphids population difference throughout the season between Bt and non-bt cotton crop. The Bt cotton used in the study was RCH-2 Bt which contain Cry1Ac protein which is very specific to lepidopteran insects. Therefore aphid population remained unaffected and hence there is no population difference between the aphids in Bt and non-bt cotton. Similar to the present findings Bt cotton did not affect the population dynamics of aphids (Reed et al., 2000, Wu and Guo, 2003 and Hegde et al., 2004 and Venkateshalu, 2005). The population of coccinellids, Chrysoperla and syrphids were also observed throughout the cropping season. There was no statistical difference between the predatory population on Bt and non-bt cotton crops. The population of predator always depends on its prey. As there was no variation in the host population between two types cotton, the dependent predator also did not show any difference (Fig. 9). This clearly indicated that Bt toxin has no effect on major predators on cotton crop. The present findings are in conformity with Wang and Xia (1997), Xia et al. (1999), Naranjo and Ellsworth (2002), Liu et al. (2003), Hegde et al. (2004) and Sisterson et al. (2004). There is strong correlation between aphid and predatory population.

138 Fig 9. Dynamics of predatory insect population in Bt and non Bt cotton Chrysoperla carnea was reared on aphid as prey, collected from Bt and non-bt cotton crop separately from first instar to last instar and upto completion of its life cycle. There was no statistical difference in the biological parameters such as larval period, pupal period, adult longevity, fecundity and incubation period indicating that the feeding on intoxicated aphid prey will have no ill effects on Chrysoperla predators (Table 38). Similarly, Pilcher (1997), Mascarenhas and Luttrel (1997), Hilbeck et al. (1998) and Hilbeck (2001) also demonstrated that the Chrysoperla fed on intoxicated aphids survived and continued its progeny as good as Chrysoperla fed on non-toxicated aphids. However, the negative effect of mortality and delayed development in predatory stages were observed when C. carnea was fed on intoxicated early instar larvae of lepidopteran pests viz., H. armigera and syrphids larvae has been documented by Mascarenhas and Luttrel (1997) and Dutton et al. (2002). In the long run negative effects of Bt toxins on predatory population cannot be ruled out. There is every chance of bio magnification over the generations which need continuous monitoring DEVELOPMENT OF IPM MODULES FOR BT COTTON For effective management of bollworms and sucking pests three IPM modules were developed and verified over two seasons. Seed treatment with imidacloprid and 20 % refugia were common to all the modules. Module-I was having okra as trap crop, nipping at DAS, PB Rope L utilization at 40 DAS and need based application of endosulfan 35 EC and quinalphos to contain bollworms. Module-II was ideal blend of bio-rationale components (Plate-4) with NSKE 5 % (against thrips), two time sowing of okra, nipping, PB Rope L at 70 DAS, need based application of HaNPV and endosulfan at last to minimize bollworm and aphids. Module-III relied upon insecticides only throughout the season to reduce sucking pests (stem smearing of imidacloprid) and bollworms with cypermethrin as target specific treatment against pink bollworm and spinosad 48 SC and quinalphos at later stages of crop growth. These modules were compared for their total effectiveness and economic advantage.
![A] Trap crop](/docs-images/92/108062428/images/139-0.jpg "okra b]")

![tips C] Tying](/docs-images/92/108062428/images/139-2.jpg "of PB rope L")
![d] Stem](/docs-images/92/108062428/images/139-3.jpg "smearing of")
139 A] Trap crop okra b] Nipping of cotton shoot tips C] Tying of PB rope L d] Stem smearing of imidacloprid solution
140 5.6.1 Sucking pests Incidence of sucking pests viz., leaf hopper, aphids and thrips were observed during vegetative phase of the crop (40 DAS). During both the years, incidence of leaf hoppers and aphids were low and there was no statistical difference among the modules with respect to their population. Incidence of thrips was significantly higher in module-ii during both seasons over other two modules (M-I and M-III) in which the insect population was low and were at par with each other (Table 39). The pooled data confirmed the lower thrips population in module- III. The use of acetamiprid as spray and imidacloprid stem smearing caused reduction in the thrips population in module-i and II, respectively. The NSKE used in the module-ii was not that effective against thrips. Hence, their population remained high compared to other two modules. These two chemicals while reducing the thrips population added recognizable amount towards cost of protection. Further, action of NSKE was multidirectional and cost was also meager. The use of NSKE at this stage in the module-ii was supported by the findings of Patil et al. (2003 and 2004b) in developing IPM for the Bt cotton cultivation. The NSKE could not suppress the thrips population as low as acetamiprid and imidacloprid, but was able to limit the population otherwise it would have caused yield reduction Incidence of bollworms Earias vittella larvae Incidence of E. vittella. was noticed when crop was at 50 DAS, remained upto 65 DAS. The module-ii recorded significantly lowest incidence of E. vittella at par with module-i and superior to module-iii (Table 40). The use of Okra as trap crop in module-i and II trapped the pest. Further, NSKE used reduced the population of sucking pests and repelled E. vittella moths from laying/depositing eggs in the module-ii and hence recorded lowest number of larvae. The present finding of use of Lady s finger as trap crop in IPM modules is inline with the finding of Patil et al. (2003). Yenagi (2006) found that okra could serve as best trap crop to trap boll worms in transgenic cotton. Further, in conventional cotton IPM modules okra has been considered as important component for similar reasons (Patil et al., 2003, Kulkarni et al., 2004, Patil et al., 2004a and 2004b and Mallapur et al., 2004) Helicoverpa armigera larvae Incidence of H. armigera was recorded from 60 DAS to 135 DAS during both the years. Excepting at 120 DAS, there was no significant H. armigera larval load difference among the modules. The pooled data clearly show that module-ii recorded significantly lowest H. armigera larval population at par with module-i and significantly superior to module-iii (Table 41). The sowing of Lady s finger for the second time (when crop was at 70 DAS) effectively trapped the eggs of H. armigera. The insignificant larval load difference upto 120 days indicates that the Bt protein expression is enough to take care of Heliothis menace upto 100 days. Further, different components used to reduce the H. armigera in different module will have no much bearing on the larval incidence upto 100 days. Nipping of terminal shoot in module I and II helped in avoiding H. armigera breeding. The application of cypermethrin in M-III as a target specific action against pink bollworm extended added advantage by reduction of H. armigera incidence. The combined effect of HaNPV use, second sowing of Lady s finger as trap crop effectively reduced the H.armigera population at 120 days in module-ii. H. armigera population reduced to minimum at 135 days in all modules owing to total impact of the modules. The action of okra as trap crop in cotton needs no further justification. After 100 days the expression of Bt protein starts to reduce and the Bt cotton used to behave like conventional cotton at this stage. (Surulivelu et al., 2003, Bhosle et al., 2004 and Patil et al., 2004). Therefore the true action of okra as trap crop is justified at this stage. The use of HaNPV in module-ii at 100 DAS resulted in effective suppression of H. armigera population. At this stage, brood of H. armigera developing on transgenic cotton will have slower growth rate and hence remain ideal for action of HaNPV. The synergestic effect of HaNPV and Bt toxin has been well documented in the past
. The same principle of reducing H.")
141 (Kambrekar, 2004) and exploited well in Bt cotton IPM (Patil et al., 2003, Bambawale et al., 2004, Kulkarni et al., 2004, Chennakeshva, 2005 and Venkateshalu, 2005). Nipping has been proved as cultural paradigm for effective management of insect pest in conventional cotton (Udikeri et al., 2004). The same principle of reducing H. armigera incidence though nipping has been better exploited in the present study by incorporating the same in M-I and M-II modules Damage to fruiting bodies The effectiveness of module-ii in reducing H. armigera larval population has direct bearing on fruiting body damage. There was significant fruiting body damage difference among the modules from 90 DAS to 120 DAS. Significantly lowest percent fruiting body damage was recorded during both the seasons at 90, 105 and 120 DAS in module-ii, over remaining two modules (Table 42 and Fig. 10). The pooled data confirmed the superiority of module-ii over remaining two modules. Each components of the module-ii fits so well to reduce the fruiting body damage to the minimum. The effective trapping of bollworm eggs by introducing Okra once again when the crop was at 70 DAS and use of HaNPV when crop was at 100 DAS not only effectively checked H. armigera but also worked out to be cost effective. Fig 10. Damage due to bollworms and seed cotton yield in different IPM modules Pink bollworm incidence M-II module recorded significantly lower pink bollworm larvae and also per cent locule damage (Table 43). Placement of PB Rope L at 70 DAS worked well to reduce the pink bollworm larval population and also damage. However, PB Rope L action was masked in the module-i during peak incidence of pink bollworm due to early placement (40 DAS) as per its recommendation in conventional cotton (Patil et al., 2004a). The effectiveness of cypermethrin used in the module-iii was not comparable.
142 5.6.3 Natural enemies There was no significant difference among the modules with respect to natural enemy populations (Table 44). The observed natural enemies were predators mainly depending on aphid (prey) population. As there was no difference in the prey (Aphid) population, there was no difference in the predators population too. The effectiveness of Cry1Ac toxin principally and practically has no bearing on insect host (Aphid) of predators observed in the present study. The safety of Bt genotypes to predators has been reported by Udikeri et al. (2003), Patil et al. (2003), Kulkarni et al. (2004) and Chennakeshava (2005) in genotype assessment on IPM studies conducted at Dharwad and Raichur. The studies so far conducted worldwide indicate either partially negative or negative effect of Bt toxin against natural enemies (Lovie and Arpaia, 2005) Seed cotton yield Module-II recorded higher number of GOB and also the higher yield. The lower incidence of E vittella, H. armigera and pink bollworm resulted in retention of more number of good bolls, leading to higher yield (Fig. 10). Further, net monetary benefit was also highest (Rs.37301/ ha) in M-II. Thus the module II proved to be the best IPM package for Bt cotton under rainfed condition (Fig. 11). There was no significant yield difference between M-I and M-III. However, the PB Rope L used in module-i increased the protection cost and reduced the profit. The net return however was more in M-I (Rs.32843/-) compared to M-III (Rs.32397/-) owing to the yield advantage to the tune of 1.1 q/ ha in M-I over M-III. The easy to adopt, ecofriendly and economically viable IPM module for rainfed cotton would be with following components. - Seed treatment for sucking pest management. - Okra as trap crop to be sown twice. First along with cotton sowing and subsequently at 70 DAS. - Application of NSKE 5% for residual incidence of sucking pests or specially for thrips management. - Use of PB Rope L around at 70 DAS to manage PBW. - Nipping of terminal shoots around days. - Need based application of HaNPV around 100 DAS. - Need based application of selected insecticides having toxicity against bollworms and aphids. - Following suggested refugia regulations. Thus the integration of the most preferred technologies viz., IPM and Bt transgenic would help for sustainability of both the novel and precise innovations.

143 Fig. 11. Economic advantage in different IPM modules of Bt cotton FUTURE LINE OF WORK 1. Detailed investigations on interspecific Bt genotypes as well as two gene cultivars. 2. In-depth studies regarding practical significance of spatial-temporal variation in Cry toxin expression along with soil and climatic factors influence 3. Exploring the causes and remedies to contain the problems associated with toxin expression. 4. Large scale validation of IPM modules for first generation Bt genotypes. 5. Development of integrated pest management modules for second generation trasngenics. 6. Development of Bt cotton hybrids having Bt gene in both parents for higher and longer period expression for effective management of pink boll worm incidence. 7. Studies on survival of PBW larvae in Bt cotton seeds under storage condition and carryover possibilities of its incidence to next season. 8. Monitoring and management of resistance to cry proteins.
Characterization of resistance to all bollworms and Spodoptera litura (Fab.) in different Bt transgenic events of cotton
 in different Bt transgenic events of cotton") ISSN: 2319-7706 Volume 3 Number 3 (2014) pp. 594-600 http://www.ijcmas.com Original Research Article Characterization of resistance to all bollworms and Spodoptera litura (Fab.) in different Bt transgenic
ISSN: 2319-7706 Volume 3 Number 3 (2014) pp. 594-600 http://www.ijcmas.com Original Research Article Characterization of resistance to all bollworms and Spodoptera litura (Fab.) in different Bt transgenic
INVESTIGATIONS ON SECOND GENERATION Bt COTTON GENOTYPES AGAINST INSECT PEST COMPLEX
 INVESTIGATIONS ON SECOND GENERATION Bt COTTON GENOTYPES AGAINST INSECT PEST COMPLEX Thesis submitted to the University of Agricultural Sciences, Dharwad in partial fulfilment of the requirements for the
Mortality and Development Effects of Transgenic Cotton on Pink Bollworm Larvae
 Mortality and Development Effects of Transgenic Cotton on Pink Bollworm Larvae T. J. Henneberry, L. Forlow Jech, and T. de la Torre USDA-ARS, PWA, Western Cotton Research Laboratory, Phoenix, AZ 85040-8803
EFFICACY OF DIFFERENT BIO-PESTICIDES AGAINST SUCKING PESTS OF Bt COTTON PATEL, R. D.; *BHARPODA, T. M.; BORAD, P. K.; BHATT, N. A. AND MAHIDA, R. D.
 EFFICACY OF DIFFERENT BIO-PESTICIDES AGAINST SUCKING PESTS OF Bt COTTON PATEL, R. D.; *BHARPODA, T. M.; BORAD, P. K.; BHATT, N. A. AND MAHIDA, R. D. DEPARTMENT OF AGRICULTURAL ENTOMOLOGY B. A. COLLEGE
Brief on Introduction and Evaluation of Transgenic Bt-cotton for Efficacy against Cotton Bollworms in Kenya
 Brief on Introduction and Evaluation of Transgenic Bt-cotton for Efficacy against Cotton Bollworms in Kenya Dr. Charles N Waturu KARI-Thika P.O. Box 220, Thika, Kenya E-mail: karithika@africaonline.co.ke
Plant Biotechnology: Current and Potential Impact For Improving Pest Management In U.S. Agriculture An Analysis of 40 Case Studies June 2002
 Plant Biotechnology: Current and Potential Impact For Improving Pest Management In U.S. Agriculture An Analysis of 40 Case Studies June 2002 Insect Resistant Cotton (2) Leonard P. Gianessi Cressida S.
B Bt Cotton Technology in Texas: A Practical View
 B-6107 02-01 Bt Cotton Technology in Texas: A Practical View Glen C. Moore, Thomas W. Fuchs, Mark A. Muegge, Allen E. Knutson* Since their introduction in 1996, transgenic cottons expressing the Bollgard
Dr. Charles N Waturu Centre Director KARI-Thika P.O. Box 220, Thika, Kenya
 Dr. Charles N Waturu Centre Director KARI-Thika P.O. Box 220, Thika, Kenya (email:karithika@africaonline.co.ke) Title of Presentation The Status of the Bt-cotton Confined Field Trials in Kenya Bt-cotton
The bollworm [Helicoverpa zea (Boddie)] and ARTHROPOD MANAGEMENT
![The bollworm [Helicoverpa zea (Boddie)] and ARTHROPOD MANAGEMENT](/thumbs/93/113523059.jpg "The bollworm [Helicoverpa zea (Boddie)] and ARTHROPOD MANAGEMENT") The Journal of Cotton Science 8:223 229 (2004) http://journal.cotton.org, The Cotton Foundation 2004 223 ARTHROPOD MANAGEMENT Impact of Bollworms [Helicoverpa ea (Boddie)] on Maturity and Yield of Bollgard
The Journal of Cotton Science 8:223 229 (2004) http://journal.cotton.org, The Cotton Foundation 2004 223 ARTHROPOD MANAGEMENT Impact of Bollworms [Helicoverpa ea (Boddie)] on Maturity and Yield of Bollgard
BIO-EFFICACY OF NEW COMBI-PRODUCT AGAINST COTTON BOLL WORMS
 BIO-EFFICACY OF NEW COMBI-PRODUCT AGAINST COTTON BOLL WORMS *Surpam A.N. 1, Neharkar P.S. 2, Shubhangi P. Bhasme 3, Kamdi S.R. 4 and Kadam B.S. 5 College of Agriculture, Sonapur, Gadchiroli, Dr. Panjabrao
Potency of insecticidal combinations against bollworm complex of cotton
 2018; SP1: 1164-1168 E-ISSN: 2278-4136 P-ISSN: 2349-8234 JPP 2018; SP1: 1164-1168 V. K. Bhamare Department of Agricultural Entomology, Vasantrao Naik Marathwada Krishi Vidyapeeth, Parbhani (M.S.), India
EffectivenessofDifferentSpayTimingMethodsfortheControlofLepidopteronPestsinCotton
 Global Journal of Science Frontier Research: D Agriculture and Veterinary Volume 16 Issue 8 Version 1.0 Year 2016 Type : Double Blind Peer Reviewed International Research Journal Publisher: Global Journals
Midsouth Entomologist 4: 1 13 ISSN:
 Midsouth Entomologist 4: 1 13 ISSN: 1936-6019 www.midsouthentomologist.org.msstate.edu Research Article Efficacy of Cotton Expressing Pyramided Bacillus thuringiensis Insecticidal Proteins Against Lepidopteran
Helicoverpa zea (Boddie) and Heliothis virescens ARTHROPOD MANAGEMENT
 and Heliothis virescens ARTHROPOD MANAGEMENT") The Journal of Cotton Science 1:155 16 (26) http://journal.cotton.org, The Cotton Foundation 26 155 ARTHROPOD MANAGEMENT Changes in Populations of Heliothis virescens (F.) (Lepidoptera: Noctuidae) and
The Journal of Cotton Science 1:155 16 (26) http://journal.cotton.org, The Cotton Foundation 26 155 ARTHROPOD MANAGEMENT Changes in Populations of Heliothis virescens (F.) (Lepidoptera: Noctuidae) and
Kongming WU 1. Contacting Information 2. Present Ranks Professor, President, Academician, 3. Academic Qualifications 4. Scientific Researches
 Kongming WU 1. Contacting Information Institute of Plant Protection, Chinese Academy of Agricultural Sciences (CAAS), No. 2 Yuanmingyuan West Road, Beijing, 100193, China. Phone: 86-010-62815906, E-mail:
PARASITISM OF SOYBEAN LOOPERS, PSEUDOPLUSIA INCLUDENS, BY COPIDOSOMA FLORIDANUM IN BOLLGARD AND NON-BT COTTON
 PARASITISM OF SOYBEAN LOOPERS, PSEUDOPLUSIA INCLUDENS, BY COPIDOSOMA FLORIDANUM IN BOLLGARD AND NON-BT COTTON John R. Ruberson, Melissa D. Thompson, Russell J. Ottens, J. David Griffin Dept. of Entomology,
%*#26'4 $6%166104'5+56#0%'/#0#)'/'06
'/'06") %*#26'4 $6%166104'5+56#0%'/#0#)'/'06 (TGF)QWNFCPF$TWEG6CDCUJPKM 2TGHCEG Conventional insecticide use in cotton is significantly higher than the average use on other agricultural crops (Gianessi and Anderson
%*#26'4 $6%166104'5+56#0%'/#0#)'/'06 (TGF)QWNFCPF$TWEG6CDCUJPKM 2TGHCEG Conventional insecticide use in cotton is significantly higher than the average use on other agricultural crops (Gianessi and Anderson
The Halo Effect: Suppression of Pink Bollworm on Non-Bt Cotton by Bt Cotton in China
 The Halo Effect: Suppression of Pink Bollworm on Non-Bt Cotton by Bt Cotton in China Peng Wan 1,2., Yunxin Huang 3., Bruce E. Tabashnik 4, Minsong Huang 2, Kongming Wu 1 * 1 State Key Laboratory for Biology
P.J. Cotty, Page NO.1 of 8.
 P.J. Cotty, Page NO.1 of 8. POSITION AND AFLATOXIN LEVELS OF TOXIN POSITIVE BOLLS ON COTTON PLANTS. P.J. Cotty and L.S. Lee Research Plant Pathologist and Research Chemist USDA, ARS, Southern Regional
Cotton Comments OSU Southwest Oklahoma Research and Extension Center Altus, OK 2018 Current Situation
 Cotton Comments OSU Southwest Oklahoma Research and Extension Center Altus, OK July 26, 2018 Volume 8 No.7 2018 Current Situation The 2018 drought continues with 87.62 percent of the state in drought,
SUMMARY AND CONCLUSION
 SUMMARY AND CONCLUSION Cabbage is an important cruciferous vegetable. Insect pests are one of the major biotic factors which contribute to major economic losses both quantitatively and qualitatively. These
INSECTICIDE RESISTANCE MONITORING IN LEPIDOPTERAN COTTON PESTS
 INSECTICIDE RESISTANCE MONITORING IN LEPIDOPTERAN COTTON PESTS Russell J. Ottens, John R. Ruberson, Robert E. Harbin, and Phillip M. Roberts Dept. of Entomology, University of Georgia, Tifton, GA Introduction
Asymmetrical cross-resistance between Bacillus thuringiensis toxins Cry1Ac and Cry2Ab in pink bollworm
 Asymmetrical cross-resistance between Bacillus thuringiensis toxins Cry1Ac and Cry2Ab in pink bollworm Bruce E. Tabashnik a,1, Gopalan C. Unnithan a, Luke Masson b, David W. Crowder a, Xianchun Li a, and
DECISION DOCUMENT. Food and Feed Safety Assessment of Soybean Event MON x MON (OECD: MON-877Ø1-2 x MON )
") DECISION DOCUMENT Food and Feed Safety Assessment of Soybean Event MON 87701 x MON 89788 (OECD: MON-877Ø1-2 x MON- 89788-1) Directorate of Agrifood Quality Office of Biotechnology and Industrialized Agrifood
DECISION DOCUMENT Food and Feed Safety Assessment of Soybean Event MON 87701 x MON 89788 (OECD: MON-877Ø1-2 x MON- 89788-1) Directorate of Agrifood Quality Office of Biotechnology and Industrialized Agrifood
AGRES An International e. Journal (2018) Vol. 7, Issue 2: ISSN :
 Vol. 7, Issue 2: ISSN :") BIOEFFICACY OF NEW INSECTICIDE MOLECULE CYANTRANILLPROLE 10.26 OD AGAINST PESTS OF POMEGRANATE LAD, R. H.; *WALUNJ, A. R.; POKHARKAR, D. S. AND PATIL, C. S. DEPARTMENT OF AGRICULTURAL ENTOMOLOGY MAHATMA
BIOEFFICACY OF NEW INSECTICIDE MOLECULE CYANTRANILLPROLE 10.26 OD AGAINST PESTS OF POMEGRANATE LAD, R. H.; *WALUNJ, A. R.; POKHARKAR, D. S. AND PATIL, C. S. DEPARTMENT OF AGRICULTURAL ENTOMOLOGY MAHATMA
Cotton Insect Control in Arizona
 Cotton Insect Control in Arizona Item Type Article Authors Watson, T. F.; Moore, Leon Publisher College of Agriculture, University of Arizona (Tucson, AZ) Journal Progressive Agriculture in Arizona Rights
Heterosis and Inbreeding Depression for economic traits in desi cotton
 Research Article Heterosis and Inbreeding Depression for economic traits in desi cotton Kumari Basamma, Kajjidoni, S. T., Salimath, P.M. and Patil Malagouda Abstract Seven parents in five cross combinations
Department of Entomology, College of Agriculture and Life Sciences, North Carolina State University, Raleigh, NC 27695
 INSECTICIDE RESISTANCE AND RESISTANCE MANAGEMENT Comparative Production of Helicoverpa zea (Lepidoptera: Noctuidae) from Transgenic Cotton Expressing Either One or Two Bacillus thuringiensis Proteins with
The Mediterranean Fruit Fly in Central America
 The Mediterranean Fruit Fly in Central America P.V. Vail, I. Moore and D. Nadel Dr. Vail is Section Head, Joint FAO/IAEA Division of Atomic Energy in Food and Agriculture. Dr. Moore is Assistant to the
Hassan Farag Dahi. Plant Protection Research Institute, Agricultural Research Center, Dokki, Giza, Egypt.
 Field Performance for Genetically Modified Egyptian Cotton Varieties (Bt Cotton) Expressing an Insecticidal- Proteins Cry 1Ac and Cry 2Ab Against Cotton Bollworms Hassan Farag Dahi Plant Protection Research
1. INTRODUCTION. oldest commercial crops, plays a key role in the economic and social affairs of the world
 1. INTRODUCTION Cotton (Gossypium spp.) regarded as white gold is one of the important and oldest commercial crops, plays a key role in the economic and social affairs of the world (Shah et al., 2011;
Management Considerations: Squaring to First Flower
 Management Considerations: Squaring to First Flower Gus Lorenz and Glenn Studebaker, U of A Div. of Ag. Scott Stewart, UT Roger Leonard, LSU Angus Catchot, MSU Jeff Gore, USDA- ARS Chuck Farr and Bobby
Control of Resistant Pink Bollworm (Pectinophora gossypiella) by Transgenic Cotton That Produces Bacillus thuringiensis Toxin Cry2Ab
 by Transgenic Cotton That Produces Bacillus thuringiensis Toxin Cry2Ab") APPLIED AND ENVIRONMENTAL MICROBIOLOGY, Aug. 2002, p. 3790 3794 Vol. 68, No. 8 0099-2240/02/$04.00 0 DOI: 10.1128/AEM.68.8.3790 3794.2002 Copyright 2002, American Society for Microbiology. All Rights Reserved.
APPLIED AND ENVIRONMENTAL MICROBIOLOGY, Aug. 2002, p. 3790 3794 Vol. 68, No. 8 0099-2240/02/$04.00 0 DOI: 10.1128/AEM.68.8.3790 3794.2002 Copyright 2002, American Society for Microbiology. All Rights Reserved.
NEW YORK'S FOOD AND LIFE SCIENCES BULLETIN NO. 57, AUGUST 1975
 NEW YORK'S FOOD AND LIFE SCIENCES BULLETIN NO. 57, AUGUST 1975 NEW YORK STATE AGRICULTURAL EXPERIMENT STATION. GENEVA, A DIVISION OF THE NEW YORK STATE COLLEGE OF AGRICULTURE AND LIFE SCIENCES, A STATUTORY
Impact of Lygus lineolaris Management on Biodiversity in Cotton IPM
 Impact of Lygus lineolaris Management on Biodiversity in Cotton IPM Jeff Gore, Mississippi State University, Stoneville, MS Don Cook Angus Catchot Fred Musser Roger Leonard Gus Lorenz Scott Stewart Mid-South
Pink Bollworm Strikes Bt-Cotton
 Weekly Publication of Cotton Association of India Edited & Published by Amar Singh 2015-16 No. 35 1 st December, 2015 Published every Tuesday Cotton Exchange Building, 2nd Floor, Cotton Green, Mumbai -
GAINES COUNTY IPM NEWSLETTER Manda G. Cattaneo, Extension Agent - IPM 101 S. Main RM B-8. Seminole, TX 79360
 GAINES COUNTY IPM NEWSLETTER Manda G. Cattaneo, Extension Agent - IPM 101 S. Main RM B-8 http://gaines-co.tamu.edu Seminole, TX 79360 http://www.tpma.org (432)758-6669 office http://ipm.tamu.edu (432)758-6662
Incidence of Podfly, Melanagromyza obtusa (MALLOCH) and its Influence on Weight Loss in Different Pigeonpea Genotypes
 and its Influence on Weight Loss in Different Pigeonpea Genotypes") Incidence of Podfly, Melanagromyza obtusa (MALLOCH) and its Influence on Weight Loss in Different Pigeonpea Genotypes *Revathi K, Sreekanth M**, Krishnayya P V and Srinivasa Rao V **Regional Agricultural
Incidence of Podfly, Melanagromyza obtusa (MALLOCH) and its Influence on Weight Loss in Different Pigeonpea Genotypes *Revathi K, Sreekanth M**, Krishnayya P V and Srinivasa Rao V **Regional Agricultural
Bioefficacy and Safety of Cyantraniliprole 10 % (W/V) OD Against Sucking Pests in Cotton
 OD Against Sucking Pests in Cotton") International Journal of Current Microbiology and Applied Sciences ISSN: 2319-7706 Volume 6 Number 2 (2017) pp. 1405-1417 Journal homepage: http://www.ijcmas.com Original Research Article http://dx.doi.org/10.20546/ijcmas.2017.602.159
International Journal of Current Microbiology and Applied Sciences ISSN: 2319-7706 Volume 6 Number 2 (2017) pp. 1405-1417 Journal homepage: http://www.ijcmas.com Original Research Article http://dx.doi.org/10.20546/ijcmas.2017.602.159
Effect of Field Plot Design on the Efficacy of Boom Sprayer
 Universal Journal of Agricultural Research 2(7): 236-241, 2014 DOI: 10.13189/ujar.2014.020702 http://www.hrpub.org Effect of Field Plot Design on the Efficacy of Boom Sprayer Khurram Yousaf 1, Muhammad
Control of the European pepper moth using biological control
 Control of the European pepper moth using biological control Biological Control in Ornamental Plant Production Symposium San Marcos. CA, January 18, 2012 Graeme Murphy, Greenhouse Floriculture IPM Specialist,
ARTHROPOD MANAGEMENT
 The Journal of Cotton Science 3:92-11 (1999) http://journal.cotton.org, The Cotton Foundation 1999 92 ARTHROPOD MANAGEMENT Laboratory and Field Evaluations of Bacillus thuringiensis Berliner Insecticides
Evaluation of JH Biotech, Inc. Products under Egyptian environment
 1 Product Name: 5- Biorepel (Natural Insect Repellent) Supervisor: Dr. Mohamad Ibrahim Plant Protection Res. Institute, Sharkia Research Station. INTRODUCTION Evaluation of JH Biotech, Inc. Products under
Spatial and temporal variability in host use by Helicoverpa zea as measured by analyses of stable carbon isotope ratios and gossypol residues
 Journal of Applied Ecology 2010, 47, 583 592 doi: 10.1111/j.1365-2664.2010.01796.x Spatial and temporal variability in host use by Helicoverpa zea as measured by analyses of stable carbon isotope ratios
INSECTICIDE RESISTANCE MONITORING IN LEPIDOPTERAN COTTON PESTS
 INSECTICIDE RESISTANCE MONITORING IN LEPIDOPTERAN COTTON PESTS Russell J. Ottens, John R. Ruberson, and Phillip M. Roberts Department of Entomology, University of Georgia, Tifton Abstract In 2005, larvae
DECISION DOCUMENT. Directorate of Agrifood Quality. Office of Biotechnology and Industrialized Agrifood Products
 DECISION DOCUMENT Food and feed safety assessment of maize event Bt11 x MIR162 x GA21 OECD:SYN-BTØ11-1 x SYN-IR162-4xMON-ØØØ21-9 (Includes all possible intermediate combinations) Directorate of Agrifood
Journal of Applied and Natural Science 6 (2): (2014)
: (2014)") APPLIED AND NATURAL SCIENCE FOUNDATION ANSF 2008 Journal of Applied and Natural Science 6 (2): 534-540 (2014) JANS Effect of fertilizer levels on nutrient availability and yield of cotton on Vertisol at
APPLIED AND NATURAL SCIENCE FOUNDATION ANSF 2008 Journal of Applied and Natural Science 6 (2): 534-540 (2014) JANS Effect of fertilizer levels on nutrient availability and yield of cotton on Vertisol at
Feeding potential of Mallada boninensis (Okamoto) [Neuroptera : Chrysopidae] on aphids and neonate noctuids
![Feeding potential of Mallada boninensis (Okamoto) [Neuroptera : Chrysopidae] on aphids and neonate noctuids](/thumbs/85/92736383.jpg "Feeding potential of Mallada boninensis (Okamoto) [Neuroptera : Chrysopidae] on aphids and neonate noctuids") Feeding potential of Mallada boninensis (Okamoto) [Neuroptera : Chrysopidae] on aphids and neonate noctuids M. Nagamallikadevi *, D.B. Undirwade and B. Nagendra Reddy Department of Entomology, College
Feeding potential of Mallada boninensis (Okamoto) [Neuroptera : Chrysopidae] on aphids and neonate noctuids M. Nagamallikadevi *, D.B. Undirwade and B. Nagendra Reddy Department of Entomology, College
LISTING OF NEW CHEMICALS UNDER THE ROTTERDAM AND STOCKHOLM CONVENTIONS
 LISTING OF NEW CHEMICALS UNDER THE ROTTERDAM AND STOCKHOLM CONVENTIONS Learning centre on Overcoming new challenges in chemicals and hazardous wastes management CSD-19 NLB Conference Room B 6 May, 3-6
The common soil bacterium Bacillus thuringiensis (Bt) produces
 produces") Frequency of resistance to Bacillus thuringiensis in field populations of pink bollworm Bruce E. Tabashnik*, Amanda L. Patin*, Timothy J. Dennehy*, Yong-Biao Liu*, Yves Carrière*, Maria A. Sims*, and Larry
Frequency of resistance to Bacillus thuringiensis in field populations of pink bollworm Bruce E. Tabashnik*, Amanda L. Patin*, Timothy J. Dennehy*, Yong-Biao Liu*, Yves Carrière*, Maria A. Sims*, and Larry
Estimation of Genetic Divergence for Growth, Earliness and Yield Parameters in Cucumber (Cucumis Sativus L.)
") International Journal of Current Microbiology and Applied Sciences ISSN: 2319-7706 Volume 7 Number 05 (2018) Journal homepage: http://www.ijcmas.com Original Research Article https://doi.org/10.20546/ijcmas.2018.705.273
International Journal of Current Microbiology and Applied Sciences ISSN: 2319-7706 Volume 7 Number 05 (2018) Journal homepage: http://www.ijcmas.com Original Research Article https://doi.org/10.20546/ijcmas.2018.705.273
Codling moth (CM) is becoming an increasing problem
 is becoming an increasing problem") Testing the PETE Insect Development Prediction Model to Limit the Resurgence of Codling Moth in Apples 7 Deborah Breth Cornell Cooperative Extension- Lake Ontario Fruit Program Albion, NY This project
Testing the PETE Insect Development Prediction Model to Limit the Resurgence of Codling Moth in Apples 7 Deborah Breth Cornell Cooperative Extension- Lake Ontario Fruit Program Albion, NY This project
An Analysis of Brand Preference and Market Share of Neem Based Pesticides in Kolar District, Karnataka
 An Analysis of Brand Preference and Market Share of Neem Based Pesticides in Kolar District, Karnataka Moksha, V. a, Shilpa, B. V. b, Shruthi, J c, G. N. Nagaraja d a Research Associate, Department of
Arkansas Fruit and Nut News Volume 5, Issue 6, 13 July 2015
 Arkansas Fruit and Nut News Volume 5, Issue 6, 13 July 2015 Upcoming Events Texas Pecan Growers Association Annual Conference online registration (Link): July 12-15, 2015, Frisco, TX; Contact (979) 846-3285
Testbiotech Data Factsheet: Insect- killing Soy MON87701 (Monsanto)
") Testbiotech Data Factsheet: Insect- killing Soy MON87701 (Monsanto) January 2012 Plant: Soybean Event name: MON87701 Applicant: Monsanto Trait: Insect resistance Bt Toxin: Cry1Ac Transformation method:
Testbiotech Data Factsheet: Insect- killing Soy MON87701 (Monsanto) January 2012 Plant: Soybean Event name: MON87701 Applicant: Monsanto Trait: Insect resistance Bt Toxin: Cry1Ac Transformation method:
EFFECTS OF ZINC AND BORON ON YIELD, NUTRIENT UPTAKE AND ECONOMICS OF MUSTARD (BRASSICA JUNCEA L.) IN MUSTARD-MAIZE CROPPING SEQUENCE
 IN MUSTARD-MAIZE CROPPING SEQUENCE") Bangladesh J. Bot. 46(2): 817-821, 2017 (June) - Short communication EFFECTS OF ZINC AND BORON ON YIELD, NUTRIENT UPTAKE AND ECONOMICS OF MUSTARD (BRASSICA JUNCEA L.) IN MUSTARD-MAIZE CROPPING SEQUENCE
Bangladesh J. Bot. 46(2): 817-821, 2017 (June) - Short communication EFFECTS OF ZINC AND BORON ON YIELD, NUTRIENT UPTAKE AND ECONOMICS OF MUSTARD (BRASSICA JUNCEA L.) IN MUSTARD-MAIZE CROPPING SEQUENCE
whereas the fourth inhibitor was extracted and semi purified from cabbage (Brassica oleracae) in the Insect Physiology Laboratory of the Department of
 in the Insect Physiology Laboratory of the Department of") 6. SUMMARY Due to long co-evolution of plants and herbivores a vast repertoire of unique bioactive compounds have appeared in plants, some of which have found use in medicines, drugs, antibiotics, insecticides,
6. SUMMARY Due to long co-evolution of plants and herbivores a vast repertoire of unique bioactive compounds have appeared in plants, some of which have found use in medicines, drugs, antibiotics, insecticides,
5. Plant Physiology/Chemistry Section
 5. Plant Physiology/Chemistry Section The research work/experiments conducted during the year 2014-15 are summarized is under: 1. Influence of potassium fertilizer on the incidence of CLCuV disease and
Scenario of Castor Seed
 Scenario of Castor Seed Castor (Ricinus communis L.) is a non edible oilseed, belonging to the Euphorbiaceae family. India is the leader in global castor production and dominates in international castor
Inducible tolerance to Bacillus. on cell-free immune reactions. thuringiensis (Bt) endotoxins based
 endotoxins based") Inducible tolerance to Bacillus thuringiensis (Bt) endotoxins based on cell-free immune reactions by Mohammad Mahbubur Rahman B. Sc (Hons.) & M. Sc in Zoology (Dhaka University, Bangladesh) thesis submitted
Inducible tolerance to Bacillus thuringiensis (Bt) endotoxins based on cell-free immune reactions by Mohammad Mahbubur Rahman B. Sc (Hons.) & M. Sc in Zoology (Dhaka University, Bangladesh) thesis submitted
MANAGEMENT OF Spodoptera litura Fabricius ON CABBAGE *RABARI, P. H., DODIA, D. A., PATEL, P. S. AND BARAD, C. S
 MANAGEMENT OF Spodoptera litura Fabricius ON CABBAGE *RABARI, P. H., DODIA, D. A., PATEL, P. S. AND BARAD, C. S DEPARTMENT OF ENTOMOLOGY C. P. COLLEGE OF AGRICULTURE S. D. AGRICULTURAL UNIVERSITY, SARDARKRUSHINAGAR-385506
Evaluation of Assail for the Control of Early Season Cotton Aphids in Upland Cotton COOPERATIVE RESEARCH PROJECT 2001
 of Early Season Cotton Aphids in Upland Cotton COOPERATIVE RESEARCH PROJECT 2001 Donald J. Reid, Agronomist Texas A & M University-Commerce James S. Swart, Entomologist Texas Agricultural Extension Service
The suppression of the False Codling Moth, Thaumatotibia leucotreta in South Africa using an AW-IPM approach with a SIT component
 The suppression of the False Codling Moth, Thaumatotibia leucotreta in South Africa using an AW-IPM approach with a SIT component Nevill Boersma Program Manager XSIT South Africa Background FCM sub-saharan
### About Bharat Biotech
 Press Release Bharat Biotech Bharat Biotech Launches Typbar-TCV, world s first clinically proven typhoid conjugate vaccine for infants 6 months & older and Adults The new vaccine brings hope to millions
VENTURA COMMODITIES PVT.LTD. BRIEF REPORT ON CASTORSEED AND CASTOR OIL
 VENTURA COMMODITIES PVT.LTD. BRIEF REPORT ON CASTORSEED AND CASTOR OIL CASTOR SEED INTRODUCTION Castor (Ricinus communis L.) is cultivated around the world because of the commercial importance of its oil.
Pheromone Based Mating Disruption
 TM Thaumatotibia leucotreta Reg No: L10320, Act 36 of 1947 Pheromone Based Mating Disruption Pest specific Easy to apply Season long control Manufactured by Hinders chemical resistance Rain fast and no
Making codling moth mating disruption work in Michigan: Adopting an area-wide approach to managing codling moth in Michigan apple production
 Fruit Crop Advisory Team Alert Vol. 20, No. 17, September 6, 2005 Making codling moth mating disruption work in Michigan: Adopting an area-wide approach to managing codling moth in Michigan apple production
Comparative efficacy of insecticides against the American bollworm, Helicoverpa armigera H ub. of cotton
 ORIGINAL ARTICLE Comparative efficacy of insecticides against the American bollworm, Helicoverpa armigera H ub. of cotton Muhammad Zahid 1 and Muhammad Hamed 2 Abstract Comparative efficacy of insecticides
Identification of Sources of Resistance against turcicum leaf blight of maize
 2017; 5(5): 1664-1668 P-ISSN: 2349 8528 E-ISSN: 2321 4902 IJCS 2017; 5(5): 1664-1668 2017 IJCS Received: 16-07-2017 Accepted: 18-08-2017 Manu TG Gangadhara Naik B Murali R Nagaraja H Correspondence Manu
Short Staple Regional Cotton Variety Trial, Safford Agricultural Center, Abstract. Introduction. Materials and Methods
 Short Staple Regional Cotton Variety Trial, Safford Agricultural Center, 1998 L.J. Clark, E.W. Carpenter, G.L. Hart and J.M. Nelson Abstract Forty eight short staple varieties were grown in a replicated
THE EVOLUTION OF COTTON PEST MANAGEMENT PRACTICES IN CHINA
 Annu. Rev. Entomol. 2005. 50:31 52 doi: 10.1146/annurev.ento.50.071803.130349 Copyright c 2005 by Annual Reviews. All rights reserved First published online as a Review in Advance on August 17, 2004 THE
JOURNAL OF INTERNATIONAL ACADEMIC RESEARCH FOR MULTIDISCIPLINARY Impact Factor 1.393, ISSN: , Volume 2, Issue 2, March 2014
 STUDIES ON THE ISOLATION OF AZADIRACHTIN FROM NEEM OIL AND THEIR ROLE IN CONTROL PESTS OF RICE V. RAMAMURTHY* M.K. VADIVAZHAGI** *P.G & Research Dept. of Biochemistry, Marudupandiyar College, Vallam, Thanjavur,
Bio Efficacy of Botanical Insecticides against Defoliators Pests on Soybean
 International Journal of Current Microbiology and Applied Sciences ISSN: 2319-7706 Volume 6 Number 3 (2017) pp. 2196-2204 Journal homepage: http://www.ijcmas.com Original Research Article https://doi.org/10.20546/ijcmas.2017.603.250
Crops - Commercial. Cotton
 per s Pre-Bloom Bollworm/ Tobacco Budworm Curacron (8) 16.0 ounce 1.0 8.0 Bollgard II, Widestrike or Widestrike 3: Steward (1.25) 11.3 ounce 0.11 11.5 treat when 2 percent to 3 Tracer (4) 2.1 2.85 ounce
Insect Pests of Canola. Dale Whaley
 Insect Pests of Canola Dale Whaley dwhaley@wsu.edu What We Want! (2) Groups of Canola Pests 1) Insects Pests: - Cabbage Seedpod Weevil - Flea Beetle - Aphids - Cabbage Aphid - Turnip Aphid - Lygus Bug
Crops - Commercial. Cotton
 icide per s Prebloom Bollworm/ Tobacco Budworm Steward (1.25) 11.3 ounce 0.11 11.5 Bollgard II, Widestrike or Widestrike 3: treat when 2% to 3% live 2 nd Prevathon (0.43) 14.0-27.0 ounce 0.047 0.09 9.1
Insecticide Resistance Questions to answer: What is resistance?
 Insecticide Resistance Questions to answer: What is resistance? How prevalent is resistance; what are some important examples? How is resistance identified and measured? What biological mechanisms confer
Response of Cotton Bollworm Helicoverpa armigera (Hubner) (Lepidoptera:noctuidae) to Different Insecticides in Maharashtra, India
 (Lepidoptera:noctuidae) to Different Insecticides in Maharashtra, India") World Journal of Agricultural Sciences 5 (2): 250-255, 2009 ISSN 1817-3047 IDOSI Publications, 2009 Response of Cotton Bollworm Helicoverpa armigera (Hubner) (Lepidoptera:noctuidae) to Different Insecticides
World Journal of Agricultural Sciences 5 (2): 250-255, 2009 ISSN 1817-3047 IDOSI Publications, 2009 Response of Cotton Bollworm Helicoverpa armigera (Hubner) (Lepidoptera:noctuidae) to Different Insecticides
Quality and yield of Indian mustard genotypes as influenced by different fertility levels
 Quality and yield of Indian mustard genotypes as influenced by different fertility levels R.S.Banga, Kamal Dhawan and Dhiraj Singh Oilseeds Section, Department of Plant Breeding, CCS Haryana Agricultural.University,
Insecticides Labeled for Control of Bean Leaf Beetle, Mexican Bean Beetle, and Green Cloverworm. Amount product per acre
 Insect Management in Soybeans 2016 Joanne Whalen Extension IPM Specialist and Bill Cissel, Extension IPM Agent University of Delaware ( adapted from VA Pest Management Guide, section written by D Ames
Final Report Aphid monitoring and virus testing in strawberries
 Final Report Aphid monitoring and virus testing in strawberries 15 February 2017 Prepared for: Horticulture Nova Scotia 32 Main St Kentville, NS B4N 1J5 Prepared by: Jennifer Haverstock Small Fruit Specialist
Efficacy of Some New Insecticides against Diamond Back Moth (Plutella xylostella L.) on Cauliflower
 on Cauliflower") International Journal of Current Microbiology and Applied Sciences ISSN: 2319-7706 Volume 6 Number 5 (2017) pp. 1958-1963 Journal homepage: http://www.ijcmas.com Original Research Article https://doi.org/10.20546/ijcmas.2017.605.218
International Journal of Current Microbiology and Applied Sciences ISSN: 2319-7706 Volume 6 Number 5 (2017) pp. 1958-1963 Journal homepage: http://www.ijcmas.com Original Research Article https://doi.org/10.20546/ijcmas.2017.605.218
Effect of organic manures on biochemical components of pigeon pea, Cajanus cajan (L.) Millsp. and their impact on the incidence of insect pests
 Millsp. and their impact on the incidence of insect pests") Effect of organic manures on biochemical components of pigeon pea, Cajanus cajan (L.) Millsp. and their impact on the incidence of insect pests B. Bommesha 1, M.I. Naik 2, G. P. Mutthuraju 2* Arati Pannure
Effect of organic manures on biochemical components of pigeon pea, Cajanus cajan (L.) Millsp. and their impact on the incidence of insect pests B. Bommesha 1, M.I. Naik 2, G. P. Mutthuraju 2* Arati Pannure
Efficacy of Selected Acaricides on Spider Mites in Corn 2011
 1 Efficacy of Selected Acaricides on Spider in Corn 2011 Larry Godfrey and Treanna Pierce Dept. of Entomology; Univ. of California-Davis Objectives: To compare the efficacy of selected registered and experimental
UPDATE ON PINK BOLLWORM RESISTANCE TO BT COTTON IN THE SOUTHWEST
 UPDATE ON PINK BOLLWORM RESISTANCE TO BT COTTON IN THE SOUTHWEST Timothy J. Dennehy, Gopalan C. Unnithan, Sarah A. Brink, Brook D. Wood, Yves Carrière and Bruce E. Tabashnik University of Arizona, Tucson,
AField Evaluation of Compatibility of Pesticides against Major Pests of Paddy
 I J T AField Evaluation of Compatibility of Pesticides against Major Pests of Paddy Serials Publications B. N. Chaudhari, G. R. Shamkuwar and P. S. Neharkar ABSTRACT: Two insecticides and two fungicides
Combination of Garlic Extract and Some Organophosphate Insecticides in Controlling Thrips (Thrips palmi) Pest in Watermelon Management
 Pest in Watermelon Management") International Journal of Applied Science and Engineering 2011. 9, 1: 19-23 Combination of Garlic Extract and Some Organophosphate Insecticides in Controlling Thrips (Thrips palmi) Pest in W. Burubai*,
International Journal of Applied Science and Engineering 2011. 9, 1: 19-23 Combination of Garlic Extract and Some Organophosphate Insecticides in Controlling Thrips (Thrips palmi) Pest in W. Burubai*,
Efficacy of Some Botanicals in Controlling Fruit Borer (Heliothis armigera) in Tomato
 in Tomato") Academic Journal of Entomology 8 (): 40-49, 05 ISSN 995-8994 IDOSI Publications, 05 DOI: 0.589/idosi.aje.05.8..9546 Efficacy of Some Botanicals in Controlling Fruit Borer (Heliothis armigera) in Tomato
Academic Journal of Entomology 8 (): 40-49, 05 ISSN 995-8994 IDOSI Publications, 05 DOI: 0.589/idosi.aje.05.8..9546 Efficacy of Some Botanicals in Controlling Fruit Borer (Heliothis armigera) in Tomato
Biofortified pearl millet cultivars to fight iron and zinc deficiencies in India
 Biofortified pearl millet cultivars to fight iron and zinc deficiencies in India Inadequate intake of energy-providing organic macronutrients (largely carbohydrate, followed by protein and fat, in that
STATUS OF BT COTTON CULTIVATION IN MAJOR GROWING AREAS OF PAKISTAN
 Pak. J. Bot., 42(3): 1583-1594, 2010. STATUS OF BT COTTON CULTIVATION IN MAJOR GROWING AREAS OF PAKISTAN SHAUKAT ALI, SHAHID HAMEED, SHAHID MASOOD, GHULAM MUHAMMAD ALI AND YUSUF ZAFAR National Agricultural
Cotton/Soybean Insect Newsletter
 Cotton/Soybean Insect Newsletter Volume 13, Issue #12 Edisto Research & Education Center in Blackville, SC 20 July 2018 Pest Patrol Alerts The information contained herein each week is available via text
Flea Beetle Field Scouting Guide
 Flea Beetle Field Scouting Guide INTRODUCTION Flea beetles are the most significant insect pest affecting canola production on the Prairies. Every year, they cost growers millions of dollars in yield,
Ohio Vegetable & Small Fruit Research & Development Program 2007 Report on Research
 Ohio Vegetable & Small Fruit Research & Development Program 2007 Report on Research Project Title: New Corn Earworm Management for Fresh Market Sweet Corn Principal Investigator(s): Jim Jasinski, Celeste
Emerging Pests of Bt Cotton and Dynamics of Insect Pests in Different Events of Bt Cotton
 Emerging Pests of Bt Cotton and Dynamics of Insect Pests in Different Events of Bt Cotton Udikeri.S.S., Kranthi.K.R 1., Patil.S.B.and Khadi.B.M Agricultural Research Station.Dharwad-580007(Karnataka:India)
CASTOR SEED SEASONAL REPORT
 August 3 rd, 2011 CASTOR SEED SEASONAL REPORT Higher area under castor across major castor growing regions in India by around 15% might be a hurdle for price rise in castor seed. Weakened export demand
Evaluation of Suitable Nutrient Management on Dual Purpose Flax (Linum usitatissimum L.) Crop under New Alluvial Zone (NAZ) of West Bengal, India
 Crop under New Alluvial Zone (NAZ) of West Bengal, India") International Journal of Current Microbiology and Applied Sciences ISSN: 2319-7706 Volume 7 Number 05 (2018) Journal homepage: http://www.ijcmas.com Original Research Article https://doi.org/10.20546/ijcmas.2018.705.002
International Journal of Current Microbiology and Applied Sciences ISSN: 2319-7706 Volume 7 Number 05 (2018) Journal homepage: http://www.ijcmas.com Original Research Article https://doi.org/10.20546/ijcmas.2018.705.002
Seasonal Incidence and Management of Red Spider Mite, Tetranychus urticae Koch. Infesting Rose
 International Journal of Current Microbiology and Applied Sciences ISSN: 2319-7706 Volume 6 Number 9 (2017) pp. 2723-2729 Journal homepage: http://www.ijcmas.com Original Research Article https://doi.org/10.20546/ijcmas.2017.609.335
Cotton (Gossypium hirsutum L.) is an important fibre
 is an important fibre") research article International Journal of Plant Sciences, Vol. 6 Issue 2 (July, 2011) : 262-266 Heterosis for seed cotton yield and its contributing characters in cotton (Gossypium hirsutum L.) S.A. PATIL,
research article International Journal of Plant Sciences, Vol. 6 Issue 2 (July, 2011) : 262-266 Heterosis for seed cotton yield and its contributing characters in cotton (Gossypium hirsutum L.) S.A. PATIL,
Efficacy of Genetically Modified Bt Toxins Against Insects with Different Genetic. Mexico. Address correspondence to B.E.T.
 Supplementary Information Efficacy of Genetically Modified Bt Toxins Against Insects with Different Genetic Mechanisms of Resistance Bruce E. Tabashnik 1, Fangneng Huang 2, Mukti N. Ghimire 2, B. Rogers
2011 Lygus Bug Management Trial in Blackeyes Kearney Research and Extension Center, Parlier, CA C.A. Frate 1, S.C. Mueller and P.B.
 2011 Bug Management Trial in Blackeyes Kearney Research and Extension Center, Parlier, CA C.A. Frate 1, S.C. Mueller and P.B. Goodell Introduction bugs are the primary insect pest of blackeye cowpeas (Vigna