AGRONOMIC HANDBOOK. J. Benton Jones, Jr. Management of Crops, Soils, and Their Fertility CRC PRESS. Boca Raton London New York Washington, D.C.
|
|
|
- Conrad Elliott
- 6 years ago
- Views:
Transcription
1
2 AGRONOMIC HANDBOOK Management of Crops, Soils, and Their Fertility J. Benton Jones, Jr. CRC PRESS Boca Raton London New York Washington, D.C.
3 The following material has been reproduced with permission from Grundon, N.J., Hungry Crops: A Guide to Nutrient Deficiencies in Field Crops, Information Series Q Department of Primary Industries, Queensland, Australia. Chapter 2--Text in Section and Tables 2.32 and 2.33; Text in Section 2.3.7; Text in Section 2.4.4; Text in Sections and and Table Chapter 3--Text in Sections and Chapter 4--Text in Sections and 4.8. Chapter 7--Text in Section 7.8. Library of Congress Cataloging-in-Publication Data Jones, J. Benton, Agronomic handbook : management of crops, soils, and their fertility / J. Benton Jones, Jr. p. cm. Includes bibliographical references (p. ). ISBN (alk. paper) 1. Agronomy--Handbooks, manuals, etc. I. Title. SB91.J dc This book contains information obtained from authentic and highly regarded sources. Reprinted material is quoted with permission, and sources are indicated. A wide variety of references are listed. Reasonable efforts have been made to publish reliable data and information, but the author and the publisher cannot assume responsibility for the validity of all materials or for the consequences of their use. Neither this book nor any part may be reproduced or transmitted in any form or by any means, electronic or mechanical, including photocopying, microfilming, and recording, or by any information storage or retrieval system, without prior permission in writing from the publisher. The consent of CRC Press LLC does not extend to copying for general distribution, for promotion, for creating new works, or for resale. Specific permission must be obtained in writing from CRC Press LLC for such copying. Direct all inquiries to CRC Press LLC, 2000 N.W. Corporate Blvd., Boca Raton, Florida Trademark Notice: Product or corporate names may be trademarks or registered trademarks, and are used only for identification and explanation, without intent to infringe. Visit the CRC Press Web site at by CRC Press LLC No claim to original U.S. Government works International Standard Book Number Library of Congress Card Number Printed in the United States of America Printed on acid-free paper
4 Preface Agronomy is defined as that branch of agriculture that deals with the theory and practice of field crop production and soil management. This agronomic handbook contains information on the cultures of some of the world s major agronomic grain, oil, fiber, and sugar crops and provides data on the characteristics and management of these crops and the soils on which they are grown. The handbook is divided into multiple parts, each dealing with a specific aspect of agronomy: the major field crops; soils, their classification and characteristics; ph, liming and liming materials; fertilizers; mineral nutrition; diagnostic procedures for assessing the fertility status of soils and the nutrient element status of plants; and units and measures. This handbook is unique in that it covers both crop and soil topics and focuses on their significant aspects. Although some of the information presented is dated and will change with time, most of it will not. The appendices include a list of definitions, a glossary of botanical terms, data on nutrient requirements for major agronomic crops, a list of troublesome weeds, a key to nutrient deficiency symptoms of legumes, and a summary of the characteristics of the major elements and micronutrients. The information in this book came from government publications, university bulletins and circulars, textbooks, journal articles, industry publications, and the Internet. The objectives are to focus on accepted basic principles and procedures and present only those aspects of each subject that will enhance knowledge of crops and soils. For example, fertilizer recommendations are not included since they are based on a range of inputs such as soil status, cropping procedures, and climatic, economic, and cultural conditions that will change with time and circumstances. Similarly, specific cultural crop practices are not included because most of them are based on local and regional climatic, economic, cultural, and other factors that will also change with time and circumstances. However, this book contains the basic information needed to develop cultural, liming, and fertilizer recommendations. Most agronomic reference books focus on a single crop or several related crops or on a specific soil topic. They do not cover a full range of both crop and soil topics as this book does. The major objective is to cover both crops and soils, so that the reader will need only one book to locate important and useful information on both aspects of agronomy. This handbook contains a wide range of fundamental information on crops and soils. It should serve as a valuable resource for all those engaged in agronomic production, study, and research, whether as farmers, agricultural consultants or advisors, researchers, or students.
5
6 Author J. Benton Jones, Jr., Ph.D., is professor emeritus at the University of Georgia (UGA). He retired in 1989 after completing 21 years of service. He spent 10 years as a professor of agronomy at the Ohio Agricultural Research and Development Center where he established the Ohio Plant Analysis Laboratory, the first of its kind to provide analytical and interpretive services dealing with agronomic crops. Dr. Jones joined UGA in 1968 and supervised construction of the Georgia Soil Testing and Plant Analysis Laboratory. He served as its first director until he became chairman of the Department of Horticulture in He also assisted in establishing the analytical laboratory of UGA s Institute of Ecology. Dr. Jones has written extensively about analytical methods and developed many procedures for assaying soil and plant tissue and interpreting soil and plant analyses to aid in crop production decision making. He was first president and later served as secretary-treasurer of the Soil and Plant Analysis Council. He has written more than 200 scientific articles, 15 book chapters, and 5 books. He established two international journals, Communications in Soil Science and Plant Analysis and the Journal of Plant Nutrition, and served as their editor for many years. Dr. Jones earned a B.S. in agricultural science from the University of Illinois and an M.S. and Ph.D. in agronomy from Pennsylvania State University. He has traveled widely in connection with consultancies in the former Soviet Union, China, Taiwan, South Korea, Saudi Arabia, Egypt, Costa Rica, Cape Verde, India, Hungary, Kuwait, and Indonesia. He has received many awards and recognitions for his work in soil testing and plant analysis. He is a Fellow of the American Association for the Advancement of Science, the American Society of Agronomy, and the Soil Science Society of America. The Soil and Plant Analysis Council established the J. Benton Jones, Jr. Award in his honor in The University of Horticulture in Budapest conferred an Honorary Doctorate on Dr. Jones. He is a member of Sigma Xi, Gamma Sigma Delta, and Phi Kappi Phi, and is listed in Who s Who in America and in several similar biographical listings. Dr. Jones resides in Anderson, SC. He continues to write and advise growers and is experimenting with hydroponic growing systems for use in the field and greenhouse.
7
8 Contents PART I Agronomic Crops Chapter 1 Production of Major Grain, Food, Oil, Fiber, and Sugar Crops Introduction Grain Yield Potentials Grain Crop Statistics World Oil Seed Production Fertilizer Application and Utilization Weights and Measures Nutrient Values of Grain and Oil Seeds Nitrogen Fixation of Legume Crops...16 References...16 Chapter 2 Grain Crops Barley (Hordenum vulgare L.) Introduction Production Statistics Barley Grain Composition Plant Analysis Interpretation Barley Grading and Glossary Terms Used by the U.S. Department of Agriculture Federal Grain Inspection Service (USDA-FGIS) to Grade Barley Barley Glossary Weights and Measures...23 References Corn (Zea mays L.) Introduction Kinds of Corn Dent Corn Flint Corn Flour Corn Pod Corn Popcorn Sweet Corn Waxy Corn Corn Glossary Composition of Whole-Grain Field Corn Composition of Whole Grain, Ground Ethanol Production Corn Production Statistics Corn Plant Nutrition Nutrient Element Deficiencies...45
9 Boron (B) Calcium (Ca) Copper (Cu) Iron (Fe) Magnesium (Mg) Manganese (Ma) Nitrogen (N) Phosphorus (P) Potassium (K) Sulfur (S) Zinc (Zn) Salinity Manganese (Mn) Toxicity Nutrient Element Plant Tissue Status Chlorophyll Meter Readings of Corn Leaves Planting Rates Correction Tables Weights and Measures...60 References Grain Sorghum [Sorghum bicolor (L.) Moench] Introduction Production Statistics Characteristics of Growth Sorghum Grain Characteristics Sorghum Plant Nutrition Nutrient Element Uptake by Grain Sorghum Nutrient Element Deficiencies Boron (B) Calcium (Ca) Copper (Cu) Iron (Fe) Magnesium (Mg) Manganese (Ma) Nitrogen (N) Phosphorus (P) Potassium (K) Sulfur (S) Zinc (Zn) Salinity Weights and Measures...77 References Oats (Avena sativa L.) Introduction Production Statistics Nutrient Element Characteristics Nutrient Element Deficiencies Boron (B) Calcium (Ca) Copper (Cu) Iron (Fe) Magnesium (Mg)...85
10 Manganese (Ma) Nitrogen (N) Phosphorus (P) Potassium (K) Sulfur (S) Zinc (Zn) Manganese Toxicity Salinity Weights and Measures...91 References Rice (Oryza sativa L.) Introduction Classification and Terminology Classes Types Special Grades Definitions Glossary Production Statistics Grain Quality Nutrient Element Deficiencies Fertilizer and Nutrient Element Status Nutrient Element Sufficiency Weights and Measures References Wheat (Triticum aestivum L., T. durum Desf.) Introduction Glossary Production Statistics Grain Quality Fertilizer Use Elemental Uptake and Utilization Nutrient Element Sufficiency Nutrient Element Deficiencies Calcium (Ca) Copper (Cu) Iron (Fe) Magnesium (Mg) Manganese (Ma) Nitrogen (N) Phosphorus (P) Potassium (K) Sulfur (S) Zinc (Zn) Salinity Saline Toxicity Problem Soils Correcting Toxicity Weights and Measures...125
11 References Chapter 3 Nut, Bean, and Oil Crops Peanut or Groundnut (Arachis hypogaea L.) Introduction Stages of Growth Production Statistics Nut Quality Nutrient Element Uptake Standards and Grades Farmers Stock Virginia Type Farmers Stock Runner Type Shelled Spanish Type Shelled Virginia Type Shelled Runner-Type Cleaned Virginia Type Weights and Measures References Soybean [Glycine max (L.) Merr.] Introduction Vegetative and Productive Stages Soybean Products, Standards, and Grades Soybean Processing Products U.S. Standards and Grades Production Statistics Fertilizer and Nutrient Element Uptake Nutrient Element Sufficiency Composition of Seed Nutrient Element Deficiencies Boron (B) Calcium (Ca) Iron (Fe) Magnesium (Mg) Manganese (Mn) Nitrogen (N) Phosphorus (P) Potassium (K) Sulfur (S) Zinc (Zn) Manganese and Sodium Chloride Toxicity Manganese (Mn) Toxicity Sodium Chloride (NaCl) Toxicity Weights and Measures References Chapter 4 Cotton (Gossypium spp.) Fiber Introduction Terms and Glossary Terms Glossary...158
12 4.3 Production Statistics Fertilizer Treatment Nutrient Element Uptake Nutrient Element Sufficiency (Leaf and Petiole Analysis) Nutrient Element Deficiencies Boron (B) Deficiency Symptoms Problem Soils Correcting Deficiency Calcium (Ca) Deficiency Symptoms Problem Soils Correcting Deficiency Copper (Cu) Deficiency Symptoms Problem Soils Correcting Deficiency Iron (Fe) Deficiency Symptoms Problem Soils Correcting Deficiency Magnesium (Mg) Deficiency Symptoms Problem Soils Correcting Deficiency Manganese (Mn) Deficiency Symptoms Problem Soils Correcting Deficiency Nitrogen (N) Deficiency Symptoms Problem Soils Correcting Deficiency Phosphorus (P) Deficiency Symptoms Problem Soils Correcting Deficiency Potassium (K) Deficiency Symptoms Problem Soils Correcting Deficiency Sulfur (S) Deficiency Symptoms Problem Soils Correcting Deficiency Zinc (Zn) Deficiency Symptoms Problem Soils Correcting Deficiency Salinity and Toxicity Toxicity Symptoms...172
13 4.8.2 Problem Soils Correcting Toxicity Weights and Measures References Chapter 5 Sugar Beet (Beta vulgaris L. spp.) Introduction Production Statistics Nutrient Element Removal and Utilization Plant Analysis Guide PART II Soil Classifications and Physical Characteristics Chapter 6 Major Soil Classification Systems Introduction Soil Taxonomy Order Suborder Great Group Subgroup Family Series Soil Orders (U.S. System of Soil Taxonomy) Global Distribution of Major Soil Orders State Soils Designations for Soil Horizons and Layers References PART III Soils and Their Properties Chapter 7 Physical, Chemical, and Biological Properties of Soils Cation Exchange Capacities of Soils and Soil Components Texture Textural Classes Soil Separates (USDA Classification) Hydrometer Procedure Soil Preparation Hydrometer Readings Blank Determination Calculations for Percentages of Sand, Silt, and Clay Soil Separate Definitions Sands Loams Clays Physical Characteristics Consistence Water Holding and Infiltration Rates Nutrient Element Contents of Surface Soils...222
14 7.6 Organic Matter Organic Matter Determination Titration Procedure Loss-on-Ignition Procedure Soil Component Glossary Soil Salinity Soluble Salt Determination Procedures :1 Water/Soil Extraction :1 Water/Soil Extraction Saturated Paste Method Correcting Salinity Problems Problem Soils Correcting Salinity Measurement of Conductivity Using a Soluble Salt Meter Theory of Operation Design of Conductivity Cell Effect of Temperature Sources of Error in Measurement Measurements and Conversions Electrical Conductivity Units and Conversions Salinity (NaCl) and Alkalinity (NaHCO 3 ) References PART IV Soil Analysis and Treatment Chapter 8 Soil ph, Liming, and Liming Materials Determination of Soil ph in Water and Salt Solutions Determination of ph in Water and Salt Solutions using ph Meter Water ph Determination ph Determination in 0.01M Calcium Chloride (CaCl 2 ) ph Determination in 1N Potassium Chloride (KCl) Determination of Soil ph Using Color Indicators Procedures Soil Acidity Definitions ph Interpretation Effect of ph on Soil and Plant Composition Fertilizer Efficiency Lime Rate (LR) Recommendations Liming Glossary Aglime Materials and Characteristics Lowering Soil Water ph Results of North America Soil Tests References Chapter 9 Fertilizers Introduction Fertilizer Use Fertilizer Glossary Major Elements of Fertilizers...263
15 9.5 Phosphorus Fertilizers Availability of Different Forms of Soil Phosphorus Effect of Soil Organic Matter on Phosphorus Availability Phosphorus for Winter Wheat Fertilizer Sources Micronutrients Fertilizer Placement and Rates Fertilizer Placement Banding Surface Strip or Dribble Banding Deep Banding High Pressure Injection Point Injection of Fluids Point Placement of Solids Starter Side-Dressing Organic Fertilizers Instructions for Preparing Organic Fertilizer References Chapter 10 Plant Mineral Nutrition Basic Principles Essential Nutrient Elements, Uptake Forms, and Relative Concentrations in Plants Factors Affecting Nutrient Element Concentrations Soil Moisture Temperature Soil ph Tillage and Placement Compaction Hybrid or Variety Interactions Stages of Growth Movement of Nutrient Element Ions in Soil Nutrient Element Symptoms Factors Affecting Nutrient Element Symptoms Root Zones Temperature Acidity or Alkalinity Varieties and Genetic Factors Stage of Maturity Summary of Essential Elements and Functions Micronutrient Elements Micronutrients Trace Elements Heavy Metals Summary: Plant Nutrition and Essential Major Nutrient Elements Nitrogen (N) Nitrogen in Soil Soil Dynamics Fertilizers Uptake and Assimilation by Higher Plants...313
16 Nitrate Translocation Ammonium Translocation Assimilation Essential Role of Nitrogen Nutrition in Higher Plants Adequate Range and Nutritional Disorders Interactions with Other Elements Phosphorus (P) Phosphorus in Soil Soil Dynamics Fertilizers Uptake and Assimilation by Higher Plants Phosphorus Nutrition in Higher Plants Adequate Range and Nutritional Disorders Interactions with Other Elements Potassium (K) Potassium in Soil Soil Dynamics Fertilizers Uptake and Assimilation by Higher Plants Adequate Range and Nutritional Disorders Interactions with Other Elements Calcium (Ca) Calcium in Soil Fertilizers Uptake and Assimilation by Higher Plants Translocation and Assimilation Nutrition in Higher Plants Adequate Range and Nutritional Disorders Interactions with Other Elements Magnesium (Mg) Magnesium in Soil Fertilizers Magnesium Uptake and Assimilation by Higher Plants Translocation and Assimilation Nutrition in Higher Plants Adequate Range and Nutritional Disorders Interactions with Other Elements Sulfur (S) Sulfur in Soil Soil Dynamics Fertilizers Uptake and Assimilation by Higher Plants Nutrition in Higher Plants Adequate Range and Nutritional Disorders Interactions with Other Elements Summary: Plant Nutrition and Essential Micronutrients Boron (B) Boron in Soil Fertilizers Uptake and Assimilation by Higher Plants Nutrition in Higher Plants...326
17 Adequate Range and Nutritional Disorders Interactions with Other Essential Elements Chlorine (Cl) Chlorine in Soil Uptake and Assimilation by Higher Plants Adequate Range and Nutritional Disorders Interactions with Other Essential Elements Copper (Cu) Copper in Soil Soil Fertilizers Uptake and Assimilation by Higher Plants Nutrition in Higher Plants Adequate Range and Nutritional Disorders Interactions with Other Essential Elements Iron (Fe) Iron in Soil Fertilizers Uptake and Assimilation by Higher Plants Nutrition in Higher Plants Adequate Range and Nutritional Disorders Interactions with Other Essential Elements Manganese (Mn) Manganese in Soil Uptake and Assimilation by Higher Plants Nutrition in Higher Plants Adequate Range and Nutritional Disorders Interactions with Other Elements Molybdenum (Mo) Molybdenum in Soil Uptake and Assimilation by Higher Plants Nutrition in Higher Plants Adequate Range and Nutritional Disorders Interactions with Other Elements Zinc (Zn) Zinc in Soil Uptake and Assimilation by Higher Plants Nutrition in Higher Plants Adequate Range and Nutrition Disorders Interactions with Other Elements References PART V Diagnostic Procedures for Soil and Plant Analysis Chapter 11 Soil Analysis Introduction Sequence of Procedures Sampling Soil Analysis Procedures Soil ph Testing Testing for Phosphorus...341
18 Testing for Cation Elements (Ca, Mg, K, and Na) Extractable Micronutrients (B, Cu, Fe, Mn, and Zn) Testing Methods for Other Ions and Elements Interpretation of Soil Test Values Interpretive Values and Ranges for Various Soil Tests Fertilizer Recommendations Based on Soil Test Results Cumulative Relative Frequencies of Levels of Soil Test K and P in North America References Chapter 12 Plant Analysis Introduction Sampling Comparative Sampling Inappropriate Sampling Number of Plants to Sample Lack of Homogeneity Plant Parts Initial Sample Handling Decontamination (Washing) Organic Matter Destruction High Temperature (Dry) Ashing Wet Acid Digestion in a Mixture of HNO 3 and HClO Wet Acid Digestion in a Mixture of HNO 3 and 30% H 2 O Wet Acid Digestion in H 2 SO 4 and 30% H 2 O Sample Analysis Interpretation of Test Results Literature References for Plant Analysis Interpretation Interpretation Texts DRIS General Texts Steps in Diagnostic Observation Visual Examination Information Required for Diagnosis Develop Case History of Problem Describe Symptoms Final Diagnosis Additional Aspects of Crop Diagnosis Factors Affecting Nutrient Element Symptoms Root Zones Temperature Acidity or Alkalinity Varieties and Genetic Factors Stage of Maturity Management Program for Producing and Sustaining High Yield References PART VI Reference Materials and Appendices Chapter 13 Weights, Measures, and Conversion Factors...381
19 Appendix A Soil/Plant Definitions Appendix B Botanical Definitions Appendix C Nutrient Element Requirements for Several Agronomic Crops (based on crop removal and/or growth response) Appendix D Troublesome Weeds Appendix E Legumes: Nutrient Element Deficiency Symptoms Appendix F Characteristics of Essential Nutrient Elements Book List Index...445
20 List of Tables Table 1.1 Maximum Attainable Crop Yield Ranges for High and Intermediate Level Inputs in Tropical, Subtropical, and Temperate Environments under Irrigated Conditions...5 Table 1.2 Annual Changes (%) in World Grain Yields by Decade, (3-year average)...6 Table 1.3 U.S. Total Grain Supply and Disappearance (million metric tons), Table 1.4 U.S. Total and Per Capita Civilian Consumption of Wheat and Wheat Products, Table 1.5 U.S. Total and Per Capita Civilian Consumption of Rye and Milled Table 1.6 Rice, U.S. Total and Per Capita Civilian Consumption of Corn and Corn Products, Table 1.7 U.S. Total and Per Capita Civilian Consumption of Oats and Barley, Table 1.8 North American Verifiable Record Crop Yields...9 Table 1.9 U.S. Average Crop Yields, Table 1.10 World Oilseed Production, Table 1.11 Field Crops: Percent of Acreage Receiving Fertilizer Applications, Table 1.12 Nutrient Utilization (lb/acre) by Various Agronomic Crops...11 Table 1.13 Uptakes of Major Elements and Micronutrients by Various Agronomic Crops...12 Table 1.14 Weights and Measures of Agronomic Commodities...13 Table 1.15 Weights of Full Bushels and Standard Yields of Grain...14 Table 1.16 Conversion Factors for Agronomic Crops...14 Table 1.17 Crop Seeds per Pound, Weights per Bushel, and Germination Times...15 Table 1.18 Comparison of the Nutritive Values of Selected Grain and Oilseed Crops...15 Table 1.19 Quality Components of Grains...16 Table 1.20 Nitrogen Fixation Rates of Legume Crops...16 Table 2.1 U.S. Barley Area, Yield, and Production, Table 2.2 Leading Barley-Growing Countries, Table 2.3 Leading Barley-Producing States, Table 2.4 U.S. Total and Per Capita Civilian Consumption of Barley and Barley Products as Food, Table 2.5 Quality Components of Barley Grain...19 Table 2.6 Nutritive Values of Pearled Barley Grain...20 Table 2.7 Nutrient Element Sufficiency Ranges...20 Table 2.8 Barley Seeds/Pound, Weight/Bushel, and Germination Time...25 Table 2.9 Weight and Standard Yield of Full (Level) Bushel of Barley Grain...25 Table 2.10 Growth Stages of Corn, Cumulative Growing Degree Days, and Calendar Days Required to Reach Successive Stages...29 Table 2.11 U.S. Corn Acreage, Grain Yield, and Production, Table 2.12 U.S. Acreage, Yield, Production, and Value for Corn Grain and Silage, Table 2.13 Corn Planted in the U.S. (1,000 acres), Table 2.14 U.S. Corn Yield and Production, Table 2.15 U.S. Total and Per Capita Civilian Consumption of Corn and Corn Products as Food,
21 Table 2.16 World Corn Production by Country Shown as Percent of Total, Table 2.17 World Corn Consumption by Country, Table 2.18 World Corn Exports by Country Shown as Percent of Total, Table 2.19 Annual Percent Change in World Corn Yields, (3-year average)...37 Table 2.20 U.S. Corn Acreage, Yield, and Production for Grain and Silage, Table 2.21 Corn Grain Acreage, Yield, and Production by Continent and Country, Table 2.22 Corn: Percent of Areas Receiving Fertilizer Applications, All States Surveyed, Table 2.23 Nutrient Elements Contained in the Stovers, Grains, and Roots of a 150-Bu Corn Crop...39 Table 2.24 Nutrient Elements Required to Produce 150 bu (8,400 lb at 56 lb/bu) of Corn...39 Table 2.25 Corn Crop Nutrient Element Utilization (lb/acre)...40 Table 2.26 Uptake of Major Elements and Micronutrients by a 10-Ton/Acre Corn Crop...40 Table 2.27 Major Element and Micronutrient Removal by Corn Grain and Stover at Two Grain Yields...41 Table 2.28 Major Requirements of Corn during Growing Season (Yield = 11.8 tons/ha)...41 Table 2.29 Increase Elemental Content of Corn Plants Produced by Nitrogen Fertilization...42 Table 2.30 Plant Nutrient Elements Absorbed by 180-Bu/Acre Corn Crop during Successive 25-day Growing Periods (%)...42 Table 2.31 Key to Nutrient Deficiency Symptoms of Corn...53 Table 2.32 Effects of Salinity on Corn...54 Table 2.33 Effects of Manganese Toxicity on Corn...55 Table 2.34 Critical Plant Nutrient Element Levels in Corn Leaves Opposite to and below the Ear at Tasseling...56 Table 2.35 Normal Expected Ranges in Nutrient Elements Concentrations for Parts of Corn Plants...56 Table 2.36 Sufficiency Ranges for Major Elements and Micronutrients in Corn Plants...57 Table 2.37 Corn Plants/Acre at Various Planting Rates...59 Table 2.38 Corn Grain Moisture Yield Correction...59 Table 2.39 Percentage of Shelled Corn to Add or Subtract to Correct to 15.5% Moisture Content...60 Table 2.40 Weights and Measures of Corn Commodities...60 Table 2.41 Weight of Grain and Standard Yield of Level Full Bushel of Corn...60 Table 2.42 Corn Seeds per Pound, Weight per Bushel, and Germination Time...61 Table 2.43 U.S. Sorghum Grain and Silage Acreage, Yield, and Production, Table 2.44 U.S. Grain Sorghum Acreage and Production, Table 2.45 U.S. Utilization of Sorghum for Silage, Table 2.46 Stages of Growth of Grain Sorghum...63 Table 2.47 Nutritive Values of Whole Sorghum Grain...64 Table 2.48 Levels and Degrees of Toxicity of Prussic Acid in Grain Sorghum...64 Table 2.49 Levels and Degree of Toxicity of Nitrates in Grain Sorghum...64 Table 2.50 Average Mineral Composition of Grain Sorghum...65 Table 2.51 Influence of Nitrogen Application on Protein Content of Grain Sorghum...65 Table 2.52 Quality Components of Sorghum Grain...65 Table 2.53 Nutrient Element Contents of Above-Ground Parts of Grain Sorghum Plant...66 Table 2.54 Normal Ranges in Composition of Leaves and Grain of Grain Sorghum...66 Table 2.55 Table 2.56 Critical Nutrient Element Concentrations for Grain Sorghum...66 Approximate Amounts of Nutrient Elements Removed by 5,600 Pounds Grain Sorghum...67
22 Table 2.57 Fertilizer Nutrient Element Demand/Uptake/Removal (kg/ha) by Grain Sorghum...67 Table 2.58 Cumulative Estimated Amounts of Primary Nutrient Elements Absorbed by Grain Sorghum during the Georgia Growing Season (5,600 lb/acre)...67 Table 2.59 Nutrient Element Utilization by Grain Sorghum Crop (8,000 lb/acre)...68 Table 2.60 Key to Nutrient Element Deficiencies for Sorghum...68 Table 2.61 Weight and Standard Yield of Level Full Bushel of Sorghum...77 Table 2.62 Sorghum Seeds/Pound, Weight/Bushel, and Germination Time...77 Table 2.63 Harvested Area, Yield, and Production of Oats by Continents and Specified Countries, Table 2.64 U.S. Oat Acreage, Yield, and Production, Table 2.65 Leading Oat-Producing States, Table 2.66 U.S. Total and Per Capita Civilian Consumption of Oat and Oat Products as Food, Table 2.67 Leading Oat-Producing States and Provinces...80 Table 2.68 Relative Nutrient Element Uptake (% of Maximum) of Oats in Relation to Plant Development...81 Table 2.69 Nutrient Element Utilization (lb/acre) by 100-bu/acre Oat Crop...81 Table 2.70 Nutrient Element Sufficiency Ranges for Oats...81 Table 2.71 Crop Seeds/Pound, Weight/Bushel, and Germination Time...91 Table 2.72 Leading Rice-Growing Countries, Table 2.73 Milled Rice: Acreage, Yield, and Production in Continents and Specified Countries, Table 2.74 Rice by Length of Grain: U.S. Acreage, Yield, and Production, Table 2.75 Rough Rice: U.S. Acreage, Yield, and Production, Table 2.76 Rice and Milled Rice Products: U.S. Total and Per Capita Civilian Consumption, Table 2.77 Food Value of White Rice Table 2.78 Nutritive Value of Whole Grain Table 2.79 Nutrient Element Deficiency Symptoms and Effects on Growth Table 2.80 Element Toxicity Symptoms and Effects on Growth Table 2.81 Silicon Fertilizer Sources Table 2.82 General Soil- and Season-Specific Fertilizer Recommendations (kg/ha) for Irrigated Rice Table 2.83 Effect of Nutrient Availability on the Removal of N, P, and K (kg Nutrient/ton of Rice Grain) for the Linear Part of the Relationship of Grain Yield and Nutrient Uptake (<80% of Potential Yield) Table 2.84 Optimal Internal Efficiency (kg/grain/kg Element) of N, P, and K in Irrigated Rice Table 2.85 Uptake of Major Elements and Micronutrients for 7.8 Tons/Acre Crop Table 2.86 Nitrogen, Phosphorus, and Potassium Uptake and Content in Modern Rice Varieties Table 2.87 Optimal Ranges and Critical Levels for Occurrence of Mineral Deficiencies or Toxicities in Tissue Table 2.88 Nutrient Element Sufficiency Ranges Table 2.89 Typical Symptoms Associated with Most Common Deficiencies Table 2.90 Rice Seeds/Pound, Weight/Bushel, and Germination Time Table 2.91 Weights and Measures Table 2.92 Wheat: Area, Yield, and Production, Table 2.93 Area, Yield, and Production of Leading Wheat-Growing Countries, Table 2.94 Area, Yield, and Production of Leading States,
23 Table 2.95 U.S. Total and Per Capita Civilian Consumption of Wheat and Wheat Products, Table 2.96 U.S. Wheat Acreage, Yield, and Production, Table 2.97 Harvest Times for Wheat Crops Table 2.98 Table 2.99 Varieties of U.S.-Grown Wheat Average Composition (%) of Wheat Flour, Bran, and Germ Containing about 13% Moisture Table Quality Components of Wheat Grain Table Fertilizer, Total Acreage, and Area Receiving Applications (%), All States Surveyed, Table Nutrient Elements Removed by a Bushel of Wheat Table Nutrient Elements (lb/acre) Removed by Wheat Crop Table Uptake of Major Elements and Micronutrients for 4-Ton/Acre Wheat Crop Table Nutrient Element Utilization by 40-Bu/Acre Wheat Crop Table Nutrient Element Sufficiency Ranges for Wheat Table Effects of Salinity on Wheat Table Wheat Seeds/Pound, Weight/Bushel, and Germination Time Table Weight and Standard Yield of Level Full Bushel of Wheat Grain Table 3.1 Peanut Growth Stages Table 3.2 U.S. Peanut Acreage, Yield, and Production, Table 3.3 Peanut Acreage, Yield, and Production by State, Table 3.4 Peanuts in the Shell: Area, Yield, and Production by Continent, Table 3.5 Peanuts in the Shell: Area, Yield, and Production in Specified Countries, Table 3.6 Nutritive Value of Whole Peanut Seed Table 3.7 Nutritive Value of Raw Peanut with Skin Table 3.8 Uptake of Major Elements and Micronutrients for a 4.5-Ton/Acre Peanut Crop Table 3.9 Allowable Percentages for Farmers Stock Runners Based on Total Weight of Sample Table 3.10 Weights and Measures for Unshelled Peanuts Table 3.11 Peanut Seeds/lb, Weight/bu, and Germination Time Table 3.12 Vegetative Stages Table 3.13 Reproductive Stages Table 3.14 Comparison of Determinate and Indeterminate Soybeans Table 3.15 U.S. Soybean Acreage, Yield, and Production, Table 3.16 World Soybean Production, Table 3.17 Leading Soybean-Growing States: Acreage, Yield, and Production, Table 3.18 Soybeans: Area, Yield, and Production by Continent and Country, Table 3.19 Percentages of Areas Receiving Fertilizer Applications, All States Surveyed, Table 3.20 Uptake of Major Nutrient Elements for a 4-Ton/Acre Soybean Crop Table 3.21 Nutrient Element Utilization (lb/acre) by 40- and 60-Bu/Acre Soybean Crops Table 3.22 Soybean Nutrient Element Sufficiency Ranges Table 3.23 Nutritive Values of Whole Soybean Seed Table 3.24 Composition of Soybean Seed Table 3.25 Weight and Standard Yield of Level Full Bushel of Soybean Grain Table 3.26 Soybean Seeds/lb, Weight/bu, and Germination Time Table 4.1 U.S. Cotton Acreage, Yield, and Production, Table 4.2 Cotton Area, Yield, and Production of Continents and Specified Countries, Table 4.3 Acreage, Yield, and Production of Leading Cotton-Producing States,
24 Table 4.4 Fertilizer Application Total Acreage and Areas Receiving Applications, All States Surveyed, Table 4.5 Uptake of Major Elements and Micronutrients for a 1.7-Ton/Acre Cotton Lint Crop Table 4.6 Nutrient Element Uptake and Removal by 2,500 kg/ha Cotton Crop Table 4.7 Nutrient Element Utilization (lb/acre) by Cotton Crop Table 4.8 Nutrient Element Sufficiency Ranges Table 4.9 Petiole Nitrate-Nitrogen (NO 3 -N) Levels for Sufficiency (ppm) Table 4.10 Nutrient Element Deficiency Symptoms Table 4.11 Nutrient Element Deficiency Descriptions Table 4.12 Cotton Seeds/lb, Weight/bu, and Germination Time Table 4.13 Cotton Weights and Measures Table 5.1 U.S. Harvested Acreage, Yield, and Production, Table 5.2 U.S. Acreage, Yield, and Production by Leading States, Table 5.3 Leading Sugar Beet-Growing Countries Table 5.4 Average Nutrient Element Removal by a 10-Ton Sugar Beet plus Foliage Crop Table 5.5 Variations of Nutrient Element Removal by Sugar Beets Depending on Cultivation Intensity Table 5.6 Nutrient Element Utilization by a 30-Ton/Acre Sugar Beet Crop Table 5.7 Sugar Beet Plant Analysis Table 6.1 Soil Order Prevalence Table 6.2 Soil Order Characteristics Table 6.3 Soil Orders Found in Different Temperature Regions Table 6.4 Soil Orders, Characteristics, and Diagnoses Table 6.5 Areas and Percentages of Suborders and Miscellaneous Land Units Based on Ice-Free Land Area Table 6.6 Prefixes and Connotations for Great Group Names in the U.S. Soil Classification System Table 6.7 U.S. Soil Classification System Table 6.8 U.S. State Soils Table 6.9 Designations for Soil Horizons and Layers Table 7.1 Representative Cation Exchange Capacities (CECs) of Surface Soils by Soil Order Table 7.2 Specific Surfaces of Clay Minerals and Soils Table 7.3 Charge Characteristics and Cation Exchange Capacities (CECs) of Clay Minerals Table 7.4 Cation Exchange Capacities (CECs) of Clay Minerals Table 7.5 Cation Exchange Capacities (CECs) of Soil Colloids Table 7.6 Approximate Cation Exchange Capacities (CECs) Related to Textural Classes of Soils with Water ph Levels below Table 7.7 Classification Scheme for Phyllosilicates Related to Clay Minerals Table 7.8 Particle Size Fraction Comparison Table 7.9 Particle Size Fraction Designations Table 7.10 Approximate Bulk Densities that Restrict Root Penetration by Soil Texture Table 7.11 Bulk Density versus Percent Volume of Solids and Pores Table 7.12 Composition of Grassland Soil Table 7.13 Consistence Levels Table 7.14 Approximate Amounts of Water Held by Different Soils Table 7.15 Soil Moisture Constants and Corresponding Tension Values Table 7.16 Approximate Water Storage Capacity of Soils Table 7.17 Infiltration Rates...220
25 Table 7.18 Options for Improving Irrigation Water Productivity Table 7.19 Amounts of Plant Nutrient Elements Ordinarily Present in 15 cm of Surface Soil in Humid Region Table 7.20 Common Concentration Levels of Micronutrients/Trace Elements (ppm) in Mineral Soils Table 7.21 Nutrient Elements in Soil Table 7.22 Functions of Organic Matter and Organisms in Soil Table 7.23 Properties and Functions of Organic Matter in Soil Table 7.24 Organic Matter Components of a Grassland Soil (wt% in dry matter) Table 7.25 Interpretative Values for Organic Matter Content in Top 6 In. of Soil Table 7.26 Interpretation of Soil Conductance Readings (ds/m) Table 7.27 Conductivity of Soluble Salts Table 7.28 Relationship of Degree of Salinity (ds/m) and Soil Texture Table 7.29 Interpretation of Field Soil Salt Concentrations Table 7.30 Crop Tolerance to Salinity Table 7.31 Amounts of Gypsum and Sulfur Required to Reclaim Alkali Soils Table 8.1 Three Category Ranges of Soil Water ph Interpretation Table 8.2 Interpretation of Soil Water ph Table 8.3 ph Categories Determined in 0.01M CaCl 2 2H 2 O Table 8.4 Effect of Soil ph on Element Availability and/or Soil Solution Composition Table 8.5 Fertilizer Efficiency (%) at Varying Soil ph Levels Table 8.6 Finely Ground Limestone Needed to Raise ph from 4.5 to 5.5 and from 5.5 to 6.5 in a 7-In. Layer of Soil Table 8.7 Approximate Amounts of Finely Ground Limestone Needed to Raise the ph of a 7-In. Layer of Soil Table 8.8 Quantity of Ag-Ground Limestone (1,000 lb/acre) Required to Raise Acid Soil ph to 6.5 to a Soil Depth of 6 2/3 In. Based on Soil Water ph and Soil Texture Table 8.9 Approximate Amount of Finely Ground Limestone Needed to Raise the ph of a 7-In. Layer of Soil Table 8.10 Agricultural Limestone (Tons/Acre) Needed to Raise Soil ph to Desired Level Based on the SMP Lime Test Index and Incorporation Depth of 8 In Table 8.11 Adjustment for Extractable Aluminum (based on Morgan Wolf modification) Table 8.12 Prediction of Lime Requirement for Most Tropical Soils Table 8.13 Common Liming Materials Table 8.14 Calcium Carbonate Equivalents (CCEs) of Aglime Materials Table 8.15 Amounts of Aglime Materials at Different CaCO 3 Equivalents Required to Equal 1 Ton Pure CaCO Table 8.16 Effect of Fineness on Aglime Availability Table 8.17 Adjustment of LR Based on Depth of Incorporation Table 8.18 Aglime Material CaCO 3 Equivalents Required to Equal 1 Ton Pure CaCO Table 8.19 Approximate Amounts of S (95%) Needed to Increase Acidity of a 6-Inch-Deep Layer of a Carbonate-Free Soil Table 8.20 Commonly Used Materials and Equivalent Amendment Values Table 8.21 Cumulative Relative Frequencies (%) for Soil Test Water ph in North America by Region Table 9.1 World Fertilizer Use, Table 9.2 Fertilizer Consumption by Region for 1995 and Projected Growth Rates for 2025 and Table 9.3 Field Crops: Percent of Area Receiving Fertilizer Applications, All States Surveyed,
26 Table 9.4 Molecular Weights of Essential Nutrient Elements, Compounds, and Ions Table 9.5 Major Element-Containing Fertilizer Materials, Their Formulations, Forms, and Percent Contents Table 9.6 Common Fertilizers and Their Characteristics Table 9.7 Properties of Major Element Fertilizer Materials Table 9.8 Equivalent Weights of Common Fertilizers Supply Plant Nutrient Elements in Ionic Forms Table 9.9 Cold Water Solubility of Fertilizers Table 9.10 Equivalent Acidities of Major Commercial Fertilizers Table 9.11 Parts per Million and Millequivalents per Liter Supplied When 1 lb or 1 kg of Material is Dissolved in 1,000 Gallons or 10 m 3 of Water Table 9.12 Conversion Factors for Nutrient Concentrations in Fertilizers Table 9.13 Physical Characteristics of Liquid Fertilizers Table 9.14 Granular Fertilizer Properties Table 9.15 Micronutrient-Containing Fertilizer Materials Table 9.16 Synthetic Micronutrient Chelates Table 9.17 Typical Application Rates of Micronutrient Fertilizers Table 9.18 Relative Sensitivities of Selected Crops to Micronutrient Deficiencies Table 9.19 Soil Conditions and Crops Most Frequently Affected with Micronutrient Deficiencies Table 9.20 Agronomic Crop Species Sensitive to Excessive Levels of Micronutrients Table 9.21 Functions of Micronutrients Table 9.22 Most Common Micronutrient Deficiency Symptoms and Causes Table 9.23 Placement Locations and Methods Table 9.24 Useful Equivalents for Estimating Application Rates for Small Areas Table 9.25 Converting Rates per Acre to Rates for Small Areas Table 9.26 Organic Fertilizer Catalog Table 9.27 Average Elemental Compositions (%) of Common Natural Organic Materials and Manures Table 9.28 Fertilizer Nutrient Contents and C/N Ratios of Commercial Organic Products Table 9.29 Typical Major Nutrient Element Contents (%) of Organic Materials Table 9.30 Micronutrient Contents (lb/ton) of Organic Materials Table 9.31 Approximate Nutrient Element Levels for Manures Table 9.32 Average Element Content of Dung Table 9.33 Approximate Major Element Composition of Manures Table 9.34 Formulas for Balanced, All-Purpose Organic Fertilizer Table 10.1 Chronology of Discoveries of Essential Nutrient Elements Table 10.2 Average Concentrations of Mineral Nutrients in Plant Dry Matter Required for Adequate Growth Table 10.3 Nutrient Elements, Uptake, and Biochemical Functions Table 10.4 Nutrient Elements Required for Normal Growth, Typical Concentrations, Major Functions, and Usual Sources Table 10.5 Characteristics and Principal Forms of Uptake of Nutrient Elements Essential for Growth and Plant Contents Table 10.6 Uptake of Nitrogen, Phosphorus, Potassium, Calcium, Magnesium, Boron, Copper, Iron, Manganese, Molybdenum, and Zinc by Various Crops Table 10.7 Movement of Nutrient Element Ions in Soil and Their Uptake by Plants Table 10.8 Relative Significance of Movements of Ions from Soil to Corn Roots Table 10.9 Generalized Symptoms of Nutrient Element Deficiencies and Excesses Table Crops Susceptible to Micronutrient Deficiencies Table Estimated Occurrence of Micronutrient Deficiencies...302
27 Table Relative Sensitivities of Selected Crops to Micronutrient Deficiencies Table Agronomic Crop Species Sensitive to Deficient or Excessive Levels of Micronutrients Table Soil Conditions and Crops Commonly Affected by Micronutrient Deficiencies Table Interactions of Major Nutrient and Trace Elements in Plants Table Typical Concentrations of Micronutrients in Foliages of Normal Plants Table Sufficient Micronutrient Content (mg/kg) of Plants at Weeks 7 to 8 Growth Stage Table Classification of Micronutrients and Trace Elements as Essential Plant Nutrient Elements or Toxins Table Approximate Concentrations (mg/kg Dry Wt.) of Micronutrients and Trace Elements in Mature Leaf Tissue Table Approximate Uptake of Micronutrients and Trace Elements Table General Effects of Micronutrient and Trace Element Toxicity on Common Cultivars Table Forms and Principal Functions of Essential Micronutrients and Trace Elements Table Average Contents of Four Trace Elements in Dry Matters of Crops Grown Side by Side Table Heavy Metals and Sources Table Cumulative Heavy Metal (Trace Element) Additions (kg/ha) to Soil Based on Cation Exchange Capacity Table Soil Plant Transfer Coefficients for Heavy Metals Table Removal of Trace Heavy Metals from Soil by Crops Table Relative Heavy Metal Accumulation in Plants Table Maximum Heavy Metal Concentrations per USEPA Regulations for Sludge Sold in Bulk for Land Application Table Frequency of Monitoring per USEPA Regulations and Based on Annual Rate of Application of Sewage Sludge Table 11.1 Soil Tests Based on Objectives Table 11.2 Phosphorus Testing Procedures Table 11.3 Recommended Phosphorus Tests for Soils in U.S. Geographic Regions Table 11.4 Phosphorus Extraction Reagents Table 11.5 Phosphorus Extraction Reagents: Preparation and Procedure Table 11.6 Interpretative Values for Extractable Phosphorus Table 11.7 Cation Testing Procedures Table 11.8 Cation Extraction Reagents Table 11.9 Cation Extraction Reagents: Preparation and Procedure Table Indices for AB-DTPA-Extractable Potassium Table Indices for Morgan-Extractable Potassium and Magnesium (mg/kg in Soil) Table Micronutrient Testing Table Extraction Reagents for Micronutrients Table Micronutrient Ratings and Recommendations Based on Tests with Different Extraction Reagents and Soils Table Interpretation of Hot Water-Extractable Boron Tests Table Indices for AB-DTPA-Extractable Micronutrients (mg/kg in Soil) Table Classification of Micronutrients (mg/l) into Fertility Classes Table Deficiency and Excess Concentration Ranges for Micronutrients Table Interpretation of Micronutrient Soil Data (mg/l Soil = 1.5 kg Mineral Soil) Table Extraction Reagents for Determining Ammonium and Nitrate Table Extraction Reagents for Determining Sulfate Table Definitions Related to Availability...356
28 Table Soil Nutrient Classifications Table Soil Analysis Interpretation by Test Rating Table Probable Crop Responses to P and K by Soil Rating Table Fertility Ratings for Mehlich No. 3-Extractable P, K, Ca, and Mg (mg/dm 3 ) Table Critical Values for Mehlich No. 3-Extractable Mn and Z (mg/dm 3 ) Table Interpretive Values for Bray P1- and Olsen-Extractable P (ppm) Table Interpretive Values for Ammonium Acetate-Extractable K, Ca, and Mg (ppm) Table Interpretive Values for DTPA-Extractable Cu, Fe, Mn, and Zn (ppm) Table Interpretive Values for Hot Water-Extractable B Table Interpretive Values for Water-Extractable N as the Nitrate Anion at 48-Inch Soil Depth (ppm) Table Cumulative Relative Frequencies (%) for Ammonium Acetate Equivalent K in North America by Region Table Cumulative Relative Frequencies for Bray P-1 Equivalent Soil Test P in North America by Region and Sampling Density for States and Provinces Table Fractions of Samples Analyzed by Specific P and K Soil Tests Table Soil Test Range Equivalents Assumed in Tables and Table 12.1 Element Mobilities within Plants Table 12.2 Effects of Decomination (Washing) on Nutrient Element Concentrations in Orange Leaves Table 12.3 Markert s Reference Plant Composition for Major Elements and Micronutrients Table 12.4 Producers and Suppliers of Reference Materials for Elemental Composition Quality Control in Plant Analysis Table 13.1 Avoirdupois Weight Table 13.2 U. S. Dry Measure Table 13.3 U.S. Liquid Measure Table 13.4 Linear Measure Table 13.5 Square Measure Table 13.6 Common Conversions Table 13.7 Factors for Converting U.S. Units into SI Units Table 13.8 Convenient Conversion Factors Table 13.9 Soil Analysis Values Table Plant Analysis Values Table Calculation of Millequivalents (meq) and Microequivalents (p.e.) per 100 g from Percent and Parts per Million...388
29
30 List of Illustrations Figure 1.1 World grain production, Figure 1.2 World grain production per person, Figure 1.3 Wheat, corn, and rice production, Figure 1.4 Harvested grain area per person, , with projections to Figure 2.1 Corn yields in the U.S., China, and Brazil, Figure 2.2 Nitrogen uptake and distribution in corn...43 Figure 2.3 Phosphorus uptake and distribution in corn...43 Figure 2.4 Potassium uptake and distribution in corn...43 Figure 2.5 Normal ears on well fertilized, high-producing corn often weigh 5 oz to 8 oz...44 Figure 2.6 Big ears (in excess of 8 oz), with kernels covering the tips of the cobs...44 Figure 2.7 Small ears may be signs of low fertility...44 Figure 2.8 Poorly filled tips and loose, chaffy kernels may indicate potassium deficiency...44 Figure 2.9 Phosphorus deficiency results in small, twisted ears and underdeveloped kernels from lack of pollination...44 Figure 2.10 Nitrogen deficiency at critical times results in small ears; kernels at the tips do not fill...44 Figure 2.11 Dry weather slows silking; kernels are not well pollinated...45 Figure 2.12 Relative yield of corn grain versus concentration of total nitrogen in a basal segment of a stalk...57 Figure 2.13 Rough rice: Production and value of production, Figure 2.14 Wheat production and value of production in the U.S., Figure 3.1 Peanuts: Value of U.S. production, Figure 3.2 World soybean production, Figure 3.3 World soybean production per person, Figure 3.3 World soybean area harvested, Figure 3.4 Production of soybeans and value of production, Figure 4.1 Sufficiency range for cotton petiole nitrate (NO 3 ) in Arkansas Figure 6.1 Proportions of Earth s surface occupied by the great soil zones Figure 6.2 Map showing nine major soil regions. Proportions of the land surface: Inceptisols, 3.44%; Spodosols and Histosols, 9.89%; Alfisols and Inceptisols, 4.25%; Ultisols, 3.83%; Mollisols, 12.38%; Vertisols, 2.81%; Aridisols, 25.34%; Oxisols, Inceptisols, and Ultisols, 20.54%; Entisols and Inceptisols (mountain soils), 17.44% Figure 6.3 Global distribution of Alfisols Figure 6.4 Global distribution of Aridisols Figure 6.5 Global distribution of Entisols Figure 6.6 Global distribution of Histosols Figure 6.7 Global distribution of Inceptisols Figure 6.8 Global distribution of Mollisols Figure 6.9 Global distribution of Oxisols Figure 6.10 Global distribution of Spodosols Figure 6.11 Global distribution of Ultisols Figure 6.12 Global distribution of Vertisols Figure 7.1 Soil textural classes based on percentage content of sand, silt, and clay Figure 7.2 Comparison of particle size limits of four systems of particle size classification...214
31 Figure 8.1 Regression line for the relationship of ph of CaCl 2 and ph of KCl Figure 8.2 ph scale for agricultural soils Figure 8.3 Soil ph ranges Figure 8.4 Availability of elements to plants at different ph levels for mineral soils Figure 8.5 Availability of elements to plants at different ph levels for organic soils Figure 9.1 World fertilizer use, Figure 9.2 The phosphorus cycle in the plant soil system Figure 10.1 Movement of nutrient element ions in the soil by mass flow, root interception, and diffusion Figure 11.1 Sequence of soil analysis test procedure Figure 11.2 Hand tools for soil testing Figure 11.3 General guidelines for making fertilizer recommendations from a soil test for available nutrients Figure 12.1 Sequence of plant analysis procedure Figure 12.2 Relationship of nutrient element content and plant growth or yield Figure 12.3 Representations of terms used to classify nutrient status Figure 12.4 General relationship of plant growth or yield and elemental content Figure 12.5 Relationship between zinc content of blade 1 of grain sorghum and top dry weight...372
32 Part I Agronomic Crops
33
34 1 Production of Major Grain, Food, Oil, Fiber, and Sugar Crops 1.1 INTRODUCTION Gary Gardner, in Trends: From Surplus to Scarcity, a section of Worldwatch Paper (1996) stated, Human efforts to produce ever-greater amounts of food reached a historic pinnacle in After thousands of years of expansion, the amount of grainland under cultivation worldwide peaked, topping 732 million hectares. From the perspective of land use, the period after 1981 marks a new agricultural era, in which increasing demand for grain is met on a generally contracting base of land. Trends in grain production wheat, corn, and rice being the major grains are the results of complex interactions among the influencing factors of land and fertilizer use and climatic and economic conditions. 2 This section contains tables and figures relating to world and U.S. production of the major food and feed grain, oil, fiber, and sugar crops. FIGURE 1.1 World grain production, (Source: Vital Signs 2001, Worldwatch Institute, W.W. Norton, New York.) FIGURE 1.2 World grain production per person, (Source: Vital Signs 2001, Worldwatch Institute, W.W. Norton, New York.) 3
35 4 Agronomic Handbook: Management of Crops, Soils, and Their Fertility FIGURE 1.3 Wheat, corn, and rice production, (Source: Vital Signs 2001, Worldwatch Institute, W.W. Norton, New York.) FIGURE 1.4 Harvested grain area per person, , with projections to (Source: The Agricultural Link, Worldwatch Institute, Washington, D.C.)
36 Production of Major Grain, Food, Oil, Fiber, and Sugar Crops GRAIN YIELD POTENTIALS TABLE 1.1 Maximum Attainable Crop Yield Ranges for High and Intermediate Level Inputs in Tropical, Subtropical, and Temperate Environments under Irrigated Conditions a High Input Yields (tons per hectare) Intermediate Input Yields (tons per hectare) Crop Type Tropics Subtropics Temperate Tropics Subtropics Temperate Barley Hibernating n.a. b n.a Nonhibernating Corn Grain Silage n.a n.a Cotton All Peanut All Rice Wetland Dry land n.a. n.a n.a n.a. Sorghum All Soybean All Sugar Beet All n.a n.a Wheat Hiberating n.a n.a Nonhiberating a Figures represent yields attained during the cultivation phase of cultivation fallow cycles. In low and intermediate input agriculture, fallow and/or crop rotations are needed to maintain soil nutrient balance and break pest and disease cycles. The required intensity of fallow depends on crop rotations, soil characteristics such as nutrient availability and retention capacity, climatic conditions, and management and agricultural inputs. As a rule, for intermediate level input and management conditions, fallow requirements may vary from 10 to 30%. b n.a. = not applicable. Source: Food & Agriculture Organization of the United Nations, Rome, 2001.
37 6 Agronomic Handbook: Management of Crops, Soils, and Their Fertility 1.3 GRAIN CROP STATISTICS TABLE 1.2 Annual Changes (%) in World Grain Yields by Decade, (3-year average) Years Total Grain Rice Wheat Corn Other Grains Source: U.S. Department of Agriculture, unpublished data, TABLE 1.3 U.S. Total Grain Supply and Disappearance (million metric tons), a Supply Disappearance Year b Beginning Stocks Production Imports Total Domestic Use Exports Total Disappearance Ending Stocks c a Aggregate data on corn, sorghum, barley, oats, wheat, rye, and rice. b The marketing year for corn and sorghum begins September 1; for oats, barley, wheat, and rye, June 1; and for rice, August 1. c Preliminary totals may not add due to independent rounding. Source: Economics Research Service, Washington, D.C., With permission.
38 Production of Major Grain, Food, Oil, Fiber, and Sugar Crops 7 TABLE 1.4 U.S. Total and Per Capita Civilian Consumption of Wheat and Wheat Products, Calendar Year a Total Consumed (million bushels) b Per Capita Consumption of Flour (pounds) c Per Capita Consumption of Cereal (pounds) a Data shown for marketing year (calendar year for wheat). b Excludes quantities used in alcoholic beverages. c Includes white, whole wheat, and semolina flour. Source: Economics Research Service, Washington, D.C., With permission. All figures are estimates based on data from private industry sources, U.S. Department of Commerce, Internal Revenue Service, and other government agencies. TABLE 1.5 U.S. Total and Per Capita Civilian Consumption of Rye and Milled Rice, Calendar Year a Total Rye Consumed (million bushels) Per Capita Consumption of Rye Flour (million pounds) Total Milled Rice Consumed (cwt) Per Capita Consumption of Rice (pounds) a Does not include shipments to U.S. territories or rye used in alcoholic beverages; includes imports and rice used in processed foods and pet foods. Calendar year is marketing year for rye; marketing year for rice is August 1 to July 31. Source: Economics Research Service, Washington, D.C., With permission. All figures are estimates based on data from private industry sources, U.S. Department of Commerce, Internal Revenue Service, and other government agencies.
39 8 Agronomic Handbook: Management of Crops, Soils, and Their Fertility TABLE 1.6 U.S. Total and Per Capita Civilian Consumption of Corn and Corn Products, Calendar Year a Total Consumed (million bushels) b Flour and Meal (pounds) Per Capita Consumption of Hominy and Grits (pounds) Syrup (pounds) Sugar (pounds) Starch (pounds) c a Data shown for marketing year for corn: September 1 to August 31; marketing years for syrup and sugar are calendar years. b Includes an allowance for quantities used as hominy and grits; series not adjusted for trade. c Preliminary; estimates of corn syrup and sugar are unofficial; industry data not reported after April Source: Economics Research Service, Washington, D.C., With permission. All figures are estimates based on data from private industry sources, U.S. Department of Commerce, Internal Revenue Service, and other government agencies. TABLE 1.7 U.S. Total and Per Capita Civilian Consumption of Oats and Barley, Calendar Year a Total Oats Consumed (million bushels) b Per Capita Consumption of Oat Food Products (pounds) Total Barley Consumed (million bushels) c Per Capita Consumption of Barley Food Products (pounds) d a Calendar year for oats and barley is June 1 to May 3. b Oats used in oatmeal, prepared breakfast foods, infant foods, and food products. c Malt for breakfast and other food uses, pearl barley, and flour. d Malt equivalents of barley food products. Source: Economics Research Service, Washington, D.C., With permission. All figures are estimates based on data from private industry sources, U.S. Department of Commerce, Internal Revenue Service, and other government agencies.
40 Production of Major Grain, Food, Oil, Fiber, and Sugar Crops 9 TABLE 1.8 North American Verifiable Record Crop Yields Crop Yield Location Year Alfalfa 24.1 tons Arizona 1982 Barley, spring 190 bu/acre Alberta 1990 Canola, spring 70 bu/acre Alberta 1999 Corn bu/acre Iowa 1999 Cotton 5.4 bales/acre Arizona 1982 Soybean 118 bu/acre New Jersey 1983 Wheat, winter 205 bu/acre British Columbia 1988 TABLE 1.9 U.S. Average Crop Yields, 2000 Crop Corn Cotton Grain sorghum Peanuts Rice Soybean Sugar beet Wheat, winter Yield bu/acre lb/acre 60.9 bu/acre 2,499 lb/acre 6,278 lb/acre 36.1 bu/acre 23.6 tons/acre 41.9 bu/acre 1.4 WORLD OIL SEED PRODUCTION TABLE 1.10 World Oilseed Production, 1999 Crop Percent (%) Weight (million short tons) Soybeans Rape seeds Cotton seeds Peanuts Sunflower seeds Copra Palm Kernels 2 6.9
41 10 Agronomic Handbook: Management of Crops, Soils, and Their Fertility 1.5 FERTILIZER APPLICATION AND UTILIZATION TABLE 1.11 Field Crops: Percent of Acreage Receiving Fertilizer Applications, a Crop Nitrogen Phosphate Potash (N) (P 2 O 5 ) (K 2 O) 1995 Corn Cotton, upland Soybeans Wheat, winter Wheat, durum Wheat, other spring Corn Cotton, upland Soybeans Wheat, winter Wheat, durum Wheat, other spring Corn Cotton, upland Soybeans Wheat, winter Wheat, durum Wheat, other spring Corn Cotton, upland Soybeans Wheat, winter Wheat, durum Wheat, other spring Corn Cotton, upland Soybeans a Acres receiving one or more applications of specific fertilizer ingredient. Source: Economics and Demographics Branch, National Agricultural Statistics Service, Washington, D.C., All states surveyed.
42 Production of Major Grain, Food, Oil, Fiber, and Sugar Crops 11 TABLE 1.12 Nutrient Utilization (lb/acre) by Various Agronomic Crops Yield Nitrogen Phosphate Potash Magnesium Sulfur (N) (P 2 O 5 ) (K 2 O) (Mg) (S) Corn 100 bu/acre bu/acre bu/acre bu/acre Cotton 1000 lb/acre lb/acre Oats 100 bu/acre Grain Sorghum 8000 lb/acre Peanuts 4000 lb/acre Rice 7000 lb/acre Soybeans 40 bu/acre bu/acre Sugar Beets 30 tons/acre Wheat 40 bu/acre
43 12 Agronomic Handbook: Management of Crops, Soils, and Their Fertility TABLE 1.13 Uptakes of Major Elements and Micronutrients by Various Agronomic Crops Crop and Yield Nitrogen Phosphate Potash Calcium Magnesium Sulfur Boron Copper Iron Manganese Molybdenum Zinc (kg) (kg) (kg) (kg) (kg) (kg) (g) (g) (g) (g) (g) (g) Alfalfa (18 tons/acre) Corn (10 tons/acre) Cotton lint (1.7 tons/acre) Peanuts (4.5 tons/acre) Rice (7.8 tons/acre) Soybeans (4.0 tons/acre) Wheat (4.0 tons/acre) Source: International Soil Fertility Manual, Potash & Phosphate Institute, Norcross, GA, With permission.
44 Production of Major Grain, Food, Oil, Fiber, and Sugar Crops WEIGHTS AND MEASURES TABLE 1.14 Weights and Measures of Agronomic Commodities Commodity Unit Approximate Net Weight (lb) (kg) Alfalfa bu Barley bu Corn ear, husked bu Corn, shelled bu Corn meal bu Corn oil gal Cotton bale, gross Cotton bale, net Cottonseed bu Cottonseed oil gal Oats bu Peanut oil gal Peanut runners bu Peanuts, Spanish bu Peanuts, unshelled Virginia bu Rice, milled bag Rice, rough bag Rice, rough barrel Rice, rough bu Sorghum, grain bu Soybean oil gal Soybeans bu Wheat bu Source: U.S. Department of Agriculture, Agricultural Statistics, U.S. Government Printing Office, Washington, D.C.
45 14 Agronomic Handbook: Management of Crops, Soils, and Their Fertility TABLE 1.15 Weights of Full Bushels and Standard Yields of Grain Weight/bu (lb) Wheat, Beans, and Soybeans a Flax, Shelled Corn, Sorghum, and Rye a Barley a a Numbers in columns denote multiplication factors required to determine standard bushels. TABLE 1.16 Conversion Factors for Agronomic Crops Crop Unit Approximate Equivalent Corn, shelled 1 bu (56 lb) 2 bu (70 lb) husked ears Cotton 1 bu ginned 3.26 lb seed cotton including trash Peanuts 1 lb shelled 1.5 lb unshelled Rice, milled 100 lb 152 lb rough or unhulled grains Soybean meal 1 lb 1.27 lb soybeans Soybean oil 1 lb 5.49 lb soybeans Sugar 1 ton raw ton refined Wheat flour 100 lb 2.30 bu wheat
46 Production of Major Grain, Food, Oil, Fiber, and Sugar Crops 15 TABLE 1.17 Crop Seeds per Pound, Weights per Bushel, and Germination Times Crop No. seeds/lb (1,000) No. of seeds/g Weight/bu (lb) Germination Time (days) Alfalfa Barley Corn Cotton Oats Peanut Rice Sorghum Soybean Sugar beet Wheat NUTRIENT VALUES OF GRAIN AND OIL SEEDS TABLE 1.18 Comparison of the Nutritive Values of Selected Grain and Oilseed Crops Crop Calories /100 g Protein (%) Fat (%) Ca (mg/lb) P (mg/lb) K (mg/lb) Carbohdrates (%) Barley, pearled Corn, whole ground Rice, milled Rye, whole grain Sorghum, whole grain Peanut, whole seed Soybean, whole seed , Source: Handbook of the Nutritional Contents of Foods, 1975, Dover Publications, Inc., New York. With permission.
47 16 Agronomic Handbook: Management of Crops, Soils, and Their Fertility TABLE 1.19 Quality Components of Grains Component Sorghum Corn Barley Wheat Digestible energy (kcal/kg) 3,453 3,610 3,080 3,520 Protein (%) Lysine (%) Methionine + cystine (%) Tryptophan (%) Calcium (%) Phosphorus (%) Fiber (%) Ether extract (%) NITROGEN FIXATION OF LEGUME CROPS TABLE 1.20 Nitrogen Fixation Rates of Legume Crops Crop Nitrogen (kg/ha) Alfalfa 150 Sweet clover 120 Red clover 90 Soybean 60 REFERENCES 1. Gardner, G., 1996, Shrinking Fields: Cropland Loss in a World of Eight Billion, Worldwatch Paper 131, Worldwatch Institute, Washington, D.C. 2. Vital Signs 2001: The Trends that Are Shaping Our Future, Worldwatch Institute, Washington, D.C.
48 2 Grain Crops 2.1 BARLEY (Hordenum vulgare L.) INTRODUCTION Barley is one of the world s oldest crop plants. While its origins are unknown, humans may have consumed it as early as 15,000 B.C. It was farmed in China around 7,000 B.C., in Spain by 5,000 B.C., and in England by 3,000 B.C. It belongs to the same plant family (Poaceae or Gramineae) as corn, oats, rice, and wheat, and is grown primarily for malting grain and as livestock feed. Barley grows throughout the Temperate Zone. It thrives in cool northern climates and at high altitudes, and is planted in warmer climates as a winter crop. Barley is planted in rows 6 to 7 in. (15 to 18 cm) apart and seeds at a rate of 1 to 2 bu per acre (2.5 to 5 bu per ha). In the U.S., barley area seeded in 2001 totalled 5.09 million acres down 13% from the 5.84 million acres seeded in The yield averages about 60 bu per acre (149 bu per ha). The highest worldwide yields range from 108 to 116 bu per acre (267 to 287 bu per ha). Annual world production is about 7.75 billion bu; 1 bu weighs 48 lb (22 kg). In the U.S., 55% of produced barley grain is used as animal feed and high quality barley is made into malt for use in beer, liquor, malted milk, and flavorings. In 1990, the highest verifiable barley grain yield of 190 bu per acre was recorded in Alberta, Canada. In the U.S. in 2000, the average barley yield was 61.1 bu per acre PRODUCTION STATISTICS TABLE 2.1 U.S. Barley Area, Yield, and Production, Year Area Harvested (1,000 acres) Yield (bu/acre) Production (1,000 bu) , , , , , , , , , , , , , , , , , , a 5, ,865 a Preliminary. Source: Crops Branch, National Agricultural Statistics Service, Washington, D.C. 17
49 18 Agronomic Handbook: Management of Crops, Soils, and Their Fertility TABLE 2.2 Leading Barley-Growing Countries, Country 1,000 Metric Tons Germany 13,301 Canada 13,196 Russia 10,600 France 9,539 Spain 7,434 Turkey 6,600 United Kingdom 6,580 Ukraine 6,400 United States 6,103 Denmark 3,620 China 3,000 Kazakhstan 2,250 Source: Foreign Agriculture Service, Washington, D.C., TABLE 2.3 Leading Barley-Producing States, 2000 State Area Harvested Yield/Harvested Acres Production (1,000 bu) North Dakota 1, ,350 Montana ,000 Idaho ,480 Washington ,300 Minnesota ,360 U.S. Total 5, ,865 Source: Crops Branch, National Agricultural Statistics Service, Washington, D.C., 2001.
50 Grain Crops 19 TABLE 2.4 U.S. Total and Per Capita Civilian Consumption of Barley and Barley Products as Food, Calendar Year a Total Consumed (million bu) b Per Capita Consumption of Food Products (lb) c d a Data for marketing year, June 1 to May 3. b Malt for breakfast and other food uses, pearl barley, and flour. c Malt equivalent of barley food products. d Preliminary. Source: Economics Research Service, Washington, D.C., With permission. All figures are estimates based on data from private industry sources, the U.S. Department of Commerce, the Internal Revenue Service, and other government agencies BARLEY GRAIN COMPOSITION TABLE 2.5 Quality Components of Barley Grain Component Value Digestable energy (kcal/kg) 3,080 Protein (%) 11.6 Lysine (%) 0.53 Methionine + cystine (%) 0.36 Tryptophan (%) 0.18 Calcium (%) 0.08 Phosphorus (%) 0.42 Fiber (%) 5.0 Ether extract (%) 1.9 Source: Principles of Field Crop Production, 3rd ed., 1976, Macmillan, New York. With permission.
51 20 Agronomic Handbook: Management of Crops, Soils, and Their Fertility TABLE 2.6 Nutritive Values of Pearled Barley Grain Component Value Calories/100 g 349 Protein, % 8.2 Fat, % 1.0 Total calcium, mg/lb 16 Total phosphorus, mg/lb 189 Total potassium, mg/lb 160 Carbohydrates, % PLANT ANALYSIS INTERPRETATION TABLE 2.7 Nutrient Element Sufficiency Ranges a Nutrient Element Sufficiency Range Nitrogen % Phosphorus % Potassium % Calcium % Magnesium % Sulfur % Copper 5 25 ppm Manganese ppm Molybdenum ppm Zinc ppm a Twenty-five whole plants measured from emergence of head to boot. Source: Plant Analysis II: A Practical Sampling, Preparation, Analysis, and Interpretation Guide, 1996, MicroMacro Publishing, Athens, GA. With permission BARLEY GRADING AND GLOSSARY Terms Used by the U.S. Department of Agriculture Federal Grain Inspection Service (USDA-FGIS) to Grade Barley Definition of Barley Grain that, before the removal of dockage, consists of 50% or more of whole kernels of cultivated barley (Hordeum vulgare L.) and not more than 25% of other grains for which standards have been established under the U.S. Grain Standards Act. The term barley as used in the standards does not include hull-less barley or black barley. The term barley also covers kernels that do not meet the requirements for six-row and two-row barley cited below.
52 Grain Crops Black Barley Barley with black hulls Broken Kernels Barley with more than one-fourth of the kernels removed Classes of Barley The three classes are six-row barley, two-row barley, and barley Six-Row Barley Six-row barley has white hulls and contains not more than 10% of two-row barley. Six-row barley is divided into three subclasses: Six-row malting barley Six-row barley of a suitable malting type that has 90% or more kernels with white aleurone layers; contains not more than 1.9% injured-by-frost kernels that may include not more than 0.4% frost-damaged kernels; is not more than 0.2% injured-by-heat kernels that may include not more than 0.1% heat-damaged kernels; is not blighted, ergoty, garlicky, infested, or smutty; and otherwise meets the grade requirements of the six-row mating barley subclass; may contain unlimited amounts of injured-by-mold kernels. Mold-damaged kernels are scored as damaged kernels and against sound barley limits. Six-row blue malting barley Six-row barley of a suitable malting type that has 90% or more kernels with blue aleurone layers; contains not more than 1.9% injured-by-frost kernels that may include not more than 0.4% frost-damaged kernels; is not more than 0.2% injured-by-heat kernels that may include not more than 0.1% heat-damaged kernels; is not blighted, ergoty, garlicky, infested, or smutty; and otherwise meets the grade requirements of the six-row blue malting barley subclass; may contain unlimited amounts of injured-by-mold kernels. Mold-damaged kernels are scored as damaged kernels and against sound barley limits. Six-row barley Any barley of the class six-row type that does not meet the requirements of the six-row malting or six-row blue malting barley subclasses Two-Row Barley Barley of the two-row type has white hulls and contains not more than 10% of six-row barley. This class is divided into two subclasses: Two-row malting barley Two-row barley of a suitable malting type that contains not more than 1.9% injured-by-frost kernels that may include not more than 0.4% frost-damaged kernels; is not more than 1.9% injured-by-mold kernels that may include not more than 0.4% mold-damaged kernels; is not more than 0.2% injured-by-heat kernels that may include not more than 0.1% heatdamaged kernels; is not blighted, ergoty, garlicky, infested, or smutty; and otherwise meets the grade requirements of the two-row malting barley subclass. Injured-by-frost kernels and injuredby-mold kernels are not scored against sound barley Two-row barley Two-row barley that does not meet the requirements of the two-row malting barley subclass Damaged Kernels Kernels, pieces of kernels, other grains, and wild oats that are badly ground-damaged, badly weather-damaged, diseased, frost-damaged, germ-damaged, heat-damaged, heat-injured, insectbored, mold-damaged, sprout-damaged, or otherwise materially damaged Dockage All matter other than barley that can be removed from the original sample by use of an approved device according to FGIS instructions. Also, under-developed, shriveled, and small pieces of barley kernels removed in properly separating the material other than barley and that cannot be recovered by properly rescreening or recleaning.
53 22 Agronomic Handbook: Management of Crops, Soils, and Their Fertility Foreign Material All matter other than barley, other grains, and wild oats that remains in a sample after removal of dockage Frost-Damaged Kernels Barley kernels, pieces of kernels, other grains, and wild oats that are badly shrunken and distinctly discolored black or brown by frost Germ-Damaged Kernels Barley kernels, pieces of kernels, other grains, and wild oats that have dead or discolored germ ends Heat-Damaged Kernels Barley kernels, pieces of kernels, other grains, and wild oats that are materially discolored and damaged by heat Injured-by-Frost Kernels Barley kernels and pieces that are distinctly indented, immature, or shrunken in appearance or are light green in color as a result of frost before maturity Injured-by-Heat Kernels Barley kernels, pieces of kernels, other grains, and wild oats that are slightly discolored as a result of heat Injured-by-Mold Kernels Barley kernels and pieces containing slight evidence of mold Mold-Damaged Kernels Barley kernels, pieces of kernels, other grains, and wild oats that are weathered and contain considerable evidence of mold Other Grains Black barley, corn, cultivated buckwheat, einkorn, emmer, flaxseed, guar, hull-less barley, nongrain sorghum, oats, Polish wheat, popcorn, poulard wheat, rice, rye, safflower, sorghum, soybeans, spelt, sunflower seed, sweet corn, triticale, and wheat Plump Barley Barley that remains on top of a 6/64 3/4 slotted-hole sieve after sieving according to FGIS instructions Sieves 1. 4/64 by 3/4 slotted-hole sieve. A metal sieve in. thick with slotted perforations (5/64) in. by (3/4) in /64 by 3/4 slotted-hole sieve. A metal sieve in. thick with slotted perforations (5.5/64) in. by (3/4) in. 3. 6/64 by 3/4 slotted-hole sieve. A metal sieve in. thick with slotted perforations (6/64) in. by (3/4) in Skinned and Broken Kernels Barley kernels that have one-third or more of their hulls removed, or with the hull loose or missing over the germ, or broken kernels, or whole kernels that have a part or all of the germ missing Sound Barley Barley kernels and pieces that are not damaged, as defined under
54 Grain Crops Stained Barley Barley that is badly stained or materially weathered Suitable Malting Barley Varieties of malting barley that are recommended by the American Malting Barley Association as suitable for malting purposes. The recommended varieties are listed in FGIS instructions Thin Barley Six-row barley that passes through a 5/64 by 3/4 slotted-hole sieve and two-row barley that passes through a 5.5/64 by 3/4 slotted-hole sieve after sieving according to FGIS instructions Wild Oats Seeds of Avena fatua L. and Avena sterilis L All Other Determinations Each determination of heat-damaged kernels, heat-injured kernels, and white or blue aleurone layers in six-row barley is made on pearled, dockage-free barley. Other determinations not specifically provided for under the general provisions are made on the basis of the grain when free from dockage, except that determination of odor is made on the basis of either the grain as a whole or the grain free from dockage Special Grades and Special Grade Requirements 1. Blighted barley that contains more than 4% fungus-damaged and/or mold-damaged kernels. 2. Ergoty barley that contains more than 0.10% ergot. 3. Garlicky barley that contains three or more green garlic bulblets, or an equivalent quantity of dry or partly dry bulblets per 500 g barley. 4. Smutty barley that has kernels covered with smut spores to give a smutty appearance or contains more than 0.20% smut balls Barley Glossary 1 Acrospire Shoot formed in the germination process that grows to about the length of the kernel. The part that extends from under the hull is broken off and along with the rootlet becomes a feed by-product. Aleurone The barley kernel is composed of the lemma and palea, a short portion of the rachilla, and the caryopsis. The seed coat of the caryopsis contains a few layers of important nitrogen-rich cells comprising the aleurone layer. These cells, when properly activated, secrete hydrolytic enzymes into the endosperm that disintegrate the structures of the starch-containing storage materials and accomplish what is called modification. Country elevator A facility located in a production area that serves as a primary outlet for offfarm sales. Country elevators unofficially determine grain grades and weights. They generally take title to the grain they handle, and may handle grain previously contracted to another buyer. Dense barley Barley with short rachis internodes that give the inflorescence a dense or compact appearance. Enzyme potential Barley, when malted, produces two known starch-splitting enzymes designated alpha amylase and beta amylase. The combination of the two enzymes results in more rapid and complete hydrolysis of starch to dextrin and fermentable sugars. Only barley, wheat, and rye contain both alpha and beta enzymes. The potential for transforming starch to fermentable sugars is not the same for all varieties so malt varieties are carefully selected.
55 24 Agronomic Handbook: Management of Crops, Soils, and Their Fertility Facultative winter barley Winter barley requires little cold temperature for vemalization and may reproduce when spring-planted, unlike the obligate winter type that requires longer periods of cold temperatures to initiate flowering. High grading Process that separates low- and high-quality products. Poorer quality barley kernels unsuitable for malting are separated and sold to feed manufacturers, leaving a higher quality malting product. Hooded barley The inflorescence has a modified lemma awn that resembles a heal over the floret. Hoods may have both male and female organs and in rare instances produce viable seeds. Hull-less barley The hulls of this barley trash free of the caryopsis during harvest. Most U.S. barley cultivars are not hull-less. Inland terminal elevator A facility located at a point of accumulation and distribution in the movement of grain. An inland terminal elevator procures a large share of its grain from other elevators rather than directly from farmers. These elevators have facilities for establishing official grades and weights and may store grain for others. Kilning Drying malted barley with hot, dry air in a kiln or oven. Lax barley Barley with long rachis internodes that give the inflorescence an open lax appearance. Malt Final product after kilning. It is cleaned to remove the dried rootlets and given a degree of polishing; it may be called final malt. Casual observation indicates that the final product varies little in appearance from the original barley, but close inspection reveals that the kernels are somewhat larger, the dried acrospires noticeably budge under the husks, and husks do not adhere as tightly to the main bodies of the kernels. Malt sprouts Rootlets separated from malt before kilning. Malt sprouts average about 27% protein, 2.5% fat, and 12% fiber. They are commonly used in dairy feeds. Midwestern six-row Manchurian Relatively small kerneled barleys with medium-high protein content that germinate vigorously and produce high enzymatic activities during malting; used to produce brewers and distillers malts. Modification The limited breakdown of the starch endosperms of barley by enzymes during the germination phase of malting. Modified starch is readily converted to dextrin and fermentable sugars when ground and mixed with water to 60 to 70 F. Naked barley Hull-less barley. No-row barley The axis of the barley head has nodes along its length. Spikelets at these nodes alternate from side to side. For two-row barley, only the central kernel develops (both laterals are sterile; cf. six-row barley. Pearled barley Barley product remaining after the hull, the kernel coating most of the embryo, and part of the outer layers of the starchy endosperm are removed by a grinding process lb high grade yields approximately 35 lb pearled barley. Pipeline stocks The grains or grain products that are not in storage awaiting a buyer or in inventory as stored grain. They may be in transit or may be held in working space. Port terminal elevator An elevator located along a waterway and designed to load vessels with grain and other products. A port terminal elevator receives most of its grain from subterminal elevators or inland terminals. Port terminals have facilities for establishing official grades and weights. Rachilla An inconspicuous pedicel or branch attached to the rachis and to which the florets are attached. Six-row barley The axis of the barley head has nodes along its length. Spikelets at these nodes alternate from side to side. For six-row barley, three kernels develop at each node (one central kernel and two lateral kernels). Spent grain Hulls and other solids remaining in the brewers mash tub. Spent grains are dried and sold as feed by-products. Terminal market A large concentration of wholesale grain handlers, commission merchants, and grain brokers that may be complemented by a grain exchange or board of trade that
56 Grain Crops 25 houses an association organized for the purpose of providing a place where buyers and sellers may conduct trading in both the cash and futures markets. True winter type Barley requiring a prolonged period of cold for vernalization; usually will not flower when spring-planted. Vernalization The stimulation of reproductive growth of a plant by passing it through a period of temperatures below 50 F. A true winter barley, for example, will not mature if planted in the spring and exposed to temperatures above 50 F. Duration of vernalization is cultivar- and temperature-dependent. Western six-row Brewing barley grown primarily in California. Large, hulled kernels, medium protein content, rather slow physical and chemical modification potential, and low enzymatic activities after malting are the characteristics of this type. It is used for brewing on the West Coast and in Rocky Mountain areas and for blending with midwestern brewing malts. Western two-row Grown primarily in the Northwest and intermountain areas of the U.S., this type has medium-sized, uniform, plump kernels with thin hulls. The type is generally low in protein and high in starch and exerts vigorous germination and intermediate enzymatic activity during mating; used by the brewing industry alone and blended with midwestern six-row barley WEIGHTS AND MEASURES The net weight of one bushel of barley grain is approximately 48 lb or 21.8 kg. TABLE 2.8 Barley Seeds/Pound, Weight/Bushel, and Germination Time Seeds (1,000/lb) No. Seeds/g Weight (lb/bu) Germination Time (days) TABLE 2.9 Weight and Standard Yield of Full (Level) Bushel of Barley Grain Weight of 1 bu (measured) Multiplication factor to yield standard bushels (lb) REFERENCES 1. Smith, C.W., Crop Production: Evolution, History, and Technology, 1995, John Wiley & Sons, New York.
57 26 Agronomic Handbook: Management of Crops, Soils, and Their Fertility 2.2 CORN (Zea mays L.) INTRODUCTION Corn (known as mais in France, Germany, and Italy and maiz in Spain) belongs to the Poaceae or Gramineae grass family. It is a cereal grass grown in more countries than any other crop and is the most important crop grown. It has a wide variety of food uses and ranks second (after wheat) in world grain production. The kernels can be eaten directly and used as components of many food products. Kernels and plants are used as livestock feed. Yellow dent is used primarily as livestock feed; white dent is used for human consumption as meal and cereals. Corn is also used in the manufacture of nonfood products including ceramics, drugs, paints, paper goods, and textiles. In developing countries in Latin America, Africa, and Asia, corn forms a major part of human diets. Corn kernels are rich in starch carbohydrates. They contain small quantities of fats and proteins but lack some important amino acids. Therefore, diets based primarily on corn-based foods can lead to protein malnutrition if other sources of protein are not added to diets. Corn has been used as a food for over 10,000 years. Indians first gathered it from wild plants in Mexico. They learned how to grown corn around 5000 B.C. By the late 1500s, corn was a well established crop in Africa, Asia, southern Europe, and the Middle East. It was the basic food in the American Colonies in the 1600s and 1700s. Corn can be grown in most mild and tropical regions (30 to 55 latitude) mainly in latitudes below 47. A warm weather crop, corn grows best when air temperatures range from 21 to 27 C and the optimum mean air temperature is below 19 C. Evapotranspiration ranges from 0.20 to 0.25 cm per day for young plants and up to 0.48 cm per day during the reproduction stage. Corn produces best when rotated with other crops, particularly legumes that can add N to the soil for the next corn crop and reduce the potential for pests and diseases. Corn can be bred and selected to fit growing seasons with maturities ranging from 60 days to over 40 weeks. Plant densities vary from 15,000 to 25,000 plants per ha, with higher densities up to 75,000 plants per ha in humid or irrigated areas when optimum production is required. Spacing between rows ranges from 50 to 100 cm. The best plant growth occurs on soils with ph levels from 6.0 to 7.0 and moderate to high fertility. Over half of the N and P and 80% of the K for best growth is required before the reproductive stage. The N requirement for corn planted after a legume crop varies from 45 to 100 kg per ha and, for corn planted after a nonleguminous crop, 145 to 170 kg per ha in the Corn Belt. Under irrigation, a 50 to 70% portion of the N is preplanted and the remainder is applied in 20 to 25 kg per ha increments through irrigation systems. Fertilizer N rates are frequently adjusted based on yield goal and expected climatic conditions. For P and K, fertilizer rates should be based on soil test recommendations. Based on surveys, PK fertilizer rates range from 54 to 84 kg P 2 O 5 per ha and from 56 to 84 kg K 2 O per ha. For some soils, B and Zn are included in fertilizer recommendations. In 1999, the highest verifiable corn grain yield of bu per acre was recorded in Iowa. In the U.S. 2000, the average corn grain yield was bu per acre KINDS OF CORN Dent Corn Dent corn forms when the soft floury starch in the kernels dries and shrinks. Most kernels are yellow or white. Dent corn is most widely grown in North America and is used chiefly for livestock feed and in manufacturing processed foods and industrial products.
58 Grain Crops Flint Corn Flint corn has hard round kernels with smooth coats. Its color ranges from white to red. It grows well in cool climates and reaches maturity early. It is used for food and livestock feed and grown widely in Asia, Europe, and Central and South America Flour Corn Flour corn kernels are white, blue, or variegated. Flour corn is the oldest type; it was grown in central Mexico and western South America more than 5,000 years ago. It is grown primarily for food Pod Corn Pod corn is the most primitive and possibly oldest form of corn. Each kernel is enclosed in a pod or husk and the entire ear is surrounded by husk. Pod corn has no commercial value; it is used in scientific research Popcorn Popcorn is one of the oldest varieties. The two types are pearl popcorn (kernels are rounded and usually yellow or orange) and rice popcorn (kernels are pointed and white). The kernels have hard endosperms with small amounts of white starch in their centers. Steam is created inside the kernels when they are heated. This causes them to explode, turn inside out, and become light, fluffy masses Sweet Corn Sweet corn kernels are soft and may be white or yellow. The kernels are the sweetest and may be eaten directly from cooked cobs or removed from the cobs Waxy Corn The endosperm of a waxy kernel has a wax-like appearance. The corn consists mostly of starch (amylopectin). This quality makes it useful as a thickener in instant pudding mixes, gravies, and sauces, and glues CORN GLOSSARY Aflatoxin Any of a number of mycotoxins produced by the Aspergillus flavus fungus. Amylase Enzyme that accelerates the hydrolysis of starch. Amylopectin Heavy molecular weight component of starch that has a branched structure of glucose subunits. Amylopectin and amylose are the components of corn starch. Amylose Component of starch; has straight chains of glucose subunits. Blending Mixing two or more grain lots to establish an overall quality that may or may not be different from any single lot. Country elevator Grain elevator that serves as the first collection point in the marketing of corn. Grain elevators accept, dry, and store corn from producers. It is then delivered to terminal elevators. Cultivar (cultivated variety) International term denoting certain cultivated plants that are clearly distinguishable from others by one or more characteristics. A cultivar will retain those characteristics when reproduced. Dockage Materials such as stems, weeds, dirt, and stones that are removed readily by ordinary grain cleaning equipment; also called foreign material. Double-cross hybrid Hybrid developed by crossing the F1s of two single cross-hybrids.
59 28 Agronomic Handbook: Management of Crops, Soils, and Their Fertility Dry milling Process of cleaning, conditioning, grinding, and sifting that separates corn into its germ, bran, and endosperm components. Embryo Undeveloped plant within a seed. Endosperm Dead but nutritive tissue in seeds found in the inner bulk of kernel consisting primarily of carhohydrates, but also containing protein, riboflavin, and B vitamins. The endosperm provides nutrients to the seedling plant during germination-emergence and early seedling growth. Enzyme Group of catalytic proteins produced by living cells that mediate the chemical processes of life without being destroyed or altered. Federal Grain Inspection Service (FGIS) U.S. Department of Agriculture branch responsible for setting grain standards and developing the technology to measure factors affecting grain quality; also develops sampling and inspection procedures, evaluates and approves equipment monitor inspection accuracy, and oversees mandatory export inspection of grain. Feed grain Grain characterized as high-energy because of high levels of carbohydrates and low levels of crude fiber. Germ See embryo. Genotype Hereditary makeup of an individual plant or animal. Germplasm Genotype of crop species or related species used or of potential use in developing cultivars; also called race stocks, breeding lines, inbred lines, or germplasm lines. Grain Seed or fruit of various food or feed plants including cereal grains (wheat, corn, barley, oats, and rye) and other plants in commercial and statutory use, such as soybeans. Hybrid Cultivar resulting from crossing two genetically unlike inbred lines of corn. Inbred line Parent in the development of a hybrid cultivar developed by repeated generations of self-pollination. Intrinsic quality Characteristic important to the end use of grain. A characteristic is nonvisual and can only be determined by analytical tests to determine, for example, protein, ash, oil content, or starch. Millfeed Material remaining after all food-grade flour and other components have been extracted from grain used in animal feed and feed supplements. Modified single-cross Scheme of hybrid production where the female parent is the F1 from the cross of two genetically similar parents. The F1 is crossed with a genetically dissimilar pollen parent to produce hybrid seed sold to the farmer. Open pollinated Seed produced on plants or to cultivars maintained with no control over which individual plants pollinate other plants within the seed increase blocks. Pericarp Seed covering derived from the ovary wall. Phenotype Plant as seen; the outward expression of the genotype of a plant within the limits of its environment. Protein Complex organic compound composed of nitrogen (N), carbon (C), hydrogen (H), and oxygen (O) essential to the functionings and structures of all organic cells. Shrinkage Loss of grain weight due to the removal of water. Single-cross Production of hybrid cultivars by crossing two genetically dissimilar inbred lines of corn. Starch Primary fraction of corn endosperm composed of straight and branched chains of glucose molecules. Starch is an important component of animal diets. It reacts with enzymes to form dextrose, maltose, and other sugars required for energy and growth. Steepwater Water used to soak corn during wet milling. Tempering Addition of water to corn and wheat during dry milling to aid in removing bran from the endosperm.
60 Grain Crops 29 Terminal elevator Elevator that takes delivery of corn from country elevators; usually owned by or will sell to a manufacturer of corn products; may sell corn to the export trade or to other terminal elevators. Three-way cross Hybrid production scheme by which the F1 of two genetically dissimilar inbred lines of corn are crossed with a genetically dissimilar inbred to produce hybrid corn seed. Variety See cultivar. Wet milling Process of using water in which corn is tempered, steeped, and milled to separate the grain into its germ, hull, gluten, and starch components. Oil is extracted from the germ; the hulls are dried and may be added to gluten to produce corn gluten feed; gluten may be purified and used in several industrial products; and the starch is converted into corn syrups and corn sugars. TABLE 2.10 Growth Stages of Corn, Cumulative Growing Degree Days, and Calendar Days Required to Reach Successive Stages State No. Stage Stage Description Growing Degree Days a Calendar Days 0.0 Emergence Tips of leaves emerged from the coleoptile Two-leaf Two leaves fully emerged with collars visible Four-leaf Four leaves fully emerged 1.5 Six-leaf Six leaves fully emerged; tassel initiation Eight-leaf Eight leaves fully emerged; tassel developing rapidly 2.5 Ten-leaf Ten leaves fully emerged; tassel developing rapidly; ear shoots developing at 6 to 8 nodes 3.0 Twelve-leaf Twelve leaves fully emerged; ears developing rapidly; number of ovules determined 3.5 Fourteen-ear Fourteen leaves fully emerged; tassel near full size; 1 1, to 2 ears developing rapidly; silks developing 4.0. Sixteen-leaf Sixteen leaves fully emerged; ears and silks developing 1, rapidly; tassel emerges 5.0 Silking Leaves and tassel fully emerged; elongation of stem 1, ceases; cob and silks growing rapidly; silks continue to grow until fertilized 6.0 Blister Cob and husks fully developed; starch begins to 8 accumulate in kernels 7.0 Dough Kernels growing rapidly; consistency like bread dough 1, Beginning dent A few kernels showing dents 9.0 Dent Kernels fully dented; dry matter accumulation almost complete 2, Physiological maturity Dry matter accumulation is complete; grain moisture is 35% 2, a Growing degree days based on a minimum temperature of 50 F and a maximum of 86 F; may be referred to as DD 50 units. Source: Adapted from Illinois Agronomy Handbook, , University of Illinois, Urbana, IL.
61 30 Agronomic Handbook: Management of Crops, Soils, and Their Fertility COMPOSITION OF WHOLE-GRAIN FIELD CORN Component % Carbohydrate 72.2 Water 13.8 Protein 8.9 Fat 3.9 Ash 1.2 Component Value Digestible energy 3,610 kcal/kg Protein 10.0% Lysine 0.13% Methionine + cystine 0.18% Tryptophan 0.09% Calcium 0.01% Phosphorus 0.31% Fiber 2.0% Ether extract 3.9% Component % Water 13.5 Protein 10.0 Oil 4.0 Starch 61.0 Sugars 1.4 Pentosans 6.0 Crude fiber 2.3 Ash 1.4 Potassium 0.40 Phosphorus 0.43 Magnesium 0.16 Sulfur 0.14 Other minerals 0.27 Other substances (organic acids, etc.) 0.4 Total The germ contains about 35% oil, 20% protein, and 10% ash Composition of Whole Grain, Ground Component Value Calories/100 g 355 Protein (%) 9.2 Fat (%) 3.9 Total calcium (mg/lb) 20 Total phosphorus (mg/lb) 256 Total potassium (mg/lb) 284 Carbohydrates (%) ETHANOL PRODUCTION In the U.S., nearly 500 million bu corn (about 7% of the crop) goes into ethanol production annually, adding about $3 billion annually to farm income. One bushel of corn will produce 2.5 gal ethanol.
62 Grain Crops 31 In 2001, the ethanol industry s capacity exceeded 2 billion gal annually. The industry added 1 billion gal capacity in 2 years CORN PRODUCTION STATISTICS TABLE 2.11 U.S. Corn Acreage, Grain Yield, and Production, Year Planted Acres (millions) Harvested Acres (millions) Grain Production (million bu) Grain Yield (bu/acre) ,900 72,400 2, ,275 71,191 2, ,230 71,353 2, ,574 70,738 2, ,185 68,668 2, ,932 68,462 2, ,828 64,877 3, ,180 63,065 3, ,351 63,549 3, ,742 72,091 3, ,425 71,422 3, ,919 57,634 3, ,017 55,726 3, ,771 59,227 4, ,823 55,367 3, ,171 55,392 4, ,347 57,002 4, ,156 60,694 4, ,126 55,980 4, ,264 54,574 4, ,863 57,358 4, ,179 64,123 5, ,513 57,513 5, ,253 62,143 5, ,935 65,405 4, ,719 67,625 5, ,588 71,506 6, ,328 71,614 6, ,675 71,930 7, ,394 72,400 7, ,043 72,961 6, ,097 74,524 8, ,857 72,719 8, ,207 51,479 4, ,517 71,897 7, ,398 75,209 8, ,580 68,907 8, ,200 59,505 7, ,717 58,250 4, ,322 64,783 7, ,166 66,952 7, ,957 68,822 7, continued
63 32 Agronomic Handbook: Management of Crops, Soils, and Their Fertility TABLE 2.11 (CONTINUED) U.S. Corn Acreage, Grain Yield, and Production, Year Planted Acres (millions) Harvested Acres (millions) Grain Production (million bu) Grain Yield (bu/acre) ,311 72,077 9, ,239 62,933 6, ,921 72,514 10, ,479 65,210 7, ,229 72,644 9, ,537 72,671 9, ,187 72,604 9, ,386 70,487 9, ,545 72,732 9, Source: Department of Agricultural Economics, Kansas State University, Manhattan. With permission. TABLE 2.12 U.S. Acreage, Yield, Production, and Value for Corn Grain and Silage, Year Area Planted (1,000 acres) Area Harvested (1,000 acres) Yield/Harvested Acre a Production b Marketing Year Average Price/bu ($) Corn Grain ,957 66, ,474, ,311 72, ,476, ,239 62, ,337, ,921 72, ,050, ,479 55, ,400, ,229 72, ,232, ,537 72, ,206, ,165 72, ,756, ,366 70, ,430, c 74,545 72, ,968, Corn for Silage , , , , , , , , , , , , , , , , , c 5, ,536 a Yield/harvested acre shown in bushels for corn grain and tons for corn for silage. b Production shown in 1,000 bu for corn grain and 1,000 tons for corn for silage. c Preliminary. Source: National Agricultural Statistics Service, Crops Branch, Washington, D.C., 2001.
64 Grain Crops 33 TABLE 2.13 Corn Planted in the U.S. (1,000 acres), State Alabama Arizona Arkansas California Colorado Connecticut Delaware Florida Georgia Idaho Illinois 10,600 10,600 11,200 Indiana 5,800 5,600 5,700 Iowa 12,500 12,100 12,300 Kansas 3,000 3,150 3,450 Kentucky 1,300 1,320 1,330 Louisiana Maine Maryland Massachusetts Michigan 2,300 2,200 2,200 Minnesota 7,300 7,100 7,100 Mississippi Missouri 2,650 2,650 2,650 Montana Nebraska 8,800 8,600 8,500 Nevada 4 New Hampshire New Jersey New Mexico New York 1,130 1, North Carolina North Dakota ,060 Ohio 3,550 3,450 3,550 Oklahoma Oregon Pennsylvania 1,550 1,500 1,550 Rhode Island South Carolina South Dakota 3,900 3,600 4,300 Tennessee Texas 2,400 1,950 2,100 Utah Vermont Virginia Washington West Virginia Wisconsin 3,700 3,600 3,500 Wyoming U.S. Total 80,165 77,366 79,545 Source: Crops Branch, National Agricultural Statistics Service, Washington, D.C., 2001.
65 34 Agronomic Handbook: Management of Crops, Soils, and Their Fertility TABLE 2.14 U.S. Corn Yield and Production, State Area Harvested (1,000 acres) Yield/Harvested Acre (bu) Production (1,000 bu) a a a Alabama ,600 20,600 10,725 Arizona ,250 5,650 6,466 Arkansas ,500 13,000 22,750 California ,200 31,450 39,950 Colorado 1,070 1,120 1, , , ,660 Delaware ,500 13,706 25,272 Florida ,410 3,720 2,100 Georgia ,525 30,900 32,100 Idaho ,600 8,525 9,120 Illinois 10,450 10,650 11, ,473,450 1, ,666,550 Indiana 5,550 5,670 5, , , ,650 Iowa 12,200 11,600 12, ,769,000 1,756,200 1,740,000 Kansas 2,650 2,960 3, , , ,000 Kentucky 1,160 1,160 1, , , ,900 Louisiana ,740 39,930 42,920 Maryland ,600 33,480 62,775 Michigan 2,050 1,950 1, , , ,280 Minnesota 6,750 6,600 6, ,032, , ,000
66 Grain Crops 35 Mississippi ,000 36,270 36,500 Missouri 2,500 2,550 2, , , ,110 Montana ,070 1,960 2,520 Nebraska 6,550 6,300 6, ,239,750 1,153,700 1,014,300 New Jersey ,106 2,220 10,050 New Mexico ,025 14,940 11,660 New York ,120 59,590 47,040 North Carolina ,900 51,200 75,400 North Dakota ,275 76, ,160 Ohio 3,340 3,200 3, , , ,100 Oklahoma ,600 40,600 37,600 Oregon ,270 5,250 5,220 Pennsylvania 1, , ,550 61, ,160 South Carolina ,000 19,250 18,200 South Dakota 3,550 3,250 3, , , ,200 Tennessee ,520 56,140 67,260 Texas 1,650 1,770 1, , , ,600 Utah ,364 2,660 3,024 Virginia ,200 21,840 48,180 Washington ,000 16,000 18,500 West Virginia ,720 1,300 4,550 Wisconsin 2,950 2,850 2, , , ,000 Wyoming ,620 6,136 6,164 U.S. Total 72,569 70,467 72, ,756,665 9,430,612 9,968,356 a Preliminary Source: Crops Branch, National Agricultural Statistics Service, Washington, D.C., 2001.
67 36 Agronomic Handbook: Management of Crops, Soils, and Their Fertility TABLE 2.15 U.S. Total and Per Capita Civilian Consumption of Corn and Corn Products as Food, Calendar year a Total Consumed (million bu) b Flour and Meal (lb) Per Capita Consumption of Food Products Hominy and Grits (lb) Syrup (lb) Sugar (lb) Starch (lb) c a Data shown for marketing year, September 1 to August 31. b Includes allowance for quantities used as hominy and grits. c Preliminary. Source: Economics Research Service, Washington, D.C., With permission. All figures are estimates based on data from private industry sources, the U.S. Department of Commerce, the Internal Revenue Service, and other government agencies. TABLE 2.16 World Corn Production by Country shown as Percent of Total, 2000 Country % India 2 Argentina 3 Brazil 6 European Union 7 China 10 U.S. 43 Others 18 Source: Foreign Agriculture Service, Washington, D.C., TABLE 2.17 World Corn Consumption by Country, 2000 Country Million Bu Romania Canada Egypt India Japan Mexico Brazil 1,393.6 European Union 1,606.5 China 4,724.1 U.S. 7,739.9 Others 5,300.8 Total 23,796.3 Source: Foreign Agriculture Service, Washington, D.C., 2001.
68 Grain Crops 37 TABLE 2.18 World Corn Exports by Country Shown as Percent of Total, 2000 TABLE 2.19 Annual Percent Change in World Corn Yields, (3-year average) Country % Year % Change Ukraine 1 South Africa 2 China 6 Argentina 14 U.S. 75 Others 2 Source: Foreign Agriculture Service, Washington, D.C., Source: Foreign Agriculture Service, Washington, D.C., unpublished printout, 1996; updated TABLE 2.20 U.S. Corn Acreage, Yield, and Production for Grain and Silage, Corn for Grain Corn for Silage Year Area Harvested (1,000 acres) Yield (bu/acre) Production (1,000 tons) Area Harvested (1,000 acres) Yield (bu/acre) Production (1,000 tons) a , , , , , ,476,698 6, , , ,337,730 6, , , ,050,520 5, , , ,400,051 5, , , ,232,557 5, , , ,206,632 6, , , ,756,685 5, , , ,430,612 6, , a 72, ,968,358 5, ,538 Preliminary. Source: Crops Branch, National Agricultural Statistics Service, Washington, D.C., 2001.
69 38 Agronomic Handbook: Management of Crops, Soils, and Their Fertility TABLE 2.21 Corn Grain Acreage, Yield, and Production by Continent and Country, Location Area Harvested (10,000 ha) Grain Yield (metric tons/ha) Production (1,000 metric tons) Continent North America 37, ,645 Central America 1, ,775 South America 18, ,995 European Union 4, ,762 Eastern Europe 7, ,840 USSR 2, ,946 Africa 23, ,042 Asia 43, ,289 Middle East 1, ,507 Oceania World total 140, ,147 Country U.S. 28, ,549 China 25, ,086 Brazil 12, ,600 Mexico 7, ,000 India 6, ,470 South Africa 3, ,584 Source: Foreign Agriculture Service, Washington, D.C., TABLE 2.22 Corn: Percent of Areas Receiving Fertilizer Applications, All States Surveyed, a Year Nitrogen (%) Phosphate (%) Potash (%) a All values shown as percents and based on number of acres receiving one or more applications of a specific fertilizer ingredient. Source: Environmental, Economics and Demographics Branch, National Agriculture Statistics Service, Washington, D.C., 2001.
70 Grain Crops CORN PLANT NUTRITION TABLE 2.23 Nutrient Elements Contained in the Stovers, Grains, and Roots of a 150-Bu Corn Crop Compound or Element Approximate (lb/acre) Supplied by or Approximate Equivalent Water 6,500,000 to 8,250, to 36 inches of rain Oxygen 10,200 Air is about 20% oxygen Carbon 7,800 carbon or 28,500 CO 2 Carbon contained in 6 tons of coal Nitrogen 310 Nitrogen, phosphorus, and potassium are the three nutrient elements contained in most mixed fertilizers Phosphorus (P 120 lb as phosphate or 52 lb as P Approx. equivalent is 1,200 lb of fertilizer 2.29 = phosphate) Potassium (K x lb as potash or 205 lb K = potash) Calcium 58 Approx. 150 lb agricultural limestone or equivalent Sulfur lb sulfur or equivalent Magnesium 50 Approx. 215 lb epsom salt or 550 lb sulfate of potashmagnesia Iron 3 15 lb iron sulfate or equivalent Manganese 0.45 Approx. 1.3 lb manganese sulfate or equivalent Boron 0.10 Approx. 1.0 lb borax or equivalent Zinc Trace Small amount of zinc sulfate or equivalent Copper Trace Small amount of copper sulfate or oxide Molybdenum Trace Very small amount of sodium or ammonium molybdate Note: Corn roots contain 75 lb N, 30 lb P 2 O 5, 60 lb K 2 O, and 9 lb S. TABLE 2.24 Nutrient Elements Required to Produce 150 bu (8400 lb at 56 lb/bu) of Corn Element Grain Stover Total (lb/acre) (lb/bu) (lb/acre) (lb/bu) (lb/acre) (lb/bu) Nitrogen Phosphorus as phosphate Potassium as potash Calcium Magnesium Sulfur Chlorine Iron 0.1 a Manganese Copper Zinc Boron Molybdenum (mo) a Less than Source: Changing Patterns in Fertilizer Use, 1968, Soil Society of America, Madison, WI. With permission.
71 40 Agronomic Handbook: Management of Crops, Soils, and Their Fertility TABLE 2.25 Corn Crop Nutrient Element Utilization (lb/acre) Yield Nitrogen Phosphorus Potassium Magnesium Sulfur 100 bu/acre bu/acre bu/acre bu/acre TABLE 2.26 Uptake of Major Elements and Micronutrients by a 10-Ton/Acre Corn Crop Major Elements kg Nitrogen 240 Phosphorus as phosphate 102 Potassium as potash 120 Calcium 43 Magnesium 58 Sulfur 30 Micronutrients mg Boron 36 Copper 20 Iron 120 Manganese 36 Zinc 60 Source: International Soil Fertility Manual, 1995, Potash & Phosphate Institute, Norcross, GA.
72 Grain Crops 41 TABLE 2.27 Major Element and Micronutrient Removal by Corn Grain and Stover at Two Grain Yields Yield 9.5 tons/ha 6.3 tons/ha Element Grain Stover Grain Stover kg/ha Nitrogen Phosphorus as phosphate Potassium as potash Calcium as oxide Magnesium as oxide Sulfur g/ha Boron Copper Iron Manganese Zinc Source: International Fertilizer Association World Fertilizer Use Manual, 2000, Paris. TABLE 2.28 Major Requirements of Corn during Growing Season (Yield = 11.8 tons/ha) Plant Age (days) Major Amount Absorbed (kg/ha/day) N P 2 O 5 K 2 O Source: International Fertilizer Association World Fertilizer Use Manual, 2000, Paris.
73 42 Agronomic Handbook: Management of Crops, Soils, and Their Fertility TABLE 2.29 Increase Elemental Content of Corn Plants Produced by Nitrogen Fertilization Element No Fertilizer 180 N kg/ha Nitrogen, % Phosphorus, % Potassium, % Calcium, % Magnesium, % Boron, ppm Copper, ppm Iron, ppm Manganese, ppm Zinc, ppm Yield, tons/ha Source: International Soil Fertility Manual, Potash & Phosphate Institute, Norcross, GA. TABLE 2.30 Plant Nutrient Elements Absorbed by 180-Bu/Acre Corn Crop during Successive 25-day Growing Periods (%) Nutrient First (Early) Second (Growth) Third (Silk) Fourth (Grain) Fifth (Mature) Nitrogen Phosphate Potash Source: Efficienct Fertilizer Use Manual Soil Fertility, IMC Global, Inc., Lake Forest, IL., FIGURE 2.1 Corn yields in the U.S., China, and Brazil, (Source: The Agricultural Link, 1997, Worldwatch Paper 136, Worldwatch Institute.)


74 Grain Crops 43 FIGURE 2.2 Nitrogen uptake and distribution in corn. FIGURE 2.3 Phosphorus uptake and distribution in corn. FIGURE 2.4 Potassium uptake and distribution in corn.


75 44 Agronomic Handbook: Management of Crops, Soils, and Their Fertility FIGURE 2.5 Normal ears on well fertilized, high-producing corn often weigh 5 oz to 8 oz. FIGURE 2.6 Big ears (in excess of 8 oz), with kernels covering the tips of the cobs. FIGURE 2.7 Small ears may be signs of low fertility. FIGURE 2.8 Poorly filled tips and loose, chaffy kernels may indicate potassium deficiency. FIGURE 2.9 Phosphorus deficiency results in small, twisted ears and underdeveloped kernels from lack of pollination. FIGURE 2.10 Nitrogen deficiency at critical times results in small ears; kernels at the tips do not fill.

76 Grain Crops 45 FIGURE 2.11 Dry weather slows silking; kernels are not well pollinated NUTRIENT ELEMENT DEFICIENCIES Boron (B) Deficiency Symptoms Boron-deficient plants are stunted; they have short, stout stems that appear oval in cross-section. Leaves are pale green, short, and more erect than normal. Boron deficiency reduces the numbers and sizes of ears and also affects pollination by preventing the growth of the pollen tube. As a result, barren ears are commonly produced by B-deficient plants and grain yields are severely reduced. Yellow interveinal lesions on younger leaves: Because B is not readily transferred from old to young leaves, symptoms of deficiency appear first and are more severe on young leaves. Old leaves usually remain green and appear healthy. The youngest leaves are affected before unrolling fully from the sheaths of previous leaves. Affected leaves are short and held erect. They are pale green, with short, yellow interveinal lesions throughout their laminae. The chlorotic lesions produce no definite patterns Problem Soils Boron deficiency is likely to occur in: Soils derived from parent material low in B such as acid igneous rocks or fresh water sediments Sandy soils from which boron has been leached Alkaline soils, especially those containing free lime Soils low in organic matter Acid peat and muck soils Correcting Deficiency Boron deficiency can be corrected by soil applications or foliar sprays of boron fertilizers. Soil applications are more effective if broadcast and mixed into the soil some months before sowing. Borax, boric acid, and chelated B compounds are suitable soil applications but only boric acid or chelated B compounds are suitable as foliar sprays. Foliar sprays should be applied about 5 to 6 weeks after seedling emergence or as soon as symptoms appear. While soil applications often remain effective for many years, foliar sprays have little residual value and must be applied to every crop. Soil tests can be used to estimate the amount of available B in a soil and predict whether fertilizer is needed. The best prediction can be obtained by seeking advice on fertilizer practices used on similar soils in the region Calcium (Ca) Deficiency Symptoms Calcium deficiency produces very stunted plants. Stems very short and stout; the foliage is green, often distorted, and appears torn and ragged. If the deficiency persists, young leaves have difficulty emerging fully and unrolling, and shoots may die before reaching maturity. Calcium deficiency
77 46 Agronomic Handbook: Management of Crops, Soils, and Their Fertility reduces grain yields. Mildly affected crops develop small ears and distorted tassels. If the deficiency is severe, no ears or tassels may develop and plants may die before maturity. Torn or malformed young leaves: Because Ca is not readily transferred from old to young tissues, symptoms appear first and are more severe on young leaves. If the deficiency persists, young leaves become very short and are held erect. Symptoms begin with young leaves that turn pale green and develop yellow to white interveinal lesions. The chlorotic areas grow and the laminae tear easily at those points. When new leaves develop, they often have holes in the laminae. The torn, malformed leaves give the plants a ragged appearance. When the deficiency is very severe, the youngest leaves do not fully unroll. They remain joined at their tips and produce a ladder-like appearance. In extreme cases, the youngest leaves die before emerging. Old leaves remain green and appear healthy. Fan-shaped stems: Calcium deficiency produces short, stout stems that appear flattened in crosssection. The sheaths of old leaves often pull away from the stems, producing a fan-shaped appearance after the leaves crowd together at the tops Problem Soils Calcium deficiency is likely to occur in: Acid sandy soils where Ca is leached by heavy rainfall Strongly acid peat and muck soils in which total Ca is low Alkaline or sodic soils in which high exchangeable sodium (Na) and ph depress the uptake of Ca Soils with high levels of soluble aluminum (Al) and low levels of exchangeable Ca Correcting Deficiency Calcium deficiency can be corrected by broadcasting a suitable fertilizer onto the soil and mixing it in some months before sowing. Where the chief problem is simply a lack of Ca, suitable fertilizers are gypsum (calcium sulfate) and calcium nitrate or chloride. However, if the ph is low, lime or limestone (calcium carbonate) and dolomite (a mixture of calcium and magnesium carbonates) are more suitable. A soil test can be used to determine the lime or Ca requirement. However, since the correct rate of application depends on soil type and the crop to be grown, advice should be sought on fertilizer practices used on similar soils in the region. The excessive use of lime may induce deficiencies of K, Mg, Fe, Mn, Zn, or Cu; and care should be taken to prevent over-liming Copper (Cu) Deficiency Symptoms Copper-deficient corn plants appear patchy. In copper-poor areas, plants are stunted; they have thin, spindly stems and pale green foliage. Affected plants often appear limp and wilted. Copper-deficient plants produce small ears that set few grains because Cu deficiency interferes with the production of fertile pollen. If a deficiency is very severe, many plants die before reaching maturity. Weather-tipped young leaves: Because Cu is not readily transferred from old to young leaves, symptoms appear first and are more severe on young leaves. Old leaves usually remain green and appear healthy. Young leaves become limp and turn pale green. Pale yellow to white, interveinal and marginal chlorosis then develops at the leaf tips. If the deficiency persists, the affected tissue dies, turns pale brown, and twists or rolls into a tube, giving the leaves a weather-tipped appearance. Deaths of shoots: When the deficiency persists and becomes very severe, the youngest leaves often die before emerging from the sheaths of older leaves. The affected plants seldom mature. Tillers may develop but they die before maturity.
78 Grain Crops Problem Soils Copper deficiency is likely to occur in: Peat and muck soils in which organic matter ties up soluble Cu in forms less available to plants Alkaline sands in which total Cu is low Leached acid soils in which total Cu is low Soils formed from rocks low in Cu Correcting Deficiency Foliar sprays and soil applications of Cu salts such as copper sulfate (bluestone) or copper chelates have corrected Cu deficiencies. Soil applications should be mixed into the soil some weeks before sowing. However, soil applications may fail to correct the deficiencies in some seasons and symptoms may reappear in the crop. If this occurs, foliar sprays should be applied immediately. A reliable remedy is to apply foliar sprays of 0.5 to 1% solutions of soluble Cu salts (for example, 0.5 to 1 kg copper sulfate per 100 L water per ha); the first application should occur 4 to 6 weeks after seedling emergence. Additional sprays should be applied as soon as symptoms reappear. Tests can be used to estimate the amount of available Cu in a soil and predict whether fertilizer is needed. The best prediction can be obtained by seeking advice on fertilizer practices used on similar soils in the region Iron (Fe) Deficiency Symptoms Iron-deficient plants are stunted and have pale green to yellow leaves. Stems are thin and spindly and usually green, although faint red-purple stripes may appear on the lower stems and older leaf sheaths when the deficiency is severe. Affected plants develop small ears that set fewer grains than normal. Kernel size may be reduced also if the deficiency is severe. As a result, grain yields may be severely reduced. Interveinal chlorosis on younger leaves: Because Fe is not readily transferred from old to young leaves, symptoms develop first and are more severe on young leaves. Symptoms begin when young leaves turn pale green. Pale yellow chlorosis then develops throughout the interveinal tissues of whole leaves. The veins become green and prominent. When the deficiency persists or becomes severe, the interveinal tissue turns dark yellow and the veins become pale green. At this stage, interveinal yellowing is often seen also on the youngest, unrolled leaves Problem Soils Iron deficiency is likely to occur in: Calcareous soils in which levels of soluble Fe are low Waterlogged soils Acid soils that have excessively high levels of soluble Mn, Zn, Cu, or Ni that depress plant uptake of Fe Sandy soils low in total Fe Peat and muck soils in which organic matter ties up Fe Correcting Deficiency While soil applications of inorganic Fe salts such as iron sulfates or chlorides have corrected the deficiencies in some soils, the applied Fe quickly becomes insoluble and less available to plants. Iron salts of various organic chelates show promise as soil applications because the chelates have
79 48 Agronomic Handbook: Management of Crops, Soils, and Their Fertility the ability to keep Fe in solution. For acid soils, FeEDTA is the most effective chelate. FeHEDTA and FeDTPA are best on neutral soils and FeEDDHA works on alkaline soils. However, to be effective, large amounts of chelates may be required and may prove too costly. Another effective remedy is to apply solutions of inorganic salts or chelates to the foliage (1% solutions or 1 kg salt per 100 L water per ha). Because Fe is so immobile in plants, sprays must be applied every 10 to 15 days to provide Fe to new leaves. Advice on fertilizer practices used on similar soils in the region should be sought to obtain the best remedies for local conditions Magnesium (Mg) Deficiency Symptoms Magnesium-deficient corn plants are stunted. They have thin, spindly stems, pale green to yellow foliage, and rust-brown lesions. Magnesium-deficient crops develop small ears and kernel size may also be reduced, causing low grain yields. Interveinal chlorosis on older leaves: Because Mg is readily transferred from old to young leaves, symptoms appear first and are more severe on old leaves. Symptoms work their way up the plants to younger leaves if the deficiency persists. Old leaves turn pale green. Pale yellow, interveinal chlorosis develops in the mid-sections of the leaves and advances toward the bases and the tips. The chlorotic tissue dies and leaves intermittent, pale brown, necrotic lesions between the veins. The youngest leaves usually remain green and appear healthy. Rust-brown striped leaves: As a deficiency becomes more severe, rust-brown stripes appear on the margins and in adjacent interveinal areas on old leaves. Eventually, the brown striping extends completely over leaves and combines with the brown necrotic lesions developed in interveinal areas. Soon afterward, the margins and tips die and turn dark brown. In severe cases, the lower leaves die and hang down around the stems Problem Soils Magnesium deficiency is likely to occur in: Acid sandy soils from which Mg has been leached Strongly acid peat and muck soils in which total Mg is low Soils over-fertilized with Ca (for example, lime) or K, thus inhibiting uptake of Mg Correcting Deficiency Magnesium deficiency on acid soils is best corrected by broadcasting dolomite (a mixture of calcium and magnesium carbonates) and mixing it into the soil some months before sowing. When the problem is strictly a deficiency of Mg, hand applications of magnesium sulfate or chloride can be made at or before planting. Tests can be used to estimate the amount of soluble and exchangeable Mg in the soil and predict the amount of fertilizer required. The best prediction can be obtained by seeking advice on fertilizer practices used on similar soils in the region. Magnesium deficiency in existing crops can be corrected by applying soluble salts such as magnesium sulfate, chloride, or nitrate with irrigation water. Foliar sprays of similar salts are usually not recommended because of the large number needed to supply the requirements of the crop Manganese (Mn) Deficiency Symptoms Crops suffering from Mn deficiency often appear patchy. Within Mn-poor areas, plants are stunted; they have thin, short stems and pale green to yellow foliage. Mild deficiencies of Mn do not appear to affect grain yields greatly. However, if the deficiency persists and becomes severe, the numbers and sizes of ears and kernels are reduced, thereby reducing grain yields.
80 Grain Crops 49 Interveinal chlorosis on older leaves: Manganese is partly mobile in corn, and some of the element is transferred from old to young leaves when a deficiency occurs. As a result, symptoms appear first on middle leaves and spread mainly to older leaves. Younger leaves are also affected if the deficiency persists and becomes severe. Middle leaves turn pale green and develop a pale yellow interveinal chlorosis that extends the full lengths of the leaves. The veins remain pale green and are easily recognizable. As the deficiency becomes more severe, this symptom develops on old leaves. It rarely appears on the youngest leaves, which remain pale green. White interveinal flecks: When the deficiency is severe, crystalline, white flecks appear within the interveinal chloroses. Eventually, all chlorotic tissue dies and turns white, leaving the veins green and very prominent. Necrosis develops near the margins and tips of old leaves and extends toward the bases until whole leaves die and turn pale brown. Wavy leaf margins: Affected leaves often appear limp or wilted. Leaf margins curl down and appear excessively wavy Problem Soils Manganese deficiency is likely to occur in: Strongly alkaline soils in which Mn is less available to plants Poorly drained, peaty soils in which Mn occurs in forms less available to plants Strongly acid, sandy soils from which soluble Mn has been leached Soils formed from rocks low in Mn Correcting Deficiency Foliar sprays and soil applications of Mn salts and oxides have been used to correct Mn deficiency. Soil applications are more effective when broadcast and mixed into the soil some weeks before sowing. However, foliar applications have generally been more successful than soil applications. One or more foliar sprays of 0.5 to 1% solutions of soluble Mn salts (for example, 0.5 to 1 kg manganese sulfate per 100 L water per ha) usually correct the deficiency. The first should be applied 5 to 6 weeks after seedling emergence. If the symptoms reappear, the spray should be repeated immediately. While soil applications usually last 5 to 6 years before fresh applications are needed, foliar sprays must be applied to every crop. Soil tests can be used to estimate the amounts of available Mn in a soil and predict whether fertilizer is needed. The best prediction can be obtained by seeking advice on fertilizer practices used on similar soils in the region Nitrogen (N) Deficiency Symptoms Corn is very sensitive to N supply and even mild deficiencies severely reduce growth. Nitrogendeficient young plants are stunted and have thin, spindly stems and pale green to yellow, short, erect leaves. If the deficiency persists or occurs in more mature crops, the old leaves become pale yellow while young leaves remain green. Nitrogen-deficient plants usually produce single small ears. The small ears and the depression of kernel size severely reduce grain yields. Furthermore, the grain will be low in protein because N plays a central role in the formation of proteins. Pale yellow older leaves: Because N is readily transferred from old to young leaves, symptoms appear first and are more severe on old leaves. Symptoms work their way up the plants to young leaves if the deficiency persists. Old leaves turn pale green. Pale yellow chlorosis then develops at the tips and advances down the leaves, usually along the mid-veins, producing V-shaped patterns. The chlorosis is followed by pale brown necrosis until entire leaves are affected and die, often hanging down around the lower stems.
81 50 Agronomic Handbook: Management of Crops, Soils, and Their Fertility Red stems: Some varieties develop red colors on the lower stems. This coloration is usually more intense on the sides facing the sun and is not present on the areas shaded by the leaf sheaths Problem Soils Nitrogen deficiency is likely to occur in: Sandy soils leached by heavy rainfall or excessive irrigation Soils low in organic matter Soils with a long history of cropping and depleted of N supplies However, even fertile soils may suffer temporary N deficiency when double-cropped, heavily leached, or waterlogged Correcting Deficiency Nitrogen deficiency is corrected by increasing the level of available N in the soil by fallowing, which allows organic N to be converted to mineral N; by growing cover or cash crops of legumes, which can fix atmospheric N 2 ; or by adding nitrogenous fertilizers. Suitable fertilizers are urea, gaseous ammonia or ammonium sulfate, nitrates, or phosphates. Crop growth depends on the amount of N already in the soil. A test can measure the amount of total N or nitrate (NO 3 )-N in the soil and predict the amount of fertilizer required. The best prediction can be obtained by seeking advice on fertilizer practices used on similar soils in the region. Nitrogen deficiency in existing crops can be corrected by applying soluble salts such as urea with irrigation water or as a foliar spray. Spray applications usually result in a rapid response of short duration, and additional sprays 10 to 14 days apart may be needed to supply enough N to the crop Phosphorus (P) Deficiency Symptoms Mild deficiencies cause reduced growth but few clearly recognizable leaf symptoms. When the deficiency is severe, plants are stunted and have short, stout stems and dark green, short, erect leaves. Some varieties may develop purple or red areas on leaves and stems. A deficient plant may produce only one small ear containing fewer, smaller kernels than usual. Grain yield is often severely reduced. Purple older leaves: Because P is readily transferred from old to young leaves, symptoms appear first and are more severe on old leaves. They work their way up the plants to young leaves if the deficiency persists. In many varieties, purple or purple-red areas develop on the old dark green leaves. In some varieties, the purple is restricted to the mid-sections of leaves and may develop interveinal patterns. In other varieties, entire leaves are suffused with purple. Young leaves usually remain unaffected. Dark yellow leaf tips: Yellow chlorosis develops at the tips of old leaves and advances toward the bases, usually in a broad front but sometimes along the margins. The chlorosis turns dark brown as the tissue dies. Purple stems: Many varieties develop red or purple areas on the lower stems and old leaf sheaths. The colors are more intense on areas exposed to sunlight; stems are green beneath protecting leaf sheaths Problem Soils Phosphorus deficiency is likely to occur in: Soils low in organic matter Soils in which cropping has depleted P supplies
82 Grain Crops 51 Highly weathered, Fe-rich acid soils in which phosphate is fixed in less available forms Soils whose topsoil has been lost during erosion Calcareous soils that contain P in forms that are less available to plants Correcting Deficiency Phosphorus deficiency can be corrected by applying phosphatic fertilizers at or before sowing. Suitable fertilizers are single or triple superphosphates or ammonium phosphates. The growth of crops depends on the amount of water-soluble phosphates and the rate of exchange between insoluble and soluble forms of P in the soil. A test can be used to estimate the amount of available phosphate in a soil and predict the amount of fertilizer needed. The best prediction can be obtained by seeking advice on fertilizer practices used on similar soils in the region. Phosphorus deficiency in existing crops can be corrected by applying soluble salts such as ammonium phosphates with irrigation water. Spray applications of similar salts are usually not recommended because of the large number of applications needed to supply the requirements of the crop Potassium (K) Deficiency Symptoms Mild deficiencies of K cause stunted growth; plants have short, thin stems and pale green foliage. In severe deficiencies, plants become very stunted with short, spindly stems, pale green young leaves, and dead old leaves that hang down around the lower stems. Potassium deficiency severely reduces grain yield. An affected plant may produce a single small ear that is often very pointed and underdeveloped at the tip. Kernel size is smaller than normal. Marginal necrosis on older leaves: Because K is readily transferred from old to young leaves, symptoms develop first and are more severe on old leaves. They work their way up the plants to younger leaves if the deficiency persists. Symptoms begin as a pale yellow chlorosis on the tips of old leaves. The chlorosis is followed rapidly by pale brown necrosis and both symptoms advance down the margins toward the bases, usually leaving the mid-veins and surrounding tissues pale green. Young leaves usually remain green and appear healthy. Red stems: When the deficiency is mild, stems are usually pale green, but prominent red stripes develop on the lower stems and leaf sheaths if the deficiency persists or becomes severe Problem Soils Potassium deficiency is likely to occur in: Soils low in organic matter Sandy soils formed from parent material low in K Light textured soils leached of K by heavy rainfall Correcting Deficiency Potassium deficiency is corrected by applying potassium nitrate, sulfate, or chloride to the soil at or before sowing. Crop yield depends on the amounts of water-soluble and exchangeable K in the soil. A test can measure the amount of available K in the soil and predict the amount of fertilizer needed. The best prediction can be obtained by seeking advice on fertilizer practices used on similar soils in the region. Potassium deficiency in existing crops can be corrected by applying soluble salts such as potassium sulfate, chloride, or nitrate with irrigation water. Foliar sprays of similar salts are not recommended because of the large number needed to meet crop requirements.
83 52 Agronomic Handbook: Management of Crops, Soils, and Their Fertility Sulfur (S) Deficiency Symptoms Sulfur-deficient plants are stunted and have stout, short stems and yellow foliage. Mild deficiencies in young crops cause whole plants to change color from pale green to yellow-green. In more mature crops or if the deficiency persists and becomes severe, older leaves are pale green and younger leaves are yellow. Sulfur deficiency reduces grain yield because affected plants produce fewer, smaller ears with fewer kernels. The grain may be low in protein because S is required for the formation of amino acids used in protein synthesis. Yellow young leaves: Because S is not readily transferred from old to young leaves, symptoms develop first and are more severe on young leaves. Symptoms begin with all leaves turning pale green; the young leaves are the palest. Young leaves then turn pale yellow while old leaves remain pale green. The veins and interveinal tissues usually turn pale yellow, but in some varieties, the veins in the lower halves of the leaves may remain pale green during the early stages of deficiency. Red-purple suffusion on leaves: On severely deficient young plants, red-purple color sometimes develops as a suffusion over the yellow areas of the youngest leaves and red striping may develop on the sheaths of old leaves Problem Soils Sulfur deficiency is likely to occur in: Soils low in organic matter after many years of cropping Soils formed from parent material low in S (for example, certain volcanic rocks and ash) Acid sandy soils from which sulfates have been leached Correcting Deficiency Soil applications of any S fertilizer will correct deficiencies. Elemental S (flowers of S) can be broadcast and thoroughly mixed into the soil about 4 months before sowing. Gypsum (calcium sulfate) is another useful source of S. Tests can measure the amounts of available sulfate in the soil before sowing and predict the amounts of fertilizer required. The best prediction can be obtained by seeking advice on fertilizer practices used on similar soils in the region. Sulfur deficiency in existing crops can be corrected by applying soluble sulfate salts, such as magnesium, ammonium, or potassium sulfate, in irrigation water. Foliar sprays of similar salts are usually not recommended because of the large numbers needed to meet crop requirements Zinc (Zn) Deficiency Symptoms Zinc-deficient corn crops often appear patchy. Within Zn-poor areas, plants can be very stunted and have short, stout stems and pale green to yellow foliage. Zinc deficiency affects both ear and tassel development. Affected crops produce small ears that set few grains. Tassels are often distorted and may be devoid of pollen when the deficiency is very severe. As a result, grain yields are severely reduced even by mild deficiencies. White bands in younger leaves: Because Zn is not readily transferred from old to young leaves, symptoms develop first and are more severe on young leaves. Often, the youngest leaves are the most severely affected. Old leaves usually remain green and appear healthy. The youngest leaves turn pale green. White to yellow bands or streaks appear between the margins and mid-veins in the lower halves of the leaves. Eventually, the affected tissue dies and turns pale grey, leaving the margins and mid-veins green.
84 Grain Crops 53 Zinc deficiency prevents elongation of the internodes. This causes the stems to become stout and flattened. As the lower leaf sheaths pull away from the stems, the plants often assume a fanshaped appearance with the leaves crowded together at the tops Problem Soils Zinc deficiency is likely to occur in: Strongly alkaline soils with depressed Zn availability Leached sandy soils with low total Zn Leveled soils that may have Zn-deficient subsoils exposed on their surfaces Soils in which heavy applications of phosphate fertilizers may reduce crop use of Zn Correcting Deficiency Foliar and soil applications of Zn salts have been used to correct deficiencies. Soil applications of zinc chelates, sulfates, or oxides should be broadcast and mixed into the soil 2 to 3 months before sowing. Soil applications are effective for 6 to 8 years before fresh applications may be needed. Foliar sprays exert no residual effects and fresh applications must be made to each crop. Best results are obtained when a 0.5 to 1% solution of a soluble Zn salt (for example, 0.5 to 1 kg zinc sulfate heptahydrate (ZnSO 4 7H 2 O) per 100 L of water per ha) is applied 2 to 3 weeks after seedling emergence. Additional sprays should be applied as soon as symptoms reappear. Soil tests can be used to estimate the amounts of available Zn in a soil and predict whether fertilizer is needed. The best prediction can be obtained by seeking advice on fertilizer practices used on similar soils in the region. TABLE 2.31 Key to Nutrient Deficiency Symptoms of Corn Symptom Color changes in lower leaves Yellow discoloration from tip backward in form of a V Brown discoloration and scorching along outer margin from tip to base Yellow discoloration between veins; edges become reddish-purple Purpling and browning that extend in waves backward from tip Uniform yellowing of upper and lower leaves Color changes in upper leaves Emerging leaves show yellow to white bleached bands in lower parts of leaves Young leaves show interveinal chlorosis along entire length Young leaves are uniformly pale and yellow; older leaves die starting from the tips White, irregular spots between veins Young leaves show pale green to yellow discoloration between veins Young leaves wilt and die along the margins Deficient Nutrient Nitrogen Potassium Magnesium Phosphorus Sulfur Zinc Iron Copper Boron Manganese Molybdenum Note: Stunted plants and loss of green color are common for all deficiencies.
85 54 Agronomic Handbook: Management of Crops, Soils, and Their Fertility Salinity Problem Soils TABLE 2.32 Effects of Salinity on Corn 1 Appearance Unthrifty, low-yielding crops Droughty appearance Weather-tipped older leaves Causal Condition When sodium chloride (NaCl) is only moderately toxic, affected plants have a droughty appearance and grow poorly. As the toxicity becomes more severe, plants become stunted and develop short, thick stems and erect, grey-green foliage. Although the number of ears developed may not be affected, ear and kernel sizes are reduced and affected crops usually produce less grain than normal. Sodium chloride is carried in the transpiration stream and accumulates to high concentrations in old leaves. Symptoms appear first in old leaves and work up the plant to younger leaves if the toxicity persists. Affected plants have harsh, droughty appearance. Foliage is dull grey-green and leaves are shorter and held more erect than normal. The margins of all leaves are often rolled in, as if the leaves had wilted. As the toxicity develops, grey necrosis appears on the margins near the tips of old leaves. The necrosis spreads down the leaves, usually along the margins, making them appear weather-tipped. Sodium cloride toxicity is more likely to occur in: Saline soils formed from salt water sediments Previously fertile soils flooded or heavily irrigated with water containing a high concentration of NaCl Correcting Toxicity Leaching with good quality irrigation water is the most effective means of removing excess Na and Cl from soil. The water table may have to be lowered to make the treatment effective. Permeable soils such as well structured sandy soils are often easily reclaimed, but the problem is more difficult in less permeable soils such as poorly structured heavy clays. If exchangeable Na in the soil is high, reclamation involves replacement of the adsorbed Na by Ca via application of gypsum (calcium sulfate) and then leaching the dissolved Na and Cl beyond the rooting depths of the plants. If irrigation water is to be used to leach the Na, the quality of the water should be checked before use to make sure it is not saline. Where excess NaCl cannot be wholly corrected by soil leaching, a more tolerant species may have to be grown.
86 Grain Crops Manganese Toxicity Problem Soils TABLE 2.33 Effects of Manganese Toxicity on Corn Appearance Unthrifty, low-yielding crops Interveinal chlorosis on older leaves Weather-tipped older leaves Causal Condition On some soils or under certain conditions, soluble Mn can reach levels that are toxic for plant growth. In corn, such toxicity causes stunted plants with thin stems and yellow-green foliage. Grain yield is depressed, mainly by reducing the numbers and sizes of ears produced. If the toxicity is very severe, small, distorted plants that produce little grain or die before maturity may develop. Excess Mn accumulates in older tissues and symptoms appear first and are usually more severe on old leaves. However, if the toxicity persists, symptoms spread rapidly to young leaves until entire plants are affected. Leaves turn pale green and pale yellow flecks and mottles develop between the veins in the mid-sections of the leaves. The chlorotic tissue dies, turns pale brown or grey, and the lesions join to produce streaks of necrotic tissue running between the veins in the mid-sections of the leaves. When the deficiency persists, the margins and tips of old leaves turn dark grey-green, then brown. The mid-veins and surrounding tissues appear silver-green and the dead brown tips appear weather-tipped. Manganese toxicity is likely to occur in: Strongly acid soils with increased solubility of Mn Waterlogged soils in which poor aeration causes unavailable manganic (Mn 3+ ) ions to be reduced to manganous (Mn 2+ ) ions that can be taken up by plants Correcting Toxicity Manganese toxicity is usually corrected by adopting management practices that reduce the levels of soluble Mn in soils. If soils are strongly acid, liming to an alkaline reaction will reduce excessive levels of soluble Mn. Drainage of waterlogged soils prevents anaerobic conditions in which soluble Mn 2+ ions are produced. If soils have been over-fertilized with Mn 2+, heavy leaching with low Mn irrigation waters or mulching with organic materials will remove soluble Mn from the soil solutions.
87 56 Agronomic Handbook: Management of Crops, Soils, and Their Fertility Nutrient Element Plant Tissue Status TABLE 2.34 Critical Plant Nutrient Element Levels in Corn Leaves Opposite to and below the Ear at Tasseling Major Element % Micronutrient ppm Nitrogen 2.90 Boron 10 Phosphorus 0.25 Copper 5 Potassium 1.90 Iron 25 Calcium 0.40 Manganese 15 Magnesium 0.15 Zinc 15 Sulfur 0.15 TABLE 2.35 Normal Expected Ranges in Nutrient Elements Concentrations for Parts of Corn Plants Average Range in Concentration Element Whole plant at 3- to 4-leaf stage Ear leaf at silk Stalk at silk above ear node Stalk at silk below ear node Grain at maturity g/kg Nitrogen Phosphorus Potassium Calcium Magnesium Sulfur mg/kg Aluminum Boron Barium Copper Iron Manganese Sodium Strontium
88 Grain Crops 57 TABLE 2.36 Sufficiency Ranges for Major Elements and Micronutrients in Corn Plants Element 15 whole tops of plants 12 in. tall Time of Sampling and Plant Part 12 leaves below whorl prior to tasseling 12 ear leaves at initial silk % Nitrogen Phosphorus Potassium Calcium Magnesium Sulfur ppm Boron Copper Iron Manganese Molybdenum Zinc Source: Plant Analysis Handbook II: A Practical Sampling, Preparation, Analysis, and Interpretation Guide, 1996, MicroMacro Publishing, Athens, GA. FIGURE 2.12 Relative yield of corn grain versus concentration of total nitrogen in a basal segment of a stalk.
89 58 Agronomic Handbook: Management of Crops, Soils, and Their Fertility CHLOROPHYLL METER READINGS OF CORN LEAVES 2 Chlorophyll meter readings taken in the field are compared to the average readings from a high N reference area. The field to be tested should have received no fertilizer N beyond a normal amount of starter N and the N applied to the high N reference area. The manual accompanying the chlorophyll meter should provide detailed instructions for operating the meter. What follows is a brief explanation of how to use a chlorophyll meter to take leaf readings for an early season test: Internal calibration This is the first step in the procedure. Turn the meter on. CAL will appear in the window. With no sample in the sample slot, press the measuring head down. The meter will beep when calibration is complete. The display will then show N = 0 (N is the sample number). If the display flashes CAL and beeps, the calibration was not performed correctly, probably because the sample head was not closed completely. Repeat the procedure. If the meter beeps and EU appears at the top of the display, the top and bottom windows of the measuring head may be dirty. Wipe them clean and repeat the procedure. Leaf reading Place a leaf in the slot of the meter head. Use the center line on the measuring head to align the measuring head window and the spot on the leaf to be read. When the head is closed on the leaf, the meter will beep, a digital reading will appear on the display, and the reading will be stored in the meter. Sometimes the meter will beep and not give a reading. When this happens, try changing the alignment of the leaf slightly before closing the head again. Standardization Meter readings of corn leaves are affected by the part of the leaf and the position of the leaf on the plant that is sampled. Therefore, it is necessary to standardize the part of the corn plant to be read with the chlorophyll meter. For this test, chlorophyll meter readings should always be done on leaf 5 of a plant to be tested. The reading is done at a point on the leaf approximately 1/2 inch from the edge of the leaf and 3/4 of the length of the leaf from the leaf base. Do not take readings on the midrib or too near the edge. Pick representative plants in the field for meter readings. Care should be taken to avoid unusual or damaged parts of leaves when reading the chlorophyll meter. Plants chosen should be relatively evenly spaced rather than separate from others or in clusters. Use your body to shield the meter from direct sunlight. Wet leaves may be read if beaded water is shaken or rubbed off before the leaf is inserted into the meter. Questionable readings Occasionally you may get readings that seem incorrect or are very different from others in the field. Such a reading can be deleted by pressing the 1 DATA DELETE button to remove the last reading. Be careful not to press ALL DATA CLEAR because it will delete all readings taken to that point. If you want to look over all of existing readings at any time, use the DATA RECALL button to scan them. During the scan, you may use the DELETE button to remove a reading and then replace it by taking another reading. Determining average A chlorophyll meter will store up to 30 readings. At any point, pressing the AVERAGE button will display the average of the readings taken. When you are ready to begin a new set of readings, press ALL DATA CLEAR to delete all the readings saved to that point. Once an operator is familiar with meter operation and leaf stage identification, readings can be done very quickly. Since the meter memory will store up to 30 readings and calculate an average, at least 30 readings should be taken. If a field is very variable, more readings may be necessary for an accurate field average or to determine whether several different N rates would be appropriate. At least 25 to 30 readings should be taken from plants in the high N reference sections. Advantages of early season chlorophyll meter testing Chlorophyll meter readings are quick, easy, and provide instantaneous values. No samples need to be collected, processed, and sent to a laboratory for analysis. The only cost of sampling is labor. Nitrogen recommendations are accurate (comparable to the pre-side-dress soil nitrate test).
90 Grain Crops 59 Disadvantages of early season chlorophyll meter testing Initial expense is high; the meter costs about $1,400. Early season corn leaf chlorophyll levels are affected by hybrid selection and environmental stresses. Thus, high N reference plots must be established. This test is not applicable to fields that have received preplant or at-plant N fertilizer applications beyond starter N PLANTING RATES TABLE 2.37 Corn Plants/Acre at Various Planting Rates Distance between Rows Checked Corn Drilled Corn 2/hill 3/hill 4/hill 8 in. 10 in. 12 in. 14 in. 2 ft. 8 in. 24,502 19,600 16,335 14,001 2 ft. 10 in. 23,061 18,449 15,374 13,178 3 feet 9,680 14,520 19,360 21,780 17,424 14,520 12,447 3 ft. 2 in. 8,690 13,030 17,380 20,634 16,507 13,756 11,791 3 ft. 4 in. 7,840 11,760 15,680 19,602 15,682 13,068 11,201 3 ft. 6 in. 7,110 10,670 14,220 18,669 14,935 12,446 10,688 3 ft. 8 in. 17,820 14,256 11,880 10,183 3 ft. 10 in. 17,045 13,636 11,363 9, CORRECTION TABLES TABLE 2.38 Corn Grain Moisture Yield Correction % Moisture lb Ears to Equal 1 bu % Moisture lb Ears to Equal 1 bu
91 60 Agronomic Handbook: Management of Crops, Soils, and Their Fertility TABLE 2.39 Percentage of Shelled Corn to Add or Subtract to Correct to 15.5% Moisture Content % Moisture in Corn % to Add % Moisture in Corn % to Subtract %Moisture in Corn % to Subtract WEIGHTS AND MEASURES Conversion factor 1 bu (56 lb) shelled corn is approximately equal to 2 bu (70 lb) husked ear corn. TABLE 2.40 Weights and Measures of Corn Commodities Approximate Net Weight Commodity Unit lb kg Ear, husked bu Shelled bu Meal bu Oil gal TABLE 2.41 Weight of Grain and Standard Yield of Level Full Bushel of Corn Weight (lb) of 1 Measured bu Multiplication Factor to Yield 1 Standard bu Shelled Corn
92 Grain Crops 61 TABLE 2.42 Corn Seeds per Pound, Weight per Bushel, and Germination Time Corn Seeds/lb (1,000) Seeds/g (no.) Weight/bu Germination Time (days) REFERENCES 1. Grundon, N.J., Hungry Crops: A Guide to Nutrient Deficiencies in Field Crops, 1987, Information Series QI87002, Queensland Department of Primary Industries, Brisbane, Australia. 2. The Early-Season Chlorophyll Meter Test for Corn, 1997, Agronomy Facts 53, Pennsylvania State University, University Park, PA. 2.3 GRAIN SORGHUM [Sorghum bicolor (L.) Moench] INTRODUCTION Some question surrounds whether the early cultivation of sorghum began in the Nile Valley or elsewhere in Africa, but its domestication is certainly tied to the origin and evolution of African agriculture. Sorghum is known as sorgho in France, sorgo in Spain and Italy, mohrenhirse and sorghum in Germany, jowar in India, and durra in Arabian countries. The five races of grain sorgum are bicolor, guinea, caudatum, kafir, and durra. Sorghum has a wide range of uses: as grain, sweetener (sugar sorghum), animal feed, silage, fuel, building material, and in broom making. Sorghum can grow at rainfall levels over 250 mm, but grows best with 800 to 1,200 mm of rain during the vegetative season. Under very dry conditions, recommended densities range from 0.5 to 3 plants per m 2 under dry conditions to 10 plants per m 2 when irrigated or grown for forage. Seed germinates at temperatures >15 C, with optimum growth between 25 and 30 C. Early maturing varieties can be harvested 3 to 4 months after sowing and late varieties, 8 to 10 months after sowing. Sorghum can grow on light sandy soils, but best yields are obtained from high fertility soils.
93 62 Agronomic Handbook: Management of Crops, Soils, and Their Fertility PRODUCTION STATISTICS TABLE 2.43 U.S. Sorghum Grain and Silage Acreage, Yield, and Production, a Year Harvested Acres (1,000) Sorghum for Grain b Yield (bu/acre) Production (1,000 bu) Harvested Acres (1,000) Sorghum for Silage Yield (tons/acre) Production (1,000) , , , , , , , , , , , , , , , , , , , , , , , , , , , c 7, , ,663 a Grain and sweet sorghum for all uses including syrup. b Includes both sorghum for grain, and sweet sorghum forage or seed. c Preliminary. Source: Crops Branch, National Agriculture Statistics Service, Washington, D.C., TABLE 2.44 U.S. Grain Sorghum Acreage and Production, 2000 State Area Harvested (1,000 acres) Yield (bu/acre) Production (1,000 bu) Kansas 3, ,800 Texas 2, ,350 Maryland Arizona California Nebraska ,000 U.S. Total 7, ,070 Source: Crops Branch, National Agricultural Statistics Service, Washington, D.C., TABLE 2.45 U.S. Utilization of Sorghum for Silage, 2000 State Area Harvested (1,000 acres) Yield (tons/acre) Production (1,000 tons) Kansas Texas Nebraska South Dakota Oklahoma Georgia Source: Crops Branch National Agriculture Statistics Service, Washington, D.C., 2001.
94 Grain Crops CHARACTERISTICS OF GROWTH TABLE 2.46 Stages of Growth of Grain Sorghum Stage Days after Emergence a Stage Name and Description a 0 0 Emergence usually occurs 3 to 10 days after planting Three-leaf stage three fully developed leaves; collar of each leaf is visible without tearing the blade or sheath; the growing point or meristem is still below the soil surface Five-leaf stage five leaves are fully developed; the root system is developing rapidly; disease at lower nodes may cause loss of leaves at the nodes; rate of growth is increased and remains almost constant until physiological maturity Stage has no descriptive name; plant normally has 7 to 10 fully developed leaves; reproductive development is initiated; the final number of leaves has been determined; potential panicle size will be established; three lower leaves may be lost; culm or stalk growth is rapid Stage has no descriptive name; flag leaf is visible in the whorl; all leaves except the final three or four are fully expanded; 80% of total leaf area is present, light interception is approaching maximum; reference to the number of leaves or leaf number should be from the top; because a variable number of leaves were lost from the base of the culm, the flag leaf is numbered 1; about 20% of the final dry weight is present Boot leaves are fully expanded; panicle is near full size and enclosed in the flag leaf sheath; culm elongation is essentially complete; peduncle elongation begins; boot stage of inflorescence development occurs during this stage Half-bloom peduncle has grown rapidly during stage 5 and the panicle is extended from the flag leaf sheath; half the plants in a field are in some stage of bloom; for some, flowering has progressed half-way down the panicle; time required to reach half bloom depends upon maturity of the hybrid and environmental conditions Soft-dough between stage 6 and the point at which grains are at soft-dough stage, about half the total dry weight of the grain is accumulated; culm weight is decreased by about 10% during grain filling; lower leaves continue to be lost and only 8 to 12 functional leaves remain Hard-dough About 75% of the grain dry weight has accumulated; grain contents are more solid; culm weight has declined to its lowest dry matter weight Physiological maturity Plant and panicle reach maximum total dry weight; the time from flowering to physiological maturity varies by hybrid but represents about a third of the total time from planting; grain moisture is usually 25 to 35%; remaining functional leaves may remain green; branches may develop from upper nodes if temperature and moisture are adequate. Approximate number of days for hybrids of RS 610 maturity grown at Manhattan, KS. Source: Growth stages of sorghum, Agron J., 64, 13, 1972.
95 64 Agronomic Handbook: Management of Crops, Soils, and Their Fertility SORGHUM GRAIN CHARACTERISTICS TABLE 2.47 Nutritive Values of Whole Sorghum Grain Component Value Calories/100 g 332 Protein, % 11.0 Fat, % 3.3 Total calcium, mg/lb 28 Total phosphorus, mg/lb 287 Total potassium, mg/lb 350 Carbohydrates, % 73.0 TABLE 2.48 Levels and Degrees of Toxicity of Prussic Acid in Grain Sorghum Level (ppm dry weight) Relative Degree of Toxicity Very low (safe to pasture) Low (safe to pasture) Medium (doubtful to pasture) 750 1,000 High (dangerous to pasture) >1,000 Very high (very dangerous to pasture) Source: Modern Grain Sorghum Production, 1990, Iowa State University Press, Ames. TABLE 2.49 Levels and Degree of Toxicity of Nitrates in Grain Sorghum Nitrate-Nitrogen Content (ppm dry weight) Toxicity 0 1,000 Safe under all feeding conditions 1,000 1,500 Safe for all except pregnant animals 1,500 4,000 Risk of poisoning: should not constitute more than 50% of ration >4,000 Potentially toxic: should not be fed Source: Modern Grain Sorghum Production, 1990, Iowa State University Press, Ames.
96 Grain Crops 65 TABLE 2.50 Average Mineral Composition of Grain Sorghum Element Content (%) Nitrogen 1.80 Phosphorus 0.30 Potassium 0.40 Sulfur 0.15 Calcium 0.04 Magnesium 0.15 Iron Manganese Copper Source: Modern Grain Sorghum Production, 1990, Iowa State University Press, Ames. TABLE 2.51 Influence of Nitrogen Application on Protein Content of Grain Sorghum Nitrogen Rate (lb/acre) Yield (lb/acre) Protein (%) 0 3, , , , , Source: Modern Grain Sorghum Production, 1990, Iowa State University Press, Ames. TABLE 2.52 Quality Components of Sorghum Grain Component Content Digestible energy, kcal/kg 3,453 Protein, % 11.0 Lysine, % 0.27 Methionine + cystine, % 0.27 Tryptophan, % 0.09 Calcium, % 0.04 Phosphorus, % 0.30 Fiber, % 2.0 Ether extract, % 2.8 Source: Modern Grain Sorghum Production, 1990, Iowa State University Press, Ames.
97 66 Agronomic Handbook: Management of Crops, Soils, and Their Fertility SORGHUM PLANT NUTRITION TABLE 2.53 Nutrient Element Contents of Above-Ground Parts of Grain Sorghum Plant Yield (lb/acre) Plant Part Dry Matter (lb) N (lb) P 2 O 5 (lb) K 2 O (lb) Ca (lb) Mg (lb) S (lb) 6,000 Grain 5, Stover 6, ,000 Grain 6, Stover 8, ,000 Grain 8, Stover 9, Source: Modern Grain Sorghum Production, 1990, Iowa State University Press, Ames. TABLE 2.54 Normal Ranges in Composition of Leaves and Grain of Grain Sorghum Range Element Leaf Grain % Nitrogen Phosphorus Potassium Calcium Magnesium ppm Boron Copper Iron Manganese Zinc Source: Modern Grain Sorghum Production, 1990, Iowa State University Press, Ames. TABLE 2.55 Critical Nutrient Element Concentrations for Grain Sorghum a Nutrient Element Concentration % Nitrogen 2.40 Phosphorus 0.20 Potassium 2.20 Calcium 0.40 Magnesium 0.25 ppm Boron 15 Copper 5 Iron 25 Manganese 15 Molybdenum 0.2 Zinc 15 a Based on the leaf immediately below the flag leaf during booting and flowering. Source: Modern Grain Sorghum Production, 1990, Iowa State University Press, Ames.
98 Grain Crops NUTRIENT ELEMENT UPTAKE BY GRAIN SORGHUM TABLE 2.56 Approximate Amounts of Nutrient Elements Removed by 5,600 Pounds Grain Sorghum Element Grain (lb) Stover (lb) a Nitrogen Phosphorus as phosphate Potassium as potash Sulfur 9 10 Magnesium 7 10 Calcium Copper Manganese Zinc a The amount of stover is not linearly related to grain yield. Source: Adapted from Changing Patterns in Fertilizer Use, 1968, Soil Science Society of America, Madison, WI. TABLE 2.57 Fertilizer Nutrient Element Demand/Uptake/Removal (kg/ha) by Grain Sorghum kg/ha Plant Condition Nitrogen Phosphorus as Phosphate Potassium as Potash Dryland, low yield Wet, medium yield Irrigated, high yield Green forage Silage Top yield, grain and forage Source: IFA World Fertilizer Use Manual., 2000, International Fertilizer Industry Association, Paris. TABLE 2.58 Cumulative Estimated Amounts of Primary Nutrient Elements Absorbed by Grain Sorghum during the Georgia Growing Season (5,600 lb/acre) Nutrient Element Stage of Growth Nitogen, % Phosphorus as phosphate, % Potassium as potash, % Nitrogen, lb Phosphorus as phosphate, lb Potassium as potash, lb
99 68 Agronomic Handbook: Management of Crops, Soils, and Their Fertility TABLE 2.59 Nutrient Element Utilization by Grain Sorghum Crop (8,000 lb/acre) Nutrient Element Uptake (lb/acre) Nitrogen 250 Phosphorus as phosphate 90 Potassium as potash 240 Magnesium 44 Sulfur 38 TABLE 2.60 Key to Nutrient Element Deficiencies for Sorghum Symptom Color changes in lower leaves Yellow discoloration extending from tip backward in form of V along midrib Brown discoloration or firing along outer margin from tip to base Purpling and browning from tip backward; in young plants entire plant shows general purpling Color changes in upper leaves Yellow to white bleached bands appear on lower parts of emerging leaves Entire lengths of young leaves show interveinal chlorosis; leaves may eventually turn white Uniform yellowing of upper leaves Deficiency Nitrogen Potassium Phosphorus Zinc Iron Sulfur Note: Stunted plants and loss of green color are common to all deficiencies. Source: Modern Grain Sorghum Production, 1990, Iowa State University Press, Ames NUTRIENT ELEMENT DEFICIENCIES Boron (B) Deficiency Symptoms Boron-deficient crops are very stunted, lack vigour and yield poorly. Affected plants have short, stout stems and dark green foliage. Leaves are shorter and held more erect than usual. Deficient plants produce small heads that may be partly barren, resulting in low grain yields. White interveinal lesions on younger leaves: Because B is not readily transferred from old to young leaves, symptoms appear first and are more severe on young leaves. Old leaves usually remain green and appear healthy. The youngest leaves remain dark green but develop intermittent, white interveinal lesions, often over their entire lengths. Tissue next to such lesions is brittle and easily torn. The edges of the torn laminae may turn brown but necrosis of the remaining tissue is rare. Fan-shaped stems: Because B plays a role in the elongation of internodes and leaves, stems on deficient plants are very short, often flattened or oval in cross-section, with leaves crowded together at the top. As the leaf sheaths pull away from the stem, they resemble a partly opened fan Problem Soils Boron deficiency is likely to occur in: Soils derived from parent material low in B such as acid igneous rocks or freshwater sediments Sandy soils from which B has been leached by heavy rainfall
100 Grain Crops 69 Alkaline soils, especially those containing free lime Soils low in organic matter Acid peat and muck soils Correcting Deficiency Boron deficiency can be corrected by applying soil dressings or foliar sprays of fertilizers. Soil dressings are more effective if broadcast and mixed into the soil some months before sowing. Borax, boric acid, and chelated B compounds are suitable for soil application, but only boric acid and chelated B compounds are suitable for foliar sprays. Foliar sprays should be applied about 5 to 6 weeks after seedling emergence or as soon as symptoms appear. While soil dressings often remain effective for many years before fresh applications are needed, foliar sprays have little residual value and must be applied to every crop. Tests can estimate the amount of available B in a soil and predict whether fertilizer is needed. The best prediction can be obtained by seeking advice on fertilizer practices used on similar soils in the region Calcium (Ca) Deficiency Symptoms Sorghum is very sensitive to Ca deficiency and even mild deficiencies can severely reduce growth and grain yields. Affected plants are stunted and have short, stout stems and dark green, often ragged foliage. If the deficiency is severe, whole plants may die or the heads may be malformed and partly or completely barren. Malformed younger leaves: Because Ca is not readily transferred from old to young leaves, symptoms develop and are more severe on young leaves. Affected leaves are dark green, short, brittle, and held more erect than usual. Pale yellow chlorotic areas develop near the margins and these are easily torn, giving the leaves a malformed appearance. Brown necrosis on younger leaves: If the deficiency persists, leaves missing sections of lamina may be produced. Tissue adjacent to the affected areas is usually chlorotic, then quickly dies and turns dark brown. Flattened stems: Calcium deficiency prevents the elongation of the internodes. Affected plants have very short stems that are oval in cross-section. Leaves are crowded together at the top of the plants Problem Soils Calcium deficiency is likely to occur in: Acid sandy soils from which Ca has been leached by heavy rainfall Strongly acid peat and muck soils that have low total Ca Sodic soils in which exchangeable Na and ph are high, thus depressing the Ca uptake Soils with high levels of soluble Al and low levels of exchangeable Ca Correcting Deficiency Calcium deficiency can be corrected by broadcasting a suitable fertilizer and mixing it into the soil some months before sowing. Where the chief problem is a lack of Ca, suitable fertilizers are gypsum (calcium sulfate) and calcium nitrate or chloride. However, if the soil ph is low, lime or limestone (calcium carbonate) and dolomite (a mixture of calcium and magnesium carbonates) are more suitable. A soil test can be used to determine the lime or Ca requirement of a soil. However, since the correct rate of application depends on soil type and the crop to be grown, advice should be sought on fertilizer practices used on similar soils in the district. Excessive use of lime may induce K, Mg, Fe, Mn, Zn, or Cu deficiencies so care should be taken to prevent over-liming.
101 70 Agronomic Handbook: Management of Crops, Soils, and Their Fertility Copper (Cu) Deficiency Symptoms Mild deficiencies usually exhibit no clearly recognizable symptoms, but cause unthriftiness, delayed maturity, and stunted plants. Definite symptoms are associated with severe deficiencies only. Affected plants are very short and have thin, spindly stems, pale green foliage, and smaller heads on which many flowers are barren. Weather-tipped younger leaves: Because Cu is not readily transferred from old to young leaves, symptoms develop first and are more severe on young leaves. Frequently, the youngest leaves are the most affected, while old leaves remain dark green and appear healthy. Symptoms develop on the youngest leaves before they are unrolled from the whorls. They turn pale green and pale yellow chlorosis develops at the tips. The chlorosis is followed rapidly by pale brown necrosis and both symptoms advance down the margins towards the bases. The dead leaf tips usually roll or twist tightly into tubes. This symptom is known as weather tipping Problem Soils Copper deficiency is likely to occur in: Peat and muck soils in which organic matter ties up soluble Cu in forms less available to plants Alkaline soils in which total Cu is low Leached acid soils containing low total Cu Soils formed from rocks low in Cu Correcting Deficiency Foliar sprays and soil dressings of Cu salts such as copper sulfate (bluestone) or copper chelates will correct Cu deficiency. Soil dressings should be broadcast and mixed into the soil some weeks before sowing. However, soil dressings may fail to correct deficiencies in some seasons and symptoms may reappear. If this occurs, foliar sprays should be applied immediately. A reliable remedy is to apply foliar sprays of 0.5 to 1% solutions of soluble Cu salts (for example, 0.5 to 1 kg copper sulfate per 100 L water per ha), the first to be applied 4 to 6 weeks after seedling emergence. Additional sprays should be applied as soon as symptoms reappear. Tests can be used to estimate the amount of available Cu in a soil and predict whether fertilizer is needed. The best prediction can be obtained by seeking advice on fertilizer practices used on similar soils in the region Iron (Fe) Deficiency Symptoms Unthrifty, low-yielding crops: Sorghum is relatively sensitive to Fe deficiency, and temporary environmental conditions such as waterlogging may cause symptoms to appear, then disappear when conditions return to normal. Prolonged or severe deficiencies produce stunted plants with thin, spindly stems and pale yellow foliage. Mild or temporary deficiencies usually have few effects on grain yields. However, prolonged or severe deficiencies reduce head size and the number of grains set per head and result in low grain yields. Yellow interveinal chlorosis on younger leaves: Because Fe is not transferred from old to young leaves, symptoms develop first and are more severe on young leaves. The youngest leaves are usually the most affected. Old leaves remain dark green and appear healthy. Young leaves turn pale green and develop pale yellow interveinal chlorosis over their entire lengths. Veins remain dark green and prominent.
102 Grain Crops Problem Soils Iron deficiency is likely to occur in: Alkaline soils that have low levels of soluble Fe Waterlogged soils Acid soils with excessively high levels of soluble Mn, Zn, Cu, or Ni that depress Fe uptake Sandy soils low in total Fe Peat and muck soils whose organic matter ties up Fe Correcting Deficiency While soil dressings of inorganic Fe salts, such as iron sulfates or chlorides, have corrected deficiencies in some soils, the applied Fe quickly becomes insoluble and less available to plants. Iron salts of various organic chelates have proved promising as soil dressings because the chelate keeps the Fe in solution. For acid soils, FeEDTA is the most effective chelate, while FeHEDTA and FeDTPA are best on neutral soils. FeEDDHA is best for alkaline soils. However, to be effective, large amounts of chelates may be required. An equally effective remedy is to apply solutions of inorganic salts or chelates to the foliage (1% solutions or 1 kg salt per 100 L water per ha). Because Fe is so immobile in plants, sprays need to be applied every 10 to 15 days to provide Fe to new leaves. Advice on fertilizer practices used on similar soils in the district should be sought to obtain the best remedy for the affected crop under local conditions Magnesium (Mg) Deficiency Symptoms Unthrifty, low-yielding crops: Magnesium-deficient crops are unthrifty, lack vigor, and yield poorly. Deficient plants are stunted and have short, thin stems and pale green to yellow foliage. Severely deficient plants usually produce small heads that set few grains; grain yields are severely reduced. Interveinal chlorosis of older leaves: Because Mg is readily transferred from old to young leaves, symptoms develop first and are more severe on old leaves. Symptoms then advance up the plants to younger leaves if the deficiency persists. Young leaves usually remain pale green and appear healthy. Pale yellow interveinal chlorosis develops on the mid-sections of old leaves and and extends rapidly over their entire lengths. As the symptoms progress, the chlorosis darkens to yellow-orange. The veins remain green and easily seen. Brown necrosis on older leaves: When a deficiency is very severe, irregular, linear, rust-brown necrotic lesions develop on and adjacent to the veins in the chlorotic tissues. Eventually these lesions join to form rust-brown streaks running almost the full lengths of affected leaves Problem Soils Magnesium deficiency is likely to occur in: Acid sandy soils from which Mg has been leached Strongly acidic peat and muck soils whose total Mg is low Soils that have been over-fertilized with Ca (for example, with lime) or K Correcting Deficiency Magnesium deficiency on acid soils is corrected by broadcasting dolomite (a mixture of calcium and magnesium carbonates) onto the surface and mixing it into the soil some months before sowing. When the problem is strictly Mg deficiency, band applications of magnesium sulfate or chloride can be made at planting. A soil test can be used to estimate the amounts of soluble and exchangeable
103 72 Agronomic Handbook: Management of Crops, Soils, and Their Fertility Mg in soil and predict the amount of fertilizer needed. The best prediction can be obtained by seeking advice on fertilizer practices used on similar soils in the district. Magnesium deficiency in existing crops can be corrected by applying soluble salts, such as magnesium sulfate, chloride, or nitrate, with irrigation water. Foliar sprays of similar salts are usually not recommended because of the large number of applications needed to supply crop requirements Manganese (Mn) Deficiency Symptoms Patchy, low-yielding crops: Affected crops often appear patchy. Within the Mn-poor area, plants are very stunted and have thin, spindly stems and dark green foliage marked by red-brown necrotic areas. Affected plants produce small heads that set few grains and produce low yields. When the deficiency is very severe, many plants die before developing heads. Interveinal white lesions on younger leaves: Because Mn is not readily transferred from old to young leaves, symptoms develop first and are more severe on young leaves. Old leaves remain dark green and appear healthy. Young leaves turn pale green and develop intermittent, white lesions between the veins around their mid-sections. If the deficiency persists, these lesions spread toward the base not toward the tips. Necrotic lesions on younger leaves: When a deficiency becomes severe, brown necrotic lesions develop in interveinal tissues adjacent to the white lesions. Initially, the main veins and leaf tips remain green. When the vein dies, the death of the leaf follows. In extreme deficiencies, young, still-unrolling leaves die, followed by the death of the main shoot Problem Soils Manganese deficiency is likely to occur in: Strongly alkaline soils whose Mn is less available to plants Poorly drained peaty soils whose Mn is in forms less available to plants Strongly acid sandy soils whose soluble Mn has been leached by heavy rain Soils formed from rocks low in Mn Correcting Deficiency Foliar sprays and soil dressings of Mn salts and oxides have been used to correct Mn deficiencies. Soil dressings are more effective when broadcast and mixed into the soil some weeks before sowing. However, foliar applications have generally been more successful. One or more foliar sprays of 0.5 to 1% solutions of soluble Mn salts (for example, 0.5 to 1 kg of manganese sulfate per 100 L of water per ha) usually correct the deficiency, the first applied 5 to 6 weeks after seedling emergence. If the symptoms reappear, sprays should be repeated immediately. While soil dressings usually last 5 to 6 years before fresh applications are needed, foliar sprays must be reapplied to every crop. Tests can estimate the amount of available Mn in a soil and predict whether fertilizer is needed. The best prediction can be obtained by seeking advice on fertilizer practices used on similar soils in the region Nitrogen (N) Deficiency Symptoms Unthrifty, low-yielding crops: Nitrogen-deficient crops are unthrifty, mature more slowly, and yield poorly. Deficient young plants are stunted and have thin, spindly stems and pale green foliage. In mature crops, affected plants have pale green upper leaves and pale yellow or brown lower leaves. Head size and the number of grains set per head are low. Because N plays a vital role in the formation of protein, grain from deficient plants may also be low in protein.
104 Grain Crops 73 Pale yellow older leaves: Because N is readily transferred from old to young leaves, symptoms develop first and are more severe on old leaves and work up the stems to young leaves if the deficiency persists. Young leaves are pale green and smaller than usual. Old leaves turn pale green and develop pale yellow chlorosis at the tips. The chlorosis is followed by pale brown necrosis and both symptoms advance down the main veins creating V-notch patterns while the margins remain green. Eventually, affected leaves die and form thatches of dead leaves around the bases of the stems. Red stems: Some varieties often develop red stripes on the lower stems and old leaf sheaths when the deficiency is very severe. The red color is more intense on areas exposed to sunlight Problem Soils Nitrogen deficiency is likely to occur in: Sandy soils that have been leached by heavy rainfall or excessive irrigation Soils low in organic matter Soils with a long history of cropping whose supplies of N have been exhausted However, even fertile soils may suffer temporary N deficiencies when double-cropped, heavily leached, or waterlogged Correcting Symptoms Nitrogen deficiency is corrected by increasing the level of available N in the soil by fallowing, which allows organic N to be converted to mineral N; by growing cover or cash crops of legumes, which can fix atmospheric N 2 ; or by adding nitrogenous fertilizers. Suitable fertilizers are urea, gaseous ammonia or ammonium sulfate, nitrate, and phosphates. Crop growth depends on the amount of N already in the soil. A soil test can measure the amount of total N or nitrate (NO 3 )-N in the soil and predict the amount of fertilizer required. The best prediction can be obtained by seeking advice on fertilizer practices used on similar soils in the district. Nitrogen deficiency in existing crops can sometimes be corrected by applying soluble salts such as urea with irrigation water or as a foliar spray. Spray applications usually result in a rapid response of short duration, and additional sprays 10 to 14 days apart may be needed to supply enough N for crop Phosphorus (P) Deficiency Symptoms Unthrifty, low-yielding crops: Sorghum is not a good indicator of P deficiency. Mild deficiencies cause unthriftiness and delayed maturity but exert no recognizable symptoms. If a deficiency is severe, plants are very stunted and have stout stems and dark green-purple foliage. Severely deficient plants produce small heads that set few grains. Dark yellow older leaves: Because P is readily transferred from old to young leaves, symptoms develop first and are more severe on old leaves, working up the stems to younger leaves if the deficiency persists. Old leaves remain dark green and develop dark yellow chlorosis at the tips. The chlorosis is followed by dark brown necrosis and both symptoms advance down the leaves, usually along the margins. Eventually, affected leaves die and turn brown to form thatches of dead leaves around the bases of the stems. Young leaves remain dark green but may be shorter and more erect than usual. Purple leaves and stems: In some varieties, purple pigmentation develops on old leaves, leaf sheaths, and lower stems. The colors are more intense on areas exposed to sunlight, developing on the upper surfaces of the leaves and on parts of the stems that are not protected by the leaf sheaths.
105 74 Agronomic Handbook: Management of Crops, Soils, and Their Fertility Clear areas on middle leaves: When a deficiency is very severe, some varieties develop clear, transparent-like areas between the margins and mid-veins in the mid-sections of middle leaves. These lesions do not increase in size as symptoms develop further Problem Soils Phosphorus deficiency is likely to occur in: Soils low in organic matter Soils with a long history of cropping and exhausted P supplies Highly weathered, Fe-rich acid soils whose phosphate is fixed in less available forms Soils that have lost their topsoil through erosion Akaline soils whose P may be insoluble and less available Correcting Deficiency Phosphorus deficiency can be corrected by applying fertilizers to the soil at or before sowing. Suitable fertilizers are single or triple superphosphates or ammonium phosphates. The growth of crops depends on the amount of water-soluble phosphate available and the rate of exchange between soluble and insoluble forms of P in the soil. Tests can estimate the available phosphate in a soil and predict the amount of fertilizer needed. The best prediction can be obtained by seeking advice on fertilizer practices used on similar soils in the district. Phosphorus deficiency in existing crops can be corrected by applying soluble salts, such as ammonium phosphates, with irrigation water. Spray applications of similar salts are usually not recommended because of the large number of applications needed to supply crop requirements Potassium (K) Deficiency Symptoms Unthrifty, low-yielding crops: Sorghum is a good indicator of K deficiency. Affected crops lack vigor, mature slowly, and yield poorly. Deficient plants are very stunted and have short, thick stems and pale green to bronze-yellow foliage. As the deficiency increases, old leaves develop marginal necrosis, often called firing. Affected plants develop small heads that set few grains. Interveinal and marginal necrosis on older leaves: Because K is easily transferred from old to young leaves, symptoms develop first and are more severe on old leaves, working up the stems to younger leaves if the deficiency persists. In some varieties, mild deficiencies cause faint, pale yellow interveinal chlorosis to develop over the entire lengths of middle leaves, followed rapidly by intermittent, necrotic lesions concentrated near the leaf tips and margins. Severely deficient plants develop marginal necrosis on old leaves. The pale brown necrosis develops near the leaf tips and advances down the margins, leaving the main veins and surrounding tissues green. Eventually, entire leaves die and form thatches of dead leaves around the lower stems Problem Soils Potassium deficiency is likely to occur in: Soils low in organic matter after many years of cropping Sandy soils formed from parent material low in K Light textured soils whose K has been leached by heavy rainfall Correcting Deficiency Potassium deficiency is corrected by applying potassium nitrate, sulfate, or chloride to the soil at or before sowing. Crop yield depends on the amount of water-soluble and exchangeable K in the soil. Tests can measure the available K in the soil and predict the amount of fertilizer needed.
106 Grain Crops 75 The best prediction can be obtained by seeking advice on fertilizer practices used on similar soils in the district. Potassium deficiency in existing crops can be corrected by applying soluble K salts, such as sulfate, chloride, or nitrate, with irrigation water. The foliar application of similar salts is usually not recommended because of the large number of applications needed to supply crop requirements Sulfur (S) Deficiency Symptoms Unthrifty, low-yielding crops: Mild deficiencies of S in young crops cause poorer growth and lack of color. Whole plants appear pale green. In more mature crops, the plants are short and have thin, spindly stems, pale green old leaves, and yellow young leaves. Mildly deficient plants may not suffer much yield loss, but the protein content of the grain may be lower than usual because S deficiency prevents the conversion of N into many proteins. If a deficiency is severe, plants often develop small heads that set few grains, and yields are greatly reduced. Pale yellow younger leaves: Because S is not readily transferred from old to young leaves when a deficiency occurs, symptoms develop first and are more severe on young leaves. Frequently, the youngest leaves are the most severely affected. Old leaves usually remain green and appear healthy. Young leaves first turn pale green, then pale yellow. Entire leaves are affected and veins are never prominent Problem Soils Sulfur deficiency is likely to occur in: Soils low in organic matter after many years of cropping Soils formed from parent material low in S (for example, volcanic rocks and ash) Acid sandy soils from which sulfates have been leached Correcting Deficiency The application of soil dressings of any S fertilizer will correct the deficiency. On alkaline soils, elemental S (flowers of S) may be broadcast and thoroughly mixed into the soil about 4 months before sowing. On neutral or acid soils, gypsum (calcium sulfate) is a useful source of S. Soil tests can measure the amount of available sulfate in soil before sowing and predict the amount of fertilizer required. The best prediction can be obtained by seeking advice on fertilizer practices used on similar soils in the region. Sulfur deficiency in existing crops can be corrected by applying soluble sulfate salts such as magnesium, ammonium, or potassium sulfate in irrigation water. Foliar sprays of similar salts are usually not recommended because of the large number of applications needed to supply crop requirements Zinc (Zn) Deficiency Symptoms Patchy, low-yielding crops: Affected crops lack vigor, are unthrifty, yield poorly, and often appear patchy. Affected plants are stunted and have very short stems and pale green foliage. On mature plants, heads are smaller than usual and may be partly barren. Pale yellow bands on younger leaves: Because Zn is not readily transferred from old to young leaves, symptoms develop first and are more severe on young leaves. The most severe symptoms appear on the youngest unrolling leaves (thus called white buds). Old leaves remain dark green and appear healthy. Young leaves turn pale green and broad bands of pale yellow
107 76 Agronomic Handbook: Management of Crops, Soils, and Their Fertility to white tissue develop between the green mid-veins and margins in the lower halves of the leaves. Necrotic lesions on younger leaves: If a deficiency persists, the chlorotic areas die and turn pale brown. Initially, the mid-veins remain green but eventually they are affected and die. Interveinal chlorosis and necrosis on middle leaves: When a deficiency is prolonged, middle leaves develop pale yellow interveinal chlorosis near their tips followed rapidly by pale brown interveinal necrosis that becomes general as the necrotic lesions join in the tip halves of the leaves. Fan-shaped stems: Zinc deficiency prevents the elongation of internodes and leaves. As a result, stems are short, often flattened or oval in cross-section, with the leaves crowded at the top to produce a fan-shaped appearance Problem Soils Zinc deficiency is likely to occur in: Strongly alkaline soils whose availability of Zn is depressed Leached sandy soils whose total Zn is low Leveled soils whose Zn-deficient subsoils may be exposed on the surface Soils in which heavy, frequent applications of phosphatic fertilizers may have reduced crop use of Zn Correcting Deficiency Foliar and soil applications of Zn salts have been used to correct deficiencies. Soil dressings of zinc chelates, sulfates, or oxides should be broadcast and mixed into the soil 2 to 3 months before sowing. While soil dressings of Zn have residual effects for 6 to 8 years before fresh applications are needed, foliar sprays have no residual effects and fresh applications must be made to each crop. Best results are obtained when a 0.5 to 1% solution of a soluble Zn salt (for example, 0.5 to 1 kg zinc sulfate heptahydrate per 100 L water per ha) is applied 2 to 3 weeks after seedling emergence. Additional sprays should be applied as soon as symptoms reappear. Tests can estimate the amount of available Zn in a soil and predict whether fertilizer is needed. The best prediction can be obtained by seeking advice on fertilizer practices used on similar soils in the region Salinity Deficiency Symptoms Unthrifty, low-yielding crops: High levels of NaCl in soils or irrigation water cause unthrifty, low yielding crops. Affected plants are stunted and have short, stout stems and dull grey-green foliage. Plants often have a harsh, droughty appearance and leaves are shorter and more erect than usual. The plants develop small heads that set few grains and produce low grain yields. Grey necrosis on older leaves: Because NaCl is carried in the transpiration stream, symptoms appear first and are more severe on older leaves. Symptoms work up the stems to young leaves if the toxicity persists. Young leaves usually remain green but may be shorter and more erect than usual. Old leaves turn dull green and appear wilted; their margins roll inward. As NaCl accumulates to toxic concentrations, the leaf tips and margins die and turn grey-green then pale brown. The dead tissue rolls into tubes Problem Soils Sodium chloride toxicity is more likely to occur in:
108 Grain Crops 77 Saline soils formed from salt water sediments Previously fertile soils that were flooded or heavily irrigated with water containing high concentrations of NaCl Correcting Toxicity Leaching with good quality irrigation water is the most effective means of removing excess Na and Cl from the soil. The water table may have to be lowered. Permeable soils such as well structured sandy soils are often easily reclaimed, but the problem is more difficult in less permeable soils (for example, poorly structured heavy clays). If exchangeable Na in the soil is high, reclamation involves replacing Na with Ca by applying gypsum (calcium sulfate) and then leaching the dissolved Na and Cl beyond the rooting depths of the plants. If irrigation water is to be used to leach the Na, the water quality should be checked before use to make sure it is not saline. If excess NaCl cannot be wholly corrected by soil leaching, a more tolerant species may have to be grown WEIGHTS AND MEASURES The net weight of 1 bu sorghum grain is approximately 56 lb or 25.4 kg. TABLE 2.61 Weight and Standard Yield of Level Full Bushel of Sorghum Weight of 1 bu (lb) Multiplication Factor to Yield Standard bu TABLE 2.62 Sorghum Seeds/Pound, Weight/Bushel, and Germination Time Seeds/lb (1,000) Seeds/g (no.) Weight/bu (lb) Germination Time (days) REFERENCES 1. Grundon, N.J., Hungry Crops: A Guide to Nutrient Deficiencies in Field Crops, 1987, Queensland Department of Primary Industries, Brisbane, Australia.
109 78 Agronomic Handbook: Management of Crops, Soils, and Their Fertility 2.4 OATS (Avena sativa L.) INTRODUCTION The oat belongs to the grass family (Poaceae or Gramineae). The oat is known as avoine in French, avena in Spanish and Italian, and hafer in German. Oats were some of the earliest cereals cultivated by man. They were known in ancient China as early as 7000 B.C. The oat belongs to the same plant family as barley, corn, rice, and wheat. It has higher food values (rich in starch and high quality protein and a good source of vitamin B) than any other cereal grain. The grain is primarily used as livestock feed (90% in the U.S.) and processed for making oatmeal, oatcakes, cookies, and ready-to-eat breakfast foods. Oat straw is commonly used as animal bedding. The chief kinds of oats are common (most commonly grown in the U.S.), red, side, and hullless. Oats grow especially well in cool, moist climates, and on fertile soil. They may be autumnsown (winter oats in areas with mild winters) or spring-sown. Yields are dependent on rainfall and range from 1.5 tons per ha with 350 mm rainfall to a high of 6.5 tons per ha with 750 mm rainfall. At a yield of 5.0 tons per ha, ear density is 350 per m 2, with a single ear weight of 1.43 g. Average oat yield in the U.S. in 2000 was 64.2 bu per acre; the highest was 98.0 and the lowest was 42.0 bu per acre. The fertilizer elements required to produce a 3.5-ton per ha grain yield are 70 kg N per ha, 35 kg P 2 O 5 per ha, and 105 kg K 2 O per ha PRODUCTION STATISTICS TABLE 2.63 Harvested Area, Yield, and Production of Oats by Continents and Specified Countries, Continent/Country Harvested Area (1,000 ha) Yield (metric tons/ha) Production (1,000 metric tons) Continent North America 2, ,863 South America ,058 Europe 1, ,115 Eastern Europe 1, ,541 USSR 5, ,195 Africa Asia Oceania ,167 World Total 14, ,383 Country Russia 4, ,400 Canada 1, ,641 U.S ,122 South Africa Australia ,092 Poland ,446 Ukraine China Source: Foreign Agriculture Service, Washington, D.C.
110 Grain Crops 79 TABLE 2.64 U.S. Oat Acreage, Yield, and Production, Year Area Harvested (1,000 acres) Yield (bu/acre) Production (1,000 bu) , , , , , , , , , , , , , , , , a 2, ,195 a Preliminary. Source: Crops Branch, National Agriculture Statistics Service, Washington, D.C., TABLE 2.65 Leading Oat-Producing States, 2000 State Area Harvested (1,000 acres) Yield (bu/acre) Production (1,000 bu) North Dakota ,845 Minnesota ,320 Wisconsin ,040 South Dakota ,420 Iowa ,060 Pennsylvania ,265 Texas ,300 U.S. Total 2, ,195 Source: Crops Branch, National Agriculture Statistics Service, Washington, D.C., 2001.
111 80 Agronomic Handbook: Management of Crops, Soils, and Their Fertility TABLE 2.66 U.S. Total and Per Capita Civilian Consumption of Oat and Oat Products as Food, Calendar Year a Total Consumed (million bu) b Per Capita Consumption of Food products (lb) c a Data shown for marketing year, June 1 to May 3. b Oats used in oatmeal, prepared breakfast foods, infant foods, and other food products. c Preliminary. Source: Economics Research Service, Washington, D.C., All figures are estimates based on data from private industry sources, the U.S. Department of Commerce, the Internal Revenue Service, and other government agencies. TABLE 2.67 Leading Oat-Producing States and Provinces State or Province 1,000 Short Tons Alberta 1,734 Saskatchewan 794 Iowa 639 Minnesota 638 South Dakota 625 Wisconsin 609 Manitoba 357 Quebec 328 Ontario 310 North Dakota 309
112 Grain Crops NUTRIENT ELEMENT CHARACTERISTICS TABLE 2.68 Relative Nutrient Element Uptake (% of Maximum) of Oats in Relation to Plant Development Growth Stage Dry Matter Nitrogen Phosphorus as Phosphate Potassium as Potash Early growth Tillering Jointing Booting Ear emergence Flowering Grain formation Physiological Maturity Biomass (dry) Grain Source: IFA World Fertilizer Use Manual, 2000, International Fertilizer Industry Association, Paris. TABLE 2.69 Nutrient Element Utilization (lb/acre) by 100-bu/acre Oat Crop Nitrogen Phosphorus as Phosphate Nutrient Element Potassium as Potash Magnesium Sulfur TABLE 2.70 Nutrient Element Sufficiency Ranges for Oats Major Elements % Micronutrients ppm Nitrogen Copper 5 25 Phosphorus Iron Potassium Manganese Calcium Molybdenum Magnesium Zinc Sulfur Note: Sampling procedure: 25 whole tops as head emerges from boot. Source: Plant Analysis Handbook II: A Practical Sampling, Preparation, Analysis, and Interpretation Guide, 1996, MicroMacro Publishing, Athens, GA.
113 82 Agronomic Handbook: Management of Crops, Soils, and Their Fertility NUTRIENT ELEMENT DEFICIENCIES Boron (B) Deficiency Symptoms Unthrifty, low-yielding crops: Boron-deficient plants are stunted and have dull yellow-green foliage. Although tiller production is usually not affected, many tiers die before maturity if a deficiency persists. Whole plants may die before producing heads if a deficiency is very severe. As a result, both forage and grain yields are reduced. Chlorotic tips on younger leaves: Boron is immobile in plants and symptoms develop first and are more severe on young leaves. Old leaves remain dark green. They appear healthy, but may turn a dull orange-green when a deficiency is severe. Marginal, dull yellow chlorosis develops at the tips of young leaves. The remainders of the leaves turn dull green-yellow. As the symptoms develop, leaf tips turn dull orange-green and pale brown necrotic lesions appear between the mid-veins and margins in the upper halves of the leaves. The chlorotic leaf tips die and turn pale orange-brown. Fan-shaped stems: Because B plays a major role in the elongation of stems and leaves, stems of deficient plants are very short and stout. The leaves are often crowded at the tops of the stems, forcing the leaf sheaths apart so the stems appear fan-shaped Problem Soils Boron deficiency is likely to occur in: Soils derived from parent material low in B, such as acid igneous rocks or freshwater sediments Sandy soils from which B has been leached Calcareous soils, especially those containing free lime Soils low in organic matter Acid peat and muck soils Correcting Deficiency Boron deficiency can be corrected by applying soil dressings or foliar sprays of B fertilizers. Soil dressings are more effective if broadcast and mixed into the soil some months before sowing. Borax, boric acid, and chelated B compounds are suitable for soil application, but only boric acid and chelated B are suitable for foliar sprays because of the low solubility of borax. Sprays should be applied within the first 5 weeks of seedling emergence or as soon as foliar symptoms appear. While foliar sprays are often beneficial, they have little residual value. Soil dressings can remain effective for many years. Soil tests can estimate the amount of available B and predict whether fertilizer is needed. The best prediction can be obtained by seeking advice on fertilizer practices used on similar soils in the district Calcium (Ca) Deficiency Symptoms Unthrifty, low-yielding crops: Calcium-deficient oat plants are very stunted and have short, dark green foliage. Tillering is not affected if the deficiency is mild. If it persists, many tillers die before producing heads. Forage and grain production are much reduced and, in some instances, whole plants die when the deficiency is severe. Weather-tipped younger leaves: The symptoms begin and are more severe on young leaves because Ca is not readily transferred from old to young leaves when a deficiency occurs. Old leaves usually remain dark green and appear healthy. Young leaves cease growth and become erect, short, and pale green. The leaf tips wilt and hang down, often with the margins rolled inward into tubes.
114 Grain Crops 83 Eventually the leaf tips die and turn grey (weather-tipped), sometimes breaking off to produce squared ends. Ragged leaf margins on younger leaves: When a deficiency is very severe, the youngest leaves become brittle and are easily torn as they emerge. Hence, the margins of young leaves often appear ragged. Death of shoots: As the deficiency persists, growing points of shoots die. The youngest leaves may die before emerging fully from the sheaths of previous leaves Problem Soils Calcium deficiency is likely to occur in: Acid sandy soils from which Ca has been removed by heavy rainfall Strongly acid peat and muck soils whose total Ca is low Alkaline or sodic soils in which high exchangeable Na and ph inhibit Ca uptake Soils with high levels of soluble Al and low levels of exchangeable Ca Correcting Deficiency Calcium deficiency can be corrected by broadcasting a suitable fertilizer onto the soil some months before sowing. Subsequent tillage operations will thoroughly mix the fertilizer and soil. Where the chief problem is a lack of Ca, suitable fertilizers are gypsum (calcium sulfate) and calcium nitrate or chloride. However, if the soil ph is low, lime or limestone (calcium carbonate) and dolomite (a mixture of calcium and magnesium carbonates) are more suitable. A soil test can be used to determine lime or Ca requirements. However, since the correct rate of application depends on the soil type and the crop to be grown, advice should be sought on fertilizer practices used on similar soils in the district. The excessive use of lime may induce deficiencies of K, Mg, Fe, Mn, Zn, and Cu, and care should be taken to prevent over-liming Copper (Cu) Deficiency Symptoms Patchy, low-yielding crops: Even in mild deficiencies, affected crops often have a patchy appearance. Within Cu-poor areas, plants are stunted and pale green and appear limp or wilted. If the deficiency is severe, young leaves may be dead while old leaves remain green. If the deficiency is mild, tiller production is usually unaffected and additional late tillers may develop at nodes or joints above ground level. However, severe deficiency causes many tillers to die before maturing. Because Cu deficiency leads to production of sterile pollen, heads on apparently healthy plants may set few grains and yields are reduced. When easily recognizable symptoms are present, little or no grain may be set. Weather-tipped younger leaves: Because Cu is immobile in plants, the symptoms develop first and are more severe on young leaves. Old leaves remain green and apparently healthy. The symptoms begin when young leaves turn pale green and appear to wilt even when ample water is available. If the deficiency persists, the tips of young leaves develop pale yellow chlorosis, then die and turn dark brown (weather-tipped). The dead tissue usually rolls or twists tightly into tubes or spirals Problem Soils Copper deficiency is likely to occur in: Peat and muck soils in which organic matter ties up Cu in forms unavailable to plants Calcareous sands whose total Cu is low Leached acid soils whose total Cu is low Soils formed from rocks low in Cu
115 84 Agronomic Handbook: Management of Crops, Soils, and Their Fertility Correcting Deficiency Foliar sprays and soil dressings of salts such as copper sulfate (bluestone) or copper chelates have corrected deficiencies. Soil dressings should be broadcast and mixed into the soil some months before planting. However, such dressings sometimes fail to correct the deficiencies or symptoms reappear. If this occurs, foliar sprays should be applied immediately. A reliable remedy is to apply two or three foliar sprays (for example, 0.5 to 1 kg copper sulfate per 100 L water per ha). The first spray should be applied 5 to 6 weeks after seedlings emerge and the second when the first or oldest heads reach the boot stage. An optional third spray may be applied 7 to 10 days after the second spray. Tests can estimate the amount of available Cu in the soil and predict whether fertilizer is needed. The best prediction can be obtained by seeking advice on fertilizer practices used on similar soils in the district Iron (Fe) Deficiency Symptoms Unthrifty, low-yielding crops: Iron deficiency causes stunted growth and pale green to yellow foliage. If the deficiency is mild, tillering may be relatively unaffected. In severely deficient plants it is very reduced, and forage and grain yields are greatly reduced. Interveinal yellow chlorosis on younger leaves: Iron is not easily transferred from old to young leaves when a deficiency occurs. Hence, symptoms begin and are more severe on young leaves, often on leaves that have not fully unrolled. Old leaves usually remain dark green and appear healthy. The symptoms begin when young leaves turn pale green. As the deficiency becomes more severe, the interveinal areas of affected leaves become bright yellow while the veins remain green and stand out prominently. If the deficiency persists, the interveinal areas may turn white and the veins become pale green to yellow Problem Soils Iron deficiency is likely to occur in: Calcareous soils whose levels of soluble Fe are low Waterlogged soils Acid soils excessively high in soluble Mn, Zn, Cu, and Ni that inhibit Fe uptake Sandy soils low in total Fe Peat and muck soils in which organic matter ties up Fe Correcting Deficiency While soil dressings of inorganic iron salts such as iron sulfates or chlorides correct deficiencies in some soils, it appears that applied Fe quickly becomes insoluble and less available. Iron salts of various organic chelates appear more promising because the chelate form keeps the Fe in solution. For acid soils, FeEDTA is the most effective chelate, while FeHEDTA and FeDTPA are best on neutral soils and FeEPDHA is best for calcareous soils. However, large amounts of chelates may be required and may prove too costly. An equally effective remedy is applying solutions of inorganic salts or chelates to the foliage (1% solution or 1 kg salt per 100 L water per ha). Because Fe is so immobile in plants, the sprays may need to be applied every 10 to 15 days to provide Fe to new leaves. Advice on local fertilizer practices should be sought.
116 Grain Crops Magnesium (Mg) Deficiency Symptoms Unthrifty, low-yielding crops: Magnesium deficiency causes stunted plants with pale green foliage that often turns orange-purple. Tillering can be greatly reduced when the deficiency appears in young plants. If the deficiency persists or becomes severe, young tillers die before producing heads and mature tillers develop small heads. Yields of forage and grain are reduced. Interveinal chlorosis on older leaves: Because Mg is easily transferred from old to young leaves when a deficiency occurs, symptoms begin and are more severe on old leaves, working up the plant to young leaves if it persists. The youngest leaves usually remain green to pale green and appear healthy. On very young plants, old leaves turn pale green and develop yellow chlorosis near the margins around the middles of the leaves. On more mature plants, linear yellow or white lesions develop in interveinal tissue in the mid-sections. The chlorosis and lesions advance toward the tips and bases of the leaves, developing into yellow or yellow-red, interveinal chlorosis. If the deficiency is severe, affected leaves develop generalized orange-red chlorosis, die, and turn pale brown Problem Soils Magnesium deficiency is likely to occur in: Acid sandy soils from which Mg has been removed by leaching Strongly acid peat and muck soils whose total Mg is low Soils that have been over-fertilized with Ca (for example, lime) or K, thus inhibiting Mg uptake Correcting Deficiency Magnesium deficiency on acid soils is corrected by broadcasting dolomite (a mixture of calcium and magnesium carbonates) onto the surface some months before sowing and mixing it thoroughly throughout the topsoil. When the problem is strictly Mg deficiency, band applications of magnesium sulfate or chloride can be made at or before planting. A test can estimate the amount of soluble and exchangeable Mg in the soil and predict the amount of fertilizer required. The best prediction can be obtained by seeking advice on fertilizer practices used on similar soils in the district. Magnesium deficiency in existing crops can be corrected by applying soluble salts such as magnesium sulfate, chloride, or nitrate with irrigation water. Foliar sprays of similar salts are usually not recommended because of the large number of applications needed to meet crop requirements Manganese (Mn) Deficiency Symptoms Patchy, low-yielding crops: Magnesium deficiency may cause areas of poor growth and give a crop a patchy appearance. Within Mn-poor areas, plants are stunted and have short, stout stems and pale green to brown foliage. If the deficiency becomes severe or persists, plants in these areas may die. Deficient plants produce few tillers and many die. As a result, both forage and grain yields are reduced. Grey flecks in older leaves: Because Mn is partly mobile in oats, the symptoms first appear and become more severe on mature leaves about halfway up the shoots. If the deficiency persists, symptoms spread rapidly to older leaves, then up the shoots to younger leaves until whole plants are affected. Small, linear, grey flecks appear in interveinal tissues in the basal halves of old leaves, extending toward the tips as symptoms develop. The flecks join to form large grey lesions in the basal halves of the leaves between the margins and mid-veins, eventually affecting the veins and causing the leaves to collapse. The necrotic areas finally turn pale brown.
117 86 Agronomic Handbook: Management of Crops, Soils, and Their Fertility Problem Soils Manganese deficiency is likely to occur in: Calcareous soils in which Mn is less available to plants Poorly drained peaty soils Strongly acid sandy soils whose soluble Mn has been leached by heavy rain Soils formed from rocks low in Mn Correcting Deficiency Foliar sprays and soil dressings of Mn salts and oxides have been used to correct deficiencies. Soil dressings are more effective when broadcast and mixed into the soil some months before sowing. However, foliar sprays have generally been more successful. One or more foliar sprays of 0.5 to 1% solutions of manganese sulfate (0.5 to 1 kg manganese sulfate per 100 L water per ha) usually correct the deficiency, the first spray to be applied 5 to 6 weeks after seedling emergence. If symptoms reappear, the spray should be repeated immediately. Tests can estimate the amount of available Mn in a soil and predict whether fertilizer is needed. The best prediction can be obtained by seeking advice on fertilizer practices used on similar soils in the district Nitrogen (N) Deficiency Symptoms Unthrifty, low-yielding crops: Nitrogen-deficient oats lack vigor and yield poorly. In young crops, stems are short and thin and the foliage is pale green. Mature plants are stunted and appear multicolored. Upper leaves are pale green, short, and erect. Middle leaves are usually yellow to pale green with red tips. The oldest leaves may be dead and brown and lie in the soil around the bases of the plants. Even mild deficiency reduces the number of tillers produced. When a deficiency persists, many young tillers die before producing heads. As a result, forage and grain yields are reduced. Furthermore, the protein concentration is low because of the central role N plays in protein formation. Pale yellow older leaves: When a deficiency occurs, N is transferred from old to young leaves. Symptoms appear first on old leaves and work up the plant to younger leaves if the deficiency persists. Old leaves turn pale green. Pale yellow chlorosis develops at the tips and advances toward the bases until entire leaves are pale yellow. Red leaf tips: When a deficiency persists or becomes severe, the tips of the leaves become orange-red. As the tissue dies, it turns dark brown and the leaf margins often roll upward to form tubes. Red stems: Stems are thin and spindly. Leaf sheaths are usually pale green but red striping often develops in cold weather Problem Soils Nitrogen deficiency is likely to occur in: Sandy soils leached by heavy rainfall or excessive irrigation Soils low in organic matter Soils with a long history of cropping where N stores have been used up Even fertile soils may suffer temporary N deficiencies when double-cropped, heavily leached, or waterlogged.
118 Grain Crops Correcting Deficiency Nitrogen deficiency is corrected by increasing the level of available N in the soil by fallowing, to allow organic N to be converted to mineral N; by growing cover or cash crops of legumes, which can fix atmospheric N 2 ; or by adding nitrogenous fertilizers such as urea, gaseous ammonia, or ammonium sulfate, nitrate or phosphates. Crop growth depends on the amount of N already in the soil. A soil test can measure the amount of total N or nitrate-n in soil and predict the amount of fertilizer required. The best prediction is obtained by seeking advice on fertilizer practices used on similar soils in the district. Nitrogen deficiency in existing crops can be corrected by applying soluble salts such as urea as solids or with irrigation water Phosphorus (P) Deficiency Symptoms Unthrifty, low-yielding crops: Phosphorus-deficient crops are unthrifty and yield poorly. Affected plants are stunted and have erect, short, dark green leaves with bright red-purple tips. In severe deficiencies, the oldest leaves may be brown and dead and lie on the soil around the bases of the plants. Tiller production is reduced and the youngest tillers usually die before maturity. As a result, yields of both foliage and grain are severely depressed. Dark yellow-orange chlorosis on older leaves: Phosphorus deficiency symptoms are more severe on old leaves, working up the plants to younger leaves if the deficiency persists because P is transferred from old to young leaves when a deficiency occurs. Dark orange-yellow chlorosis begins at the tips of affected leaves and advances toward the bases, usually along the leaf margins. Red or purple tips on older leaves: If the deficiency persists or becomes severe, chlorotic tissue dies and turns red or purple. Affected leaves often have green bases, orange-yellow mid-sections, and bright red or purple tips. The margins of the leaf tips often roll inward to form tubes. Eventually, entire leaves die and turn dark brown. Purple stems: The leaf sheaths and stems of affected plants often turn purple, especially if the season is cold Problem Soils Phosphorus deficiency is likely to occur in: Soils low in organic matter Soils in which cropping has exhausted the stores of P Highly weathered, Fe-rich acid soils in which phosphate is fixed in unavailable forms Soils whose topsoil has been lost through erosion Calcareous soils in which much of the P is tied up in insoluble phosphates that are less available to plants Correcting Deficiency Phosphorus deficiency can be corrected by applying phosphatic fertilizers to the soil at or before sowing. Suitable fertilizers are single or triple superphosphates or ammonium phosphates. The growth of crops depends on the amount of available water-soluble phosphate and the rate of exchange between insoluble and soluble forms of P in the soil. Tests can estimate the amount of available P in the soil and predict the amount of fertilizer required. The best prediction can be obtained by seeking advice on fertilizer practices in the district. Phosphorus deficiency in existing crops can be corrected by applying soluble salts such as ammonium phosphates with irrigation water. Spray applications of similar salts are usually not recommended because of the large number needed to satisfy crop requirements.
119 88 Agronomic Handbook: Management of Crops, Soils, and Their Fertility Potassium (K) Deficiency Symptoms Unthrifty, low-yielding crops: Potassium-deficient oat plants are stunted and exhibit sprawling growth. Foliage is green with brownish-yellow lesions. Stems are short and stout and leaf sheaths often develop brownish lesions similar to those on the leaf laminae. As affected leaves die, plants develop a three-tone appearance. Younger leaves are green, middle leaves are green with yellow to bronze areas, and older leaves are brown and dead. Tiller production may be unaffected but when a deficiency persists, many tiers die before maturity. Because of the severe stunting and deaths of tillers, K deficiency greatly reduces forage and grain yields. Bronze-yellow older leaves: Because K is readily transferred from old to young leaves when a deficiency occurs, symptoms appear first and are more severe on old leaves, working up the plant to younger leaves if it persists. Affected leaves turn pale green and develop bronze-yellow chlorosis in their mid-sections between the margins and mid-veins. The chlorosis rapidly extends toward the tips until two thirds of the leaves turn bronze-yellow. In some varieties, the chlorosis may be orangered. Necrotic lesions on older leaves: Grey-brown necrotic lesions develop in the chlorotic tissues of old leaves, usually beginning in the mid-sections between the mid-veins and margins. Eventually the lesions join and affect the mid-veins, causing the leaves to bend downward. Similar lesions develop on the sheaths of old leaves. Affected leaves die, turn brown, and form thatches of dead leaves at the plant bases Problem Soils Potassium deficiency is likely to occur in: Soils whose organic matter was depleted by many years of cropping, and particularly where hay was cut Sandy soils formed from parent material low in K Light textured soils whose K has been leached by rainfall Correcting Deficiency Potassium deficiency is corrected by applying potassium nitrate, sulfate, or chloride to the soil at or before sowing. Yield depends on the amount of water-soluble and exchangeable K in the soil. Tests can estimate the amount of available K in the soil and predict the amount of fertilizer required. The best prediction can be obtained by seeking advice on fertilizer practices used on similar soils in the district. Potassium deficiency in existing crops can be corrected by applying soluble salts such as potassium sulfate, chloride, or nitrate with irrigation water. The foliar application of similar salts is usually not recommended because of the large number of sprays required Sulfur (S) Deficiency Symptoms Unthrifty, low-yielding crops: Sulfur deficiency leads to stunted plants with yellow to pale green foliage. In young crops, the whole plant is often pale green. In more mature crops, young leaves are pale green to yellow, giving the field a distinct yellow appearance. Tiller production is severely reduced and heads are smaller than normal. As a result, both forage and grain yields are depressed. Forage and grain from affected plants are usually low in protein because S deficiency depresses the conversion of N into protein. Yellow or white younger leaves: Because S is not readily transferred from old to young leaves when a deficiency occurs, the first and more severe symptoms occur on younger leaves. Symptoms begin with the youngest leaves turning pale green, then pale yellow. The chlorosis is not confined
120 Grain Crops 89 to the interveinal areas. Entire leaves take on the same color. Necrosis (death) of tissues is rare even when leaves turn pale yellow. Old leaves usually remain dark green but may become pale green if the deficiency persists or becomes severe. When a deficiency is very severe, old leaves may develop orange-red margins. Purple streaked stems: Stems are short and thin. Leaf sheaths are usually pale green, but purple streaks often develop when a deficiency is very severe Problem Soils Sulfur deficiency is likely to occur in: Soils whose organic matter has been depleted by many years of cropping Soils formed from parent material low in S (for example, some volcanic rocks and ash) Acid sandy soils whose sulfates have been leached Correcting Deficiency Soil dressings of any S fertilizer will correct deficiencies. Elemental S (flowers of sulfur) may be broadcast onto the soil and thoroughly mixed in, about 4 months before sowing. Gypsum (calcium sulfate) is another useful source of S. Tests can estimate the amount of available sulfate in a soil before sowing and predict the amount of fertilizer required. The best prediction can be obtained by seeking advice on fertilizer practices used on similar soils in the district. Sulfur deficiency in existing crops can be corrected by applying soluble sulfate salts such as magnesium, ammonium, or potassium sulfate in irrigation water. Foliar sprays of similar salts are usually not recommended because of the large number of applications needed Zinc (Zn) Deficiency Symptoms Patchy, low-yielding crops: Zinc deficiency often causes patchy growth. In Zn-poor areas, plants are stunted and have pale green foliage and yellow or orange-red leaf tips. Tiller production may not be affected, but if a deficiency is severe or persists, many tillers die before producing heads. As a result, forage and grain yields can be reduced greatly. Yellow, orange, purple, or black tips on older leaves: Zinc is only partly mobile in oats and symptoms appear first and are more severe on middle and old leaves, working up the plant to younger leaves if deficiency persists. The youngest leaves usually remain green and appear healthy. Initially, middle and older leaves turn pale green and develop pale yellow chlorosis between the margins and mid-veins at the tips. As the deficiency progresses, the chlorosis becomes more extensive and general, turning dark yellow, orange-red, or purple. Brown necrotic lesions appear in the chlorotic tissues and increase in size until the leaf tips die, often turning red-brown to black. Frequently, the basal portions of leaves remain green while the mid-sections are chlorotic and the leaf tips turn dark brown or black. Crowded leaves: When a deficiency is very severe, stems are short and the youngest leaves sometimes have difficulty emerging fully from the sheaths of older leaves. This leads to the crowding of leaves on top of the short stems Problem Soils Zinc deficiency is likely to occur in: Calcareous soils in which the availability of Zn is depressed Leached sandy soils whose total Zn is low Leveled soils in which Zn-deficient subsoils may be exposed on the surface Soils in which heavy, frequent applications of phosphate fertilizers may have reduced Zn uptake
121 90 Agronomic Handbook: Management of Crops, Soils, and Their Fertility Correcting Deficiency Foliage and soil applications of Zn salts have been used to correct deficiencies. Soil dressings of zinc chelates, sulfates, or oxides should be broadcast and mixed into the soil 2 to 3 months before sowing. While soil applications have residual effects lasting 6 to 8 years, foliar sprays have no residual effects and fresh applications must be made to each crop. Best results are obtained when two sprays of a 0.5 to 1% solution of zinc sulfate heptahydrate (0.5 to 1 kg zinc salt per 100 L water per ha) are applied about 2 weeks apart, the first sprayed 2 to 3 weeks after seedling emergence. Tests can estimate the amount of available Zn in the soil and predict whether fertilizer is needed. The best prediction can be obtained by seeking advice on fertilizer practices used on similar soils in the district Manganese Toxicity Toxicity Symptoms Unthrifty, low-yielding crops: Manganese toxicity causes stunted plants to produce stout stems and dull green foliage. If the toxicity becomes severe or persists, the leaves develop bronzeorange areas. Tiller production is usually not affected initially, but some may die if the toxicity persists. Mature tillers often produce small heads. As a result, forage and grain yields can be greatly reduced. Dull-colored leaves: Excess Mn accumulates in old leaves. Hence symptoms appear first and are more severe on old leaves, working up the plant to younger leaves if the toxicity persists. All leaves present a dull appearance, ranging from dull green in young leaves to dull bronze-green in old leaves. If the toxicity persists, entire plants appear dull bronze-green. Chlorosis on older leaves: Bronze-orange chlorosis develops on old leaves between the margins and the mid-veins near the points of attachment of the laminae and leaf sheaths. The chlorosis advances up the leaves between the margins and mid-veins, eventually affecting whole leaves. As the concentration of Mn becomes toxic, affected tissues die and turn brown. Broken leaves: When the toxicity is severe, the mid-veins die near the points of attachment of the laminae and leaf sheaths, thus weakening the leaves and allowing the laminae to bend down and lie on the soil Problem Soils Manganese toxicity is likely to occur in: Strongly acid soils that have increased solubility of Mn Waterlogged soils in which poor aeration causes unavailable manganic (Mn 3+ ) ions to reduce to manganous (Mn 2+ ) ions that can be taken up by plants Correcting Toxicity Manganese toxicity is usually corrected by adopting management practices that reduce the level of soluble Mn in the soil. Liming of strongly acid soils and drainage of waterlogged soils are effective measures. If soils have been over-fertilized with Mn, heavy leaching with low Mn irrigation water or mulching with organic materials removes soluble Mn from the root zones of plants. Acidreacting fertilizers should not be used on acid soils high in Mn. Care should be taken also when applying Mn fertilizers to prevent over-fertilization Salinity Salinity Symptoms Unthrifty, low-yielding crops: When sodium chloride (NaCl) levels in soils or irrigation water become excessive, oat plants become stunted and develop harsh, droughty appearance. The foliage
122 Grain Crops 91 turns dull, bluish yellow-green. While tillering may not be affected initially, many tillers die if the toxicity persists. Yields of both forage and grain are reduced. Wilted appearance: High levels of NaCl in soil make it difficult for plants to take up water. Hence, they develop a harsh, droughty appearance even when ample water is available. They often wilt on hot days and recover overnight. Dull-colored leaves: Sodium chloride is carried in the transpiration stream to the margins and tips of leaves. Because older leaves had more time to accumulate NaCl, their symptoms are more severe. The foliage has a dull appearance, ranging from dull green in young leaves to dull, bluish yellow-green in old leaves. If the toxicity persists, the whole plant develops a bluish-green color. Yellow tips on older leaves: As NaCl accumulates in the leaf tips, it eventually reaches concentrations that kill tissues. Dull yellow chlorosis develops on the tips of old leaves, followed by yellow-grey necrosis when the tissues die. The chlorosis and necrosis advance down the margins until entire leaves are dead Problem Soils Sodium chloride toxicity is more likely to occur in: Saline soils formed from salt water sediments Previously fertile soils flooded or heavily irrigated with water containing high concentrations of NaCl Correcting Toxicity Leaching with good quality irrigation water is the most effective means of removing excess Na or Cl from the soil. The water table may have to be lowered. Permeable soils such as well structured sandy soils are often easily reclaimed, but the problem is more difficult in less permeable soils (for example, poorly structured heavy clays). If exchangeable Na in the soil is high, reclamation involves replacement of the adsorbed Na with Ca by applying gypsum (calcium sulfate) and then leaching the dissolved Na and Cl beyond the rooting depths of the plants. If irrigation water is to be used to leach the Na, its quality should be checked before use to make sure it is not saline. Where excess NaCl cannot be wholly corrected by soil leaching, a more tolerant species may have to be grown WEIGHTS AND MEASURES The net weight of 1 bu of oat grain is approximately 32 lb or 14.5 kg. TABLE 2.71 Crop Seeds/Pound, Weight/Bushel, and Germination Time Seeds/lb (1,000) Seeds/g (number) Weight/bu Germination Time (days) REFERENCES 1. Grundon, N.J., Hungry Crops: A Guide to Nutrient Deficiencies in Field Crops, 1987, Queensland Department of Primary Industries, Brisbane, Australia.
123 92 Agronomic Handbook: Management of Crops, Soils, and Their Fertility 2.5 RICE (Oryza sativa L.) INTRODUCTION Rice belongs to the Gramineae grass family. It is known as riz in France, arroz in Spain, riso in Italy, and reirs in Germany. It is a vital food crop because half the world s population eats rice as a main part of their diets. Rice ranks second only to wheat in terms of area harvested. It provides more calories per hectare than any other cereal grain. Most people who depend heavily on rice live in Asia. Asian farmers grow about 90% of the world s rice. It grows during the wet season that starts in June or July. Rice grows best in warm temperatures with plentiful moisture from rainfall or irrigation, and is most frequently grown in valley and river deltas. It grows in more than 100 countries. Crops cover about 360 million acres and production is about 580 million short tons. The three Asian rice groups are Indica, grown in India and other tropical regions; Japonica, cultivated in cooler Asian regions (China, Japan, and Korea), Europe, North America, and Australia; and Javanica, grown in Indonesia. Rice is also classified by the method of culture. Lowland rice is grown in flat fields that are flooded by irrigation and in enclosed fields called paddies. Upland rice depends on rainfall for moisture and accounts for only 6% of all rice grown. Highest grain yields for irrigated rice range from 7 to 10 tons per ha in dry seasons when well irrigated and 5 to 8 tons per ha in wet seasons. Rain-fed rice yields an average of 1 ton per ha. Each ripened rice panicle contains 80 to 120 grains. Evidence indicates that rice was cultivated about 5,000 B.C. in southern China and northern Thailand, Laos, and Vietnam. Cultivation later spread to northern China, Japan, and Korea, west to India, and south to Indonesia. Rice reached the American Colonies during the 1600s, and was grown commercially in South Carolina as early as Rice production moved west. By 1900, about 70% of the rice grown in the U.S. was from Louisiana. It became an established crop in California around the same time. In the 1960s, the worldwide Green Revolution brought, through plant breeding and production trials, higher yielding varieties that had shorter, sturdier stems and responded to fertilization. The International Rice Institute, established in 1960 and located in the Philippines, is devoted to improving cultivation. It conducts research and provides extension services in an effort to increase food production throughout the developing world CLASSIFICATION AND TERMINOLOGY Classes Classes are based mainly on type of rice. All class designations are explained in the Definitions section. The four main classes of rice are: 1. Long-grain rice 2. Medium-grain rice 3. Short-grain rice 4. Mixed rice The following additional classes apply only to milled rice and are based on the percentages of whole kernels and broken kernels of different sizes they contain: 1. Second head milled rice 2. Screenings milled rice 3. Brewers milled rice
124 Grain Crops Types Rice types are based on the length:width ratios of unbroken kernels of rice and the widths, thicknesses, and shapes of broken kernels, as set forth in the Rice Inspection Handbook. 1 All type designations are explained in the Definitions section. The types are: 1. Long grain 2. Medium grain 3. Short grain Special Grades A special grade designation is supplemental to the grade assigned and includes the following terms: coated, granulated, parboiled, parboiled light, parboiled dark, and/or undermilled. 2 Special grades for milled rice are: Coated milled rice Granulated brewers milled rice Parboiled milled rice Undermilled milled rice Definitions 2 Brewers milled rice Milled rice containing not more than 25% whole kernels and that does not meet the kernel size requirements of the second head milled rice or screenings milled rice class. Brown rice for processing Rice consisting of more than 50% kernels of brown rice and is intended for processing to milled rice. Coated milled rice Special grade of rice that is coated in whole or in part with safe and suitable substances according to commercially accepted practice. Damaged kernels Whole or large broken kernels that are distinctly discolored or damaged by water, insects, heat, or other means, and whole or large broken kernels of parboiled rice in nonparboiled rice. Heat-damaged kernels (see below) shall not function as damaged kernels. Granulated brewers milled rice Special grade of milled rice that is crushed or granulated so that 95% or more will pass through a 5 sieve, 70% or more will pass through a 4 sieve, and not more than 15% will pass through a 2 1/2 sieve. Heat-damaged kernels Whole or large broken kernels of rice that are materially discolored and damaged as a result of heating, and whole or large broken kernels of parboiled rice in nonparboiled rice that are as dark as or darker than the interpretive line for heatdamaged kernels. Long-grain brown rice for processing Brown rice for processing that contains more than 25% whole kernels of brown rice and not more than 10% whole or broken kernels of mediumor short-grain rice. Long-grain milled rice Milled rice that contains more than 25% whole kernels of milled rice; in U.S. Nos. 1 through 4, not more than 10% whole or broken kernels of medium- or short-grain rice. U.S. Nos. 5 and 6 long-grain milled rice shall contain not more than 10% whole kernels of medium- or short-grain milled rice. Broken kernels do not apply. Long-grain rough rice Rough rice that contains more than 25% whole kernels and after milling to a well-milled degree, contains not more than 10% whole or large broken kernels of medium- or short-grain rice.
125 94 Agronomic Handbook: Management of Crops, Soils, and Their Fertility Medium-grain brown rice for processing Brown rice for processing that contains more than 25% whole kernels of brown rice and not more than 10% whole or broken kernels of long-grain or short-grain rice. Medium-grain milled rice Milled rice that contains more than 25% whole kernels of milled rice; in U.S. Nos. 1 through 4, not more than 10% whole or broken kernels of long-grain rice or whole kernels of short-grain rice. U.S. Nos. 5 and 6 medium-grain milled rice shall contain not more than 10% whole kernels of long- or short-grain milled rice. Broken kernels do not apply. Medium-grain rough rice Rough rice that contains more than 25% whole kernels and after milling to a well-milled degree, contains not more than 10% whole or large broken kernels of long-grain rice or whole kernels of short-grain rice. Milled rice Whole or broken kernels from which the hulls or at least the outer bran layers have been removed; contains not more than 10% seeds, paddy kernels, or foreign material, either singly or combined. Milling yield Estimate of the quantity of whole kernels and total milled rice (whole and broken kernels combined) produced in the milling of rough rice to a well-milled degree. Mixed brown rice for processing Brown rice for processing that contains more than 25% whole kernels of brown rice and more than 10% other types (see below). Mixed milled rice Milled rice that contains more than 25% whole kernels of milled rice and more than 10% other types. U.S. Nos. 5 and 6 mixed milled rice shall contain more than 10% whole kernels of other types. Broken kernels do not apply. Mixed rough rice Rough rice that contains more than 25% whole kernels; after milling to a well-milled degree, contains more than 10% other types (see below). Objectionable seeds Seeds other than rice, except seeds of Echinochloa crusgalli (commonly known as barnyard grass, water grass, and Japanese millet). Other types (A) Whole kernels of (i) long grain rice in medium- or short-grain rice, (ii) medium-grain rice in long- or short-grain rice, (iii) short-grain rice in long- or mediumgrain rice; (B) large broken kernels of long grain rice in medium- or short-grain rice and large broken kernels of medium- or short-grain rice in long-grain rice. Large broken kernels of medium-grain rice in short-grain rice and large broken kernels of short-grain rice in medium-grain rice shall not be considered other types. Paddy kernels Whole or broken unhulled kernels. Parboiled milled rice Special grade of milled rice in which the starch has been gelatinized by soaking, steaming, and drying. U.S. Nos. 1 through 6 shall contain not more than 10% ungelatinized kernels. U.S. Nos. 1 and 2 shall contain not more than 0.1%. U.S. Nos. 3 and 4 shall contain not more than 0.2%. U.S. Nos. 5 and 6 shall contain not more than 0.5% nonparboiled rice. If the rice is (A) not distinctly colored by parboiling, it shall be considered parboiled light; (B) distinctly but not materially colored by parboiling, it shall be considered parboiled; (3) materially colored by parboiling, it shall be considered parboiled dark. Color levels for parboiled light, parboiled, and parboiled dark shall be in accordance with interpretive line samples for parboiled rice. The maximum limits for chalky kernels, heat-damaged kernels, kernels damaged by heat, and color requirements are not applicable to the parboiled milled special grade. Red rice Whole or large broken kernels that contain appreciable amounts of red bran. Rough rice Consists of 50% or more paddy kernels. Screenings milled rice Milled rice that contains (A) not more than (i) 25% whole kernels, (ii) 10% broken kernels removed by a 5 plate, and (iii) 0.2% broken kernels passing through a 4 sieve (southern production); or (B) not more than (i) 25% whole kernels, (ii) 15% broken kernels passing through a 5 1/2 sieve, (iii) more than 50% broken kernels passing through a 6 1/2 sieve, and (iv) 10% broken kernels passing through a 6 sieve (western production).
126 Grain Crops 95 Second head milled rice Milled rice that contains (A) not more than (i) 25% whole kernels, (ii) 7% broken kernels removed by a 6 plate, (iii) 0.4% broken kernels removed by a 5 plate, and (iv) 0.05% broken kernels passing through a 4 sieve (southern production); or (B) not more than (i) 25% whole kernels, (ii) 50% broken kernels passing through a 6 1/2 sieve, and (iii) 10% broken kernels. Seeds Whole or broken seeds of any plant other than rice. Short-grain brown rice for processing Brown rice for processing that contains more than 25% whole kernels of brown rice and not more than 10% whole or broken kernels of long-grain rice or whole kernels of medium-grain rice. Short-grain milled rice Milled rice that contains more than 25% whole kernels of milled rice; in U.S. Nos. 1 through 4, not more than 10% whole or broken kernels of long-grain rice or whole kernels of medium-grain rice. U.S. Nos. 5 and 6 short-grain milled rice shall contain not more than 10% whole kernels of long- or medium-grain milled rice. Broken kernels do not apply. Short-grain rough rice Rough rice that contains more than 25% whole kernels; after milling to a well-milled degree, contains not more than 10% whole or large broken kernels of long-grain rice or whole kernels of medium-grain rice. Smutty kernels Whole or broken kernels of rice that are distinctly infected by smut. Undermilled milled rice Special grade of milled rice that does not meet the requirements for well milled, reasonably well milled, or lightly milled rice, U.S. Nos. 1 and 2 shall contain not more than 5%, U.S. Nos. 3 and 4 shall contain not more than 5%, U.S. No. 5 shall contain not more than 10%, and U.S. No. 6 shall contain not more than 15% well milled kernels. U.S. No. 5 shall contain not more than 10% red rice and damaged kernels (singly or combined), and in no case, more than 6% damaged kernels. Color and milling requirements are not applicable to the undermilled milled rice special grade. Ungelatinized kernels Whole or large broken kernels of parboiled rice with distinct white or chalky areas resulting from incomplete gelatinization of starch. Whole kernels Unbroken kernels of rice that comprise at least 3/4 of an unbroken kernel. Whole and large broken kernels Rice (including seeds) that (A) passes over a 6 plate (southern production) or (B) remains on top of a 6 sieve (western production) Glossary 2 Adventitious Plant structure arising from an unusual place. Anaerobic Without oxygen. Auricle Narrow extension of the collar in grasses; may completely clasp the culm; may be absent. Blank Individual floret of rice that produces no grain. Boot Growth stage identified by the bulge within the flag leaf sheath caused by the enlarging panicle. Borrow pit Depression on each side of a rice levee created when soil is embanked. Brewers Smallest size of broken milled rice, less than 1/4 of a whole kernel. Broken Milled rice containing less than 3/4 whole kernels; includes second heads, screenings, and brewers. Broken yield Broken grain resulting from milling 100 lb of rough rice; equals total mill yield minus head yield. Brown rice Rice with the hull removed; bran and embryo remain. Carbohydrate Organic chemical composed of carbon (C), hydrogen (H), and oxygen (O); photosynthetically produced sugar and starch found in plants. Chlorosis Yellowing of normally green tissue resulting from chlorophyll destruction or failure to develop.
127 96 Agronomic Handbook: Management of Crops, Soils, and Their Fertility Coleoptile Sheath-like structure enclosing the shoot of a grass seeding for a short time after germination. Collar Juncture of leaf blade and sheath; may be used to identify grass species. Commingled rice Blend of rice of similar grain type, quality, and grade. Culm Stem of a grass plant; rice plants have main culms and tiller culms. Dough stage Stage of maturity when a grain develops from a thick liquid to a soft dough consistency. Embryo Microscopic plant attached to the endosperm of a seed; often called the germ. Endosperm Stored food, primarily a carbohydrate in the form of starch, comprising most of a monocot seed such as rice; the endosperm serves as food for the embryo and developing seedling during germination and early growth. Flag leaf Topmost leaf of the rice plant immediately below the panicle. Floret Grass flower, including the lemma, palea, and sex organs. Green rice High moisture (18.5 to 22.5%) rough rice. Hailing Removal of the lemma and palea (husks or hulls) from rough rice. Head milling yield Pounds of head rice milled from 100 lb of rough rice. Head rice Milled rice kernel comprising more than 3/4 of the whole kernel. Hull Lemma and palea parts of rough rice that are usually waste products but may be used in rice millfeed and as filler in feed products. Inflorescence Flowering structure of a plant. Instant rice Milled rice that has been cooked, cooled, and dried under controlled conditions and packaged in dehydrated form; requires little preparation time before eating; enriched with thianline, riboflavin, niacin, and iron. Internode Area of a stem between two nodes. Jointing Internode elongation in grasses. Lemma The larger of two structures enclosing a rice seed; with the palea, it forms the hard outer covering of rough rice. Ligule Short membranous projection on the inner side of a leaf blade at the junction of blade and sheath in many grasses. Long-grain rice Long slender rice; when milled, measures typically from 0.26 to 0.28 in. (6.7 to 7.0 mm) or longer; has length:width ratio from 3.27 to 3.41:1. Main culm or shoot Stem or above-ground portion of a plant originating directly from seed. Medium-grain rice Rice that, when milled, measures typically from 0.22 to 0.23 inches (5.5 to 5.8 mm); has length:width ratio of 2.09 to 2.49:1. Milk stage Early stage of grain development when milky liquid fills the grain. Milled rice Grain with husks, bran, and germ removed. Milling Converting rough rice into milled or brown rice. Necrotic Dead. Nematode Unsegmented, round, thread-like, usually microscopic worm that may be free-living or parasitic on plants and animals; soil-inhibiting nematodes may be parasitic on rice. Node Solid portion of the rice stem from which leaves arise. Paddy Subdivision of a rice field; bounded by levees. Palea The smaller of two enclosing structures forming a hard outer covering of unmilled rice. Panicle Many-branched inflorescence composed of few to many spikelets containing one to several florets. Parboiled rice Rough rice steeped in warm water under pressure, steamed, dried, and milled; improves head milling yield. Pathogen Living organism that causes infectious disease. Precooked rice Milled rice processed to make it cook quickly. Processed rice Rice used in breakfast cereals, soups, baby foods, packaged mixes, etc.
128 Grain Crops 97 Ratoon crop Second crop; regrowth from stubble of a first crop that grew from seed. Residue management Management of rice straw and stubble after harvest; residue of previous crop before planting. Rice bran Outer layer of the caryopsis just beneath the hull containing the outer bran layer and parts of the germ; rich in protein and vitamin B; used as livestock feed and in vitamin concentrates. Rice polish Layer composed of the inner white bran and perhaps aleurone cells that are high in protein and fat; used in livestock feed and baby food; sometimes removed at the final stage of milling. Rough or paddy rice Rice grains with hulls but without stalk parts; consists of 50% or more whole or broken unhulled kernels. Screenings Broken milled rice kernels containing less than 1/2 and more than 1/4 of the whole kernel. Second heads Broken milled rice kernels containing more than 1/2 and less than 3/4 of the whole kernel. Senescence Stage of growth from maturity to death. Sheath Portion of a complete grass leaf below the collar that may enclose the stem. Shoot Above-ground portion of a plant; in rice, the portion above the crown. Short-grain rice Rice that is almost round and when milled measures typically from 0.20 to 0.22 inches (5.2 to 5.4 mm); has a length:width ratio of 1.66 to 1.77:1. Spikelet Subdivision of a spike consisting of one to several flowers. Tiller Vegetative shoot, not the main culm. Total milling yield Pounds of heads, second heads, brewers, and screenings milled from 100 lb rough rice. White rice Kernel remaining after hull, bran layer, and germ are removed; includes head rice and brokens. Y leaf Most recently matured leaf PRODUCTION STATISTICS TABLE 2.72 Leading Rice-Growing Countries, Country 1,000 Short Tons China 206,335 India 121,418 Indonesia 31,740 Bangladesh 30,451 Vietnam 22,337 Thailand 21,708 Myanmar 16,708 Japan 12,865 Brazil 10,908 Philippines 10,410 Source: United Nations Food and Agriculture Organization, Rome.
129 98 Agronomic Handbook: Management of Crops, Soils, and Their Fertility TABLE 2.73 Milled Rice: Acreage, Yield, and Production in Continents and Specified Countries, 2000 a Location Harvested Area (1,000 ha) Yield (metric tons/ha) Production (1,000 metric tons) Continent North America 1, ,802 South America 5, ,122 Central America Caribbean European Union ,725 Eastern Europe Soviet Union Middle East ,930 Africa 7, ,581 Asia 137, ,376 Oceania Country India 44, ,480 China 31, ,936 Indonesia 11, ,445 Bangladesh 10, ,530 Thailand 10, ,500 Vietnam 7, ,750 Myanmar 5, ,860 Philippines 3, ,772 Brazil 3, ,843 Pakistan 2, ,156 Cambodia 2, ,400 World Total 154, ,200 a Crop yield beginning August 1. Source: Estimate and Crop Assessment Division, Foreign Agriculture Service, Washington, D.C.
130 Grain Crops 99 TABLE 2.74 Rice by Length of Grain: U.S. Acreage, Yield, and Production, State Area Harvested (1,000 acres) Yield (lb/acre) Production (1,000 cwt) Long Grain Arkansas 1,175 6,060 71,205 California 5 7, Louisiana 455 5,080 23,114 Mississippi 218 5,900 12,862 Missouri 173 5,700 9,861 Texas 209 6,740 14,087 Medium Grain Arkansas 233 6,300 14,679 California 513 8,000 41,040 Louisiana 25 5,150 1,288 Missouri 1 5, Texas 5 5, Short Grain Arkansas 2 6, California 30 7,300 2,190 Source: Crops Branch, National Agriculture Security Service, Washington, D.C., TABLE 2.75 Rough Rice: U.S. Acreage, Yield, and Production, Year Area Harvested (1,000 acres) Yield (lb/acre) Production (1,000 cwt) ,761 5, , ,132 5, , ,833 5, , ,316 5, , ,093 5, , ,604 6, , ,103 5, , ,257 5, , ,512 5, , ,044 6, ,113 Source: Crops Branch, National Agriculture Security Service, Washington, D.C., 2001.
131 100 Agronomic Handbook: Management of Crops, Soils, and Their Fertility TABLE 2.76 Rice and Milled Rice Products: U.S. Total and Per Capita Civilian Consumption, Marketing Year (August 1 July 1) Total Consumed (cwt) Per Capita Consumption (lb) a Preliminary a Source: Economics Research Service, Washington, D.C., All figures are estimates based on data from private industry sources, the U.S. Department of Commerce, the Internal Revenue Service, and other government agencies. FIGURE 2.13 Rough rice: Production and value of production,
132 Grain Crops GRAIN QUALITY TABLE 2.77 Food Value of White Rice Component % Carbohydrate 80.4 Water 12.0 Protein 6.7 Ash 0.5 Fat 0.4 TABLE 2.78 Nutritive Value of Whole Grain Component Value Calories/100 g 363 Protein,% 6.7 Fat,% 0.2 Total calcium, mg/lb 24 Total phosphorus, mg/lb 94 Total potassium, mg/lb 92 Carbohydrates,% NUTRIENT ELEMENT DEFICIENCIES TABLE 2.79 Nutrient Element Deficiency Symptoms and Effects on Rice Growth Nutrient Element Nitrogen Phosphorus Potassium Calcium Magnesium Sulfur Silicon Boron Copper Iron Zinc Symptoms and Effects on Growth Stunted, yellowish plants; yellowish green older leaves or whole plants Stunted dark green plans with erect leaves and reduced tillering Dark green plants with yellowish brown leaf margins or dark brown necrotic spots first appearing on the tips of older leaves Chlorotic-necrotic split leaves or rolled tips on younger leaves Orange-yellow interveinal chlorosis on older leaves Pale green plants; light green-colored young leaves Soft, droopy leaves and culms White, rolled tips of young leaves Chlorotic streaks and bluish green leaves that become chlorotic near the tips Interveinal yellowing and chlorosis Dusty brown spots on upper leaves of stunted plants appearing 2 to 4 weeks after transplanting Source: Rice: Nutrient Disorders and Nutrient Management, 2000, Potash & Phosphate Institute, Norcross, GA. TABLE 2.80 Element Toxicity Symptoms and Effects on Growth Element Aluminum Boron Iron Manganese Sulfide Symptoms and Effect on Growth Orange-yellow interveinal chlorosis on leaves; poor growth, stunted plants Brownish leaf tips and dark brown elliptical spots on leaves Tiny brown spots on lower leaves starting from the tips or whole leaves colored orange-yellow to brown; black coating on root surfaces Yellowish brown spots between leaf veins, extending to interveinal areas Interveinal chlorosis of emerging leaves; coarse, sparse, and blackened roots Source: Rice: Nutrient Disorders and Nutrient Management, 2000, Potash & Phosphate Institute, Norcross, GA.
133 102 Agronomic Handbook: Management of Crops, Soils, and Their Fertility TABLE 2.81 Silicon Fertilizer Sources Substance Formula Silicon Content Comment Blast furnace slag CaSiO 3, MgSiO % Si, 25 32% Ca, 2 4% Mg Convertor slag CaSiO 3, MgSiO % Si, 26 46% Ca, 0.5 9% Mg Silico-manganese slag CaSiO 3, MnSiO % Si, 21 25% Ca, 0.5 2% Mn Fused magnesium 9% Si, 9% P, 7 9% Mg Granular phosphate Calcium silicate Si, Ca, Mg 14 19% Si, 1 4% Mg Granular, slow-release fertilizer Potassium silicate K, Si 14% Si, 17% K, 2.5% Mg Granular, slow-release fertilizer Source: Rice: Nutrient Disorders and Nutrient Management, 2000, Potash & Phosphate Institute, Norcross, GA FERTILIZER AND NUTRIENT ELEMENT STATUS TABLE 2.82 General Soil- and Season-Specific Fertilizer Recommendations (kg/ha) for Irrigated Rice Target Yield Dry Season (Y max ~ 10 tons/ha) Wet Season (Y max ~7.5 tons/ha) N P K N P K Low Soil Fertility a a Yield target not applicable b Medium Soil Fertility 4 0 a 8 12 a a 0 a 8 12 a a a a a a Yield target not applicable b High Soil Fertility 4 0 a 8 12 a a 0a 8 12 a a 5 0 a a a a a a a a a a a Yield target not applicable a Indigenous supply of P and K sufficient to achieve this yield level with smaller or no fertilizer application. For N, this is a situation where input from other sources such as biological N 2 fixation is large enough to sustain the INS at this level. For P and K, we recommend applying amounts of P and K at least equivalent to the net P and K removal from the field with grain and straw to maintain soil P and K supplies. The values given assume a replenishment dose equivalent to P removal of 2 3 kg P/ha and K removal of 3 10 kg K/ha/ton of grain yield. The smaller value applies to systems in which most of the P and K in straw remains in the field, either incorporated or burned. The larger value applies to systems with large removals of crop residues. b Caution: N dose recommended is very large and could cause lodging and increased pest incidence. Source: QUBFTS model modified for rice. For each yield target, the model was run using the INS, IPS, and IKS assumed for each soil type and the ranges of recovery effciencies of N, P, and K specified above.
134 Grain Crops 103 TABLE 2.83 Effect of Nutrient Availability on the Removal of N, P, and K (kg Nutrient/ton of Rice Grain) for the Linear Part of the Relationship of Grain Yield and Nutrient Uptake (<80% of Potential Yield) Nutrient Element Availability Nitrogen Phosphorus Potassium Maximum nutrient limitation Nutrient limitation Nutritional optimum Nutrient surplus Maximum nutrient surplus Source: Rice: Nutrient Disorders and Nutrient Management, 2000, Potash & Phosphate Institute, Norcross, GA. TABLE 2.84 Optimal Internal Efficiency (kg/grain/kg Element) of N, P, and K in Irrigated Rice N P K Source: Rice: Nutrient Disorders and Nutrient Management, 2000, Potash & Phosphate Institute, Norcross, GA. TABLE 2.85 Uptake of Major Elements and Micronutrients for 7.8 Tons/Acre Crop Major Elements kg Nitrogen 125 Phosphorus as phosphate 67 Potassium as potash 130 Calcium 23 Magnesium 16 Sulfur 21 Micronutrients g Boron 60 Copper 20 Iron 810 Manganese 600 Molybdenum 2 Zinc 215 Source: International Soil Fertility Manual Potash & Phosphate Institute, Norcross, GA.
135 104 Agronomic Handbook: Management of Crops, Soils, and Their Fertility TABLE 2.86 Nitrogen, Phosphorus, and Potassium Uptake and Content in Modern Rice Varieties Plant Part Typical Observed Range a Observed Average b kg N uptake/ton grain yield Grain + straw Grain Straw % N content Grain Straw Unfilled spikelets kg P uptake/ton grain yield Grain + straw Grain Straw % P content Grain Straw Unfilled spikelets kg K uptake/ton grain yield Grain + straw Grain Straw % K content Grain Straw Unfilled spikelets a 25 75% interquartile range of farmers fields and field experiments in Asia (n = 1,300). b Median of farmers fields and field experiments in Asia (n = 1,300). Source: Rice: Nutrient Disorders and Nutrient Management, 2000, Potash & Phosphate Institute, Norcross, GA.
136 Grain Crops NUTRIENT ELEMENT SUFFICIENCY TABLE 2.87 Optimal Ranges and Critical Levels for Occurrence of Mineral Deficiencies or Toxicities in Tissue Nutrient Element Growth Plant Stage Plant Part Optimum Range Critical Level for Deficiency Critical Level for Excess or Toxicity % Nitrogen Tillering-PI Y leaf <2.5 >4.5 Flowering Flag leaf <2.0 Maturity Straw Phosphorus Tillering-PI Y leaf <0.10 >0.50 Flowering Flag leaf <0.18 Maturity Straw <0.06 Potassium Tillering-PI Y leaf <1.5 >3.0 Flowering Flag leaf <1.2 Maturity Straw <1.2 Calcium Tillering Y leaf <0.15 >0.7 Tillering-PI Shoot <0.15 Maturity Straw <0.15 Magnesium Tillering-PI Y leaf <0.12 >0.50 Tillering-PI Shoot <0.13 Maturity Straw <0.10 Sulfur Tillering Y leaf <0.15 Tillering Shoot <0.11 Flowering Flag leaf <0.10 Flowering Shoot <0.07 Maturity Straw <0.06 Silicon Tillering Y leaf <5 Maturity Straw 8 10 <5 mg/kg Boron Tillering Y leaf 6 15 <5 >100 Maturity Straw <3 >100 Copper Tillering Y leaf 7 15 <5 >25 Maturity Straw <6 >30 Iron Tillering Y leaf <70 >300 Tillering Shoot <50 Manganese Tillering Y leaf <40 >800 Tillering Shoot <20 Zinc Tillering-PI Y leaf <20 >500 Tillering Shoot <10 >500 Aluminum Tillering Shoot <5 >100 Note: PI = panicle initiation. Source: Rice: Nutrient Disorders and Nutrient Management, 2000, Potash & Phosphate Institute, Norcross, GA.
137 106 Agronomic Handbook: Management of Crops, Soils, and Their Fertility TABLE 2.88 Nutrient Element Sufficiency Ranges Nutrient Element Panicle Initiation Sufficiency Range Maximum Tillering % Nitrogen Phosphorus Potassium Calcium Magnesium ppm Boron Copper Iron Manganese Zinc Note: Sampling procedure = 25 mature leaves from new growth. Source: Plant Analysis Handbook II: A Practical Sampling, Preparation, Analysis, and Interpretation Guide, 1996, MicroMacro Publishing, Athens, GA. TABLE 2.89 Typical Symptoms Associated with Most Common Deficiencies Nutrient Element Mobility Symptoms Nitrogen Mobile Older leaves become pale green to yellow; younger leaves greener and may be narrow, short, and erect; plants are stunted with few tillers Phosphorus Mobile Leaves become dark green to purple, narrow, short and erect; later become necrotic; plants are stunted with few tillers Potassium Mobile Leaves become dark green followed by interveinal chlorosis and small necrotic spots coalescing from tips; leaves are shortened and slightly smaller Sulfur Mobile Similar to N Iron Immobile Starts as interveinal chlorosis on young leaves; entire leaves become pale yellow to whitish; older leaves remain green Zinc Immobile Midribs of younger leaves turn yellow and droop, stunted growth and delayed maturity Source: Crop Production: Evolution, History, and Technology, 1995, John Wiley & Sons, New York.
138 Grain Crops WEIGHTS AND MEASURES TABLE 2.90 Rice Seeds/Pound, Weight/Bushel, and Germination Time Seeds/lb (1,000) Seeds/g (no.) Weight/bu Germination Time (days) TABLE 2.91 Weights and Measures Approximate Net Weight Unit lb kg Rough rice Bu Bag Bbl Milled rice Cook-in-bag Source: U.S. Department of Agriculture, Agricultural Statistics, 2001, U.S. Government Printing Office, Washington, D.C. REFERENCES 1. Rice Inspection Handbook. 2. Smith, C.W., Crop Production: Evolution, History, and Technology, 1995, John Wiley & Sons, New York. 2.6 WHEAT (Triticum aestivum L., T. durum Desf.) INTRODUCTION Wheat is a member of the Poaceae or Graminae grass family. It is known as blé in France, trigo in Spain, frumento in Italy, and wreizen in Germany. It was one of the earliest crops cultivated and dates back to 11,000 B.C. in the Middle East. By about 4,000 B.C., wheat farming had spread to Asia, Europe, and northern Africa. In 1493, wheat was brought to the Americas. It reached Mexico in 1519 and Argentina by The spread of cultivation followed the movements of missionaries, colonists, pioneers, and religious groups into Canada and the U.S. The introduction of winter wheat in the U.S. in the 1870s greatly increased production. `In 1988, the highest verifiable winter wheat grain yield of 190 bu per acre was recorded in British Columbia, Canada. In the U.S. in 2000, the average winter wheat yield was 41.9 bu per acre and the highest average state yield was 61.8 bu per acre in the state of Washington. Wheat covers more cultivated land (232 million ha) than any other food crop and is one of the most important (595 million tons). It grows in a wide range of climates (best in fairly dry and mild climates) and soils (best grown on clay and silt loams). In most wheat-growing areas, farmers grow
139 108 Agronomic Handbook: Management of Crops, Soils, and Their Fertility the crop on the same land every year. This produces soil fertility problems and increased protential for water and wind erosion. The grain is harvested when its moisture level is not more than 14%. Harvested products include or are made into bran, bread, flour, gluten, pasta, starch, and straw for litter and bedding. Plants are sometimes harvested for grazing or fodder. Hard red wheats generally make excellent bread flour, cakes, cookies, and pastries, Durum wheats are best in pasta products, and white wheats are used in breakfast foods and pastries GLOSSARY 1 Blending Combining measured amounts of different lots from bins and mixing them into a uniform blend with grain assemblers or millers. Bolt Sift through a cloth or sieve. Bran Outer covering of a wheat kernel composed of seed coat, nuclear tissue, tube and cross cells, hypodermis, and endodermis, which are separated from the endosperm and embryo or germ during commercial milling. Break flour Flour produced by break rolls during commercial milling; particles of endosperm are also reduced to flour. Break system Stage in the milling process in which kernels are broken by a series of successively closer-set pairs of rollers to separate the endosperm from the bran coat. Broken kernel Kernel separated into two or more pieces, exclusive of insect boring or surface consumption. Clear flour Flour remaining after a patent flour has been removed; normally higher in ash and protein than patent but of lower market value because of color. Club wheat Triticum aestivum subsp. compactum: usually white wheat cultivars; may be winter or spring; heads are usually awnless, elliptical, oblong, or clavate in shape, and short, compact, or laterally compressed. Coarse break Break roll that grinds larger particles in a classified break system in which break stock is classified as coarse and fine by size and ground on separate rolls. Crop year U.S. officially designated production marketing year for a commodity; the wheat crop year is June 1 to May 31. Durum wheat Triticum turgidum subsp. durum; has 14 pairs of chromosomes; spring growth habit; very hard; high protein; used primarily for pasta. Elevator Point of accumulation and distribution in the movement of grain; terminal elevators usually receive grain by railroad carloads; country elevators receive grain by trucks, usually from farmers. Endosperm Starchy portion of the wheat kernel that is ground into flour; the seed-stored nutrient supply for the embryo during germination and early seedling growth. Ethanol Grain alcohol made from almost any kind of grain containing a reasonable amount of starch. Family flour Commonly called all-purpose flour; used for baking bread, cakes, biscuits, etc. Fancy patent flour Most finely ground flour. Farina Very pure endosperm of nondurum wheat ground to about medium screen size; maybe used in pasta, but will overcook more easily than pasta made from durum wheat Fine break Break roll used to further reduce smaller particles in a classified break system of milling. First clear Portion of straight run flour remaining after patent flour has been removed; higher in protein than the patent flour produced but poorer in color and thus has lower commercial value; about 20 to 25% of the flour produced in hard wheat mills may be first clear. Flour extraction rate Percent of flour produced from milling l00 lb of wheat kernels.
140 Grain Crops 109 Gluten Rubber-like proteinaceous material in wheat that gives wheat its superior bread-making quality; a measure of flour quality; a third of the weight of wet gluten approximates the protein content of the flour. Grain reserve Wheat stored by the U.S. government. Hard red spring (HRS) Triticum aestivum subsp. aesrivum; also called common or bread wheat; has 21 chromosome pairs A, B, and D genomes; spring seeded; not winter hardy; does not require vernalization for reproduction; may be referred to as red, dark northern, or northern; high protein; hard endosperm; primarily used to produce bread flour. Hard red winter (HRW) Triticum aestium subsp. aestivum, also called common or break wheat; has 21 chromosome pairs A, B, and D genomes; fall seeded; winter hardiness varies; requires vernalization for reproduction; may be referred to as dark hard, hard, or yellow hard; medium to high protein; hard endosperm; primarily used to produce bread flour. Hard wheat Generic term for wheat having a vitreous endosperm suitable for bread flour or semolina; yields coarse, gritty flour that is free-flowing and easily sifted; flour consists of regular shaped particles that are mostly whole endosperm cells. Middlings Pieces of endosperm not ground into flour; a byproduct of commercial milling produced during break reduction and composed of coarse material; usually used for animal feed. Middlings rolls Pair of smooth rolls used to reduce middlings to flour particle size; may be called reduction rolls. Millfeed Any byproduct of the milling industry used as livestock feed. Pasta Product made principally from durum wheat flour; includes macaroni, spaghetti, and noodles. Patent flour Highest value grade flour with good dress and color. Product stream Any of 125 to 150 mill streams in the flour manufacturing process; different grades of flour are produced by blending individual streams. Semolina Coarse endosperm extracted from durum wheat; used for pasta. Short An inseparable mixture of bran, endosperm, and wheat germ remaining after flour extraction in milling; used for animal feed. Soft red winter (SRW) Triticum aestivum subsp. aestium; a common wheat; has 21 chromosome pairs A, B, and D genomes; fall seeded; winter hardiness varies; requires vernalization for reproduction; low to medium protein; soft or floury endosperrn; used primarily for cakes, pastries, and products whose tenderness is important. Soft wheat Generic term for wheat having a chalky, nonvitreous endosperrn suitable for pastry flour; yields a very fine flour consisting of irregular-shaped fragments of endosperm cells that cling together and are difficult to shift. Spring wheat Wheat seeded in the spring and harvested the following summer or fall; does not require vernalization to reproduce. Stock Wheat in storage or transit; stock sometimes includes processed products in inventory. Straight flour Flour extracted from a blend or mill mix of wheat without division or addition of flour from other runs. Test weight Quality test used to determine weight per bushel; bushel weight standard for wheat is 60 pounds. Vernalization Low temperature-triggered, hormonal-controlled conversion from vegetative growth to reproductive growth in winter wheat; requires temperatures below 50 F; length of exposure required is cultivar-dependent.
141 110 Agronomic Handbook: Management of Crops, Soils, and Their Fertility PRODUCTION STATISTICS TABLE 2.92 Wheat: Area, Yield, and Production, a Continent Harvested Area Yield (metric (1,000 ha) b tons/ha) Production (1,000 metric tons) North America 32, ,519 South America 8, ,179 Europe 17, ,115 Eastern Europe 8, ,951 Western Europe Soviet Union 42, ,510 Middle East 17, ,482 Africa 9, ,583 Asia 68, ,422 Oceania 12, ,287 World Total 216, ,944 a Year of harvest. b Harvested area. Source: Foreign Agriculture Service, Washington, D.C. TABLE 2.93 Area, Yield, and Production of Leading Wheat-Growing Countries, a Country Harvested Area Yield (metric (1,000 ha) b tons/ha) Production (1,000 metric tons) China 28, ,880 India 27, ,780 Russia 23, ,000 U.S. 21, ,569 Australia 12, ,012 Canada 10, ,850 Kazakhstan 8, ,200 Turkey 8, ,500 Pakistan 8, ,854 Iran 6, ,500 Ukraine 5, ,599 France 5, ,232 World Total 216, ,944 a Year of harvest. b Harvested area. Source: Foreign Agriculture Service, Washington, D.C.
142 Grain Crops 111 TABLE 2.94 Area, Yield, and Production of Leading States, 2000 State Harvested Area (1,000 acres) Yield (bu/acre) Production (1,000 bu) North Dakota 9, ,785 Kansas 9, ,800 Montana 4, ,250 Oklahoma 4, ,800 South Dakota 2, ,268 Washington 2, ,880 Colorado 2, ,370 Texas 2, ,000 Minnesota 1, ,926 Nebraska 1, ,400 U.S. Total 53, ,223,440 Source: Crops Branch, National Agriculture Statistics Service, Washington, D.C. TABLE 2.95 U.S. Total and Per Capita Civilian Consumption of Wheat and Wheat Products, Calendar Year Total Consumed (million bu) a Per Capita Consumption of Food Products Flour (lb) b Cereal (lb) a Excludes quantities used alcoholic beverages. b Includes white, whole wheat, and semolina flour. Source: Economics Research Service, Washington, D.C. All figures are estimates based on data from private industry sources, the U.S. Department of Commerce, the Internal Revenue Service, and other government agencies.
143 112 Agronomic Handbook: Management of Crops, Soils, and Their Fertility TABLE 2.96 U.S. Wheat Acreage, Yield, and Production, a Year Harvested Acres (1,000) Yield (bu/acre) b Production (1,000 bu) , ,980, , ,466, , ,396, , ,320, , ,182, , ,277, , ,461, , ,547, , ,299, , ,223,440 a Includes area seeded in preceding fall for winter wheat. b Includes allowance for loans outstanding and purchases by the government valued at the average loan and purchase rate by state where applicable. Source: Crops Branch, National Agriculture Statistics Service, Washington, D.C., TABLE 2.97 Harvest Times for Wheat Crops January February March April May June July August September and October November December Argentina, Australia. Chile, New Zealand Myanmar, Chile, New Zealand, Uruguay India, Upper Egypt Lower Egypt, India, Iran, Mexico, Morocco Algeria, China, Japan, Spain, southwestern U.S. China, southern France, Greece, Italy, Portugal, Spain, Tunisia, Turkey, southern U.S. Bulgaria, Croatia, southern England, France, Germany, Hungary, Kazakhstan, Moldova, Romania, Russia, Urkaine, northern U.S. Belgium, Canada, Denmark, northern England, Kazahkstan, Moldova, Netherlands, Russia, Ukraine, northern U.S. Canada, Kazakhstan, Russia, Scandinavia, Scotland Argentina, Brazil, Venezuela, South Africa Argentina, Australia TABLE 2.98 Varieties of U.S.-Grown Wheat Variety Hard red winter Hard red spring Spring durum Soft red winter White States Where Grown Texas, Oklahoma, Kansas, Colorado, Nebraska Minnesota, South Dakota, North Dakota, Montana Northern Great Plains, Arizona, California Missouri, Illinois, Indiana, Ohio, Pennsylvania Michigan, New York, California, Washington, Oregon, Idaho
144 Grain Crops 113 FIGURE 2.14 Wheat production and value of production in the U.S., GRAIN QUALITY TABLE 2.99 Average Composition (%) of Wheat Flour, Bran, and Germ Containing about 13% Moisture Composition Wheat or Graham Flour White Flour Bran Germ Carbohydrates Nitrogen-free extract Starch Pentosans Dextrins 4 Sugars Crude fiber Fat Crude protein Ash (mineral matter) TABLE Quality Components of Wheat Grain Component Value Digestible energy, kcal/kg 3,520 Protein, % 13.7 Lysine, % 0.45 Methionine + cystine, % 0.36 Tryptophan, % 0.18 Calcium, % 0.05 Phosphorus, % 0.36 Fiber, % 3.0 Ether extract, % 1.7
145 114 Agronomic Handbook: Management of Crops, Soils, and Their Fertility FERTILIZER USE TABLE Fertilizer, Total Acreage, and Area Receiving Applications (%), All States Surveyed, a Crop Type Nitrogen Phosphate Potash 1995 Wheat, winter Wheat, durum Wheat, other spring Wheat, winter Wheat, durum Wheat, other spring Wheat, winter Wheat, durum Wheat, other spring Wheat, winter Wheat, durum Wheat, other spring a Acres receiving one or more applications of a specific fertilizer ingredient. Source: National Agriculture Statistics Service, Washington, D.C ELEMENTAL UPTAKE AND UTILIZATION TABLE Nutrient Elements Removed by a Bushel of Wheat Amount Removed Nutrient Element Grain Grain + Straw Nitrogen, lb/bu Phosphorus as phosphate, lb/bu Potassium as potash, lb/bu Sulfur, lb/bu Calcium, lb/bu Magnesium, lb/bu Copper, oz/bu Manganese, oz/bu Zinc, oz/bu Source: Crop Production: Evolution, History, and Technology, 1995, John Wiley & Sons, New York.
146 Grain Crops 115 TABLE Nutrient Elements (lb/acre) Removed by Wheat Crop Nutrient Element Grain (60 bu/acre) Straw (2 tons/acre) Nitrogen Phosphate 39 9 Potash Sulfur 5 7 Calcium 2 9 Magnesium 9 5 Boron Copper Iron Manganese Zinc TABLE Uptake of Major Elements and Micronutrients for 4-Ton/Acre Wheat Crop Major Element kg Micronutrient g Nitrogen 130 Boron 36 Phosphorus as phosphate 46 Copper 43 Potassium as potash 180 Iron 380 Calcium 18 Manganese 120 Magnesium 20 Zinc 180 Sulfur 17 Source: International Soil Fertility Manual, 1995, Potash & Phosphate Institute, Norcross, GA. With permission. TABLE Nutrient Element Utilization by 40-Bu/Acre Wheat Crop Nutrient Element Content (lb) Nitrogen 160 Phosphorus as phosphate 54 Potassium as potash 184 Magnesium 24 Sulfur 20
147 116 Agronomic Handbook: Management of Crops, Soils, and Their Fertility NUTRIENT ELEMENT SUFFICIENCY TABLE Nutrient Element Sufficiency Ranges for Wheat Sufficiency Range Nutrient Element Spring Wheat a Winter Wheat b Nitrogen, % Phosphorus, % Potassium, % Calcium, % Magnesium, % Boron, ppm 6 10 Copper, ppm Iron, ppm Manganese, ppm Molybdenum, ppm Zinc, ppm a As head emerges from boot; 50 leaves, top 2 leaves. b Just before heading; 25 whole tops. Source: Plant Analysis Handbook II: A Practical Sampling, Preparation, Analysis, and Interpretation Guide, 1996, MicroMacro Publishing, Athens, GA. With permission NUTRIENT ELEMENT DEFICIENCIES Calcium (Ca) Deficiency Symptoms Calcium-deficient plants are very stunted with short, stout stems and dark green leaves that are held erect. Although tiller production does not appear to be affected by mild deficiencies, few tillers may mature and produce heads. When a deficiency is severe, plants die before heads are produced. As a result, grain yields can be greatly reduced. Weather-tipped young leaves: Because Ca is not transferred from old to young leaves when a deficiency occurs, symptoms appear first and are more severe on young leaves. They are often most severe on the youngest, still unrolling leaves. All leaves are dark green and the tips of the youngest leaves turn yellow, then grey or pale brown, and die. The dead tissue becomes tightly rolled into tubes and may twist into circles. Affected leaves are very brittle and the laminae may tear while emerging or the dead tips may break off to produce squared ends of the leaves. The bases of affected leaves remain dark green and appear healthy. Mature leaves remain unaffected and retain their healthy, dark green appearance. Fan-shaped stems: Stems are short and stout. As a plant matures, young leaves have difficulty emerging fully and this causes the stem to become flattened in cross-section and develop a fanlike appearance Problem Soils Calcium deficiency is likely to occur in: Acidic, sandy soils whose original Ca has been removed by heavy rainfall Strongly acid peat and muck soils that have low total Ca
148 Grain Crops 117 Alkaline or sodic soils in which exchangeable Na and ph are high, thus depressing plant uptake of Ca Soil with high levels of soluble Al and low levels of exchangeable Ca Correcting Deficiency Calcium deficiency can be corrected by broadcasting suitable fertilizer onto the soil some months before sowing. Subsequent tillage operations then thoroughly mix the fertilizer with the soil. Where the chief problem is simply a lack of Ca, suitable fertilizers are gypsum (calcium sulfate) and calcium nitrate or chloride. If the soil ph is low, lime or limestone (calcium carbonate) and dolomite (a mixture of calcium and magnesium carbonates) are more suitable. A soil test can determine soil lime or Ca requirement. However, since the correct rate of application depends on the soil type and crop to be grown, advice should be sought on fertilizer practices used on similar soils in the district. The excessive use of lime may induce deficiencies of K, Mg, Fe, Mn, Zn, and Cu, so care should be taken to prevent overliming Copper (Cu) Deficiency Symptoms The first signs of Cu deficiency may be areas of poor growth within an apparently healthy crop. Deficient plants appear limp and wilted even when ample water is available in the soil. If the deficiency persists and becomes severe, affected plants are shorter and develop thin, spindly stems and pale green to yellow foliage. When the deficiency is very severe, affected plants appear to die from the tops down, resulting in plants with dark green old leaves and crowns of dead leaves at the tops. Copper deficiency affects the amount of live pollen formed. As a result, partly filled or even empty heads can be produced by plants that appear healthy. Heads without grain often turn white but remain firmly attached to the plants. A similar symptom is associated with frost, fungal, or mouse damage; the white heads are easily pulled from the stems in those situations. Weather-tipped younger leaves: Because Cu is not readily transferred from old to young leaves when a deficiency occurs, symptoms develop first and are more severe on young leaves. Old leaves usually remain dark green and appear healthy. Affected leaves turn pale green to yellow and appear limp or wilted. If the deficiency persists, the tips of young leaves wilt, hang down, and turn yellow. The leaf tips eventually die and turn pale brown, rolling or twisting into tight tubes. The bases of the affected leaves may remain green when a deficiency is mild, but entire leaves are affected and die if a deficiency is very severe. Increased tillering: In mild deficiencies, tiller production may be increased by the development of late tillers around the boot stage of growth. The new tillers are usually formed from nodes or joints that are well above ground level. Delayed maturity and black straw: Copper deficiency delays crop maturity. When plants eventually ripen, their straw is usually much darker than normal and may be black or dark grey Problem Soils Copper deficiency is likely to occur in: Peat and muck soils in which organic matter ties up soluble Cu in forms less available to plants Calcareous sands whose total Cu is low Leached acid soils whose total Cu is low Soils formed from rocks low in Cu Correcting Deficiency Foliar sprays and soil dressings of salts such as copper sulfate (bluestone) or copper chelates have corrected deficiencies. Dressings should be broadcast and mixed into the soil some weeks before
149 118 Agronomic Handbook: Management of Crops, Soils, and Their Fertility sowing. However, soil dressings may fail to correct the deficiency in some seasons and symptoms may reappear. If this occurs, foliar sprays should be applied immediately. A reliable remedy is to apply two or more foliage sprays of 0.5 to 1% solutions of soluble Cu salts (for example, 0.5 to 1 kg copper sulfate per 100 L water per ha), the first to be applied 5 to 8 weeks after seedling emergence when the crop is in the tillering stage. The second spray is applied when the first or oldest heads reach the boot stage of growth; an optional third spray can be applied 7 to 10 days later. Soil tests can estimate the amount of available Cu in a soil and predict the amount of fertilizer needed for most seasons. The best prediction can be obtained by seeking advice on fertilizer practices used on similar soils in the district Iron (Fe) Deficiency Symptoms Iron-deficient plants are stunted and have short, spindly stems and pale green to yellow foliage. Because the symptoms are more severe on upper leaves, the crop has a distinct yellow color. Tiller production is reduced even by mild deficiencies. If a deficiency persists or becomes severe, many young tillers die without producing heads and mature tillers develop small heads. Grain yields can be severely reduced. Interveinal chlorosis on younger leaves: Because Fe is not transferred from old to young leaves when a deficiency occurs, symptoms appear first and are more severe on young leaves. Old leaves usually remain dark green and appear healthy. During the early stages of symptom development, the youngest leaves turn pale green or yellow and the veins remain dark green and clearly visible. If the deficiency persists or becomes severe, the veins may lose their green color and the youngest leaves often turn dark or pale yellow, but rarely white. At this stage, it can be difficult to distinguish between S and Fe deficiencies, although Fe-deficient plants usually have a greener overall appearance than those deficient in S Problem Soils Iron deficiency is likely to occur in: Calcareous soils whose levels of soluble Fe are low Waterlogged soils Acid soils with excessively high levels of soluble Mn, Zn, Cu, and Ni that depress plant uptake of Fe Sandy soils low in total Fe Peat and muck soils in which organic matter ties up Fe Correcting Deficiency While dressings of inorganic salts such as iron sulfates or chlorides have corrected deficiencies in some soils, the applied Fe quickly becomes insoluble and less available to plants. Fe salts of organic chelates have proved more promising because the chelate has the ability to keep Fe in solution in soils. For acid soils, FeEDTA is the most effective chelate. FeHEDTA and FeDTPA are best on neutral soils and FeEDDHA is best on alkaline, calcareous soils. However, to be effective, large amounts of chelates may be required and may prove too costly. An equally effective remedy is to apply solutions of inorganic salts or chelates to the foliage (1% solution or 1 kg salt per 100 L water per ha). Because Fe is so immobile in plants, sprays may need to be applied every 10 to 15 days to provide Fe to new leaves. Advice on fertilizer practices used on similar soils in the district should be sought to obtain the best remedy for the affected crop under local conditions.
150 Grain Crops Magnesium (Mg) Deficiency Symptoms Magnesium-deficient wheat and triticale plants are stunted and have short, spindly stems and pale green to yellow foliage. Although tiller production may not be affected, many young tillers die before reaching maturity if a deficiency persists or becomes severe. Extremely deficient plants develop only a few heads that set few grains. Interveinal chlorosis on older leaves: Because Mg is readily transferred from old to young leaves when a deficiency occurs, symptoms appear first and are more severe on old leaves, working up the plants to younger leaves as the deficiency develops. Pale yellow interveinal chlorosis begins between the leaf tips and the mid-sections of middle and old leaves and rapidly expands toward the bases until whole leaves are affected. During early stages, the veins remain green and prominent. As the deficiency becomes more severe, the veins become less distinct and the interveinal tissue may die and turn pale or dark brown. Necrosis of interveinal tissue is more common on old leaves and usually occurs toward the tips. The youngest leaves remain green and appear healthy Problem Soils Magnesium deficiency is likely to occur in: Acid sandy soils whose Mg has been removed by leaching Strongly acid peat and muck soils whose total Mg is low Soils that have been over-fertilized with Ca (for example, lime) or K, thus inhibiting uptake of Mg Correcting Deficiency Magnesium deficiency on acid soils is best corrected by broadcasting dolomite (a mixture of calcium and magnesium carbonates) onto the surface some months before sowing. The dolomite is then mixed thoroughly with the topsoil during seedbed preparation. When the problem is simply a deficiency of Mg, applications of magnesium sulfate or chloride can be made at or before planting. A soil test can estimate the amounts of soluble and exchangeable Mg in the soil and predict the amount of fertilizer required. The best prediction can be obtained by seeking advice on fertilizer practices used on similar soils in the district. Magnesium deficiency in existing crops can be corrected by applying soluble salts such as magnesium sulfate, chloride, or nitrate with irrigation water. Foliar sprays of soluble magnesium salts such as magnesium sulfate are usually not recommended because of the large number of applications required to supply crop requirements Manganese (Mn) Deficiency Symptoms Manganese-deficient crops often appear patchy and exhibit areas of poorer growth adjacent to apparently healthy plants. Within the Mn-poor area, plants are stunted and have short, thin, spindly stems and pale green to yellow foliage. Affected plants often have wilted appearance and prostrate growth. Even mild deficiencies cause plants to produce few tillers. When a deficiency is severe, many young tillers and sometimes whole plants die before maturity. As a result, grain yields may be greatly reduced. White flecks in younger leaves: Because Mn is not readily transferred from old to young leaves when a deficiency occurs, symptoms develop first and are more severe on young leaves. When the deficiency persists, the severest symptoms appear on the youngest leaves. The oldest leaves may show mild symptoms. Affected leaves turn pale green and appear limp or wilted. Mild interveinal chlorosis develops in the mid-sections of leaves and spreads rapidly. Whole leaves turn pale yellowgreen. Small, linear grey to white flecks or streaks appear in interveinal tissues toward the bases.
151 120 Agronomic Handbook: Management of Crops, Soils, and Their Fertility Wilted leaves: If the deficiency persists or becomes severe, the leaves bend downward and lie on the surface of the soil and the plants appear wilted. This is caused by joining of the white flecks at the bases of the leaves. The basal tissue then dies and turns pale brown. Initially, the leaf tips remain green and appear healthy but eventually whole leaves die. Deaths of shoots: Severe deficiency causes the youngest leaves to die before they emerge fully from the sheaths of the previous leaves. When this occurs, the apical microstem soon dies and then the whole shoot dies Problem Soils Manganese deficiency is likely to occur in: Calcareous soils whose Mn is less available to plants Poorly drained soils with high organic matter content in which Mn is tied up in forms less available to plants Strongly acid sandy soils whose soluble Mn has been leached by heavy rain Soils formed from rocks low in Mn Correcting Deficiency Foliar sprays and soil dressings of Mn salts and oxides have been used to correct deficiencies. Soil dressings are more effective when broadcast and mixed into the soil some weeks before sowing. Foliar applications have generally been more successful. One or more sprays of 0.5 to 1% solutions of soluble Mn salts (for example, 0.5 to 1 kg manganese sulfate per 100 L water per ha) usually correct the deficiency, the first to be applied 5 to 6 weeks after seedling emergence. If symptoms reappear, the spray should be repeated immediately. While soil dressings usually last 5 to 6 years, foliar sprays must be reapplied to every crop. Tests can estimate the amount of available Mn in the soil and predict whether fertilizer is needed. The best prediction can be obtained by seeking advice on fertilizer practices used on similar soils in the district Nitrogen (N) Deficiency Symptoms Nitrogen deficiency leads to stunted plants with thin, spindly stems and short, erect leaves. In young crops, all leaves are pale green to yellow. Mature crops often take on a three-tone appearance: the oldest leaves are pale lemon yellow or pale brown; the middle leaves are yellow; and the youngest are pale green. Tiller production is reduced and if the deficiency is severe, many die before maturing, forming thatches of dead leaves around the bases of the plants. Grain yields are severely reduced. Mottled grain: An early warning sign is the production of low protein grain. In bread wheats, such grain is only partly vitreous and has opaque patches or mottles. Pale yellow older leaves: Because N is readily transferred from old to young leaves as soil supplies become deficient, symptoms appear first and are more severe on old leaves, working up the plants to younger leaves if the deficiency persists. The youngest leaves remain pale to dark green and appear healthy but may be short and more erect than usual. Old leaves turn pale green. Pale yellow chlorosis develops at the leaf tips and advances in broad fronts down the leaves. The chlorotic tissues die and turn pale brown. Affected leaves can be green at the bases and develop yellow mid-sections and brown leaf tips. Red stems: Deficient plants usually have green, thin, spindly stems. However, in cold weather, stems, leaf sheaths and auricles may develop red stripes, a symptom usually associated with P deficiency.
152 Grain Crops Problem Soils Nitrogen deficiency is likely to occur in: Sandy soils that have been leached by heavy rainfall or excessive irrigation Mineral soils low in organic matter Soils with a long history of cropping, where the supplies of N are exhausted Even fertile soils may suffer temporary N deficiency when double-cropped, heavily leached or waterlogged Correcting Deficiency Nitrogen deficiency is corrected by increasing the available N in the soil by fallowing, which allows organic N to be converted to mineral N; by growing cover or cash crops of legumes, which can fix atmospheric N 2 ; or by adding nitrogenous fertilizers. Suitable fertilizers are urea, gaseous ammonia or ammonium sulfate, nitrate, or phosphates. Crop growth depends on the amount of N already in the soil. A soil test can measure the amount of total N or (NO 3 )-N in the soil prior to sowing, and predict the amount of fertilizer required. The best prediction can be obtained by seeking advice on fertilizer practices used on similar soils in the district. Nitrogen deficiency in existing crops is sometimes corrected by applying soluble salts such as urea with irrigation water or as a foliar spray. Spray applications usually result in a rapid response of short duration, and additional sprays 10 to 14 days apart may be needed to supply enough N for crop requirements Phosphorus (P) Deficiency Symptoms Symptoms are more noticeable in young plants, which have greater relative demands for P than more mature plants. Mild deficiencies cause stunted growth but no obvious leaf symptoms. More severe deficiencies produce small, dark green plants that have short, erect leaves, stout stems, and often develop orange, red, or purple areas. Tiller production and grain yield are reduced even by mild deficiencies. When a deficiency persists or becomes severe, little grain is produced because many young tillers die before maturity and the surviving tillers produce small heads that set few grains. Dark yellow older leaves: Because P is readily transferred from old to young leaves when a deficiency occurs, symptoms develop first and are more severe on old leaves, working up the plants to younger leaves if the deficiency persists. The youngest leaves remain dark green and appear healthy but may be short and more erect than usual. Old leaves remain dark green and dark yellow chlorosis develops on the leaf tips and advances in broad fronts down the leaves. If the deficiency is severe or persists, purple suffusion combines with the yellow to produce orange-yellow to orange-purple chlorosis. Eventually the affected leaves die, turn dark brown, and form thatches around the bases of the plants. Purple stems: Red-purple or purple striping develops on stems and leaf sheaths even when a deficiency is mild Problem Soils Phosphorus deficiency is likely to occur in: Mineral soils low in organic matter Soils with a long history of cropping, whose supplies of P are depleted Highly weathered, Fe-rich acid soils whose phosphate is fixed in less available forms Soils whose P-rich topsoil has been lost through erosion Alkaline soils in which much of the P may be tied up in insoluble phosphates that are less available to plants
153 122 Agronomic Handbook: Management of Crops, Soils, and Their Fertility Correcting Deficiency Phosphorus deficiency can be corrected by applying phosphatic fertilizers at or before sowing. Suitable fertilizers are single or triple superphosphates or ammonium phosphates. Crop growth depends on the amounts of water-soluble phosphates and the rates of exchange between insoluble and soluble forms of P in the soil. Soil tests can estimate the amounts of available phosphate in soils and predict the amounts of fertilizer needed. The best prediction can be obtained by seeking advice on fertilizer practices used on similar soils in the district. Phosphorus deficiency in existing crops can be corrected by applying soluble salts such as ammonium phosphates with irrigation water. Spray applications of similar salts are usually not recommended because of the large number required to supply enough P Potassium (K) Deficiency Symptoms Deficient plants are stunted and have thin, spindly stems and pale green, yellow-tipped foliage. The lower leaves may wilt and lie on the surface of the soil or may die and turn brown if the deficiency is severe. Tiller production is usually not affected by mild deficiency. However, if it persists or becomes severe, many young tillers die before producing heads, while mature tillers produce small heads that set few grains. Marginal yellowing on older leaves: Because K is readily transferred from old to young leaves when a deficiency occurs, symptoms appear first and are more severe on old leaves, working up the plants to younger leaves if the deficiency persists. The youngest leaves usually remain green and appear healthy. On old leaves, symptoms appear on the tips and advance along the margins toward the bases, usually leaving the mid-veins alive and green. The symptoms become clearly recognizable only when a deficiency is severe. In mild deficiencies, leaves may be pale green and appear limp or wilted and lack other signs of disorder. When a deficiency is severe, the tips and margins of older leaves become bright yellow or dull yellow-brown. Eventually the affected tissue dies and turns dark brown, giving the leaf margins a ragged appearance Problem Soils Potassium deficiency is likely to occur in: Mineral soils low in organic matter after many years of cropping Sandy soils formed from parent material low in K Light textured soils whose original K has been leached by rainfall Correcting Deficiency Potassium deficiency is corrected by applying potassium nitrate, sulfate, or chloride to the soil at or before sowing. Crop yield depends on the amounts of water-soluble and exchangeable K in the soil. Tests can estimate the amount of available K in the soil and predict the amount of fertilizer required. The best prediction can be obtained by seeking advice on fertilizer practices used on similar soils in the district. Potassium deficiency in existing crops can be corrected by applying soluble K salts such as potassium sulfate, chloride, or nitrate with irrigation water. The foliar application of similar salts is usually not recommended because of the large number of sprays needed to supply crop requirements Sulfur (S) Deficiency Symptoms Sulfur deficiency causes stunted growth, delayed maturity, and yellowing of leaves. In young crops or when the deficiency is mild, stunting is limited. The first symptom of a deficiency is general yellowing over the whole plant followed by severe symptoms developing on upper leaves. In the
154 Grain Crops 123 early stages, upper leaves turn pale green to yellow while lower leaves remain green. If the deficiency persists and becomes severe, upper leaves turn pale yellow to white and lower leaves turn pale green. The yellowing is not confined to areas between the veins and affects entire leaves. Leaf tissue usually does not die even when the leaves have turned white Problem Soils Sulfur deficiency is likely to occur in: Mineral soils low in organic matter after many years of cropping Soils formed from parent material low in S (for example, some volcanic rocks and ash) Acid sandy soils whose original sulfates have been removed by leaching Correcting Deficiency Soil dressings of any S fertilizer will correct deficiencies. Elemental S (flowers of sulfur) can be broadcast and thoroughly mixed into the soil about 4 months before sowing. Gypsum (calcium sulfate) is another useful source of S. In soils not subject to heavy leaching, tests can estimate the amount of available sulfate before sowing and predict the amount of fertilizer required. The best prediction can be obtained by seeking advice on fertilizer practices used on similar soils in the district. Sulfur deficiency in existing crops can be corrected by applying soluble sulfate salts such as magnesium, ammonium, or potassium sulfate in irrigation water. Foliar sprays of similar salts are usually not recommended because of the large number of applications needed to supply crop requirements Zinc Deficiency Symptoms Zinc-deficient crops often appear patchy, with deficient plants adjacent to well grown, apparently healthy plants. Deficient plants are stunted and have short, thin stems and usually pale green foliage. If the deficiency continues and becomes severe, plants cease growth and often develop a grasstufted appearance. Tiller production is usually normal in mild deficiencies but many young tiers die without developing heads if the deficiency persists. When it is severe, tillering is greatly reduced and the few heads produced may have little or no grain. Chlorosis and necrosis of middle leaves: Zinc is partly mobile in wheat and triticale and the first symptoms originate halfway up the middle leaves. The youngest leaves at the top and the oldest at the base of the shoots may be unaffected initially, but will develop symptoms if the deficiency persists. Symptoms appear in the lower halves of the leaves, commencing as yellow chlorotic areas between the mid-veins and leaf margins and extending outward toward the tips and bases. These chlorotic areas eventually die and turn pale grey or brown. The affected areas may remain discrete, producing separate, linear brown or grey lesions or they may join, involve the mid-veins, and result in the deaths of the central areas of the leaves, leaving the tips, bases, and margins green. Chlorotic and necrotic lesions on the leaf sheath: Similar chlorotic areas and grey lesions may develop on the leaf sheaths when a deficiency is severe Problem Soils Zinc deficiency is likely to occur in: Strongly alkaline soils whose availability of Zn is depressed Leached sandy soils whose total Zn is low Leveled soils whose Zn-deficient subsoils may be exposed on the surface Soils in which heavy, frequent applications of phosphatic fertilizers may have reduced crop use of Zn
155 124 Agronomic Handbook: Management of Crops, Soils, and Their Fertility Correcting Deficiency Foliar and soil applications of Zn salts have been used to correct deficiencies. Soil dressings of zinc chelates, sulfates or oxides should be broadcast and mixed into soil 2 to 3 months before sowing. While soil dressings usually remain effective for 6 to 8 years before more are needed, foliar sprays have no residual effects and fresh applications must be made to each crop. Best results are obtained when two sprays of a 0.5 to 1% solution of a soluble Zn salt such as zinc sulfate heptahydrate (0.5 to 1 kg Zn salt per 100 L water per ha) are applied about 2 weeks apart, the first applied 2 to 3 weeks after seedling emergence. Soil tests estimate the amount of available Zn in a soil and predict whether fertilizer is needed. The best prediction can be obtained by seeking advice on fertilizer practices used on similar soils in the district SALINITY Saline Toxicity TABLE Effects of Salinity on Wheat Appearance Unthrifty, low-yielding crops Dull yellow leaf tips on older leaves Red-purple awns Causal Factors Excessive NaCl leads to short, stunted plants that have generally short, erect leaves. Affected plants have a harsh, droughty appearance, short, spindly stems, and bluish-green foliage. Young plants may appear only droughted. Older leaves of more mature plants may be brown and dead and lie on the soil surface around the bases of the plants. Tiller production may not be affected but if the toxicity persists, many young tillers die before maturity. On mature tillers, heads are small and set few grains. The leaf tips of old leaves turn dull yellow due to the accumulation of excess NaCl in tissues that transpired the greatest amounts of water during the life of the plant. Symptoms appear first and are more severe on the oldest leaves, working up the plants to younger leaves as the toxicity persists. The leaves are shorter than normal and appear harsh and wilted. They are carried erect and are dark green or dull bluish-green. The tips of the oldest leaves turn dull, dark yellow then die and turn pale brown. As the toxicity worsens, the chlorosis and necrosis advance down the leaves, usually along the margins, until entire leaves die. In awned wheats, the glumes and awns may develop reddish-purple areas Problem Soils Sodium chloride toxicity is more likely to occur in: Saline soils formed from salt water sediments Previously fertile soils that were flooded or heavily irrigated with water containing high concentrations of NaCl Correcting Toxicity Leaching with good quality irrigation water is the most effective means of removing excess Na and Cl from the soil. The water table may have to be lowered. Permeable soils such as well structured sandy soils are often easily reclaimed, but the problem is more difficult in less permeable soils (for example, poorly structured heavy clays).
156 Grain Crops 125 If exchangeable Na in the soil is high, reclamation involves replacing the adsorbed Na with Ca by applying gypsum (calcium sulfate) and then leaching the dissolved Na and Cl beyond the rooting depths of the plants. If irrigation water is to be used to leach the Na, the quality of the water should be checked before use to make sure it is not saline. Where excess NaCl cannot be wholly corrected by leaching, a more tolerant species may have to be grown WEIGHTS AND MEASURES A bushel of wheat grain weighs 60 lb (27.2 kg). TABLE Wheat Seeds/Pound, Weight/Bushel, and Germination Time Seeds/lb (1,000) Seeds/g (no.) Weight/bu (lb) Germination time (days) TABLE Weight and Standard Yield of Level Full Bushel of Wheat Grain Weight of 1 Measured Bushel (lb) Multiplication Factor to Yield Standard Bushel REFERENCES 1. U.S. Department of Commerce, U.S. Wheat History, 1979, U.S. Government Printing Office, Washington, D.C. 2. Grundon, N.J., Hungry Crops: A Guide to Nutrient Deficiencies in Field Crops, 1987, Queensland Department of Primary Industries, Brisbane, Australia.
157
158 3 Nut, Bean, and Oil Crops 3.1 PEANUT OR GROUNDNUT (Arachis hypogaea L.) INTRODUCTION The peanut plant belongs to the pea or Leguminosae family and is known as arachide in France, mani or cacahuete in Spain, pistacchio di terra in Italy, erdnuss in Germany, and amendoim in Portugal. The plant is a native of South America. Indians grew peanuts at least 1,000 years ago, although farmers in Africa and Asia now grow about 90% of the world total. The leading peanutgrowing countries are India, China, and the U.S. Georgia produces about half the annual U.S. peanut crop. Since the pods develop underground, peanuts are often called groundnuts, and are also called goobers. They are nutritious; peanuts and peanut butter contain more energy-providing calories than equal weights of beefsteak. About one half the peanuts consumed in the U.S. are in the form of peanut butter and about one fourth are consumed as roasted nuts. Peanut oil has both food (cooking and salad oils and dressings, margarine, and other vegetable shortenings) and industrial uses (as an ingredient in soap, face powders, shaving creams, shampoos, paints, and explosives). It is undergoing testing as a fuel source. The meal remaining after the oil is extracted is used as a protein animal feed and the protein in the meal used to make a textile fiber. Powdered peanut shells are used to make plastics, cork substitutes, wallboard, and abrasives. About 60% of the world s peanut production is used to produce oil. Worldwide peanut oilseed production represents 10% of all oilseeds a total of 31.6 million short tons. Peanut plants grow best in well-drained sandy soils and sunny warm temperatures (4 to 5 frost-free months) with moderate rainfall. The plant is a legume that can meet its nitrogen (N) requirement by bacterial symbiotic nitrogen (N 2 ) fixation. The average yield in the U.S. in the year 2000 was 2,499 lb per acre. 127
159 128 Agronomic Handbook: Management of Crops, Soils, and Their Fertility STAGES OF GROWTH TABLE 3.1 Peanut Growth Stages Stage a Abbreviated Title Description V-E Emergence Cotyledons near the soil surface with some part of the seedling plant visible V-O Cotyledons are flat and open at or below the soil surface V-1 First tetrafoliate One node on the main axis with its tetrafoliolate leaflets unfolded and flat V-n Additional V stages n developed nodes on the main axis; a tetrafoliolate node is counted when its leaflets are unfolded and flat R-1 Beginning bloom One open flower at any node on the plant R-2 Beginning peg One elongated peg R-3 Beginning pod One peg in the soil with turned, swollen ovary at least twice the width of the peg R-4 Full pod One fully-expanded pod; size characteristic of the cultivar R-5 Beginning seed One fully-expanded pod in which seed cotyledon growth is visible when the fruit is cut in cross-section R-6 Full seed One pod with seed cavity apparently filled R-7 Beginning maturity One pod showing visible, natural coloration or blotching of inner pericarp or testa R-8 Harvest maturity 2/3 to 3/4 of all developed pods have testa or pericarp coloration; fraction is cultivardependent, lower for Virginia types R-9 Over-mature pod One undamaged pod showing orange-tan coloration of the testa and/or natural peg deterioration a Vegetative (V) and reproductive (R) stages are considered established when at least 50% of the plants in the sample reach that stage. The establishment of the R Stage for an individual plant is based on the first occurrence of the specific trait without regard to position on the plant. Source: Crop Production: Evolution, History, and Technology, 1995, John Wiley & Sons, New York PRODUCTION STATISTICS TABLE 3.2 U.S. Peanut Acreage, Yield, and Production, Year Harvested Area (1,000 acres) Yield (lb/acre) Production (1,000 lb) , ,444 4,926, , ,567 4,284, , ,008 3,392, , ,624 4,247, , ,282 3,461, , ,653 3,661, , ,503 3,539, , ,702 3,963, , ,667 3,629, a 1, ,499 3,287,600 a Preliminary. Source: National Agriculture Statistics Service, Washington, D.C., 2001.
160 Nut, Bean, and Oil Crops 129 TABLE 3.3 Peanut Acreage, Yield, and Production by State, 2000 State Area Harvested (1,000 acres) Yield (lb/acre) Production (1,000 lb) Alabama 192 1, ,640 Florida 86 2, ,110 Georgia 487 2,750 1,339,250 New Mexico 24 2,500 60,000 North Carolina 123 2, ,700 Oklahoma 67 1, ,650 South Carolina ,000 34,500 Texas 250 2, ,000 Virginia 75 2, ,750 Source: National Agriculture Statistics Service, Washington, D.C., TABLE 3.4 Peanuts in the Shell: Area, Yield, and Production by Continent, Continent Area (1,000 ha) Yield (metric tons/ha) Production (1,000 metric tons) North America ,872 South America Africa 6, ,865 Asia 14, ,639 World Total 21, ,149 Source: Foreign Agriculture Service, Washington, D.C. TABLE 3.5 Peanuts in the Shell: Area, Yield, and Production in Specified Countries, Country Area (1,000 ha) Yield (metric tons/ha) Production (1,000 metric tons) India 8, ,500 China 4, ,639 Nigeria 1, ,450 Indonesia U.S ,737 Sudan Zaire Myanmar World Total 21, ,149 Source: Foreign Agriculture Service, Washington, D.C.
161 130 Agronomic Handbook: Management of Crops, Soils, and Their Fertility FIGURE 3.1 Peanuts: Value of U.S. production, NUT QUALITY TABLE 3.6 Nutritive Value of Whole Peanut Seed Component Level Calories/100 g 564 Protein,% 26.0 Fat,% 47.5 Total calcium, mg/lb 69 Total phosphorus, mg/lb 401 Total potassium, mg/lb 674 Carbohydrates,% 18.6 TABLE 3.7 Nutritive Value of Raw Peanut with Skin Component Level (%) Fat 47.5 Protein 26.0 Carbohydrate 18.6 Water 5.6 Other 2.3 Source: Composition of Foods, 1961, Agricultural Handbook No. 8, U.S. Department of Agriculture, Washington, D.C.
162 Nut, Bean, and Oil Crops NUTRIENT ELEMENT UPTAKE TABLE 3.8 Uptake of Major Elements and Micronutrients for a 4.5- Ton/Acre Peanut Crop Major Elements (kg) Nitrogen 270 Phosphorus as phosphate 45 Potassium as potash 92 Calcium 20 Magnesium 25 Sulfur 21 Micronutrients (g) Copper 60 Iron 480 Manganese 400 Source: International Soil Fertility Manual Potash & Phosphate Institute, Norcross, GA. With permission STANDARDS AND GRADES Farmers Stock Virginia Type U.S. No. 1 Unshelled Virginia-type peanuts that are mature, dry, and practically free from foreign material. Not less than 45% by weight of any lot shall consist of jumbo and fancy hand-picks and of this amount not less than 3/4 or 34% of the total unshelled weight shall be jumbo handpicks. U.S. No. 2 Unshelled Virginia-type peanuts that are mature, dry, and practically free from foreign material. Not less than 35% by weight of any lot shall consist of jumbo and fancy hand-picks and of this amount not less than 3/5 or 21% of the total unshelled weight shall be jumbo hand-picks. U.S. No. 3 Unshelled Virginia-type peanuts that are mature, dry, and practically free from foreign material. Unclassified Unshelled Virginia-type peanuts that do not meet the requirements of the foregoing grades. Large kernels Peanuts pass over a screen having 20/64- by 1-in. perforations. Medium kernels Peanuts that will pass through a screen having 20/64- by 1-in. perforations and over a screen having 15/64- by 1-in. perforations. Small kernels Peanuts that will pass through a screen having 15/64- by 1-in. perforations. Note: The large, medium, and small kernel terms are equivalent to extra large No. 1 and No. 2 terms now commonly used to designate kernels. The large, medium, and small descriptions are cited here to avoid confusion with the U.S. No. 1, U.S. No. 2, etc. grades that deal with hand-picks, shelled, and defective peanuts.
163 132 Agronomic Handbook: Management of Crops, Soils, and Their Fertility Farmers Stock Runner Type U.S. No. 1 Unshelled runner peanuts that are mature, dry, and practically free from damage. When shelled, the sound and mature kernels shall not be less than 65% of the total weight of the sample. U.S. No. 2 Unshelled runner peanuts that are mature, dry, and practically free from damage. When shelled, the sound and mature kernels shall not be less than 60% of the total weight of the sample. U.S. No. 3 Unshelled runner peanuts that are mature, dry, and practically free from damage. When shelled, the sound and mature kernels shall not be less than 55% of the total weight of the sample. U.S. sample grade Unshelled runner peanuts that do not meet any of the foregoing grades. Sample Total quantity of material taken for examination including all shelled and unshelled stock and foreign material. Practically free from damage Relates to shelled peanuts. No appreciable amount of nuts with cracked shells shall be noticeable. Damaged kernels 1. Kernels that are rancid or decayed. 2. Moldy kernels. 3. Kernels showing sprouts over 1/8 in. long; all sprouted kernels, the separated halves of which show decay, shall be classed as damaged. 4. Dirty kernels; surfaces are distinctly dirty and the dirt is ground in. 5. Wormy or worm-injured kernels. 6. Kernels that show yellow discoloration when the skin is removed. 7. Kernels having skins that show dark brown discoloration, usually netted and irregular, and affecting more than 25% of the skin; kernels having skins that are paler or darker than characteristic of the variety that are not actually discolored shall not be classed as damaged. Mature Kernels are fully developed. Hand-picks Unshelled peanuts that are clean, fairly bright, mature, dry, and free from mildewed or speckled shells, paper ends, and cracked or broken shells. Hand-picks shall not pass through a slotted screen having 32/64- by 3-in. perforations. Fancy hand-picks Hand-picks that will pass through a slotted screen having 37/63- by 3-in. perforations, but will not pass through a screen having 32/64- by 3-in. perforations. Jumbo hand-picks Hand-picks that will not pass through a slotted screen having 37/64- by 3- in. perforations Shelled Spanish Type U.S. No. 1 Spanish Shelled Spanish peanut kernels of similar varietal characteristics that are whole and free from foreign material, damage, and minor defects, and will not pass through a screen having 15/64- by 3/4-in. openings. U.S. Spanish splits Shelled Spanish-type peanut kernels of similar varietal characteristics that are split or broken, but free from foreign material, damage, and minor defects, and will not pass through a screen having 16/64-in. round openings. U.S. No. 2 Spanish Shelled Spanish peanut kernels of similar varietal characteristics that may be split or broken, but free from foreign material, damage, and minor defects, and will not pass through a screen having 16/64-in. round openings.
164 Nut, Bean, and Oil Crops Shelled Virginia Type U.S. extra large Virginia Shelled Virginia-type peanut kernels of similar varietal characteristics that are whole and free from foreign material, damage, and minor defects, and will not pass through a screen having 20/64- by 1-in. openings. Unless otherwise specified, the peanuts in a lot shall average not more than 512 per lb. U.S. medium Virginia Shelled Virginia peanut kernels of similar varietal characteristics but are whole and free from foreign material, damage, and minor defects, and will not pass through a screen having 18/64- by 1-in. openings. Unless otherwise specified, the peanuts in a lot shall average not more than 640 per lb. U.S. No. 1 Virginia Shelled Virginia peanut kernels of similar varietal characteristics that are whole and free from foreign material, damage, and minor defects, and will not pass through a screen having 15/64- by 1-in. openings. Unless otherwise specified, the peanuts in a lot shall average not more than 864 per lb. U.S. Virginia splits Shelled Virginia-type peanut kernels of similar varietal characteristics that are free from foreign material, damage, and minor defects, and will not pass through a screen having 20/64-in. round openings. Not less than 90% by weight shall be splits. U.S. No. 2 Virginia Shelled Virginia-type peanut kernels of similar varietal characteristics that may be split or broken but are free from foreign material, damage, and minor defects, and will not pass through a screen having 17/64- by 1-in. round openings Shelled Runner-Type U.S. No. 1 runners Shelled runner-type peanut kernels of similar varietal characteristics that are whole and free from foreign material, damage, and minor defects, and will not pass through a screen having 16/64- by 3/4-in. openings. U.S. runner splits Shelled runner peanut kernels of similar varietal characteristics that are slit or broken, but are free from foreign material, damage, and minor defects, and will not pass through a screen having 17/64-in. round openings. U.S. No. 2 runners Shelled runner-type peanut kernels of similar varietal characteristics that may be split or broken, but are free from foreign material, damage, and minor defects, and which will not pass through a screen having 17/64-in. round openings. Similar varietal characteristics Peanut kernels in a lot are not of distinctly different varieties. For example, Spanish types are not mixed with runners. Whole A peanut kernel is not split or broken. Split Separated half of a peanut kernel. Broken More than 1/4 of the peanut kernel is broken off. Foreign material Pieces or loose particles of any substance other than peanut kernels or skins. Unshelled A peanut kernel with part or all of the hull (shell) attached. Minor defect A peanut kernel is not damaged but is affected by one or more of the following: (1) dark brown, dark gray, dark blue, or black skin discoloration that covers more than 1/4 of the surface; (2) flesh discoloration that is darker than light yellow or consists of more than slight yellow pitting of the flesh; (3) a sprout extending more than 1/8 in. from the tip of the kernel; and (4) the surface of the kernel is distinctly dirty, and its appearance is materially affected. Damage A peanut kernel is affected by one or more of the following: (1) rancidity or decay; (2) mold; (3) insects, worm cuts, web, or frass; (4) freezing injury causing hard, translucent, or discolored flesh; and (5) the surface of the kernel is heavily smeared, thickly flecked, or coated with dirt and its appearance is seriously affected.
165 134 Agronomic Handbook: Management of Crops, Soils, and Their Fertility Cleaned Virginia Type U.S. jumbo hand-picked Cleaned Virginia-type peanuts in the shell that are mature, dry and free from loose peanut kernels, dirt, or other foreign material, pops, paper ends, and damage caused by cracked or broken shells, discoloration, or other means. The kernels shall be free from damage (rancidity, decay, mold, sprouts, dirt, worms, discoloration) from any cause. The peanuts shall not pass through a screen having 37/64- by 3-in. perforations. Unless otherwise specified, the unshelled peanuts in any lot shall not average more than 176 count per lb. [Note: Italicized terms are explained in the Other Terms section below.] U.S. fancy hand-picked Cleaned Virginia peanuts in the shells meeting the same standards as U.S. jumbo hand-picks, except the peanuts shall not pass through a screen having 32/64- by 3-in. perforations. Unless otherwise specified, the unshelled peanuts in a lot shall not average more than 225 per lb. Unclassified Cleaned Virginia-type peanuts in the shell that fail to meet the requirements of the foregoing grades. Unclassified is not a grade within the meaning of these standards. It is provided as a designation to show that no definite grade is appolied to a lot. Other terms Mature: Shells are firm and well developed. Pops: Fully developed shells that contain practically no kernels Paper ends: Peanut shells that have very soft and/or very thin ends Damage: An injury or defect that materially affects the appearance, edibility, or shipping quality of an individual peanut or a lot as a whole. The following shall be considered damages: 1. Cracked or broken shells are broken to the extent that kernels within the shells are plainly visible without minute examination and with no application of pressure, or where the appearance of individual peanuts are materially affected. 2. Discolored shells that have dark discoloration caused by mildew, staining, or other means affecting half or more of the shell surtace. Talc powder or other similar material that may have been applied to the shells during the cleaning process shall not be removed to determine the amount of discoloration beneath, but the peanut shall be judged as it appears with the talc. 3. Rancid or decayed kernels. 4. Moldy kernels. 5. Kernels showing sprouts extending more than 1/8 in. from the ends of the kernels. 6. Distinctly dirty kernels. 7. Kernels that are wormy, have worm frass adhering, or have worm cuts that are more than superficial. 8. Kernels that have dark yellow color penetrating the flesh or yellow pitting extending deep into the kernels. Count per pound: Number of peanuts in a pound. When determining count per pound, a singlekernel peanut shall be counted as 1/2 peanut.
166 Nut, Bean, and Oil Crops 135 TABLE 3.9 Allowable Percentages for Farmers Stock Runners Based on Total Weight of Sample Grade Tolerance for Other Varieties Tolerance for Sound Kernels Tolerance for Damaged Kernels U.S. No U.S. No U.S. No Source: U.S. Department of Agriculture Federal Grain Inspection Service, Washington, D.C., WEIGHTS AND MEASURES One pound of shelled nuts is equivalent to 1.5 lb unshelled nuts. TABLE 3.10 Weights and Measures for Unshelled Peanuts Approximate Net Weight Commodity Unit lb kg Virginia bushel Runner bushel Spanish bushel Source: U.S. Department of Agriculture, Agricultural Statistics, 2001, U.S. Government Printing Office, Washington, D.C. TABLE 3.11 Peanut Seeds/Pound, Weight/bu, and Germination Time Seeds/lb (1,000) Seeds/g (no.) Weight/bu (lb) Germination Time (days) REFERENCES 1. Smith, C.W., Crop Production: Evolution, History, and Technology, 1995, John Wiley & Sons, New York.
167 136 Agronomic Handbook: Management of Crops, Soils, and Their Fertility 3.2 SOYBEAN [Glycine max (L.) Merr.] INTRODUCTION Soybeans belong to the Fabaceae or Leguminosae pea family. The soybean is known as soya in French, soja in Spanish and Italian, and sojaböhne in German. Soybean culture dates back to 2,500 B.C. The plant is native to eastern Asia, Australia, and several Pacific Islands and is also called Chinese pea, Manchurian bean, Japan pea, Japan bean, and Japanese fodder plant. The soybean was introduced to Europe in the early 1700s and to North America in It was grown as a forage crop in the U.S. until World War II. The acreage harvested for seed (beans) by 1930 was less than 25% of total acres planted; it increased to 40% by By 1944, the acreage harvested for the beans had increased to 74%. Today, most plants are harvested for their beans to be used primarily for meal and oil. In 1999, 171 million short tons of soybean oil were produced and represented 52% of all vegetable oil produced. Soybean adapts to a wide range of climatic conditions, but is very susceptible to drought damage during flowering and grain filling. The U.S. is the leading soybean-growing country (72.7 million acres in 2000). It provides about two-thirds of the world s soybeans, followed by China, India, and Indonesia. Other major soybeangrowing countries are Nigeria, Russia, North Korea, Italy, and Thailand. In 1983, the highest verifiable soybean grain yield of 118 bu per acre was recorded in New Jersey. The U.S. average yield in 2000 was 38.1 bu per acre. Soybean oil contains no cholesterol and has one of lowest levels of saturated fat among vegetable oils. The soy foods business in the United States is a $2.5 billion industry and growing. The products are soy milks, cheeses, and yogurts as dairy subsitutes, soy butter, corn dogs, and soyburgers. They require 6.5 million bu of soybeans and the number is projected to rise to million bu by Speciality items, such as infant formula, nutritional supplements and bars, beverages and nutraceuticals or functional foods use 12.4 million bu and are projected to require 50 million bu by VEGETATIVE AND PRODUCTIVE STAGES TABLE 3.12 Vegetative Stages Stage Abbreviated Title Description VE Emergence Cotyledons above the soil surface VC Cotyledon Unifoliolate leaves unrolled sufficiently so the leaf edges do not touch. V1 First node Fully developed leaves at unifoliolate nodes V2 Second node Fully developed trifoliolate leaf at node above unifoliolate nodes V3 Third node Three nodes on the main stem with fully developed leaves beginning with the unifoliolate nodes V(n) nth node Number of nodes on the main stem with fully developed leaves beginning with the unifoliolate nodes; n can be any number beginning with 1 for V1, first node stage Source: Stages of Soybean Development, Iowa State University, Ames.
168 Nut, Bean, and Oil Crops 137 TABLE 3.13 Reproductive Stages Stage Abbreviated Title Description R1 Beginning bloom One open flower at any node on the main stem R2 Full bloom Open flower at one of the two uppermost nodes on the main stem with a fully developed leaf R3 Beginning pod Pod 5 mm (3/16 in.) long at one of the uppermost nodes on the main stem with a fully developed leaf R4 Full pod Pod 2 cm (3/4 in.) long at one of the four uppermost nodes on the main stem with a fully developed leaf. R5 Beginning seed Seed 3 mm (1/8 in.) long in pod at one of the four uppermost nodes on the main stem with a fully developed leaf. R6 Full seed Pod containing a green seed that fills the pod cavity at one of the four uppermost nodes on the main stem with a fully developed leaf R7 Beginning maturity One normal pod on the main stem that has reached its mature pod color R8 Full maturity 95% of the pods have reached their mature pod color; 5 to 10 days of drying weather are required after R8, before the soybeans have less than 15% moisture Source: Stages of Soybean Development, Iowa State University, Ames. TABLE 3.14 Comparison of Determinate and Indeterminate Soybeans Determinate Little growth in height after flowering Flowers occur about the same time throughout the plant Pods and seeds develop uniformly throughout the plant Terminal leaves are approximately the same size as lower leaves Terminal nodes on main stem usually have long, flowering stalks and several pods Indeterminate Will usually double in height during flowering Will flower at new nodes; flowering, pod, and seed development occur at same time Pods and seeds develop from lower nodes upward Terminal leaves are smaller than lower leaves Few pods at terminal node
169 138 Agronomic Handbook: Management of Crops, Soils, and Their Fertility SOYBEAN PRODUCTS, STANDARDS, AND GRADES Soybean Processing Products The National Soybean Processors Association defined product standards as follows: Soybean cake or chip The product remaining after extraction of part of the oil by pressure or solvents. A term descriptive of the process of manufacture, such as expelled, hydraulic, or solvent-extracted shall be used in the brand name. The product is designated and sold according to its protein content. Soybean meal Ground soybean cake, ground soybean chips, or ground soybean flakes. A term descriptive of the process of manufacture, such as expelled, hydraulic, or solventextracted, shall be used in the brand name. The product is designated and sold according to its protein content. Soybean mill feed The by-product resulting from the manufacture of soybean flour or grits; composed of soybean hulls and the offal from the tail of the mill. A typical analysis is 13% crude protein, 32% crude fiber, and 13% moisture. Soybean mill run The product resulting from the manufacture of dehulled soybean meal; composed of soybean hulls and bean meals that adhere to the hull in normal milling operations. A typical analysis is 11% crude protein, 35% crude fiber, and 13% moisture. Soybean hull The product consisting primarily of the outer covering of the bean. Solvent-extracted soybean flake The product obtained after extracting part of the oil by using hexane or homologous hydrocarbon solvents. The product is designated and sold according to its protein content. Soybean flake and 44% protein soybean meal These are produced by cracking and heating soybeans and reducing the oil content of the conditioned product by using hexane or homologous hydrocarbon solvents. The extracted flakes are cooked and marketed as flakes or ground into meal. Typical analysis is minimum protein, 44%; minimum fat, 0.5%; maximum fiber, 7%; and maximum moisture, 12%. Ground soybean Product obtained by grinding whole soybeans without cooking or removing any oil. Ground soybean hay Ground plant that includes leaves and beans. It must be reasonably free of other crop plants and weeds and contain not more than 33% crude fiber. Soybean feed, solvent-extracted The product remaining after partial removal of protein and nitrogen-free extract from dehulled solvent-extracted soybean flakes. Heat processed (dry roasted) soybeans The product resulting from heating whole soybeans without removing any of the component parts. The product may be ground, pelleted, flaked, or powdered and must be sold according to its crude protein content. Soy protein concentrate Concentrate prepared from high quality sound, clean, dehulled soybean seeds by removing most of the oil and water-soluble nonprotein constituents; must contain not less than 70% protein on a moisture-free basis. Kibbled soybean meal The product obtained by cooking ground, solvent-extracted soybean meal under pressure and extruding from an expeller or other mechanical pressure device. It must be designated and sold according to its protein content and contain not more than 7% crude fiber.
170 Nut, Bean, and Oil Crops 139 Ground extruded whole soybean Meal product resulting from extrusion by friction, heat, and/or steam of whole soybeans without removing any of the components. It must be sold according to its crude protein, fat, and fiber content. Soy grits Granu!ar material remaining from the screened and graded product after removal of most of the oil from selected, sound, clean, and dehulled soybeans by a mechanical or solvent extraction process. Soy flour Finely powdered material resulting from the screened and graded product after removal of most of the oil from selected, sound, cleaned, and dehulled soybeans by a mechanical or solvent extraction process U.S. Standards and Grades Definition of Soybean Grain that consists of 50% or more of whole or broken soybeans (Glycine max (L.) Merr.) that will not pass through an 8/64 round-hole sieve and not more than 10% of other grains for which standards have been established under the U.S. Grain Standards Act Other Terms Classes The two classes of soybeans are yellow and mixed. Yellow soybeans Soybeans that have yellow or green seed coats. In cross-section, they are yellow or have a yellow tinge, and may include not more than 10% soybeans of other colors. Mixed soybeans Soybeans that do not meet the requirements of the yellow soybean class. Damaged kernels Soybeans and pieces of soybeans that are badly ground damaged, badly weather damaged, diseased, frost damaged, germ damaged, heat damaged, insect bored, mold damaged, sprout damaged, stinkbug stung, or otherwise materially damaged. Stinkbug stung kernels are considered damaged at the rate of 1/4 of the actual percentage of the stung kernels. Foreign material All matter that passes through an 8/64 round-hole sieve and all matter other than soybeans remaining in the sample after sieving according to procedures prescribed in Federal Grain Inspection Service instructions. Heat damaged kernels Soybeans and pieces of soybeans that are materially discolored and damaged by heat. Purple mottled or stained kernels Soybeans that are discolored by the growth of fungus or by dirt or dirt-like substances, including nontoxic inoculants or other nontoxic substances. Sieve (8/64 round-hole) Metal sieve in. thick; perforated with in. diameter round holes. Soybeans of other colors Soybeans that have green, black, brown, or bicolored seed coats. Soybeans with green seed coats will also be green in cross-section. Bicolored soybeans will have seed coats of two colors, one of which is brown or black and covers 50% of the seed coats. The hilum of a soybean is not considered a part of the seed coat for this determination. Split Undamaged soybean with more than 1/4 of the bean removed.
171 140 Agronomic Handbook: Management of Crops, Soils, and Their Fertility PRODUCTION STATISTICS TABLE 3.15 U.S. Soybean Acreage, Yield, and Production, Year Harvested Area (1,000 acres) Yield (bu/acre) Production (1,000 bu) , ,986, , ,190, , ,669, , ,514, , ,174, , ,380, , ,686, , ,741, , ,653, , ,769,665 Source: National Agriculture Statistics Service, Washington, D.C., TABLE 3.16 World Soybean Production, Year Total (million tons) Per Person (kg) Year Total (million tons) Per Person (kg) Note: Preliminary. Source: U.S. Department of Agriculture electronic database, December 2000.
172 Nut, Bean, and Oil Crops 141 TABLE 3.17 Leading Soybean-Growing States: Acreage, Yield, and Production, 2000 State Acres Harvested (1,000) Yield (bu/acre) Production (1,000 bu) Iowa 10, ,240 Illinois 10, ,800 Minnesota 7, ,150 Indiana 5, ,980 Missouri 5, ,000 Nebraska 4, ,850 Ohio 4, ,480 South Dakota 4, ,950 Arkansas 3, ,200 U.S. Total 72, ,769,665 Source: National Agriculture Statistics Service, Washington, D.C., TABLE 3.18 Soybeans: Area, Yield, and Production by Continent and Country, Location Area (1,000 ha) Yield (metric tons/ha) Production (1,000 metric tons) Continent North America 30, ,124 South America 23, ,413 Central America European Union ,140 Eastern Europe Soviet Union Middle East Africa Asia 15, ,999 Oceania Country China 8, ,290 India 5, ,200 Indonesia 1, ,360 Nigeria Russia North Korea Italy Thailand World Total 72, ,682 Source: Foreign Agriculture Service, Washington, D.C.
173 142 Agronomic Handbook: Management of Crops, Soils, and Their Fertility FIGURE 3.2 World soybean production, (Source: Vital Signs 2001, Worldwatch Institute, W.W. Norton, New York.) FIGURE 3.3 World soybean production per person, (Source: Vital Signs 2001, Worldwatch Institute, W.W. Norton, New York.) FIGURE 3.3 World soybean area harvested, (Source: Vital Signs 2001, Worldwatch Institute, W.W. Norton, New York.)
174 Nut, Bean, and Oil Crops 143 FIGURE 3.4 Production of soybeans and value of production, FERTILIZER AND NUTRIENT ELEMENT UPTAKE TABLE 3.19 Percentages of Areas Receiving Fertilizer Applications, All States Surveyed, a Year Nitrogen Phosphate Potash a Acres receiving one or more applications of a specific fertilizer ingredient. Source: National Agriculture Statistics Service, Washington, D.C., TABLE 3.20 Uptake of Major Nutrient Elements for a 4-Ton/Acre Soybean Crop Major Element Weight (kg) Nitrogen 350 Phosphorus as phosphate 65 Potassium as potash 180 Calcium 29 Magnesium 27 Sulfur 22 Source: International Soil Fertility Manual, 1995, Potash & Phosphate Institute, Norcross, GA. With permission.
175 144 Agronomic Handbook: Management of Crops, Soils, and Their Fertility TABLE 3.21 Nutrient Element Utilization (lb/acre) by 40- and 60-Bu/Acre Soybean Crops Nutrient Element Nitrogen Phosphorus Potassium Magnesium Sulfur 40 bu/a bu/a NUTRIENT ELEMENT SUFFICIENCY TABLE 3.22 Soybean Nutrient Element Sufficiency Ranges a Major Elements Sufficiency Range % Nitrogen Phosphorus Potassium Calcium Magnesium Sulfur Micronutrients ppm Boron Copper Iron Manganese Molybdenum Zinc a Sampling procedure: 25 mature leaves from new growth prior to pod set. Source: Plant Analysis Handbook II: A Practical Sampling, Preparation, Analysis, and Interpretation Guide, 1996, Micro- Macro Publishing, Athens, GA. With permission COMPOSITION OF SEED TABLE 3.23 Nutritive Values of Whole Soybean Seed Component Value Calories/100 g 403 Protein, % 34.1 Fat, % 17.7 Total calcium, mg/lb 226 Total phosphorus, mg/lb 554 Total potassium, mg/lb 1,677 Carbohydrates, % 33.5
176 Nut, Bean, and Oil Crops 145 TABLE 3.24 Composition of Soybean Seed Substance % Protein 34.1 Carbohydrate 33.5 Fat 17.7 Water 10.0 Ash NUTRIENT ELEMENT DEFICIENCIES Boron (B) Deficiency Symptoms Unthrifty, low-yielding crops: Boron-deficient crops show poor growth, lack vigor, and yield poorly. Affected plants are very stunted and have stout stems and dark green leaves. If the deficiency persists and becomes severe, plants may die before setting pods. Mild deficiencies reduce branching and plant size and interfere with pollination and seed set, resulting in reduced grain yields. Severely deficient plants may either fail to branch or develop only a few flowers and pods, thereby producing little or no grain. Interveinal chlorosis and necrosis of young leaves: Because B is not transferred from old to young leaves, symptoms develop first and are more severe on young leaves and are most severe on leaves that are still growing. Young leaves turn pale green and develop pale yellow interveinal chlorosis. Dark brown necrotic lesions appear in the chlorotic tissues. Old leaves remain dark green and appear healthy. Deformed younger leaves: On severely affected plants, leaflets on the young leaves become deformed. The tips and sometimes the margins of the leaflets curl down and under. Shortened internodes and deaths of buds: Boron deficiency greatly affects the growth of internodes and the development of apical and axillary buds. The upper internodes of the stems of affected plants are shortened, giving mildly deficient plants a rosette appearance. On severely deficient plants, the apical and axillary buds die and the young, undeveloped leaves or flowers turn pale brown Problem Soils Boron deficiency is likely to occur in: Soils derived from parent material low in B, such as acid igneous rocks or fresh water sediments Sandy soils from which B has been leached by heavy rainfall Alkaline soils, especially those containing free lime Soils low in organic matter Acid peat and muck soils Correcting Deficiency Deficiencies can be corrected by applying soil dressings or foliar sprays of B fertilizers. Soil dressings are more effective if broadcast and mixed into the soil some months before sowing. Borax, boric acid, and chelated B compounds are suitable for soil application. Boric acid and chelated B compounds are suitable for foliar sprays and should be applied 5 to 6 weeks after
177 146 Agronomic Handbook: Management of Crops, Soils, and Their Fertility seedling emergence or as soon as symptoms appear. While soil dressings often remain effective for many years, foliar sprays must be reapplied to every crop. Tests can estimate the amount of available B in a soil and predict whether fertilizer is needed. The best prediction can be obtained by seeking advice on fertilizer practices used on similar soils in the district Calcium (Ca) Deficiency Symptoms Unthrifty, low-yielding crops: Calcium deficiency causes poor crop growth and can kill plants when severe. Affected plants are stunted and have short internodes, stout stems, and dark green, often distorted, leaves. If the deficiency occurs in old plants, the young leaves may develop yellow discolorations. Branching is reduced or even prevented if the deficiency is severe. Pod set may be severely reduced even by mild deficiencies. As a result, grain yields can be much lower than usual. Deaths of young buds: Because Ca is not transferred from old to young tissues, symptoms are more severe on the youngest leaves that are still developing from buds. When a deficiency is severe, the youngest leaves and bud meristems die and turn brown. Distorted young leaves: In young plants, the first leaves are distorted. Their tips fail to expand and become chlorotic, then develop pale brown necrosis. Tissue between the veins continues to expand, causing the margins to be cupped upward or downward. The bud meristems usually die quickly if the deficiency persists. Chlorosis and necrosis of veins: When severe deficiencies develop in old plants, the bud meristems die and turn brown. The larger veins on young leaflets then become necrotic and turn brown. Yellow chlorosis develops in tissue adjacent to necrotic veins Problem Soils Calcium deficiency is likely to occur in: Acid sandy soils from which Ca has been leached by heavy rainfall Strongly acid peat and muck soils that have low total Ca Alkaline or sodic soils in which exchangeable Na and ph are high and depress plant uptake of Ca Soil with high levels of soluble Al and low levels of exchangeable Ca Correcting Deficiency Calcium deficiency can be corrected by broadcasting a suitable fertilizer and mixing it into the soil some months before sowing. Where the problem is strictly a lack of Ca, suitable fertilizers are gypsum (calcium sulfate) and calcium nitrate or chloride. However, if the soil ph is low, lime, limestone (calcium carbonate), and dolomite (a mixture of calcium and magnesium carbonates) are more suitable. A soil test can determine the lime or Ca requirements of a soil. However, since the correct rate of application depends on soil type and the crop to be grown, advice should be sought on fertilizer practices used on similar soils in the district. The excessive use of lime may induce deficiencies of K, Mg, Fe, Mn, Zn, and Cu so care should be taken to prevent overliming Iron (Fe) Deficiency Symptoms Unthrifty, low-yielding crops: Soybeans seem to be relatively sensitive to Fe deficiency and affected crops are unthrifty and lack vigor. The plants are stunted and have thin, spindly stems, yellow young leaves, and dark green old leaves. Mild Fe deficiencies may not seriously reduce branching,
178 Nut, Bean, and Oil Crops 147 pod set, or grain yields, but severely deficient plants do not branch profusely and set fewer pods, greatly reducing grain yields. Interveinal chlorosis on younger leaves: Because Fe is not readily transferred from old to young leaves, symptoms develop first and are more severe on leaflets of young leaves. The youngest, still expanding leaves are often the most severely affected if a deficiency persists. In mild deficiencies, pale yellow chlorosis develops in the interveinal areas of young leaflets. The veins remain green and easily seen. As the deficiency worsens, the veins fade and the chlorosis expands over entire leaflets. Old leaves remain dark green and appear healthy. Necrotic lesions on veins of younger leaves: On severely affected plants, dark brown lesions develop on the veins of young leaflets. The lesions are more prominent on the undersurface of the leaflet and usually appear after the veins have turned yellow. The interveinal areas of affected leaflets may be puckered and the tips and margins of the leaflets curl down under the lamina. Necrotic lesions on petioles and laminae of younger leaves: As symptoms develop, pale brown necrotic lesions appear on the petioles and margins of leaflets of younger leaves. These symptoms develop only after the whole leaves turn yellow and they can be used to distinguish between Fe and S deficiencies Problem Soils Iron deficiency is likely to occur in: Alkaline soils in which levels of soluble Fe are low Waterlogged soils Acid soils with excessively high levels of soluble Mn, Zn, Cu, and Ni that depress Fe uptake Sandy soils low in total Fe Peat and muck soils whose organic matter ties up Fe Correcting Deficiency While dressings of inorganic Fe salts such as sulfates or chlorides have corrected deficiencies in some soils, the applied Fe quickly becomes insoluble and less available to plants. Iron salts of organic chelates are more promising as soil dressings because the chelate has the property of keeping Fe in solution. For acid soils, FeEDTA is the most effective chelate. FeHEDTA and FeDTPA are best on neutral soils and FeEDDHA is best for alkaline soils. However, large amounts of chelates may be required and this may prove too costly. An equally effective remedy is to apply solutions of inorganic salts or chelates to the foliage (1% solutions or 1 kg salt per 100 L water per ha). Because Fe is so immobile in plants, sprays may need to be applied every 10 to 15 days to provide Fe to new leaves. Advice on fertilizer practices used on similar soils in the district should be sought to obtain the best remedy for the affected crop under local conditions Magnesium (Mg) Deficiency Symptoms Unthrifty, low-yielding crops: Magnesium-deficient crops lack vigor and are pale green. Affected plants are slightly shorter than usual with thin, spindly stems and pale green to yellow leaves. Although branching is not reduced initially, deficient plants set fewer pods. The pods contain fewer seeds than usual and thereby reduce grain yields. Interveinal chlorosis of older leaves: Symptoms begin as pale yellow, interveinal mottling on leaflets of middle leaves and spread rapidly to older leaflets. If the deficiency persists, these symptoms advance up the stems to younger leaflets.
179 148 Agronomic Handbook: Management of Crops, Soils, and Their Fertility Interveinal necrosis of older leaves: When a deficiency is severe, pale brown necrotic lesions appear in interveinal tissues in the bodies of the leaflets, advancing toward, but usually not reaching, the margins. The veins remain green and tissue near the veins may appear puckered Problem Soils Magnesium deficiency is likely to occur in: Acid sandy soils from which Mg has been leached Strongly acid peat and muck soils that have low total Mg Soils that have been over-fertilized with Ca (for example, lime) or K, thus inhibiting Mg uptake Correcting Deficiency Magnesium deficiency on acid soils is corrected by broadcasting dolomite (a mixture of calcium and magnesium carbonates) and mixing it into the soil some months before sowing. When the problem is only a deficiency of Mg, band applications of magnesium sulfate or chloride can be made at or before planting. Tests can estimate the amounts of soluble and exchangeable Mg in the soil, and predict the amount of fertilizer needed. The best prediction can be obtained by seeking advice on fertilizer practices used on similar soils in the district. Magnesium deficiency in existing crops can be corrected by applying soluble salts, such as magnesium sulfate, chloride, or nitrate, with irrigation water. Foliar sprays of similar salts are usually not recommended because of the large number of applications needed to meet crop requirements Manganese (Mn) Deficiency Symptoms Patchy, low-yielding crops: Soybeans are sensitive to Mn deficiency and affected crops often appear patchy. Plants in Mn-poor areas are stunted and have short, thin stems and pale green to yellow foliage. Affected plants produce less grain because branching is reduced and fewer pods are developed. Mottled, interveinal chlorosis on younger leaves: Leaflets on the youngest leaves turn pale green and pale yellow mottling develops in interveinal areas. The veins remain green. Old leaves remain green and appear. This pattern of development occurs because manganese is not transferred from old to young leaves, and symptoms develop first and are more severe on younger leaves. Brown necrotic lesions on younger leaves: As symptoms develop, small, brown lesions appear between the veins and the leaflets often curl downward. Leaf fall of younger leaves: If a deficiency persists and becomes very severe, the affected young leaflets readily fall off, leaving bare stems and petioles on the upper parts of the plants. Mildly affected and healthy green leaves remain on the lower parts Problem Soils Manganese deficiency is likely to occur in: Strongly alkaline soils in which Mn is less available to plants Poorly drained soils with high organic matter content in which Mn is tied up in forms less available to plants Strongly acid sandy soils from which soluble Mn has been leached by heavy rain Soils formed from rocks low in Mn
180 Nut, Bean, and Oil Crops Correcting Deficiency Foliar sprays and soil dressings of Mn salts and oxides have been used to correct deficiencies. Soil dressings are more effective when broadcast and mixed into the soil some weeks before sowing. However, foliar applications have generally been more successful. One or more foliar sprays of 0.5 to 1% solutions of soluble Mn salts (for example, 0.5 to 1 kg manganese sulfate per 100 L water per ha) usually correct the deficiency, the first to be applied 5 to 6 weeks after seedling emergence. If the symptoms reappear, sprays should be repeated immediately. While soil dressings usually last 5 to 6 years before fresh applications are needed, foliar sprays must be reapplied to every crop. Tests can estimate the amount of available Mn in a soil and predict whether fertilizer is needed. The best prediction can be obtained by seeking advice on fertilizer practices used on similar soils in the district Nitrogen (N) Deficiency Symptoms Unthrifty, low-yielding crops: Rhizobium bacteria normally live in symbiosis with soybeans in the nodules attached to roots. The bacteria can fix atmospheric N 2 and supply all or most N requirements of the plant so N deficiencies are rare. However, they can occur if a crop is sown in N-deficient soil and the proper bacteria are not present naturally in the soil or not supplied at sowing, or if soil conditions prevent the bacteria from fixing N 2. Affected plants are stunted and have thin, spindly stems and small, pale green to yellow leaves. Deficient plants branch less profusely and set fewer pods that contain fewer seeds, resulting in low grain yields. Pale yellow older leaves: Because N is readily transferred from old to young leaves, symptoms appear first and are more severe on old leaves, working up the plants to younger leaves if the deficiency persists. Young leaves remain pale green while old leaves fade from pale green through pale yellow to almost white. Eventually, the leaflets on affected leaves die, turn pale brown, and fall readily from the petioles. Downward pointing leaflets: On healthy plants, the leaflets are carried in a horizontal plane, but on deficient plants, leaflets are often held with tips pointed toward the ground Problem Soils Nitrogen deficiency is likely to occur in: Sandy soils that have been leached by heavy rainfall or excessive irrigation Soils low in organic matter Soils with a long history of cropping, whose N supplies have been exhausted Even fertile soils may suffer temporary N deficiency when double-cropped, heavily leached, or waterlogged Correcting Deficiency When soybeans are grown for the first time in a particular field, it is essential to treat the seeds before planting with a culture of the specified N 2 -fixing bacteria. In some soils it may be advisable or even necessary to innoculate subsequent crops to ensure effective nodulation. If, for any reason, nodulation fails, N deficiency in existing crops can be corrected by applying soluble salts such as urea with irrigation water or as a foliar spray. Spray applications usually result in a rapid, short-lived response, and additional sprays 10 to 14 days apart may be necessary to meet crop N requirements.
181 150 Agronomic Handbook: Management of Crops, Soils, and Their Fertility Phosphorus (P) Deficiency Symptoms Unthrifty, low-yielding crops: Soybeans demand high levels of P and young plants develop easily recognizable symptoms. Affected crops lack vigor. The plants are stunted and have thin, spindly stems and small, bluish-green leaves. Phosphorus deficiency delays maturity and reduces branching, the number of pods produced, and the number of seeds per pod. As a result, grain yields can be severely reduced. Brown necrotic lesions on older leaves: Symptoms are clearly recognizable even when a deficiency is mild. All leaves are dull bluish-green, and the leaflets are smaller than usual. Small, dark brown necrotic lesions appear in interveinal areas on leaflets of old leaves. As the symptoms develop, the lesions become surrounded by dark yellow chlorosis. The symptoms appear first and are more severe on old leaves, working up the plants to young leaves if the deficiency continues. Dark yellow older leaves: In severe deficiencies, leaflets of old leaves turn dark yellow and the interveinal tissue is covered by small, dark brown necrotic lesions. As the leaflets die, they turn dark orange then brown and fall readily, leaving the petioles attached to the stems. Eventually, the petioles are shed. Downward pointing leaflets: Older leaflets on healthy plants are carried in a horizontal plane. On deficient plants the tips of affected leaflets point toward the ground Problem Soils Phosphorus deficiency is likely to occur in: Soils low in organic matter Soils with a long history of cropping and exhausted P supplies Highly weathered, Fe-rich soils whose phosphate is fixed in less available forms Soils whose topsoil has been lost through erosion Alkaline soils whose P may be tied up in insolube phosphates that are less available to plants Correcting Deficiency Phosphorus deficiency can be corrected by applying phosphatic fertilizers to the soil at or before sowing. Suitable fertilizers are single or triple superphosphates and ammonium phosphates. Growth depends on the amounts of water-soluble phosphates and the rates of exchange between soluble and insoluble forms of P in the soil. Tests can estimate the amount of available phosphate in a soil and predict the amount of fertilizer needed. The best prediction can be obtained by seeking advice on fertilizer practices used on similar soils in the district. Phosphorus deficiency in existing crops can be corrected by applying soluble salts such as ammonium phosphates with irrigation water. Spray applications of similar salts are usually not recommended because of the large number needed to supply crop requirements Potassium (K) Deficiency Symptoms Unthrifty, low-yielding crops: Like other legumes, soybeans have a great need for K. Deficient crops lack vigor and mature more slowly than usual. Affected plants are short and have thin stems and pale green older leaves. Potassium deficiency delays branching and reduces the number of pods set and the number of seeds per pod. Severely deficient plants may produce deformed seeds. Marginal necrosis on older leaves: Symptoms appear first and are more severe on old leaves because K is readily transferred from old to young leaves when a deficiency occurs. While the
182 Nut, Bean, and Oil Crops 151 youngest leaves remain dark green and appear healthy, old leaves develop pale brown marginal necrosis. The necrotic lesions appear in interveinal tissues on or near the margins, usually toward the tips of the leaflets. As more K is withdrawn, the lesions join and advance along the margins toward the bases of the leaflets. If the deficiency persists, the symptoms move up the plants to younger leaves. Dark yellow older leaves: When a deficiency is very severe, leaflets on old leaves develop general, dark yellow chlorosis before dying, turning dark brown, and falling from the plants. Red veins on older leaves: When a sudden, severe deficiency occurs, leaflets on middle and older leaves may become distorted and develop red lesions on the main veins before other symptoms appear. Reddening of the veins is more noticeable on the undersides. The interveinal tissue becomes puckered and the tips of the leaflets curl downward. Necrotic lesions on petioles of older leaves: On severely deficient plants, dark brown necrotic lesions develop on the petioles, which then collapse. The leaves hang down around the stems before the leaflets die and fall from the plants Problem Soils Potassium deficiency is likely to occur in: Soils low in organic matter after many years of cropping Sandy soils formed from parent material low in K Light-textured soils from which K has been leached by heavy rainfall Correcting Deficiency Potassium deficiency is corrected by applying potassium nitrate, sulfate, or chloride to the soil at or before sowing. Crop yield depends on the amounts of water-soluble and exchangeable K in the soil. Tests can measure the amount of available K and predict the amount of fertilizer needed. The best prediction can be obtained by seeking advice on fertilizer practices used on similar soils in the region. Potassium deficiency in existing crops can be corrected by applying soluble K salts, such as potassium sulfate, chloride, or nitrate, with irrigation water. The foliar application of similar salts is usually not recommended because of the large number needed to supply crop requirements Sulfur (S) Deficiency Symptoms Unthrifty, low-yielding crops: Sulfur deficiency causes unthriftiness, lack of vigor and delayed maturity. Whole plants in young crops may be pale green, but in more mature crops, plants are stunted and have thin stems. Only young leaves are pale green to yellow. Affected plants produce fewer branches that set fewer pods containing fewer seeds than usual. As a result, grain yields are reduced. Pale yellow younger leaves: Because S is not readily transferred from old to young leaves, symptoms appear first and are more severe on young leaves. Old leaves remain green and appear healthy. In young crops, whole plants may appear pale green and the youngest leaves will be yellowest. As the crop matures, leaflets on young leaves turn pale yellow while those on old leaves remain green Problem Soils Sulfur deficiency is likely to occur in:
183 152 Agronomic Handbook: Management of Crops, Soils, and Their Fertility Soils low in organic matter after many years of cropping Soils formed from parent material low in S (for example, some volcanic rocks and ash) Acid, sandy soils from which sulfates have been leached Correcting Deficiency Soil dressings of any S fertilizer will correct deficiencies. Elemental S (flowers of sulfur) may be broadcast and thoroughly mixed into soil about 4 months before sowing in alkaline soils. Gypsum (calcium sulfate) is a useful source of S in neutral and acidic soils. Tests can measure the amount of available sulfate in the soil before sowing and predict the amount of fertilizer required. The best prediction can be obtained by seeking advice on fertilizer practices used on similar soils in the district. Sulfur deficiency in existing crops can be corrected by applying soluble salts, such as magnesium, ammonium, or potassium sulfate, in irrigation water. Foliar sprays of similar salts are usually not recommended because of the large number of applications needed to supply crop requirements Zinc (Zn) Deficiency Symptoms Patchy, low-yielding crops: Soybeans are relatively sensitive to Zn deficiency. Affected crops grow poorly, lack vigor, and mature slowly. The plants are very stunted and have thin, short stems and pale green, bronzed foliage. Zinc-deficient plants develop fewer pods than normal, resulting in reduced grain yields. Yellow mottling on older leaves: The earliest symptom is pale yellow mottling in interveinal areas on leaflets of middle leaves. The yellow mottling then appears in older leaves until they are all pale yellow; young leaves remain green and appear healthy. If the deficiency persists, these symptoms move up the plants to younger leaves. Bronze necrosis on older leaves: When a deficiency is very severe, small, bronze necrotic lesions develop in the chlorotic interveinal areas of old leaflets. The veins remain green but the leaf edges cup downward and the leaflets point toward the ground. Eventually, the leaflets die, turn pale brown, and fall readily from the petioles Problem Soils Zinc deficiency is likely to occur in: Strongly alkaline soils where the availability of Zn is depressed Leached sandy soils whose total Zn is low Leveled soils whose Zn-deficient subsoils may be exposed on the surface Soils in which heavy applications of phosphatic fertilizers may have reduced the use of Zn by crops Correcting Deficiency Foliar and soil applications of Zn salts have been used to correct deficiencies. Soil dressings of zinc chelates, sulfates, or oxides should be broadcast and mixed into the soil 2 to 3 months before sowing. Soil-applied Zn has a residual effect for 6 to 8 years before fresh applications are needed. Foliar sprays have no residual effects and fresh applications must be made to each crop. Best results are obtained when a 0.5 to 1% solution of a soluble Zn salt (for example, 0.5 to 1 kg zinc sulfate heptahydrate per 100 L water per ha) is applied 2 to 3 weeks after seedling emergence. Additional sprays should be applied as soon as symptoms reappear.
184 Nut, Bean, and Oil Crops 153 Tests can estimate the amount of available Zn in a soil and predict whether fertilizer is needed. The best prediction can be obtained by seeking advice on fertilizer practices used on similar soils in the district MANGANESE AND SODIUM CHLORIDE TOXICITY Manganese (Mn) Toxicity Symptoms of Toxicity Unthrifty, low-yielding crops: Soybeans appear to be more tolerant of high levels of Mn than many other crops. Affected crops lack vigor and show poor growth. Plants are stunted and have short, stout stems and dark green leaves. If the toxicity persists and becomes severe, branching is reduced and plants set fewer pods that contain fewer seeds than usual. Necrotic lesions on older leaves: Excess Mn is carried in transpiration streams and accumulates in older tissues. Symptoms develop first and are more severe on old leaves, working up the stems to young leaves if the toxicity persists. Leaflets on old leaves remain dark green and develop pinpoint, red-brown necrotic lesions on their upper surfaces. The lesions tend to concentrate in tissues adjacent to the larger veins. Red-brown lesions: All veins develop red-brown lesions on veins of older leaves when a deficiency is severe. Although the lesions are more prominent on the undersides, they are easily seen on the upper surfaces. Yellow mottling on youngest leaves: The leaflets on the youngest leaves are smaller than usual and develop pale yellow, interveinal mottling. As the leaflets mature, the mottling disappears and is replaced by red-brown necrotic lesions Problem Soils Manganese toxicity is likely to occur in: Strongly acid soils that show increased solubility of Mn Waterlogged soils in which poor aeration reduces unavailable manganic (Mn 3+ ) ions to manganous (Mn 2+ ) ions that can be taken up by plants Correcting Toxicity Manganese toxicity is usually corrected by management practices that reduce levels of soluble Mn in soil. If soils are strongly acid, liming to an alkaline reaction will reduce excess levels of soluble Mn. Drainage of waterlogged soils prevents anaerobic conditions that produce soluble Mn 2+ ions. If soils are over-treated with Mn 2+ fertilizers, heavy leaching with low-mn irrigation waters or mulching with organic materials removes soluble Mn Sodium Chloride (NaCl) Toxicity Symptoms of Toxicity Unthrifty, low-yielding crops: Soybeans are more sensitive to excess NaCl than many other summer crops. Affected crops show poor growth, lack vigor, and appear harsh and droughty. Plants may appear wilted and have short, thin stems and small, pale green and grey foliage. The number of pods set and the number of seeds per pod are both reduced and grain yields are low. Droughty, limp appearance: When high soil concentrations of NaCl occur, plants have difficulty obtaining sufficient water for normal growth. Affected plants often have harsh, droughty appearance and wilt readily on hot days even when ample water is available. Wilted plants may recover overnight but eventually permanently wilted.
185 154 Agronomic Handbook: Management of Crops, Soils, and Their Fertility Grey necrosis on older leaves: Because NaCl is carried in transpiration streams, it accumulates in older tissues. Therefore, symptoms appear first and are more severe on old leaves and work up the plants to young leaves if the toxicity persists. Leaflets on older leaves wilt and grey necrosis develops on the margins near the tips. The necrosis advances rapidly into interveinal areas until only the veins remain green. If the toxicity persists, the leaflets or entire plants die and turn pale brown Problem Soils Sodium chloride toxicity is more likely to occur in: Saline soils formed from salt water sediments Previously fertile soils that have been flooded or heavily irrigated with water containing high concentrations of NaCl Correcting Toxicity Leaching with good quality irrigation water is the most effective means of removing excess Na and Cl from soil. The water table may have to be lowered. Permeable soils such as well structured sandy soils are often easily reclaimed, but the problem is more difficult in less permeable soils (for example, poorly structured heavy clays). If exchangeable Na in the soil is high, reclamation involves replacement of the adsorbed Na with Ca by applying gypsum (calcium sulfate) and then leaching the dissolved Na and Cl beyond the rooting depths of the plants. If irrigation water is to be used to leach the Na, its quality should be checked before use to ensure it is not saline. Where excess NaCl cannot be wholly corrected by soil leaching, a more tolerant species may have to be grown WEIGHTS AND MEASURES One bushel of soybean grain has an approximate net weight of 20 lb or 27.2 kg. One gallon of soybean oil has an approximate net weight of 7.7 lb or 3.5 kg. TABLE 3.25 Weight and Standard Yield of Level Full Bushel of Soybean Grain Weight of 1 measured bu (lb) Multiplication factor to yield standard bu
186 Nut, Bean, and Oil Crops 155 TABLE 3.26 Soybean Seeds/lb, Weight/bu, and Germination Time Seeds/lb (1,000) Seeds/g (no.) Weight/bu (lb) Germination time (days) REFERENCES 1. Smith, C.W., Crop Production: Evolution, History, and Technology, 1995, John Wiley & Sons, New York. 2. Grundon, N.J., Hungry Crops: A Guide to Nutrient Deficiencies in Field Crops, 1987, Queensland Department of Primary Industries, Brisbane, Australia.
187
188 4 Cotton (Gossypium spp.) Fiber 4.1 INTRODUCTION Cotton belongs to the Malvaceae family. It is known as coton in French, cottone in Italian, algodon in Spanish, baumwolle in German, and algodao in Portuguese. Cotton is unique among cultivated crops in that four distinct species were domesticated two in the Old World and two in the New World. Various theories were proposed regarding the origins and development of the New World tetraploid cotton grown today from the Old World diploid species. Of the identified 39 species of cotton, upland cotton, Pima, also called Egyptian and American- Egyptian cotton, tree cotton, and Levant cotton are the only ones grown today. All four have different characteristics such as plant height, type of fiber, blooming time, and flower color. Upland cotton is cultivated in many parts of the world. Fiber length varies from 3/4 to 1-1/4 in. Pima, Egyptian, and American-Egyptian fibers range in length from 1-1/4 to 1-1/2 in. and are stronger than those of upland cotton. Old World, tree, and Levant cotton are low-yielding types and their fibers are coarse and short. Although most cotton is produced for fiber, cottonseed oil is an important commodity. The 37.1 million short tons produced in 1999 represent 11% of all vegetable oil produced. Although cotton is considered a tropical species, it is grown mostly in temperate regions where summer temperatures are hot (25 to 35 C) and more than 200 days are frost-free. Sunny weather after the bolls open helps dry the fibers for harvest. Cotton grows best in fertile (ph 6.0 to 8.0), well drained soil that receives adequate moisture during the growing season. Cotton grown in the western U.S. is normally irrigated. Periodic petiole analysis for nitrate (NO 3 ) content is used to regulate fertilization, particularly of N, to ensure balance between vegetative growth and boll set and development. In 1982, the highest verifiable cotton yield of 5.4 bales per acre was recorded in Arizona. In the U.S. in 2000, the average cotton yield was 635 lb or 1.3 bales per acre. 4.2 TERMS AND GLOSSARY TERMS Bale Bundle of raw cotton; in the U.S., a bale weighs about 500 lb (227 kg). Boll Rounded, mature seed pod of the cotton plant. Boll weevil Beetle whose young feed on cotton squares (buds), causing the squares to fall off the plants. Bur Opened seed case of the cotton plant. Carding Process of cleaning and straightening cotton fibers. Drawing Process that further straightens cotton fibers after carding and forms them into a loose rope called a drawn sliver (pronounced SLY vuhr). Ginning Separating cotton fibers from seeds. Gray-state cloth Cotton fabric in its natural grayish-white state before bleaching or dyeing; also called gray goods or greige (pronounced gray). Lint Raw, ginned cotton that is ready for baling. Linters Short fibers that remain on cotton seed after ginning. 157
189 158 Agronomic Handbook: Management of Crops, Soils, and Their Fertility Mercerization Application of an alkaline solution to cotton cloth or thread to strengthen the cotton, make it hold dye better, and give it luster. Picker Machine that separates and cleans cotton fibers. Pima cotton Cotton composed of strong, silky fibers that is used to make fine, smooth fabrics. Roving Thin strand of cotton fiber ready for spinning. Sizing Sliver Pronounced SLY vuhr; a loose rope of cotton fibers. A card sliver is thicker and has more tangled fibers than a drawn sliver. Squares Buds of cotton blossoms. Staple Average lengths of cotton fibers. Trash Leaves, stems, and other unwanted plant materials in harvested cotton. Upland cotton Most common type of cotton GLOSSARY Anther Upper portion of the stamen that contains pollen grains. Bast fiber Coarse fiber made from plant conductive tissues (e.g., phloem fibers). Boll Cotton fruit that consists (after fertilization) of the carpel wall, placental column, seeds, and cellulose fibers. Bracts Modified leaves subtending the floral buds and later the bolls. Calyx First series of floral organs, immediately external to the flower buds and later the bolls; consists of five sepals. Carpel Organ-bearing ovules along the inside margins; a unit of structure of a compound pistil; upland cotton may have three to six (usually four); Pima has three. Chalazal cap Large end of a seed or ovule where its parts merge. Corolla Collectively, the five petals of a cotton flower. Cotyledon Rudimentary or first leaves found inside a seed; the seed leaves of the embryo. Filament Lower portion of the stamen that supports the anther. Fruiting branch Branch on which pedicled fruits are borne directly from branches; terminates in a fruit; subtending leaf lateral extension is via axillary bud break; also called a sympodium. Glabrous Having no hairs or pubescence. Gossypol gland Gland found in all above-ground plant tissue; contains gossypol and related compounds that are toxic to nonruminant animals. Hirsute Having pubescence or hairs on stems or leaves. Hull Seed coat or outer covering removed by milling. Lint Cellulose fibers resulting from elongation of seed epidermal cells. Linters Fibers too short to be removed during ginning and fiber stumps left on seeds after normal ginning; linters are removed at oil mills and used in a variety of industrial products and as padding in seats and furniture. Micropyle Pointed end of a seed; opening in the integument of the ovule. Nectary Specialized structure or gland that exudes sugary nectar. Ovary Swollen basal portion of the pistil, contains the ovules or seeds. Ovule Female egg containing a haploid number of chromosomes. Peduncle Stalk supporting a flower; also called a pedicle. Petiole Stalk supporting a leaf. Phyllotaxy Distribution or arrangement of leaves on a stem; expressed as a fraction Pistil Female portion of a flower composed of the stigma, style, and ovary. Raphe Broad seam or mid-vein of a seed. Sepal One of the units of the calyx; a modified leaf. Stamen Male portion of a flower composed of filaments and anthers. Stigma Part of the pistil that receives pollen grain. Style Portion of the pistil between the stigma and the ovary.
190 Cotton (Gossypium spp.) Fiber 159 Vegetative branch Branch that does not directly bear fruit; reproductive branches that directly bear fruit may originate from vegetative branches. 4.3 PRODUCTION STATISTICS TABLE 4.1 U.S. Cotton Acreage, Yield, and Production, Year Harvested Acres (1,000) Yield (lb/acre) Production (1,000 bales) a , , , , , , , , , , , , , , , , , , b 13, ,219.5 a 480-lb net weight bales. b Preliminary. Source: National Agriculture Statistics Service, Washington, D.C., TABLE 4.2 Cotton Area, Yield, and Production of Continents and Specified Countries, Location Area (1,000 ha) Yield (kg/ha) Production (1,000 bales) a Continent North America 5, ,637 South America 1, ,455 Central America European Union 543 1,041 2,596 Eastern Europe USSR 2, ,305 Middle East 1,250 1,042 5,983 Africa 4, ,883 Asia 15, ,028 Australia 464 1,595 3,400 Country India 8, ,337 U.S. 5, ,968 China 3,726 1,028 17,600 Pakistan 2, ,600 Uzbekistan 1, ,180 World Total 32, ,357 a Bale = 480 lb. Source: Foreign Agriculture Service, Washington, D.C.
191 160 Agronomic Handbook: Management of Crops, Soils, and Their Fertility TABLE 4.3 Acreage, Yield, and Production of Leading Cotton-Producing States, 2000 State Area Harvested (1,000 acres) Yield (lb/acre) Production (1,000 bales) a Upland Cotton Texas 4, ,950 Georgia 1, ,640 Mississippi 1, ,730 Arkansas ,450 North Carolina ,440 California 770 1,371 2,200 Louisiana Alabama U.S. Total 12, ,822 Pima Cotton California 144 1, Texas U.S. Total , a 480-lb net weight bales. Source: National Agriculture Statistics Service, Washington, D.C., FERTILIZER TREATMENT TABLE 4.4 Fertilizer Application Total Acreage and Areas Receiving Applications, All States Surveyed, a a Year Nitrogen (%) Phosphate (%) Potash (%) Acres receiving one or more applications of a specific fertilizer ingredient. Source: National Agriculture Statistics Service, Washington, D.C., 2001.
192 Cotton (Gossypium spp.) Fiber NUTRIENT ELEMENT UPTAKE TABLE 4.5 Uptake of Major Elements and Micronutrients for a 1.7-Ton/Acre Cotton Lint Crop Major Elements kg Nitrogen 200 Phosphorus as phosphate 57 Potassium as potashg 95 Calcium 14 Magnesiumg 23 Sulfur 20 Micronutrients g Boron 120 Copper 110 Iron 140 Manganese 190 Molybdenum 2 Zinc 480 Source: International Soil Fertility Manual, 1995, Potash & Phosphate Institute, Norcross, GA. With permission. TABLE 4.6 Nutrient Element Uptake and Removal by 2,500 kg/ha Cotton Crop Major Elements kg/ha Nitrogen 156 Phosphorus 36 Potassium 151 Calcium 168 Magnesium 40 Micronutrients g/ha Boron 3 Copper 120 Iron 2,960 Manganese 250 Zinc 116 TABLE 4.7 Nutrient Element Utilization (lb/acre) by Cotton Crop Nutrient Element Yield Level 1,000 lbs/acre 2,000 lbs/acre Nitrogen Phosphorus as phosphate Potassium as potash Magnesium Sulfur 28 30
193 162 Agronomic Handbook: Management of Crops, Soils, and Their Fertility 4.6 NUTRIENT ELEMENT SUFFICIENCY (LEAF AND PETIOLE ANALYSIS) TABLE 4.8 Nutrient Element Sufficiency Ranges Major Elements First Squares to Initial Bloom Sufficiency Range a % Full Bloom Nitrogen Phosphorus Potassium Calcium Magnesium Sulfur Micronutrients ppm Boron Copper Iron, Manganese Zinc a Sampling procedure: Column 2, 25 vegetative stems, first squares to initial bloom; Column 3, vegetative stems, full bloom. Source: Plant Analysis Handbook II: A Practical Sampling, Preparation, Analysis, and Interpretation Guide, 1996, MicroMacro Publishing, Athens, GA. With permission. TABLE 4.9 Petiole Nitrate-Nitrogen (NO 3 -N) Levels for Sufficiency (ppm) Nitrate-Nitrogen Content Status First Square First Flowers First Bolls First Open Bolls Sufficient 18,000 12,500 7,000 3,500 Deficient 12,000 7,500 3,000 1,500 Source: IFA World Fertilizer Use Manual, 2000, International Fertilizer Industry Association, Paris.
194 Cotton (Gossypium spp.) Fiber 163 FIGURE 4.1 Sufficiency range for cotton petiole nitrate (NO 3 ) in Arkansas. 4.7 NUTRIENT ELEMENT DEFICIENCIES TABLE 4.10 Nutrient Element Deficiency Symptoms Symptom Causal parasites or viruses absent Localized effects and decreased growth Effects localized on older or lower leaves or generalized on whole plant Local symptoms occurring as mottling or chlorosis with or without necrotic spotting (areas of dead tissue) on lower leaves; little or no drying up of lower leaves Lower leaves brittle, curved, or cupped under; yellowish-white mottling between veins; necrotic spots Lower leaves purplish-red with green veins Symptoms general; yellowing and drying or firing of lower leaves Plants light green; lower leaves yellow, drying to brownish color Plants dark green; leaves and plants small; maturity delayed Phosphorus Pronounced interveinal chlorosis and bronzing of leaves that become brittle with upturned margins; maturity delayed Effects localized on terminal growth (newer or bud leaves) Dieback involving terminal buds, resulting in many-branched plant Young leaves; yellowish-green flower buds; chlorosis; early indications are banded petioles and ruptured peduncles Terminal buds remain alive; chlorosis of upper or bud leaves; leaves yellowish-gray or reddishgray with green veins Young leaves first affected, turning pale green; older leaves remain greener; plants dwarfed Deficient Element All deficiencies All deficiencies Potassium Magnesium Nitrogen Zinc Boron Manganese Sulfur
195 164 Agronomic Handbook: Management of Crops, Soils, and Their Fertility TABLE 4.11 Nutrient Element Deficiency Descriptions Element Nitrogen Phosphorus Potassium Magnesium Sulfur Manganese Zinc Boron Deficiency Symptom Reduced yield and quality; visible symptoms are light green plants; lower leaves drying to brownish color Plants are short and small; growth is retarded; maturity is postponed; typical symptoms are loss of chlorophyll and development of discolored red leaves Plants are susceptible to stem blight leading to premature senescence; typical symptoms are bronzing and marginal necrosis of leaves adjacent to developing bolls; plants fully necrotic; premature defoliation Lower purplish red leaves with green veins Dwarfed plants with green leaves Leaves are yellowish or reddish grey with green veins Small leaves with interveinal chlorosis and shortened stems giving plants a small bushy appearance; slow in development; leaves lose green color and develop necrotic spots Plants produce clittelums and dieback of terminal buds that do not blossom and decrease production; young leaves turn yellowish green; flower buds chlorotic BORON (B) Deficiency Symptoms Unthrifty, low-yielding crops: Mildly deficient crops lack vigor and yield poorly. Affected plants are stunted and have short, stout stems and dark green leaves. Branching may not be reduced but branches are shorter than usual and give the plant a bushy look. Flower production is lower and few bolls may set. In severely deficient crops, the plants often die before flowers are formed. Dark green, vertical younger leaves: All leaves are dark green. Young leaves hang down and point toward the ground, with their margins cupped under so that they appear to fold around the upper stems. Old leaves remain flat and are held more horizontally. Shortened internodes and deaths of apical buds: Because B is not transferred from old to young leaves, the youngest tissues are the most affected. The upper internodes are very short and the youngest leaves crowd together at the shoot tips. Young buds often die, preventing further growth of the stems. Many lateral branches appear but their apical buds also die. Entire plants die if the deficiency persists Problem Soils Boron deficiency is likely to occur in: Soils derived from parent material low in B, such as acid igneous rocks or freshwater sediments Sandy soils from which B has been leached by heavy rainfall Alkaline soils, especially those containing free lime Soils low in organic matter Acid peat and muck soils Correcting Deficiency Boron deficiency can be corrected by soil dressings or foliar sprays of B fertilizers. Soil dressings are more effective if broadcast and mixed into the soil some months before sowing. Borax, boric acid, and chelated boron compounds are suitable for soil application. Boric acid and chelated B compounds
196 Cotton (Gossypium spp.) Fiber 165 are suitable for foliar sprays that should be applied 5 to 6 weeks after seedling emergence or as soon as symptoms appear. While soil dressings often remain effective for many years before fresh applications are needed, foliar sprays have no residual value and must be reapplied to every crop. Tests can estimate the amount of available B in a soil and predict whether fertilizer is needed. The best prediction can be obtained by seeking advice on fertilizer practices used on similar soils in the district CALCIUM (Ca) Deficiency Symptoms Unthrifty, low-yielding crops: Mildly deficient crops are unthrifty, lack vigor, and yield poorly. Affected plants are stunted and have thin stems and dark green leaves. They appear wilted, with stems bent over and leaves and petioles hanging limply down around the stems. Branching is severely reduced and fewer flowers and bolls are produced. Yields of lint and seed are very low. In severe deficiencies, the apical buds die, causing many plants to die before maturity. Wilted plants: Deficient plants wilt even when ample water is available. The stems bend over and the leaves and petioles hang limply down around the stems. Shortened internodes and deaths of apical buds: Because Ca is not transferred from old to young tissues, symptoms are more severe in developing tissues. The internodes at the tops of the shoots fail to elongate and give the plants a bushy or rosetted appearance. The young buds at the top of the main shoots and the stems immediately below them turn dark brown and die. The lateral buds in the axils of the leaves begin to grow, then brown and die. Similar brown lesions appear on the bases of petioles, causing the leaves to die. All severely affected plants eventually die Problem Soils Calcium deficiency is likely to occur in: Acid sandy soils from which Ca has been leached by heavy rainfall Strongly acid peat and muck soils whose total Ca is low Alkaline or sodic soils in which exchangeable Na and ph are high, thus depressing Ca uptake by plants Soil with high levels of soluble Al and low levels of exchangeable Ca Correcting Deficiency Calcium deficiency can be corrected by broadcasting a suitable fertilizer and mixing it into the soil some months before sowing. Where the problem is only a lack of Ca, suitable fertilizers are gypsum (calcium sulfate) and calcium nitrate or chloride. If the soil ph is low, lime or limestone (calcium carbonate) and dolomite (a mixture of calcium and magnesium carbonates) are more suitable. Tests can determine lime or Ca requirements. The correct application rate application depends on soil type and the crop to be grown. Advice should be sought on fertilizers used on similar soils in the district. Excessive lime use may induce deficiencies of K, Mg, Fe, Mn, Zn, and Cu, and care should be taken to prevent overliming COPPER (Cu) Deficiency Symptoms Unthrifty, low-yielding crops: Copper deficiency is rare in cotton and the only signs of disorders may be unthriftiness and poor yields. Affected plants are stunted and have short stems and dull green leaves. Branching is reduced and severely deficient plants may not branch. Fewer flowers are produced and the number of bolls set is reduced.
197 166 Agronomic Handbook: Management of Crops, Soils, and Their Fertility Wilted plants: The leaves of Cu-deficient plants appear limp and wilted. The leaves are held almost vertically with the tips and margins cupped or pointed downward. Interveinal chlorosis on older leaves: As symptoms progress, faint, dull yellow interveinal chlorosis develops on old leaves. The veins and adjacent tissues remain dark green. If the deficiency persists, the symptoms advance up the plants to young leaves. The youngest leaves remain dark green but may be smaller than usual Problem Soils Copper deficiency is likely to occur in: Peat and muck soils whose organic matter ties up soluble Cu in forms less available to plants Alkaline sands whose total Cu is low Leached acid soils that have low total Cu Soils formed from rocks low in Cu Correcting Deficiency Foliar sprays and soil dressings of salts such as copper sulfate (bluestone) or copper chelates have corrected Cu deficiencies. Soil dressings should be applied and mixed into the soil some weeks before sowing. However, they may fail to correct deficiencies in some seasons and symptoms may reappear. If this occurs, foliar sprays should be applied immediately. A reliable remedy is to apply foliar sprays of 0.5 to 1% solutions of soluble Cu salts (for example, 0.5 to 1 kg copper sulfate per 100 L water per ha), the first applied 4 to 6 weeks after seedling emergence. Additional sprays should be applied as soon as symptoms reappear. Tests can estimate the amount of available Cu in a soil and predict whether fertilizer is needed. The best prediction can be obtained by seeking advice on fertilizer practices used on similar soils in the district IRON (Fe) Deficiency Symptoms Unthrifty, low-yielding crops: Iron-deficient crops lack vigor and yield poorly. Affected plants are only slightly smaller than usual unless a deficiency has been prolonged. They then become shorter and develop thin stems and pale green to yellow foliage. Branching, flower production, and boll set may not be greatly affected unless the deficiency persists, in which case all will be reduced. Interveinal chlorosis on younger leaves: Because Fe is not transferred from old to young leaves, symptoms appear first and are more severe on young leaves. Old leaves remain dark green and appear healthy. Pale green to yellow interveinal chlorosis develops on young leaves. The veins remain green and prominent during the early stages of symptom development but fade to become barely visible when the deficiency persists. Affected leaves may appear limp and the tips and margins hang down as if wilted. They do not develop marginal necrotic lesions nor do the margins become excessively wavy or cupped up or down Problem Soils Iron deficiency is likely to occur in: Alkaline soils whose levels of soluble Fe are low Waterlogged soils
198 Cotton (Gossypium spp.) Fiber 167 Acid soils with excessively high levels of soluble Mn, Zn, Cu, and Ni that depress Fe uptake by plants Sandy soils low in total Fe Peat and muck soils in which organic matter ties up Fe Correcting Deficiency While soil dressings of inorganic Fe salts such as iron sulfates or chlorides have corrected deficiencies in some soils, the applied Fe quickly becomes insoluble and less available to plants. Fe salts of various organic chelates are more promising as soil dressings because the chelate has the ability to keep Fe in solution. For acid soils, FeEDTA is the most effective chelate. FeHEDTA and FeDTPA are best on neutral soils and FeEDDHA is best on alkaline soils. However, large amounts of chelates may be required to be effective and may prove too costly. An equally effective remedy is to apply solutions of inorganic salts or chelates to the foliage (1% solutions or 1 kg salt per 100 L water per ha). Because Fe is so immobile in plants, sprays may need to be applied every 10 to 15 days to provide Fe to new leaves. Advice on fertilizer practices used on similar soils in the district should be sought to obtain the best remedies for affected crops under local conditions MAGNESIUM (Mg) Deficiency Symptoms Unthrifty, low-yielding crops: Magnesium-deficient crops lack vigor and yield poorly. Affected plants are stunted and have short, thin stems and pale green foliage. Branching is severely affected and deficient plants are often single-stemmed The yields of lint and seed are much reduced as a result of the lower numbers of flowers and bolls produced. Interveinal chlorosis on older leaves: Because Mg is readily transferred from old to young leaves, symptoms appear first and are more severe on old leaves, working up the plants to young leaves if the disorder persists. Pale green to yellow interveinal chlorosis develops on older leaves. The main and smaller veins remain green and prominent. Young leaves remain dark green and appear healthy. Interveinal necrosis on older leaves: If a deficiency persists and becomes severe, small, pale brown necrotic lesions develop in the yellow interveinal areas in the bodies of leaves. Eventually, the necrotic lesions join together. They initially leave the veins green and unaffected. Finally, the veins are affected and the leaves die and fall Problem Soils Magnesium deficiency is likely to occur in: Acid sandy soils from which Mg has been leached Strongly acid peat and muck soils whose total Mg is low Soils that have been over-fertilized with Ca (for example, lime) or K and whose Mg uptake is inhibited Correcting Deficiency Magnesium deficiency in acid soils is best corrected by broadcasting dolomite (a mixture of calcium and magnesium carbonates) and mixing it into the soil some months before sowing. When the problem is only Mg deficiency, band applications of magnesium sulfate or chloride at or before planting may be effective.
199 168 Agronomic Handbook: Management of Crops, Soils, and Their Fertility Tests can estimate the amounts of soluble and exchangeable Mg in the soil, and predict the amount of fertilizer required. The best prediction can be obtained by seeking advice on fertilizer practices used on similar soils in the district. Magnesium deficiency in existing crops can be corrected by applying soluble salts such as magnesium sulfate, chloride, or nitrate with irrigation water. Foliar sprays of similar salts are usually not recommended because of the large number of applications needed to meet crop requirements MANGANESE (Mn) Deficiency Symptoms Unthrifty, low-yielding crops: Manganese-deficient crops lack vigor and yield poorly. Affected crops may appear patchy. Plants in Mn-poor areas are stunted and have short, stout stems and dark to pale green foliage. Branching is reduced and few flowers and bolls are produced. Interveinal chlorosis on younger leaves: Because Mn is not readily transferred from old to young leaves, symptoms appear first and are more severe on young leaves. Old leaves usually remain dark green and appear healthy. Young leaves are small, turn pale green, then develop faint yellow interveinal chlorosis that becomes more distinct if the deficiency persists. The veins remain green and easily seen. The margins of affected leaves cup down or roll beneath the leaves. Brown necrotic lesions on younger leaves: When a deficiency becomes severe, small dark brown necrotic lesions develop within the chlorotic areas on young leaves. The surrounding tissue may become puckered and produce a distorted appearance Problem Soils Manganese deficiency is likely to occur in: Strongly alkaline soils whose Mn is less available to plants Poorly drained, peaty soils in which Mn is tied up in less available forms Strongly acid, sandy soils from which soluble Mn has been leached by heavy rain Soils formed from rocks low in Mn Correcting Deficiency Foliar sprays and soil dressings of Mn salts and oxides have been used to correct deficiencies. Soil dressings are more effective when broadcast and mixed into soil some weeks before sowing. However, foliage applications are generally more successful. One or more foliar sprays of 0.5 to 1% solutions of soluble Mn salts (for 0.5 to 1 kg manganese sulfate per 100 L water per ha) usually correct the deficiency, the first applied 5 to 6 weeks after seedling emergence. If the symptoms reappear, the spray should be repeated immediately. While soil dressings usually last 5 to 6 years before fresh applications are needed, foliar sprays must be reapplied to every crop. Tests can estimate the amount of available Mn in a soil and predict whether fertilizer is needed. The best prediction can be obtained by seeking advice on fertilizer practices used on similar soils in the district NITROGEN (N) Deficiency Symptoms Unthrifty, low-yielding crops: Nitrogen-deficient crops are unthrifty, lack vigor, and are slower to mature. Affected plants are stunted and have short, thin stems that often develop bright red pigmentation on the lower sections. Leaves are small, pale green to yellow, and often hang vertically and fold inward towards the stems. Branching is reduced and severely deficient plants
200 Cotton (Gossypium spp.) Fiber 169 are usually single-stemmed. Flower production is reduced and immature bolls may be shed before maturity. As a result, yields of lint and seed are low. Pale yellow older leaves: Because N is readily transferred from old to young leaves, symptoms develop first and are more severe on old leaves, working up the plants to young leaves if the disorder persists. Old leaves turn pale green, then pale yellow, and develop brown necrosis, usually in interveinal areas, before dying and falling. Young leaves are small and remain green Problem Soils Nitrogen deficiency is likely to occur in: Sandy soils that have been leached by heavy rainfall or excessive irrigation Soils low in organic matter Soils with a long history of cropping, in which supplies of N are exhausted However, even fertile soils may suffer temporary N deficiency when double-cropped, heavily leached, or waterlogged Correcting Deficiency Nitrogen deficiency is corrected by increasing levels of available N in the soil by fallowing, which allows organic N to be converted to mineral N; by growing cover or cash crops of legumes, which can fix atmospheric N 2 ; or by adding nitrogenous fertilizers. Suitable fertilizers are urea, gaseous ammonia or ammonium sulfate, nitrate, and phosphates. Crop growth depends on the amount of nitrate (NO 3 )-N already in the soil. Tests can measure the amounts of total N and nitrate (NO 3 )-N in the soil prior to sowing, and predict the amount of fertilizer required. The best prediction can be obtained by seeking advice on fertilizer practices used on similar soils in the district. Nitrogen deficiency in existing crops can be corrected by applying soluble salts, such as urea, with irrigation water or as a foliar spray. Spray applications usually result in a rapid response of short duration, and additional sprays 10 to 14 days apart may be needed to supply enough N for the crop PHOSPHORUS (P) Deficiency Symptoms Unthrifty, low-yielding crops: Phosphorus-deficient crops are unthrifty and yield poorly. Affected plants are very stunted and have short, thin stems which often have red-brown pigmentation on their lower sections. Leaves are small and dark green. Branching is reduced and severely deficient plants are often single-stemmed. Flower production is delayed and reduced. Because fewer bolls are set, yields of lint and seed are low. Necrosis of older leaves: Because P is readily transferred from old to young leaves, symptoms appear first and are more severe on old leaves, working up the plants to young leaves if the deficiency persists. All leaves are small and dark green. Old leaves develop dull yellow chlorosis on the margins, which is rapidly followed by grey necrosis. The necrosis advances rapidly into interveinal areas, killing the leaves, which then readily fall Problem Soils Phosphorus deficiency is likely to occur in: Soils low in organic matter Soils with a long history of cropping and exhausted P supplies
201 170 Agronomic Handbook: Management of Crops, Soils, and Their Fertility Highly weathered, Fe-rich soils whose phosphate is fixed in less available forms Soils that have lost topsoil through erosion Alkaline soils whose P may be tied up in insoluble phosphates that are less available to plants Correcting Deficiency Phosphorus deficiency can be corrected by applying phosphatic fertilizers to the soil at or before sowing. Suitable fertilizers are single or triple superphosphates or phosphates. The growth of crops depends on the amounts of water-soluble phosphates and the rates of exchange between soluble and insoluble forms of P compounds in the soil. Tests can estimate the amount of available phosphate in a soil and predict whether fertilizer is needed. The best prediction can be obtained by seeking advice on fertilizer practices used on similar soils in the district. Phosphorus deficiency in existing crops can be corrected by applying soluble salts, such as ammonium phosphates, with irrigation water. Spray applications of similar salts are usually not recommended because of the large number needed to supply crop requirements POTASSIUM (K) Deficiency Symptoms Unthrifty, low-yielding crops: Potassium-deficient crops are unthrifty, mature slowly, and yield less. Affected plants are stunted and have short, thin stems, and small green leaves. Branching is reduced and fewer flowers and bolls are produced. Yields of lint and seed are much reduced. Interveinal chlorosis of older leaves: Because K is readily transferred from old to young leaves, symptoms develop first and are more severe on old leaves. If the deficiency persists, the symptoms advance up the plants to young leaves. They start with blotchy, pale yellow, interveinal chlorosis on old leaves. Young leaves remain dark green and appear healthy. Marginal necrosis on older leaves: If a deficiency persists, pale brown or dark purple-brown necrosis develops on the margins of affected leaves. The lesions advance into interveinal areas and the margins of the leaves tend to cup downward. The major veins remain green and are easily seen. Necrotic lesions on petioles: In severely deficient plants, necrotic lesions often develop on the petioles of affected older leaves Problem Soils Potassium deficiency is likely to occur in: Soils low in organic matter after many years of cropping Sandy soils formed from parent material low in K Light textured soils from which K has been leached by heavy rainfall Correcting Deficiency Potassium deficiency is corrected by applying potassium nitrate, sulfate, or chloride to the soil at or before sowing. Crop yield depends on the amounts of water-soluble and exchangeable K in the soil. Tests can measure the amount of available K in the soil and predict the amount of fertilizer needed. The best prediction can be obtained by seeking advice on fertilizer practices used on similar soils in the district. Potassium deficiency of existing crops can be corrected by applying soluble K salts, such as potassium sulfate, chloride, or nitrate, with irrigation water. The foliar application of similar salts is usually not recommended because of the large number of sprays needed to meet crop requirements.
202 Cotton (Gossypium spp.) Fiber SULFUR (S) Deficiency Symptoms Unthrifty, low-yielding crops: Sulfur deficiency causes unthriftiness, lack of vigor, and poor yield. Affected plants are stunted and have short, thin stems and small, pale green to yellow leaves. Branching is reduced, fewer flowers are produced, and fewer bolls set. As a result, yields of lint and seed are reduced. Pale yellow younger leaves: Because S is not readily transferred from old to young leaves, symptoms develop first and are more severe on young leaves. They begin when entire plants turn pale green. The youngest leaves then develop general pale yellow chlorosis that includes the veins. If the deficiency persists and becomes severe, pale brown necrotic lesions may develop in tissues adjacent to the margins of affected leaves. In addition, the margins often become excessively wavy or cupped upward. Old leaves remain pale green and do not develop marginal symptoms Problem Soils Sulfur deficiency is likely to occur in: Soils low in organic matter after many years of cropping Soils formed from parent material low in S (for example, some volcanic rocks and ash) Acid sandy soils from which sulfates have been leached Correcting Deficiency The application of soil dressings of any S fertilizer will correct a deficiency. On alkaline soils, elemental S (flowers of sulfur) may be broadcast and thoroughly mixed into the soil about 4 months before sowing. On neutral or acid soils, gypsum (calcium sulfate) is a useful source of S. Tests can measure the amount of available sulfate in the soil before sowing and predict the amount of fertilizer required. The best prediction can be obtained by seeking advice on fertilizer practices used on similar soils in the district. Sulfur deficiency in existing crops can be corrected by applying soluble sulfate salts, such as magnesium, ammonium, or potassium sulfate, in irrigation water. Foliar sprays of similar salts are usually not recommended because of the large number of applications needed to supply crop requirements ZINC (Zn) Deficiency Symptoms Unthrifty, low-yielding crops: Zinc-deficient crops lack vigor and are unthrifty. Areas of poor growth may occur adjacent to healthy, apparently normal plants, giving the crop a patchy appearance. Plants in Zn-poor areas are stunted and have short, thin stems. Leaves are smaller than usual and may be dark or pale green, with or without brown necrotic lesions. Branching is reduced and fewer flowers and bolls are set. As a result, yields of lint and seed are low. Brown necrotic lesions on older leaves: In young plants, symptoms appear as dark brown necrotic lesions in interveinal areas of the cotyledons and older true leaves. These lesions develop without prior chlorosis and initially do not affect the veins. The margins of affected leaves often cup upward. Eventually, the lesions join together and affect the veins, killing the leaves, which then fall. Chlorosis and malformation of younger leaves: If a deficiency persists, pale yellow, blotchy chlorosis develops on young leaves. The youngest leaves do not grow and are often malformed and have holes or torn margins. By this stage, the youngest internodes are very short and the plant has a bushy appearance. The malformed leaves form rosettes at the tops of the shoots.
203 172 Agronomic Handbook: Management of Crops, Soils, and Their Fertility Problem Soils Zinc deficiency is likely to occur in: Strongly alkaline soils whose availability of Zn is depressed Leached sandy soils whose total Zn is low Leveled soils whose Zn-deficient subsoils may be exposed on the surface Soils in which heavy frequent applications of phosphatic fertilizers may have reduced the use of Zn by crops Correcting Deficiency Foliage and soil applications of Zn salts have been used to correct deficiencies. Soil dressings of Zn chelates, sulfates or oxides should be broadcast and mixed into the soil 2 to 3 months before sowing. Soil-applied Zn lasts 6 to 8 years before fresh applications are needed, but foliar sprays have no residual effects and fresh applications must be made to each crop. The best results from foliar sprays are obtained when a 0.5 to 1% solution of a soluble Zn salt (for example, 0.5 to 1 kg zinc sulfate heptahydrate per 100 L water per ha) is applied 2 to 3 weeks after seedling emergence. Additional sprays should be applied as soon as symptoms reappear. Tests can estimate the amount of available Zn in a soil and predict whether fertilizer is needed. The best prediction can be obtained by seeking advice on fertilizer practices used on similar soils in the district. 4.8 SALINITY AND TOXICITY TOXICITY SYMPTOMS Unthrifty, low-yielding crops: Excess sodium chloride (NaCl) in soils causes a lack of vigor, poor yields or lint and seed, and unthriftiness. Affected plants are stunted and have short stems that may develop red pigmentation if the toxicity persists for a long time. Leaves are dark green, often much smaller than usual, and have a harsh appearance. If the toxicity is mild and persists for some time, the leaves may be held vertically and point downward to produce a wilted appearance. Necrosis on older leaves: Excess sodium chloride accumulates in older tissues. Therefore, symptoms appear first and are more severe on old leaves. If the toxicity develops slowly over time, small, purple-brown lesions appear on the margins of older leaves and advance into interveinal areas as the toxicity progresses. Eventually, small, grey necrotic lesions appear in interveinal areas. Similar grey necrotic lesions represent the first symptom when toxicity develops rapidly, perhaps as a result of irrigation or flooding with very saline water. The grey lesions join and eventually all interveinal tissues die, leaving the major veins green. The leaves then die and fall PROBLEM SOILS Sodium chloride toxicity is more likely to occur in: Saline soils formed from salt-water sediments Previously fertile soils that were flooded or heavily irrigated with water containing high concentrations of NaCl CORRECTING TOXICITY Leaching with good quality irrigation water is the most effective means of removing excess Na or Cl from soil. The water table may have to be lowered. Permeable soils such as well structured
204 Cotton (Gossypium spp.) Fiber 173 sandy soils are often easily reclaimed, but the problem is more difficult in less permeable soils (for example, poorly structured heavy clays). If exchangeable Na in the soil is high, reclamation involves replacing the adsorbed Na with Ca by applying gypsum (calcium sulfate) and leaching the dissolved Na and Cl beyond the rooting depths of the plants. If irrigation water is to be used to leach the Na, its quality should be checked before use to make sure it is not saline. Where excess NaCl cannot be wholly corrected by soil leaching, a more tolerant species may have to be grown. 4.9 WEIGHTS AND MEASURES Conversion Factor One bushel of ginned cotton is approximately equal to 3.26 lb seed cotton including trash. TABLE 4.12 Cotton Seeds/lb, Weight/bu, and Germination Time Seeds/lb (1,000) Seeds/g (no.) Weight/bu (lb) Germination Time (days) TABLE 4.13 Cotton Weights and Measures Approximate Net Weight Commodity Unit lb kg Cotton bale, gross bale, net Cottonseed bushel Cottonseed oil gallon Source: U.S. Department of Agriculture, Agricultural Statistics, 2001, U.S. Government Printing Office, Washington, D.C. REFERENCES 1. Smith, C.W., Crop Production: Evolution, History, and Technology, 1995, John Wiley & Sons, New York. 2. Grundon, N.J., Hungry Crops: A Guide to Nutrient Deficiencies in Field Crops, 1987, Queensland Department of Primary Industries, Brisbane, Australia.
205
206 5 Sugar Beet (Beta vulgaris L. spp.) 5.1 INTRODUCTION The sugar beet belongs to the Chenopodiaceae (goosefoot) family. It is known as betterave a sucre in French, remolacha azucar in Spanish, barbabietola zucchero in Italian, and zuckerruebe in German. Sugar beets grow best in regions that have sunny days and cool nights. They require slightly acid to neutral soils (ph 5.8 to 7.0) and high water requirements. They are frequently grown under irrigation. The enlarged portion of the root is called the beet. It normally weighs 1-1/2 to 3 lb and has a tap root extending to soil depths of 2 to 5 feet. The sugar (sucrose) content of a beet ranges from 15 to 20% of fresh weight. Sugar content is affected by climate. Near-harvest moisture stress increases percent of beet sugar content. Fertility (nitrogen) stress increases beet sugar content. It takes about 1.07 tons of raw sugar to produce 1 ton of refined sugar. The primary beet-growing states are California, Idaho, Michigan, Minnesota, and North Dakota. Oregon in the leading producer of sugar beet seeds. 5.2 PRODUCTION STATISTICS TABLE 5.1 U.S. Harvested Acreage, Yield, and Production, Year Harvested Acres (1,000) Yield (tons/acre) Production (1,000 tons) , , , , , , , , , , , , , , , , , , a 1, ,521 a Preliminary. Source: National Agriculture Statistics Service, Washington, D.C.,
207 176 Agronomic Handbook: Management of Crops, Soils, and Their Fertility TABLE 5.2 U.S. Acreage, Yield, and Production by Leading States, 2000 State Area Harvested (1,000 acres) Yield (tons/acre) Production (1,000 tons) Minnesota ,245 North Dakota ,127 Idaho ,694 Michigan ,403 California ,039 U.S. Total 1, ,521 Source: National Agriculture Statistics Service, Washington, D.C. TABLE 5.3 Leading Sugar Beet- Growing Countries a Country Short Tons of Sugar Beets ( 1,000) France 34,756 Ukraine 34,447 Germany 38,732 Russia 28,135 U.S. 27,789 Turkey 16,915 China 14,975 Italy 14,677 U.K. 10,080 a Figures represent 2-year average, Source: United Nations Food and Agriculture Organization, Rome.
208 Sugar Beet (Beta vulgaris L. spp.) NUTRIENT ELEMENT REMOVAL AND UTILIZATION TABLE 5.4 Average Nutrient Element Removal by a 10-Ton Sugar Beet plus Foliage Crop Element kg Nitrogen Phosphorus as phosphate Potassium as potash Magnesium as oxide Sulfur 5 TABLE 5.5 Variations of Nutrient Element Removal by Sugar Beets Depending on Cultivation Intensity Intensity Yield (tons/ha) Beets/ha Nutrient Element (kg/ha) Nitrogen Phosphorus Potassium Magnesium Sulfur Low 20 30, Medium 40 50, High 60 75, Source: IFA World Fertilizer Use Manual, 2000, International Fertilizer Industry Association, Paris. TABLE 5.6 Nutrient Element Utilization by a 30-Ton/Acre Sugar Beet Crop Nutrient Element Amount (lb/acre) Nitrogen 255 Phosphorus as phosphate 40 Potassium as potash 550 Magnesium 80 Sulfur 45
209 178 Agronomic Handbook: Management of Crops, Soils, and Their Fertility 5.4 PLANT ANALYSIS GUIDE TABLE 5.7 Sugar Beet Plant Analysis Nutrient Element Plant Part Critical Value, Field Sample b,c Concentration of Element a Range Showing Deficiency Symptoms d Range without Deficiency Symptoms e Boron Blade Calcium Petiole 1 g/kg g/kg 2 25 g/kg Blade 5 g/kg 1 4 g/kg 4 15 g/kg Chlorine Petiole 4 g/kg g/kg 8 85 g/kg Copper Blade <2 <2 Iron Blade Magnesium Petiole g/kg 1 7 g/kg Blade g/kg 1 25 g/kg Manganese Blade Molybdenum Blade Nitrogen (NO 3 -N) Petiole 1, ,000 Storage root 1, ,000 Phosphorus (H 2 PO 4 -P) Petiole ,000 Blade ,000 8,000 Seedling Petiole 1, ,300 1,600 5,000 Blade 3, ,700 3,500 14,000 Cotyledon 1, ,600 13,000 Potassium (Na >1.5%) Petiole 10 g/kg 2 6 g/kg g/kg Blade 10 g/kg 3 6 g/kg g/kg Potassium (Na <1.5%) Petiole f 5 20 g/kg g/kg Blade 10 g/kg 4 5 g/kg g/kg Sodium Petiole g/kg Blade g/kg Sulfur (SO 2-4 -S) Blade ,000 Zinc Blade a All concentrations are on a dry weight basis and are noted as mg/g (ppm) except when noted as g/kg; (g/kg)10 1 = %. b Critical concentration is nutrient element concentration at which plant growth begins to decrease in comparison with plants above the critical concentration. c All critical concentrations except for P in seedlings and N in roots are based on a sample of leaves that just fully expanded. d Leaf material for chemical analysis must be collected shortly after appearance of leaf symptoms; otherwise, deficient plants may accumulate nutrients in leaves without restoring chlorotic tissues to normal. Use a color atlas to identify what deficiency, if any, occurred. e The upper value reported is the highest observed to date for normal plants. Abnormally high values are often associated with other nutrient deficiencies; for example, blades low in Fe may contain up to 40 g Ca/kg. f Because of the influence of Na on K content of petioles, blades must be used for K analysis when petioles contain <15 g Na/kg. Source: Soil Testing and Plant Analysis, 3rd ed., Soil Science Society of America, Madison, WI.
210 Part II Soil Classifications and Physical Characteristics
211
212 6 Major Soil Classification Systems 6.1 INTRODUCTION Scientists of the U.S. Department of Agriculture (USDA) first proposed a soil classification scheme. The original classification scheme was published in 1949 with the somewhat cryptic designation of first approximation. The system was refined through six succeeding approximations after distribution to soil scientists throughout the U.S. The seventh approximation was considered satisfactory. Soil classification is defined as the systematic arrangement of soils into groups or categories on the basis of their characteristics. Broad groupings are made on the basis of general characteristics and subdivisions on the basis of more detailed differences in specific properties. 6.2 SOIL TAXONOMY A category is the aggregate of classes formed by differentiation within a population on a single basis. A category includes the entire population. It includes all classes differentiated on one basis. It is distinguished from a class, which is only one part of a category and is definable only in terms of the basis of differentiation. The higher categories of a hierarchy have fewer classes and they are more inclusive than the classes of the lower categories that include attributes from all the higher categories. Thus, high categorical levels are associated with high-level generalizations or abstractions. These abstractions are used as the bases of differentiation, but these ideas are expressed in terms of attributes assumed to be their consequences. Thus, soil attributes thought to be the results of such processes are the criteria used to segregate soils. The definitions of categories, orders, series, and other terms, although not entirely clear, are intended to guide the selection and testing of properties and features used to characterize and classify soils. Soils thought to reflect processes or control processes are of great importance in this system. Although the processes of formation are influential in the selection of properties, the properties determine the placement of soils into classes. The applications of quantified definitions and observations are the tests of adequacy of the theories behind this model. Hence, soil taxonomy is considered a morphogenetic classification system ORDER Classes at the order level are separated on the basis of properties resulting from the major processes and pathways of soil formation. Neither the genetic processes nor the courses of development are precisely known, but the accepted concepts influenced the selection of soil properties used to recognize and define the 12 classes currently considered. Many features are thought to have taken a long time to develop, are stable in a pedological sense, and are mainly static historically SUBORDER Classes at the suborder level are separated within orders on the basis of soil properties that serve as major controls or reflect such controls on the current set of soil-forming processes. Most 181
213 182 Agronomic Handbook: Management of Crops, Soils, and Their Fertility properties selected, such as soil moisture regime or cold soil temperatures, are dynamic. Other properties, such as sand or alluvial sedimentation, relate to materials or processes that retard horizon development GREAT GROUP Classes at the great group level are differentiated within suborders on the basis of properties that constitute subordinate or additional controls or reflect such controls on the current set of soilforming processes. The properties selected, such as layers that retard percolation of water or root extension, are generally static, but some, such as moisture regime if not a criterion at the suborder level, are dynamic SUBGROUP Classes at the subgroup level are differentiated within great groups on the basis of properties resulting from (1) blending or overlapping of sets of processes in space or time that causes one kind of soil to develop from or toward another kind of soil that has been recognized at the great group, suborder, or order level; or (2) sets of processes or conditions not recognized as criteria for any class at a higher level. A third kind of subgroup fits neither (1) nor (2) and is considered to typify the central concept of the great group FAMILY Classes at the family level are separated with subgroups on the basis of properties that reflect important conditions affecting behavior or potential for further change. Particle size, mineralogy, and soil depth are mainly capacity factors, whereas soil temperature and exchange activity are intensity factors SERIES Classes at the series level are separated within families on the basis of properties that reflect relatively narrow ranges of soil-forming factors and processes that transform parent materials into soils. Some properties, such as coarse fragments, sand or silt content, color, and horizon thickness or expression, are indicative of parent materials. Others reflect influences on processes such as differences in intensity or amounts of precipitation and depth to the presence or concentration of soluble compounds. 6.3 SOIL ORDERS (U.S. SYSTEM OF SOIL TAXONOMY) 1 Alfisols Mineral soils that have umbric or ochric epipedons and argillic horizons, and hold water at <1.5 MPa tension for at least 90 days when the soil is warm enough for plants to grow outdoors. Alfisols have a mean annual soil temperature of <8 C or a base saturation in the lower part of the argillic horizon of 35% or more when measured at ph 8.2. Aridisols Mineral soils that have an aridic moisture regime, an ochric epipedon, and other pedogenic horizons, but no oxic horizon. Entisols Mineral soils that have no distinct subsurface diagnostic horizons within 1 m of the soil surface. Histosols Organic soils that have organic soil materials in more than half of the upper 80 cm, or are of any thickness if overlying rock or fragmental materials have interstices filled with organic soil materials.
214 Major Soil Classification Systems 183 Inceptisols Mineral soils that have one or more pedogenic horizons in which mineral materials other than carbonates or amorphous silica have been altered or removed but not accumulated to a significant degree. Under certain conditions, Inceptisols may have an ochric, umbric, histic, plaggen, or mollic epipedon. Water is available to plants more than half of the year or more than 90 consecutive days during a warm season. Mollisols Mineral soils that have a mollic epipedon overlying mineral material with a base saturation of 50% or more when measured at ph 7. Mollisols may have an argillic, natric, albic, cambic, gypsic, calcic, or petrocalcic horizon, a histric epipedon or a duripan, but not an oxic or spodic horizon. Oxisols Mineral soils that have an oxic horizon within 2 cm of the surface or plinthite as a continuous phase within 30 cm of the surface, and do not have a spodic or argillic horizon above the oxic horizon. Spodosols Mineral soils that have a spodic horizon or a placic horizon that overlies a fragipan. Ultisols Mineral soils that have an argillic horizon with a base saturation of <35% when measured at ph 8.2. Ultisols have a mean annual soil temperature of 8 C or higher. Vertisols Mineral soils that have 30% or more clay, deep wide cracks when dry, and either gilgai micorelief intersecting slickensides, or wedge-shaped structural aggregates tilted at an angle from the horizon. TABLE 6.1 Soil Order Prevalence Soil Order Area (km ) Proportion (%) Alfisols 12, Andisols Aridisols 15, Entisols 21, Gelisols 11, Histisols 1, Inceptisols 12, Mollisols 9, Oxisols 9, Spodosols 3, Ultisols 11, Vertisols 3, Miscellaneous 18,
215 184 Agronomic Handbook: Management of Crops, Soils, and Their Fertility TABLE 6.2 Soil Order Characteristics Alfisols Semi-arid to humid climates Light colored surfaces Subsoils rich in basic cations Developed under deciduous forest vegetation in humid climates Developed under grass or savannah vegetation in dry climates Formed on a wide variety of parent materials Found on all continents except Antarctica Concentration in Northern Hemisphere, especially North America Suborders: Aqualfs, Cryalfs, Ustalfs, Xeralfs, Udalfs Andisols Developed from volcanic ash, pumice, cinders, or other volcanic ejecta Amorphous mineralogy Low permanent and high variable charge Low bulk density High C and P content Largest concentrations found around Pacific Ring of Fire Suborders: Aquands, Cryands, Torrands, Xerands, Vitrands, Ustands, Udands Aridisols Do not have water available to mesophytic plants Evapotranspiration exceeds precipitation Low water-holding capacity Shallow soil depth or restricted infiltration Low osmotic potential due to salinity Accumulation of soluble salts (gypsum and more soluble evaporites) Calcium carbonate is present in all Aridisols Occupy less than 50% of the arid land areas Located in southwestern and central Asia, most of Australia, western North and South America, continental margins of Africa Vegetation dominated by drought-escaping annual grasses, forbs, drought-enduring evergreen shrubs Suborders: Cryids, Salids, Durids, Gypsids, Argids, Calcids, Cambids Entisols Formed in areas where pedogenesis has been present Found in mountains, sand dunes, flood plains, coastal plains, and urban areas Not defined by temperature or precipitation Inherit many physical and chemical properties from parent materials Suborders: Orthents, Psamments, Fluvents, Aquents, Arents Gelisols Permafrost-affected soils within 100 cm of the soil surface or gelic materials with 100 cm of the soil surface and permafrost within 200 cm of soil surface Twelfth and newest soil order Support unvegetated to continuously vegetated trunda Suborders: Histels, Turbels, Orthels Formed from organic materials derived from plants Formation is favored by wet or cold climates Histosols
216 Major Soil Classification Systems 185 TABLE 6.2 (CONTINUED) Soil Order Characteristics Contain a minimum of 12 to 18% organic C Cation exchange capacity is high Water retention closely related to degree of decomposition Soil material has been used a fuel Most occur in wetlands Uniquely fragile and highly vulnerable to degradation Largest expanses in west Siberian lowlands and Hudson s Bay lowlands of central Canada Suborders: Folists, Fibrists, Saptists, Hemists Inceptisols Include soils that have undergone modification of parent material by structural development and alteration sufficient to differentiate from Entisols Found in all known climates, subhumid to humid climates from equatorial to tundra regions Order has inordinate diversity Usually considered immature soils Major soils on which agronomic crops are produced in some parts of the world Suborders: Aquepts, Anthrepts, Cryepts, Ustepts, Xerepts, Udepts Mollisols Generally characterized as soils with thick, dark surface horizons resulting from organic C incorporation Among the most important soils for food and fiber production High levels of native fertility Distributed throughout the mid-latitudes Dark-colored soils of semiarid to subhumid grassland ecosystems Clay mineralogy is typically dominated by 2:1 layer silicates Relatively high soil organic matter (SOM) content conductive to the formation of water-stable aggregates Suborders: Albolls, Aquolls, Rendolls, Cryolls, Xerolls, Ustolls, Udolls Oxisols Deep red, highly weathered soils confined almost exclusively to the tropics Most are in areas with mean annual air temperatures >15 C Humification occurs in all Oxisols Textures may vary from sandy loam to clay Gibbsite is present as a secondary mineral; the other frequent mineral is goethite Have low nutrient retention capacity, anion adsoprtion, Ca deficiency, and Mn and Al toxicity Support the largest areas of tropical forests Suborders: Aquox, Torrox, Ustox, Perox Spodosols Most are sandy soils with relatively low water-holding capacities Found on all continents, most in cool, humid climates Formed under coniferous or deciduous forests but not under prairie vegetation Droughty and infertile; require high inputs, especially P Suborders: Aquods, Cryods, Humods, Orthods Ultisols Found on a variety of parent materials and under a range of climatic conditions About 80% are in tropical regions, under many tropical and subtropical ecosystems Found on almost all landforms Common but minor mineral component is gibbsite continued
217 186 Agronomic Handbook: Management of Crops, Soils, and Their Fertility TABLE 6.2 (CONTINUED) Soil Order Characteristics Extensively weathered, low base saturation, and low native fertility Suborders: Aquults, Humults, Udults, Ustults, Xerults Vertisols Clay soils that exhibit impressive volume changes due to shrinking and swelling processes Derived from a wide variety of parent materials Natural vegetation is typically grassland and savanna Dark colored; commonly lack distinct horizonation; finely textured Neutral to alkaline in reaction Exhibit high moisture retention characteristics Highly productive Suborders: Aquerts, Cryerts, Xererts, Torrerts, Uderts, Usterts TABLE 6.3 Soil Orders Found in Different Temperature Regions Soil Temperature Regimes a (%) Order Tropical Temperate Boreal Tundra Alfisols Andisols Aridisols Entisols Gelisols Histisols Inceptisols Mollisols Oxisols Spodosols « Ultisols Vertisols a Soil Taxonomy. Soil Survey Staff, 1998, Tropical: isomesic, isothermic, and isohyperthermic (MAST >8 C in which the difference in mean summer and mean winter temperature is < 6 C at 50-cm soil depth). Temperate: mesic, thermic, and hyperthermic (MAST is >8 C at 50-cm soil depth). Boreal: frigid, isofrigid, and cytic (MAST is 0 8 C at 50-cm soil depth). Tundra: pergelic (MAST <0 C at 50-cm soil depth). Source: Modified from data supplied through USDA-NRCS, Soil Survey Division, Washington, D.C., 1998.
218 Major Soil Classification Systems 187 TABLE 6.4 Soil Orders, Characteristics, and Diagnoses Order Characteristic Diagnosis World Area [million mi 2 (%)] Entisol Recent Lack of discernible horizons 6.5 (12) Inceptisol Young Horizons present but poorly developed 8.1 (16) Vertisol Inverted Cracks; all horizons have high clay content 1.1 (2.2) Aridisol Arid climate Prominent calcic horizon 9.9 (19.7) Mollisol Soft, rich Prominent mollic horizon 4.6 (9.2) Spodosol High ash content Prominent spodic horizon 2.8 (5.6) Alfisol High clay content Prominent argillic horizon; ochric horizon 7.6 (15.1) Ultisol Heavily leached Aall horizons heavily weathered; argillic horizon present 4.4 (8.8) Oxisol High oxide content Prominent oxic horizon; forms laterite 4.8 (9.6) Histosol High organic content Prominent histic horizon (peat) 0.4 (0.8) TABLE 6.5 Areas and Percentages of Suborders and Miscellaneous Land Units Based on Ice-Free Land Area Suborder Area (km ) Percentage Alfisols Aqualfs Cryalfs 2, Ustalfs 5, Xeralfs Udalfs 2, Subtotal 12, Andisols Cryands Torrands Xerands 32 «0.1 Vitrands Ustands Udands Subtotal Aridisols Cryids Salids Gypsids Argids 5, Calcids 4, Cambids 2, Subtotal 15, Entisols Aquents Psamments 4, continued
219 188 Agronomic Handbook: Management of Crops, Soils, and Their Fertility TABLE 6.5 (CONTINUED) Areas and Percentages of Suborders and Miscellaneous Land Units Based on Ice-Free Land Area Suborder Area (km ) Percentage Fluvents 2, Orthents 13, Subtotal 21, Gelisols Histels 1, Turbels 6, Haplels 3, Subtotal 11, Histosols Folists «1 «0.1 Fibrists Hemists Saprists Subtotal 1, Inceptisols Aquepts 3, Anthrepts <1 «0.1 Cryepts Ustepts 4, Xerepts Undepts 4, Subtotal 12, Mollisols Albolls 28 «0.1 Aquolls Rendolls Xerolls Cryolls 1, Ustolls 5, Udolls 1, Subtotal 9, Oxisols Aquox Torrox 31 «0.1 Ustox 3, Perox 1, Udox 5, Subtotal 9,
220 Major Soil Classification Systems 189 TABLE 6.5 (CONTINUED) Areas and Percentages of Suborders and Miscellaneous Land Units Based on Ice-Free Land Area Suborder Area (km ) Percentage Spodosols Aquods Cryods 2, Humods 58 <0.1 Orthods Subtotal 3, Ultisols Aquults 1, Humults Udults 5, Ustults 3, Xerults 19 «0.1 Subtotal 11, Vertisols Aquerts 5 «0.1 Cryerts 15 «0.1 Xererts Torrerts Usterts 1, Uderts Subtotal 3, Miscellaneous Shifting 13, Other 5, Subtotal 18, Grand Total 130, Source: USDA-NRCS, Washington, D.C., 1998.
221 190 Agronomic Handbook: Management of Crops, Soils, and Their Fertility TABLE 6.6 Prefixes and Connotations for Great Group Names in the U.S. Soil Classification System Prefix Connotation Prefix Connotation acr Extreme weathering luv Illuvial agr Agric horizon med Of temperate climates alb Albic horizon nadur See natr and dur and Ando-like natr Presence of natric horizon anthr Anthropic epipedon ochr Presence of ochric epipedon arg Argillic horizon pale Old development bor Cool pell Low chroma cale Calcic horizon plae Presence of a thin cemented layer camb Cambic horizon plag Presence of plaggen horizon chrom High chroma plinth Presence of plinthite cry Cold psamm Sand texture dur Duripan quartz High quartz content dystr, dys Low base saturation rhod Dark red color cutr, eu High base saturation sal Presence of salic horizon fen Presence of iron sider Presence of free iron oxides fluv Floodplain sombr Dark horizon frag Presence of fragipan sphagn Presence of Sphagnum moss fraglost See frag and glots sulf Presence of sulfides or their oxidation products gibbs Presence of gibbsite tort Torric moisture regime glots Tongued trap Continually warm and humid gyps Presence of gypsic horizon ud Udic moisture regime hal Salty umbr Presence of umbric epipedon hapl Minimum horizon ust Ustic moisture regime hum Presence of humus verm Wormy or mixed by animals hydr Presence of water vitr Presence of glass kand Presence of low activity clay xer Xeric moisture regime
222 Major Soil Classification Systems 191 TABLE 6.7 U.S. Soil Classification System Order Suborder Great Group Alfisols Aqualfs Albaqualfs Duraquaifs Fragiaqualfs Glossaqualfs Kandiaqualfs Natraqualfs Ochraqualfs Plinthaqualfs Umbraqualfs Boralfs Cryoboralfs Eutroboralfs Fragiboralfs Glossoboralfs Natriboralfs Palehoralfs Udalfs Agrudalfs Ferrudalfs Fragiudalfs Fraglossudalfs Glossudalfs Hapludalfs Kandiudalfs Kanhapludalfs Natrudalfs Paleudalfs Rhodudalfs Ustalfs Durustalfs Haplustalfs Kandiustalfs Kaofiapiustalfs Natrustalfs Paleustalfs Plinthustalfs Rhodustalfs Xeralfs Durixeralfs Fragixeralfs Haploxeralfs Natrixeralfs Palexerralfs Plinthoxeralfs Rhodoxeralfs Aridisols Argids Durargids Haplargids Nadurargids Natrargids Paleargids Orthids Calciorthids Camnorthids continued
223 192 Agronomic Handbook: Management of Crops, Soils, and Their Fertility TABLE 6.7 (CONTINUED) U.S. Soil Classification System Order Suborder Great Group Durorthids Gypsiorthids Paieorthids Salorthids Entisols Aquents Cryaquents Fluvaquents Haplaquents Hydraquents Psammaquents Sulfaquents Tropaquents Arents Arents Fluvents Cryofluvents Torrifluvents Tropofluvents Udifluvents Ustifluvents Xerofluvents Orthents Cryorthents Torriorthents Troporthents Udorthents Ustorthents Xerorthents Psamments Cryopsamments Quartzipsamments Torripsamments Tropopsamments Udipsamments Ustipsamments Xeropsamments Histosols Fibrists Borofibrists Cryofibrists Luvifibrists Medifibrists Tropofibrists Folists Borofolists 6.4 GLOBAL DISTRIBUTION OF MAJOR SOIL ORDERS

224 Major Soil Classification Systems FIGURE 6.1 Proportions of Earth s surface occupied by the great soil zones. (Source: Hanson, A.A., 1990, Practical Handbook of Agricultural Science, CRC Press, Inc., Boca Raton, FL. With permission.) 0897_frame_C06 Page 193 Thursday, September 19, :25 AM 193

225 194 Agronomic Handbook: Management of Crops, Soils, and Their Fertility U.S. DEPARTMENT OF AGRICULTURE A A A A A A A BROAD SCHEMATIC SOIL MAP A INCEPTISOLS: Dwarf shrub- and moss-covered soils of frigid climates commonly with permafrost. SPODOSOLS AND HISTOSOLS: Forested soils of humid cool climates. A A A ALFISOLS AND INCEPTISOLS: Forested soils of humid temperate A climates. ULTISOLS: Forested soils of humid warm climates. MOLLISOLS: Originally grass-covered soils of humid to semiarid cool to warm climates. VERTISOLS: Grass- or savanna-covered layer soils of humid to semi- and warm-temperate to tropical climates with wet and dry seasons. ARIDISOLS: Sparsely shrub- or grass-covered soils of arid temperate to tropical climates. OXISOLS, INCEPTISOLS, AND ULTISOLS: Forested and savanna covered soils of humid and subhumid tropical and subtropical climates. SOILS OF MOUNTAINS - ENTISOLS AND INCEPTISOLS: Stony or shallow soils with the vision of many others. A INCEPTISOLS AND ENTISOLS: Soils in recent deltas and floodplains of large rivers. FIGURE 6.2 Map showing nine major soil regions. Proportions of the land surface: Inceptisols, 3.44%; Spodosols and Histosols, 9.89%; Alfisols and Inceptisols, 4.25%; Ultisols, 3.83%; Mollisols, 12.38%; Vertisols, 2.81%; Aridisols, 25.34%; Oxisols, Inceptisols, and Ultisols, 20.54%; Entisols and Inceptisols (mountain soils), 17.44%.
226 Major Soil Classification Systems 195 FIGURE 6.3 Global distribution of Alfisols. (Source: USDA-NRCS, Soil Survey Division, Washington, D.C., 1998.)
227 196 Agronomic Handbook: Management of Crops, Soils, and Their Fertility FIGURE 6.4 Global distribution of Aridisols. (Source: USDA-NRCS, Soil Survey Division, Washington, D.C., 1998.)
228 Major Soil Classification Systems 197 FIGURE 6.5 Global distribution of Entisols. (Source: USDA-NRCS, Soil Survey Division, Washington, D.C., 1998.)
229 198 Agronomic Handbook: Management of Crops, Soils, and Their Fertility FIGURE 6.6 Global distribution of Histosols. (Source: USDA-NRCS, Soil Survey Division, Washington, D.C., 1998.)

230 Major Soil Classification Systems 199 FIGURE 6.7 Global distribution of Inceptisols. (Source: USDA-NRCS, Soil Survey Division, Washington, D.C., 1998.)

231 200 Agronomic Handbook: Management of Crops, Soils, and Their Fertility FIGURE 6.8 Global distribution of Mollisols. (Source: USDA-NRCS, Soil Survey Division, Washington, D.C., 1998.)
232 Major Soil Classification Systems 201 FIGURE 6.9 Global distribution of Oxisols. (Source: USDA-NRCS, Soil Survey Division, Washington, D.C., 1998.)
233 202 Agronomic Handbook: Management of Crops, Soils, and Their Fertility FIGURE 6.10 Global distribution of Spodosols. (Source: USDA-NRCS, Soil Survey Division, Washington, D.C., 1998.)

234 Major Soil Classification Systems 203 FIGURE 6.11 Global distribution of Ultisols. (Source: USDA-NRCS, Soil Survey Division, Washington, D.C., 1998.)

235 204 Agronomic Handbook: Management of Crops, Soils, and Their Fertility FIGURE 6.12 Global distribution of Vertisols. (Source: USDA-NRCS, Soil Survey Division, Washington, D.C., 1998.)
236 Major Soil Classification Systems STATE SOILS A state soil is represented by a soil series that has special significance to a particular state. Every state in the U.S. has selected a state soil and 15 of them have been established legislatively. The official state soils share the same distinctions as official state flowers and birds. Also, representative soils have been selected for Guam, Puerto Rico, and the Virgin Islands. Areas with similar soils are grouped and labeled as soil series because their similar origins and chemical and physical properties cause them to behave similarly for land use purposes. A soil series name generally is derived from a town or landmark in or near the area where the series was first recognized. A soil series is a naturally occurring entity so a given series does not necessarily appear only within the confines of one state. For instance, 7 of the 12 state soils featured in USDA s annual State Soil Planning Guide extend beyond the respective states in which they are honored. Each series consists of soils having major horizons that are similar in color, texture, structure, reaction, mineral and chemical composition, and arrangement in the soil profile. A soil profile is the sequence of natural layers or horizons in a soil. It extends from the surface downward to unconsolidated material. Most soils have three major horizons, called the surface horizon, the subsoil, and the substratum. The surface layer has the maximum accumulation of organic matter and is the horizon of maximum leaching of clay minerals and iron and aluminum oxides. Some soils have subsurface layers below their surface layers. The subsoil underlying the surface layer or subsurface layer is the horizon of maximum accumulation of clay minerals, iron and aluminum oxides, and other compounds. These compounds may have been leached from the surface layer and redeposited in the subsoil or may have formed in place. Most likely, they result from a combination of both processes. The subsoil commonly has blocky or prismatic structure and generally is firmer and lighter colored than the surface layer. The substratum is below the surface layer and subsoil. It consists of material that was somewhat modified by weathering but is relatively unchanged by soil-forming processes. TABLE 6.8 U.S. State Soils State State Soil Legislation Classification Alabama Bama April 1997 Fine-loamy, siliceous, subactive, thermic Typic Paleudults Alaska Tanana Coarse-loamy, mixed, superactive, subgelic, Typic Aquiturbels Arizona Casa Grande fine-loamy, mixed, superactive, hyperthermic Typic Natrargids Arkansas Stuttgart March 1997 Fine, smectitic, thermic Albaquultic Hapludalfs California San Joaquin July 1997 Fine, mixed, active, thermic Abruptic Durixeralfs Colorado Seitz Clayey-skeletal, smectitic Ustic Glossocryalfs Connecticut Windsor Mixed, mesic Typic Udipsamments Delaware Greenwich Coarse-loamy, mixed, semiactive, mesic Typic Hapludults Florida Myakka May 1989 Sandy, siliceous, hyperthermic Aeric Alaquods Georgia Tifton Fine-loamy, kaolinitic, thermic Plinthic Kandiudults Guam Akina Fine, kaolinitic, isohyperthermic Oxic Haplustults Hawaii Hilo Medial overhydrous, ferrihydritic, isohyperthermic Acrudoxic Hapludands Idaho Rexburg Coarse-silty mixed, superactive, frigid Calcic Haploxerolls Illinois Drummer Fine-silty, mixed, superactive, mesic Typic Endoaquolls Indiana Miami Fine-loamy, mixed, active, mesic Oxyaquic Hapludalfs Iowa Tama Fine-silty, mixed, superactive, mesic Typic Argiudolls continued
237 206 Agronomic Handbook: Management of Crops, Soils, and Their Fertility TABLE 6.8 (CONTINUED) U.S. State Soils State State Soil Legislation Classification Kansas Harney April 1990 Fine, smectitic, mesic Typic Argiustolls Kentucky Crider April 1990 Fine-silty, mixed, active, mesic Typic Paleudalfs Louisiana Ruston Fine-loamy, siliceous, semiactive, thermic Typic Paleudults Maine Chesuncook April 1999 Coarse-loamy, mixed, isotic, frigid Aquic Haplorthods Maryland Sassafras Fine-loamy, siliceous, semiactive, mesic Typic Hapludults Massachusetts Paxton May 1991 Coarse-loamy, mixed, active, mesic Michigan Kalkaska December 1990 Sandy, mixed, frigid Typic Haplorthods Minnesota Lester Fine-loamy, mixed, superactive, mesic Mollic Hapludalfs Mississippi Natchez Coarse-silty, mixed, superactive, thermic Typic Eutrudepts Missouri Menfro Fine-silty, mixed, superactive, mesic Typic Hapludalfs Montana Scobey Fine, smectitic, frigid Aridic Argiustolls Nebraska Holdrege June 1979 Fine-silty, mixed, superactive, mesic Typic Argiustolls Nevada Orovada Coarse-loamy, mixed, superactive, mesic Durinodic Xeric Haplocambids New Hampshire Marlow Coarse-loamy, isotic, frigid Oxyaquic Haplorthods New Jersey Downer Coarse-loamy, siliceous, semiactive, mesic Typic Hapludults New Mexico Penistaja Fine-loamy, mixed, superactive, mesic Ustic Haplargids New York Honeoye Fine-loamy, mixed, mesic Glossoboric Hapludalfs North Carolina Cecil Fine, kaolinitic, thermic Typic Kanhapludults North Dakota Williams Fine-loamy, mixed, superactive, frigid Typic Argiustolls Ohio Miamian Fine, mixed, active, mesic Oxyaquic Hapludalfs Oklahoma Port April 1987 Fine-silty, mixed, superactive, thermic Cumulic Haplustolls Oregon Jory Fine, mixed, active, mesic Xeric Palehumults Pennsylvania Hazleton Loamy-skeletal, siliceous, subactive, mesic Typic Dystrochrepts Puerto Rico Bayamon Very fine, kaolinitic, isohyperthermic Typic Hapludox Rhode Island Narragansett Coarse-loamy over sandy or sandy-skeletal, mixed, active, mesic Typic Dystrudepts South Carolina Bohicket Fine, mixed, superactive, nonacid, thermic Typic Sulfaquents South Dakota Houdek February 1990 Fine-loamy, mixed, superactive, mesic Typic Argiustolls Tennessee Dickson Fine-silty, siliceous, semiactive, thermic Gossic Fragiudults Texas Houston Fine, smectitic, thermic Udic Haplusterts Black U.S.Virgin Islands Victory Loamy-skeletal, mixed, superactive, isohyperthermic Typic Haplusterts Utah Taylorsflat Fine-loamy, mixed, superactive, mesic Xeric Haplocalcids Vermont Tunbridge March 1985 Coarse-loamy, isotic, frigid Typic Haplorthods Virginia Pamunkey Fine-loamy, mixed, semiactive, thermic Ultic Hapludalfs Washington Tokul Medial, amorphic, mesic Aquic Vitrixerands West Virginia Monongahela April 1997 Fine-loamy, mixed, semiactive, mesic Typic Fragiudults Wisconsin Antigo September 1983 Coarse-loamy over sandy or sandy-skeletal, mixed, superactive, frigid Haplic Glossudalfs Wyoming Forkwood Fine-loamy, mixed, active, mesic Ustic Haplargids Source: USDA-NRCS, 2000 State Soil Planning Guide, U.S. Government Printing Office, Washington, D.C.
238 Major Soil Classification Systems DESIGNATIONS FOR SOIL HORIZONS AND LAYERS TABLE 6.9 Designations for Soil Horizons and Layers Master Horizons and Layers O horizons Layers dominated by organic material, except limnic layers that are organic A horizons Mineral horizons formed at the surface or below an O horizon and (1) are characterized by an accumulation of humified organic matter intimately mixed with the mineral fraction and not dominated by properties characteristic of E or B horizons; or (2) have properties resulting from cultivation, pasturing, or similar disturbances E horizons Mineral horizons in which the main feature is loss of silicate clay, iron, aluminum, or some combination of these, leaving a concentration of sand and silt particles of quartz or other resistant materials B horizons Horizons formed below an A, E, or O horizon and are dominated by (1) carbonates, gypsum, or silica, alone or in combination; (2) evidence of removal of carbonates; (3) concentrations of sesquioxides; (4) alterations that form silicate clay; (5) formation of granular, blocky, or prismatic structure; or (6) a combination of these factors C horizons Horizons or layers, excluding hard bedrock, that are little affected by pedogenic processes and lack properties of O, A, E, or B horizons. Most are mineral layers, but limnic layers, whether organic or inorganic, are included R layers Hard bedrock including granite, basalt, quartzite, and indurated limestone or sandstone that is sufficiently coherent to make hand digging impractical Transitional Horizons Two kinds of transitional horizons occur. With one, the properties of an overlying or underlying horizon are superimposed on properties of the other throughout the transition zone (AB, BC, etc.). With the other, the distinct parts characteristic of one master horizon are recognizable and enclose parts characteristic of a second recognizable master horizon (E/B, B/E, and R/C). AB A horizon with characteristics of both an overlying A horizon and an underlying B horizon, but which is more like the A than the B EB A horizon with charactcristics of both an overlying E horizon and an underlying B horizon, but which is more like the E than the B BE A horizon with characteristics of both an overlying E horizon and an underlying B horizon, but which is more like the B than the E BC A horizon with characteristics of both an overlying B horizon and an underlying C horizon, but which is more like the B than the C CB A horizon with characteristics of both an overlying B horizon and an underlying C horizon, but which is more like the C than the B E/B A horizon comprised of individual parts of E and B horizon components in which the E component is dominant and surrounds the B materials B/E A horizon comprised of individual parts of E and B horizons in which the E component surrounds the B component but the latter is dominant B/C A horizon comprised of individual parts of B and C horizons in which the B horizon component is dominant and surrounds the C component Subordinate Distinctions within Master Horizons and Layers a Highly decomposed organic material where rubbed fiber content averages <1/6 of the volume b Identifiable buried genetic horizons in a mineral soil c Concretions or hard nonconcretionary nodules of iron, aluminum, manganese, or titanium cement e Organic material of intermediate decomposition in which rubbed fiber content is 1/6 to 2/5 of the volume f Frozen soil in which the horizon or layer contains permanent ice g Strong gleying in which iron has been reduced and removed during soil formation or in which iron has been preserved in a reduced state because of saturation with stagnant water h illuvial accumulation of organic matter in the form of amorphous, dispersible organic matter; sesquioxide complexes where sesquioxides are in very small quantities and the value and chroma of the horizon are <3 continued
239 208 Agronomic Handbook: Management of Crops, Soils, and Their Fertility TABLE 6.9 (CONTINUED) Designations for Soil Horizons and Layers i Slightly decomposed organic material in which rubbed fiber content is more than about 2/5 of the volume k Accumulation of pedogenic carbonates, commonly calcium carbonate m Continuous or nearly continuous cementation or induration of the soil matrix by carbonates (km), silica (qm), iron (sm), gypsum (ym), carbonates and silica (kqm), or salts more soluble than gypsum (zm) n Accumulation of sodium on the exchange complex sufficient to yield a morphological appearance of a natric horizon. o Residual accumulation of sesquioxides p Plowing or other disturbance of the surface layer by cultivation, pasturing or similar uses q Accumulation of secondary silica r Weathered or soft bedrock including saprolite; partly consolidated soft sandstone, siltstone or shale; or dense till that roots penetrate only along joint planes and are sufficiently incoherent to permit hand digging with a spade s Illuvial accumulation of sesquioxides and organic matter in the form of illuvial, amorphous, dispersible organic matter; sesquioxide complexes if both organic matter and sesquioxide components are significant and the value and chroma of the horizon are >3 t Accumulation of silicate clay that either has formed in the horizon and is subsequently translocated or has been moved into it by illuviation v Plinthite which is composed of iron-rich, humus-poor, reddish material that is firm or very firm when moist and that hardens irreversibly when exposed to the atmosphere under repeated wetting and drying w Development of color or structure in a horizon but with little or no apparent illuvial accumulation of materials x Fragic or fragipan characteristics that result in genetically developed firmness, britor high bulk density y Accumulation of gypsum z Accumulation of salts more soluble than gypsum REFERENCES 1. Glossary of Soil Science Terms, 1987, Soil Science Society of America, Madison, WI.
240 Part III Soils and Their Properties
241
242 7 Physical, Chemical, and Biological Properties of Soils 7.1 CATION EXCHANGE CAPACITIES OF SOILS AND SOIL COMPONENTS TABLE 7.1 Representative Cation Exchange Capacities (CECs) of Surface Soils by Soil Order Soil Order CEC (molc/kg) Soil Order CEC (molc/kg) Alfisols 0.12 Mollisols 0.22 Aridisols 0.16 Oxisols 0.05 Entisols 0.43 Spodosols 0.11 Histisols 1.40 Ultisols 0.06 Inceptisols 0.19 Vertisols 0.37 Source: Sumner, M.E., Ed., Handbook of Soil Science, 2000, CRC Press, Boca Raton, FL, p B-241. TABLE 7.2 Specific Surfaces of Clay Minerals and Soils Component Specific Surface (m 2 /g) Kaolinite Illite Bentonite Montimorillonite Organic matter Calcite Crystalline iron oxides Amorphous iron oxides Sands <10 Sandy loams and silt loams 5 20 Clay loams Clay soils >25 211
243 212 Agronomic Handbook: Management of Crops, Soils, and Their Fertility TABLE 7.3 Charge Characteristics and Cation Exchange Capacities (CECs) of Clay Minerals Clay Mineral Charge per Unit Half Cell Tetrahedral Octahedral CEC (cmol/kg) Kaolinite Smectite Montmorillonite Beidellite Vermiculite Mica Muscovite Chlorite TABLE 7.4 Cation Exchange Capacities (CECs) of Clay Minerals Clay CEC (meq/100 g) Kaolinite 5 15 Chlorite Illite Transitional minerals 40 0 Montmorrillonite (smectite) Vermiculite Humic material TABLE 7.5 Cation Exchange Capacities (CECs) of Soil Colloids Cation Exchange Capacity Type of Colloid Mean (meq/100 g) Range (meq/100 g) Humus Vermiculite Allophane Montmorillonite Illite Chlorite Peat Kaolinite
244 Physical, Chemical, and Biological Properties of Soils 213 TABLE 7.6 Approximate Cation Exchange Capacities (CECs) Related to Textural Classes of Soils with Water ph Levels below 7.0 Soil Textural Class CEC (meq/100 g soil) Sand 1 8 Loamy sand 9 12 Sandy or silty loam Loam Clay loam Clay >40 TABLE 7.7 Classification Scheme for Phyllosilicates Related to Clay Minerals Type Group (x ~ charge per formula unit) Subgroup Species a 1:1 Kaolin-serpentine Kaolins Kaolinite, halloysite (7 Å or 0.7 nm), halloysite (10 Å or 1.0 nm) x ~ 0 Serpentines Chrysotile, lizardite, antigorite 2:1 Pyrophyllite-talc Pyrophyllites Pyrophyllite x ~ 0 Talcs Talc Smectite Dioctahedral smectites Montmorillonite, beidellite, nontronite x ~ Trioctahedral smectites Saponite, hectorite, sauconite Vermiculite Dioctahedral vermiculite Dioctalledral vermiculite x ~ Trioctahedral vermiculite Trioctahedral vermiculite Mica Dioctahedral micas Muscovite paragonite x ~ 1 Trioetahedral micas Biotite, phlogopite Brittle mica Dioetahedral brittle micas Margarite x ~ 2 Trioctahedral brittle micas Clintonite Chlorite Dioctahedral chlorites (4-5 octahedral cations/formula unit) x variable Trioctahedral chlorites 5-6 octahedral cations/formula unit Pennine, chlinochlore, prochlorite a Only a few examples are given. 7.2 TEXTURE TEXTURAL CLASSES The 12 textural classes (sand, loamy sand, sandy loam, sandy clay loam, sandy clay, loam, silt loam, silt, clay loam, silty clay loam, silty clay, clay) of soils can be determined by knowing the relative percentages of the three major soil separates (sand, silt, and clay) as illustrated in Figure 7.1.
245 214 Agronomic Handbook: Management of Crops, Soils, and Their Fertility FIGURE 7.1 Soil textural classes based on percentage content of sand, silt, and clay. Dia. mm USDA International European Very coarse sand Coarse sand Medium sand Fine sand Very fine sand Coarse sand Fine sand Coarse sand Medium sand Fine sand Coarse silt Dia. mm Silt Silt Medium silt Fine silt Coarse clay Clay Clay Medium clay Fine clay FIGURE 7.2 Comparison of particle size limits of four systems of particle size classification. (From McKeague, J.A., Ed., Manual on Soil Sampling and Methods of Analysis, 2nd ed., Canada Society of Soil Science, Ottawa, Ontario, With permission.)
246 Physical, Chemical, and Biological Properties of Soils SOIL SEPARATES (USDA CLASSIFICATION) Soil separates are defined by particle diameter size based on the USDA classification as follows: Separate Diameter (mm) Fine gravel Coarse gravel Medium sand Fine sand Very fine sand Silt Clay Below 0.02 The international system for size limits of soil separates is as follows: Fraction Diameter range (mm) I II III IV Below The amounts of sand, silt, and clay in a soil can be determined by several methods, although all are based on the same basic principle varying settling velocities due to different particle sizes in a standing column of water (the principle of sedimentation is known as Stokes Law). This technique is frequently referred to as a mechanical analysis. Particle separation by varying settling velocity assumes a consistent particle density (2.65 g/cm 3 ) for all the separates HYDROMETER PROCEDURE Soil Preparation 1. Weigh 50 g air-dried <10-mesh-sieved (2-mm) soil (100 g for sandy soils) into a beaker and add 100 ml 5% Calgon solution. Stir and let stand overnight (8 hr). Transfer the entire contents of the beaker into a dispersion cup and fill the cup 2/3 full with water. Add 1 drop of soil and place the cup on a Humboldt Mixer. Mix for 2 min. Remove the cup and cleanly transfer its entire contents into a 1,000-mL cylinder. 2. Bring to the mark (1,000 ml for 50-g sample, 1,120 ml for 100-g sample) with water Hydrometer Readings 1. Cap the cylinder and invert 10 times with vigor. Put the cylinder down; uncap and place the Bouyoucos hydrometer (calibrated in g/l) into the water soil slurry. 2. After 40 sec of standing, take a hydrometer reading. Place a therometer into the slurry. Determine its temperature and record both readings. 3. Let the cylinder stand undisturbed for 2 hr, then take additional hydrometer and temperature readings.
247 216 Agronomic Handbook: Management of Crops, Soils, and Their Fertility Blank Determination 1. Dilute 100 ml 5% Calgon solution to 1000 ml with water in a 1000-mL cylinder. Take a Bouyoucos hydrometer reading and determine the temperature of the solution Calculations for Percentages of Sand, Silt, and Clay Percentages of silt and clay: 40-sec hydrometer reading: (sample blank) + temperature correction (see note below)/weight of soil sample in g. Percentage of sand: 100 percent silt + percent clay. Percentage of clay: 2-hr hydrometer reading: (sample blank) + temperature correction (see note below)/weight of soil sample in g. Percentage of silt: 100 percent sand percent clay. Note regarding temperature correction: Degrees below 19.4 C (67 F): subtract 0.2 units/degree from hydrometer reading. Degrees above 19.4 C (67 F): add 0.2 units/degree to hydrometer reading. 7.3 SOIL SEPARATE DEFINITIONS SANDS Very coarse sand Contains 85% or more sand; percentage of silt plus 1.5 times the percentage of clay shall not exceed 15. Coarse sand Contains 25% or more very coarse and coarse sand and <50% any other single grade of sand. Medium sand Contains 25% or more very coarse, coarse, and medium sand, and <50% fine or very fine sand. Fine sand Contains 50% or more fine sand or <25% very coarse, medium sand, and <50% very fine sand. Very fine sand Contains 50% or more fine sand. Loamy sand Soil material that contains at the upper limit 85 to 90% sand; the percentage of silt plus 1.5 times the percentage of clay is not less than 15; at the lower limit, contains not less than 70 to 85% sand and the percentage of silt plus twice the percentage of clay exceeds 30. Loamy coarse sand Contains 25% or more very coarse and coarse sand and <50% any other single grade of sand. Loamy sand Contains 25% or more very coarse, coarse, and medium sand and <50% fine or very fine sand. Loamy fine sand Contains 50% or more very fine sand or <25% very coarse, coarse, and medium sand and <50% very fine sand. Loamy very fine sand Contains 50% or more very fine sand LOAMS Sandy loam Soil material that contains either 20% clay or less and the percentage of silt plus twice the percentage of clay exceeds 30 and 52% or more sand; or <7% clay, <50% silt, and 43 to 52% sand. Coarse sandy loam Loam that contains 25% or more very coarse and coarse sand and <50% any other one grade of sand. Sandy loam Contains 30% or more very coarse, coarse, and medium sand, <25% very coarse sand, and <30% very fine or fine sand, or <15% very coarse or coarse and <30% fine sand or very fine sand.
248 Physical, Chemical, and Biological Properties of Soils 217 Fine sandy loam Contains 30% or more fine sand and <30% very fine sand or 15 to 30% very coarse, coarse, and medium sand, or >40% fine and very fine sand, at least half of which is fine sand, and <15% very coarse, coarse, and medium sand. Very fine sandy loam Contains 30% or more very fine or >40% fine and very fine sand, more than half of which is very fine sand, and <15% very coarse, coarse, and medium sand. Loam Soil material that contains 7 to 27% clay, 28 to 50% silt, and <52% sand. Silt loam Soil material that contains 50% or more silt and 12 to 27% clay or 50 to 80% silt and <2% clay. Silt Soil material that contains 80% or more silt and <12% clay. Sandy clay loam Soil material that contains 20 to 35% clay, <28% silt, and 45% or more sand. Clay loam Soil material that contains 27 to 40% clay and 20 to 45% sand. Silty clay loam Soil material that contains 27 to 40% clay and <20% sand CLAYS Sandy clay Soil material that contains 35% or more clay and 45% or more sand. Silty clay Soil material that contains 40% or more clay and 40% or more silt. Clay Soil material that contains 40% or more clay, <45% sand, and <40% silt. TABLE 7.8 Particle Size Fraction Comparison Size Fraction (µm) Approximate No. Particles/g Approximate Specific Surface (cm 2/g) 2, , ,000-2m 3 = 2000,000 TABLE 7.9 Particle Size Fraction Designations Equivalent Diameter (mm) Description >600 Rocks Stones Cobbles 75 2 Gravel Coarse sand Medium sand Fine sand Coarse silt Medium silt Coarse silt Coarse clay Medium clay < Fine clay
249 218 Agronomic Handbook: Management of Crops, Soils, and Their Fertility TABLE 7.10 Approximate Bulk Densities that Restrict Root Penetration by Soil Texture Critical Bulk Density for Soil Resistance Texture High (mg/m 3 ) Low (mg/m 3 ) Sandy Coarse loamy Fine loamy Coarse, fine silty Clayey Depends on clay percent and structure Source: Sumner, M.E., Ed., Handbook of Soil Science, 2000, CRC Press, Boca Raton, FL. With permission. TABLE 7.11 Bulk Density versus Percent Volume of Solids and Pores a Bulk Density kg/m 3 % solids % pores 1.0 1, , , , , , , a 2.65 g/cm 3 particle density. 7.4 PHYSICAL CHARACTERISTICS TABLE 7.12 Composition of Grassland Soil Volume Percent Component 45 Mineral components: fragments of parent rock, primary and secondary minerals, amorphous substance 7 Organic components: soil fauna and flora, plant roots, intact decaying plant residues, newly formed humic substances (humus) 25 Air 23 Water
250 Physical, Chemical, and Biological Properties of Soils CONSISTENCE Consistence is the sum effect of particle size distribution, organic matter content, soil structure, and stability at the prevailing water content level. The main factors that determine consistence are clay and water contents. TABLE 7.13 Consistence Levels Loose Sticky Plastic Friable Firm Easy to work; neither sticky nor malleable Adheres to hands and implements Smooth and malleable; subject to smearing when cultivated Breaks into crumbs under gentle pressure; not sticky; does not smear Not friable even under high stress; cloddy when cultivated WATER HOLDING AND INFILTRATION RATES Plants consume, on the average, 0.1 to 0.3 inches of rainfall or irrigation per day. They use more in hot, dry weather than in cool weather. Well fertilized crops require less water than poorly fertilized crops. TABLE 7.14 Approximate Amounts of Water Held by Different Soils Soil Texture Inches of Water Held/Ft of Soil Maximum Rate of Irrigation In./Hr Bare Soil Sand Fine sand Loamy sand Loamy fine sand Sandy loam Loam Silt loam Clay loam Silty clay Clay Source: Western Fertilizer Handbook, Horticulture Edition, 1990, Interstate Publishers, Danville, IL. With permission from California Plant Health Association.
251 220 Agronomic Handbook: Management of Crops, Soils, and Their Fertility TABLE 7.15 Soil Moisture Constants and Corresponding Tension Values Soil Moisture Constant cm H 2 O Bars pf MPa Maximum retentive capacity Field capacity Moisture equivalent 1, Wilting point 15, Hygroscopic coefficient 31, Air dry soil , Oven dry soil , ,000 TABLE 7.16 Approximate Water Storage Capacity of Soils Soil Texture Total Storage (in./ft) Available Water (in./ft) Coarse sand Sandy loams (coarse to medium) Silts and loams (medium) Clay loams (medium to fine) Clays (fine) TABLE 7.17 Infiltration Rates Soil Texture Good Physical Condition (in./hr) Poor Physical Condition (in./hr) Coarse sand Fine sand Sandy loams Silts and loams Clay loams Clays
252 Physical, Chemical, and Biological Properties of Soils 221 TABLE 7.18 Options for Improving Irrigation Water Productivity Technical Options Land leveling to apply water more uniformly Surge irrigation to improve water distribution Efficient sprinklers to apply water more uniformly Low energy precision application sprinklers that cut evaporation and wind drift losses Furrow diking to promote soil infltration and reduce runoff Drip irrigation to cut evaporation and other water losses and increase crop yields Managerial Options Better irrigation scheduling Improving canal operations for timely deliveries Applying water when most crucial to crop yield Water-conserving tillage and field preparation methods Better maintenance of canals and equipment Recycling drainage and tail water Institutional Options Establishing water user organizations for better involvement of farmers and collection of fees Reducing irrigation subsidies and/or introducing conservation-oriented pricing Establishing legal framework for implementing efficient and equitable water markets Fostering rural infrastructure for private sector dissemination of efficient technologies Better training and extension efforts Agronomic Options Selecting crop varieties with high yields/liter of transpired water Intercropping to maximize use of soil moisture Better matching crops to climate conditions and quality of available water Sequencing crops to maximize output under soil and water salinity conditions Selecting drought-tolerant crops where water is scarce or unreliable Breeding water-efficient crop varieties Source: Sumner, M.E., Ed., Handbook of Soil Science, 2000, CRC Press, Boca Raton, FL. With permission.
253 222 Agronomic Handbook: Management of Crops, Soils, and Their Fertility 7.5 NUTRIENT ELEMENT CONTENTS OF SURFACE SOILS TABLE 7.19 Amounts of Plant Nutrient Elements Ordinarily Present in 15 cm of Surface Soil in Humid Region Nutrient Element Range (%) Amount (kg/ha) Nitrogen ,000 Phosphorus ,500 Potassium ,800 74,000 Calcium ,600 81,000 Magnesium ,700 34,000 Sulfur ,500 Iron , ,000 Manganese ,500 22,000 Zinc Boron Copper Chlorine ,240 Cobalt Molybdenum TABLE 7.20 Common Concentration Levels of Micronutrients/ Trace Elements (ppm) in Mineral Soils Micronutrient/Trace Element Normal Range Extreme Values Iron 15,000 40, ,000 Manganese 300 7, ,000 Chlorine Vanadium Zinc ,000 Copper ,300 Boron ,300 Cobalt Molybdenum Selenium
254 Physical, Chemical, and Biological Properties of Soils 223 TABLE 7.21 Nutrient Elements in Soil Element Ionic Form Taken Up Most Important Sources Usual Content Major Elements Nitrogen NO 3 - Organic matter, N z from atmosphere % NH + 4 Phosphorus H 2 PO 4 - Ca, Al, and Fe phosphates % HPO 2-4 PO 3-4 Sulfur SO 2-4 Fe sulfide and sulfate % Potassium K + Micas, illite, K feldspar % Calcium Ca 2+ Ca feldspar, augite, hornblende, CaCO 3, CaSO % a Magnesium Mg 2+ Augite, hornblende, olivine, biotite, MgCO % b Micronutrients Boron H 2 BO - 3 Tourmaline, accessory in silicates and salts mg/kg HBO 2-3 B(OH) - 4 Chlorine Cl - Various chlorides 50 1,000 mg/kg Copper Cu 2+ Cu sulfide, sulfate, carbonate mg/kg Cu + Iron Fe 2+ Augite, hornblende, biotite, olivine, Fe oxide, and % c hydroxide Fe 3+ Manganese Mn 2+ Manganite, pyrolusite, accessory in silicates mg/kg Mn 3+ Molybdenum MoO 2-4 Accessory in silicates, Fe- and Al oxides and mg/kg hydroxides Zinc Zn 2+ Zn phosphate, carbonate, hydroxide, accessory in silicates mg/kg a Except chalk soils. b Except dolomitic soils. c Except Fe-enriched horizons.
255 224 Agronomic Handbook: Management of Crops, Soils, and Their Fertility 7.6 ORGANIC MATTER ORGANIC MATTER DETERMINATION Titration Procedure Reagents Potassium dichromate reagent: Weigh g 0.267N potassium dichromate (K 2 Cr 2 O 7 ) into a 1,000-mL volumetric flask. Add 400 ml water to dissolve, then add 550 ml concentrated sulfuric acid (H 2 SO 4 ). Let cool and bring to volume with water. Mohr s Salt Solution (0.2M): Weigh g ferrous ammonium sulfate [Fe(NH 4 ) 2 (SO 4 ). 6H 2 O] into a 1000-mL volumetric flask. Add 500 ml water to dissolve, then add 50 ml concentrated H 2 SO 4. Let cool and bring to volume with water. Prepare fresh for each use. Indicator Solution: Weigh 200 mg n-phenylanthranilic acid into a 1,000-mL volumetric flask containing 0.2% sodium carbonate (Na 2 CO 3 ) solution Determination Weigh 0.1 to 0.5 g (depending on estimated organic content) of air-dried <10-mesh screened (2- mm) soil into a 500-mL Erlenmeyer flask and add 15 ml 0.267N potassium dichromate reagent. Connect the flask to a reflux condenser and boil for 30 min; let cool. Wash down the condenser and flush with pure water. Add 3 drops of indicator solution and titrate with Mohr s Salt Solution at room temperature. As the end point is approached, add a few more drops of the indicator solution. The color change is from violet to bright green. A blank analysis with no soil added is carried through the procedure Calculation Percent organic carbon = {[(meq K 2 Cr 2 O 7 meq FeSO 4 ) x 0.3]/g soil} Loss-on-Ignition Procedure Percent organic matter = percent organic carbon Weigh 5.00 to g (to the nearest 0.01 g) sieved 2-mm soil into an ashing vessel (50-mL beaker or other suitable vessel). Place the ashing vessel and soil into a drying oven set at 105 C (221 F) and dry for 4 hr. Remove the ashing vessel from the drying oven and place in a dry atmosphere. When cooled, weigh to the nearest 0.01 g. Place the ashing vessel plus soil into a muffle furnace and bring the temperature to 400 C (752 F). Ash in the furnace for 4 hr. Remove the ashing vessel from the muffle furnace; let cool in a dry atmosphere and weigh to the nearest 0.01 g Calculation Percent organic matter in soil = [(W 105 W 400 ) 100]/W 105 where W 105 is the weight of soil at 105 C (221 F) and W 400 is the weight of soil at 400 C (752 F)
256 Physical, Chemical, and Biological Properties of Soils 225. TABLE 7.22 Functions of Organic Matter and Organisms in Soil Components of organic matter can: Attract and hold cation nutrient elements and trace elements in an available state, reducing leaching losses. Bind soil particles into aggregates, producing a granular structure that allows root accessibility to air, capillary movement of water, and penetration of roots through soil. Soak up water. Be transformed into vitamins, hormones, and other substances that stimulate growth of plants and soil organisms. Be transformed into plant toxins that suppress weeds. Soil organisms can: Fix nitrogen (N 2 ) from the air. Form symbiotic relationships with plant roots, thereby serving the plants as extensions in their searches for mineral nutrient elements. Produce vitamins, growth hormones, and organic acids (effective solvents of minerals) as by-products of metabolism. Contribute to soil aggregation and distribution of nutrient elements by binding organic matter and mineral particles or by feeding on plant debris, mixing it throughout the soil, and forming tunnels and nutrient-rich fecal matter. Prey on plant pathogens. Produce carbon dioxide (CO 2 ) as a metabolism by-product that passes through the soil and into the atmosphere and becomes a source for absorption of carbon by plant leaves. Source: Parnes, R., Fertile Soil: A Grower s Guide to Organic and Inorganic Fertilizers, 1990, AgAccess, Davis, CA. With permission.
257 226 Agronomic Handbook: Management of Crops, Soils, and Their Fertility TABLE 7.23 Properties and Functions of Organic Matter in Soil Property Reservoir of metabolic energy Source of macronutrients Ecosystem resilience Stimulation and inhibition of enzyme activities and plant and microbial growth Stabilization of soil structure Water retention Low solubility Color Cation exchange capacity Buffering capacity and ph effects Chelation of metals Interactions with xenobiotics Function Biological Properties Organic matter provides the metabolic energy that drives soil biological processes. The mineralization of soil organic matter can positively or negatively influence the size of the available macronutrient (N, P, and S) pools. The build-up of significant pools of organic matter and associated nutrients can enhance the ability of an ecosystem to recover after imposed natural or anthropogenic perturbations. The activity of enzymes found in soils and the growth of plants and microorganisms can be stimulated or inhibited by the presence of soil humic materials. Physical Properties Through the formation of bonds with the reactive surfaces of soil mineral particles, organic matter is capable of binding individual particles and aggregations of soil particles into water-stable aggregates at scales ranging from <2 µm for organic molecules to millimeters for plant roots and fungal hyphae. Organic matter can affect water retention directly through its ability to absorb up to 20 times its mass of water and indirectly through its impact on soil structure and pore geometry. Ensures that the bulk of organic materials added to the soil are retained and not leached out of the soil profile. The dark color soil organic matter imparts may alter thermal properties. Chemical Properties The high charge characteristics of soil organic matter enhance retention of cations (e.g., Al 3+, Fe 3+, Ca 2+, Mg 2+, NH + 4, ) and transition metal micronutrients. In slightly acidic to alkaline soils, organic matter can act as a buffer and aids in the maintenance of acceptable soil ph conditions. Stable complexes formed with metals and trace elements enhance the dissolution of soil minerals, reduce losses of soil micronutrients, reduce the potential toxicity of metals, and enhance the availability of P. Organic matter can alter the biodegradability, activity, and persistence of pesticides in soils. Source: Sumner, M.E., Ed., Handbook of Soil Science, 2000, CRC Press, Boca Raton, FL, p. B-29.
258 Physical, Chemical, and Biological Properties of Soils SOIL COMPONENT GLOSSARY Soil organic matter (SOM) All natural and thermally altered, biologically derived organic material found in the soil or on the soil surface regardless of source or stage of decomposition, whether living or dead, and excluding the above-ground portions of living plants. Phytomass Living tissue of plant origin; standing plant components that are dead (e.g., standing dead trees) are also considered phytomass. Microbial biomass Organic matter associated with cells of living soil microorganisms. Faunal blomass Organic matter associated with living soil fauna. Nonliving component Organic fragment with a recognizable cellular structure derived from any source but usually dominated by plant-derived materials. Litter Particulate organic material devoid of mineral residues and located on the soil surface. Macroorganic matter Fragments of organic matter 20 µm to 50 µm in size (i.e., larger than the lower size limit of the sand fraction) contained within the mineral soil matrix and typically isolated by sieving dispersed soil. Light fraction Organic materials isolated from mineral soils by flotation of dispersed soil suspensions on water or heavy liquids of densities 1.5 to 2.0 mg per m 3. Dissolved organic matter Water-soluble organic compounds found in the soil solution that are smaller than 0.45 µm by definition; consists of simple compounds of biological origin (e.g., metabolites of microbial and plant processes) including sugars, amino acids, low molecular weight organic acids (citrate, malate, etc.); may also include large molecules. Humus Organic materials remaining in the soil after removal of macroorganic matter and dissolved organic matter. Non-humic biomolecules Identifiable organic structures that can be placed into discrete categories of biopolymers including polysaccharides and sugars, proteins and amino acids, fats, waxes and other lipids, and lignins. Humic substances Organic molecules with chemical structures that do not allow them to categorized as nonhumic biomolecules. Humic acids Organic materials that are soluble in alkaline solution but precipitate on acidification of the alkaline extracts. Fulvic acids Organic materials that soluble in alkaline solution and remain soluble on acidification of the alkaline extracts. Humins Organic materials that are insoluble in alkaline solution. Inert organic matter Highly carbonized organic materials including charcoal, charred plant materials, graphites, and coals that have long turnover times
259 228 Agronomic Handbook: Management of Crops, Soils, and Their Fertility. TABLE 7.24 Organic Matter Components of a Grassland Soil (wt% in dry matter) Component % Humus 85 Plant roots 10 Soil flora and fauna 5 Total 100 Soil Flora and Fauna % Fungi and algae 40 Bacteria and actinomycetes 40 Earthworms 12 Other macrofauna 5 Mesofauna and microfauna 3 Total 100 TABLE 7.25 Interpretative Values for Organic Matter Content in Top 6 Inches of Soil Soil Test Rating Organic Matter Content Range (%) Very low Low Medium High Very high > SOIL SALINITY SOLUBLE SALT DETERMINATION PROCEDURES :1 Water/Soil Extraction Scoop 10 cm 3 2-mm-sieved soil into a beaker; add 20 ml water and stir thoroughly. Allow the suspension to settle at least 30 min or long enough for the solids to settle. Insert the conductivity cell into the supernatant and read the electrical conductivity :1 Water/Soil Extraction Scoop 20 cm 3 2-mm-sieved soil into a test tube or small container. Add 20 ml water, stir thoroughly, and allow the suspension to stand 15 to 20 min. Insert the conductivity cell into the suspension and read the electrical conductivity.
260 Physical, Chemical, and Biological Properties of Soils Saturated Paste Method Weigh 250 g air-dried <10-mesh-sieved (2-mm) soil into a 400-mL beaker. Add water while stirring with a spatula until the soil slides freely from the surface of the spatula. At saturation the soil paste will glisten as it reflects light. Let stand for 1 hr. Transfer the saturated paste to a filter funnel and draw water from the soil by applying vacuum. Insert the conductivity cell into the filtrate and read the electrical conductivity. TABLE 7.26 Interpretation of Soil Conductance Readings (ds/m) Saturated Paste 2:1 Water/Soil Effects <1.0 <0.40 Nonsaline: Salinity effects mostly negligible Very slightly saline: Yields of very salt-sensitive crops may be reduced by 25 to 50% Moderately saline: Yields of salt-sensitive crops restricted; crop yields reduced by 25 to 50% Saline soils: Only tolerant crops will grow normally Strongly saline: Only salt-tolerant crops yield satisfactorily. >16.0 >3.2 Very strongly saline: Only salt-tolerant crops will grow. TABLE 7.27 Conductivity of Soluble Salts Electrical Conductivity (ds/cm) a Electrical Conductivity (ds/cm) b Assessment < Not saline Slightly saline Saline Very saline >6.0 >16.1 Highly saline a Handbook of Agriculture, 1999, Marcel Dekker, New York. b Jones, J.B., Jr., Laboratory Guide for Conducting Soil Tests and Plant Analysis, 2001, CRC Press, Boca Raton, FL. TABLE 7.28 Relationship of Degree of Salinity (ds/m) and Soil Texture Soil Texture Degree of Salinity Coarse to Loamy Sand Loamy Fine Sand to Loam Silt Loam to Clay Loam Silty Clay Loam to Clay Nonsaline Slightly saline Moderately saline Strongly saline Very strongly saline >9.0 >9.5 >10.1 >11.5
261 230 Agronomic Handbook: Management of Crops, Soils, and Their Fertility TABLE 7.29 Interpretation of Field Soil Salt Concentrations Salt Concentration ppm ds/m Safety Level 0 1, Low to normal 1,000 2,000 Slightly saline; some plants restricted 2,000 3,000 Moderately saline; many plants restricted 3,000 4,000 Strongly saline; salt-tolerant plants >4,000 >16 Very strongly saline; few plants grow Source: Compost Organics: Buyers Guide, Composting News, Mentor, OH. TABLE 7.30 Crop Tolerance to Salinity High Tolerance Bermuda grass Barley Sugar beet Cotton Medium Tolerance Sweet clover Alfalfa Rye Wheat Oats Rice Sorghum Corn CORRECTING SALINITY PROBLEMS Problem Soils Sodium chloride (NaCl) toxicity is likely to occur in: Saline soils formed from salt water sediments Previously fertile soils that were flooded or heavily irrigated with water containing high concentrations of NaCl Correcting Salinity 2 Leaching with good quality irrigation water is the most effective means of removing excess Na and Cl from the soil. The water table may have to be lowered. Permeable soils such as well structured sandy soils are often easily reclaimed, but the problem is more difficult in less permeable soils (for example, poorly structured heavy clays). If exchangeable Na in the soil is high, reclamation involves replacement of the adsorbed Na with Ca by applying gypsum (calcium sulfate), then leaching the dissolved Na and Cl beyond the rooting depths of the plants. If irrigation water is to be used to leach the Na, its quality should be checked before use to ensure it is not saline. Where excess NaCl cannot be wholly corrected by soil leaching, a more tolerant species may have to be grown.
262 Physical, Chemical, and Biological Properties of Soils 231 TABLE 7.31 Amounts of Gypsum and Sulfur Required to Reclaim Alkali Soils Exchangeable Tons/Acre for Top 1 ft Tons/Acre for Top 6 in. Na (meq/100 g) a Gypsum Sulfur Gypsum Sulfur a As determined by soil test. Source: U.S. Department of Agriculture, Diagnosis and Improvement of Saline and Alkali Soils, 1954, Handbook No. 60, U.S. Government Printing Office, Washington, D.C MEASUREMENT OF CONDUCTIVITY USING A SOLUBLE SALT METER* Theory of Operation Conductance is the readiness of materials to carry electric current. Liquids that carry electric currents are generally referred to as electrolytic conductors. The flow of current through electrolytic conductors is accomplished by the movement of electric charges (positive and negative ions) when the liquid is under the influence of an electrical field. The conductance of a liquid can be defined by its electrical properties the ratio of current to voltage between any two points within the liquid. As the two points move closer together or further apart, the value changes. To be useful for analytical purposes, a measurement requires dimensions or physical parameters. Defining the physical parameters of a measurement creates a standard measure. Specific conductance or conductivity is an example of a standard measure. It is defined as the reciprocal of the resistance in ohms measured between the opposing faces of a 1-cm cube of liquid at a specific temperature. The units used to define conductance are: 1 ohm = 1 mho = 1,000 ms = 1,000,000 µs. Standard international units may be used in place of mhos: 1 mho = 1 Siemen (S). Conductivity units are expressed as µs/cm (1.0 ds/m = 1.0 S/cm) or ms/cm Design of Conductivity Cell In theory, a conductivity measuring cell is formed by two square surfaces spaced 1 cm apart. Cells of different physical configurations are characterized by a cell constant value known as K a function of the electrode areas, the distance between the electrodes, and the electrical field pattern between the electrodes. This theoretical cell has a constant K of 1.0. Often, because of sample volume or space issues, a cell is designed differently. Cells with constants of 1.0 or more normally have small, widely spaced electrodes. Cells with constants of K = 0.1 or less normally have large, closely spaced electrodes. Since K reflects the configuraton of a certain cell, it must * Information from Denton Slovacek, Manager of Technical Training Center, HACH Company, Loveland, CO.
263 232 Agronomic Handbook: Management of Crops, Soils, and Their Fertility be multiplied by the observed conductance to yield the actual conductivity reading. For example, for an observed conductance reading of 200 µs using a cell with K = 0.1, the conductivity value is = 20 µs/cm. In a simplified approach, the cell constant is defined as the ratio of the distance between electrodes (d) to the electrode area (A). This, however, neglects the fringe-field effect that affects the electrode area by the quantity AR. Therefore, K = d/(a + AR). Because it is normally impossible to measure the fringe-field effect and the amount of AR to calculate K, the actual K of a specific cell is determined by a comparison measurement of a standard solution of known electrolytic conductivity. The most commonly used standard solution for calibration is 0.01 M KCl which has a conductivity of 1,412 µs/cm at 25 C. Some sources in literature quote this value at 1,409 or 1,413 µs/cm at 25 C. Differences are due to the use of kilograms (weights) of water rather than liters (volumes) and changes in assigned molecular weights, definitions of Siemens, the use of different temperature scales, and whether the inherent conductivity of water was subtracted from the equation. For normal laboratory calibration, the difference arising from using 1,409 versus 1,413 µs/cm is insignificant. In summary, calibration of a conductivity probe is required to compensate for the fact that the K is not specifically known and changes as an electrode ages. Calibration simply adjusts the measured reading to the true value at a specified temperature Effect of Temperature The conductivity of a solution with a specific electrolyte concentration will change with a change in temperature. The temperature-compensated conductivity of a solution is the conductivity the solution exhibits at the reference temperature. The reference temperature is 20 or 25 C. A measurement made at reference temperature needs no compensation. Generally, for most aqueous samples, a coefficient of 2.1% per degree Celsius (C) is used in temperature compensation, with the apparent value set 2.1% higher for each degree above 25 C. Conversely, the apparent value will be 2.1% lower for each degree below 25. For soil and irrigation water analysis, the standard temperature for measurement is 25 C. A useful algorithm for temperature correction is: C = C 25 [ (T 25)] where C = the measured conductivity of a solution at sample temperature; C 25 = the conductivity of the solution at 25 C; and T = the sample temperature (in degrees C). Many conductivity meters automatically compensate for temperature if the conductivity probe includes a thermistor. However, errors can arise in analysis if the thermistor is not accurate or the instrument is improperly calibrated. The following examples explain the effects of and compensation for fringe-field effect and temperature. Example 1: Manual Temperature Compensation An analyst wishes to calibrate a conductivity probe and measure an unknown sample. The conductivity probe is specified to have a cell constant of 1.0. The analyst is calibrating in a 0.01M KCl (conductivity = 1,412 µs/cm at 25 C) solution at a temperature of 22 C. Automatic temperature compensation is not available. 1. Determine the conductivity of the 0.01M KCl at 22 C. Conductivity of KCl at 22 C = 1,412[ (22 25)] Conductivity of KCl at 22 C = 1,412 [0.937] Conductivity of KCl at 22 C = 1,323 µs/cm
264 Physical, Chemical, and Biological Properties of Soils Immerse the conductivity probe into the standard and adjust the value to 1,323 µs/cm. Any adjustment made will compensate for the difference between the specified cell constants and the true cell constant. 3. The analyst measures an unknown sample whose temperature is 19 C and obtains an apparent value of 967 µs/cm. How is this value adjusted to 25 C? 967 µs/cm = C 25 [ (19 25)] C 25 = 967 µs/[ (19 25)] C 25 = 967 µs/[ (-6)] C 25 = 967 µs/0.874 C 25 = 1,106 µs/cm Example 2: Automatic Temperature Compensation (ATC) An analyst wishes to calibrate a conductivity probe and measure a sample. The conductivity probe has a cell constant of 1.0. The analyst is calibrating in a 0.01M KCl (conductivity = 1,412 µs/cm at 25 C) solution at 22 C. ATC at 25 C is available. 1. Immerse the conductivity probe into the standard and adjust the value to 1,412 µs/cm. Any adjustment made will compensate for the difference between the specified cell constant and the true cell constant. (Most modern instrumentation displays the true temperature along with the temperature-compensated conductivity value.) In this case, the display would show a conductivity of 1,412 µs/cm and 22 C. 2. Once the electrode has been calibrated, it is cleaned and placed into the unknown sample at 19 C. When temperature is stable, the correct conductivity value of 1,106 µs is displayed Sources of Error in Measurement Temperature Compensation Because many conductivity probes now include a thermistor for ATC, it is important to determine whether the thermistor reading is accurate at the temperatures at which samples are measured. If it is not, the automatic temperature-corrected value will be inaccurate. Compare the measured value from the thermistor with that from a quality laboratory thermometer. If the values differ significantly, contact the manufacturer about the defect or consider manual temperature compensation Improper Calibration Calibration standards often sit on laboratory shelves for long periods. They should be fresh and known to be correct at least to ±1% before calibration is attempted. Since the conductometric response is not perfectly linear at all ranges, it is best to calibrate the probe in the same magnitude of range as the samples to be measured. In other words, do not calibrate a conductivity probe in a 100-µS/cm standard if your samples are typically in the >1,000-µS/cm range. Standard conductivity solutions: KCl Concentration at 25 C Conductivity (µs/cm) 0.001N N N N 6.668
265 234 Agronomic Handbook: Management of Crops, Soils, and Their Fertility Condition of Probe Probes can become inaccurate if the probe elements become coated with interfering substances. During normal use, rinse the probe thoroughly with laboratory grade water between each measurement. This will minimize the build-up of coating substances. If the probe needs cleaning, first try ethanol, which effectively removes most organics. If ethanol is not successful, clean the probe with a strong detergent solution and rinse thoroughly with demineralized water. The cells may occasionally need replatinization to refresh the plates and return them back to the original cell constant. The cell constant will change when the platinum black layer becomes partially eroded or contaminated. Follow the manufacturer s directions on this procedure. 7.9 MEASUREMENTS AND CONVERSIONS ELECTRICAL CONDUCTIVITY UNITS AND CONVERSIONS 1 millimho per centimeter = mmho/cm = conductivity x micromho per centimeter = µmho/cm = conductivity x ,000 micromhos per centimeter = 1 mmho/cm 1 millisiemen per centimeter = 1 ms/cm = 1 µmho/cm 1,000 microsiemen per centimeter = 1 µs/m = 1 µmho/cm 1 decasiemen per meter = 1 ds/m = 1 ms/cm = 1 mmho/cm = 700 ppm SALINITY (NACL) AND ALKALINITY (NAHCO 3 ) fertilizer (200 ppm) = conductivity of 1.5 ds/m and a ph of ppm NaCl = conductivity of 3.0 ds/m 400 ppm NaCl = conductivity of 7.2 ds/m 100 ppm NaHCO 3 (ph = 6.06) = conductivity of 1.5 ds/m 200 ppm NaHCO 3 (ph = 7.14) = conductivity of 1.9 ds/m 300 ppm NaHCO 3 (ph = 7.43) = conductivity of 2.3 ds/m 400 ppm NaHCO 3 (ph = 7.62) = conductivity of 2.8 ds/m 500 ppm NaHCO 3 (ph = 7.88) = conductivity of 3.1 ds/m REFERENCES 1. Glossary of Soil Science Terms, 1987, Soil Science Society of America, Madison, WI. 2. Grundon, N.J., Hungry Crops: A Guide to Nutrient Deficiencies in Field Crops, 1987, Queensland Department of Primary Industries, Brisbane, Australia.
266 Part IV Soil Analysis and Treatment
267
268 8 Soil ph, Liming, and Liming Materials 8.1 DETERMINATION OF SOIL ph IN WATER AND SALT SOLUTIONS DETERMINATION OF ph IN WATER AND SALT SOLUTIONS USING ph METER Water ph Determination Weigh 10 g air-dried <10-mesh-sieved (2-mm) soil into a cup. Pipette 10 ml water into the cup and mix thoroughly for 5 min with a glass rod or mechanical stirrer. Let the soil water suspension stand for 30 min. Perform ph measurement at 20 to 25 C (68 to 77 F). Before analysis, stir the soil water suspension with glass rod or mechanical stirrer. Insert electrodes of calibrated ph meter into the soil water slurry so that the electrode tips are at the soil water interface; swirl soil water suspension slightly. Read ph immediately (after 30 to 60 sec) to the nearest 0.1 unit. Note: Erratic movement of the ph meter dial or number may be due to a faulty operating electrode or lack of sufficient junction potential. The position of the reference electrode with respect to the glass electrode and the flow rate from the reference electrode may affect the ph determination ph Determination in 0.01M Calcium Chloride (CaCl 2 ) To mask the variability in salt content, maintain the soil in a flocculated condition, and decrease the junction potential effect. Measure the soil ph in 0.01M CaCl 2 solution. The same procedure is followed as used to measure ph in water, except 0.01M CaCl 2 is substituted for water in preparing the soil slurry. The ph values obtained will be lower (usually 0.3 to 0.5 of a ph unit) than values measured in water. The ph meter needle will move less with agitation of the slurry and quickly settle on the reading. A different set of interpretative values must be used when ph is measured in 0.01M CaCl Reagents 0.01M Calcium chloride Weigh 1.47 g calcium chloride dihydrate (CaCl 2 2H 2 O) into a 1,000- ml volumetric flask and bring to volume with water. 1.0M Calcium chloride Weigh 147 g calcium chloride dihydrate (CaCl 2. 2H 2 O) into a 1,000-mL volumetric flask and bring to volume with water ph Determination Weigh 5 g or scoop 4.25 cm 3 air-dried <10-mesh-sieved (2-mm) soil into a 50-mL cup. Pipette 5 ml 0.01M CaCl 2 solution into the cup and stir 30 min on a mechanical stirrer or shaker or stir periodically with a glass rod for 30 min. Calibrate the ph meter according to the instructions supplied with the meter. Stir the soil and 0.01M CaCl 2 slurry. 237
269 238 Agronomic Handbook: Management of Crops, Soils, and Their Fertility Lower the electrodes into the soil CaCl 2 slurry so that the electrode tips are at the soil water interface. While stirring the slurry, read the ph and record value to the nearest 0.1 ph unit. Note: For laboratories desiring tests in water and 0.01M CaCl 2, 5 ml water can be substituted for the 5 ml 0.01M CaCl 2. After the water ph is detertmined, add 1 drop 1M CaCl 2 to the soil water suspension, stir or shake 30 min and then read the ph of the suspension ph Determination in 1N Potassium Chloride (KCl) To establish a significant salt content in the soil slurry for measuring ph, the soil ph measurement can be made in a 1N KCl solution. This procedure is commonly used in Europe and other parts of the world for soil ph determination. The same procedure is followed as that used to measure ph in water, except 1N KCl is substituted for water in the preparation of the soil slurry. The ph value obtained will be lower (usually 0.5 to 1.0 of a ph unit) than that measured in water. The ph meter needle will move less with agitation in the soil slurry and quickly settle on the reading. A different set of ph interpretative values must be used when the ph is measured in 1N KCl Reagent 1N Potassium chloride Weigh g potassium chloride (KCl) into a 1,000-mL volumetric flask and bring to volume with water ph Determination Weigh 5 g or scoop 4.25 cm 3 air-dried <10-mesh-sieved (2-mm) soil into a cup. Pipette 5 ml 1 N KCl into the cup and stir for 5 sec. Let stand 10 min. Calibrate the ph meter according to the instructions supplied with the meter. Stir the soil and 1N KCl slurry. Lower the electrodes into the slurry so that the electrode tips are at the soil water interface. Read the ph and record to nearest 0.1 ph unit. FIGURE 8.1 Regression line for the relationship of ph of CaCl 2 and ph of KCl.
270 Soil ph, Liming, and Liming Materials DETERMINATION OF SOIL ph USING COLOR INDICATORS ph and Corresponding Colors of Various Indicators Critical Indicator Critical ph Color Change a Thymol blue b 1.9 R-O-Y Dinitrophenol 3.1 C-Y-Y Methyl orange 3.7 R-Y-O Bromphenol blue 4.0 Y-Pu-V Bromcresol green 4.6 Y-G-B Chlorphenol red 5.6 Y-OP-V Methyl red 5.7 R-O-Y Bromthymol blue 6.9 Y-G-B Phenol red 7.3 Y-RO-V Phenolphthalein 8.3 C-P-P Thymolphtalein 9.4 C-B-B Alizarin yellow R 10.3 Y-O-R ph and Corresponding Color of Bromocresol Purple Mixed Indicator Color ph Brilliant red <3.0 Red Red orange Orange Orange yellow Yellow Greenish yellow Green Greenish blue Blue >7.9 a Color at center is at critical ph; B = blue, C = colorless, G = green, O = orange, P = pink, Pu = purple, R = red, V = violet, Y = yellow. b Thymol blue has two critical ph values Procedures Laboratory Procedure Weigh 15.0 g aliquot of soil into a clean 100-mL centrifuge tube. Add 30 ml distilled water, and swirl frequently for 1 min. Centrifuge the mixture at 2,500 rpm for 15 min and filter the supernatant into a 150-mL beaker. Transfer 10 ml of the clear solution into a test tube. Add 5 to 10 drops duplex indicator or mixed indicator and swirl to develop color. Match the color with the color chart to determine ph. If the mixed indicator is used, prepare a series of standards and match the color with the standards Field Procedure Place a small sample of soil in a plastic spoon. Wet the sample with distilled water and allow the mixture to react for 5 min. Tilt the spoon to separate the liquid from the soil and add 2 to 3 drops of duplex indicator (Bromocresol Purple) to the solution. Match the color developed with the color chart to determine ph. 8.2 SOIL ACIDITY DEFINITIONS Acid soil Soil with a ph value <7.0. Acidic cations Hydrogen ions (H + ) or cations that, when added to water, undergo hydrolysis and produce an acidic solution. Examples in soils are H +, Al 3+, and Fe 3+. Acidity, residual Soil acidity that is neutralized by lime or other alkaline materials; it cannot be replaced by an unbuffered salt solution. Acidity, salt-replaceable Al or H that can be replaced from an acid by an unbuffered salt solution such as KCl or NaCl. Acidity, total Total acidity in a soil or clay; usually estimated by a buffered salt determination: cation exchange capacity exchangeable bases = total acidity; can also be approximated by: salt-replaceable acidity + residual acidity.
271 240 Agronomic Handbook: Management of Crops, Soils, and Their Fertility 8.3 ph Interpretation The degree of acidity or alkalinity is expressed as a ph value; descriptive terms related to a range in ph serve as interpretations. The ideal soil ph and range will also vary with soil type and crop. Independent of these factors, three such category ranges for soil water ph categorization are shown in Table 8.1. TABLE 8.1 Three Category Ranges of Soil Water ph Interpretation Category ph Category ph Category ph Extremely acid <4.5 Very acid Acid <4.5 Very strongly acid Acid Weakly acid Strongly acid Slightly acid Neutral Moderately acid Neutral Weakly basic Slightly acid Alkaline Basic >9.5 Neutral Slightly alkaline Moderately alkaline Strongly alkaline Very strongly alkaline >9.1 TABLE 8.2 Interpretation of Soil Water ph ph Interpretation <4.0 Extremely acid Very strongly acidic Strongly acid Moderately acidic Slightly acidic Range of neutral 7.0 Neutral Weakly alkaline Moderately alkaline Highly alkaline Very highly alkaline >10.0 Extremely alkaline Optimal for most crops Subhumid grassland soils Soils with excess Ca 2+ ion Soils with excess Na + ions TABLE 8.3 ph Categories Determined in 0.01M CaCl 2 2H 2 O Category ph Acid <4.5 Weakly acid Neutral Weakly basic Basic >9.5 Source: Handbook of Agriculture, 1999, Marcel Dekker, New York. With permission.
 FIGURE 8.3 Soil ph ranges.")
272 Soil ph, Liming, and Liming Materials 241 FIGURE 8.2 ph scale for agricultural soils. (Source: Crop Fertilization Based on North Carolina Soil Tests, 1997, North Carolina Department of Agriculture and Consumer Services, Raleigh.) FIGURE 8.3 Soil ph ranges. (Source: Soil Analysis: An Interpretation Manual, 1999, CSIRO Publishing, Collingwood, Australia.)
 of")
273 242 Agronomic Handbook: Management of Crops, Soils, and Their Fertility 8.4 EFFECT OF ph ON SOIL AND PLANT COMPOSITION Soil ph can significantly influence plant growth by affecting the composition of the soil solution and the availability (sufficiency or toxicity) of essential and nonessential elements as shown in Figure 8.4 for mineral soils, Figure 8.5 for organic soils, and Table 8.4. TABLE 8.4 Effect of Soil ph on Element Availability and/or Soil Solution Composition Element ph Decreasing ph Increasing Aluminum Increases Decreases Copper Increases Decreases Iron Increases Decreases Magnesium Decreases Increases Manganese Increases Decreases Zinc Increases Decreases FIGURE 8.4 Availability of elements to plants at different ph levels for mineral soils. (From Sartoretto, P., The ph-factor, 1991 W-A-clearly Chemical, Dayton, N.J.).
. 8.5 FERTILIZER EFFICIENCY TABLE 8.")
274 Soil ph, Liming, and Liming Materials 243 FIGURE 8.5 Availability of elements to plants at different ph levels for mineral soils. (From Sartoretto, P., The ph-factor, 1991 W-A-clearly Chemical, Dayton, N.J.). 8.5 FERTILIZER EFFICIENCY TABLE 8.5 Fertilizer Efficiency (%) at Varying Soil ph Levels Fertilizer Efficiency (%) Soil Acidity ph Nitrogen Phosphate Potash Extreme Very strong Strong Medium Neutral
275 244 Agronomic Handbook: Management of Crops, Soils, and Their Fertility 8.6 LIME RATE (LR) RECOMMENDATIONS The lime requirement (LR) is the quantity of agricultural limestone required to raise the soil water ph from acidic level to a level near neutrality. Determining the soil water ph and knowing the soil texture (plus organic matter content for some types of soil) allows LR to be estimated. Several buffer methods are commonly used to determine soil LR levels: the Adams Evans buffer for sandy low cation exchange capacity (CEC) soils, SMP for silt and clay loam soils of moderate CEC and organic matter content, and the Mehlich buffer for most soils. 1 TABLE 8.6 Finely Ground Limestone Needed to Raise ph from 4.5 to 5.5 and from 5.5 to 6.5 in a 7-Inch Layer of Soil Soil Type Limestone Requirement Per Acre Cool and Temperate Regions a ph ph Warm and Tropical Regions b ph ph Sand, loamy sand Sandy loam Loam Silt loam Clay loam Muck a Gray or brown Podsols. b Red or yellow soils. TABLE 8.7 Approximate Amounts (tons/a) of Finely Ground Limestone Needed to Raise the ph of a 7-Inch Layer of Soil Soil Region and Texture Class Limestone Requirement LR(tons/A) to Increase ph From 3.5 to 4.5 From 4.5 to 5.5 From 5.5 to 6.5 Soils of warm-temperate and tropical regions Sand and loamy sand Sandy loam Loam Silt loam Clay loam Muck Soils of cool-temperate and temperate regions Sand and loamy sand Sandy loam Loam Silt loam Clay loam Muck
276 Soil ph, Liming, and Liming Materials 245 TABLE 8.8 Quantity of Ag-Ground Limestone (1,000 lb/acre) a Required to Raise Acid Soil ph to 6.5 to a Soil Depth of 6 2/3 Inches Based on Soil Water ph and Soil Texture Lime Requirement (1,000bs/A) b Soil Water ph S SL L SiCl O nr c nr a Ag-ground limestone with a Total Neutralizing Power (TNP) of 90 and fineness of 40%, <100-mesh; 50%, <60-mesh; and 95%, <8-mesh. Rate adjustment is required for other liming materials or different depths. b S = sand; SL = sandy and gravelly loam; L = loam; SiCl = silt and clay loam; O = organic soil and soilless mixes. c nr = None required. TABLE 8.9 Approximate Amount of Finely Ground Limestone Needed to Raise the ph of a 7-Inch Layer of Soil LR (lb/1,000 ft 2 ) to Raise ph Soil Texture From 4.5 to 5.5 From 5.5 to 6.5 Sand and loamy sand Sandy loam Loam Silt loam Clay loam Muck Source: Western Fertilizer Handbook, Horticulture Edition, Interstate Publishers, 1998, Danville, IL. With permission from California Plant Health Association.
277 246 Agronomic Handbook: Management of Crops, Soils, and Their Fertility TABLE 8.10 Agricultural Limestone (Tons/Acre) Needed to Raise Soil ph to Desired Level Based on the SMP Lime Test Index and Incorporation Depth of 8 In. Lime Test Index a Desired ph Level Mineral Soils Organic Soils 6.8 b 6.5 b 6.0 b Soil ph a Lime test index is the SMP buffer ph x 10. b Values based on agricultural limestone with a neutralizing value of 90% (Indiana RNV = 65, 0hio total neuitralizing power = 90+). Adjustments in the application rate should be made for liming materials with different particle sizes, neutralizing values, and depths of incorporation. TABLE 8.11 Adjustment for Extractable Aluminum (based on Morgan Wolf modification) Add 45 lb ag-ground limestone/acre for each 10 ppm extractable Al. TABLE 8.12 Prediction of Lime Requirement for Most Tropical Soils CaCO 3, equivalent (tons/ha) = 2.0 a x meq Al/100 g a Factor ranges from 1.5 to 3.3, with most between 1.5 and 2.0; actual value determined in accordance with site specificity and crop tolerance to Al. Source: International Soil Fertility Manual, 1995, Potash & Phosphate Institute, Norcross, GA. 8.7 LIMING GLOSSARY Acid-forming fertilizer Fertilizer capable of increasing acidity (lowering ph) of a soil after application. Agricultural liming material Material that contains Ca and Mg in forms capable of reducing soil acidity. Aglime Synonymous with agstone; produced by crushing and grinding calcite or dolomite limestone to a gradation or fineness that enables it to neutralize soil acidity; usually ground to pass sieves in the 8- to 100-mesh range or finer.
278 Soil ph, Liming, and Liming Materials 247 Calcite Crystalline form of calcium carbonate (CaCO 3 ). Pure calcite contains 100% calcium carbonate (40% Ca). Although calcite occurs in nature, limestones of this purity are not commercially available. It may be colorless, but is usually tinted by impurities. Calcitic limestone Term widely used to refer to agricultural limestone with high Ca content; mainly contains CaCO 3, but may also contain small amounts of Mg. Term is not restrictive in definition like calcite with which it is frequently confused. Calcium carbonate (CaCO 3) A compound consisting of Ca combined with carbonate; occurs in nature as limestone, marble, chalk, marl, shell, and similar substances. Calcium carbonate equivalent (CCE) Expression of the acid-neutralizing capacity of a carbonate relative to that for pure CaCO 3, e.g., calcite; expressed as a percentage. The value for pure calcite is 100%; for pure dolomite, 108.5%. CCEs of most limestones vary from these percentages due to impurities in the rock and the fact that commercially available limestones are usually composed of mixtures of calcite and dolomite rather than either compound in its pure form. Calcium oxide (CaO) Chemical compound composed of Ca and O; formed from CaCO 3 by heating limestone to drive off CO 2 ; also known as quick lime, unslaked lime, burnt lime, caustic lime; does not occur in nature. Calcium oxide equivalent Percentage of calcium oxide (CaO) in a liming material plus 1.39 times the magnesium oxide (MgO) content. For pure calcite, the value is 56.0%; for pure dolomite, 60.8%. Used by some states as a measure of aglime quality. Dolomite Limestone containing MgCO 3 in an amount approximately equivalent to its CaCO 3 content. Limestone containing MgCO 3 in lesser proportions is called magnesium limestone or dolomitic limestone. Pure dolomite is 54.3% CaCO 3 and 45.7% MgCO 3. Expressed another way, it is comprised of 30.4% CaO, 21.8% magnesia (MgO), and 47.8% CO 3. Dolomitic limestone Limestone that contains from 10% up to, but less than, 50% dolomite, and from 50 to 90% calcite. The magnesium carbonate (MgCO 3 ) content of dolomitic limestone may range approximately from 4.4 to 22.6%. Effective calcium carbonate equivalent (ECCE) Expression of aglime effectiveness based on the combined effect of purity (CCE) and fineness; required for labeling in some states; determined by multiplying CCE by a set of factors based on fineness of grind of the limestone; also referred to as effective neutralizing value (ENV), total neutralizing power (TNP), effective neutralizing power (ENP), effective neutralizing material (ENM) and, in one state, as lime score. Gypsum Hydrated form of calcium sulfate (CaSO 4 ); supplies calcium to soil, but is neutral and does not correct soil acidity; hence, it is not a liming material. Lime Chemically, it is a compound comprised of calcium and magnesium oxides produced by calcining calcitic or dolomitic limestone; that is, replacing the carbonate (CO 2-3 ) ion with oxygen under heat. However, the term is also broadly applied in agriculture to any material containing calcium and magnesium in forms capable of correcting soil acidity. Lime requirement Quantity of agricultural limestone required to bring an acid soil to neutrality or some other desired degree of acidity or ph; usually stated in pounds per acre of CaCO 3 needed to bring the soil to the desired ph under field conditions. Magnesium limestone Limestone containing 5 to 10% dolomite and 90 to 95% calcite. The MgCO 3 content of magnesium limestone may range from 2.3 to 4.4%. Magnesium carbonate Compound consisting of Mg combined with CO 3 ; occurs in nature as magnesite and as a constituent of dolomitic limestone and dolomite. Magnesium oxide (MgO) Chemical compound composed of Mg and O; formed from MgCO 3 by heating to drive off CO 2, or in a mixture with CaO by heating magnesium limestone or dolomite; also known as magnesia, it is found in nature as periclase. Marble Compact, hard, polishable form of limestone.
279 248 Agronomic Handbook: Management of Crops, Soils, and Their Fertility Marl Granular or loosely consolidated, earthy material composed largely of CaCO 3 in theform of sea shell fragments; contains varying amounts of silt and organic matter. Neutralizing power Calculated on the basis of the chemical composition and fineness of a liming material. Pelletized lime Produced by binding or compressing fine lime particles into large granules or pellets. Suspension lime Suspended finely ground aglime, 100- to 200-mesh, in 50:50 lime:water suspension. 8.8 AGLIME MATERIALS AND CHARACTERISTICS TABLE 8.13 Common Liming Materials a Name Chemical Formula Equivalent % CaCO 3 Source Shell meal CaCO 3 95 Natural shell deposits Limestone CaCO Pure form, finely ground Hydrated lime Ca(OH) Steam burned Burned lime CaO Kiln burned Dolomite CaCO 3 MgCO Natural deposit Sugar beet lime b CaCO Sugar beet by-product Calcium silicate CaSiO Slag Power plant ash CaO, K 2 O, MgO, Na 2 O 5 50 Wood-fired power plants Cement kiln dust CaO, CaSiO Cement plants a Ground to same degree of fineness and at similar moisture content. b Contains 4 to 10% organic matter. Source: Western Fertilization Handbook, Horticulture Edition, 1998, Interstate Publishers, Danville, IL. With permission from California Plant Health Association. TABLE 8.14 Calcium Carbonate Equivalents (CCEs) of Aglime Materials Aglime Material CCE (%) Calcium carbonate 100 Calcitic limestone Dolomitic limestone Marl (Selma chalk) Calcium hydroxide (slaked lime) Calcium oxide (burnt or quick lime) Calcium silicate 86 Basic slag Ground oyster shells Cement kiln dusts Wood ashes Power plant ashes 25 50
280 Soil ph, Liming, and Liming Materials 249 TABLE 8.15 Amounts of Aglime Materials at Different CaCO 3 Equivalents Required to Equal 1 Ton Pure CaCO 3 CaCO 3 Equivalent of Liming Material (%) lb Needed to Equal 1 Ton Pure CaCO , , , , , , , ,667 TABLE 8.16 Effect of Fineness on Aglime Availability Years after Application Mesh Size 1 4 Coarser than to to to TABLE 8.17 Adjustment of LR Based on Depth of Incorporation Depth of Incorporation (in.) Multiplication Factor
281 250 Agronomic Handbook: Management of Crops, Soils, and Their Fertility TABLE 8.18 Aglime Material CaCO 3 Equivalents Required to Equal 1 Ton Pure CaCO 3 CaCO 3 Equivalent of Liming Material (%) lb Needed to Equal 1 Ton Pure CaCO , , , , , , , , LOWERING SOIL WATER ph TABLE 8.19 Approximate Amounts of S (95%) Needed to Increase Acidity of a 6-Inch-Deep Layer of a Carbonate-Free Soil Change in ph Desired lb S/1,000 Ft 2 Sand Loam Clay 8.5 to to to to Source: Western Fertilizer Handbook, Horticultural Edition, 1990, Interstate Publishers, Danville, IL. With permission from California Plant Health Association. TABLE 8.20 Commonly Used Materials and Equivalent Amendment Values Material (100% Basis) Chemical Formula lb Amendment Equivalent to 100 lb Pure Gypsum lb Amendment Equivalent to 100 lb Soil S Gypsum CaSO 4 2H 2 O Soil sulfur S Concentrated sulfuric acid H 2 SO Ferric sulfate Fe 2 (SO 4 ) 3 9H 2 O Lime sulfur (22% S) CaS Calcium chloride CaCl 2 H 2 O 86 Calcium nitrate Ca(NO 3 ) 2 H 2 O 106 Aluminum sulfate Al 2 (SO 4 ) 3 18H 2 O Ammonium polysulfide (NH 4 ) 2 S x 4 23 Source: Western Fertilizer Handbook, Horticulture Edition, 1990, Interstate Publishers, Danville, IL. With permission from California Plant Health Association.
282 Soil ph, Liming, and Liming Materials RESULTS OF NORTH AMERICA SOIL TESTS The following table shows results of soil analyses performed on approximately 2.5 million samples collected in Fall 2000 and Spring 2001 by 31 private and 34 public laboratories. TABLE 8.21 Cumulative Relative Frequencies (%) for Soil Test Water ph in North America by Region Water ph (1:1) >8.5 North Central (994,652 Samples) Northeast (45,327 Samples) Northern Great Plains (124,057 Samples) Southeast (848,258 Samples) Southern Great Plains (221,718 Samples) West (91,249 Samples) Notes: Regional category averages are means of state or province percentages and are not weighted by number of samples. North Central: Missouri, Ohio, Kentucky, Illinois, Indiana, Iowa, Michigan, Wisconsin, Minnesota. Northeast: Prince Edward Island, New Brunswick, Maine, Massachusetts, Delaware, Quebec, New Hampshire, Maryland, Connecticut, New Jersey, Nova Scotia, Pennsylvania, New York, Vermont. Northern Great Plains: Alberta, Manitoba, South Dakota, Saskatchewan, North Dakota, Montana. Southeast: North Carolina, South Carolina, Alabama, Florida, Mississippi, Louisiana, Georgia, Tennessee, Virginia, Arkansas. Southeast: Oklahoma, Nebraska, Texas, Kansas. West: Oregon, Washington, Califonia, Colorado, Nevada, New Mexico, Idaho, Utah, Arizona, Wyoming. Source: Soil Test Levels in North America: Summary Update, PPI/PPIC/FAR Technical Bulletin , Potash & Phosphate Institute, Norcross, GA. With permission. REFERENCES 1. Jones, J. B., Jr., 2001, Laboratory Guide for Conducting Soil Tests and Plant Analysis, CRC Press, Boca Raton, FL.
283
284 9 Fertilizers 9.1 INTRODUCTION Farmers worldwide now use 10 times more fertilizer than was used in Nutrient element depletion of the principal nutrient elements (N, P, and K) ranges from 40 to 60 kg per ha in Latin America and some parts of Africa. World fertilizer use totaled 141 million tons in 2000 (86 million tons of N, 33 million tons of P, and 22 million tons of potash. World fertilizer use between 1950 and 2000 peaked in 1989, decreased steadly from 1989 to 1995, and then began to increase (see Figure 9.1). FIGURE 9.1 World fertilizer use, (Source: Worldwatch Paper 136, The Agricultural Link, 1997, Worldwatch Institute, Washington, D.C.) Low fertilizer prices tended to stimulate fertilizer use. In recent years, use increased in most developing countries and remained about the same or slightly decreased in the developed world. Africa uses only 2% of the world s fertilizer tonnage a quantity insufficient to replace what is removed by crops that undermine soil fertility. The low rate of use is due to lacks of transport infrastructure, credit, and agronomic advisors. The recent reduction in world grain stocks may lead to increased fertilizer use. Fertilizer is defined as an organic or inorganic material of natural or synthetic origin (other than liming materials) that is added to a soil to supply one or more elements essential to the growth of plants. This section will discuss fertilizer use, terminology, materials, and application. 253
285 254 Agronomic Handbook: Management of Crops, Soils, and Their Fertility 9.2 FERTILIZER USE TABLE 9.1 World Fertilizer Use, Year Total (million tons) kg/person a a Preliminary. Sources: Fertilizer Yearbook, United Nations Food and Agriculture Organization, Rome, various years; Soh and Prud homme, Fertilizer Consumption Report; World and Regional Overview and Country Reports, International Fertilizer Association, Paris, December 2000.
286 Fertilizers 255 TABLE 9.2 Fertilizer Consumption by Region for 1995 and Projected Growth Rates for 2025 and 2050 Consumption (million tons) Growth Rate (%) Region Africa China Latin America Middle East Southern and Southeast Asia Eastern Europe Former Soviet Union North America Pacific OECD a Western Europe Developing Transitional OECD a World Total a OECD = Organization for Economic Cooperation and Development.
287 256 Agronomic Handbook: Management of Crops, Soils, and Their Fertility TABLE 9.3 Field Crops: Percent of Area Receiving Fertilizer Applications, All States Surveyed, a Crop Nitrogen Phosphate Potash % 1995 Corn Cotton, upland Soybeans Wheat, winter Wheat, durum Wheat, other spring Corn Cotton, upland Soybeans Wheat, winter Wheat, durum Wheat, other spring Corn Cotton, upland Soybeans Wheat, winter Wheat, durum Wheat, other spring Corn Cotton, upland Soybeans Wheat, winter Wheat, durum Wheat, other spring Corn Cotton, upland Soybeans a Acres receiving one or more applications of a specific fertilizer ingredient. Source: National Agriculture Statistics Service, Washington, D.C., FERTILIZER GLOSSARY 1,2 Acid-forming A product that tends to make soil more acid. Acid-forming fertilizer Fertilizer that, after application to and reaction with soil, increases residual acidity and decreases soil ph. Ammonia See anhydrous ammonia and aqua ammonium. Ammoniated superphosphate Product formed by reaction of superphosphate with ammonia (NH 3 ).
288 Fertilizers 257 Ammoniation Process by which anhydrous ammonia, aqua ammonia or a solution containing NH 3 or other form of nitrogen is used to form ammoniated superphosphate or treat a mixture of fertilizer ingredients (including superphosphate) in the manufacture of a multiple nutrient element fertilizer. Ammonium hydroxide (NH 4 OH) See aqua ammonia. Ammonium nitrate (NH 4 NO 3 ) Product containing approximately 33.5% nitrogen, half of which is in the ammonium (NH 4 ) form and the other half in the nitrate (NO 3 ) form. Ammonium nitrate is water soluble and is used in fertilizer solutions. Ammonium nitrate limestone Combination of ammonium nitrate (NH 4 NO 3 ) and limestone forms a product containing 20.5% nitrogen. Ammonium phosphate Product manufactured by reacting ammonia (NH 3 ) with phosphoric acid (H 3 PO 4 ). Different phosphates can be formed, depending on the amount of NH 3 used. Two commonly used in fertilizers are monoammonium phosphate (NH 4 H 2 PO 4 ) ( ) and diammonium phosphate [(NH 4 ) 2 HPO 4 ] ( , , and ). The last two products result when wet process H 3 PO 4 is used. Ammonium phosphate sulfate Wet process phosphoric acid (H 3 PO 4 ) containing an excess of sulfuric acid (H 2 SO 4 ) is neutralized with ammonia (NH 3 ) to make products such as Ammonium sulfate [(NH 4 ) 2 SO 4 ] Solid material manufactured by reacting ammonia (NH 3 ) with sulfuric acid (H 2 SO 4 ), typically containing 20.5 to 21% nitrogen. Analysis The determination of composition by chemical means and expressed in terms that physical laws require or permit. Although analysis and grade sometimes are used synonymously, grade applies only to the three primary plant nutrient elements (N, available P 2 O 5, and soluble K 2 O) and is stated as the guaranteed minimum quantities present. See grade. Anhydrous ammonia (NH 3 ) Gas containing approximately 82% nitrogen. Under pressure, ammonia gas is changed to a liquid and is stored and transported in this form. Aqua ammonia (NH 4 OH) Ammonium hydroxide formed by dissolving anhydrous ammonia (NH 3 ) in water. Commercial grades of NH 3 liquor usually contain 20 to 25% nitrogen. Most of it is used either for direct application to the soil or in the manufacture of ammoniated superphosphates. Available phosphate The P 2 O 5 equivalent of a water-soluble fertilizer with neutral ammonium citrate considered readily available to growing plants. (P 2 O 5 is phosphorus pentoxide. P 2 O 5 is not found in fertilizers, but has been historically accepted as expressing P content.) The traditional term, available phosphoric acid (H 3 PO 4, frequently abbreviated as APA), is a misnomer because phosphoric acid is H 3 PO 4. Basic slag By-product of steel manufacture containing lime, phosphate (P 2 O 5 ) and small amounts of other plant food elements such as S, Mn, and Fe. Basic slags may contain 10 to 17% P 2 O 5, 35 to 50% Ca, and 2 to 10% MgO. The available P 2 O 5 content of most American slag is in the range of 8 to 10%. Blended fertilizer Mechanical mixture of different fertilizer materials. Bone meal Raw bone meal consists of ground cooked bones from which no gelatin or glue has been removed. Steamed bone meal is cooked under pressure to dissolve some of the gelatin. Borax (Na 2 B 4 O 7 10H 2 O) Salt used in fertilizer as a source of B. Fertilizer borax contains about 11% B. Brand Term, design, or trademark used in connection with one or several grades of fertilizer; trade name assigned by a manufacturer to its fertilizer product. Brand name or product name Specific designation applied to a certain fertilizer. Bulk-blended fertilizer Mixture of dry granular fertilizer materials to yield specific ratios and grades. Individual granules in a bulk-blended fertilizer do not have the same ratio and content of plant food as the total mixture.
289 258 Agronomic Handbook: Management of Crops, Soils, and Their Fertility Bulk fertilizer Commercial fertilizer delivered to the purchaser in an unpackaged solid or liquid state to which a label cannot be attached. Calcite Limestone containing mostly CaCO 3 ; more commonly known as ground agricultural limestone. See liming materials. Calcium ammonia nitrate Product formed by reacting CaCO 3 and NH 4 NO 3 ; typically contains 27% N. Calcium carbonate (CaCO 3) Principal component of calcitic limestone and one of the main components of dolomitic limestone (MgCO 3 is the other). Marl and oyster shells are composed primarily of CaCO 3. See calcite and liming materials. Calcium cyanamide (CaCN 2 ) Organic material containing approximately 21% N; alkaline in reaction; is used as a fertilizer and as a defoliant to control weeds and certain soil-borne diseases. Calcium oxide (CaO) Active ingredient in certain liming materials; liming materials are sometimes compared based on their calcium oxide equivalents. See liming materials. Calcium phosphate Calcium phosphate has several forms; the most prevalent in nature is apatite, a highly insoluble form found mainly as phosphate rock. Apatite is changed into more soluble monocalcium phosphate monohydrate [Ca(H 2 PO 4 ) 2 H 2 O], and CaSO 4 in the manufacture of superphosphate. See superphosphate. Calcium sulfate See gypsum. Complete fertilizer Compound or blend of compounds used for its significant quantities of N, P, and K; may contain other plant nutrients. Compound fertilizer Fertilizer formulated with two or more plant nutrients. Concentrated superphosphate Also called triple superphosphate (TSP); manufactured by reacting H 3 PO 4 with phosphate rock; product has a P 2 O 5 equivalent of 44 to 48%, depending on the ratio of the acids used; contains only a minor amount of gypsum. Controlled release fertilizer Term used interchangeably with delayed release, slow release, controlled availability, slow acting, and metered release to designate controlled dissolution of fertilizer at a lower rate than conventional water-soluble fertilizers. Controlled release properties may result from coatings on water-soluble fertilizers or from low dissolution and/or mineralization rates of fertilizer materials in soil. Copper sulfate (CuSO 4 5H 2 O) Most common source of Cu for fertilizer; 25% Cu; also used as an insecticide and fungicide; common name is blue vitriol. Diammonium phosphate See ammonium phosphate. Dolomite Material used to lime soils in areas where Mg and Ca are needed; made by grinding dolomitic limestone which contains MgCO 3 and CaCO 3. See liming materials. Ferrous sulfate (FeSO 4 7H 2 O) Green vitriol; used as a source of Fe, especially in alkaline soils. Fertigation Application of plant nutrients in irrigation water to accomplish fertilization. Fertilizer Organic or inorganic material of natural or synthetic origin (other than liming materials) added to soils to supply one or more elements essential to plant growth; any material or mixture that supplies plant nutrient elements. Fertilizer analysis Percent composition of a fertilizer determined in a laboratory and expressed as total N, available phosphoric acid (P 2 O 5 ), and water-soluble potash (K 2 O). Fertilizer grade Minimum guarantee of available plant nutrient expressed in terms of total N, available phosphate or phosphorus, and soluble potash or potassium. The numerals used to designate N, P 2 O 5, and K 2 O must coincide with the guaranteed analysis statement. Only one set of numerals may be used in a grade designation (a set of three numbers in sequence that express percents of total nitrogen, available phosphate and soluble potash). A grade contains 5% N, 10% P 2 O 5, and 15% K 2 O. A missing nutrient is represented by a zero. For example, designates urea; is for triple superphosphate, is for potassium chloride (muriate), and is for diammonium phosphate. The analysis is usually designated as N-P 2 O 5 -K 2 O, but it may be N-P-K where permitted or required under state law.
290 Fertilizers 259 Fertilizer ratio Relative proportion of primary nutrients in a fertilizer grade divided by the highest common denominator for the grade, e.g., grades and have 5:3:2 ratios; the ratio of two or more nutrient percentages to another, e.g., grade has a 1:2:3 ratio and has a 0:1:2 ratio. Fertilizer requirement The quantity of a certain plant nutrient needed to increase growth to a designated level in addition to the amount supplied by soil. Filler Substance added to fertilizer to provide bulk, prevent caking, or serve a purpose other than providing essential plant nutrients. Fluid fertilizer A fluid in which essentially all the plant nutrient elements are in solution; a fertilizer wholly or partially in solution that can be handled as a liquid, including clear liquids and liquids containing solids in suspension. Foliar fertilization Application of a dilute solution of fertilizer nutrients to plant foliage to supplement nutrients absorbed by plant roots. See nitrogen solutions. Formula Designation of quantities of various ingredients combined to make a fertilizer. Grade Guaranteed analysis of a fertilizer containing one or more primary plant nutrient elements. Grades are stated as guaranteed percentages of total nitrogen (N), available phosphate (P 2 O 5 ), and soluble potash (K 2 O) in that order. For example, a grade contains 10% total nitrogen (N), 10% available phosphate (P 2 O 5 ), and 10% soluble potash (K 2 O). See analysis. Granular fertilizer Particular form of fertilizer. Particles are sized between upper and lower limits or between two screen sizes, usually within the range of 1 to 4 mm and often more closely sized. The desired size may be obtained by agglomerating smaller particles, crushing and screening larger particles, controlling size by crystallization processes, or prilling. Guano Decomposed dried excrement of birds and bats. Most guano came from islands off the coast of Peru and was derived from the excrement of sea fowl. Guano is high in N and PO 4, and was once a major fertilizer in the U.S. Gypsum (CaSO 4 2H 2 O) Common name for calcium sulfate, a mineral used in fertilizers as a source of Ca and S. Gypsum also is used widely in reclaiming alkali soils in the western U.S.; also known as landplaster. Pure form contains approximately 18.6% S. Hygroscopic Material that tends to absorb moisture from the atmosphere. Many materials used for fertilizer are hygroscopic and may require special treatment to prevent caking. Injected fertilizer Placement of fluid fertilizer or anhydrous ammonia into the soil via pressure or nonpressure systems. Inorganic fertilizer Fertilizer material in which carbon is not an essential component of its basic chemical structure. Urea is often considered an inorganic fertilizer because of its rapid hydrolysis to form ammonium ions in soil. Landplaster See gypsum. Lime Calcium oxide (CaO); in agricultural usage, lime denotes any liming material. See liming materials. Liming materials Lime and liming materials in common agricultural usage designate any material containing Ca, Mg, or both that can neutralize soil acidity. Common sources of liming materials are limestone (calcitic and dolomitic), marl, and oyster shells. The most common materials are ground calcitic limestone and ground dolomitic limestone, both simply referred to as ground agricultural limestone. Liquid fertilizer A fluid in which the plant nutrients are in a true solution. Magnesium carbonate (MgCO 3 ) Principal component of dolomitic limestone; CaCO 3 is the other. Magnesium oxide (MgO) Active ingredient of certain liming materials that supply Mg and Ca to the soil. Magnesium sulfate (MgSO 4 NH 2 O) Soluble salt used as a source of Mg; common forms are Epsom salts and the kieserite (9 to 18% Mg). See liming materials and dolomite.
291 260 Agronomic Handbook: Management of Crops, Soils, and Their Fertility Manganese sulfate (MnSO 4 H 2 O) Solid compound used as a source of Mn for plants; contains 26 to 28% Mn. Micronutrient Seven nutrient elements required in very small quantities: B, Cl, Cu, Fe, Mn, Mo, and Zn, in addition to the primary nutrients that are essential for the normal growth of plants; may need to be added to growth media. Mixed fertilizer Two or more fertilizer materials blended or granulated together into individual mixes. The term includes dry mix powders, granulated mixes, clear liquids, suspensions, and slurry mixtures. Monoammonium phosphate See ammonium phosphate. Muriate of potash (KCl) Principal source of fertilizer K; chemical name is potassium chloride; usually sold on the basis of a material containing 95 to 99% KCl with a K 2 O equivalent of 60 to 62%. Nitrate of soda (NaNO 3 ) Fertilizer material containing approximately 16% N; correct chemical name is sodium nitrate; principal sources were natural deposits in Chile; also produced synthetically. Nitric phosphate Phosphate fertilizer made by reacting HNO 3 with phosphate rock. Usually another acid such as sulfuric or phosphoric acid is added. Nitrification A process by which bacteria form nitrates from ammonium (NH 4 ) nitrogen. Nitrogen solutions Water solutions of ammonia (NH 3 ), ammonium nitrate (NH 4 NO 3 ), and sometimes urea [CO(NH 2 ) 2 ] and other soluble nitrogen compounds used in ammoniating superphosphate, the manufacture of complete fertilizer, and as a source of N for direct application to soil. These pressure and nonpressure solutions vary in composition and N content. Normal superphosphate Compound manufactured by mixing H 2 SO 4 and finely ground phosphate rock to produce a material composed mainly of monocalcium phosphate (CaHPO 4 ) and gypsum. Small amounts of unreacted rock and H 3 PO 4 may also be present. Normal superphosphate has a P 2 O 5 equivalent of 18 to 20%. Organic fertilizer A material containing carbon and one or more plant nutrients in addition to hydrogen and/or oxygen. Urea is often considered an inorganic fertilizer because of its rapid hydrolysis to form ammonium ions in soil. Although some organic fertilizers are manufactured synthetically, the term generally applies to products derived from plant or animal materials, such as manure, sewage sludge, castor pomace, and process tankage. ph Potential hydrogen; expresses a measurement of hydrogen ion (H + ) activity or concentration in a solution. The ph scale from 1 to 14 denotes the relative intensity of acidity or alkalinity. A neutral material has a ph of 7.0. Values below 7.0 denote progressively more intense acid conditions, and those above 7.0 more intense alkaline conditions. Phosphoric acid (H 3 PO 4 ) Inorganic acid used to manufacture concentrated superphosphate and ammonium phosphate; sometimes directly applied; produced from phosphate rock and H 2 SO 4; ; three forms are filter grade unconcentrated acid, 30 to 32% P 2 O 5 ; merchant grade concentrated acid, 54% P 2 O 5 ; and superphosphoric concentrated acid, 65 to 72% P 2 O 5. Phosphoric anhydride See available phosphate. Phosphoric oxide See available phosphate. Phosphorus pentoxide See available phosphate. Plant nutrient element Also called plant food or plant food element; material essential for plant growth. Pop-up fertilizer Fertilizer placed in small amounts in direct contact with seeds. Potash Potassium oxide (K 2 O) equivalent; the K 2 O form is never found in fertilizer, but historically has been used to express K content. Potassium chloride (KCl) See muriate of potash. Potassium nitrate (KNO 3 ) Solid material containing approximately 13% N and 44% K 2 O. Potassium sulfate (K 2 SO 4 ) Solid material with a K 2 O equivalent of 48 to 53%; also called sulfate of potash.
292 Fertilizers 261 Primary nutrient element Nitrogen, phosphorus or phosphate, and potassium or potash; called primary or major elements because of the relatively large quantities needed for healthy plant growth; most common constituents of commercial fertilizers. Ratio The numerical relationship of concentrations of the primary nutrient elements in a fertilizer, e.g., grade has a 1:2:3 ratio of elements. Salt index Index used to compare solubilities of chemical compounds. Most N and K 2 O compounds have high indices; PO 4 compounds have low indices. When applied too close to seeds or on foliage, compounds with high indices can cause salt injuries. Salt index fertilizer Ratio of the decrease in osmotic potential of a solution containing a fertilizer compound or mixture to that produced by the same weight of NaNO Secondary nutrient Nutrient other than the primary elements essential to plant growth; may have to be added to growth medium. Secondary plant nutrients include Ca, Mg, and S; micronutrients include B, Cl, Co, Cu, Fe, Mn, Mo, Na, and Zn. Side-dressed fertilizer Application of fertilizer to the sides of crop rows after plant emergence. Slow-release fertilizer See controlled release fertilizer. Slurry fertilizer Fluid mixture containing dissolved and undissolved plant nutrient materials; requires continuous mechanical agitation to assure uniform content. Sodium nitrate (NaNO 3 ) See nitrate of soda. Sodium molybdate (Na 2 MoO 4 2H 2 O) Common source of Mo micronutrient. Soluble potash K 2 O equivalent of a fertilizer soluble in an aqueous solution of 0.8% ammonium oxalate after boiling in a 1.4% solution of ammonium oxalate. Starter fertilizer Fertilizer applied in relatively small amounts with or near seed for the purpose of accelerating early plant growth. Sulfate of ammonia See ammonium sulfate. Sulfate of potash-magnesia (2MgSO 4 K 2 SO 4 ) Solid material, also called langbeinite, found in salt deposits primarily in New Mexico and in several European countries. The commercial product usually has a K 2 O equivalent of about 21%, and contains 53% MgSO 4 and not more than 2.5% Cl; used in fertilizer as a source of K 2 O and Mg. Suspension Saturated solution in which some plant nutrient elements are suspended (by gelling clay) in a saturated solution. Anhydrous ammonia (NH 3 ) is the major source of agricultural N. It is a high-pressure liquid used in the manufacture of other fertilizers. Suspension fertilizer Fluid fertilizer containing dissolved and undissolved plant nutrients. Undissolved nutrients are kept in suspension with a suspending agent, usually a swelling clay. The suspension must be flowable enough to be mixed, pumped, agitated, and applied to the soil in a homogeneous mixture. The suspension of the undissolved nutrients may be inherent to the materials or produced with a suspending agent that has nonfertilizer properties. Occasional mechanical agitation may be necessary to facilitate uniform suspension of undissolved nutrients. Tankage Animal feed; process tankage is made from leather scrap, wool, and other inert nitrogenous materials by steaming under pressure with or without adding acid; also contains P. Top-dressed fertilizer Surface application of fertilizer to a soil after the crop is established. Triple superphosphate See concentrated superphosphate. Unit A unit of plant nutrient element is 1% of a ton or 20 lb. A ton of a fertilizer contains 6 units of N, 12 units of P 2 O 5, and 12 units of K 2 O. Urea [CO(NH 2 ) 2 ] Solid synthetic organic material containing approximately 45% N; when applied to soil, its N changes first to the ammonium (NH 4 ) form, then to the nitrate (NO 3 ) form. White vitriol or zinc sulfate (ZnSO 4 7H 2 O) Solid material used as a source of Zn for plants; contains 36% Zn.
293 262 Agronomic Handbook: Management of Crops, Soils, and Their Fertility TABLE 9.4 Molecular Weights of Essential Nutrient Elements, Compounds, and Ions Essential Element Form Molecular Weight (g/mol) Nitrogen N NH NO Phosphorus P P 2 O Potassium K 39.1 K 2 O 94.4 KCl 74.5 Calcium Ca CaO CaSO Magnesium Mg MgO Sulfur S SO SO Boron B B 2 O Na 2 B 4 O 7 5H 2 O Copper Cu CuSO Iron Fe FeSO Manganese Mn MnSO Zinc Zn ZnO 81.4 ZnSO 4 H 2 O 179.5
294 Fertilizers MAJOR ELEMENTS OF FERTILIZERS TABLE 9.5 Major Element-Containing Fertilizer Materials, Their Formulations, Forms, and Percent Contents Nitrogen (N) Source Formula Form % N Inorganic Ammonium nitrate NH 4 NO 3 Solid 34 Ammonium sulfate (NH 4 ) 2 SO 4 Solid 21 Ammonium thiosulfate (NH 4 ) 2 SO 3 Liquid 12 Anhydrous ammonia NH 3 Gas 82 Aqua ammonia NH 4 OH Liquid 2 25 Nitrogen solutions Varies Liquid Monoammonium phosphate NH 4 H 2 PO 4 Solid 11 Diammonium phosphate (NH 4 ) 2 HPO 4 Solid 1 18 Calcium cyanamide CaCN 2 Solid 21 Calcium nitrate Ca(NO 3 ) 2 Solid 16 Sodium nitrate NaNO 3 Solid 16 Potassium nitrate KNO 3 Solid 13 Synthetic organic Urea CO(NH 2 ) 2 Solid Sulfur-coated urea CO(NH 2 ) 2 -S Solid 40 Urea-formaldehyde CO(NH 2 ) 2 -CH 2 O Solid 38 Natural organic Cotton seed meal Solid Milorganite Solid 12 Animal manure Solid Sewage sludge Solid Chicken litter Solid Phosphorus (P) Source Formula % Available P 2 O 5 Citrate Soluble Water Soluble Superphosphate, 20% (0 20 0) Ca(H 2 PO 4 ) Concentrated superphosphate (0 45 0) Ca(H 2 PO 4 ) Monoammonium phosphate NH 4 H 2 PO Diammonium phosphate (NH 4 ) 2 HPO Ammonium polyphosphate (NH 4 ) 3 HP 2 O 7 H 2 O Phosphoric acid H 3 PO Superphosphoric acid, polyphosphate H 3 PO 4 + H 4 P 2 O Rock phosphate fluor- and chloroapatites 3Ca 3 (PO 4 ) 2 CaF Basic slag 5CaO P 2 O 5 SiO Bone meal 22 28
295 264 Agronomic Handbook: Management of Crops, Soils, and Their Fertility Potassium (K) Compound Formula % K Potassium chloride (muriate of potash) KCl Potassium sulfate K 2 SO Potassium magnesium sulfate (SUL-PO-MAG) K 2 SO 4 MgSO 4 22 Potassium nitrate KNO 3 44 Potassium hydroxide KOH 83 Calcium Liming and Fertilizer Sources a Carrier Formula % Ca Liming materials Blast furnace slag CaSiO 3 29 Calcitic limestone CaCO 3 32 Dolomitic limestone CaCO 3 + MgCO 3 22 Hydrate lime Ca(OH) 2 46 Precipitated lime CaO 60 Fertilizers Calcium nitrate Ca(NO 3 ) 2 19 Superphosphate, normal Ca(H 2 PO 4 ) 2 + CaSO 4 2H 2 O 20 Superphosphate, triple Ca(H 2 PO 4 ) 2 14 Others Gypsum CaSO 4 2H 2 O 23 Gypsum (by-product) CaSO 4 2H 2 O 17 b Gypsum (impure) CaSO 4 2H 2 O 15 b a For acid soils, it is generally assumed that maintaining soil ph within the optimum range (5.8 to 7.5) by frequent liming will provide sufficient Ca to meet crop requirements. b Ca content varies. Magnesium (Mg) Source Formula Water Solubility % Mg Dolomitic limstone CaCO 3 + MgCO 3 Insoluble 6 12 Kieserite (magnesium sulfate) MgSO 4 H 2 O Slightly 18 Epsom salt (magnesium sulfate) MgSO 4 2H 2 O Soluble 10 Potassium magnesium sulfate K 2 SO 4 MgSO 4 Soluble 11 Pro/Mesium 3MgOSiO 2 2H 2 O Insoluble 22 Magnesium oxide MgO Slightly Note: For acid soils and for Ca, it is generally assumed that maintaining soil ph within the optimum range (5.8 to 7.5) by frequent liming using dolomitic (Mg-bearing) limestone or other high-content Mg liming materials will provide sufficient Mg to meet crop requirements.
296 Fertilizers 265 Sulfur (S) Source Formula % S Sulfur S Ammonium sulfate (NH 4 ) 2 SO 4 24 Gypsum CaSO 4 2H 2 O 19 Magnesium sulfate (Epsom salt) MgSO 4 7H 2 O 13 Potassium sulfate K 2 SO 4 18 Potassium magnesium sulfate (SUL-PO-MAG) K 2 SO 4 + MgSO 4 23 Superphosphate (0-20-0) CaSO 4 + calcium phosphate 12 Ammonium thiosulfate (NH 4 ) 2 S 2 O 3 26 Sulfur-coated urea CO(NH 2 ) 2 -S 10 Nitrogen-S solution CO(NH 2 ) 2 NH 4 NO 3 (NH 4 ) 2 SO 4 2 5
297 266 Agronomic Handbook: Management of Crops, Soils, and Their Fertility TABLE 9.6 Common Fertilizers and Their Characteristics Name Fertilizer Ratio Physical Properties Comments Fertilizers used primarily as sources of nitrogen (N) Anhydrous ammonia Compressed gas; high affinity for water; pungent odor; corrosive Must be placed at 46 in. depth; hazardous; safety precautions and high pressure required Urea a Granular Applied prior to or after seeding; much less corrosive than other nitrogen fertilizers; avoid mixing with ammonium nitrate as attraction for moisture causes mixture to turn to slush; more subject to volatilization losses than ammonium nitrate when not incorporated in soil; volatilization losses enhanced when urea is broadcast without incorporation under warm and windy conditions on alkaline, calcareous, or drying soils Nitrogen solution (UAN) Solution; 50% of nitrogen is in urea form and 50% is in ammonium nitrate form; contains 9.79 lb N/L or 357 lb N/Imp gal Can be applied prior to or after seeding; may be injurious to crops when applied after emergence; can be applied with certain pesticides; urea portion is subject to volatilization losses when nitrogen solution is surface-applied and not incorporated; losses enhanced when solution is surface-applied without incorporation under warm and windy conditions on alkaline, calcareous, or dry soil. Ammonium nitrate a Granular; prilled Larger amount than urea can be applied with seed of cereal crops; can be applied prior to or after seeding; avoid mixing with urea as attraction for moisture causes mixture to turn to slush; less subject to volatilization losses than urea when broadcast without incorporation. Monoammonium phosphate (MAP) Dammonium phosphate (DAP) Ammonium polyphosphate Fertilizers used primarily as sources of phosphorus (P) Solid, granular; fairly resistant to breakdown during handling ; ; Most commonly used high analysis dry phosphorus fertilizers Solid, granular Phosphorus availability to plants similar to monoammonium phosphate; more toxic than MAP when placed with seed Liquid; contains 0.31 Phosphorus availability to plants similar to MAP lb N and 1.06 lb P 2 O 5 /L or 1/42 lb N and 4.83 lb P 2 O 5 /Imp gal Phosphoric acid Liquid; contains 1.87 lb P 2 O 5 /L or 8.50 lb P 2 O 5 /Imp gal Triple superphosphate Burns skin on contact; requires specialized delivery systems that can withstand corrosiveness of product; primarily used for dual band applications with N fertilizers Solid, granular Phosphorus availability less than for phosphorus fertilizer containing ammonium
298 Fertilizers 267 TABLE 9.6 (CONTINUED) Common Fertilizers and Their Characteristics Name Fertilizer Ratio Physical Properties Comments Potassium chloride (potash) Fertilizers used primarily as sources of potassium (K) Crystalline; hydroscopic; soluble ; Most commonly used potassium fertilizer in Manitoba; can be mixed with other fertilizers; contains chloride which is a nutrient and may help reduce incidence of some plant diseases Ammonium sulfate ; ; Ammonium thiosulfate Fertilizers used primarily as sources of sulfur (S) Crystalline; granular; granular Liquid; contains 0.35 lb N and 0.76 lb/s/l or 1.60 lb N and 3.46 lb S/Imp gal Contains 0.43 lb N and 0.57 lb S/L or 1.96 lb N and 2.62 lb S/Imp gal Elemental sulfur Can be blended with most dry fertilizers except ammonium nitrate Applied prior to seeding; contains S in the readily available sulfate form; corrosive; highly acidifying; should not be used continuously or at high rates on acidic soils Noncorrosive; contains S in readily available form Must be oxidized to sulfate before plants can use it; apply one year before crop use Ammonium nitrate; monoammonium phosphate a Urea; monoammonium phosphate a Monoammonium phosphate; ammonium sulfate ; ; , etc ; Combination or blended fertilizers Solid; granular; a Suitable for nitrogen and phosphorus-deficient soils; blend of and phosphorus availability same as MAP Solid; granular; blend of and ; fairly stable during storage and handling Solid; granular; sources mixed into a common granule Suitable for nitrogen- and phosphorus-deficient soils; nitrogen component can cause germination to seed at above-recommended rates Suitable for sulfur-deficient soils; phosphorus availability same as MAP; suitable size for blending a Warning: Contact between urea (46-0-0) or urea blends and ammonium nitrate (34-0-0) or ammonium nitrate blends will cause the fertilizer to absorb moisture and turn into slush. Thoroughly clean all equipment and storage bins before switching from one product to another. Some micronutrient fertilizer may have similar compatibility problems with dry and liquid fertilizers, so consult manufacturer s instructions. Note: When blending fertilizer, it is important to use fertilizer sources with evenly matched particle sizes. Using inconsistently sized sources will result in segregation of different fertilizers and may result in lost productivity and crop damage. Source: Soil Fertility Guide, 1999, Manitoba Agriculture. (
299 268 Agronomic Handbook: Management of Crops, Soils, and Their Fertility TABLE 9.7 Properties of Major Element Fertilizer Materials Material N (%) P 2 O 5 (%) K 2 O (%) Soil Reaction a lb Lime/100 lb N b Salt Index c Ammonium nitrate A Monoammonium phosphate A Diammonium phosphate A Ammonium sulfate (23.7% S) A Ammonium polyphosphate A 180 Urea A Liquid nitrogen A 180 Calcium nitrate N 0 65 Potassium nitrate N 0 74 Muriate of potash N Potassium sulfate (18% S) N 0 46 Sodium nitrate B Magnesium sulfate (10% Mg; 13% S) N 0 44 Sulfate of potash-magnesia (11% Mg; N % S) Nitrate of soda-potash N 0 19 Normal superphosphate (12% S) N 0 10 Triple superphosphate N 0 10 Gypsum (19% S; 22% Ca) N 0 8 a A = acid; B = basic; N = neutral. b Lb lime required to neutralize acid from 100 lb of nitrogen. c Salt index for equal weights of materials, NaNO 3 = 100. TABLE 9.8 Equivalent Weights of Common Fertilizers Supply Plant Nutrient Elements in Ionic Forms Chemical Name Formula Ions Supplied Equivalent Weight Ammonium nitrate HN 4 NO 4 NH + 4 and NO Monoammonium phosphate NH 4 H 2 PO 4 NH + 4 and H 2 PO Diammonium phosphate ( ) (NH 4 ) 2 HPO 4 NH + 4 and HPO Ammonium sulfate (NH 4 ) 2 SO 4 NH + 4 and SO Calcium nitrate Ca(NO 3 ) 2 4H 2 O Ca 2+ and NO Sodium nitrate NaNO 3 Na + and NO Phosphoric acid H 3 PO 4 H + and H 2 PO (usually 75, 80%) Potassium chloride (muriate of potash) KCl K + and Cl - 75 Potassium nitrate (saltpeter) KNO 3 K + and NO Potassium sulfate K 2 SO 4 K + and SO Magnesium sulfate (Epsom salt) MgSO 4 7H 2 O Mg 2+ and SO Sulfuric acid H 2 SO 4 H + and SO (usually 85, 0%) Nitric acid HNO 3 H + and NO (usually 85, 90%)
300 Fertilizers 269 TABLE 9.9 Cold Water Solubility of Fertilizers Fertilizer Solubility (lb/100 gal) Primary Materials Ammonium nitrate 984 Ammonium sulfate 592 Calcium nitrate 851 Diammonium phosphate 358 Magnesium sulfate 592 Monoammonium phosphate 192 Potassium nitrate 108 Sodium nitrate 608 Supersphosphate, ordinary 17 Supersphosphate, triple 33 Urea 651 Micronutrients Ammonium molybdate Decomposes Borax 8 Calcium chloride 500 Coppic oxide Insoluble Copper sulfate 183 Ferrous sulfate 242 Manganese sulfate 876 Sodium molybdate 467 Solubor 68 F Zinc sulfate 625 Source: Knott s Handbook for Vegetable Growers, 4th ed., 1997, John Wiley & Sons, New York. TABLE 9.10 Equivalent Acidities of Major Commercial Fertilizers Fertilizer Equivalent Acidity per 1,000 kg per 2,000 lb Ammonium nitrate, NH 4 NO ,188 Ammonium phosphate, NH 4 H 2 PO ,450 Ammonium sulfate, (NH 4 ) 2 SO 4 1,099 2,200 Anhydrous ammonia, NH Nitrate of soda, NaNO Urea, CO(NH 2 ) ,500
301 270 Agronomic Handbook: Management of Crops, Soils, and Their Fertility TABLE 9.11 Parts per Million and Millequivalents per Liter Supplied When 1 lb or 1 kg of Material is Dissolved in 1,000 Gallons or 10 m 3 of Water Compound Analysis a lb/1,000 gal ppm kg/10 m 3 lb/1,000 gal meq/l b kg/10 m 3 NH 4 NO N NH NO NH 4 Cl N NH C Cl (NH 4 ) 2 SO N NH S SO Ca(NO 3 ) 2 4H 2 O N NO Ca Ca NaNO N NO Na Na H 3 PO c 80 P H 2 PO KNO N K K 2 O NO KCl K 2 O K Cl Cl (NH 4 ) 2 HPO N NH P 2 O HPO K 2 SO K 2 O K S SO NH 4 H 2 PO N NH P 2 O H 2 PO MgSO 4-24 Mg Mg S SO Mg(NO 3 ) 2 6H 2 O N Mg Mg NO HNO 3 (pure) N NO K 2 HPO P 2 O K K 2 O HPO KH 2 PO P 2 O K K 2 O H 2 PO a Analyses in percentage N, P 2 O 5, and K 2 O. b Millequivalents calculated on the basis of equivalent weight. c Percentage of H 3 PO 4 in liquid.
302 Fertilizers 271 TABLE 9.12 Conversion Factors for Nutrient Concentrations in Fertilizers From Multiply by to get/from Multiply by to get NO N NO 3 NH N NH 3 NH N NH 4 CO(NH 2 ) 2 -urea N CO(NH 2 ) 2 -urea (NH 4 ) 2 SO N (NH 4 ) 2 SO 4 NH 4 NO N NH 4 NO 3 P 2 O P P 2 O 5 Ca 3 (PO 4 ) P 2 O Ca 3 (PO 4 ) 2 K 2 O K K 2 O KCl K 2 O KCl KCl K KCl ZnSO 4 H 2 O Zn ZnSO 4 H 2 O ZnSO 4 7H 2 O Zn ZnSO 4 7H 2 O SO S SO 2 SO S SO 4 MgSO S MgSO 4 MgSO 4 H 2 O S MgSO 4 H 2 O MgSO 4 H 2 O S MgSO 4 7H 2 O (NH 4 ) 2 SO S (NH 4 ) 2 SO 4 SiO Si SiO 2 CaSiO Si CaSiO 3 MgSiO Si MgSiO 3 MgO Mg MgO MgO MgSO MgO MgO MgSO 4 H 2 O MgO MgO MgSO 4 7H 2 O MgO MgO MgCO MgO CaO Ca CaO CaCO CaO CaCO 3 CaO Ca CaO CaCl Ca CaCl 2 CaSO Ca CaSO 4 Ca 4 (PO 4 ) Ca Ca 4 (PO 4 ) 2 FeSO Fe FeSO 4 MnSO Mn MnSO 4 MnCl Mn MnCl MnCO Mn MnCO 3 MnO Mn MnO CuSO 4 H 2 O Cu CuSO 4 H 2 O CuSO 4 5H 2 O Cu CuSO 4 5H 2 O Na 2 B 4 O 7 5H 2 O B Na 2 B 4 O 7 5H 2 O Na 2 B 4 O 7 7H 2 O B Na 2 B 4 O 7 7H 2 O Source: Rice: Nutrient Disorders and Nutrient Management, 2000, Potash & Phosphate Institute, Norcross, GA.
303 272 Agronomic Handbook: Management of Crops, Soils, and Their Fertility TABLE 9.13 Physical Characteristics of Liquid Fertilizers Grade Weight gal/lb gal/ton (28%) (aqua ammonia) % phosphoric acid TABLE 9.14 Granular Fertilizer Properties Fertilizer Grade Salt Index CaCO 3 Equivalent Bulk (lb/ft 3 ) Density (kg/l) Urea Ammonium nitrate Calcium ammonium nitrate Ammonium sulfate Calcium nitrate B Potassium nitrate B Sodium nitrate B Superphosphate Neutral Triple superphosphate Neutral Monoammonium phosphate Diammonium phosphate Muriate of potash (red) Neutral Muriate of potash (white) Neutral Potassium sulfate Neutral Sulfate of potash-magnesium Neutral Notes: Grade: total nitrogen (N), phosphate (P 2 O 5 ), and potash (K 2 O). Salt Index: comparison of relative solubilities of fertilizer to sodium nitrate (100). CaCO 3 Equivalent: kg lime required to neutralize acidity in 100 kg fertilizer. B: Alkaline (acid neutralizing) material. Bulk Density: lb/ft 3 or kg/l important when fertilizer is metered by volume rather than weight.
304 Fertilizers PHOSPHORUS FERTILIZERS 3 Some important phosphate fertilizers and the reagents in which their solubilities are normally measured are: Single (or normal) superphosphate made by reacting phosphate rock with sulfuric acid. Water-soluble monocalcium phosphate is the active ingredient. The accompanying calcium sulfate (gypsum) co-product is a useful source of S. Solubility is determined by the proportion of neutral ammonium citrate that is soluble in water. Triple superphosphate made by reacting phosphate rock with phosphoric acid. Water-soluble monocalcium phosphate is the principal ingredient. Solubility is similar to that of single superphosphate. Monoammonium and diammonium phosphates made by reacting phosphoric acid with ammonia to produce water-soluble products; solubility is similar to that of superphosphates. Nitrophosphates range of products produced by reacting phosphate rock with nitric acid to produce a mixture of water-soluble monocalcium phosphate and calcium nitrate. The latter takes up water and must be removed. The the range of water solubilities depends on the amount of monocalcium phosphate converted to dicalcium phosphate. Finely ground phosphate rock cam be used only on acidic soils in which acidity slowly releases plant-available P. These finely ground materials are difficult to handle. In the humid tropics they have proven beneficial on plantation crops grown on acid soils. The more suitable phosphate rocks are classified as reactive. Their chemical composition allows rapid dissolution in the soil. Compound fertilizers monoammonium and diammonium phosphates are examples of fertilizers containing two plant nutrient elements. Fertilizers containing two or more nutrient elements contained in a single granule are called compound fertilizers. Manufacturers often produce a range of such fertilizers containing various proportions of N, P, and K. Blended fertilizers single or multinutrient element fertilizers that have granules or crystals about the same size and weight that can be blended to yield an almost infinite range of ratios of N, P, and K. The physical characteristics of the individual components are important to prevent separation during transport, handling, and spreading AVAILABILITY OF DIFFERENT FORMS OF SOIL PHOSPHORUS It is helpful to visualize the P cycle of the plant soil system as a series of pools as shown in Figure 9.2. Water-soluble phosphorus added as fertilizers or manures goes first into the soil solution. From there, P is taken up by the plant roots or remains readily available or less readily available as a result of the reactions described in the figure. Readily available P can be estimated by different soil analysis methods, but no single universal method exists for determining available P. Although the quantity of P extracted will vary with method, soils can be classified descriptively (e.g., deficient, sufficient, etc.) by using the analytical data obtained. The soil analysis methods most widely used gained acceptance because they adequately distinguished soils on the basis of the responsiveness of crops to applications of phosphate fertilizer. Removed in harvested produce Water-soluble nutrients in fertilizers and manures Loss in drainage Crop Uptake Soil Readily Less readily Very slowly solution available pool available pool available pool FIGURE 9.2 The phosphorus cycle in the plant soil system. (Source: Soil and Plant Phosphate, 2000, International Fertilizer Industry Association, Paris.)
305 274 Agronomic Handbook: Management of Crops, Soils, and Their Fertility No routine soil analysis method is available to determine less readily available P. We know that the rates and amounts of P released from the pool can vary greatly. The results of P fractionation studies support an important feature shown in Figure 9.2, namely the reversible transfer of P between amounts in the soil solution and amounts in the readily and less available P pools. This seems to apply to many soils, although it may not apply to soils that have considerable capacities to fix P. Soil P reserves are not held in any particular soil P fraction EFFECT OF SOIL ORGANIC MATTER ON PHOSPHORUS AVAILABILITY Soil organic matter (humus) plays an important role in P crop availability, which is not related to the mineralization of organic P. Humus apparently provides sites with low bonding energies for P, including P applied in fertilizers. Organic P in soils can be associated either with soil organic matter (humus) or P added recently as organic debris coming from plants or animals. Before this organic P can be recycled and used by plants, it must be mineralized by soil microbes and released into the soil solution as inorganic phosphate ions. The ions are then either taken up by plant roots or they enter into the same reactions with soil particles as added fertilizer phosphate ions and are distributed among the varous soil pools as shown in Figure PHOSPHORUS FOR WINTER WHEAT Findings of a multiyear study of a continuous wheat system in the Great Plains indicates that a single P fertilization can influence grain yields for several years. That means the cost of P fertilizer applications can be amortized over several years. The results show that a balanced N and P fertilization program is needed to optimize yields and economic returns and reduce the potential for nitrate-n contamination of ground water FERTILIZER SOURCES MICRONUTRIENTS TABLE 9.15 Micronutrient-Containing Fertilizer Materials Fertilizer Material Formula Water Solubility Element Content (%) Boron (B) Boric acid H 3 BO 3 Soluble 17 Na 2 B 4 O 7 5H 2 O Soluble 20 Na 2 B 4 O 7 10H 2 O Soluble 11 Ca 2 B 6 O 11 5H 2 O Slightly soluble 10 Fertilizer Borate, 48 Na 2 B 4 O 7 10H 2 O Soluble Fertilizer Borate, granular Na 2 B 4 O 7 10H 2 O Soluble 14 Foliarel Na 2 B 8 O 13 4H 2 O Soluble 21 Solubor Na 2 B 4 O 7 4H 2 O + Na 2 B 10 O 16 10H 2 O Soluble 20 Borax Na 2 B 4 O 7 10H 2 O Soluble 11 Chloride (Cl) Calcium chloride CaCl 2 Soluble 50 Potassium chloride KCl Soluble 48 Copper (Cu) a Copper sulfate (monohydrate) CuSO 4 H 2 O Soluble 35 Copper sulfate (pentahydrate) CuSO 4 5H 2 O Soluble 25 Cupric oxide CuO Insoluble 75 Cuprous oxide Cu 2 O Insoluble 89
306 Fertilizers 275 TABLE 9.15 (CONTINUED) Micronutrient-Containing Fertilizer Materials Fertilizer Material Formula Water Solubility Element Content (%) Cupric ammonium phosphate Cu(NH 4 )PO 4 H 2 O Soluble 32 Basic copper sulfates CuSO 4 3Cu(OH) 2 (general formula) Soluble Cupric chloride CuCl 2 Soluble 17 Copper chelates Na 2 CuEDTA Soluble 13 NaCuHEDTA Soluble 9 Copper polyflavonoids Organically bound Cu Partially soluble 5 7 Iron (Fe) b Ferrous sulfate FeSO 4 7H 2 O Soluble 20 Ferric sulfate Fe(SO 4 ) 3 4H 2 O Soluble 23 Ferrous ammonium phosphate Fe(NH 4 )PO 4 H 2 O Soluble 29 Ferrous ammonium sulfate (NH 4 ) 2 SO 4 FeSO 4 6H 2 O Soluble 14 Iron chelates NaFeEDTA Soluble 5 11 NaFeHFDTA Soluble 5 9 NaFeEDDHA Soluble 6 NaFeDTPA Soluble 10 FeHEDTA Soluble 5 9 FeEDDHA Soluble 6 Iron polyflavonoids Organically bound Fe 9 10 Manganese (Mn) c Manganese sulfate MnSO 4 4H 2 O Soluble 24 Manganese oxide MnO Insoluble 53 Manganese oxysulfate Variable Manganese chelate MnEDTA Soluble 5 12 Molybdenum (Mo) d Sodium molybdate Na 2 MoO 4 2H 2 O Soluble 39 Ammonium molybdate (NH 4 ) 6 Mo 7 O 24 Soluble 53 Molybdenum trioxide MoO 3 Soluble 66 Molybdenum dioxide MoO 2 Soluble 75 Zinc (Zn) e Zinc sulfate ZnSO 4 2H 2 O Soluble 36 ZnSO 4 -NH 3 complex Soluble Zinc oxide ZnO Insoluble Zinc oxysulfate Variable Zinc chelate ZnEDTA Soluble 6 14 Zinc oxide ZnO Zinc chelates Na 2 ZnEDTA 14 NaZnTA 13 NaZnHEDTA 9 Zinc Polyflavonoids Organically bound Zn 10 a Copper can be applied to soil or foliage; some Cu sources are shown in this table. b Iron sources can be applied to soil or foliage. Foliar application with a solution of ferrous sulfate (FeSO 4 ) or one of the chelated (EDTA or EDDHA) forms of Fe is most efficient. c Manganese is best applied as a foliar spray to correct a deficiency; soil application can be inefficient due to inactivation of applied Mn. Row application of a P fertilizer increases Mn availability and uptake. d Molybdenum is best supplied by seed treatment. e Zinc can be applied as both soil and foliar applications.
307 276 Agronomic Handbook: Management of Crops, Soils, and Their Fertility TABLE 9.16 Synthetic Micronutrient Chelates Micronutrient Content (%) Chelating Agent Copper Iron Manganese Zinc EDTA HEEDTA NTA 8 13 DTPA 10 EDDHA 6 Source: Western Fertilizer Handbook, Horticulture Edition, 1990, Interstate Publishers, Danville, IL. With permission from California Plant Health Association. TABLE 9.17 Typical Application Rates of Micronutrient Fertilizers Forms and Application Rates Boron Borax (10.6% B) is the most common fertilizer. Soil application: 0.5 to 2.5 lb B/acre; 0.5 to 1 lb for most crops; higher rates for heavy feeders, such as alfalfa, beets, turnips. Foliar spray: perennials 0.2 lb B/100 gal water 1 to 3 wk after petal fall. Annuals several sprayings, e.g., 0.1 lb B/100 gal water weekly for 8 wk. Copper Copper sulfate (25 to 35% Cu) and copper oxide (75% Cu) are most common fertilizers. Soil application: 2 to 6 lb Cu/acre; double that amount or more for muck soils. Foliar spray: 0.8 lb Cu/100 gal water. Iron Ferrous sulfate (19% Fe) is the usual inorganic fertilizer; NaFeEDDH (6% Fe) and NaFeEDTA (5 to 14% Fe) are the best chelated forms. Foliar spray: 3% solution of ferrous sulfate, possibly including a wetting agent, at a rate of 120 to 180 gal/acre starting when deficiency symptoms begin and continued at 2-wk intervals until they disappear. Manganese Manganous sulfate (26 to 28% Mn) and MnEDTA (12% Mn) are common. Soil application: 5 to 10 lb inorganic Mn/acre, banded; broadcast application is much less effective. Foliar spray: 0.5 to 1 lb Mn/100 gal water (inorganic or chelated) repeated 2 or 3 times. Molybdenum Ammonium or sodium molybdate are the usual fertilizers. Seed treatment is the most common remedy, other than liming: 0.25 to 0.5 lb Mo/acre. Soil application: 0.02 to 0.4 lb Mo/acre. Zinc Zinc sulfate (23 to 35% Zn) is a typical fertilizer. Soil application is the usual treatment: 2 to 20 lb Zn/acre. Foliar spray: to 2.2 lb Zn/100 gal water, sprayed regularly until deficiency symptoms disappear.
308 Fertilizers 277 TABLE 9.18 Relative Sensitivities of Selected Crops to Micronutrient Deficiencies Micronutrient Crop Boron Copper Iron Manganese Zinc Alfalfa High High Medium Medium Low Barley Low Medium High Medium Medium Clover Medium Medium a Medium Medium Corn Low Medium Medium High Oat Low High Medium High Low Rye Low Low Low Low Sorghum Low Medium High High High Soybean Low Low High High Medium Sudan grass Low High High High Medium Sugar beet High Medium High Medium Medium Wheat Low High Low High Low a Inadequate data to categorize into low, medium, or high sensitivity groups. TABLE 9.19 Soil Conditions and Crops Most Frequently Affected with Micronutrient Deficiencies Micronutrient Sensitive Crops Soil Conditions for Deficiency Boron Alfalfa, clover, cotton, peanut, sugar beet, cereals Acid sandy soils low in organic matter; overlimed soils; organic soils Copper Corn, small grains (oats), legumes Organic soils; mineral soils high in ph and organic matter Iron Clover, sorghum, soybeans, rice Leached sandy soils low in organic matter; alkaline soils; soils high in P Manganese Alfalfa, small grains (oats), soybeans, sugar beets Leached acid soils; neutral to alkaline soils high in organic matter Zinc Corn, sorghum, legumes, grasses, soybeans Leached acid sandy soils low in organic matter; neutral to alkaline soils; soils high in P TABLE 9.20 Agronomic Crop Species Sensitive to Excessive Levels of Micronutrients Micronutrient Boron Chlorine Copper Iron Manganese Zinc Crop Species Cereals Cereals Cereals, legumes Rice Cereals, legumes Cereals
309 278 Agronomic Handbook: Management of Crops, Soils, and Their Fertility TABLE 9.21 Functions of Micronutrients Micronutrient Boron Copper Iron Manganese Molybdenum Zinc Function Regulates cell division Stimulates flowering and pollen production Increases fertility and improves fruit set Improves sugar concentration in reserve organs (sugar beets) Improves fixation of N in leguminous plants Essential to formation of healthy cell walls Stimulates germination and growth Very important for fertility; deficiency causes sterile ears empty ears or half empty ears Reduces aging Improves resistance to flattening of cereals Stimulates chlorophyll function With magnesium is essential for chlorophyll production Important for energy production and transport Stimulates protein synthesis and respiration Increases photosynthesis Increases resistance to frost (corn) Improves transformation of nitrites to amino acids and proteins Increases sugar content Essential for N fixation in leguminous plants Reduces nitrate (NO 3 ) accumulation Very important for transformation of N to proteins Increases protein content Essential in early stages of growth and fruit development Stimulates production of natural growth hormone (auxinen) Influences protein synthesis
310 Fertilizers 279 TABLE 9.22 Most Common Micronutrient Deficiency Symptoms and Causes Boron (average export: 60 to 300 g/ha) Symptoms Slowing of growth Uncontrolled cell division between xylem and phloem Brown spots that quickly become necrotic Sugarbeet: heart rot and brown heart Leguminous crops: yellowing of youngest leaves Causes Boron content depends on mineral composition of soil Boron is strongly fixed on the clay humus complex The organic compound also fixes B and lowers availability Increasing ph reduces B absorption capacity Boron is easily leached by heavy rainfall Deficiency symptoms occur when soils have high content of organic material, soils have high ph, after excessive liming, and during very dry periods Copper (average export: 25 to 100 g/ha) Symptoms Monocotyls (cereals and corns) are much more sensitive then dicotyls White flag syndrome appearing on tops of youngest leaves is typical of cereals; ripening of cereals is also delayed Corn: nanism, shorter internodes, deformed and partially filled ears Youngest leaves remain connected Causes Deficiency usually primary; certain soil types contain too little Cu, i.e., granite, basalt, and volcanic soils Copper likely to be blocked in lightly acid soils with high organic content (plowed pastures, peaty soils) Blockage in alkaline soils Fresh organic matter makes Cu more available Increasing ph lowers availability. N and/or K excess blocks Cu and reduces availability Iron (average export: 0.5 to 1.0 kg/ha) Symptoms Chlorosis; leaves turn yellowish-green to yellow; nerves remain green Borders of leaves become necrotic in severe deficiency Chlorosis always begins on youngest leaves Causes Soils with high content of active Ca High ph (transformation to nonsoluble form) Excessive liming Too much phosphoric acid in soil Excess of Cu, Zn, or Mn Manganese (average export: 150 to 600 g/ha) Symptoms Diffuse chlorosis between nerves and borders of leaves; symptoms first appear on older leaves continued
311 280 Agronomic Handbook: Management of Crops, Soils, and Their Fertility TABLE 9.22 (CONTINUED) Most Common Micronutrient Deficiency Symptoms and Causes Yellow clouds on older leaves of dicotyls (e.g., sugarbeets) Causes Availability of Mn is strongly linked to acidity of soil (more so than B, Zn, and Cu) Deficiencies of Mn are more frequent when soil is poor in organic matter and ph is high; if soil is light (sandy) and has coarse structure Deficiency also appears on soil with high level of active Ca Excessive liming In soils rich in organic matter, Mn 2+ is transformed to an insoluble organic compound An excess of Cu and/or Zn increases the chance of Mn deficiency Molybdenum (average export: 10 to 20 g/ha) Symptoms Leguminous plants: poor development of nodules on roots, which causes low N fixation and absorption Symptoms resemble those of N deficiency Causes Availability increases with high ph Relatively large amounts of Mo are linked to organic materials Deficiency appears mainly on acid soils, but also on neutral or alkaline soils from which Mo has been leached Zinc (average export: 100 to 300 g/ha) Symptoms Slight symptoms: chlorosis on youngest leaves makes them almost white Leaves stay small and pointed Short internodes (rosetting) Corn: 2 white strips on bottom parts of the oldest leaves and both sides of the mid-ribs; yellow to white color on youngest leaves Squatted, stunted appearance due to poor juvenile growth Causes Raising ph reduces quantity of absorbable Zn Occurs essentially in alkaline soils with high levels of organic matter Antagonism with P Badly structured soils produce poor rooting Cold and humid spring weather 9.7 FERTILIZER PLACEMENT AND RATES FERTILIZER PLACEMENT Placing fertilizer in the proper part of the root zone ranks in importance with applying the correct amounts of plant nutrient elements, according to experts with the Potash and Phosphate Institute. Researchers identified four basic objectives in fertilizer placement: To achieve efficient use of nutrient elements from plant emergence to maturity To prevent or reduce harmful effects to the environment To avoid fertilizer-induced salt injuries to plants To provide convenient and economical operations for custom applicators and their farmer customers
312 Fertilizers 281 This section describes various application procedures according to location in the soil and method of placement. With the exception of foliar fertilization, fertilizers are normally applied to the soil surface or beneath the surface at varying depths. Many of the new techniques involve placement below the soil surface. The descriptions of the different methods of fertilizer placement may help applicators understand the various options available to them as the farmer customers strive for more economical crop production Banding Banding is a general term implying methods that concentrate fertilizers into narrow zones that are kept intact to provide concentrated sources of nutrient elements. Applications may be made prior to, during, or after planting. Banding is particularly effective where soil nutrient element levels are low, where soils tend to readily revert applied nutrient elements into unavailable forms (fixation), where early season stress from cool or wet conditions limits root growth, where compaction limits root development, and where large amounts of surface residue limit soil fertilizer contact. Generally, banding of P, K, and micronutrients results in better utilization of applied nutrient elements during the first cropping season and better N application for reduced tillage systems where first-year responses are essential Surface Strip or Dribble Banding Strip banding or dribbling is a placement form involving application of solid or fluid fertilizers in bands or strips of varying widths on the soil surface or on the surfaces of crop residues. Zones of high nutrient element concentration that improve nutrient use are produced. Typically, the fertilizer material contacts 25 to 30% of the soil surface. If surface strip applications are followed by tillage, the concentration effect is diluted to something between broadcast applications and subsurface banding where the concentrated zones remain intact Deep Banding Deep banding is preplant application of nutrient elements 2 to 6 in. below the soil surface. Some applications may be as deep as 15 in. The applied nutrient elements may be in solid, fluid, or gaseous form. Concentrated zones of nutrient elements are produced streams, sheets, or points, depending on the design of the applicator. In some areas, this fertilization is applied many months before the next crop is seeded, often in conjunction with a tillage operation. In some areas of the southern U.S. coastal plains, deep banding with a shank running immediately ahead and below the planting unit is common. Large amounts of nutrient elements are placed immediately below the seed, and compacted zones are opened to root development. Dual application, another term for deep banding, implies simultaneous application of anhydrous ammonia as the main N source with fluid or solid P, K, and S fertilizers. Otherwise, deep banding terminology can imply the use of either fluid or solid fertilizers High Pressure Injection This method of deep banding application of liquid fertilizer employs high pressure to force a constant stream or pulse of fertilizer through surface residue and into the soil. No physical disturbance of the soil is necessary. Pressures range from 2,000 to 6,000 psi. Advantages for this method of application are the same as for deep banding, but the depth of penetration is less.
313 282 Agronomic Handbook: Management of Crops, Soils, and Their Fertility Point Injection of Fluids This technique of liquid fertilizer application is another variation of deep placement that employs a spoked wheel to inject nutrient elements at points about 8 in. apart to a soil depth of 4 to 5 in. Spacings between the wheels can be varied according to crop to be fertilized. A rotary valve in the wheel hub dispenses fertilizer to the down spike from a positive displacement pump Point Placement of Solids Deep placed nests, pockets, chutkis, or super granules of solid fertilizers are in developmental stages. This technique was conceived primarily to concentrate ammoniacal sources of N in localized zones at approximately the same soil depths as regular deep banding. Solid sources of conventionally sized urea or ammonium sulfate are often used for nesting, or super granules of urea are substituted and individually placed Starter Starter fertilizer application is a form of band placement applied at planting in direct seed contact, below the seeds, or to the sides and below the seeds. Exact position is not implied by the title. Pop-up is another term sometimes used in starter terminology. It means direct seed application of fertilizer material at low rates to stimulate very early growth. Nutrient element rates in direct seed contact must be kept low to avoid germination and seedling damage Starter Fertilizer Benefits Early season nutrient element availability is especially critical because young, limited root systems grow in cold, moist soils. Starter fertilization can help to assure that availability. It benefits plants by: Enhancing root and above-ground development, resulting in earlier cultivation, increased competition with weeds, reduced heat stress during pollination, and earlier harvest Providing quicker soil cover and decreasing runoff and erosion potential Reducing grain moisture content at harvest and cutting production costs Improving N use efficiency, increasing production efficiency, and reducing potential for water pollution Boosting yield and enhancing crop quality and, ultimately, farmer profit potential Side-Dressing Side-dressing involves placement of nutrient elements beside crop rows after emergence. Surface banding or some type of subsurface placement is usually employed. Fluids, solids, or anhydrous ammonia can be used.
314 Fertilizers 283 TABLE 9.23 Placement Locations and Methods Placement Location Soil surface Below soil surface Directly onto plant Placement Method Broadcast Stripped or dribbled Side-dressed and top-dressed Irrigation Broadcast, plowed under Broadcast, incorporated in varying degrees by other tillage operations Side-dressing Row application with seed, pop-up, or starter Banded apart from seed, starter Deep banding in fall or spring before seeding; also referred to as dual application, deep placement, knifing, tillage implement application, preplant banding, double shooting, root zone handing, etc. Irrigation Foliar spray Fertigation with sprinkler systems TABLE 9.24 Useful Equivalents for Estimating Application Rates for Small Areas Unit Equivalent a 1 tsp (level) 1/2 oz 2 tsp (level) 1 tbsp 3 tsp (level) 1 oz 1 pt 1.37 lb 1 qt 2.75 lb 1 gal 11.0 lb 1 pt liquid lb a The equivalents are based on a fertilizer with an average weight/unit of volume, such as superphosphate and most mixed fertilizers. Organics, except bone meal, are generally lighter, and chemical salts heavier than average. TABLE 9.25 Converting Rates per Acre to Rates for Small Areas lb/acre Rate/100 lb/100 ft of 36- lb/100 ft 2 In. Row /2 oz /2 oz oz /4 oz lb 2 1/2 oz lb 6 oz lb 10 oz lb 13 oz lb 1 oz lb 5 oz lb 10 oz ORGANIC FERTILIZERS
315 284 Agronomic Handbook: Management of Crops, Soils, and Their Fertility TABLE 9.26 Organic Fertilizer Catalog Organic Fertilizer Nutrients Supplied Rate of Application Uses and Comments Sold as Blood meal, dried blood Blood meal: 15% N, 1.3% P, 0.7% K; Dried blood: 12% N, 3% P, 0% K Up to 3 lb/100 ft 2 (more will burn plants Source of readily available N; add to compost to speed decomposition; repels deer rabbits; lasts 3 to 4 months Bone meal 3% N, 20% P, 0% K, 24 to 30% Ca Up to 5 lb/100 ft 2 Excellent source of P; raises ph; raw form contains gelatin which is rich in N; lasts 6-12 months Colloidal phosphate or soft phosphate 0% N, 18 to 22% P, 27% calcium, 1.7% iron silicas, 14 other trace minerals Composted cow manure 2% N, 1% P, 1% K 40 lb/50 to 100 ft 2 as soil conditioner; 2 parts to 6 to 8 parts loam as potting mix Cottonseed meal 6% N, 2 to 3% P, 2% K 2 to 5 lb/100ft 2 ; trees: for each in. of trunk size, apply 2 to 4 cc. around drip line Dolomite, dolomitic limestone 51% calcium carbonate, 40% magnesium carbonate Up to 10 lb/100 ft 2 More effective than rock phosphate on neutral soils; P To raise ph one unit, use 7 lb on clay or sandy loam, 5.5 lb on sand, and 10 lb on loam soils per ft 2 Fish emulsion, fish meal Meal: 10% N, 4 to 6% P, 1% K Meal: up to 5 lb/100 ft 2 ; emulsion: dilute 20:1 with water Granite dust, granite meal, crushed granite 0% N, 0% P, 3 to 5% K, 67% silica, 19 trace minerals Greensand, glauconite 0% N, 1% P, 5 to 7% K, 50% silica, 18 to 23% iron oxide, 22 trace minerals available higher (2% immediately available) than for rock phosphate because of small particle size of colloidal clay base; half the ph-raising value of ground limestone; use in fall in garden and when planting bareroot trees in winter; lasts 2 to 3 yr Low level of nutrients and slow release make it valuable as a soil conditioner and as winter fertilizer for houseplants that then need minimal feeding Blood meal, dried blood Raw bone meal Composted cow manure Acidifies soil, so best for crops that prefer low ph Cottonseed meal Raises ph and adds Mg, which is needed for chlorophyll production and photosynthesis; repeated use may cause Mg excess Meal: use in early spring, at transplanting, and any time plants need a boost; lasts 6 to 8 months; emulsion: apply as foliar spray in early morning or evening Up to 10 lb/100 ft 2 Very slowly available; releases potash more slowly than greensand; lasts up to 10 years; improves soil structure; use mica-rich type only Up to 10 lb/100 ft 2 Slowly available; lasts up to 10 yr; loosens clay soils; apply in fall for benefit during next season Dolomite, dolomitic limestone Fish emulsion, fish meal, fish soluble Granite dust, granite meal Greensand, Jersey greensand
316 Fertilizers 285 Guano (bat) 8% N, 4% P, 2% K average but varies widely; 24 trace minerals Up to 5 lb/100 ft 2 ; 2 tbsp/pt potting soil; 1 lb/gal water for manure tea Caves protect guano from leaching so nutrients are conserved Guano (bird) 13% N, 8% P, 2%K, 11 trace minerals 3 lb/100 ft 2 ; fruit trees: 3 to 6 oz/in. trunk diameter; houseplants: 1 to 2 oz/gal water Especially good for roses, bulbs, azaleas, and houseplants Gypsum (calcium sulfate) 23 to 57% Ca, 17.7% S Up to 4 lb/100 ft 2 Use when both Ca and S are needed and soil ph is already high; S will tie up excess Mg; helps loosen clay soils Hoof and horn meal 14% N, 2% P, 0% K Up to 4 lb/100 ft 2 High nitrogen source; much more slowly available than bloodmeal; good for fall-planted perennials; smelly; takes 4 to 6 wk to start releasing N; lasts 12 mo Langbeinite 0% N, 0% P, 22% K, 22% S, 11% Mg Up to 1 lb/100 ft 2 Will not alter ph; use where Ca and S are abundant and Mg and K are needed Leatherdust, leather meal 5.5 to 12% N, 0% P, 0% K 0.5 lb/100 ft 2 2% N is immediately available; balance releases slowly over growing season; does not burn or leach Up to 10 lb/100 ft 2 Releases P best in acid soils below ph 6.2; slower release Rock phosphate 0% N, 22% P, 0% K, 30% Ca, 2.8% Fe, 10% silica, 10 other trace minerals Kelp meal, liquid seaweed 1% N, 0% P, 12% K Meal: up to 1 lb/100 ft 2 ; liquid: dilute 25:1 with water for transplanting and rooting cuttings; 40:1 as booster and for fruit crops than colloidal phosphate; will slowly raise ph one unit or more Contains natural growth hormones, so use sparingly; best source of trace minerals; lasts 6 to 12 mo Sulfur 100% S 1 lb/100 ft 2 to lower ph one unit; as fungicide: dilute 3 tbsp/gal water Lowers ph in alkaline soils; increases crop protein; ties up excess Mg Quik Start, Bloomin Wonder, Super Bat, Full Circle Bat, natural bat guano Plantjoy Gypsum Hoof and horn meal Sul-Po-Mag, K-Mag Leathermeal, Nitro-10 Rock phosphate, phosphate rock Thorvin Kelp, FoliaGro, Sea Life, Maxicrop, Norwegian Seaweed, K-meal, liquid kelp Sulfur, Dispersul
317 286 Agronomic Handbook: Management of Crops, Soils, and Their Fertility TABLE 9.27 Average Elemental Compositions (%) of Common Natural Organic Materials and Manures Elemental Composition N P K Ca Mg S Cl Organic Material Activated sewage sludge Blood, dried Bone meal (raw) Bone meal (steamed) Castor pomace Cocoa meal Cocoa shell meal Cocoa tankage Cottonseed meal l Fish scrap (acidulated) Fish scrap (dried) Garbage tankage Peanut meal Peanut hull meal Peat Peruvian guano Process tankage Soybean meal Tankage, animal Tobacco stems Whale guano Manure N P K Organic C Dairy Goat Hog Horse Poultry Rabbit Sheep Steer
318 Fertilizers 287 TABLE 9.28 Fertilizer Nutrient Contents and C/N Ratios of Commercial Organic Products [lb/ton (%)] Material Nitrogen Phosphate Potash Sulfur Carbon/ Nitrogen Ratio Alfalfa pellets 54 (2.7) 10 (0.5) 56 (2.8) 4 (0.2) 15 Blood meal 260 (13) 40 (2) 3 Bone meal 60 (3) 400 (20) 10 (0.5) Cocoa shells 20 (1) 20 (1) 60 (3) 42 Cottonseed meal 120 (6) 40 (2) 40 (2) 7 Fish scraps, dried and ground 180 (9) 140 (7) 4 Hoof and horn meal (2) 3 Average 220 (11) Linseed meal 100 (5) 40 (2) 20 (1) 8 Seaweed, ground 20 (1) 4 (0.2) 40 (2) 60 (3) Soybean meal 120 (6) 30 (1.4) 40 (2) 7 Tankage, rendered, dried, ground Average 130 (6.5) 290 (14.5) TABLE 9.29 Typical Major Nutrient Element Contents (%) of Organic Materials Organic Material Water Carbon Nitrogen Phosphorus Potassium Calcium Human feces Cattle feces Pig feces Fresh cattle manure Composted cattle manure Pig manure Poultry manure Garbage compost Sewage sludge Sugarcane filter cake Castor bean cake Note: kg nutrient per ton fresh manure = % nutrient content x 10. Source: Rice: Nutrient Disorders and Nutrient Management, 2000, Potash & Phosphate Institute, Norcross, GA. With permission.
319 288 Agronomic Handbook: Management of Crops, Soils, and Their Fertility TABLE 9.30 Micronutrient Contents (lb/ton) of Organic Materials Quantities a (lb/ton) Fertilizer Boron Copper Iron Manganese Molybdenum Zinc Manure Organic Cow Horse Sheep Pig Poultry Cage layer Broiler Hay Legume up to Nonlegume Straw Average crop Alfalfa pellets Seaweed Inorganic Wood ashes a Fresh weight basis for manure and dry weight bases for others. TABLE 9.31 Approximate Nutrient Element Levels for Manures Nutrient Element Content Manure Type N P 2 O 5 K 2 O Cu Mn Zn Solid Manure from poultry (lb/ton) a Liquid Manure from livestock lb/1,000 gal b Layer Broiler Turkey Swine Dairy Beef a Dry matter content ranges from 60 to 90%. b Liquid weight based on 8.34 lb/gal. Source: Crop Fertilization Based on North Carolina Soil Tests, 1997, North Carolina Department of Agriculture and Consumer Services, Raleigh.
320 Fertilizers 289 TABLE 9.32 Average Element Content of Dung Element kg/ton Nitrogen 4.0 Phosphorus as phosphate 2.5 Potassium as potash 5.5 Calcium 5.0 Magnesium 2.5 Sulfur 0.5 Boron Copper Manganese 0.04 TABLE 9.33 Approximate Major Element Composition of Manures Source Dry Matter (%) Approximate Composition Nitrogen (% dry weight) Phosphate (% dry weight) Potash (% dry weight) Dairy Feedlot Horse Poultry Sheep Swine Source: Knott s Handbook for Vegetable Growers, 4th ed., 1997, John Wiley & Sons, New York. With permission. 9.9 INSTRUCTIONS FOR PREPARING ORGANIC FERTILIZER 5 Organic fertilizers need not be expensive. You can make your own. This recipe, to the best of my knowledge, was created by Steve Solomon, founder of Territorial Seed Company. I have used it for 6 years with good results. Instead of buying components in small quantities, buy bulk bags (40 to 50 lb) at a farm supply or feed store. If you keep them dry, they will last many years. All measurements are shown in terms of volume, not weight. 4 parts seed meal 1 part dolomite lime 1/2 part bone meal or 1 part soft rock phosphate 1/2 part kelp meal Seed meal provides N and smaller amounts of P and K. I like to use cottonseed meal, which costs about $13 for a 40-lb bag and is readily available. Some states prohibit its use in certified organic operations (not something a home grower needs to be concerned about). Other options are alfalfa meal, or rape/canola meal. The NPK value of cottonseed meal is about In spring, I
321 290 Agronomic Handbook: Management of Crops, Soils, and Their Fertility substitute bloodmeal in place of some seed meal, since it acts more quickly. Try using three parts seed meal and one part bloodmeal. Seed meals tend to be acidic, so lime is included to balance that. Dolomite limestone is roughly half magnesium carbonate (MgCO 3 ) and half calcium carbonate (CaCO 3 ). Calcitic limestone is pure calcium carbonate. Plants usually need more Ca than Mg. You might want to try 1/3 dolomite lime and 2/3 calcitic lime. If your soil is alkaline, you might experiment with reducing or eliminating the lime. Bone meal and rock phosphate provide the bulk of the P component. Less bone meal (NPK ) is required since it releases its P more readily. The advantage of using rock phosphate (NPK 0-3-0) is that it continues to contribute P to the soil over many years. Bone meal is easy to find. It is produced as a by-product of the beef industry. Rock phosphate is mined. Twenty pounds of bone meal cost about $5. Kelp meal (NPK ) contributes K and micronutrients. It tends to be more expensive than the other components; I recently paid $35 for a 50-lb bag. Another possible K source is Jersey greensand. It has the same advantages and liabilities as rock phosphate (very slow release) but does not supply micronutrients. TABLE 9.34 Formulas for Balanced, All-Purpose Organic Fertilizer Fertilizer Ratio (N-P 2 O 5 -K 2 O ) Ingredients part bone meal 3 parts alfalfa hay 2 parts greensand parts granite dust 1 part dried blood 1 part bone meal 5 parts seaweed parts dried blood 1 part phosphate rock 4 pants wood ashes parts cottonseed meal 1 part colloidal phosphate 2 parts granite dust part phosphate rock 3 parts greensand 2 parts wood ashes parts greensand 2 parts seaweed 1 part dried blood 2 parts phosphate rock REFERENCES 1. Glossary of Soil Science, 1987, Soil Science Society of America, Madison, WI. 2. The Fertilizer Handbook, 1982, Fertilizer Institute, Washington, D.C. 3. Soil and Plant Phosphate, 2000, International Fertilizer Association, Paris. 4. Better Crops with Plant Food, 85, 14, Travis Saling,
322 10 Plant Mineral Nutrition 10.1 BASIC PRINCIPLES Plant mineral nutrition is a science that studies the effects of elements on plant growth and development, determines the forms and conditions of availability and uptake, and establishes the ranges of beneficial and detrimental effects. Scientists began to unravel the mysteries of how green plants grow in the 1800s. A number of theories were put forth to explain plant growth, and through observation and carefully crafted experiments, scientists began to learn what was required for normal growth and development. It might be well to note that modern humus concept theories that relate to the forms in which elements exist in the soil and the forms that should be supplied to plants had their origins in theories developed by some of these early scientists. The ideas that the soil provided food for plants and that humus in the soil was the source of plant health still have their proponents. It is fairly well established that the form of an essential element, whether as an inorganic ion or originating from an organic matrix, is not a factor that determines the wellbeing of a plant. The combination of concentration and lability of an essential element determines a plant s nutritional status. The early scientists discovered that the mass of a live plant was essentially composed of water and organic substances, and that total mineral matter constituted less than 10% and frequently less than 5% of the dry matter of most plants. The analysis of the mineral matter (ash) after the removal of water and destruction of the organic matter provided better understanding of the nutritional requirements of plants by revealing which elements were present in the ash and at what concentrations. By 1890, scientists established plant requirements for C, H, O, N, P, S, K, Ca, Mg, and Fe. Their absence or low availability led to plant death or poor growth after exhibiting visual symptoms. By the early 1900s, 10 of the now-known 16 essential elements required by plants had been identified, but no system existed to scientifically establish their absolute essentiality. Their presence was assumed to be related to their importance. In 1939, two University of California plant physiologists, A.I. Arnon and P.R. Stout, published criteria for plant nutrient element essentiality criteria that are still acknowledged today. 1 They established three criteria: Omission of the element in question must result in abnormal growth, failure to complete the life cycle, or premature death of the plant. The element must be specific and not replaceable by another. The element must exert its effect directly on growth or metabolism and not exert some indirect effect such as by antagonizing another element present at a toxic level. Between 1922 and 1954, Mn, Cu, Zn, Mo, B, and Cl were determined to be essential. The 16 essential elements, their discoverers, and the discoverers of their essentiality are listed in Table Plant physiologists today continue to apply the three requirements set forth by Arnon and Stout over 60 years ago in attempts to determine whether additional elements are essential plants. Recent plant nutrition studies suggest that two additional elements, nickel (Ni) and silicon (Si), should be added to the list, although many plant nutritionists have yet to be convinced that Ni and Si meet all the requirements for essentiality set by Arnon and Stout
323 292 Agronomic Handbook: Management of Crops, Soils, and Their Fertility The concentrations plants require for normal growth and development vary enormously (relative range is from 1 to 1 million) among 13 of the essential elements as shown in Table It is not surprising that many essential elements were not identified until the purification of reagent chemicals was achieved, and the techniques of analytical chemistry brought detection limits below the milligram level. Carbon, H, and O are derived from air and water. They are combined in a process known as photosynthesis that is exclusive to green (chlorophyll-containing) plants. In this energytrapping process that takes place in the presence of light and chlorophyll, a molecule of water (H 2 O) is split. One portion is combined with carbon dioxide (CO 2 ) to form a carbohydrate (CH 2 O) and the other portion is released as an oxygen (O 2 ) molecule, as shown in the following basic equation: nco 2 + n(2h 2 O) + light + chlorophyll n(ch 2 O) + n(o 2 ) The remaining 13 essential elements are derived primarily from the soil or growing medium. They are grouped into two categories based on their concentrations found in plants as either macronutrients (N, P, K, Ca, Mg, and S that have sufficiency requirements at relatively high concentrations), or micronutrients (B, Cl, Cu, Fe, Mn, Mo, and Zn that are required at relatively low concentrations). Nitrogen can also be brought into leguminous plants by a process called nitrogen (N 2 ) fixation. Organisms that exist symbiotically as nodules on plant roots convert atmospheric N 2 into N compounds that can be utilized by the plants. Nitrogen fixation can supply most N requirements of leguminous plants under certain circumstances. TABLE 10.1 Chronology of Discoveries of Essential Nutrient Elements Element Discoverer Year Discoverer of Essentiality Year a C a DeSaussure 1804 H Cavendish 1766 DeSaussure 1804 O Priestley 1774 DeSaussure 1804 N Rutherford 1772 DeSaussure 1804 P Brand 1772 Ville 1860 S a von Sachs, Knop 1865 K Davy 1807 von Sachs, Knop 1860 Ca Davy 1807 von Sachs, Knop 1860 Mg Davy 1808 von Sachs, Knop 1860 Fe a von Sachs, Knop Mn Scheele 1774 McHargue 1922 Cu a Sommer 1931 Lipman and MacKinnon 1931 Zn a Sommer and Lipman 1926 Mo Hzelm 1782 Arnon and Stout 1939 B Gay-Lussac and Thenard 1808 Sommer and Lipman 1926 Cl Scheele 1774 Stout 1954 Element known since ancient times. Source: Plant Nutrition: An Introduction to Current Concepts, 1989, Jones and Bartlett, Boston.
324 Plant Mineral Nutrition 293 TABLE 10.2 Average Concentrations of Mineral Nutrients in Plant Dry Matter Required for Adequate Growth Mineral Nutrient µmol/g dry wt. mg/kg (ppm) Percent Relative Number of Atoms Molybdenum Copper Zinc Manganese ,000 Iron ,000 Boron ,000 Chlorine ,000 Sulfur ,000 Phosphorus ,000 Magnesium ,000 Calcium ,000 Potassium ,000 Nitrogen 1, ,000,000 Source: Epstein, E., Mineral nutrition, in Bonner, J. and Varner, J.E., Eds., Plant Biochemistry, 1965, Academic Press, Orlando, FL ESSENTIAL NUTRIENT ELEMENTS, UPTAKE FORMS, AND RELATIVE CONCENTRATIONS IN PLANTS TABLE 10.3 Nutrient Elements, Uptake, and Biochemical Functions Nutrient Element Uptake Biochemical Functions 1st group C, H, O, N, S 2nd group P, B, Si 3rd group K, Na, Mg, Ca, Mn, Cl 4th group Fe, Cu, Zn, Mo In the form of CO 2, HCO - 3, H 2 O, O 2, NO 3-, NH 4+, N 2, SO 2-4, SO 2. The ions from the soil solution, the gases from the atmosphere. In the form of phosphates, boric acid or borate, silicate from the soil solution In the form of ions from the soil solution. In the form of ions or chelates from the soil solution. Major constituent of organic material; essential elements of atomic groups which are involved in enzymic processes; assimilation by oxidation-reduction reactions. Esterification with native alcohol groups in plants; the phosphate esters are involved in energy transfer reactions. Nonspecific functions established osmotic potentials; more specific reactions in which the ion brings about optimum conformation of an enzyme protein (enzyme activation); bridging of the reaction partners; balancing anions; controlling membrane permeability and electro-potentionals. Present predominantly in a chelated form incorporated in prosthetic groups; enable electron transport by valency change.
325 294 Agronomic Handbook: Management of Crops, Soils, and Their Fertility TABLE 10.4 Nutrient Elements Required for Normal Growth, Typical Concentrations, Major Functions, and Usual Sources Element Typical Concentration (% dry wt.) Usual Sources Major Functions Group I: Structural Components and Intermediates of Metabolism Carbon 44 Atmosphere Organic compounds Hydrogen 6 Atmosphere Organic compounds Oxygen 44 Atmosphere Organic compounds Nitrogen 2 CF, NF, Atm. a Amino acids, proteins, co-enzymes Sulfur 0.5 NF, CF Amino acids, proteins. Phosphorus 0.4 CF, NF ATP, NADP (i.e., energy system) Group II: Enzyme Activators Potassium 2.0 CF, NF Activates about 60 enzymes; essential for protein synthesis; responsible for turgor and stomata movement Calcium 1.5 NF, CF Activates enzymes; essential for membrane permeability Magnesium 0.4 NF, CF Activates ATP; component of chlorophyll Manganese 0.4 NF, CF Activates enzymes; essential for photolysis of H 2 O Group III: Redox Reagents that Undergo Reduction/Oxidation via Multiple Valency Iron NF Fe 3+ + e Fe 2+ Copper NF Cu 2+ + e Cu + Molybdenum NF Reduction of nitrate (NO 3- ) by nitrate reductase and reduction of N 2 by nitrogenase of free living and no bacteria in legumes: Mo +6 + e Mo 5+ Group IV: Elements of Uncertain Function Boron NF Membrane activity? Chlorine NF Osmosis, charge balance, photolysis of H 2 O? Silicon b? NF May reduce transpiration Zinc? NF Protein synthesis; growth hormones; may be important in reproduction Sodium NF May be essential for C4 photosynthesis a Atm. = atmosphere; CF = commercial fertilizer; NF = native fertility. b The need for Si and the role of Si are not universally accepted. Source: Plant Nutrition: An Introduction to Current Concepts, 1989, Jones & Bartlett, Boston.
326 Plant Mineral Nutrition 295 TABLE 10.5 Characteristics and Principal Forms of Uptake of Nutrient Elements Essential for Growth and Plant Contents Element Atomic No. Atomic Wt. Principal Forms for Uptake Plant Contents a Macronutrient Hydrogen 1 1 Water 6 60,000 Carbon 6 12 Air CO 2, soil 45 40,000 Oxygen 8 16 Water H 2 O,air O ,000 Nitrogen 7 14 NH 4+, NO , Potassium K Calcium Ca Magnesium Mg Phosphorus H 2 PO 4-, HPO Sulfur SO Micronutrient Chlorine Cl ,000 Boron H 3 BO Iron Fe, 2+ Fe ,000 Manganese Mn Zinc Zn 2+, Zincate Copper Cu Molybdenum MoO a Plant contents for macronutrients shown as %, mol/g, and Range (%); plant contents for micronutrients shown as ppm, mol/g, and ppm FACTORS AFFECTING NUTRIENT ELEMENT CONCENTRATIONS 2 Soil test levels and amounts of nutrient elements added by fertilizers, manures, residues, and soil amendments are key factors in nutrient element availability. However, the concentration of a nutrient element within a plant is the integrated value of all the factors that interacted to affect growth. Considering the number of factors that influence growth and resulting crop yields, it is surprising that plant analysis relationships hold as well as they do. Some of the relevant factors are discussed in the following paragraphs Soil Moisture It is more difficult for plants to absorb nutrient elements at low soil moisture levels, so nutrient element contents will be lower. Sufficient nutrient elements should be added to prevent seasonal variations in moisture and other unfavorable environmental conditions Temperature Low temperature reduces uptake of a number of elements including N, P, K, S, Mg, B, and Zn. In cooler climates, higher soil test levels or rates of applied nutrient elements must be used to achieve plant nutrient element concentrations comparable to those found in warmer climates. Under cooler conditions, root growth is slower and plant uptake processes are slowed. Also, releases of such elements as N, P, and S from organic matter through mineralization are slowed when temperatures are low.
327 296 Agronomic Handbook: Management of Crops, Soils, and Their Fertility Soil ph Soil acidity and alkalinity influence the availabilities of many nutrient elements. For example, higher ph tends to lower Fe, Al, Zn, Mn, and B availability, and increases Mo availability. Lower ph makes it more difficult for plants to absorb Mg and P, but more Mn, Fe, and Al are absorbed Tillage and Placement Conservation tillage practices may cause reduced uptake of nutrient elements including P and K. This is due in part to positional availability because much of the fertilizer is broadcast and remains on or near the surface. Band placement of nutrient elements near seed or deeper in the soil improves uptake by the plant. Side-band placement is effective for increasing nutrient uptake in early growth stages and may influence yield Compaction Soil compaction can have major effects on ability to absorb nutrient elements. Compaction reduces oxygen in soil. Root energy production and consequent nutrient element absorption are slowed. Concentrating moderate amounts of readily available nutrients in starter fertilizer near seedlings can help overcome these problems. Growth and yield responses to starter fertilizers even on high testing soils may be partially due to higher concentrations of nutrient elements intended to help overcome diminished ability to take up nutrient elements under compacted conditions Hybrid or Variety Crop yield is the product of genetic capability and environmental factors. Hybrids or varieties vary greatly in their yield capabilities. For example, in an experiment in New Jersey, one corn hybrid yielded 312 bu per acre and another 227 bu per acre in the same environment. Obviously, their total nutrient element uptakes were much different. Varieties or hybrids may vary widely in their nutrient element requirements and responses to environmental conditions. For instance, studies demonstrated significantly different corn hybrid responses to K knifed into the ridges for ridge-till corn. Differences in corn hybrid responses to starter P have also been documented. Corn hybrid differences in N uptake patterns, time of N application, and availability of ammonium-n further emphasize genetic effects on nutritional requirements. More information is required to determine differences in critical or sufficiency levels of nutrient elements for specific varieties and hybrids Interactions High concentrations of one element may cause imbalances or deficiencies of other elements. The relationship between P and Zn is one example. A high amount of available P may reduce the amount of Zn absorbed. With a marginal Mg supply in the soil, an application of K may reduce Mg uptake to the point of deficiency in the plant. The concentration of K in the plant may be reduced by a high rate of ammonia-n Stages of Growth The concentration of an element considered to be adequate changes as a plant grows and matures. Hence, it is important to sample plants at comparable and recognizable growth stages.
328 Plant Mineral Nutrition 297 TABLE10.6 Uptake of Nitrogen, Phosphorus, Potassium, Calcium, Magnesium, Boron, Copper, Iron, Manganese, Molybdenum, and Zinc by Various Crops Crop (tons/acre) N (kg) P 2 O 5 (kg) K 2 O (kg) Ca (kg) Mg (kg) S (kg) B (g) Cu (g) Fe (g) Mn (g) Mo (g) Zn (g) Alfalfa (18) Corn (10) Cotton lint (1.7) Peanuts (4.5) Rice (7.8) Soybeans (4.0) Wheat (4.0) Source: International Soil Fertility Manual, 1995, Potash & Phosphate Institute, Norcross, GA MOVEMENT OF NUTRIENT ELEMENT IONS IN SOIL TABLE 10.7 Movement of Nutrient Element Ions in Soil and Their Uptake by Plants Method Mechanism of Movement in Soil Ions Mass flow Ion movement with and in water as a result of rainfall, applied irrigation water, or water movement as a result of evapotranspiration Nitrate (NO 3- ), chloride (Cl - ), calcium (Ca 2+ ), sulfate (SO 2-4 ) Diffusion Ion movement in soil solution driven by concentration gradients Phosphate (PO 3-4 ), potassium (K + ) Root interception Absorption of ions from the soil solution by plant root contact as a result of root movement (growth) through soil; extent of uptake depends on amount of root occupation and root characteristics TABLE 10.8 Relative Significance of Movements of Ions from Soil to Corn Roots Element Amount (lbs) Required for 150 Bu/Acre Corn % Supplied by: Root Interception Mass Flow Diffusion Nitrogen Phophorus Potassium Calcium Magnesium Sulfur Copper Zinc Boron Iron Manganese Molybdenum Source: Soil Nutrient Bioavailability: A Mechanistic Approach, 1984, John Wiley & Sons, New York.
329 298 Agronomic Handbook: Management of Crops, Soils, and Their Fertility FIGURE 10.1 Movement of nutrient element ions in the soil by mass flow, root interception, and diffusion NUTRIENT ELEMENT SYMPTOMS FACTORS AFFECTING NUTRIENT ELEMENT SYMPTOMS Why do symptoms of a plant nutrient element deficiency occur? Because the amount of the nutrient element present in a form the plant can take up and use is insufficient. The reason may be that the soil was infertile and not enough of the nutrient element was added, but other factors affect uptake and lead to the appearance of symptoms Root Zones Crops differ a great deal in their development of root systems, and a single crop will show variations in the numbers roots developed, depending on the environment and differences in plant genetics. Since some plant nutrient elements do not move very far in the soil, the extent of the root system will determine whether the plant acquires enough of vital nutrient elements. If root growth is shallow, plants may show deficiency symptoms even when the soil contains a good supply of nutrient elements. Dry surface soil conditions may also limit nutrient element uptake if most of the available nutrient elements are in that zone. This situation is called positional unavailability. When a deficiency symptom is noted, it is good practice to examine the roots to see whether a restricted root zone may be contributing to the deficiency Temperature Many growers noted symptoms when plants were young, only to see the plants grow out of the symptoms as the growing season progressed. This may be caused by the effect of temperature on root growth. If soil and air temperatures are cold, plants grow very slowly, root systems are small, and nutrient element uptake is low. Also, when air temperatures are too
330 Plant Mineral Nutrition 299 low or too high, photosynthesis and respiration rates are affected. For example, if temperatures are too high at night, respiration continues at a high rate, burning up sugars and limiting the accumulation of carbohydrates Acidity or Alkalinity When a symptom appears, the degree of soil acidity or alkalinity of the soil in which the plant is growing should be evaluated. Acidity or alkalinity is often related to the cause of the symptom. The solubilities and availabilities of many plant nutrient elements depend on soil ph. When the ph rises above 6.0 to 6.5, elements such as Fe, Mn, Zn, and B decrease in solubility perhaps to the point where the plants become deficient and show symptoms. Conversely, when soil ph is too acid (below 6.0), Mo becomes less soluble and a deficiency may occur. Because of the influence of ph on nutrient element availability, it is essential to learn the liming history when a symptom is observed. Over-liming is easy to do on sandy soils. When these soils are overlimed, symptoms of Fe, Mn, and Zn deficiency are likely to appear. In some parts of the world, soils are naturally alkaline. This is often the case in arid regions where soils are only slightly weathered or where alkaline salts have accumulated. In areas of higher rainfall where outcroppings of limestone exist, soil ph may be above 7.0 and symptoms of Fe, Mn, and Zn deficiency may be seen. Soils in arid regions may also have problems of excess salinity (soluble salts) or a condition known as black alkali (Na excess). These problems must be dealt with by establishing drainage, adding amendments if Na is involved, and leaching. Plants on such soils grow slowly, appear droughty, and may exhibit necrosis of leaf margins Varieties and Genetic Factors Sometimes a deficiency symptom is noticed in one variety of a crop and absent in another. This is not uncommon, but is often overlooked. Differences in genetic make-up may affect a plant s ability to take up and utilize certain nutrient elements. One variety may show symptoms of deficiency while a variety growing beside it may lack symptoms Stage of Maturity As a plant nears maturity, it starts to show signs of old age such as reddening, browning, or leaf tip or edge burn. What may be a sign of aging may be mistaken for a deficiency symptom. In fact, a relationship exists. As a plant grows older, it may run out of N or K and mature before reaches its full yield potential. Some crops require a delicate balance between the amount of N required for full yield and what may be too little or too much. Visual symptoms help us recognize problems and make corrections SUMMARY OF ESSENTIAL ELEMENTS AND FUNCTIONS Nitrogen is essential to the formation of amino acids, the building blocks of proteins. Phosphorus is used by plants to form nucleic acids and other vital chemicals. It promotes root formation, early growth, early maturity, and seed production. Potassium encourages root growth and appears to enhance disease resistance in crops. It also boosts fruit size and quality. In fact, cotton takes up and uses more K during boll fill than at any other time in its development. Sulfur occupies a grey area between primary nutrient elements and micronutrients. Some call it the fourth primary nutrient element, mainly because wide areas of S deficiency exist all over the U.S. Sulfur is required for three amino acids critical to protein formation.
331 300 Agronomic Handbook: Management of Crops, Soils, and Their Fertility Boron is needed primarily at the growing points (meristematic cells) of plants, where it helps differentiate the structural components of new cells. Boron deficiency can cause reduced flower set and death of terminal growth. Deficiency is often induced by intensive crop production and irrigation, both common features of cotton culture. Boron is not mobile, and thus is needed continuously at all growing points. For that reason, a foliar source of B is an effective measure. Chlorine assists in photosynthesis and enhances disease resistance. Copper is a relative newcomer to the ranks of micronutrient inputs. Deficiency most often appears in crops grown in highly organic or sandy soil, and interferes with protein synthesis. Iron is vital to photosynthesis, and deficiencies most often occur where excess Zn or Mn is present, soil ph is high (alkaline), or aeration is poor (highly compacted or poorly draining clay soils). Manganese works with Fe during chlorophyll synthesis. Excess Mn can cause Fe deficiency. If a soil has too much Mn, it cannot be eliminated, but a foliar nutrient element blend can help maintain or restore the proper element balance. Molybdenum is critical to N utilization. Without Mo, a plant cannot convert nitrate-nitrogen (NO 3- N) to amino acids. Deficiency can lead to poor vigor and stunting. Zinc controls the synthesis of indoleacetic acid, an important plant growth regulator. Deficiency is most common in high ph, low organic, sandy soils and can cause reduced fruit set. High P concentrations can also lead to Zn deficiency. Again, a balanced input can help. TABLE 10.9 Generalized Symptoms of Nutrient Element Deficiencies and Excesses Element/Status Symptoms Major Elements Nitrogen Deficiency Excess Ammonium Toxicity Phosphorus Deficiency Excess Potassium Deficiency Excess Calcium Deficiency Light green leaf and plant color; older leaves turn yellow and will eventually turn brown and die. Plant growth is slow; plants will mature early and be stunted. Plants will be dark green; new growth will be succulent; susceptible if subjected to disease, insect infestation, and drought stress; plants will easily lodge; blossom abortion and lack of fruit set will occur. Plants fertilized with ammonium-nitrogen (NH 4- N) may exhibit ammonium toxicity symptoms, with carbohydrate depletion and reduced plant growth; lesions may appear on plant stems, along with downward cupping of leaves, decay of the conductive tissues at the bases of the stems, and wilting under moisture stress; blossom-end fruit rot will occur and Mg deficiency symptoms may also appear. Plant growth will be slow and stunted; older leaves will have purple coloration, particularly on the undersides. Phosphorus excess will not have a direct effect on plants but may produce visual signs of Zn, Fe, and Mn deficiencies. High P may also interfere with normal Ca nutrition and typical Ca deficiency symptoms may be present. Edges of older leaves will appear burned, a symptom known as scorch. Plants will easily lodge and be sensitive to disease infestation. Fruit and seed production will be impaired and of poor quality. Plants will exhibit typical Mg and possibly Ca deficiency symptoms due to cation imbalance. Growing tips of roots and leaves will turn brown and die. The edges of leaves will look ragged; edges of emerging leaves will stick together. Fruit quality will be affected and blossom-end rot will appear on fruits.
332 Plant Mineral Nutrition 301 TABLE 10.9 (CONTINUED) Generalized Symptoms of Nutrient Element Deficiencies and Excesses Element/Status Excess Magnesium Deficiency Excess Sulfur Deficiency Excess Symptoms Plants may exhibit typical Mg deficiency symptoms; in cases of great excess, K deficiency may also occur. Older leaves will be yellow, with interveinal chlorosis (yellowing between veins) symptoms. Growth will be slow and some plants may be easily infested by disease. Results in a cation imbalance with signs of Ca or K deficiency. Overall light green color of the entire plant; older leaves turn light green to yellow as the deficiency intensifies. Premature senescence of leaves may occur. Micronutrients Boron Deficiency Excess Chlorine Deficiency Excess Copper Deficiency Excess Iron Deficiency Excess Manganese Deficiency Excess Molybdenum Deficiency Excess Zinc Deficiency Excess Abnormal development of growing points (meristematic tissue); apical growing points eventually become stunted and die. Flowers and fruits will abort. For some grain and fruit crops, yield and quality are significantly reduced Leaf tips and margins turn brown and die. Younger leaves will be chlorotic and plants will easily wilt. A plant disease will infest wheat if Cl is deficient. Premature yellowing of the lower leaves with burning of leaf margins and tips. Leaf abscission will occur and plants will easily wilt. Plant growth will be slow; plants will be stunted; young leaves will be distorted and growing points will die. Iron deficiency may be induced with very slow growth. Roots may be stunted. Interveinal chlorosis on emerging and young leaves with eventual bleaching of the new growth. When severe, the entire plant may turn light green. Bronzing of leaves with tiny brown spots a typical symptom on rice crops. Interveinal chlorosis of young leaves while the leaves and plants remain generally green. When severe, the plants will be stunted. Older leaves will show brown spots surrounded by chlorotic zones and circles. Symptoms are similar to those of N deficiency. Older and middle leaves become chlorotic first, and in some instances, leaf margins are rolled and growth and flower formation are restricted. Not common. Upper leaves will show interveinal chlorosis with whitening of affected leaves. Leaves may be small and distorted and form rosettes. Iron deficiency will develop.
333 302 Agronomic Handbook: Management of Crops, Soils, and Their Fertility 10.5 MICRONUTRIENT ELEMENTS TABLE Crops Susceptible to Micronutrient Deficiencies Boron Copper Iron Manganese Molybdenum Zinc Alfalfa a Alfalfa Peanuts Barley Alfalfa Maize Cotton Barley Sorghum Oats Clover Rice Peanuts Oats Soybean Sorghum Soybean Sorghum Sugar beet Rice Sudan grass Soybean Soybean Wheat Sudan grass Sudan grass Sugar beet Wheat a Italics indicates crops that are often treated. TABLE Estimated Occurrence of Micronutrient Deficiencies a Estimated Deficiency Degree and Occurrence (%) Micronutrient Acute Latent b Total Boron Copper Iron 3 3 Manganese Molybdenum Zinc a Based on 190 field trials with maize, rice, wheat, and barley in 15 countries. b Test crop did not necessarily respond to application of micronutrient. TABLE Relative Sensitivities of Selected Crops to Micronutrient Deficiencies Sensitivity to Micronutrient Deficiency Crop Boron Copper Iron Manganese Molybdenum Zinc Alfalfa High High Medium Medium Medium Low Barley Low Medium High Medium Low Medium Bean Low Low High High Medium High Clover Medium Medium a Medium Medium Low Corn Low Medium Medium Medium Low High Grass Low Low High Medium Low Low Oat Low High Medium High Low Low Rye Low Low Low Low Low Sorghum Low Medium High High Low High Soybean Low Low High High Medium Medium Sudan grass Low High High High Low Medium Sugar beet High Medium High Medium Medium Medium Wheat Low High Low High Low Low a Inadequate available data to categorize into low, medium, or high sensitivity groups.
334 Plant Mineral Nutrition 303 TABLE Agronomic Crop Species Sensitive to Deficient or Excessive Levels of Micronutrients Micronutrient Sensitive to Deficiency Sensitive to Excess Boron Legumes, cotton, and sugar beet Cereals Chlorine Cereals and sugar beet Copper Cereals (oats) and alfalfa Cereals and legumes Iron Sorghum, soybean, and clover Rice and tobacco Manganese Cereals (oats), legumes, soybean, sugar beet Cereals and legumes Molybdenum Legumes Cereals Zinc Cereals (corn), legumes, grasses, Cereals and soybean TABLE Soil Conditions and Crops Commonly Affected by Micronutrient Deficiencies Micronutrient Sensitive Crops Soil Conditions for Deficiency Boron Alfalfa, clover, cotton, peanut, sugar beet Acid sandy soils low in organic matter, overlimed soils, organic soils Copper Corn, small grains Organic soils, mineral soil high in ph and organic matter Iron Clover, sorghum, soybean Leached sandy soils low in organic matter, alkaline soils, soils high in phosphorus Manganese Alfalfa, small grains, soybean, sugar beet Leached acid soils, neutral to alkaline soils high in organic matter Zinc Corn, sorghum Leached acid sandy soils low in organic matter, neutral to alkaline soils and soils high in phosphorus TABLE Interactions of Major Nutrient and Trace Elements in Plants Major Element Antagonistic Elements Synergistic Elements Calcium Magnesium Phosphorus Aluminum, barium, beryllium, boron, cadmium, cesium, chromium, cobalt, copper, fluorine, iron, lead, lithium, manganese, nickel, strontium, zinc Aluminum, barium, beryllium, chromium, cobalt, copper, fluorine, iron, manganese, nickel, zinc Aluminum, arsenic, boron, beryllium, cadmium, chromium, copper, fluorine, iron, lead, manganese, mercury, molybdenum, nickel, rubidium, scandium, silicon, strontium, zinc Copper, manganese, zinc Aluminum, zinc Aluminum, boron, copper, fluorine, iron, manganese, molybdenum, zinc Potassium Aluminum, boron, cadmium, chromium, fluorine, manganese, mercury, molybdenum, rubidium Sulfur Arsenic, barium, iron, lead, molybdenum, selenium Fluorine, iron Nitrogen Boron, copper, fluorine Boron, copper, iron, molybdenum Chlorine Bromine, iodine
335 304 Agronomic Handbook: Management of Crops, Soils, and Their Fertility TABLE Typical Concentrations of Micronutrients in Foliages of Normal Plants Micronutrient Dry Matter Content (mg/kg) Cell Sap Content (mm) a Nutrient Solution (mm) b Boron Chlorine 100 1, Copper Iron Manganese Molybdenum Zinc a Value merely indicates in round numbers the total aqueous concentration possible without regard to insoluble, lipid, or other structural fractions. b Typical nutrient solution concentrations. TABLE Sufficient Micronutrient Content (mg/kg) of Plants at Weeks 7 to 8 Growth Stage Crop Boron Copper Iron Manganese Molybdenum Zinc Barley Cotton Groundnut Maize Oats Rice > Rye Sorghum Soybean Sunflower Wheat
336 Plant Mineral Nutrition MICRONUTRIENTS TABLE Classification of Micronutrients and Trace Elements as Essential Plant Nutrient Elements or Toxins Element Essential to Plants Toxic to Plants Micronutrient Boron Yes Yes Copper Yes Yes Manganese Yes Yes Molybdenum Yes Yes Zinc Yes Yes Trace Element Antimony No? Arsenic No Yes Barium No Low Beryllium No Yes Bismuth No Yes Cadmium No Yes Chromium No Yes Cobalt Yes Low Lead No Yes Mercury No No Nickel Possibly Yes Selenium Yes Yes Silver No No Tin No? Tungsten No? Vanadium Yes Yes Note: Toxicity considers the likelihood of uptake of the element.
337 306 Agronomic Handbook: Management of Crops, Soils, and Their Fertility TABLE Approximate Concentrations (mg/kg Dry Wt.) of Micronutrients and Trace Elements in Mature Leaf Tissue Micronutrient/ Trace Element Deficient or Normal Sufficient or Toxic Excessive Antimony Arsenic Barium 500 Beryllium < Boron Cadmium Chromium Cobalt Copper Fluorine Lead Lithium Manganese Molybdenum Nickel Selenium Silver Thalliu 20 Tin 60 Titanium Vanadium Zinc Zirconium Source: Trace Elements in Soils and Plants, 3rd ed., 2000, CRC Press, Boca Raton, FL. With permission. TABLE Approximate Uptake of Micronutrients and Trace Elements Micronutrient/Trace Element Uptake (g/ha) Manganese, iron 500 Zinc, boron 200 Copper 100 Molybdenum 10 Cobalt 1 Selenium 0.02
338 Plant Mineral Nutrition 307 TABLE General Effects of Micronutrient and Trace Element Toxicity on Common Cultivars Trace Element Symptoms Sensitive Crops Aluminum Overall stunting, dark green leaves, purpling of stems, deaths of Cereals leaf tips and coralloid, damaged root systems Arsenic Red-brown necrotic spots on old leaves, yellowing and browning Legumes, brome grass of roots, depressed tillering, wilting of new leaves Beryllium Inhibition of seed germination and reduced growth, degradation of protein enzymes Boron Margin or leaf tip chlorosis, browning of leaf points, decaying Cereals growing points, wilting and dying-off of older leaves; in severely affected pine trees, necrosis occurs on needles near the ends of shoots and in top halves of trees Cadmium Brown margin of leaves, chlorosis, reddish veins and petioles, Legumes (beans, soybeans) curled leaves, and brown stunted roots; severe reduction in growth of roots, tops, and number of tillers (in rice); reduced conductivity of stems caused by deterioration of xylem tissues Chromium Chlorosis of new leaves, necrotic spots and purpling, injured root growth Cobalt Interveinal chlorosis in new leaves followed by induced Fe chlorosis and white leaf margins and tips and damaged root tips Copper Dark green leaves followed by induced Fe chlorosis; thick, short, Cereals and legumes or barbed wire roots; depressed tillering Fluorine Margin and leaf tip necrosis, and chlorotic and red-brown points of leaves Iron Dark green foliage, stunted growth of tips and roots, dark brown Rice, tobacco to purple leaves of some plants (e.g., bronzing disease of rice) Lead Dark green leaves, wilting of older leaves, stunted foliage, and brown short roots Manganese Chlorosis and necrotic lesions on old leaves, blackish or red Cereals, legumes necrotic spots, accumulation of MnO particles in epidermal cells, drying tips of leaves, and stunted roots and plant growth Mercury Severe stunting of seedlings and roots, browning of leaf points Sugar beet, maize Molybdenum Yellowing or browning of leaves, depressed root growth and Cereals tillering Nickel Interveinal chlorosis (caused by Fe-induced deficiency in new Cereals leaves), gray-green leaves, and brown and stunted roots and plant growth Rubidium Dark green leaves, stunted foliage, increasing numbers of shoots Selenium Interveinal chlorosis or black spots at Se content of about 4 ppm, and complete bleaching or yellowing of younger leaves at higher Se content, pinkish spots on roots Thallium Impairment of chlorophyll synthesis, mild chlorosis and slight Tobacco, cereals cupping of leaves, reduced germination of seeds and growth of plants Titanium Chlorosis and necrosis of leaves, stunted growth Beans Zinc Chlorotic and necrotic leaf tips, interveinal chlorosis in new leaves, retarded growth of entire plants, injured roots resemble barbed wire Cereals Source: Trace Elements in Soils and Plants, 3rd ed., 2000, CRC Press, Boca Raton, FL. With permission.
339 308 Agronomic Handbook: Management of Crops, Soils, and Their Fertility TABLE Forms and Principal Functions of Essential Micronutrients and Trace Elements Element Constituent Function Aluminum a Controlling colloidal properties in cells, possible activation of some dehydrogenases and oxidases Arsenic a Phospholipid (in algae) Metabolism of carbohydrates in algae and fungi Boron Phosphogluconate Metabolism and transport of carbohydrates, flavonoid synthesis, nucleic acid synthesis, phosphate utilization, and polyphenol production Bromine a Bromophenols (in algae) Cobalt Cobalamide coenzyme Symbiotic N 2 fixation, possibly also in non-nodulating plants, valence changes, stimulation of synthesis of chlorophyll and proteins Copper Various oxidases, plastocarbohydrate Oxidation, photosynthesis, protein and cyanins, centroplasmin metabolism, possibly involved in symbiotic N 2 fixation and valence changes Fluorine Fluoroacetate (in a few species) Citrate conversions Iron Hemoproteins and nonheme Photosynthesis, N 2 fixation, valence changes, iron proteins, dehydrogenases, and ferredoxins Lithium a Metabolism in halophytes Manganese Many enzyme systems Photoproduction of oxygen in chloroplasts and indirectly on NO 3 reduction Molybdenum Nitrate reductase, nitrogenase, N 2 fixation, NO 3 reduction, and valence changes oxidases, and molybdoferredoxin Nickel a Enzyme urease (in Canavalia seeds) Possibly in action of hydrogenase and translocation of N Rubidium a Function similar to that of K in some plants Selenium a Glycene reductase (in Clostridium cells) Silicon Structural components Strontium a Function similar to that of Ca in some plants Titanium a Possibly photosynthesis and N 2 fixation Vanadium Porphyrins Lipid metabolism, photosynthesis (in green algae), and possibly in N 2 fixation Zinc Anhydrases, dehydrogenases, proteinases, and peptidases Carbohydrate and protein metabolism a Elements known to be essential for some groups or species and whose general essentialities need confirmation. Source: Trace Elements in Soils and Plants, 3rd ed., 2000, CRC Press, Boca Raton, FL. With permission.
340 Plant Mineral Nutrition TRACE ELEMENTS TABLE Average Contents of Four Trace Elements in Dry Matters of Crops Grown Side by Side Crop Part Sampled Cadmium (ppm) Lead (ppm) Cobalt (ppm) Selenium (ppb) Spring wheat Grain ± ± ± ± 0.8 Straw ± ± ± ± 2.3 Winter wheat Grain ± ± ± Straw ± ± ± Oats Grain ± ± ± ± 1.3 Straw ± ± Barley Grain ± ± ± ± 0.9 Straw 0.53 ± ± Rye Grain 0.20 ± ± Straw ± ± ± Timothy, silage First cut ± ± ± ± 2.6 Second cut ± ± ± ± 3.5 Timothy Dry hay ± ± ± ± 3.2 Fresh growth ± ± ± ± 4.9 Ryegrass, silage First cut ± ± ± ± 3.6 Second cut ± ± ± ± 3.4 Red clover Dry hay ± ± ± ± 3.1 Fresh growth ± ± ± ± 4.3 Sugar beet Root ± ± ± 0.08 Tops ± ± ± 0.16 Note: Mean ± standard deviation HEAVY METALS TABLE Heavy Metals and Sources Heavy Metal Arsenic Cadmium Chromium Copper Lead Mercury Nickel Zinc Sources Pesticides, coal and petroleum wastes, mine tailings Electroplating, paint residues, plastics, and batteries Stainless steel, chrome-plated products, paints, fire brick Mine tailings, copper dust, fly ash, fertilizers Batteries, wet and dry air deposition, steel mill residues Catalysts for industrial processes, pesticides, metals Wet and dry air deposition, electroplating, batteries Batteries, galvanized metals, brass and rubber production Source: Compost Organics: Buyers Guide, , Composting News, Mentor, OH.
341 310 Agronomic Handbook: Management of Crops, Soils, and Their Fertility TABLE Cumulative Heavy Metal (Trace Element) Additions (kg/ha) to Soil Based on Cation Exchange Capacity Cation Exchange Capacity (meq/100 g) Heavy Metal <5 5 to 15 >15 Cadmium Nickel Copper Zinc ,120 Lead 560 1,120 2,240 TABLE Soil Plant Transfer Coefficients for Heavy Metals Element Soil Plant Transfer Coefficient Arsenic Beryllium Cadmium 1 10 Chromium Cobalt l Copper Lead Mercury Nickel Selenium Thallium 1 10 Tin Zinc 1 10 Source: Heavy Metals in Soils, 2nd ed., 1995, Blackie Academic, London.
342 Plant Mineral Nutrition 311 TABLE Removal of Trace Heavy Metals from Soil by Crops Output with Planting Content of Trace Element Soil (kg/ha) Reference (g/ha, %) a Accumulator (g/ha, %) a Cadmium Chromium Copper Lead Manganese 810 1, , Molybdenum Nickel Zinc , a As percent of total content of soil. Source: Trace Elements in Soils and Plants, 2nd ed., 1994, CRC Press, Boca Raton, FL. TABLE Relative Heavy Metal Accumulation in Plants a Heavy Metal High Accumulators Low Accumulators Cadmium Corn Copper Sugar beet, certain barley cultivars Lead Ryegrass, celery, corn Some barley cultivars Nickel Sugar beet, ryegrass Corn, barley cultivars Zinc Sugar beet a Cadmium and lead in edible portions; copper, nickel, and zinc in leaves. TABLE Maximum Heavy Metal Concentrations per USEPA Regulations for Sludge Sold in Bulk for Land Application Heavy Metal Maximum Concentration (mg/kg) Arsenic 75 Cadmium 85 Copper 4,300 Lead 840 Mercury 57 Molybdenum 75 Nickel 420 Selenium 100 Zinc 7,500 TABLE Frequency of Monitoring per USEPA Regulations and Based on Annual Rate of Application of Sewage Sludge Amount of Sewage Sludge (metric tons/yr) Monitoring Frequency <290 Annually 290 < 1,500 Quarterly 1,500 <15,000 Bimonthly 15,000 + Monthly
343 312 Agronomic Handbook: Management of Crops, Soils, and Their Fertility 10.9 SUMMARY: PLANT NUTRITION AND ESSENTIAL MAJOR NUTRIENT ELEMENTS NITROGEN (N) The atomic number of nitrogen is 7; its atomic weight is Rutherford discovered it in 1772 and de Saussure proved it essential to plants in Nitrogen in Soil Most N (98%) is found in soils and is associated with organic material. Total N levels in soils range from 0.02% in subsoils to 2.5% in peat, but the plowed layers of most cultivated soils contain 0.02 to 0.04% N by weight. However, due to continuous changes in availability, determinations of soil N levels are of limited use to predict short-term availability to plants. Changes in oxidation states occur naturally due to chemical, biochemical, and microbial processes. These reactions form the dynamic N cycle. The different N forms have oxidation levels of +5 in N 2 O 5 and HNO 3 ; +4 in NO 2 ; +3 in N 2 O 3 and HNO 2 ; +2 in NO; +1 in N 2 O, HNO, and H 2 N 2 O; 0 in N 2 ; 1 in NH 2 OH; 2 in NH 2 -NH 2 ; and 3 in NH 3. Soil N is found in three main fractions: (1) organic matter; (2) ammonium (NH 4+ ) ions fixed on exchange sites of clay minerals; and (3) ammonium and nitrate (NO 3- ) ions in soil solution. The forms of N that are important to plant nutrition are ammonium (NH 4 ), nitrite (NO 2 ), and nitrate (NO 3 ). Both nitrate and ammonium are taken up by plants and constitute the major crop fertilizer forms of N. Nitrite is toxic to plants at very low levels (below 5 ppm) and generally becomes a factor only when environmental or cultural practices or chemicals affect the nitrification processes in the soil Soil Dynamics Nitrogen in soil may be (1) transformed by mineralization (conversion of organic into inorganic N), followed by nitrification (conversion of ammonium into nitrate); (2) incorporated by symbiotic fixation (conversion of the N 2 gas into ammonia or ammonium); or (3) lost by denitrification (transformation of nitrate into N gas), ammonia volatilization (change of ammonium into N 2 gas), dissimilatory nitrite reduction (transformation of nitrite into nitrous oxide), or plant uptake (mainly ammonium and nitrate). The rates of these natural transformations may be altered by aerobic and anaerobic conditions, soil ph, temperature, chemical inhibitors, or certain fungicides and pesticides. Nitrate is the primary N form absorbed by plants due to rapid conversion of ammonium in the soil to that form. Nitrification involves two steps. Bacteria (Nitrosomonas spp.) oxidize ammonium into nitrite (Step 1), and then Nitrobacter bacteria transform nitrite to nitrate (Step 2). Because Step 2 proceeds faster than Step 1 under normal conditions, nitrite does not accumulate in soils unless this process is blocked at the nitrite step by some environmental or cultural practice. Nitrification requires oxygen and releases hydrogen ions, thereby acidifying the soil over time and requiring lime to adjust the acidification of the soil. Higher plants and microorganisms compete for N in soils. Because microorganisms are more efficient in intercepting N, its availability for plant growth depends on the soil carbon:nitrogen (C:N) ratio. When C:N > 30:1, N is immobilized by the decomposition of organic residue by soil microbes, while at 20:1 < C:N, limited immobilization and release of mineral N into the soil environment occur. N is available for plant uptake at C:N < 20:1. In order to increase N available for plant uptake, fertilizers containing N are routinely applied to cropped soils Fertilizers Nitrogen fertilizers are usually grouped by the forms of N. Urea-based fertilizers include granular urea and liquid solutions of urea ammonium nitrate, urea ammonium phosphate, urea ammonium sulfate, urea nitric phosphate, urea phosphate, water-soluble urea formaldehyde, methylene diurea,
344 Plant Mineral Nutrition 313 dimethylenetriurea, and stabilized urea formaldehyde. Urea is usually rapidly converted to ammonium, which can be absorbed by plants in the ammonium form or as nitrate, if nitrification converts the ammonium to the nitrate form prior to absorption. Ammonium-based fertilizers include gaseous anhydrous ammonia, granular ammoniated superphosphate, ammonium chloride, ammonium nitrate, ammonium nitrate limestone, diammonium phosphate, monoammonium phosphate, ammonium phosphate nitrate, ammonium phosphate sulfate, ammonium polyphosphate, and ammonium sulfate. Ammonium may be absorbed by the plant or converted to nitrate before absorption. If negatively charged clay and humus particles are present in the soil, ammonium is less likely to leach due to its positive charge. Nitrate-based fertilizers include calcium ammonium nitrate solutions, granular calcium nitrate, potassium nitrate, magnesium nitrate, and sodium nitrate. Nitrate is not strongly bound to soil colloids, and is therefore prone to leaching during rainfall or irrigation. Organic N-containing fertilizers include dried blood, castor bean pomace, cottonseed meal, dried fish scraps, bird guano, manure, and sewage sludge. These N sources release ammonium upon decomposition. Because N fertilizers are applied in fairly large quantities to cropland soils, they can exert marked effects on soil ph. Urea and ammonium-based fertilizers have strong acidification effects on bulk soils. This acidification results from release of protons during nitrification or absorption of ammonium by the roots. Similarly, organic N sources exert acidifying effects through mineralization. Continued long-term use of ammoniacal or urea-based N fertilizers must be accompanied by a regular liming program if soil acidity problems are to be avoided. The main factors of concern due to decreased soil ph are increased risks of Al and Mn toxicities. The use of nitrate-based fertilizers results in a temporary increase in soil ph Uptake and Assimilation by Higher Plants Nitrate and ammonium should be regarded as separate nutrient elements due to their different reactions in plants. It is generally recognized that ammonium greens a plant while nitrate grows a plant. Ammonium is toxic to plants when absorbed and must be combined with carbon to form N compounds to prevent it from damaging the plants. If ammonium is supplied either through fertilizer application or rapid organic matter decomposition in amounts that take carbon normally utilized in the growth process, smaller plants will result. Because ammonium is incorporated into N compounds in the roots first, the first impact of high levels of ammonium will be reduced root growth. When the root system s ability to detoxify the absorbed ammonium is overloaded, ammonium ions will be translocated to the top portions of the plants. The carbon used for leaf and stem growth will be diverted to detoxify the absorbed ammonium. Ammonium uptake is optimal at neutral ph; lower uptake with increasing acidity has been observed due to the competition between hydrogen (H + ) and ammonium (NH 4+ ) ions for binding sites on plant roots. As the hydrogen ion concentration increases (or ph decreases), its competition with ammonium becomes more intense. The uptake mechanism for ammonium ions is currently unknown. Nitrate is taken up in plants via both passive and active absorption in large amounts. It is continually absorbed as long as it exists in the soil. Nitrate uptake can be depressed by ammonium. It decreases at ph levels below 4.5 and above 6.0. Reductions in uptake at high ph may be due to the competitive effects of hydroxyl ions. Nitrate and ammonium uptake are both temperaturedependent, with uptake increasing as temperature increases Nitrate Translocation Nitrate is transported upward through the xylem. Simultaneously, organic anion synthesis increases with a corresponding increase in accumulated inorganic cations (Ca, Mg, K, and Na) in roots. After absorption, nitrate can be stored in vacuoles or incorporated into organic molecules. It is reduced and incorporated into organic molecules by nitrate reductase, a light-activated enzyme whose activity is genetically controlled.
345 314 Agronomic Handbook: Management of Crops, Soils, and Their Fertility Ammonium Translocation Ammonium must be rapidly incorporated into organic molecules because free ammonium disorganizes the photosynthetic mechanism by uncoupling redox reactions and affecting the photosynthetic membrane stacks (grana) in chloroplasts Assimilation The ammonium (NH 4+ ) ion is toxic to plants and must be incorporated into N compounds immediately upon absorption. Conversely, nitrate is not toxic and can be stored in plants until utilized. Regardless of the inorganic form of N absorbed, the ammoniacal form of N is incorporated into alpha-ketoglutarate to yield glutamate in chloroplasts. This reaction is controlled by the glutamate dehydrogenase enzyme. Other amino groups may be added to glutamate residues to produce glutamine under control of the glutamine synthetase enzyme. The reactions are reductive assimilations (NADPH + H + NADP) and require energy transfer from ATP. Two glutamate residues may also be formed by transamination of alphaketo-glutarate by glutamine under the control of glutamate synthetase. A series of transaminations using glutamate and glutamine as amino group donors initiates the synthetic pathways of other essential amino acids using the corresponding alpha-keto acids as receptors Essential Role of Nitrogen Nutrition in Higher Plants Nitrogen is involved in the structures of all amino acids, proteins, and many enzymes. It is also a component of the puric and pyrimidic bases, and therefore is a constituent of RNA and DNA. Nitrogen is also present in the tetra-pyrrole rings of chlorophyll, NADH, NADPH, choline, and indoleacetic acid. It exists as free nitrate in vacuole sap. It will accumulate at substantial concentrations (>1,000 ppm) in the conductive tissues (petioles and stems) during the vegetative period of growth. Therefore, petioles of certain crops can be used as indicators of N status during the vegetative period Adequate Range and Nutritional Disorders Sufficiency Range Nitrogen contents in plants range between 1.0 and 6.0% of dry weight in leaf tissues. High N levels, however, can cause growth stimulations that may produce deficiencies of other elements (if not supplied additionally) due to dilution effects. Petiole measurements of nitrate range from 8,000 to 12,000 ppm during early growth to 3,000 to 8,000 ppm mid-season. Nitrate is concentrated primarily at the bases of the main stems and in the petioles of recently matured leaves Deficiency All N forms are mobile in plants. Therefore, N deficiency symptoms first appear on older leaves. Under N shortage, plants grow slowly and are weak and stunted. Leaves are small, the foliage color is light green to yellow, and older leaves often fall prematurely. Necrosis of leaves or leaf parts occurs at a rather late and severe stage of deficiency. Root growth is reduced and branching is restricted, but root:shoot ratio usually increases. Yield and quality are significantly reduced Toxicity Plants can tolerate excess nitrate to a much greater degree than excess ammonium. Ammonium levels can be toxic to plants if not incorporated into carbon containing N compounds after absorption. Ammonium can also restrict K uptake by competing for root uptake binding sites. When ammonium is the dominant form of N available for uptake, toxicity conditions may develop. The toxicity of ammonium ions is characterized by restricted root growth, which is often discolored, and results in a break-down of vascular tissue, thereby restricting water uptake.
346 Plant Mineral Nutrition 315 Foliar symptoms can include chlorosis and necrosis of leaves, epinasty, and stem lesions. However, a small application of an ammonium-based fertilizer at the end of the growing season on leafy vegetables or ornamentals produces a desirable darker green leaf color without reducing growth. With ammonium fertilization, secondary problems, such as K, Ca, and Mg deficiencies, often occur. Fruits may develop blossom end-rot symptoms and poor set Interactions with Other Elements Ammonium depresses the uptake of the essential cations such as K, Ca, and Mg, while nitrate depresses the uptake of essential anions (P and S). Chlorine can also compete with nitrate for uptake. Ammonium-fed plants often have higher P contents than nitrate-fed plants due to acidification of the rhizospheres with ammonium absorption and subsequent H + ion release. Ammonium applications can reduce Fe deficiencies in calcareous soils. Because the nitrate reductase enzyme requires Mo, a deficiency of Mo reduces the rate of nitrate reduction and thereby decreases N use efficiency PHOSPHORUS (P) The atomic number of phosphorus is 15; its atomic weight is Brand discovered it in 1772 and Ville proved it essential to plants in Phosphorus in Soil Phosphorus exists in the soil as: (i) calcium phosphate resulting from the weathering of primary P-bearing minerals; (ii) non-labile, or strongly bound P; (iii) organic P in humus and organic residue; and (iv) soluble and adsorbed phosphates which constitute P in solution (0.1 µg P per ml). Of the adsorbed P, only the mononuclear fraction is considered to be in equilibrium with P in solution, and therefore accessible to plants Soil Dynamics The pka values of phosphoric acid are 1, 6, and 12. In the ph range of 5.5 to 7.0, the dominant form is H 2 PO 4-, and P availability is highest. Insoluble iron phosphates and aluminum phosphates are formed at low ph, while insoluble calcium phosphates and magnesium phosphates are formed at phs above 7.0. Phosphorus released from decomposition of plant residues can be a relatively significant source of available P. Because P is relatively immobile in the soil, banding P 5 to 8 cm to the side and 3 to 5 cm below the seed is preferable to broadcast application. Flooding from rain or excessive irrigation leaches only P in soil solutions, while erosion is the major means of P removal from the soil Fertilizers Phosphorus in fertilizer is expressed as phosphate or P 2 O 5. The main sources of P are normal superphosphate (0-20-0), triple superphosphate (0-46-0), monoammonium phosphate (MAP, NH 4 H 2 PO 4, ), diammonium phosphate [DAP, (NH 4 ) 2 HPO 4, ], ammonium phosphates, ammoniated superphosphates, and potassium phosphate (KH 2 PO 4 ) Uptake and Assimilation by Higher Plants Uptake Phosphorus reaches root surfaces mainly by diffusion along a concentration gradient. However, P only moves a short distance in the soil and must be placed near roots to achieve absorption. Soil factors such as moisture, buffering capacity, and temperature, and plant factors such as root length, root mass, and intensity of mycorrhizal infection all influence the rate of P uptake by roots.
347 316 Agronomic Handbook: Management of Crops, Soils, and Their Fertility Phosphorus is taken up actively as H 2 PO - 4 and does not undergo redox changes in plants. Phosphorus in root cells and xylem sap has been measured at levels 100 to 1,000 times greater than P in soil. The absorption of P utilizes a cotransport or antiport system. The cotransport system comprises adenosine triphosphatases (ATPases) that pump H + into the apoplasts to protonate a phosphate carrier that crosses the plasmalemma. The ph in the apoplasts controls P uptake. In the antiport system, HCO - 3 is pumped out while H 2 PO - 4 is pumped in. For each H 2 PO - 4 ion absorbed, the equivalent of one OH - ion is released into the soil and that tends to increase the rhizosphere ph. Phosphorus uptake is genetically determined and differs among species and cultivars. The genetic factor is especially important in choosing rootstock materials. Phosphorus uptake is greater in early plant life and decreases with maturity Assimilation Within minutes of uptake, most P is converted to organic P (mostly hexose phosphates and uridine diphosphate) and is quickly metabolized. Phosphorus is mobile in plants and downward movement occurs mainly in the phloem as either inorganic or organic P (phosphatidylcholine); 85 to 90% of inorganic P may be stored in vacuoles, primarily as orthophosphate Phosphorus Nutrition in Higher Plants Cell Buffer System and Metabolism Regulation Because phosphoric acid (H 3 PO 4 ) is a tri-acid, its successive dissociations allow P to buffer cell ph and maintain homeostasis. Levels of inorganic P regulate the activities of enzymes such as phosphofructokinase and adenosine diphosphate (ADP) glucose pyrophosphorylase, and are involved in controlling starch synthesis and climacteric respiration during fruit ripening Energy Carrier Function The breakage of P-P bonds in diphosphate and triphosphate nucleotides (mainly adenosine triphosphate or ATP) and phosphocreatine, all release energy that may be used for biosynthesis or ion uptake. The reduction of nicotinamide adenine dinucleotide phosphate (NADP + ) into NADPH also releases energy for use in respiration, glycolysis, and CO 2 fixation Nucleotides Mono-, di- and triphosphates are constituents of nucleic acids (DNA, trna, mrna, and rrna). Uridine triphosphate (UTP) is required for sucrose and callose synthesis; cytosine triphosphate (CTP) in phospholipid synthesis; and guanidine triphosphate (GTP) in cellulose formation Energy Reserve and Other Functions Phytin is the Ca or Mg salt of phytic acid, an ester of inositol. During germination, phytin is hydrolyzed to free inorganic P that is used to form organic compounds for metabolic processes and cell walls. Phosphorus is present in membrane phospholipids (phosphatidyl inositol, phosphatidyl serine, and choline) as a lipid anchor constituent of certain lipoproteins and lipopolysaccharides Adequate Range and Nutritional Disorders Sufficiency Range Phosphorus concentrations in mature leaves range from 0.2 to 0.5%. Phosphorus content in actively growing plant parts is higher because intense anabolism requires multiple energy transfer reactions involving ATP Deficiency Phosphorus deficiency generally occurs when the P content of a plant is below 0.2%. Temporary P deficiency can be caused by low soil temperature, especially after early spring planting. This is why P as DAP is often included in the formulations of pop-up fertilizers. Phosphorus deficiency
348 Plant Mineral Nutrition 317 leads to retarded growth and lower shoot:root ratios. Symptoms include darkish green color in older leaves. Purplish areas and necrosis of leaf margins will appear. Deficiency results in low production of fruits, seeds, and flowers of poor quality Toxicity Very high P levels in growing media can depress growth, primarily by decreasing the uptake and translocation of Zn, Fe, and Cu. Toxicity occurs when the P level in tissue exceeds 1.00% Interactions with Other Elements For many crops, a 10:1 ration of N:P is considered optimum. In alkaline soils, ammonium-based fertilizers increase P availability via their acidifying effects. Increased Ca in solution increases P uptake, possibly because Ca stimulates the transport of P at the mitochondrial membranes. However, all calcium phosphate salts have low solubilities in water at high ph. Magnesium is an activator of kinase enzymes and activates many reactions involving phosphate transfers. Aluminum can form aluminum phosphates in the intercellular regions of root tips, which restrict P translocation and induces P deficiency. However, Al uptake is often accompanied by increased P uptake, and high root P levels often occur with high Al levels. It is unclear whether the P is available for use by the plants. Iron is believed to interfere with the absorption, translocation, and assimilation of P by forming iron phosphates. High levels of P will induce Zn deficiency symptoms in plants with adequate levels of Zn. Conversely, high levels of Zn have been found to interfere with normal P metabolism POTASSIUM (K) The atomic number of potassium is 15; its atomic weight is Davy discovered it in 1807 and von Sachs and Knop proved it essential to plants in Potassium in Soil Potassium in soils exists as (1) a structural component of primary and secondary minerals; (2) fixed K in the lattices of clay minerals; (3) adsorbed and exchangeable ions at the surfaces of soil colloids; and (4) solutes of soil solutions. Total K content ranges from 0.5 to 2.5% in most soils; this represents about 20 tons per acre. However, only 0.1 to 2% of total soil K is readily available to plants Soil Dynamics The weathering of K-containing feldspars results in the release of K into the soil solution for plant utilization. Potassium may also move back within the interlayers of clay particles and become trapped. Because 1 to 2 g K can be fixed by 100 g of clay minerals, this phenomenon, called K fixation, is of agricultural importance in clay-containing soils Fertilizers The main fertilizer sources of K are potassium nitrate (KNO 3 ), potassium sulfate (K 2 SO 4 ), potassium chloride (KCl) and Sul-Po-Mag (a double salt of potassium and magnesium sulfate) Uptake and Assimilation by Higher Plants Eighty-five percent of K movement in the soil is by diffusion through the water films around soil particles. Because diffusion is a relatively slow process, K fertilization may be needed to maintain high levels of exchangeable K. Rapid plant growth and uptake may deplete K in the soil around
349 318 Agronomic Handbook: Management of Crops, Soils, and Their Fertility the root surfaces. At high soil K levels, readily available soil moisture and warm temperatures increase K movement from the soil to the roots and ensure adequate levels to sustain growth Adequate Range and Nutritional Disorders Sufficiency Range In healthy, recently and fully developed leaves, the typical sufficiency range for K is 1.5 to 4% on a dry weight basis, with a N:K (w:w) ratio of 1:1. Sufficient K can be as high as 6 to 8% in the stem tissues of some vegetable crops. Highest concentrations are found in new leaves, petioles, and stems. High-yielding crops absorb 56 to 560 kg K per ha (50 to 500 lb K per acre), but many species absorb more K than they need; the excess is frequently called luxury consumption Deficiency Because K is mobile in plants, deficiency symptoms first appear in older tissues. For most vegetable crops, K deficiency symptoms are usually manifest as a light green to yellow areas around the edges and tips of older leaves. The leaves appear as if they had been burned along the edges, a deficiency symptom known as scorch. Deficient plants easily lodge and are sensitive to disease. The production of grain, fruit, and flowers and their quality and shelf life are all reduced when K is deficient Toxicity Plants with an excess of K will first become deficient in Mg, then Ca, due to induced nutrient element imbalances that upset normal K:Mg and K:Ca ratios if Mg and Ca are at the low ends of their sufficiency ranges Interactions with Other Elements Levels of K and N are closely related in most plants. In general, abundant N increases sensitivity to disease infection, while K increases resistance to infection. Nitrogen stimulates rapid, soft growth, while adequate K balances this effect by promoting the growth of firmer tissues. The responses of these elements to applications of either one are often dependent on the levels of the other. Applications of K without sufficient N may lead to decreased N content in young plants. Without sufficient K, N was found to increase in outer cabbage leaves and in tomato upper stems and leaves. In sugarcane sheath tissue, the relationship of K to N is related to the concentration of each, N rising as the percentage of K is raised or lowered beyond 2%, which is its critical value. The source of N has a bearing on the accumulation of K. At several N levels, an increase of nitrate tends to result in K accumulation, while ammonium tends to depress K concentration. Increasing Ca levels tends to nullify the negative effects of increased N on K uptake. Ammonium has a greater depressing effect on K in soil-grown plants than those grown in solution culture because it interferes with the diffusion of K from the clay lattice and competes with K for uptake. Potassium also influences the uptake and/or utilization of the two forms of N. The uptake of nitrate is affected by K, a factor thought to be one of the essential functions of K. For most vegetable crops, larger amounts of ammonium (NH 4 ) can be used without causing toxicity as the amount of K is increased in the tissue. This suggests an optimum NH 4 :K ratio for growth. In tomato, occurrence of stem lesions increases as the NH 4 :K ratio in the substrate exceeds 1:4. The relative presences of K, Ca, and Mg influence the concentration of each individual cation within the plant. Potassium seems to be the most active. It exerts a greater depressing effect on Ca and Mg than Ca and Mg exert on K. Magnesium has a greater depressing effect on K plant content than on Ca content. Calcium appears to be less antagonistic to Mg than to K. Evidently, a strong mutual antagonism exists between K and Ca, since high concentrations of both these elements seldom exist simultaneously.
350 Plant Mineral Nutrition 319 While the K:(Ca + Mg) ratio in plant tissue tends to be constant, variations are caused by the source of N, stage of growth, lime additions, and deficiencies of Mg or K. The use of nitrate favors cation uptake, although sodium nitrate can depress Ca uptake. Cation content also tends to increase with age if low levels of K are present. Total cation amounts also tend to increase as lime is added, possibly due to replacement of the H + cation on the exchange complex with mostly Ca when high- Ca content lime is applied or when both Ca and Mg are increased if dolomitic limestone is the liming material. Total equivalents of cations tend to decrease if either K or Mg is deficient. Despite the interrelationships between K and Ca + Mg in plant tissue, critical values of these elements are usually not seriously affected unless the ratio of one of these elements to another is very wide. In corn, for instance, a K:Mg ratio of 10:1 or less in the ear leaf is satisfactory, but a 14:1 ratio can lead to serious growth restriction, although both may contain more than the critical concentration of 0.3% Mg. Because K and Na ions are similar in ionic size and chemical properties, Na may replace K in several of essential roles, but K is an essential element and Na is not. Therefore, Na applications may reduce the effect of K shortage, but will not produce healthy plants when K is deficient. The extent of this substitution is dependent on plant species and the amount of K present. Sodium-for-K substitution can be substantial in plants such as sugar and table beets, spinach, turnip, and Swiss chard, but only if the level of available K is low. Substitution is small or absent in plants such as barley, buckwheat, corn, flax, millet, rape, rye, soybean, and wheat. The substitution of K by Na may make the interpretation of K status difficult for some plants. In the case of sugar beets, for example, this problem can be avoided by using the leaves rather than the petioles for K diagnosis. Under saline conditions, Na concentrations in several tropical and temperate crops may be reduced by applications of potassium chloride CALCIUM (Ca) The atomic number of calcium is 20; its atomic weight is Davy discovered it in 1807 and von Sachs and Knop proved it essential to plants in Calcium in Soil Calcium is present in various soil minerals including phosphates (apatite), silicates, sulfates (gypsum), and carbonates (calcite and dolomite). Weathering of these minerals releases Ca 2+ ions that may be adsorbed onto organic and inorganic soil colloids, thus contributing to clay flocculation, particle aggregation, and soil structure. Calcium adsorbed on the surfaces of soil colloids and in soil solutions is available for plants Fertilizers The primary sources of Ca are liming materials such as calcite, dolomite, hydrated lime, precipitated lime, and blast furnace slag. Although Ca is often called a base or basic cation, the increase in soil ph after liming comes from reactions involving carbonates and carbonic acid, and not from Ca alone. Other Ca sources have limited effects on soil ph; they include gypsum, calcium nitrate, and calcium chloride Uptake and Assimilation by Higher Plants Calcium moves in the soil mainly by mass flow. Uptake is passive and restricted to the tips of young roots where the walls of the endodermis cells are still unsuberized. Calcium uptake is reduced when root tips are damaged by nematodes or chemically altered by ions such as NH 4, Na, or Al. Calcium uptake is also depressed by competitive uptake with ammonium and K. Water stress can also depress Ca uptake by damaging root tips.
351 320 Agronomic Handbook: Management of Crops, Soils, and Their Fertility Translocation and Assimilation Calcium is translocated in the xylem mainly through the transpiration stream. Upward movement in the xylem is also facilitated by exchange sites where Ca 2+ is momentarily adsorbed and by chelation with organic acids of the xylem sap. The higher the concentration of Ca in the xylem sap, the faster it moves through the plant, preferentially toward the shoot apices of growing plants. Calcium is also transported in the phloem in very small amounts. Thus, Ca levels in plant organs largely provided through the phloem are rather low, with downward Ca movement limited. High relative humidity can reduce Ca movement to meristematic tissue, creating a Ca deficiency in the growing tips of plant tissues Nutrition in Higher Plants Most of the Ca present in cells is located in the apoplasts and vacuoles, while cytoplasmic concentrations are low. The main structural role occurs in the middle lamella between adjacent cell walls, where Ca binds with free carboxyl groups of pectines. It acts as a cement between adjacent cell walls. Ca is also involved in cell elongation in the shoots and growing tips of roots. The removal of Ca from the cell walls is part of the leaf abscission and fruit ripening processes. Applications of Ca to senescing leaves reduce the catabolytic effects of cytokinins. Therefore, post-harvest quality and rates of decay of flowers, foliage, fruits, and vegetables are dependent on Ca levels. Calcium is also involved in the expression of chilling-injury symptoms during cold storage. Calcium in vacuoles may form insoluble crystals of oxalate, carbonate, sulfate, or phosphate, thus regulating the levels of these anions at toxic levels. In the cytoplasm, the Ca calmodulin complex can allosterically activate enzymes such as cyclic nucleotide phosphodiesterase, adenylate cyclase, membrane bound Ca 2+ -ATPase, and MAD-kinase. Calcium alone is believed to directly activate mitochondrial enzymes such as glutamate dehydrogenase and several u-amylases involved in starch degradation in the chloroplasts. Calcium also stabilizes the mitotic spindle apparatus during cell division, and enhances pollen tube growth and germination. Accumulation of callose in the germination tube helps the movement of the pollen into the female cells Adequate Range and Nutritional Disorders Sufficiency Range Adequate levels of Ca in mature leaves range from 0.5 to 1.5%. About 800 ppm (0.08%) is considered chemically active. Higher levels are required to counter the effects of other ions and their negative effects on plant metabolism Deficiency Calcium deficiency is characterized by a reduction in the growth of meristematic tissues. The deficiency occurs first in the growing tips and youngest leaves because Ca is immobile in plants. Calcium-deficient leaves become deformed and chlorotic; in later stages, their margins become necrotic. Temporary deficiencies may occur when Ca levels in the xylem drop because of reduced transpiration on humid, cloudy days or during water shortages. A shortage of Ca to growing and transpiring fruits results in bitter pits of apples, tip burn, and brownheart of leafy and heading vegetables, blossom-end rot of tomato, squash, watermelon, and bell pepper, and asparagus tip deterioration. Blossom-end rot is an irreversible disorder. Exogenous applications of Ca may be used as preventive measures but will not correct existing symptoms Toxicity Symptoms of excess Ca in vegetables are uncommon, but appear mainly as Mg- or K-induced deficiencies.
352 Plant Mineral Nutrition Interactions with Other Elements Calcium uptake is affected in decreasing order by the presence of ammonium, Mg, K, and Na. Foliar Ca:Mg ratios of 2:1 and K:Ca of 4:1 are considered optimum for growth. Nitrate usually increases Ca uptake, possibly by the formation of Ca organic acid chelates released during nitrate uptake. In acid conditions, P favors Ca uptake. The formation of low solubility calcium phosphates in soils with ph >7.0 reduces Ca availability. Increases in ph after excessive liming results in induced Fe, Mn, B, or Zn deficiencies and subsequent chlorosis. In soils at ph <5.0, Ca may bind with Al and Fe hydroxides. In cells, Al toxicity is due to the competition between Al and Ca for binding sites on calmodulin. Calcium uptake by roots is restricted due to competition with Al for root uptake binding sites. Calcium and B exert synergistic effects in reducing the incidence of disorders near actively growing points MAGNESIUM (Mg) The atomic number of magnesium is 12; its atomic weight is Davy discovered it in 1808 and von Sachs and Knop proved it essential to plants in Magnesium in Soil Magnesium exists in the soil (1) in primary ferromagnesium minerals such as biotite, hornblende, olivine, or serpentine; (2) in secondary clay minerals such as chlorite, illite, vermiculite, or montmorillonite; and (3) in inorganic salts such as carbonates, sulfates, or dolomite. Magnesium is seldom associated with the organic matter complex. Magnesium in primary and secondary minerals is nonexchangeable. Exchangeable Mg adsorbed onto the surfaces of soil colloids and soluble Mg in soil solutions are available to plants over the 5.4 to 7.0 ph range. Isomorphous substitution between iron (Fe 3+ ) or aluminum (Al 3+ ) and magnesium (Mg 2+ ) ions produces positive charges on surfaces of clay minerals. Low soil ph favors weathering of ferromagnesium minerals, resulting in the release of Mg. Exchangeable Mg represents approximately 5% of the total in soil. Magnesium levels in highly leached or sandy soils are usually low. Tropical soils are generally low in Mg and require Mg fertilizer for proper growth Fertilizers Magnesium is found in liming materials primarily as dolomitic limestone. The rise in soil ph induced by these liming materials comes from reactions involving carbonates and carbonic acid, not Mg. Particle size of Mg-containing liming materials affects Mg availability as these materials have relatively low solubilities. Finely ground dolomitic limestone changes soil ph faster than coarse material. Under intensive cropping systems, Mg availability may be limited to the second or third crop. Reduced Mg availability is due to slow rate of release, not to low Mg levels. Dependency on Mg release from dolomitic lime is not adequate to support intense cropping systems and necessitates supplemental Mg fertilizer during the growth cycle. Applications of Mg in its nitrate, chloride, or sulfate forms are common and have little effect on soil ph Magnesium Uptake and Assimilation by Higher Plants Magnesium moves to the roots by mass flow. Uptake is passive, possibly mediated by ionophores in which Mg 2+ moves down an electrochemical gradient. The involvement of ionophores may explain the effect of cation competition (NH 4, K, Ca, and Na) on Mg uptake.
353 322 Agronomic Handbook: Management of Crops, Soils, and Their Fertility Translocation and Assimilation Magnesium is mobile in the phloem and can be transported from older to younger leaves or to the shoot apices. Because fruit and storage tissues depend on the phloem for their mineral supplies, they are higher in K and Mg than in Ca. In some cases, bitter pits may be due to a localized Mg toxicity rather than a Ca deficiency Nutrition in Higher Plants Magnesium found in the centers of the tetrapyrrole rings of chlorophyll molecules comprises 15 to 20% of the total Mg in plants. Another 70% is associated with anions and organic anions, malate, and citrate. Magnesium is a cofactor of kinase enzymes such as hexokinase and phosphofructokinase, which require divalent cations such as Mg 2+ or Mn 2+ for activity. These enzymes catalyze the transfer of phosphoryl groups between ATP and ADP. Magnesium is essential for the activities of the two principal CO 2 -fixing enzymes, ribulose phosphate carboxylase and phosphoenolpyruvate carboxylase. It activates ribulose phosphate carboxylase in the light reactions of photosynthesis in chloroplasts. Light triggers the import of Mg 2+ into the stroma of the chloroplasts in exchange for H + ions that provide optimum conditions for the carboxylase reaction. With its two positive charges, Mg also stabilizes the tails of phosphoryl groups in ATP and ADP by weakly binding with negative charges. Magnesium is the most important cation neutralizing the nondiffusible anions of the thylakoid membrane. It also stabilizes the ribosomes in adequate configuration for protein synthesis Adequate Range and Nutritional Disorders Sufficiency Range The normal concentration of Mg in plants ranges from 0.15 to 0.40% Deficiency Because Mg is relatively mobile in plants, deficiency symptoms develop first in older leaves. Magnesium deficiency is characterized by interveinal yellowing of the leaf blades that progresses from the edges to the centers. The most typical pattern of Mg deficiency is green conductive tissue surrounded by yellow background. Ultimately, leaves become stiff and brittle and the veins become twisted. Mg uptake is strongly influenced by ph, its availability markedly declining when the soil ph is below Toxicity In field conditions, Mg toxicity rarely occurs Interactions with Other Elements Magnesium uptake is affected in decreasing order by K, NH 4, Ca, and Na. Foliar Ca:Mg ratios of 2:1 and K:Mg of 8:1 are considered optimum for growth. Mg depresses Mn uptake. In acidic soils, Al competes with Mg for uptake at root uptake binding sites. Aluminum-induced Mg deficiency has been implicated in acid rain-induced forest declines in Europe and in tropical soils fertilized with ammonium-based fertilizers SULFUR (S) The atomic number of sulfur is 16; its atomic weight is Sulfur was known in ancient times; von Sachs and Knop proved it essential to plants in 1865.
354 Plant Mineral Nutrition Sulfur in Soil Over 90% of available S in soil is found in association with organic matter, which has a 10:1 N:S ratio. Soil organic S is found in protein and amino acids, and may be associated with Fe and Al oxides, clay minerals, or soil humus fractions. In well drained soils, inorganic S exists as: (1) soluble sulfates (SO 4 2- ) of Ca, Mg, K. Na, or NH 4 ; (2) sulfate adsorbed on clay surfaces; (3) sulfate adsorbed to Al or Fe hydrous oxides at ph <4.0; and (4) sulfates coprecipitated with natural calcium carbonates at ph >7. Most available sulfate is found at lower depths, where ph and base saturation are lower and exchangeable Al is higher. The availability of subsoil sulfate for growth depends on the crop rooting habits and on soil water movement Soil Dynamics Sulfur in soil is made available to plants from S-containing rainfall, fertilizer application, or microbial activity. Volcanic eruptions and burning of fossil fuels by automobiles and factories liberate S into the air. Rainfall then deposits it on soils. This phenomenon, called acid rain, may annually return to the soil up to 50 kg S per ha (44.6 lbs per acre). Under aerobic conditions, soil microorganisms mineralize S containing amino acids such as cysteine into sulfate, which annually releases approximately 4 to 13 kg S per ha (3.6 to 11.6 lbs per acre). In anaerobic conditions, mineralization and sulfate reduction by Desulfovitorio may produce hydrogen sulfide (H 2 S) that can be released into the atmosphere. In waterlogged soils, the degradation of organic matter releases organic sulfides such as methyl and butyl sulfides. Hydrogen sulfide may be oxidized to elemental S by chemotrophic S bacteria. When aerobic conditions are restored, H 2 S readily undergoes autoxidation to sulfate. Photosynthetic green and purple bacteria can oxidize H 2 S to S by utilizing H + for photosynthetic electron transport. When this process is restricted, hydrogen sulfide may accumulate to toxic levels and thus impair plant growth. Sulfur may be removed from soil by leaching or crop uptake, or can be lost as various gases. Sulfates adsorbed to AlOH or FeOH groups may be displaced by the electrostatic effects of excess cations or by phosphates that are more strongly adsorbed to Al and Fe oxides than are sulfates. Sulfate adsorption decreases with increasing ph, and is negligible above 6.5. The desorbed sulfate is relatively mobile in soils and may then be taken up by plants or leached. Increases in soil acidity or in amounts of Fe and Al hydroxides reduce sulfate leaching. Although plants remove almost as much S as P, larger amounts of S are lost from the growing zone through leaching, erosion, and decomposition as compared to P Fertilizers Sulfur is frequently applied as a sulfate fertilizer element because S is the accompanying anion in ammonium sulfate (24% S), magnesium sulfate (13% S), potassium sulfate (17.5% S), and calcium sulfate (18.6% S). Sulfur is also present in superphosphates since sulfuric acid is used to acidulate phosphate rock and convert P into a soluble form in the manufacture of superphosphate fertilizers Uptake and Assimilation by Higher Plants Elemental S is also available as a yellow powder that, upon addition to the soil, liberates dilute sulfuric acid and lowers soil ph. An application of 1 kg S per ha (0.89 lbs per acre) lowers the ph approximately 0.5 unit. Mass flow moves sulfates to the roots, which makes uptake dependent on soil moisture. Concentrations of 3 to 5 mg S per liter in soil solutions are adequate for most plant species. Once at the root surfaces, sulfate (SO 4 2- ) ions are actively absorbed against an electrochemical gradient. Generally, soil
355 324 Agronomic Handbook: Management of Crops, Soils, and Their Fertility ph and other nutrient elements have little influence on sulfate absorption. Sulfur may be absorbed through the stomata as SO 2 at atmospheric concentrations between 0.5 to 0.7 mg SO 2 per m 3. The N:S ratio in the growing medium may be as important as total S alone, or the ratio of sulfate S to total S. An adequate N:S ratio for most plants species is 15:1; for crucifers, 3:1; for legumes, 13:1; and for cereals, 17:1. For most crops, S uptake is similar to that of P, and ranges from 10 kg S per ha in cereals and grasses to 45 kg S per ha in crucifers. After uptake, sulfate is translocated to shoots in the xylem, may be reduced to sulfite, and is immobilized. Little downward movement occurs in the phloem. Sulfur moves in the phloem mainly in the reduced SH (thio) form. During shortage, sulfate is redistributed from roots and petioles to younger tissues. Older leaves do not contribute significantly to S supplies for younger tissues. Sulfate must be reduced before it is incorporated into the cysteine, cystine, or methionine amino acids. Sulfate reduction is most prominent in chloroplast membranes of green tissues, especially in daylight hours Nutrition in Higher Plants Several essential functions are attributed to S. Disulfide bonds are formed by two SH groups of cysteine or methionine. These bonds are involved in the tertiary structures of proteins. Sulfur is involved in the conformations and activities of many enzymes. Sulfur is also essential for the formation of glucoside oils and volatile compounds found in plants in the onion and garlic families. It promotes legume nodule formation and stimulates seed production. It also helps plants withstand low temperatures. One of the most important S-containing proteins is ferredoxin, which is involved in CO 2 assimilation, glucose synthesis, glutamate synthesis, N 2 fixation, and NO 3 reduction. Sulfur is also a constituent of coenzyme A, biotin, and thiamine. CoA is a coupling substance in the Krebs (citric acid) cycle and is important in lipid and fatty acid metabolism. Biotin is associated with carbon dioxide assimilation and decarboxylation. Thiamine acts as a coenzyme in the decarboxylation of pyruvate and oxidation of u-keto acids. Sulfur is also a component of glutathione and various plant hormones Adequate Range and Nutritional Disorders Sufficiency Range Sulfur content in leaf tissues ranges from 0.15 to 0.50% on a dry weight basis. Symptoms of S deficiency may occur in newly emerging plants and tend to disappear with root development Deficiency The main causes for S deficiencies in cultivated crops are low S or high N levels in the soil, sulfate leaching, or inadequate water regime. Sulfur deficiencies are corrected easily by soil applications of S-containing fertilizers. Because S is associated with the formation of proteins and chlorophyll, its deficiency symptoms resemble those of N deficiency. Unlike N, S is not highly mobile in plants, so S deficiency symptoms first appear on younger leaves. Initially, S-deficient plants are light yellow-green. Red or purple pigmentation may appear later. Fruits are light green and lack succulence. Roots are longer than normal, and stems become woody. The most typical symptoms of S deficiency are stunted chlorotic growth and short, thin, woody stems. Leaf area and fruit set are reduced. In legumes, root nodulation is reduced; in grain crops, maturity is delayed. In tobacco, S deficiency is needed to produce proper leaf color and burning quality Toxicity Plants are relatively insensitive to high sulfate (SO 4 ) concentrations in growing media. Although acute sulfur dioxide (SO 2 ) damage is common, its occurrence is usually localized near the source and is related to weather conditions favoring slow dispersion of the gas. Toxicities are more common
356 Plant Mineral Nutrition 325 when atmospheric concentration exceeds 0.5 to 0.7 mg SO 2 per m 3 and are generally described as water-soaked areas on the leaves that develop into well-defined dry, white necrotic spots, mainly on the undersides. At cellular level, chloroplast membranes are disrupted by excess sulfate. These toxicity symptoms may resemble N deficiency, but younger leaves will be chlorotic and foliar analysis is likely to reveal a high nitrate content due to effects of S on ferredoxin. Another internal disorder is inhibition of protein synthesis accomplished by an increase in non-s-containing amino acids such as asparagine, glutamine, and arginine. A reduction in photosynthesis is associated with low sugar and high amide N levels Interactions with Other Elements Sulfur is synergistic with N and F and is antagonistic to As, B, Mo, Pb, Se, and Fe. Sulfur and N in plants have a close relationship. Field crops require an average S:N (w:w) ratio of 1:15 for protein synthesis, ranging from 1:14 for grasses to 1:17 for legumes. Generally, additions of S will increase the N content but the degree of increase can vary with the age of the tissue. Although the S:N ratios of specific proteins are constant, they will vary at each stage of growth and among plant species. Unlike total N, plant nitrate tends to increase as S becomes limiting. The S concentration in plant proteins, which ranges from 0.5 to 3.0%, is probably responsible for the relationship of S and P because some proteins contain P SUMMARY: PLANT NUTRITION AND ESSENTIAL MICRONUTRIENTS BORON (B) The atomic number of boron is 5; its atomic weight is Gay-Lussac and Thenard discovered it in 1808 and Sommer and Lipman proved it essential to plants in Boron in Soil Total B content in soils ranges from 20 to 2,000 mg per kg (ppm); available B ranges from 0.4 to 5.0 ppm. Boron is found in primary minerals such as borax (Na 2 B 4 O 7 10H 2 O), kermite (Na 2 B 4 O 7 4H 2 O), colemanite (Ca 2 B 6 O 11 5H 2 O), ulexite (NaCaB 5 O 9 8H 2 O), kotonite [Mg 3 (BO 3 ) 2 ], and ludwigite (Mg 2 FeBO 3 ). Boron may also bind with organic matter or with carbohydrates released during humification. In most agricultural soils, B associated with humic colloids is the principal B pool for plant growth. As B-containing rocks weather, B is released into the soil solution in the nonionized boric acid (H 3 BO 3 ) form that allows B to be leached easily from the soil. Liming may decrease B availability through the action of Ca and the subsequent rise in ph. At ph above 9.2, the dominant form of B is B(OH) 4-. In this form, B may be adsorbed by sesquioxides and clay minerals, especially Fe and Al oxides Fertilizers The most common source of B is borax (Na 2 B 4 O 7 10H 2 O, 11% B). Other sources include sodium pentaborate (Na 2 B 10 O 16 10H 2 O, 18% B), Solubor (Na 2 B 4 O 7 5H 2 O and Na 2 B 10 O 16 10H 2 O, 20% B), boric acid (H 3 BO 3, 17% B), colemanite (Ca 2 B 6 O 11 5H 2 O, 10% B), and B frits (2 to 6% B). Trace B is also found in borated superphosphates. Banding is usually more effective than broadcasting B fertilizers. Application rates from 0.6 to 1.2 kg B per ha are used with most crops and may be increased from 1.2 to 3.2 kg B per ha for
357 326 Agronomic Handbook: Management of Crops, Soils, and Their Fertility legumes or sugar beets. Optimum rates of B application depend on cultural practices, rainfall, liming, and soil organic matter content. Boron may be applied via foliar sprays, especially when soils may fix B or when high H reduces availability. Borax and Solubor are the most commonly used sources of B in foliar sprays at rates from 0.5 to 1.5 kg B per ha Uptake and Assimilation by Higher Plants Most B enters the roots passively with the transpiration stream as undissociated boric acid. However, small amounts are taken up actively. Factors reducing transpiration, such as high relative humidity or drought, reduce B uptake and translocation. Once within the root-free spaces, B may associate with polysaccharides, remain free as surface film B, or become bound onto cell walls. Boron moves primarily in the xylem as a sugar borate complex. Its movement in the phloem is limited; B is relatively immobile within plants and may be lost through guttation from hydathodes Nutrition in Higher Plants Boron functions in plants are related to meristematic growth. Boron is directly involved in cell differentiation, maturation, division, and elongation. The molecular basis of this function arises because B is necessary for the synthesis of uracil, a component of RNA and a precursor of uridine diphosphate glucose. When B levels are limiting, cell division rates are reduced and the number of undifferentiated cells increases. Boron also affects the growth of pollen tubes, possibly by increasing sugar absorption and metabolism and respiration. Thus, B also exerts indirect control on germination. Several other roles are attributed to B. It may form complexes with polyhydroxy substrates, enzymes, and coenzymes to stimulate or inhibit metabolic pathways and protect indoleacetic acid oxidase by forming complexes with its inhibitors. Boron may combine with phosphogluconate to block the pentose phosphate pathway so that glycolysis is favored and phenols do not accumulate. Boron is involved also in the biosynthesis of lignin and differentiation of xylem vessels Adequate Range and Nutritional Disorders Sufficiency Range The average B content in most plants is 20 mg B per kg (ppm) on a dry weight basis. Boron is unevenly distributed within plants and the highest levels are found in reproductive structures such as anthers, stigmas, and ovaries (sometimes at levels twice those in stems). Most B in leaves accumulates in margins and tips, at levels 5 to 10 times higher than those found in blades. Boron requirements vary with plant type; in monocotyledon species, leaf content ranges from 1 to 6 ppm; in most dicotyledons, from 20 to 70 ppm; and in dicotyledons with latex systems, from 80 to 100 ppm. Crops such as sugar beet, celery, apple, pear, and grape have higher B requirements. Brassica crops such as turnips, cauliflowers, cabbages, brussels sprouts, and some legumes, also have high B requirements Deficiency Boron deficiency is the most common and widespread micronutrient problem. It is characterized by abnormal or retarded elongation of growing points and/or apical meristems. Young leaves are misshapen, wrinkled, thick, and dark. Terminal growing points die. Leaves and stems become brittle due to effects on cell wall formation or phenol accumulation. Accumulations of auxins and phenols induce necrosis of leaves and other parts. Roots are slimy, thick, bumpy, and have necrotic tips. Boron deficiency is responsible for crown and heart rot in sugar beet. Young leaves are stunted and brown or black; growing points die and the crowns rot. In turnip, B deficiency causes hollow,
358 Plant Mineral Nutrition 327 cracked roots with glassy appearances. It causes cracked roots in celery. Fruits of B-deficient plants may be small, misshapen, and of poor quality. Corky material forms in B-deficient apple fruit and tomato plants Toxicity The range between adequate and toxic levels of B is narrow. Boron-sensitive species include peaches, grapes, figs, and kidney beans. In arid areas, B may accumulate in topsoil layers due to high levels in irrigation water. Levels above 5 ppm in water are toxic for most plants. Above 10 ppm, toxicity may become visible on tolerant plants. Symptoms of toxicity are leaf tip chlorosis and necrosis, and eventually scorch and burn of leaves. Leaves drop prematurely Interactions with Other Essential Elements Low levels of B affect phosphate incorporation into nucleic acids and reduce levels of other P- containing compounds such as ATP. The adsorption of P at the roots of B-deficient plants may be reduced by half. High levels of K have been found to decrease B content. Increasing K decreases the calcium:boron ratio. Boron and Ca must be in balance for proper growth. For soybeans, the correct ratio is 500:1. For sugar beets, the ratio should be 100:1. Spraying apples with B has been effective in reducing bitter pit, a disorder related to Ca deficiency. Calcium added to soil helps decrease the incidence of B toxicity. Calcium inhibition of B uptake is especially marked in high ph soils CHLORINE (Cl) The atomic number of chlorine is 17; its atomic weight is Scheele discovered it in 1774 and Broyer et al. proved it essential to plants in Chlorine in Soil Chlorine is present in soil in primary minerals such chlorapatite [Ca 5 (PO 4 )Cl], carnallite (KMgCl 3 6H 2 O), sodalite (Na 4 Al 3 Si 3 O 12 Cl) halite (NaCl) and sylvinite (KCl). Upon weathering of these minerals, Cl - is released and remains in the soil solution. Chloride (Cl - ) is not adsorbed by soil colloids because of its negative charge. It is leached readily in most soils, and is the most common counterion for Na. Chlorine may be carried by wind to return to the soil. It may also accumulate when saline water is used for irrigation. Chlorine is present in KCl, NH 4 Cl, and CaCl Uptake and Assimilation by Higher Plants Chloride in soil follows water movements and is taken up as the Cl - anion. The greater the Cl concentration in soil solution, the greater its uptake. Chloride is taken up against an electrochemical gradient mediated by a protein carrier. It may also be taken up by aerial parts as Cl - anion or chlorine gas (Cl 2 ). Chloride is very mobile in plants. Chlorine was the last element for which essentiality was established (1954). It is required in the splitting of water (Hill reaction) during photosynthesis and enhances the evolution of oxygen (O 2 ) and photophosphorylation. It also functions in the transfer of electrons from hydroxyl ions (OH - ) to chlorophyll b in Photosystem II Adequate Range and Nutritional Disorders Sufficiency Range Chlorine levels from 50 to 200 mg Cl per kg (ppm) are common in plants. Levels are usually highest in leaf blades, followed by petioles, shoots, stems, and fruits.
359 328 Agronomic Handbook: Management of Crops, Soils, and Their Fertility Deficiency Chlorine deficiencies are fairly rare in natural conditions, although deficiencies are related to various fungus and root diseases in small grains, primarily wheat and oats Toxicity For sensitive crops, toxicity occurs at foliar levels from 0.5 to 2%. Halophytes may contain up to 4% Cl. Toxicity involves premature yellowing and burning of the leaf tips and margins. In severe cases, the leaves are bleached and necrotic in the interveinal areas, margins are scorched, and the leaves abscise. Chloride toxicity under saline conditions is due to chemical effects of large quantities of Cl - ions to detrimental competition with other essential anions such as nitrate (NO 3- ) and sulfate (SO 2-4 ), and to induced water stress due to increased water potential in the growing environment Interactions with Other Essential Elements Chloride influences NO 3 uptake by competing for exchange sites on soil colloids COPPER (Cu) The atomic number of copper is 29; its atomic weight is Copper was known in ancient times. Sommer, Lipman, and MacKinnon proved it essential to plants in Copper in Soil Most Cu in soils is insoluble and immobile between soil layers due to its binding strength. Liming and raising the ph generally decreases availability, possibly by strengthening the adsorption of Cu 2+ or Cu(OH) +. Available Cu in soils is most likely present as adsorbed Cu 2+ that can directly bind carboxylic, carbonyl, or phenolic groups of organic matter in the soil. Complexed and soluble Cu 2+ are found in the soil solution Soil Fertilizers Materials for soil and foliar applications of Cu include copper sulfates (CuSO 4 5H 2 O, 25% Cu or CuSO 4 H 2 O, 35% Cu), basic copper sulfates [CuSO 4 3Cu(OH) 2, 13 to 53% Cu], copper carbonates [CuCO 3 Cu(OH) 2, 57% Cu or CuCO 3 Cu(OH) 2, 55% Cu], copper oxides (Cu 2 O, 89% Cu or CuO, 75% Cu), and copper chelates (CuEDTA, CuHEDTA). Soil applications, generally as CuSO 4 5H 2 O, consist of a single application of 1 to 10 kg Cu per ha every few years. Foliar applications of CuSO 4 or Cu chelates at rates of 0.3 to 1 kg Cu per ha (0.27 to 0.90 lb Cu per acre) are also common. The Bordeaux mixture of copper sulfate and lime has been long used as a fungicide for grapes and other crops Uptake and Assimilation by Higher Plants Copper uptake is active and metabolically controlled. Although roots have the ability to absorb Cu 2+, the uptake of chelated Cu also occurs. Copper moves in the xylem via complexing with soluble N compounds such as amino acids. It is not mobile in plants. Approximately half the active Cu in plants is found in the chloroplasts. Concentration in shoots is highest when plants are young and decreases steadily as they mature. Most Cu in flowers is found in anthers and ovaries Nutrition in Higher Plants Copper is a component of several enzyme complexes that influence plant carbohydrate and N metabolism. Plastocyanin is a Cu-containing enzyme involved in the electron transport chain of Photosystem I. More than half the foliar Cu is associated with plastocyanin. In the mitochondria,
360 Plant Mineral Nutrition 329 Cu-containing cytochrome oxidases are components of the respiratory pathway. Other Cu-containing enzymes are involved in oxidation reactions, reducing oxygen to hydrogen peroxide or water. In thylakoid membranes and mitochondria, phenolases catalyze the oxygenation of phenols, which are then oxidized to quinones. Phenolase and lactase are involved in lignin synthesis. In chloroplasts, the three isoenzymes of superoxide dismutase prevent superoxide (O 2- ) damage by reduction to H 2 O 2. This enzyme also contains Zn atoms. In the cytoplasm and cell walls, ascorbic acid oxidase catalyzes the oxidation of ascorbic acid to L-dehydroascorbate and amine oxidases catalyze the oxidative deamination of ammonium (NH 4 )-containing compounds, including polyamines Adequate Range and Nutritional Disorders Sufficiency Range Copper content in most plants ranges from 2 to 20 mg Cu per kg (ppm). The sufficiency range in leaves is 3 to 7 ppm. Copper levels as high as 200 ppm can be found when Cu fungicides are used during crop production Deficiency Since Cu is immobile, young organs are the first plant parts to show deficiency symptoms. Effects consist of reduced or stunted growth with distortion of young leaves and growing points and necrosis of apical meristems. In chrysanthemums, lateral buds may be distorted or fail to form. Young leaves may have white or bleached tips. This occurs typically in cereals, along with reduced growth and panicle formation. Copper deficiency increases the incidence of lodging, especially when simultaneous growth occurs as a response to N fertilization. Flowering and fruiting may be affected or absent, since pollen and ovaries are very sensitive to Cu deficiency Toxicity Excess Cu can induce typical Fe deficiencies. Root growth may be stunted, with little lateral root formation, possibly due to membrane damage by excess Cu. Legumes are generally more sensitive to high Cu levels than other plants. Low ph, particularly in subsoil, may restrict root growth Interactions with Other Essential Elements High levels of N increase requirements for Cu since it is bound to amino acids. Increased need for Cu may also be related to the dilution effect caused by plant growth. In citrus, heavy or prolonged use of P fertilizers induces Cu deficiencies. Potassium-containing foliar sprays on pecans reduced levels of foliar Cu. In citrus and lettuce, high Cu levels induced Fe chlorosis. Copper significantly inhibits the uptake of Zn, and vice versa. Zinc is believed to interfere with Cu at the absorption site. Copper may stimulate the uptake of Mn. It also interferes with the role of Mo in the enzymatic reduction of nitrate. A mutual antagonism has been found between Cu and Mo in some plants. If one element is in excess, application of the other alleviated negative symptoms. Aluminum adversely affects Cu uptake IRON (Fe) The atomic number of iron is 26; its atomic weight is Iron has been known since ancient times and von Sachs and Knop proved it essential to plants in Iron in Soil Iron is present in large amounts (up to 5% of soil) in primary minerals such as ferromagnesium silicates (olivine, augite, hornblende, and biotite) and oxides (hematite and magnetite), but little correlation exists between total and available Fe in soil. As weathering of primary mineral occurs,
361 330 Agronomic Handbook: Management of Crops, Soils, and Their Fertility Fe appears in clay minerals and may accumulate as hydrous oxides. Iron chemistry in the soil is complex, and depends largely on ph and redox potential. Soluble inorganic forms include Fe 3+, Fe(OH) 2+, and Fe 2+. Ferrous iron (Fe 2+ ) is stable as long as low ph and nonoxidizing conditions prevail. However, in the solutions of well aerated soils, Fe 3+ is the dominant form Fertilizers Most Fe deficiencies are due to reduced availability in an unfavorable ph range, not to low Fe levels. The mobility of soluble Fe does not exceed 1.5 cm. Hence, foliar fertilization with ferrous sulfate (FeSO 4 ), ferrous chloride (FeCl 2 ), or Fe chelates at rates of 3 to 5 kg Fe per ha (2.7 to 4.5 lb Fe per acre) are preferable to soil applications Uptake and Assimilation by Higher Plants The ferric (Fe 3+ ) form is dominant in soil, but ferrous (Fe 2+ ) is the physiologically active form. Hence, Fe has to be oxidized before assimilation. Iron uptake and nutrition are genetically controlled and not totally understood. Two mechanisms of Fe uptake have been identified in root tips and hairs. In the plasmalemmas of root cells near the root surfaces, Fe 3+ is reduced to Fe 2+ by the release of electrons and protons (Strategy 1). This release increases the activity of Fe 3+ reductase. In Strategy 2, Fe 3+ is taken up after chelation with plant-synthesized molecules called phytosiderophores. Ferric Fe may be oxidized in the roots or translocated as Fe 3+ associated with citrate. Oxidation is thought to occur in the stems. Iron is transported in the xylems, mainly to the chloroplasts, where its levels are controlled by reversible binding with ferric phosphoprotein and phytoferritin Nutrition in Higher Plants Essential roles of Fe are related to changes in oxidation reduction states and electron transfer reactions. Iron is a component in enzyme systems such as cytochrome oxidases, catalases, peroxidases, cytochromes, and heme-containing pigments. It it also a component of ferredoxin, a protein required for nitrate reduction, sulfate reduction, N 2 assimilation, and energy production via NADP). Indirect roles attributed to Fe include chlorophyll and protein synthesis, root tip meristem growth, and control of alanine synthesis Adequate Range and Nutritional Disorders Sufficiency Range The sufficiency range for Fe is not clearly established, although the range is 50 to 75 mg Fe per kg (ppm) in normal tissues Deficiency Symptoms of Fe deficiency are similar to those of Mg because both play roles in chlorophyll production. However, because Fe is not mobile (Mg is), symptoms of Fe deficiency appear first on young leaves. Interveinal chlorosis appears. As the severity of the deficiency increases, chlorosis spreads to older leaves, which turn white and dry. Amino acids and nitrate (NO 3 ) tend to accumulate when plants are Fe-deficient. Iron is unique among micronutrients because its availability and uptake can be influenced by plants. Plants within species are Fe-efficient or Fe-inefficient. Iron-efficient plants can acidify the rhizosphere and/or release siderophores that enhance Fe uptake Toxicity Iron toxicity develops as a bronzing of the leaves, followed by tiny brown spots. It can often accumulate to 300 to 400 ppm without inducing toxicity.
362 Plant Mineral Nutrition Interactions with Other Essential Elements An increase in ph (>7.0) after liming can result in Fe chlorosis, due primarily to the availability of Fe as ferric hydroxide at higher ph rather than the inhibitory effect of bicarbonate on Fe movement within plants. Nitrogen accentuates Fe deficiency due to increased growth of tissues. Nitrate-induced high ph levels in the root-free spaces and rhizospheres can restrict Fe uptake due to the effects of ph on Fe availability. High levels of P decrease the solubility of Fe in plants. A P:Fe ratio of 29:1 is considered optimal for most plants. Potassium increases mobility and solubility of Fe in plants and may indirectly increase the rate of Fe uptake. Potassium is involved in maintaining the osmotic equilibrium of Strategy 1 for Fe uptake, and in the synthesis of phytosiderophores and organic acids of Strategy 2. Each of these micronutrients competes with Fe for uptake. Chloride may enhance Fe uptake MANGANESE (Mn) The atomic number of manganese is 25; its atomic weight is Scheele discovered it in McHargue proved it essential to plants in Manganese in Soil The weathering of primary Mn-containing ferromagnesium minerals forms secondary minerals such as pyrolusite (MnO 2 ) and manganite [MnO(OH)]. Manganese is also found in soils as Mn and Fe oxides, in part adsorbed at the surfaces of clay minerals. Anaerobic and acidic conditions favor the release of Mn into the soil solution, which is the most important fraction for plant nutrition. At slightly acidic ph, Mn 3+ increases; at ph above 8, Mn 4+ may be found. The availability of Mn depends also on organic matter content and microbial activity. Mn availability is significantly affected by soil ph; availability increases with decreasing ph, soil with temperature, organic matter content, and the form and method of fertilization. Mn 2+ is easily leached from the soil. Common fertilizer sources are MnSO 4 and MnCl 2. Manganese is also available in a chelated EDTA form Uptake and Assimilation by Higher Plants As with Ca and Mg, the other essential divalent cations, Mn uptake is competitive and metabolically mediated. Levels of Mn in the roots are generally low. Manganese is mainly translocated in the xylems as Mn 2+ or weakly combined with organic acids, preferentially to meristematic tissues. It is relatively immobile in plants Nutrition in Higher Plants Changes between Mn 2+ and Mn 3+ allow Mn to be involved in oxidation reduction and act as a cofactor for nitrite reductase, hydroxylamine reductase, indoleacetic oxidase, RNA polymerase, phosphokinases, and phosphotransferase. Manganese is a component of superoxide dismutase, which neutralizes the free radicals formed by the splitting of water during the Hill reaction in photosynthesis. Similarly, Mn and superoxide dismutase may be involved in controlling the amounts of superoxides and free radicals generated by ozone and atmospheric pollutants. Manganese is involved in pollen germination and growth of the pollen tubes Adequate Range and Nutritional Disorders Sufficiency Range Foliar levels of Mn range from 10 to 200 mg per Mn kg (ppm); the sufficiency range is from 10 to 50 ppm.
363 332 Agronomic Handbook: Management of Crops, Soils, and Their Fertility Deficiency Symptoms of Mn deficiency vary among plant species and often appear similar to deficiencies of Fe and Zn. One symptom is chlorosis between the veins of older leaves Toxicity Manganese toxicity usually occurs in acid (ph <5.4) soils. Tolerance to Mn toxicity is speciesand cultivar-dependent. Manganese toxicity appears as marginal yellowing of young leaves; central areas remain green. Necrotic spots may appear on various parts of leaves. High Mn levels in tree fruits appear as black specks (called measles) on stems and fruit Interactions with Other Elements Nitrate-fed plants take up larger quantities of Mn than ammonium (NH 4 )-fed plants. However, high ammonium fertilization can increase Mn uptake due to the acidification of the rhizospheres and increase availability for absorption. Phosphorus increases Mn uptake and Mg depresses Mn uptake by competition. Increased ph reduces Mn solubility and uptake which can create a deficiency. Toxicity can occur in acid oil. Iron Mn antagonism involves competition for absorption, interference in translocation, and possibly interference at functional sites in plants MOLYBDENUM (MO) The atomic number of molybdenum is 42; its atomic weight is Hzelm discovered it in Arnon and Stout proved it essential to plants in Molybdenum in Soil The main reservoir of Mo in the soil is molybdenite sulfide (Mo 2 S). Molybdenum is found as a relatively insoluble salt in association with P, Ca, or Fe, and in association with organic matter. The weathering of these materials and the decomposition of organic matter release MoO 4 - into the soil solution. At low ph, Mo precipitates with Fe or Al. Foliar applications of Mo at 50 to 100 g NaMoO 4 in 500 liters are used to correct deficiencies Uptake and Assimilation by Higher Plants Molybdenum is taken up as the molybdate anion (MoO 4- ) and translocated, preferentially to the leaves Nutrition in Higher Plants Molybdenum is an essential component of nitrate reductase (NR) and nitrogenase (NI). NR catalyzes the conversion of nitrate (NO 3 ) into nitrite (NO 2 ) during assimilatory nitrate reduction. Nitrogenase is required for the fixation of atmospheric nitrogen (N 2 ). In theory, plants fed exclusively with ammonium (NH 4 ) have no requirements for Mo Adequate Range and Nutritional Disorders Sufficiency Range The sufficiency range for Mo is 0.15 to 0.30 mg Mo per kg (ppm). Of all the essential nutrient elements, Mo is required in the smallest amount Deficiency Molybdenum deficiencies may occur in leached, acid sandy soils or in soils naturally low in Mo. The Mo present in seed crops is usually sufficient to satisfy the requirements of developing plants. Deficiencies usually develop over several plant generations.
364 Plant Mineral Nutrition 333 The most obvious symptom is leaf chlorosis resembling N deficiency. The chlorosis results from the need for Mo in nitrate reduction. It is followed by marginal curling and wilting, then withering and necrosis of the leaves. The symptoms initially appear in older leaves, then in younger leaves, until the growing points are killed. In some Brassica species, the condition known as whiptail, described as distorted leaf blades with the leaves showing perforations and/or marginal scorching, is due a Mo deficiency. Intensive agriculture on sandy, acid-leached, and/or tropical soils require frequent Mo applications to support plant growth Toxicity Molybdenum toxicity seldom occurs in the field, although some plants may contain over 15 ppm Mo. Molybdenum levels above 5 ppm in grasses can be toxic to grazing animals Interactions with Other Elements Molybdenum uptake is inhibited by sulfates and enhanced by phosphates. During initial nutrient absorption, sulfates compete directly with molybdate for absorption sites on roots. Phosphates replace molybdate from the anion exchange sites at the surfaces of soil colloids. This increases Mo concentration in the soil solution and availability to plants ZINC (Zn) The atomic number of zinc is 30; its atomic weight is Zinc has been known since ancient times. Sommer and Lipman proved it essential to plants in Zinc in Soil The main primary mineral containing Zn is sphalerite, a sulfide mineral. In some silicate minerals, Zn substitutes for Fe and Mn. It is present in augite, biotite, and hornblende. After weathering of primary minerals, Zn may become adsorbed at the surfaces of clay particles, bind with organic matter, form hydrous oxide complexes, or remain in soil solution. The main sources are zinc sulfates (ZnSO 4 H 2 O, ZnSO 4 6H 2 O, and ZnSO 4 7H 2 O) applied at rates from 50 to 100 kg ZnSO 4 per ha (44.7 to 89.3 lb per acre), depending on soil test results. Banding zinc fertilizers is preferable over broadcasting because Zn does not move in the soil. Other sources include zinc ammonium nitrate, zinc nitrate [(Zn(NO 3 ) 2 6H 2 O)], and zinc chelates. Amendments of chicken litter and animal manure also supply significant but variable amounts of Zn Uptake and Assimilation by Higher Plants Zinc availability is related to its mobility; up to 95% of the Zn in soil moves by diffusion. Diffusion gradients and root depletion zones have been observed. Factors that limit the rate of diffusion of Zn to plant roots also reduce Zn availability. This is probably the most important reason why Zn deficiency often occurs on compacted soils or where root growth is restricted. Zinc is taken up mainly as the Zn 2+ cation, although ZnCl 2 and Zn chelates may also be absorbed. The uptake of Zn 2+ is active and metabolically controlled. Zinc is transported radially across roots to the endodermis through the symplast to the xylem. Zinc is present in the xylem sap as an ion and does not appear to form complexes. It may move in the xylem by successive bindings to stable, slowly exchanging ligands as observed with Cu 2+ and Fe Nutrition in Higher Plants The role of Zn is similar to that of manganese (Mn 2+ ) and magnesium (Mg 2+ ) ions and Zn is involved in binding substrate and enzyme in several enzyme systems. Carbonic anhydrase activity is highly
365 334 Agronomic Handbook: Management of Crops, Soils, and Their Fertility dependent on Zn supply. This enzyme promotes hydrolysis and hydration reactions involving carbonyl groups. It is localized in the cytoplasm of the chloroplast where it catalyzes the reaction between CO 2 and H 2 O to form carbonic acid (H 2 CO 3 ). Because the enzyme concentrates in the stroma, it protects proteins from denaturation resulting from local ph changes associated with hydrogen ion pumps and the incorporation of CO 2 into ribulose 1,5 bisphosphate. In the cytoplasm, alcohol dehydrogenase catalyzes reduction of acetaldehyde to ethanol as part of glycolysis. In higher plants, this reaction occurs mainly in meristematic zones. Alternatively, in anaerobic respiration, Zn 2+ catalyzes lactic acid dehydrogenase for the conversion of pyruvic acid to L-lactic acid. In one of the three types of superoxide dismutase, the metal prosthetic group includes Zn and Cu. In the chloroplast, this enzyme catalyzes the conversion of the superoxide radical, O 2-, to hydrogen peroxide (H 2 O 2 ) and oxygen, protecting aerobic organisms from damage caused by oxygen. The H 2 O produced is hydrolyzed by catalase. In the absence of Zn, RNA polymerase is inactivated and RNA synthesis is impaired. Zinc deficiency is closely related to inhibition of RNA synthesis. The deficiency prevents the normal development of chloroplast grana. Zinc also stabilizes cytoplasmic ribosomes. It is required for enolases, glutamate dehydrogenase, D-glyceraldehyde-3-phosphate dehydrogenase, L- and D-lactic dehydrogenase, D-lactic cytochrome-c reductase, malic dehydrogenase, and aldolase. Some of the enzymes activated by Zn 2+ can be activated by other divalent cations as Mg 2+, Mn 2+, Cu 2+, or Ca 2+. Indirect evidence indicates that Zn is required to synthesize indoleacetic acid from tryptophan and may have a role related to starch formation in plant metabolism Adequate Range and Nutrition Disorders Sufficiency Range The sufficiency range for Zn in leaves is 15 to 50 mg Zn per kg (ppm). While Zn is present throughout plants, it is preferentially retained by the root systems Deficiency One Zn deficiency symptom is chlorosis in the interveinal areas of leaves. The areas turn pale green, yellow, or even white. In monocotyledon species and particularly in maize, chlorotic bands form on both sides of the mid-ribs. In fruit trees, leaf development is restricted and unevenly distributed clusters or rosettes of small stiff leaves are formed; fewer buds appear and many remain closed. Symptoms of Zn deficiency in vegetable crops are more species-related than deficiency symptoms of other nutrient elements. Zinc deficiency is usually characterized by short internodes and chlorotic areas on older leaves Toxicity At levels above 200 mg Zn per kg (ppm), Zn toxicity reduces root growth and leaf expansion, followed by chlorosis. High levels of Zn in the soil may also induce Fe, Mn, or P deficiencies Interactions with Other Elements Excessive P interferes with Zn uptake, translocation, and metabolism. Excessive Zn depresses Fe uptake and can result in the development of Fe deficiency symptoms. REFERENCES 1. Arnon, A.I. and Stout, P.R., 1939, The essentiality of certain elements in minute quantity for plants with special reference to copper, Plant Physiol., 14, Best Managment Practices Begin with the Diagnostic Approach, 1991, Potash & Phosphate Institute, Norcross, GA.
366 Part V Diagnostic Procedures for Soil and Plant Analysis
367
368 11 Soil Analysis 11.1 INTRODUCTION The management of a cropping system requires periodic evaluation that includes systematic testing. Knowing the physical and chemical status of the soil and the crop before and during the growing season are essential requirements for profitable production. This section focuses on the techniques of soil and plant analysis along with a discussion of diagnostic approaches. Many publications discuss these topics. The objective here is to present an overview of the basic principles and techniques associated with each of these procedures. In 1951, the National Soil Test Work Group 1 stated, There is good evidence that the competent use of soil tests can make a valuable contribution to the more intelligent management of the soil. The objectives of soil testing have changed little since they were first presented over 50 years ago: 1. To group soil into classes for the purpose of suggesting fertilizer and lime practices. 2. To predict the probability of getting a profitable response to the application of plant nutrient elements. 3. To help evaluate soil productivity. 4. To determine specific soil conditions that may be improved by addition of soil amendments or cultural practices. Soil testing as practiced today fits Objectives 1 and 2. Farmers and growers routinely test soil to determine lime and fertilizer needs. Although acceptance of the first two objectives is nearly unanimous, opinions still differ about the practical application of Objective 2 (soil test interpretation in terms of the recommended application rates of fertilizer). Adjustments can be made on the basis of crop requirement, anticipated yield, management skill of the farmer, and economic goals. Objectives 3 and 4 advocate soil testing for diagnostic reasons to show how test results can describe general conditions of the soil. From a long-term view, these objectives have far more importance than was generally recognized in the 1950s. Although soil testing has a long development and application history, test performance still needs improvement. Modern analytical capabilities are advancing faster than test methodology. However, most soil testing procedures in use today are adequate to evaluate soil fertility status. Change is proceeding in several directions, including universal single-extraction reagent methods, repeated extractions, and equilibrium solutions. Soil testing is the only means of specifying lime and fertilizer needs and describing nutrient element fertility status correctly. Without soil test results and/or without following recommendations based on soil tests, random lime and fertilizer use would seldom allow production of successful crop yields free of nutrient element stress. Unfortunately, such stresses are still common. About a quarter of the world s land surface is affected by some type of naturally occurring elemental stress. Even the best naturally fertile soils will suffer from intensive cropping if proper techniques are not followed to: 337
 Micronutrients (B, Cl, Cu, Fe, Mo, Mn, Zn) Other elements")
369 338 Agronomic Handbook: Management of Crops, Soils, and Their Fertility Replace crop-removed nutrient elements Counter acidification Maintain proper nutrient element balances for optimum growth TABLE 11.1 Soil Tests Based on Objectives Test Water, salt, and buffer ph levels Extractable elements: Major elements (P, K, Ca, Mg, NO 3, SO 4 ) Micronutrients (B, Cl, Cu, Fe, Mo, Mn, Zn) Other elements (Al, Na) Trace elements and heavy metals (As, Cd, Co, Cr, Cu, Mn, Pb, Ni) Organic matter content Mechanical analysis Soluble salts Objective Soil reaction and lime requirement Nutrient element status Nutrient element status Toxicity Toxicity Physical and chemical characteristics Soil texture classification Total salts in soil solution 11.2 SEQUENCE OF PROCEDURES The value of a soil analysis result is no better than the quality of the sample assayed, determined by: (1) how the sample was taken from the field, (2) what conditions existed during transport to the laboratory, (3) the preparation techniques applied to the sample, (4) sample aliquot measurement, (5) laboratory factors, and (6) sample storage. Soil analysis follows a series of steps with field sampling, progressing to laboratory analysis, and eventually to interpretation as shown in Figure FIGURE 11.1 Sequence of soil analysis test procedure SAMPLING Soils vary horizontally and vertically and the variation requires careful sampling technique. Topography and soil type are common factors for determining where, within sampling boundaries, to collect a single soil composite. The three most common sampling strategies are:
370 Soil Analysis Simple random sampling 2. Stratified random sampling selecting individual soil cores in a random pattern within a designated area 3. Systematic or grid sampling Statistical considerations determine which method of sampling best defines the area under test evaluation. The depth of sampling is determined by any of several factors: horizonal characteristics (limiting depth to one soil horizon), depth of soil mixing for land preparation, and rooting depth of the growing or to-be-grown crop. Because most field soils are not homogeneous naturally or because of past and/or current cultural practices, the challenge is to obtain a sample that is representative of the field under test. The common procedure is to take a number of individual cores to form a composite; the number of cores required to comprise a single composite sample ranges from as few as 4 to as many as 16. Several studies show that variance for a determined soil test parameter is not substantially reduced by increasing the number of cores beyond 8. It is better to composite fewer cores and submit more multiple composites to a laboratory for analysis so that the mean analysis results for several composite samples are treated as a soil test value accompanied by a variance or range. Although this practice increases the time for and cost of soil testing, the variance detemined for the field under test adds a valuable factor to the test result. The area represented by one composite soil sample is also an important consideration. Here again opinions vary considerably about the best procedure to follow. Some scientists recommend at least one composite per 5 acres (2 ha); others suggest one composite per 100 acres (40 ha). The decision becomes a management choice with or without knowledge of the homogeneity or lack of it in the field under test. Until the soil test level of a field is firmly established, it is best to divide it into equal-sized sections of no more than 10 acres (4 ha) each, and to gather a composite from each section. The soil test level is then determined by averaging the sum (with outliers discarded) of the test values of all the composites collected. Coring should be random while avoiding areas that are markedly different in elevation and soil type. Coring should not be done near roads, fence rows, buildings, or tree lines. In fields to be treated as single units with soil type differences, cores from the differing soil types should not be mixed. Composites should be prepared from each major soil type for separate laboratory analysis. Some have suggested that, instead of dividing a field into equal-sized blocks, first divide it based on differences in soil type, and then further subdivide it into equal-sized blocks for sampling and compositing. Such a procedure is repeated until a pattern of homogeneity is established and previously separate sections can be combined to establish new boundaries for compositing. The recommended procedure is to core to the plow (mixing) depth or to the depth of soil occupied by most plant roots in unplowed soils. Surface and subsurface (below plow depth) layers should not be mixed. Both horizons should be kept separate for individual analysis and interpretation. Normally, subsurface soils are not collected for analysis unless for specific purposes, such as for deep-rooted crops or when past nutrient element stress suggests a possible significant subsoil infertility problem. Deep soil profile samples are required for tests such as nitrate-nitrogen (NO 3 -N). Normally, sampling instructions do not specify a best time to collect samples, although some tests involve seasonal cycles. The best time when seasonal effects are minimal is midsummer to early fall. Some recommend sampling when plant tissue samples are collected for analysis, normally during mid or late summer months. However, the best time of the year for sampling is probably of less importance than taking samples at the same time each year so that test results can be tracked. The following procedure for field sampling is recommended: for plowed fields, core to the plow depth; in unplowed planted or to-be-planted-in-row-crops fields, core to the depth at which at least 75% of the plant roots will be found. By using varying rate applicators, lime and fertilizer application rates can be based on prepared grid maps that outline the areas of similar soil ph and levels of extractable elements. A range of
371 340 Agronomic Handbook: Management of Crops, Soils, and Their Fertility FIGURE 11.2 Hand tools for soil testing. sampling techniques can be used to base the grid patterns, and lime and fertilizer application rates may be adjusted to maximize probable crop response and/or effect a reduction in soil ph and level of element variability. Various devices can be used to collect soil cores; the more common types are Hoffer soil sampling tubes or soil augers as shown in Figure Hydraulic-driven truck or offroad vehiclemounted sampling devices can speed sample collection SOIL ANALYSIS PROCEDURES SOIL ph TESTING See Chapter 8 for extensive discussion of soil ph, testing methods, and interpretation of test results.
372 Soil Analysis TESTING FOR PHOSPHORUS TABLE 11.2 Phosphorus Testing Procedures Test Introduction Date Adapted Range of Soil Properties Morgan 1941 Acid soils with CECs below 10 meq/100 g Bray P Acid soils (ph w <6.8) of moderate texture Bray P Acid soils in which rock phosphate is the primary P source and most P is in forms of calcium phosphate Mehlich No Acid (ph w <6.5) coastal plain soils with low CECs (<10 meq/100 g) and low organic matter content (<5%) Olsen 1954 Calcareous, alkaline, or neutral ph soils; P is mostly in various forms of calcium phosphate AB-DTPA 1977 Calcareous, alkaline, or neutral ph soils; P is mostly in various forms of calcium phosphate; extractable P is highly correlated with Olsen P Mehlich No For a wide range of acid soils with extracted P correlating well with Bray P1 P for acid soils and with Olsen P for calcareous, alkaline, or neutral soils 0.01M CaCl 2 2H 2 O 2000 All soils TABLE 11.3 Recommended Phosphorus Tests for Soils in U.S. Geographic Regions Test For Soil Type Northeast South North Central West Mehlich No. 3 a Acid and calcareous Mehlich No. 1 a Acid to neutral + + Bray/Kurtz Acid to neutral Olsen Calcareous + + AB-DTPA a Calcareous + + Morgan/modified Morgan a Acid to neutral + + a Multi-element extract that can be used to test for K, Ca, Mg, and trace elements. Source: Relevance of Soil Testing to Agriculture and the Environment, Issue Paper 15, June 2000, CAST, Ames, IA. With permission.
373 342 Agronomic Handbook: Management of Crops, Soils, and Their Fertility TABLE 11.4 Phosphorus Extraction Reagents Test Extraction Reagent Soil Aliquot (g) Extractant Volume (ml) Shaking Time (min) Morgan 0.7N NaC 2 H 3 O N CH 3 COOH, ph 4.8 Bray P1 0.03N NH 4 F N HCl Bray P2 0.03N NH 4 F NHCl Mehlich No N HCl N H 2 SO Olsen 0.5N NaHCO 3, ph AB-DTPA 1M NH 4 HCO M DTPA, ph Mehlich No N CH 3 COOH N NH 4 F cm N NH 4 NO N HNO M DTPA Calcium chloride 0.01M CaCl 2 2H 2 O TABLE 11.5 Phosphorus Extraction Reagents: Preparation and Procedure Bray P1 Extraction Reagent (0.03N NH 4 F in 0.025N HCl) Mix 30 ml 1N ammonium fluoride (weigh 37 g NH 4 F into a 1,000-mL volumetric flask and bring to volume with water; store in a polyethylene container and avoid prolonged contact with glass) with 50 ml 0.5N HCl (dilute 20.4 ml concentrated HCl to 500 ml with water] in a 1,000-mL volumetric flask and dilute to volume with water. Store in polyethylene. Note: Solution has a ph of 2.6 and is stable for more than 1 year. Extraction Procedure Weigh 2.0 g or scoop 1.70 cm 3 air-dried <10-mesh sieved (2-mm) soil into a 50-mL extraction vessel. Add 20 ml extraction reagent and shake 5 min on a reciprocating shaker at a minimum of 180 oscillations/min. Immediately filter through Whatman No. 2 paper, limiting filtration time to 10 min; save the filtrate. Bray P2 Extraction Reagent (0.03N NH 4 F in 0.1N HCl) Mix 30 ml 1 N ammonium fluoride (weigh 37 g NH 4 F into a 1,000-mL volumetric flask and bring to volume with water; store in a polyethylene container and avoid prolonged contact with glass) with 200 ml 0.5N HCl (pipette 20.4 ml concentrated HCl into a 500-mL volumetric flask and dilute to volume with water) in a 1,000-mL volumetric flask and bring to volume with water. Store in polyethylene. Note: Solution has a ph of 2.6 and is stable for more than 1 year. Extraction Procedure Weigh 2.0 g or scoop 1.70 cm 3 air-dried <10-mesh sieved (2-mm) soil into a 50-mL extraction vessel. Add 20 ml extraction reagent and shake 5 min on a reciprocating shaker at a mininium of 180 oscillations/min. Immediately filter through Whatman No. 2 paper, limiting filtration time to 10 min; save the filtrate. Olsen
374 Soil Analysis 343 TABLE 11.5 (CONTINUED) Phosphorus Extraction Reagents: Preparation and Procedure Extraction Reagent (0.5N NaHCO 3 ) Weigh 42.0 g NaHCO 3 into a 1,000-mL volumetric flask and bring to volume with water. Adjust ph to 8.5 with 50% NaOH or 0.5N HCl. Add mineral oil to avoid exposure of the solution to air. Store in a polyethylene container. Check ph of the solution before use and adjust if necessary. Note: Maintenance of ph at 8.5 is essential. Extraction Procedure Weigh 2.5 g or scoop 2 cm 3 air-dried <10-mesh sieved (2-mm) soil into a 250-mL extraction vessel. Add 50 ml extraction reagent and shake 30 min on a reciprocating shaker at a minimum of 180 oscillations/min. Immediately filter and collect the filtrate. Caution: Soil extraction is sensitive to temperature, changing 0.43 mg P/kg for every degree Celsius for soils containing 5 to 40 mg P/kg. Mehlich No. 1 Extraction Reagent (0.05N HCl in 0.025N H 2 SO 4 ) Pipette 4.3 ml concentrated HCl and 0.7 ml concentrated H 2 SO 4 into a 1,000-mL volumetric flask. Bring to volume with water. Extraction Procedure Weigh 5 g or scoop 5 cm 3 air-dried <10-mesh screened (2-mm) soil into a 50-mL extraction vessel. Add 25 ml extraction reagent and shake 5 min on a reciprocating shaker at a minimum of 180 oscillations/min. Immediately filter and collect the filtrate. Mehlich No. 3 Extraction Reagent (0.2N CH 3 COOH; 0.25N NH 4 NO 3 ; 0.015N NH 4 F; 0.13N HNO 3 ; 0.001M EDTA] Ammonium fluoride-edta stock reagent: Add approximately 600 ml water to a 1,000-mL volumetric flask. Add g NH 4 F and dissolve. Add g EDTA. Dissolve the mixture and bring to volume with water. Store in a plastic container. Final extraction reagent mixture: Add approximately 3,000 ml water to a 4,000-mL volumetric flask. Add 80 g NH 4 NO 3 and dissolve. Add 16 ml NH 4 F-EDTA stock reagent (above) and mix well. Add 46 ml glacial acetic acid (CH 3 COOH) and 3.28 ml concentrated HNO 3. Bring to volume with water and mix thoroughly. Achieve a final ph of 2.5 ± 0.1. Store in a plastic container. Extraction Procedure Scoop 5 cm 3 air-dried <10-mesh screened (2-mm) soil into an acid-washed 100-mL extraction vessel. Add 50 ml extraction reagent and shake 5 min on a reciprocating shaker. Immediately filter; collect the filtrate and save for elemental content determination. Store in a plastic container. Morgan Extraction Reagent (0.5N NaC 2 H 3 O 2 3H 2 O) Weigh 100 g sodium acetate (NaC 2 H 3 O 2 3H 2 O) into a 1,000-mL volumetric flask. Add about 900 ml water. Add 30 ml glacial acetic acid (CH 3 COOH), adjust the ph to 4.8, and bring to volume with water. Wolf Modification Extraction Reagent Weigh 100 g sodium acetate (NaC 2 H 3 O 2.3H 2 O) into a 1,000-mL volumetric flask and add about 300 ml water. Add 30 ml glacial acetic acid (CH 3 COOH) and 0.05 g DTPA (diethylenetriaminepentaacetic acid). Dilute to 950 ml with water, adjust the ph to 4.8, and bring to volume with water. continued
375 344 Agronomic Handbook: Management of Crops, Soils, and Their Fertility TABLE 11.5 (CONTINUED) Phosphorus Extraction Reagents: Preparation and Procedure Extraction Procedure Scoop 5 cm 3 air-dried <10-mesh sieved (2-mm) soil into a 50-mL extraction vessel. Add 25 ml extraction reagent and shake 5 min on a reciprocating shaker at a minimum of 180 oscillations/min. Immediately filter and save the filtrate. Ammonium Bicarbonate-DTPA (AB-DTPA) Extraction Reagent (1M NH 4 HCO 3 -DPTA) Obtain 0.005M DTPA (diethylenetriaminepentaacetic acid) solution by adding 9.85 g DTPA (acid form) to 4,500 ml water in a 5,000-mL volumetric flask. Shake constantly for 5 hr to dissolve the DTPA. Bring to 5,000 ml with water. The ph of the solution is stable. To 900 ml of the 0.005M DTPA solution, add g NH 4 HCO 3 gradually and stir gently with a rod to facilitate dissolution and prevent effervescence when bicarbonate is added. Dilute solution to 1,000 ml with the 0.005M DTPA solution and mix gently with a rod. Adjust ph to 7.6 with slow agitation with a rod by adding 2M HCl. Store the ammonium bicarbonate-dtpa solution under mineral oil. Cheek the ph after storage and adjust dropwise with 2M HCl if necessary. Note: The cumulative volume of HCl added should not exceed 1 ml/l, after which a fresh solution should be prepared. Extraction Procedure Weigh 10 g air-dried <10-mesh sieved (2-mm) soil into a 125-mL conical flask. Add 20 ml extraction reagent and shake on an Eberbach or equivalent reciprocal shaker for exactly 15 min at 180 cycles/min with flasks kept open. Immediately filter the extracts through Whatman No. 42 paper and save the filtrater. 0.01M Calcium Chloride Extraction Reagent (0.01M CaCl 2 2H 2 O) Weigh 1.47 g calcium chloride dihydrate (CaCl 2 2H 2 O) into a 1000-mL volumetric flask and bring to volume with water. Comment: CaCl 2 2H 2 O may absorb water on standing and should be standardized by titration with EDTA at ph = 10 with Eriochrome black T as an indicator. Extraction Procedure Weigh 10.0 g air-dried <10-mesh sieved (2-mm) soil into a 250-mL polystyrene bottle. Add 100 ml 0.01M CaCl 2 2H 2 O and shake mechanically at least 2 hr at room temperature (20 C; 68 F). Decant about 60 ml of the slurry into a 100- ml centrifuge tube and centrifuge 10 min at about 1,800 g. Carefully remove the supernatant for analysis. TABLE 11.6 Interpretative Values for Extractable Phosphorus Test Critical Phosphorus Values (lb/acre) Deficient Excess Morgan <3.5 >6.5 Bray P1 <30 >60 Bray P2 <30 >60 Mehlich No. 1 <30 >100 Olsen <11 >22 AB-DTPA <15 >30 Mehlich No. 3 <36 >90
376 Soil Analysis TESTING FOR CATION ELEMENTS (CA, MG, K, AND NA) TABLE 11.7 Cation Testing Procedures Test Introduction Date Adapted Range of Soil Properties Morgan 1941 Acid soils with CECs below 10 meq/100 g Ammonium acetate 1945 Acid to slightly alkaline soils Mehlich No Acid (ph w <6.5) coastal plain sandy soils of low CEC (<10 meq/100 g) and low (<5%) organic matter content Water 1965 Primarily alkaline soils AB-DTPA 1977 Calcareous, alkaline, or neutral ph soils Mehlich No Wide range of acid soils 0.01M CaCl 2 2H 2 O 2000 All soils TABLE 11.8 Cation Extraction Reagents Test Extraction Reagent Soil Aliquort (g) Extractant Volume (ml) Shaking Time (min) Morgan 0.7N NaC 2 H 3 O N CH 3 COOH, ph 4.8 Ammonium acetate 1N NH 4 C 2 H 3 O 2, ph Water Water Mehlich No N HCl N H 2 SO AB-DTPA 1M NH 4 HCO M DTPA, ph Mehlich No N CH 3 COOH N NH 4 F cm N NH 4 NO N HNO M DTPA Calcium chloride 0.01M CaCl 2 2H 2 O
377 346 Agronomic Handbook: Management of Crops, Soils, and Their Fertility TABLE 11.9 Cation Extraction Reagents: Preparation and Procedure Neutral Normal Ammonium Acetate Extraction Reagent (1N NH 4 C 2 H 3 O 2, ph 7.0) Dilute 57 ml glacial acetic acid (CH 3 COOH) with water to approximately 500 ml. Add 69 ml concentrated NH 4 OH. Caution: Use a fumehood. Add sufficient water to obtain a volume of 990 ml. After thoroughly mixing the solution, adjust the ph to 7.0 using NH 4 OH or glacial CH 3 COOH. Dilute to a final volume of 1,000 ml with water. Alternate Method Weigh 77.1 g ammonium acetate (NH 4 C 2 H 3 O 2 ) in about 900 ml water in a 1,000-mL volumetric flash. After thoroughly mixing, adjust the ph to 7.0 using 3N CH 3 COOH or 3N NH 4 OH. Bring to volume with water. Extraction Procedure Weigh 5 g or scoop 4.25 cm 3 air-dried <10-mesh screened (2-mm) soil into a 50-mL extraction vessel. Add 25 ml extraction reagent and shake 5 min on a reciprocating shaker at a mininium of 180 oscillations/min. Immediately filter and save the filtrate. Mehlich No. 1 Extraction Reagent (0.05N HCl in 0.025N H 2 SO 4 ) Pipette 4.3 ml concentrated HCl and 0.7 ml concentrated H 2 SO 4 into a 1,000-mL volumetric flask. Bring to volume with water. Extraction Procedure Weigh 5 g or scoop 5 cm 3 air-dried <10-mesh screened (2-mm) soil into a 50-mL extraction vessel. Add 25 ml extraction reagent and shake 5 min on a reciprocating shaker at a minimum of 180 oscillations/min. Immediately filter and save the filtrate. Mehlich No. 3 Extraction Reagent (0.2N CH 3 COOH; 0.25N NH 4 NO 3 ; 0.015N NH 4 F; 0.13N HNO 3 ; 0.001M EDTA) Ammonium fluoride-edta stock reagent: Add approximately 600 ml water to a 1,000-mL volumetric flask. Add g NH 4 F and dissolve. Add g EDTA. Dissolve the mixture and bring to volume with water. Store in a plastic container. Final extraction reagent mixture: Add approximately 3,000 ml water to a 4,000-mL volumetric flask. Add 80 g NH 4 NO 3 and dissolve. Add 16 ml NH 4 F-EDTA stock reagent (above) and mix well. Add 46 ml glacial acetic acid (CH 3 COOH) and 3.28 ml concentrated HNO 3. Bring to volume with water and mix thoroughly. Achieve a final ph of 2.5 ± 0.1. Store in a plastic container. Extraction Procedure Scoop 5 cm 3 air-dried <10-mesh screened (2-mm) soil into an acid-washed 100-mL extraction vessel. Add 50 ml extraction reagent and shake 5 min on a reciprocating shaker. Immediately filter and save the filtrate. Store in a plastic container. Morgan Extraction Reagent (0.5N NaC 2 H 3 O 2 3H 2 O) Weigh 100 g sodium acetate (NaC 2 H 3 O 2 3H 2 O) into a 1,000-mL volumetric flask. Add about 900 ml water. Add 30 ml glacial acetic acid (CH 3 COOH), adjust the ph to 4.8, and bring to volume with water.
378 Soil Analysis 347 TABLE 11.9 (CONTINUED) Cation Extraction Reagents: Preparation and Procedure Wolf Modification Extraction Reagent Weigh 100 g sodium acetate (NaC 2 H 3 O 2 3H 2 O) into a 1,000-mL volumetric flask and add about 300 ml water. Add 30 ml glacial acetic acid (CH 3 COOH) and 0.05 g DTPA. Dilute to 950 ml with water, adjust the ph to 4.8, and bring to volume with water. Extraction Procedure Scoop 5 cm 3 air-dried <10-mesh sieved (2-mm) soil into a 50-mL extraction vessel. Add 25 ml extraction reagent and shake 5 min on a reciprocating shaker at a minimum of 180 oscillations/min. Immediately filter and save the filtrate. Ammonium Bicarbonate-DTPA (AB-DTPA) Extraction Reagent (1M NH 4 HCO 3 -DPTA) Prepare 0.005M DTPA solution by adding 9.85 g DTPA (acid form) to 4,500 ml water in a 5,000-mL volumetric flask. Shake constantly for 5 h to dissolve the DTPA. Bring to 5,000 ml with water. The ph of the solution is stable. To 900 ml of the 0.005M DTPA, gradually add g NH 4 HCO 3 and stir gently with a rod to facilitate dissolution and prevent effervescence. Dilute to 1,000 ml with the 0.005M DTPA solution and mix gently with a rod. Adjust ph to 7.6 with slow agitation and a rod by adding 2M HCl. Store AB-DTPA solution under mineral oil. Check ph after storage and adjust dropwise with 2M HCl if necessary. Note: The cumulative volume of HCl added should not exceed 1 ml/l, after which fresh solution should be prepared. Extraction Procedure Weigh 10 g air-dried <10-mesh sieved (2-mm) soil into a 125-mL conical flask. Add 20 ml extraction reagent and shake on an Eberbach or equivalent reciprocal shaker for exactly 15 min at 180 cycles/min with flasks kept open. Immediately filter the extracts through Whatman No. 42 paper and save the filtrate. Extraction Reagent Pure water Water Extraction Procedure Weigh 5 g or scoop 4.25 cm 3 air-dried <10-mesh sieved (2-mm) soil into a 50-mL extraction vessel. Add 25 ml water, seal the vessel with a stopper, and shake 30 min on a reciprocating shaker at a minimum of 180 oscillations/min. Allow to stand 15 min to let the bulk of the soil settle. Filter the supernatant liquid. Note: Discard the initial filtrate if it is turbid. Save the filtrate. 0.01M Calcium Chloride Extraction Reagent (0.01M CaCl 2 2H 2 O) Weigh 1.47 g calcium chloride dihydrate (CaCl 2 2H 2 O) into a 1,000-mL volumetric flask and bring to volume with water. Comment: CaCl 2 2H 2 O may absorb water on standing and should be standardized by titration with EDTA at ph = 10 with Eriochrome black T as an indicator. Extraction Procedure Weigh 10.0 g air-dried <10-mesh sieved (2-mm) soil into a 250-mL polystyrene bottle. Add 100 ml 0.01M CaCl 2 2H 2 O and shake mechanically at least 2 hr at room temperature (20 C; 68 F). Decant about 60 ml of the slurry into a 100- ml centrifuge tube and centrifuge for 10 min at about 1,800 g. Carefully remove the supernatant for analysis.
379 348 Agronomic Handbook: Management of Crops, Soils, and Their Fertility TABLE Indices for AB-DTPA-Extractable Potassium Index Soil Content (mg K/kg) Low 0 60 Marginal Adequate >120 TABLE Indices for Morgan-Extractable Potassium and Magnesium (mg/kg in Soil) Index Potassium Magnesium Low Marginal Adequate >100 > EXTRACTABLE MICRONUTRIENTS (B, Cu, Fe, Mn, AND Zn) TABLE Micronutrient Testing Micronutrient Interacting Factors Method Range at Critical Level (mg/kg) Boron Crop yield goal, ph, soil moisture, texture, Hot water soluble organic matter, soil type Copper Crop, organic matter, ph, percent CaCO 3 Mehlich No Mehlich No. 3 DTPA AB-DTPA 0.15M HCl Modified Olsen s Iron ph, percent CaCO 3, aeration, soil moisture, DTPA organic matter, CEC AB-DTPA Modified Olsen s Manganese ph, texture, organic matter, percent CaCO 3 Mehlich No at ph 6.0, 10.0 at ph 7.0 Mehlich No at ph 6.0, 8.0 at ph 7.0 DTPA M HC M H 3 PO Modified Olsen s Zinc ph, percent CaCO 3, P, organic matter, Mehlich No percent clay, CEC Mehlich No DTPA AB-DTPA Modified Olsen s M HCl
380 Soil Analysis 349 TABLE Extraction Reagents for Micronutrients Mehlich No. 1 for Extraction of Zn Extraction Reagent (0.05N HCl in 0.25N H 2 SO 4 ) Pipette 4.3 ml concentrated HCl and 0.7 ml concentrated H 2 SO 4 into a 1,000-mL volumetric flask. Bring to volume with water. Extraction Procedure Weigh 5 g or scoop 5 cm 3 air-dried <10-mesh screened (2-mm) soil into a 50-mL extraction vessel. Add 25 ml extraction reagent and shake 5 min on a reciprocating shaker at a minimum of 180 oscillations/min. Immediately filter and save the filtrate. Mehlich No. 3 for Extraction of B, Mn, and Zn Extraction Reagent (0.2N CH 3 COOH; 0.25N NH 4 NO 3 ; 0.015N NH 4 F; 0.13N HNO 3 ; 0.001M EDTA) Ammonium fluoride-edta stock reagent: Add approximately 600 ml water to a 1,000-mL volumetric flask. Add g NH 4 F and dissolve. Add g EDTA. Dissolve the mixture and bring to volume with water. Store in a plastic container. Final extraction reagent mixture: Add approximately 3,000 ml water to a 4,000-mL volumetric flask. Add 80 g NH 4 NO 3 and dissolve. Add 16 ml NH 4 F-EDTA stock reagent (above) and mix well. Add 46 ml glacial CH 3 COOH and 3.28 ml concentrated HNO 3. Bring to volume with water and mix thoroughly. Achieve a final ph of 2.5 ± 0.1. Store in a plastic container. Extraction Procedure Scoop 5 cm 3 air-dried <10-mesh screened (2-mm) soil into an acid-washed 100-mL extraction vessel. Add 50 ml extraction reagent and shake 5 min on a reciprocating shaker. Immediately filter and save the filtrate elemental content determination. Store in a plastic container. Morgan for Extraction of B, Cu, Fe, Mn, and Zn Extraction Reagent (0.5N NaC 2 H 3 O 2 3H 2 O) Weigh 100 g sodium acetate (NaC 2 H 3 O 2 3H 2 O) into a 1,000-mL volumetric flask. Add about 900 ml water. Add 30 ml glacial CH 3 COOH, adjust ph to 4.8, and bring to volume with water. Wolf Modification Extraction Reagent Weigh 100 g sodium acetate (NaC 2 H 3 O HO) into a 1,000-mL volumetric flask and add about 300 ml water. Add 30 ml glacial CH 3 COOH and 0.05 g DTPA. Dilute to 950 ml with water, adjust the ph to 4.8, and bring to volume with water. Extraction Procedure Scoop 5 cm 3 air-dried <10-mesh sieved (2-mm) soil into a 50-mL extraction vessel. Add 25 ml extraction reagent and shake 5 min on a reciprocating shaker at a minimum of 180 oscillations/min. Immediately filter and save the filtrate. Ammonium Bicarbonate-DTPA for Extraction of Cu, Fe, Mn, and Zn Extraction Reagent (1M NH 4 HCO 3- DPTA) Prepare 0.005M DTPA solution by adding 9.85 g DTPA (acid form) to 4,500 ml water in a 5,000-mL volumetric flask. Shake constantly for 5 hr to dissolve the DTPA. Bring to 5,000 ml with water. The ph of the solution is stable. To 900 ml of the 0.005M DTPA, gradually add g NH 4 HCO 3 and stir gently with a rod to facilitate dissolution and prevent effervescence. Dilute the solution to 1,000 ml with the 0.005M DTPA solution and mix gently with a rod. Adjust ph to 7.6 with slow agitation with a rod by adding 2M HCl. Store the AB-DTPA solution under mineral oil. Check the ph after storage and adjust dropwise with 2M HCl if necessary. Note: The cumulative volume of HCl added should not exceed 1 ml/l, after which a fresh solution should be prepared. continued
381 350 Agronomic Handbook: Management of Crops, Soils, and Their Fertility TABLE (CONTINUED) Extraction Reagents for Micronutrients Extraction Procedure Weigh 10 g air-dried <10-mesh sieved (2-mm) soil into a 125-mL conical flask. Add 20 ml extraction reagent and shake on an Eberbach reciprocal or equivalent shaker for exactly 15 min at 180 cycles/min with flasks kept open. Immediately filter the extracts through Whatman No. 42 paper and save the filtrate. DTPA for Extraction of Cu, Fe, Mn, and Zn Extraction Reagent Weigh 1.96 DTPA into a 1000-mL volumetric flask. Add g triethanolaniine (TEA). Bring to approximately 950 ml with water. Add 1.47 g CaCl 2 2H 2 O. Bring to 1000 ml with water while adjusting the ph to exactly 7.3 with 6N HCl to achieve final concentration of 0.005M DTPA (acid form), 0.1M TEA, and 0.01M CaCl 2. Extraction Procedure Weigh 10 g or scoop 8.5 cm 3 air-dried <10-mesh sieved (2-mm) soil into a 125-mL extraction vessel. Add 20 ml extraction reagent and shake on a reciprocating shaker for 2 hr at a minimum of 180 oscillations/min. Immediately filter and save the filtrate. Note: Samples shaken longer than 2 hr will give high results because final equilibrium of metal and soil is not reached in 2 hr. 0.01M Calcium Chloride for Extraction of B, Cu, Fe, Mn, and Zn Extraction Reagent (0.01M CaCl 2 2H 2 O) Weigh 1.47 g calcium chloride dihydrate (CaCl 2 2H 2 O) into a 1,000-mL volumetric flask and bring to volume with water. Comment: CaCl 2 2H 2 O may absorb water on standing and should be standardized by titration with EDTA at ph = 10 with Eriochrome black T as an indicator. Extraction Procedure Weigh 10.0 g air-dried <10-mesh sieved (2-mm) soil into a 250-mL polystyrene bottle. Add 100 ml 0.01M CaCl 2 2H 2 O and shake mechanically at least 2 hr at room temperature (20 C; 68 F). Decant about 60 ml of the slurry into a 100- ml centrifuge tube and centrifuge 10 min at about 1,800 g. Carefully remove the supernatant for analysis.
382 Soil Analysis 351 TABLE Micronutrient Ratings and Recommendations Based on Tests with Different Extraction Reagents and Soils Micronutrient Rating b Water (ppm) Extraction Reagent Hot Crop/Soil Parameter (Rate, lb/acre) a Legume c Nonlegume ph <6.8 ph >6.8 ph <6.8 ph >6.8 Boron VL < L M H VH > N HCl (ppm) DTPA (ppm) Soil Mineral Organic Copper VL <0.3 < L M H VH >3.0 > ph <6.8 ph >6.8 Iron VL L M H VH >50 > ph <6.8 ph >6.8 Manganese VL L M H VH >50 > Low Phosphorus High Phosphorus <6.8 ph >6.8 ph <6.8 ph >6.8 ph Zinc VL <1.0 < L M H VH >8.0 > a Broadcast rates: Fe, Mn, and Zn are more efficient when applied in bands. Divide rates by three for band placement. b VL = very low; L = low; M = medium; H = high; VH = very high. c For legumes or other crops with high B requirements.
383 352 Agronomic Handbook: Management of Crops, Soils, and Their Fertility TABLE Interpretation of Hot Water- Extractable Boron Tests Category B Content (mg/ha in Soil) Insufficient <1.0 Adequate for normal growth High Excessive >5.0 TABLE Indices for AB-DTPA-Extractable Micronutrients (mg/kg in Soil) Category Copper Iron Manganese Zinc Low Marginal Adequate >0.5 >5.0 >1.0 >1.5 TABLE Classification of Micronutrients (mg/l) into Fertility Classes Micronutrient (Test) Class 1 (Very Low) Class 2 (Low) Class 3 (Medium) Class 4 (High) Class 5 (Very High) Boron (hot water) < Copper (AAAc-EDTA) a < Iron (AAAc-EDTA) < Manganese (AAAc-EDTA) < Manganese (DTPA) < Molybdenum (AAAc-EDTA) < Zinc (AAAc-EDTA) < Zinc (DTPA) < Note: Classes 1 and 5 represent the 3 to 4% of the lowest and highest values, respectively; remaining percentages are divided among the middle classes. a AAAc = acidified ammonium acetate. Source: Micronutrients and the Nutrient Status of Soils: A Global Study, 1982, Soil Bulletin 63, United Nations Food and Agriculture Organization, Rome.
384 Soil Analysis 353 TABLE Deficiency and Excess Concentration Ranges for Micronutrients Micronutrient (Method) Deficiency (mg/l) Excess (mg/l) Boron (hot water) < >3 5 Copper (AAAca-EDTA) < >17 25 Iron (AAAc-EDTA) <3 35 Manganese (DTPA + ph correction) <2 4 > Manganese (AAAc-EDTA + ph correction) < ,300 2,000 Molybdenum (AAAc-EDTA + ph correction) < Zinc (DTPA) < >1 2 Zinc (AAAc-EDTA + ph correction) < >2 30 Note: AAAc = acidified ammonium acetate. Source: Micronutrients and the Nutrient Status of Soils: A Global Study, 1982, Soil Bulletin 63, United Nations Food and Agriculture Organization, Rome. TABLE Interpretation of Micronutrient Soil Data (mg/l Soil = 1.5 kg Mineral Soil) Available Micronutrients Micronutrient (Method) Deficient Medium Excess Boron (hot water) < >3 5 Copper (AAAc-EDTA) < >17 25 Manganese (AAAc + ph correction) < >1,300 Zinc (DTPA) < >10 20 Note: Hot water = Berger and Truog (1939) Ind. Eng. Chem. Anal. Ed., 11: AAAc = 0.5M ammonium acetate + acetic acid, ph 4.7), with 0.02M Na- EDTA (Lakanen and Ervio, (1971), Suom. Maataloustiet. Seuran Julk., 123: ph corrections for Mn: at ph 6.5, factor 0.5; at ph 6, factor 1; at ph 5.5, factor 1.5. DTPA = 0.005M, ph 7.3 (Lindsay and Norwell, (1978), Soil Sci. Soc. Amer. J., 42: Source: IFA World Fertilizer Use Manual, 1992, International Fertilizer Association, Paris.
385 354 Agronomic Handbook: Management of Crops, Soils, and Their Fertility TESTING METHODS FOR OTHER IONS AND ELEMENTS TABLE Extraction Reagents for Determining Ammonium and Nitrate 2M Potassium Chloride for Extraction of NH 4 - and NO 3 -N Extraction Reagent (2M KCl) Weigh 150 g KCl into a 1,000-mL volumetric flask and bring to volume with water. Extraction Procedure Weigh 10 g air-dried <10-mesh sieved (2-mm) soil into a 125-mL conical flask. Add 50 ml extraction reagent and shake on an Eberbach or equivalent reciprocal shaker exactly 15 min at 180 cycles/min. Filter the slurry through Whatman No. 42 paper and save the filtrate. 0.01M Calcium Chloride for Extraction of NH 4 - and NO 3 -N Extraction Reagent (0.01M CaCl 2 2H 2 O) Weigh 1.47 g calcium chloride dihydrate (CaCl 2 2H 2 O) into a 1,000-mL volumetric flask and bring to volume with water. Comment: CaCl 2 2H 2 O may absorb water on standing and should be standardized by titration with EDTA at ph = 10 with Eriochrome black T as an indicator. Extraction Procedure Weigh 10.0 g air-dried <10-mesh sieved (2-mm) soil into a 250-mL polystyrene bottle. Add 100 ml 0.01M CaCl 2 2H 2 O and shake mechanically for at least 2 hr at room temperature (20 C; 68 F). Decant about 60 ml of the slurry into a 100-mL centrifuge tube and centrifuge 10 min at about 1800 g. Carefully remove the supernatant for analysis. 0.01M Calcium Sulfate for Extraction of NO 3 -N Extraction Reagent (0.01M CaSO 4 2H 2 O) Weigh 1.72 g calcium sulfate (CaSO 4 H 2 O) into a 1,000-mL volumetric flask and bring to volume with water. Extraction Procedure Weigh 5 g air-dried <10-mesh sieved (2-mm) soil into a 125-mL conical flask. Add 50 ml extraction reagent and shake on an Eberbach or equivalent reciprocal shaker exactly 15 min at 180 cycles/min. Filter the slurry through Whatman No. 2 paper and save the filtrate. 0.04M Ammonium Sulfate for Extraction of NO 3 -N Extraction Reagent [0.04M (NH 4 ) 2 SO 4 ] Weigh 5.28 g ammonium sulfate [(NH 4 ) 2 SO 4 ] into a 1,000-mL volumetric flask and bring to volume with water. Extraction Procedure Weigh 5 g air-dried <10-mesh sieved (2-mm) soil into a 125-mL conical flask. Add 50 ml extraction reagent and shake on an Eberbach or equivalent reciprocal shaker exactly 15 min at 180 cycles/min. Filter the slurry through Whatman No. 2 paper and save the filtrate. Morgan for extraction of NO 3 -N Extraction Reagent (0.5 N NaC 2 H 3 O 2 3H 2 O) Weigh 100 g sodium acetate (NaC 2 H 3 O 2 3H 2 O) into a 1,000-mL volumetric flask. Add about 900 ml water. Add 30 ml glacial acetic acid (CH 3 COOH), adjust the ph to 4.8, and bring to volume with water. Wolf Modification Extraction Reagent Weigh 100 g sodium acetate (NaC 2 H 3 O 2 3H 2 O) into a 1,000-mL volumetric flask and add about 300 ml water. Add 30 ml glacial acetic acid (CH 3 COOH) and 0.05 g DTPA. Dilute to 950 ml with water, adjust the ph to 4.8, and bring to volume with water. Extraction Procedure Scoop 5 cm 3 air-dried <10-mesh sieved (2-mm) soil into a 50-mL extraction vessel. Add 25 ml extraction reagent and shake 5 min on a reciprocating shaker at a minimum of 180 oscillations/min. Immediately filter and save the filtrate.
386 Soil Analysis 355 TABLE Extraction Reagents for Determining Sulfate Morgan Extraction Reagent (0.5N NaC 2 H 3 O 2 3H 2 O) Weigh 100 g sodium acetate (NaC 2 H 3 O 2 3H 2 O) into a 1,000-mL volumetric flask. Add about 900 ml water. Add 30 ml glacial acetic acid (CH 3 COOH), adjust the ph to 4.8, and bring to volume with water. Wolf Modification Extraction Reagent Weigh 100 g sodium acetate (NaC 2 H 3 O 2 3H 2 O) into a 1,000-mL volumetric flask and add about 300 ml water. Add 30 ml glacial acetic acid (CH 3 COOH) and 0.05 g DTPA. Dilute to 950 ml with water, adjust the ph to 4.8, and bring to volume with water. Extraction Procedure Scoop 5 cm 3 air-dried <10-mesh sieved (2-mm) soil into a 50-mL extraction vessel. Add 25 ml extraction reagent and shake 5 min on a reciprocating shaker at a minimum of 180 oscillations/min. Immediately filter and save the filtrate. 0.01M Calcium Chloride Extraction Reagent (0.01M CaCl 2 2H 2 O) Weigh 1.47 g calcium chloride dihydrate (CaCl 2 2H 2 O) into a 1,000-mL volumetric flask and bring to volume with water. Comment: CaCl 2 2H 2 O may absorb water on standing and should be standardized by titration with EDTA at ph = 10 with Eriochrome black T as an indicator. Extraction Procedure Weigh 10.0 g air-dried <10-mesh sieved (2-mm) soil into a 250-mL polystyrene bottle. Add 100 ml extraction reagent and shake mechanically at least 2 hr at room temperature (20 C; 68 F). Decant about 60 ml of the slurry into a 100- ml centrifuge tube and centrifuge 10 min at about 1,800 g. Carefully remove the supernatant for analysis.
387 356 Agronomic Handbook: Management of Crops, Soils, and Their Fertility INTERPRETATION OF SOIL TEST VALUES TABLE Definitions Related to Availability Source Definition Bray (1954) 2 Available forms of nutrient elements are forms whose variations in amount are responsible for significant variations in yield and response. The availability of these forms involves their chemical and physical natures and the ability of a plant to use its root system to forage for them. Scarsbrook (1965) 3 Available N is in the root zone in form readily absorbed by plant roots. Brady (1974) 4 The available portion of any element or compound in soil can be absorbed and assimilated by growing plants. Barber (1984) 5 An available or bioavailable nutrient element is present in a pool of ions in the soil and can move to plant roots during growth if the roots are near enough. Dahnke and Johnson Nitrogen availability indices are measurents of the potential of a soil to supply N to plants (1990) 6 when conditions are ideal for mineralization. They do not include existing inorganic N present when the soil is sampled. Peck and Soltanpour A plant-available nutrient element usually means the chemical form or forms of an essential (1991) 7 plant nutrient element in the soil whose variations in amounts are reflected in variations in plant growth and yield. Troeh and Thompson An available nutrient element is the small portion of each essential plant nutrient element (1993) 8 in the soil that is available in plants. Black (1993) 9 An available material is susceptible to absorption by plants; availability affects quantity. Biological index nutrient element availability estimate ratios of availabilities or values are proportional; actual availabilities cannot be measured. Bundy and Meisinger Available N in soils and N present in forms, concentrations, and spatial positions that allow (1994) 10 utilization by plants growing in the soil. Nitrogen availability indices are analyses or chemical or biological tests to measure or predict amounts of available N released from soil under a specified set of conditions. SSSA (1987) 11 Available nutrient elements are (1) amounts of a soil nutrient element in chemical forms accessible to plant roots or compounds likely to be convertible to such forms during the growing; or (2) the contents of legally designated available nutrient elements in fertilizers determined by specified laboratory procedures, which in most states constitute the legal bases for guarantees. Source: Sumner, M.E., Ed., 2000, Handbook of Soil Science, CRC Press, Boca Raton, FL, p. D-4. With permission. TABLE Soil Nutrient Classifications Classification Very low to low Moderately low Marginal Adequate to high Interpretation Very high probability of achieving a response to applied nutrient; unlikely probability of achieving a response to applied ameliorant for toxicity. High probability of achieving a response to applied nutrient; possible or low probability of achieving a response to applied ameliorant for toxicity. Possible or low probability of achieving a response to applied nutrient; high probability of achieving a response to applied ameliorant for toxicity. Unlikely probability of achieving a response to applied nutrient; very high probability of achieving a response to applied ameliorant for toxicity. Source: Soil Analysis: An Interpretation Manual, 1999, CSIRO Publishing, Collingwood, Australia.
388 Soil Analysis 357 TABLE Soil Analysis Interpretation by Test Rating Rating Symbol Interpretation Low L Profitable response in almost all cases Medium M Profitable response in most cases High H Profitable response rare Very high VH Not profitable to apply fertilizer Excessive E Application may lower crop yield or quality Source: Soil Fertility Handbook, 1998, Ontario Ministry of Agriculture, Toronto, Canada. TABLE Probable Crop Responses to P and K by Soil Rating Soil Test Rating Probability of Response (%) Low Medium High Very high Source: International Soil Fertility Manual, 1995, Potash & Phosphate Institute, Norcross, GA. With permission.
389 358 Agronomic Handbook: Management of Crops, Soils, and Their Fertility INTERPRETIVE VALUES AND RANGES FOR VARIOUS SOIL TESTS TABLE Fertility Ratings for Mehlich No. 3-Extractable P, K, Ca, and Mg (mg/dm 3 ) Fertility Rating P K Ca Mg Very low Low Medium High Source: Comparison of Mehlich 1 and Mehlich 3 extractants for P, K, Ca, Mg, Mn, Cu, and Zn in Atlantic coastal plain soils, Commun. Soil Sci. Plant Anal., 20, 1707, With permission. TABLE Critical Values for Mehlich No. 3- Extractable Mn and Zn (mg/dm 3 ) Soil ph Mn Zn Source: Comparison of Mehlich 1 and Mehlich 3 extractants for P, K, Ca, Mg, Mn, Cu, and Zn in Atlantic coastal plain soils, Commun. Soil Sci. Plant Anal., 20, 1707, With permission. TABLE Interpretive Values for Bray P1- and Olsen-Extractable P (ppm) Test Rating Bray P1 Olsen Very low Low Medium High Very high >35 >20
390 Soil Analysis 359 TABLE Interpretive Values for Ammonium Acetate- Extractable K, Ca, and Mg (ppm) Test Rating K Ca Mg Very low Low , Medium ,001 2, High ,001 5, Very high >300 >5,000 >750 Note: Soils with ph below 5.5 may be Ca- or Mg-deficient. TABLE Interpretive Values for DTPA-Extractable Cu, Fe, Mn, and Zn (ppm) Test Rating Cu Fe Mn Zn Very low < <0.2 <0.2 Low Medium High Very high >10 >250 >50 >10 TABLE Interpretive Values for Hot Water-Extractable B Test Rating B (ppm) Very low <2.0 Low Medium High Very high >4.1 TABLE Interpretive Values for Water- Extractable N as the Nitrate Anion at 48-Inch Soil Depth (ppm) Test Rating Nitrogen Content Range Very low 0 4 Low 5 9 Medium High >14
391 360 Agronomic Handbook: Management of Crops, Soils, and Their Fertility FERTILIZER RECOMMENDATIONS BASED ON SOIL TEST RESULTS FIGURE 11.3 General guidelines for making fertilizer recommendations from a soil test for available nutrients. (Source: Soil Analysis: An Interpretation Manual, 1999, CSIRO Publishing, Collingwood, Australia. With permission.)
392 Soil Analysis CUMULATIVE RELATIVE FREQUENCIES OF LEVELS OF SOIL TEST K AND P IN NORTH AMERICA The following summaries show results of soil tests performed on approximately 2.5 million samples collected in Fall 2000 and Spring 2001 by 31 private and 34 public laboratories. TABLE Cumulative Relative Frequencies (%) for Ammonium Acetate Equivalent K in North America by Region 0 40 ppm ppm ppm ppm ppm ppm ppm ppm >320 ppm North Central (993,489 Samples) Northeast (149,010 Samples) Northern Great Plains (124,143 Samples) Southeast (835,066 Samples) Southern Great Plains (247,380 Samples) West (99,227 Samples) Note: Regional category averages are means of state and province percentages and are not weighted by number of samples. North Central: Missouri, Ohio, Kentucky, Illinois, Indiana, Iowa, Michigan, Wisconsin, Minnesota Northeast: Prince Edward Island, New Brunswick, Maine, Massachusetts, Delaware, Quebec, New Hampshire, Maryland, Connecticut, New Jersey, Nova Scotia, Pennsylvania, New York, Vermont Northern Great Plains: Alberta, Manitoba, South Dakota, Saskatchewan, North Dakota, Montana Southeast: North Carolina, South Carolina, Alabama, Florida, Mississippi, Louisiana, Georgia, Tennessee, Virginia, Arkansas Southern Great Plains: Oklahoma, Nebraska, Texas, Kansas West: Oregon, Washington, California, Colorado, Nevada, New Mexico, Idaho, Utah, Arizona, Wyoming. Source: Soil Test Levels in North America: Summary Update, Technical Bulletin Potash & Phosphate Institute, Norcross, GA. With permission.
393 362 Agronomic Handbook: Management of Crops, Soils, and Their Fertility TABLE Cumulative Relative Frequencies (ppm) for Bray P-1 Equivalent Soil Test P in North America by Region and Sampling Density for States and Provinces 0 5 ppm 6 10 ppm ppm ppm ppm ppm ppm ppm >50 ppm North Central (1,056,873 Samples) Northeast (157,579 Samples) Northern Great Plains (137,338 Samples) Southeast (834,840 Samples) Southern Great Plains (250,914 Samples) West (104,385 Samples) Note: Regional category averages are means of state and province percentages and are not weighted by number of samples. North Central: Missouri, Ohio, Kentucky, Illinois, Indiana, Iowa, Michigan, Wisconsin, Minnesota Northeast: Prince Edward Island, New Brunswick, Maine, Massachusetts, Delaware, Quebec, New Hampshire, Maryland, Connecticut, New Jersey, Nova Scotia, Pennsylvania, New York, Vermont Northern Great Plains: Alberta, Manitoba, South Dakota, Saskatchewan, North Dakota, Montana Southeast: North Carolina, South Carolina, Alabama, Florida, Mississippi, Louisiana, Georgia, Tennessee, Virginia, Arkansas Southern Great Plains: Oklahoma, Nebraska, Texas, Kansas West: Oregon, Washington, California, Colorado, Nevada, New Mexico, Idaho, Utah, Arizona, Wyoming Source: Soil Test Levels in North America: Summary Update, Technical Bulletin Potash & Phosphate Institute, Norcross, GA. With permission. TABLE Fractions of Samples Analyzed by Specific P and K Soil Tests Phosphorus % Potassium % Mehlich No Mehlich No Mehlich No Mehlich No Bray P-1 30 Ammonium acetate 42 Olsen 11 Others 5 Others 7 Source: Soil Test Levels in North America: Summary Update, Technical Bulletin , Potash & Phosphate Institute, Norcross, GA. With permission.
394 Soil Analysis 363 TABLE Soil Test Range Equivalents Assumed in Tables and Extraction Method Categories Requested from Participating Laboratories (ppm) Ammonium bicarbonate-dtpa >19 Bray and Kurtz P >50 Bray and Kurtz P-2 (LSU only) >50 Kelowa, modified >50 Lancaster P >50 Mehlich No. 1 P >30 Mehlich No. 2 P >50 Mehlich No. 3 P >50 Morgan, Cornell >20 Morgan, modified >20 Olsen P (sodium bicarbonate) >54 TAMU >54 Ammonium acetate K >320 Ammonium bicarbonate-dtpa >240 Kelowna, modified >320 Lancaster >320 Mehlich No. 1 K >320 Mehlich No. 3 K >320 TAMU >360 Water (NMSU only) >120 Source: Soil Test Levels in North America: Summary Update, Technical Bulletin , Potash & Phosphate Institute, Norcross, GA. With permission.
395 364 Agronomic Handbook: Management of Crops, Soils, and Their Fertility REFERENCES 1. Nelson, W.L. et al., 1951, Soil Testing in the United States, National Soil and Fertilizer Research Committee, U.S. Government Printing Office, Washington, D.C. 2. Bray, R.H., 1954, A nutrient mobility concept of soil-plant relationships, Soil Sci., 78, Scarsbrook, C.E., 1965, Nitrogen availability, in Soil Nitrogen, Bartholomew, W.V. and Clark, F.E., Eds., Soil Science Society of America, Madison, WI, p Brady, N.C., 1974, The Nature and Properties of Soils, Macmillan, New York. 5. Barber, S.A., 1984, Soil Nutrient Bioavailability: A Mechanistic Approach, John Wiley & Sons, New York. 6. Dahnke, W.C. and Johnson, G.V., 1990, Testing soils for available nitrogen, in Soil Testing and Plant Analysis, 3rd ed., Westerman, R.L., Ed., Soil Science Society of America, Madison, WI, p Peck, T.R. and Soltanpour, P.N., 1990, Principles of soil testing, in Soil Testing and Plant Analysis, 3rd ed., Westerman, R.L., Ed., Soil Science Society of America, Madison, WI, p Troeh, F.R. and Thompson, L.M., 1993, Soils and Soil Fertility, 5th ed., Oxford University Press, New York. 9. Black, C.A., 1993, Soil Fertility: Evaulation and Control, Lewis Publishers, Boca Raton, FL. 10. Bundy, L.G. and Meisinger, J.J., 1994, Nitrogen availability indices, in Methods of Soil Analysis, Part 2, Microbiological and Biochemical Properties, Weaver, R.W., Ed., Soil Science Society of America, Madison, WI, p Glossary of Soil Science Terms, 1987, Soil Science Society of America, Madison,WI.
396 12 Plant Analysis 12.1 INTRODUCTION Plant analysis, also called leaf analysis, is a technique for determining the elemental contents of tissues of particular plant parts. It plays a major role in diagnosing mineral nutrition problems in the field and involves a series of steps (Figure 12.1): Sampling Sample preparation Laboratory analysis Interpretation 12.2 SAMPLING Taking as samples the mature leaves exposed to full sunlight just below the growing tips on main branches or stems just before or when a plant begins its reproductive stage of growth is the preferred technique. In some cases, sampling may be done earlier or during the growth cycle of the plant if the intent is to collect leaf tissue of the same maturity. The important components for proper tissue collection are: Plant parts taken from a specific location on each plant Stage of plant growth or specific time of sampling FIGURE 12.1 Sequence of plant analysis procedure. 365
397 366 Agronomic Handbook: Management of Crops, Soils, and Their Fertility Number of parts taken per plant Number of plants selected for sampling If the prescribed sampling directions are followed, the sampler should achieve reasonable statistical reliability. Sampling instructions are very specific in terms of plant part and stage of growth, since a comparison of assay results with established critical or standard values or sufficiency ranges is based on clearly identified plant parts taken at specified times. When specific sampling instructions are unknown, the general rule is to select upper leaves. Avoidance criteria are also crucial; plants to be avoided: Have suffered long-term climatic or nutritional stress Have been damaged mechanically or by insects Are infested with disease Are covered with dust, soil, or foliar-applied sprays unless the extraneous substances can be removed effectively Are border row plants or shaded leaves within the plant canopy Contain dead tissue 12.3 COMPARATIVE SAMPLING Sampling two different populations of plants for comparative purposes, a highly desirable diagnostic procedure, poses a difficult problem, particularly when the type of stress produces substantial differences in plant growth. For example, when two or more sets of plants exhibit varying signs of a possible nutrient element insufficiency, collecting tissue for comparative purposes may be difficult because of the effect of the nutrient element stress on plant growth and development. Therefore, it is important whenever possible, to obtain plant tissue samples when the symptoms of stress first appear rather than waiting until substantial differences in plant charactistics are noted. Finally, great care must be taken to ensure that representative samples are collected for such comparisons, and that the interpretation of the results takes into consideration the condition of the plants when they were sampled, whether normal in appearance or not, because of some type of stress INAPPROPRIATE SAMPLING Although it is possible to assay just about any plant part or even an entire plant, the biological significance of such a result is dependent on the availability of interpretative data for the plant part collected, stage of plant growth, etc. For example, the assay of fruit or grain or the analysis of a whole plant or one of its parts at maturity or harvest does not usually provide reliable data on plant nutrition during earlier growth. The primary objective of plant analysis should be obtaining plant parts for which assay results can be compared with known interpretative values NUMBER OF PLANTS TO SAMPLE The number of plants to sample depends on the general condition of the plants, soil homogeneity, and the purpose for which results will be used. Precision requirements will dictate the number of plant parts to be collected, the number of plants needed to constitute a composite sample, and the number of composite samples necessary to ensure sufficient replication. Normally, the mean value of several composite sample assays gives a more accurate estimate than a single assay result based on a single composite sample consisting of the same total number of individual samples.
398 Plant Analysis LACK OF HOMOGENEITY Lack of homogeneity within the plant and its parts is due to (1) movement of mobile elements from older tissue to newly developing tissue, (2) accumulation of immobile elements, and (3) reduction in dry matter content. Anatomical factors can affect the concentrations of elements found in whole leaves. Therefore, a sampling procedure that enhances the distribution effects of elements within the leaves will affect analysis results. TABLE 12.1 Element Mobilities within Plants Mobile Variably Mobile Immobile Nitrogen Sulfur Calcium Phosphorus Copper Manganese Potassium Zinc Boron Magnesium Molybdenum Iron 12.7 PLANT PARTS Petioles are not parts of leaf blades and should not be included in leaf samples. However, for certain crops, e.g., grapes, sugar beets, and cotton, the petiole is the plant part to be assayed rather than the leaf blade. The petiole, as conductive tissue, is normally higher in elements like K, P, and nitrate-nitrogen (NO 3 -N) than the attached leaf blade. Compound leaves pose a problem for sampling because they comprise mixtures of petioles, conductive tissues, and leaf blades. In general, the recommended procedure is to collect a select leaf or leaves for such plants as tomato and potato, the terminal leaf at the end of a compound leaf, and middle pairs of leaves for nut trees such as pecan and walnut INITIAL SAMPLE HANDLING Fresh plant tissue is perishable and must be kept cool and dry before delivery to the laboratory. If possible, the tissue should be air dried before shipment, and/or kept at reduced temperature (40 to 50 C; 104 to 122 F) to prevent decay because any deterioration will result in reduced dry weight and that will affect the analysis result DECONTAMINATION (WASHING) Plant tissue covered with dust, soil, or foliar-applied materials that contain elements of interest requires decontamination before drying. Normally, decontamination (washing) is not recommended unless necessary. Mechanical wiping or brushing may be sufficient to remove large soil particles. Washing fresh plant tissue in a 0.1 to 0.4% P-free detergent solution followed by a rinse in pure water can effectively remove most extraneous materials. Iron is the main element affected by decontamination; results of an assay for Fe without decontamination would be questionable. Contamination on rough or pubescent plant tissue surfaces is difficult to remove and poses a serious problem, as washing may not remove the contaminants effectively. Following an analysis, contamination can be detected by noting whether concentrations of Al, Si, and Fe in the assayed tissue are all equally high or if their concentrations among a series of plant analysis results track each other.
399 368 Agronomic Handbook: Management of Crops, Soils, and Their Fertility TABLE 12.2 Effects of Decomination (Washing) on Nutrient Element Concentrations in Orange Leaves Nutrient Element Unwashed Detergent Wash a Detergent/Acid Wash b Nitrogen (%) Phosphorus (%) Potassium (%) Calcium (%) Magnesium (%) Sodium (%) Chloride (%) Boron (mg/kg) Copper (mg/kg) Iron (mg/kg) Manganese (mg/kg) Zinc (mg/kg) a Detergent wash: hand washed in 0.1% detergent and rinsed in deionized water. b Detergent/acid wash: washed in 0.1% detergent, rinsed, dipped in 3% HCl for 2 min, and washed in deionized water. Source: Effect of orange leaf washing techniques on removal of surface contaminants and nutrient losses, Proc. Amer. Sci. Hort. 89, 201, With permission ORGANIC MATTER DESTRUCTION Organic matter destruction can be accomplished by high temperature thermal oxidation or by wet acid digestion; the former method is frequently referred as dry ashing, and the latter as wet ashing HIGH TEMPERATURE (DRY) ASHING 1. Weigh 0.5 g dried (80 C; 176 F), 0.84-mm, (20-mesh screened) plant tissue into a 30- ml, high form porcelain and/or quartz crucible. Note: If an ashing aid is needed, add 5 ml HNO 3, or 5 ml 7% Mg(NO 3 ) 2 6H 2 O. Dry on a hot plate and continue with Step Place crucible in a rack, and the rack in a cool muffle furnace. 3. Set furnace to reach set temperature (500 C; 932 F) in about 2 hours. 4. After 4 to 8 hr of muffling, remove the crucible rack from the furnace and let cool. 5. Add 10 ml dilute acid mixture (300 ml HCl and 100 ml HNO 3 in 1,000 ml water) to dissolve the ash. Note: Dilute HNO 3 alone is frequently used to minimize the corrosive character of HCl when in contact with metal in the elemental analysis procedure WET ACID DIGESTION IN A MIXTURE OF HNO 3 AND HClO 4 1. Weigh 0.5 g dried (80 C; 176 F), 0.84-mm (20-mesh) plant tissue into a beaker or digestion tube. 2. Add 2.5 ml concentrated HNO 3. Cover the beaker with a watch glass or place a funnel into the mouth of the digestion tube. Let stand overnight.
400 Plant Analysis Place covered beaker on a hot plate or digestion tube into a port of a digestion block and digest at 80 C (176 F) for 1 hour. Remove beaker or digestion tube from hot plate or block, and let cool. 4. Add 2.5 ml HClO 4. Replace watch glass or funnel, and heat at 180 to 200 C (356 to 392 F) for 2 to 3 hr or until digest is clear. 5. Remove watch glass or funnel, lower temperature to 100 C (212 F) until fumes of HClO 4 dissipate. If digest is not colorless, repeat Step Remove from the hot plate or digestion block and let cool. 7. Add pure water to digest to bring to 10 ml or other appropriate volume. Digest is ready for elemental assay WET ACID DIGESTION IN A MIXTURE OF HNO 3 AND 30% H 2 O 2 1. Weigh 0.5 g dried (80 C; 176 F), 0.84-mm (20-mesh) plant tissue into a beaker or digestion tube. 2. Add 5.0 ml concentrated HNO 3. Cover with watch glass or place funnel into mouth of the digestion tube. Let stand overnight. 3. Place covered beaker on a hot plate or digestion tube into a port of digestion block and digest at 125 C (257 F) for 1 hour. Remove beaker or digestion tube from plate or block and let cool. 4. Add 3 ml 30% H 2 O 2 to the beaker or digestion tube and digest at 125 C (257 F). Repeat additions of 30% H 2 O 2 until digest is clear. Add HNO 3 as needed to prevent dryness. 5. When the digest is clear, remove the watch glass or funnel and reduce temperature of hot plate or block to 80 C (176 F). Take nearly to dryness. Residue should be colorless. If not, repeat Step Add 1:1 HNO 3 or HCl to bring to final volume of 10 ml. Clear solution is ready for elemental assay WET ACID DIGESTION IN H 2 SO 4 AND 30% H 2 O 2 1. Weigh 0.5 g dried (80 C, 176 F) 0.84-mm (20-mesh) plant tissue into a beaker or digestion tube. 2. Add 3.5 ml concentrated H 2 SO 4 and let stand 30 min. 3. Add 3.5 ml 30% H 2 O Cover the beaker or place a funnel into the mouth of the digestion tube. Place beaker on a hot plate or digestion tube into a port of the digestion block. Heat 30 min at 350 C (662 F). 5. Remove beaker or tube from hot plate or digestion block and let cool. 6. Add 2-mL aliquots of 30% H 2 O 2 and repeat digestion step until cool digest is clear. 7. Once the digest is clear, dilute to 20 ml with pure water. Digest is ready for elemental assay SAMPLE ANALYSIS Analytical procedures suitable for the determination of elements in prepared plant tissue samples are described in two texts: 1. Jones, J.B., Jr., 2001, Laboratory Guide for Conducting Soil Tests and Plant Analysis, CRC Press, Boca Raton, FL. 2. Kalra, Y.P., Ed., 1998, Handbook of Reference Methods for Plant Analysis, CRC Press, Boca Raton, FL.
401 370 Agronomic Handbook: Management of Crops, Soils, and Their Fertility INTERPRETATION OF TEST RESULTS Various techniques are used to interpret plant analysis results. The sufficiency range method is the most common. Critical values and standard reference values are used for particular crops. Many years of assay results are summarized, providing the interpreter with assay results that can be compared to currently determined results. In 1994, Markert published what he defined as reference plant composition values that can be compared to any plant analysis result as shown in Table TABLE 12.3 Markert s Reference Plant Composition for Major Elements and Micronutrients Major Element % Micronutrient ppm Nitrogen 2.5 Boron 40 Phosphorus 0.2 Chlorine 2,000 Potassium 1.9 Copper 10 Calcium 1.0 Iron 150 Magnesium 0.2 Manganese 200 Sulfur 0.3 Molybdenum 0.5 Zinc 50 Source: Progress Report on the Element Concentration Cadaster Project of INTE- COL/IUBS, 25th General Assembly of IUBDS, 1994, Paris. With permission. Diagnosing a plant analysis result based on critical or standard values or sufficiency ranges requires that the plant part and time of sampling be identical for the diagnosed tissue and for the source of the interpretative values. Those who now interpret plant analysis results for diagnostic purposes prefer working with the full range of concentrations from deficiency to excess. Such interpretive data is obtained from response curves as shown in Figures 12.2, 12.3, and The slope and general configuration shown in Figure 12.3 are typical for describing the association of yield or plant response and macronutrient concentration in leaves or plants. Figure 12.4 better typifies the association between yield and micronutrient concentration. FIGURE 12.2 Relationship of nutrient element content and plant growth or yield.
402 Plant Analysis 371 FIGURE 12.3 Representations of terms used to classify nutrient status. (Source: Plant Analysis: An Interpretation Manual, 1997, CSIRO Publishing, Collingwood, Australia. With permission.) FIGURE 12.4 General relationship of plant growth or yield and elemental content. (Source: Smith, P.F., Annu. Rev. Plant Physiol., 13, 81, With permission.) The C shape seen on the left side of Figure 12.3 is called the Steenbjerg Effect, and results from a combination of elemental concentrations or dilutions. The steep slope on the left of Figure 12.4 poses a significant sampling and analytical problem since a very small change in concentration results in a significant change in plant growth and/or yield. A different concept of interpretation is the Diagnosis and Recommendation Integration System (DRIS). DRIS has been applied primarily for interpretations based on the major elements since the data base for the major elements is considerably larger than that for the micronutrients. DRIS will never totally replace the more traditional critical value or sufficiency range techniques.
403 372 Agronomic Handbook: Management of Crops, Soils, and Their Fertility FIGURE 12.5 Relationship between zinc content of blade 1 of grain sorghum and top dry weight. (Source: Ohki, K., Agron. J., 76, 253, With permission.) LITERATURE REFERENCES FOR PLANT ANALYSIS INTERPRETATION INTERPRETATION TEXTS Chapman, D.H., Ed., 1966, Diagnostic Critiera for Plants and Soils, University of California, Riverside. Goodall, D.W. and Gregory, F.G., 1947, Chemical Composition of Plants as an Index of Their Nutritional Status, Ministry of Agriculture, London. Halliday, D.J. and Trenkel, M.E., Eds., 1992, IFA World Fertilizer Use Manual, International Fertilizer Association, Paris. Martin-Prevel, P., Garnard, J., and Gautier, P., Eds., 1987, Plant Analysis as a Guide to the Nutrient Requirements of Temperate and Tropical Crops, Lavosier Publishers, New York. Mills, H.A. and Jones, J.B., Jr., 1996, Plant Analysis Manual II, MicroMacro Publishing, Athens, GA. Reuter, D.J. and Robinson, J.B., Eds., 1997, Plant Analysis: An Interpretation Manual, Inkata Press, Melbourne, Australia DRIS Beverly, R.B., 1991, A Practical Guide to the Diagnosis and Recommendation Integration System (DRIS), MicroMacro Publishing, Athens, GA GENERAL TEXTS Jones, J.B., Jr., 2000, Laboratory Guide for Conducting Soil Tests and Plant Analysis, CRC Press, Boca Raton, FL. Kalra, Y.P., Ed., 1998, Handbook on Reference Methods for Plant Analysis, CRC Press, Boca Raton, FL. Kitchen, H.B., Ed., 1948, Diagnostic Techniques for Crops and Soils, American Potash Institute, Washington, D.C. Westerman, R.L., Ed., 1990, Soil Testing and Plant Analysis, Soil Science Society of America, Madison, WI.
404 Plant Analysis 373. TABLE 12.4 Producers and Suppliers of Reference Materials for Elemental Composition Quality Control in Plant Analysis a Code Source AAFC Eastern Cereal and Oilseed Research Centre, Agriculture and Agri-Food Canada, Ottawa, Ontario K1A 0C6, Canada. AMM Faculty of Physics and Nuclear Techniques, University of Mining and Metallurgy, Al Mickiewicsa 30, Krakow, Poland. ARC Food Research Institute, Laboratory of Food Chemistry, Agricultural Research Centre, SF Jokioinen, Finland. BCR Institute for Reference Materials and Measurements (IRMM), Retieseweg, B-2440 Geel, Belgium. BOWEN Dr. H.I.M. Bowen, West Down, West Street, Winterborne Kingston, Dorset DT11 9AT, Great Britain. CALNRI Central Analytical Laboratory, Nuclear Research Institute Rez plc, Rez, Czech Republic. CANMET Canadian Certified Reference Materials Project, Canada Centre for Mineral and Energy Technology, Natural Resources Canada, 555 Booth Street, Ottawa, Ontario K1A 0G1, Canada. CSRM Pb-Anal., Garbiarska 2, Kosice, Slovakia. DL AG Dillinger Huttenwerke, Postfach 1580, D Dillingen-Saar, Germany. GBW National Research Centre for Certified Reference Materials, 18 Bei San Huan Dong Hu, Hepingjie, Beijing, China. IAEA Analytical Quality Control Services, International Atomic Energy Agency, P.O. Box 100, A-1400 Wien, Austria. ICHTJ Commission of Trace Analysis, Committee for Analytical Chemistry of the Polish Academy of Sciences, Department of Analytical Chemistry, Institute of Nuclear Chemistry and Technology, ul. Dorodna 16, Warszawa, Poland. LIVSVER Chemistry Division 2, Swedish National Food Administration, P.O. Box 622, Uppsala, Sweden. NIES Division of Environmental Chemistry, National Institute for Environmental Studies, 16 2 Onagowa, Tsukuba, Ibaraki 305, Japan. NIST Standard Reference Materials Program, National Institute of Standards and Technology, Room 204, Building 202, Gaithersburg, MD WSPTP Western States Proficiency Testing Program, Department of Land, Air, and Water Resources, University of California, Davis, CA a Primarily major government agencies; includes some academic, commercial, and private sources STEPS IN DIAGNOSTIC OBSERVATION VISUAL EXAMINATION When plants do not receive enough of a nutrient element to satisfy their needs, they grow poorly and develop abnormal appearances. They may also show abnormal growth patterns if supplied with toxic levels of an element. Symptoms of deficiency or excess are more visible on leaves but may appear on any part of a plant, including the stem, fruit, and roots. Symptoms of deficiency or toxicity are generally typical for each nutrient element. Therefore, it is possible to use the visual appearance of a sick plant to diagnose the cause of the disorder; as with animals or human beings the correct diagnosis of disorder is the first step in correction.
405 374 Agronomic Handbook: Management of Crops, Soils, and Their Fertility INFORMATION REQUIRED FOR DIAGNOSIS An essential requirement for visual diagnosis is the knowledge of what a healthy plant looks like. This is gained from a thorough knowledge of the plant its life history and habits, how it looks and acts at all stages of growth. It is also necessary to know how seasonal conditions such as rainfall, temperature and light affect appearance. The next essential is knowledge of the symptoms of each nutrient element disorder in the affected plant. It is also necessary to know how diseases, nematodes, and insect pests affect plants so their effects may not be confused with symptoms of nutrient element disorders DEVELOP CASE HISTORY OF PROBLEM It is essential to develop a case history of the problem, including the cultural conditions experienced by the plants. The following information might be collected and analyzed: Rainfall How heavy were planting rains? How much and when did post-sowing rains fall? Was the pattern of rainfall normal or did drought or waterlogged conditions occur? Temperature Has weather been unseasonally hot or cold? Have frosts occurred; and if so, at what stage of growth were the plants? Time of planting Was planting normal, early or late? Variety What variety was planted. What was the source of seed? Was the seed treated with fungicides; if so, what compounds were used and at what rates? Cultural history of paddock What previous crops were grown? When were they sown and harvested? How did they yield? How was stubble handled? What fertilizers were applied and at what rates? Hahave the same problems appeared in previous crops? Soil type and tests Examine the soil for depth, presence of hardpans and root penetration, and for variations within the paddock. Have any soil tests been conducted; and if so, what are the results? Plant analyses Have plant samples been analyzed; what were the results? This information frequently allows some of the potential problems to be eliminated from further consideration DESCRIBE SYMPTOMS Record a general impression of the appearance of the crop: its color, density, height, stage of development and evenness of plant growth. Do all plants have the same general symptoms or are abnormal plants restricted to defined areas within the paddock? Are differences between areas of poor and good growth related to differences in topography, soil, drainage, cultural history, or management? It is important to note the presence of all visible agents of damage such as insects, disease, and nematodes that can produce symptoms of abnormal growth. Frequently, the causal agent is invisible (for example, nutritional). Symptoms on individual plants should then be recorded in the following terms: Location The symptoms can be located on one organ only (e.g., on leaves or stems) or spread over entire plants. Categorize leaves as young (expanding or recently matured) or old, and each leaf as consisting of lamina and petiole, leaf tip and leaf base, veins and interveinal areas, and upper and lower surfaces. Pests Insects and diseases usually attack all leaves. Symptoms of nutritional disorders are usually restricted to certain leaves or only certain parts of leaves, for example, symptoms of Fe deficiency appear only in interveinal areas of younger leaves. Color Differences in color are important and should be noted not only as greens, yellows or reds, but as shades or tones, such as pale or dark yellow. Necrotic (dead) tissue may be present and its color should be noted also. Size Plants can be stunted, normal, or spindly in appearance. Some disorders cause excessive growth of some tissues, leading to outgrowths or galls. Other disorders cause smaller leaves to be produced.
406 Plant Analysis 375 Shape Shape and size are somewhat related. However, shape can be altered while size remains constant. Some disorders cause marked changes in the shapes of leaves and flowers. Orientation The general growth of some plants is vertical, others sprawl horizontally. Disorders can alter the orientations of stems and leaves. For example, plants can have a limp, wilted appearance where normally upright stems droop. Pattern Development of a disorder follows a definite pattern. The early stages may be characterized by lesions that develop just inside the margins of the laminae near the leaf tips. As a disorder becomes more severe, the small lesions join together and expand until the leaves develop necrotic margins that progress from the tips toward the bases. By carefully examining a number of plants, both early and later stages of the disorder will be found FINAL DIAGNOSIS When all information has been collected, a decision can be made on the probable cause of the problem. First, consider the possibility that the symptoms were produced by insects, nematodes, disease organisms, or mechanical injury. When symptoms are found on a single plant, they are usually caused by one of these agents or genetic variations. Symptoms caused by nutritional disorders usually occur on several plants over a broad area related to a soil or management pattern. If disease, insect, or nematode attack or mechanical injury can be eliminated, the symptoms can be compared and matched with those characteristic of a nutritional disorder. Different nutrient element disorders can sometimes produce somewhat similar symptoms. If more than one disorder is present, it is often difficult to sort out the symptoms that characterize each disorder. A nutrient element deficiency or toxicity may occur at any time during the life of a plant. However, the most typical symptoms are those that appear first; that is, during the early stages of the disorder, and these symptoms serve best to distinguish one disorder from another. Any diagnosis based solely on visual symptoms should be regarded as preliminary. To confirm the diagnosis, help should be sought where possible from other methods such as soil, water and plant analyses, pot culture assays, field experiments, and test strips ADDITIONAL ASPECTS OF CROP DIAGNOSIS 1 A crop diagnostician looks beyond fertility problems and soil tests for P, K, and other nutrient elements. The diagnostician must know and understand all the field conditions that impact crop growth. Such knowledge may help pinpoint a problem that is inducing or magnifying apparent nutrient element shortages. Look at all factors that influence crop growth, response to fertilization, and final yield. Root zone Soil must be granular and permeable for roots to expand and feed extensively. A crop will develop a root system 6 ft deep or more on some soils to reach water and nutrient elements. For that reason, it is desirable to know the fertility level of the subsoil. A shallow or compacted soil does not offer this root feeding zone. Wet or poorly drained soils produce shallow root systems. Proper drainage is important to early crop growth. Temperature Cool soil temperatures slow organic matter decomposition. This limits the releases of N, S, and other nutrient elements. Nutrient uptake is slower in cool soils, thus increasing deficiency potential. Nutrient elements diffuse more slowly in cool soils. Root activity is decreased. Soil ph Acid soil conditions reduce the availability of Ca, Mg, Mo, and P. They increase the availability of Fe, Mn, B, Cu, and Zn. N is most available between ph 6.0 and 7.0. Insects Do not mistake insect damage for a nutrient element deficiency. Examine roots, leaves, and stems for insect damage that may cause similar symptoms. Diseases Close study will show the difference between disease and nutrient element deficiency. Disease symptoms can often be detected with a small hand lens. Moisture conditions Dry soil conditions may create deficiencies. Boron, Cu, Mg, and K are good examples. This is why crops respond so well to such nutrients when they are well supplied in dry periods. Drought slows movement of nutrient elements to roots.
407 376 Agronomic Handbook: Management of Crops, Soils, and Their Fertility Soil salinity problems Soluble salts and Na cause problems in some low rainfall areas. These conditions may occur only in part of a field usually where a high water table exists, where poor quality water was used for irrigation, or where seepage water reaches the surface. Weed identification Herbicides and mechanical controls are more important than ever. Weeds rob agronomic plants of water, air, light, and nutrient elements. Some weeds may even release substances that inhibit crop growth. Learn to identify weeds and the materials used to control them. Herbicide damage Under certain conditions, plants may suffer from carryover herbicides or those applied in the current year. Be aware of possible drift from adjacent fields. Herbicide injury may also be affected by soil ph. Know the symptoms of herbicide damage and the interactions of herbicides with soil conditions. Tillage practices Some soils develop hardpans and require deep tillage. In conservation tillage, much of the fertilizer is broadcast and is on or near the surface. More P and K may be needed to build fertility. Band placing of some fertilizer near the seed may be helpful in such cases. Hybrid or variety Yield potential and adaptability to a given environment affect how a crop performs. Plant spacing Row width, uniform spacing of plants in rows, and number of plants per acre are important to yield. Water management Adequate surface or tile drainage is the key. Irrigation time and amount of water are of prime importance in good crop growth. Determine what the irrigation program has been. Date of planting This will affect rate of growth and plant appearance, as well as final yield potential in some cases. Fertilizer placement Under some conditions, a small amount of fertilizer near the roots is important for a fast start. The fertilizer may have been broadcast or applied too deeply. Strip or deep banding may be required in some situations. Cultural practices Knowing what has been done before you check conditions in the field may be the most important diagnostic technique Get facts and record them Cropping history, planting date, seeding rate, row width, tillage practices, depth and method of planting, past fertilizer, soil amendments, and weather conditions are all important issues. The more you know about a field before entering it, the better it can be diagnosed. Record all data. A checklist will ensure against forgetting vital information FACTORS AFFECTING NUTRIENT ELEMENT SYMPTOMS Why do symptoms of plant nutrient element deficiency occur? Because insufficient amounts of an element in a form a plant can take up and use are present. That may occur because the soil is infertile and not enough of the nutrient element was added, but other factors also affect uptake and lead to the appearance of symptoms ROOT ZONES Crops differ a great deal in their development of root systems. The same crop may vary in the number and sizes of roots developed, depending on the environment and differences in plant genetics. Since some plant nutrient elements do not move far in the soil, the extent of the root system determines whether the plant gets enough of those nutrient elements. If root growth is shallow, plants may show deficiency symptoms even when the soil contains good supplies of those nutrient elements. Dry surface soil conditions may also limit nutrient element uptake if most of the available nutrient elements are in that zone (positional unavailability). When a deficiency symptom is noted, it is a good practice to examine the roots to see whether a restricted root zone may be contributing to the deficiency.
408 Plant Analysis TEMPERATURE Many growers note visual symptoms when plants are young, only to see the plants grow out of the symptoms as the season progresses. Often this is caused by the effects of temperature on root growth. If soil and air temperatures are cold, plants grow very slowly, root systems are small, and nutrient element uptake is low. Also, when air temperatures are too low or high, photosynthesis and respiration rates are affected. For example, if temperatures are too high at night, respiration continues at a high rate, burning up sugars and limiting the accumulation of carbohydrates ACIDITY OR ALKALINITY When a visual symptom is noted, the degree of soil acidity or alkalinity in which the plant is growing should be evaluated. Very often this is closely related to the cause of the symptom. The solubility and availability of many plant nutrient elements depend on soil ph. When the ph value rises above 6.0 to 6.5, elements such as Fe, Mn, Zn, and B decrease in solubility, perhaps to the point where the plants become deficient and show symptoms. In contrast, when soil ph is too acid (below 6.0), Mo becomes less soluble and a deficiency may occur. Because of the influence of ph on plant nutrient element availability, it is essential to learn the liming history when a symptom is observed. Over-liming is easy to do on sandy soils and it produces symptoms of deficiencies of Fe, Mn, and Zn. In some parts of the world, soils are naturally alkaline. This is often the case in arid regions where soils are only slightly weathered or where alkaline salts have accumulated. In areas of higher rainfall and outcroppings of limestone, the soil ph may be above 7.0. In such soils, deficiency symptoms of Fe, Mn, and Zn may be seen. Soils in arid regions may also have problems of excess salinity (soluble salt) or Na (black alkali). These problems must be dealt with by establishing drainage, adding amendments if Na is involved, and leaching. Plants on such soils grow slowly, appear droughty, and may exhibit necrosis of the leaf margins VARIETIES AND GENETIC FACTORS Sometimes a deficiency symptom may be noticed in one variety of a crop but not in another. This is not uncommon, but is often overlooked. Differences in genetic makeup may affect a plant s ability to take up and utilize certain nutrient elements. One variety may show symptoms of deficiency while another variety growing beside it may not show any symptoms STAGE OF MATURITY 1 As a plant nears maturity, it shows signs of old age that may include reddening, browning, or leaf tip or edge burn that may resemble a deficiency symptom. In fact, the two conditions are related. As a plant grows older, it may run out of N or K and may mature before it reaches its full yield potential. Some crops are sensitive to a delicate balance between the amount of N required for full yield and the amount that may be too little or too much. Visual symptoms help us recognize the correct amount MANAGEMENT PROGRAM FOR PRODUCING AND SUSTAINING HIGH YIELD Developing a fundamental planning process that estimates attainable yield levels for each field while recognizing controllable limiting factors and their interactions for the cropping system is a challenge. Producing high yields often requires on-farm experimentation and setting a yield goal that is slightly out of reach. All input levels, from seeding rate to variety selection to fertilizer rate,
409 378 Agronomic Handbook: Management of Crops, Soils, and Their Fertility are set assuming the yield can be obtained, and practices applicable to whole fields and farms can be utilized: A focus on timeliness of all operations and a record-keeping system that allows quantification of what works and does not work. Use of technologies such as genetically enhanced varieties and site-specific management to control risk Long-term dedication to soil improvement, including physical, chemical, and biological properties. Individuals who produce top yields seldom do so overnight because soil properties, water holding capacity, and subsoil characteristics can be improved, but only over a period of several years. A constant watch for yield-limiting factors and dedication to removal of yield-limiting factors where possible. Insufficient soil fertility is an example of a controllable limiting factor that can be profitably removed, given sufficient time. REFERENCES 1. Best Management Practices Begin the Diagnostic Approach, 1991, Potash & Phosphate Institute, Norcross, GA.
410 Part VI Reference Materials and Appendices
411
412 13 Weights, Measures, and Conversion Factors TABLE 13.1 Avoirdupois Weight Unit Equivalent 1 dram (dr) 27 11/32 grains (gr) 1 ounce (oz) 16 drams (dr) 1 pound (lb) 16 ounces (oz) 1 quarter 25 pounds (lb) 1 hundredweight (cwt) 100 pounds, 4 quarters, 112 pounds (British) 1 ton (T) 2,000 pounds, 20 hundredweight TABLE 13.2 U.S. Dry Measure Unit Equivalent 2 pints (pt) 1 quart (qt) 8 quarts (qt) 1 peck (pk) 4 pecks (pk) 1 bushel (bu) 1 bushel (bu) 2, cubic inches, cubic feet, liters, 64 pints (dry) a, 32 quarts (dry) a, barrels 1 barrel (bbl) bushels (bu), quarts (dry) a, 7,056 cubic inches, cubic feet a In the U.S. system, the dry measure pint and quart are about 16% larger than their liquid measure equivalents. TABLE 13.3 U.S. Liquid Measure Unit Equivalent 1 teaspoon (tsp) 1/6 ounce 1 tablespoon (tbsp) 1/2 ounce 4 fluid ounces 1 gill 4 gills 1 pint 2 pints 1 quart 4 quarts 1 gallon 31 1/2 gallons 1 barrel 2 barrels 1 hogshead 381
413 382 Agronomic Handbook: Management of Crops, Soils, and Their Fertility TABLE 13.4 Linear Measure Unit Equivalent 1 inch (in.) feet 1 foot (ft) 12 inches 1 yard (yd) 36 inches, 3 feet 1 rod (rd) 16 1/2 feet, 200 inches, 5 5/9 yards, 25 links 1 chain 4 rods, 100 links, 66 feet 1 mile 5,280 feet, 1,760 yards, 8,000 links, 320 rods, 80 chains 1 span 9 inches 1 hand 4 inches TABLE 13.5 Square Measure Unit Equivalent 1 square inch (sq in.) square feet 1 square foot (sq ft) 144 square inches 1 square yard (sq yd) 1,296 square inches, 9 square feet 1 square rod (sq rd) 272 1/4 square feet, 30 1/4 square yards 1 square chain (sq ch) 4,356 square feet, 16 square rods 1 acre (A) 43,560 square feet, 4,840 square yards, 160 square rods, 10 square chains, a square area feet on each side or rectangle 200 feet by feet 1 section 640 acres, 1 square mile 1 quarter (1/4 section) 160 acres 1 township (Twp) 36 square miles
414 Weights, Measures, and Conversion Factors 383 TABLE 13.6 Common Conversions a Unit Equivalent 1 U.S. short ton 2,000 U.S. pounds (lb) 1 British long ton 2,240 U.S. pounds (lb) 1 metric ton (1,000 kg) 2,204.6 U.S. pounds (lb) 1 fluid ounce (oz) cubic centimeters (cc) 1 quart (qt) 32 fluid ounces (oz), 946 cubic centimeters (cc) 1 liter (L) quarts (liquid) 1 gallon (U.S. standard) 128 fluid ounces (oz), 231 cubic inches (cu. in.), 3,785 cubic centimeters (cm 3 ) 1 gallon (Imperial) 277 cubic inches, liters (L), U.S. gallons (gal) 1 gallon of water 3,788 grams (g), pounds (lb) 1 ounce (oz) grams (g) 1 pound (lb) 454 grams (g) 1 inch (in) 2.54 centimeters (cm) 1 centimeter (cm) inches (in.) 1 meter (m) inches (in.) 1 yard meters (m) 1 kilometer (km) 3,280 feet 10 inches, mile 1 cubic inch cubic centimeters (cc), liter (L) 1 cubic foot liters (L), gallons (gal) 1 acre foot of soil 4,000,000 pounds (lb) 1 acre foot of water 43,560 cubic feet or 325,851 gallons (gal) 1 part per million (ppm) 2.72 lb per acre foot of water 1 ppm tons of salt per acre foot of water 1 cubic foot per second 450 galllons per minute, 2 acre feet per day 1 gallon per minute 1/450 cubic feet per second 1 ton per acre 20.8 grams per square foot, l lb per square foot (4 feet, 8 inches each way), 1 kilogram per 48 square feet a Conversions involving volume of liquid to weight are based on standard conditions of room temperature (7 F or 20 C) and sea level barometric pressure. Such conversions will vary depending upon actual temperature and pressure.
415 384 Agronomic Handbook: Management of Crops, Soils, and Their Fertility TABLE 13.7 Factors for Converting U.S. Units into SI Units U.S. Unit SI Unit Multiply U.S. Unit by Number below to Obtain SI Unit Ångstrom Nanometer, nm 10 1 Atmosphere Megapascal, MPa Bar Megapascal, MPa 101 Calorie Joule, J 4.19 Cubic foot Liter, L 28.3 Cubic inch Cubic meter, m Curie Becquerel, Bq Degrees, C (+273, temperature) Degrees K (no degree symbol) 1 Degrees, F ( 32, temperature) Degrees, C Dyne Newton, N 10 5 Erg Joule, J 10 7 Foot Meter, m Gallon Liter, L 3.78 Gallon per acre Liter per ha 9.35 Inch Centimeter, cm 2.54 Micron Micrometer, pm 1 Mile Kilometer, km 1.61 Mile per hour Meter per second Millimho per cm Decisiemens per m, dsm 1 Ounce (weight) Gram, g 28.4 Ounce (fluid) Liter, L Pint Liter, L Pound Gram, g 454 Pound per acre Kilogram per ha 1.12 Pound per cubic foot Kilogram per m Pound per square foot Pascal, Pa 47.9 Pound per square inch Pascal, Pa Quart Liter, L Square foot Square meter, m Square inch Square cm, cm Square mile Square kilometer, km Ton (2,000 lb) Kilogram, kg 907 Ton per acre Megagram per ha, Mg/ha 2.24
416 Weights, Measures, and Conversion Factors 385 TABLE 13.8 Convenient Conversion Factors Factor Multiply by To Get Acres Hectares Acres 43,560 Square feet Acres 160 Square rods Acres 4,840 Square yards Acres 1,076.4 Square feet Bushels 4 Pecks Bushels 64 Pints Bushels 32 Quarts Centimeters Inches Centimeters 0.01 Meters Cubic centimeters Ounces (liquid) Cubic feet 1,728 Cubic inches Cubic feet Cubic yards Cubic feet Gallons Cubic feet Quarts (liquid) Cubic yards 27 Cubic feet Cubic yards 46,656 Cubic inches Cubic yards 202 Gallons Feet Centimeters Feet 12 Inches Feet Meters Feet Rods Feet 1/3 or Yards Feet per minute Miles per hour Gallons Cubic feet Gallons 4 Quarts (liquid) Gallons of water Pounds of water Grams Grains Grams Kilograms Grams 1,000 Milligrams Grams Ounces Grams per liter Parts per million Hectares Acres inches 2.54 Centimeters Inches Feet Kilograms 1,000 Grams Kilograms Pounds Kilograms per hectare Pounds per acre Kilometers 3,281 Feet Kilometers Miles Liters 1,000 Cubic centimeters Liters Cubic feet Liters Cubic inches Liters Gallons Liters Quarts (liquid) Meters 100 Centimeters Meters Feet Meters Inches continued
417 386 Agronomic Handbook: Management of Crops, Soils, and Their Fertility TABLE 13.8 (CONTINUED) Convenient Conversion Factors Factor Multiply by To Get Miles 5,280 Feet Miles 63,360 Inches Miles 320 Rods Miles 1,760 Yards Miles per hour 88 Feet per minute Miles per hour Feet per second Miles per minute 60 Miles per hour Ounces (dry) Pounds Ounces (liquid) Pints (liquid) Ounces (liquid) Quarts (liquid) Parts per million Pounds per million gallons water Pecks 16 Pints (dry) Pecks 8 Quarts (dry) Pints (dry) 0.5 Quarts (dry) Pints (liquid) 16 Ounces (liquid) Pounds Grams Pounds 16 Ounces Pounds of water Gallons Quarts (liquid) Liters Quarts (liquid) 32 Ounces (liquid) Quarts (liquid) 2 Pints (liquid) Rods 16.5 Feet Rods 5.5 Yards Square feet 144 Square inches Square feet Square yards Square inches Square feet Square miles 640 Acres Square miles 27,878,400 Square feet Square rods Acres Square rods Square feet Square yards Acres Square yards 9 Square feet Square yards 1,296 Square inches Temperature ( C) Temperature, F Temperature ( F) 32 5/9 or Temperature, C Tons Kilograms Tons 2,000 Pounds Tons, long 2,240 Pounds Yards 3 Feet Yards 36 Inches Yards Meters
418 Weights, Measures, and Conversion Factors 387 TABLE 13.9 Soil Analysis Values Major Cation lb/acre ppm (mg/kg) kg/ha cmol/100 g (meq/100 g) Calcium (Ca 2+ ) 4,999 2,900 2, Magnesium (Mg 2+ ) Potassium (K + ) Sodium (Na + ) Note: Conversion to millequivalents: lb Ca/acre divided by 400 = meq Ca/100 g lb Mg/acre divided by 240 = meq Mg/100 g lb Na/acre divided by 460 = meq Na/100 g lb K/acre divided by 780 = meq K/100 g Micronutrient ppm (mg/kg) lb/acre kg/ha mmol/kg Boron Chlorine Copper Iron Manganese Molybdenum Zinc Note: Levels chosen for illustrative purposes only. TABLE Plant Analysis Values Major Element Percent g/kg cmol(p+)/kg cmol/kg Nitrogen Phosphorus Potassium Calcium Magnesium Sulfur Micronutrient ppm mg/kg cmol(p+)/kg mmol/kg Boron Copper Iron Manganese Zinc Note: Levels chosen for illustrative purposes only.
419 388 Agronomic Handbook: Management of Crops, Soils, and Their Fertility TABLE Calculation of Millequivalents (meq) and Microequivalents (p.e.) per 100 g from Percent (%) and Parts per Million (ppm) Element Converting from Valence Equivalent Weight Factor Nitrogen % to meq Phosphorus % to meq Potassium % to meq. l Calcium % to meq Magnesium % to meq Boron ppm to p.e Copper ppm to p.e Iron ppm to p.e Manganese ppm to p.e Zinc ppm to p.e Sulfur % to meq Sodium % to meq Chlorine % to meq Note: Millequivalents can be converted to percentages by multiplying by equivalent weight/1000. Microequivalents can be converted to ppm by multiplying by equivalent weight/100. Factor x % = meq/100 g, and factor x ppm = p.e./100 g.
420 Appendix A Soil/Plant Definitions A AB-DTPA Extraction Reagent An acronym for an extraction reagent of 1 M ammonium bicarbonate (NH 4 HCO 3 ) in M diethylenetriaminepentatacetic acid (DTPA) that has a ph of 7.6 and is used for the extraction of phosphorus (P), potassium (K), sodium (Na), iron (Fe), manganese (Mn), and zinc (Zn) from alkaline soils. Absorption A process in which a substance is taken into something, such as a plant cell or structure, by either an active (biological) or passive (physical or chemical) process. Acid-Forming Fertilizer Fertilizer that, after application to and reaction with soil, increases residual acidity and decreases soil ph. Acid Soil A soil with a water ph below 7.0. A soil having a prepoderance of hydrogen (H + ) over hydroxyl (OH - ) ions in the soil solution. Acidic Cations Hydrogen ions or cations that, on being added to ater, undergo hydrolysis resulting in an acidic solution. Examples in soils are: H +, Al 3+, and Fe 3+. Acidity Refers to the ph of a soil or solution in which the hydrogen (H + ) ion concentration exceeds that of the hydroxyl (OH - ) ion concentration, and therefore, the ph value is less than 7.0 (see Alkalinity). Acidity, total The total acidity in a soil or clay, usually estimated by a buffered salt determination of total acidity, and also approximated by the sum of salt replaceable acidity plus residual acidity. Adams-Evans Buffer A buffer solution used for measuring exchangeable hydrogen (H + ) and determining the lime requirement (LR) for acid, low cation exchange capacity (CEC) soils (see SMP Buffer). Adsorption The attachment of a substance to the surface of another substance. Aggregate A group of soil particles cohering so as to behave mechanically as a unit. Aggreation The process whereby primary soil particles (sand, silt, clay) are bonded together, usually by natural forces and substances derived from root exudates and microbial activity. AgLime (agricultural limestone) Refers to calcitic or dolomitic limestone that has been crushed to a certain fineness making it capable of neutralizing soil acidty. Agronomy The branch of agriculture that deals with the theory and practice of field-crop production and soil management. Air-dry The state of dryness at equilibrium with the water content in the surrounding atmosphere. Alkaline Soil A soil with a water ph above 7.0. A soil having a preponderance of hydroxyl (OH - ) over hydrogen (H + ) ions in the soil solution. Alkalinity Refers to the ph of a soil or solution in which the hydroxyl ion (OH - ) concentration exceeds that of hydrogen ion (H + ) concentration, and therefore, the ph value is greater than 7.0 (see Acidity). Amino Acid An organic acid containing an amino group (NH 2 ), a carboxyl group (COOH), and an attached alkyl or aryl group. 389
421 390 Agronomic Handbook: Management of Crops, Soils, and Their Fertility Ammonium A cation consisting of one nitrogen (N) and four hydrogen (H) atoms to form a cation whose formula is NH 4 +. The ammonium (NH 4+ ) cation exists in the soil solution and on the soil s cation exchange complex and is combined with various anions to form N fertilizer sources. Anaerobic The absence of molecular oxygen (O 2 ). Anion An ion in solution having a negative charge. In chemical notation, the minus sign indicates the number of electrons the compound will give up. Anion Exchange Capacity The sum total of exchangeable anions that a soil can adsorb, and expressed as centimoles of charge per kilogram of soil. Atom The smallest unit of a substance that cannot be broken down further or changed to another substance by purely chemical means. Atomic Weight The average mass of a single atom of an element, expressed in terms of a dimensionless unit approximately equal to the mass of one hydrogen (H) atom. Atmospheric Demand The capacity of air surtounding the plant to absorb moisture. This capacity of the air will influence the amount of water transpired by the plant through its exposed surfaces. Atmospheric demand varies with changing atmospheric conditions. It is greatest when air temperature and movement are high, and relative humidity is low. The reverse conditions exist when the atmospheric demand is low. Available Nutrient Element in Soil A part of the supply of a plant nutrient element in soil that can be taken up by plants in amounts significant to plant growth. Availability A term used to indicate that an element is in a form and position suitable for plant root absorption. B Banding A method of fertilizer applications. Base Any compound that dissociates upon contact with water, releasing hydroxide (OH - ) ions. Base Saturation Percentage Refers to the percentage of the cation exchange capacity (CEC) of the soil colloids by the cations calcium (Ca 2+ ), magnesium (Mg 2+ ), potassium (K + ), and sodium (Na + ). Basic Slag A by-product in the manufacturer of steel, containing lime, phosphorus (P), and small amounts of other plant nutrients, such as sulfur (S), manganese (Mn), and iron (Fe). Beneficial Elements Elements not essential for plants but when present for plant use at specific concentrations enhance plant growth. Boron (B) An essential element classified as a micronutrient involved in energy transfer and carbohydrate movement. The element exists in the plant and soil solution as the borate anion (BO 3 3- ). Bray P1 Extraction Reagent An extraction reagent of 0.03N ammonium fluoride (NH 4 F) in N hydrochloric acid (HCl) for determining soil-extractable phosphorus (P) in acid soils of moderate cation exchange capacity (CEC). Bray P2 Extraction Reagent An extraction reagent of 0.03N ammonium fluoride (NH 4 F) in 0.1 N hydrochloric acid (HCl) for determining soil-extractable phosphorus (P) in acid soils of moderate cation exchange capacity (CEC) that have been either fertilized with rock phosphate or that have sizable content of calcium phosphate. Buffer Capacity A measure of the ability to maintain a constant ph by neutralizing excess acids or bases. Buffer ph (ph B ) ph of soil in a buffer solution that can be used to measure exchangeable hydrogen ions (H + ) and calculate the lime requirement (LR) (see Adams-Evans Buffer and SMP Buffer).
422 Appendix A: Soil/Plant Definitions 391 Bulk Density The ratio of the mass of water-free soil to its bulk volume. When expressed in grams per cubic centimeter, bulk density in numerically equal to appear specific gravity or volume weight. C Calcareous Soil A soil having a ph above 7.0 that effervesces when a drop of 6 M hydrochloric acid (HCl) is placed on it. Calcitic Limestone Mainly calcium carbonate (CaCO 3 ) finely ground and applied to soil to neutralize soil acidity. Calcium Carbonate Equivalent (CCE) An expression of the neutralizing capacity of a liming material relative to pure calcium carbonate (CaCO 3 ), which is 100%. Calcium (Ca) An essential element classified as a major element which serves as a specific component of organic compounds and exists in the soil solution as a cation (Ca 2+ ). Catalyst A substance whose presence causes or speeds up a chernical reaction between two or more other substances. Cation An ion having a positive charge. In chemical notation, the plus sign indicates the number of electrons the element will accept. Cation Exchange The interchange among cations in the soil solution with other cations taking place on the surface of any surface-active colloidal material, such as clay or humus. Cation Exchange Capacity (CEC) The total negative charge of colloidal clay and humus in soil measured in terms of exchange cation concentration in millequivalent per 100 grams (meq/100 g) of soil. Chelate A type of chemical compound in which a metallic atom [such as iron (Fe)] is firmly combined with a molecule by means of multiple chemical bonds. The term refers to the claw of a crab, illustrative of the way in which the atom is held. Chlorine (Cl) An essential element classified as a micronutrient which is involved in the evolution of oxygen (O) in photosystem II and raises cell osmotic pressure. Chlorine exists in the plant and soil solution as the chloride anion (Cl - ). Chlorite A layer-structured group of silicate minerals of the 2:1 type that has the interlayer filled with a positively charged metal-hydroxide octahedral sheet. Chlorophyll A complex molecule found in green plants that is directly involved in photosynthesis. Chlorosis A light green to yellow coloration of leaves or whole plants which usually indicates an essential element insufficiency or toxicity. Clay A soil particle (crystalline inorganic substances) less than millimeter in diameter. Coarse Texture The texture exhibited by sands, loamy sands, and sandy loams except very fine sandy loam. Colloid A material that has been subdivided into extremely small particles capable of forming a colloidal suspension, particle size smaller than millimeters ( inches) in diameter. Conductivity A measure of the electrical resistance of a soil water extract, or irrigation water, used to determine the level of ions in solution. Conductivity may be expressed as specific conductance as mhos/cm (micro- or milli-) or decisiemans/m (ds/m) (see Specific Conductance). Consistence The attributes of soil material as expressed in its degree of cohesion and adhesion or in its resistance to deformation or rupture. Copper (Cu) An essential element classified as a micronutrient which participates in electron transport, and protein and carbohydrate metabolism. Copper exists in the plant and soil solution as the cupric cation (Cu 2+ ). Critical Nutrient Concentration/Value The nutrient concentration in the plant, or specified plant part, below which the nutrient becomes deficient for optimum growth rate.
423 392 Agronomic Handbook: Management of Crops, Soils, and Their Fertility D Deficiency Describes the condition in which an essential element is not in sufficient supply or proper form to adequately supply the plant, or not in sufficient concentration in the plant to meet the plant s physiological requirement. Plants usually grow poorly and show visual signs of abnormality in color and structure. Deflocculate To separate the individual components of compound particles by chemical and/or physical means, and to cause the particles of the disperse phase of a collodial system to become suspended in the dispersion medium. Denitrification The conversion of organic or inorganic fixed nitrogen (N) to nitrogen (N 2 ) gas by either microbial activity or chemical reactions. Diffusion The movement of an ion in solution at high concentration to an area of lower concentration. Movement continues as long as the concentration gradient exists. Dolomitic Limestone Limestone that contains magnesium carbonate (MgCO 3 ), which may range from 4.4 to 22.6%. Pure dolimite is 54.3% calcium carbonate (CaCO 3 ) and 45.7% MgCO 3. Drip Irrigation Irrigation whereby water is slowly applied to the soil surface through emitters that have small orifices. DRIS An acronym for the Diagnosis and Recommendation Integrated System developed by Beaufils in 1973, which is based on nutrient relationships comparing an observed value to a corresponding ratio. E EC Acronym designating the electrical conductivity (EC) of a liquid or an extract from a soil, normally expressed in units of Siemens per meter (S/m) at 25 C. Effective Calcium Carbonate Equivalent (ECCE) An expression of AgLime effectiveness based on the combined effect of chemical purity (CCE) and fineness. Other similar terms are effective neutralizing power (ENP), total neutralizing power (TNP), and effective neutralizing material (ENM). Electron A tiny charged particle, smallest of the three principle constituents of the atom, with a mass of 9.1 x grams and a negative charge of 1.6 x coulomb. Element A substance made up entirely of the same kind of atom. Enzyme An organic compound that serves as a catalyst in metabolic reactions. Enzymes are complex proteins that are highly specific to particular reactions. Essential Elements Those elements that are necessary for higher plants to complete their life cycle. Also refers to the requirements established for essentiality by Arnon and Stout in Evaporation The conversion of a substance from the liquid state to the gaseous state. Evaporation occurs when a molecule of liquid gains sufficient energy (in the form of heat) to escape from the liquid into the atmosphere above it. Evapotranspiration The sum of evaporation and transpiration which varies with temperature, wind speed, type of vegetation, and relative humidity. Exchange Capacity The total ionic charge of the adsorption complex active in the adsorption of ions. Exchangeable Acidity Titratable acidity removed from strongly acid soils by a neutral, unbuffered salt solution. Exchangeable Anion A negatively charged ion held on or near the surface of a solid particle by a positive surface charge and which may be replaced by other negatively charged ions.
424 Appendix A: Soil/Plant Definitions 393 Exchangeable Cation A positively charged ion held on or near the surface of a solid by a negatice surface charge of a colloid and which may be replaced by other positively charged ions in the soil solution. Exchangeable Cation Percentage The extent to which the adsorption complex of a soil is occupied by a particular cation: ECP = exchangeable cation/cation exchange capacity x 100. Extractable Elements Those elements removed from the soil or dried plant tissue by means of an extraction reagent. Exchangeable Ions Ions held on the soil complex that may be replaced by other ions of like charge. Ions which are held so tightly that they cannot be exchanged are called nonexchangeable. Extraction Reagent A reagent that may be pure water, a mixture of acids, or buffered salts used to extract elements as ions from soil or plant tissue. F Fertilizer A substance added to the soil/plant system to aid plant growth or increase productivity by providing extra nutrient elements for plant use. Fertilizer Analysis The present composition of a fertilizer as determined in a laboratory and expresed as total nitrogen (N), available phosphoric acid (P 2 O 5 ), and water-soluble potash (K 2 O). Fertilizer Grade An expression that indicates the weight percentage of plant nutrient elements in a fertilizer; thus a grade contains 10 percent nitrogen (N), 20 percent phosphate (P 2 O 5 ), and 10 percent potash (K 2 O). Fertilizer Ratio The relative proportion of primary nutrient elements in a fertilizer grade divided by the highest common divisor for that grade; e.g., grades and have the ratio of Fertilizer Requirement The quantity of fertilizer needed to supply the difference between the nutrient element requirement of the crop and the nutrient element supplied by the soil. Fertilizer Salt Index The ratio of the decrease in osmotic potential of a solution containing a fertilizer compound or mixture to that produced by the same weight of sodium nitrate (NaNO 3 ) x 100. Fibrous Root System A plant root system consisting of a thick mat containing many short, slender, interwoven roots, without the presence of a taproot. Fine Texture Consisting of or containing large quantities of the fine fractions, particularly of silt and clay. Foliar Analysis An estimation of mineral nutrient deficiencies (excesses) of plants based on examination of the chemical composition of selected plant parts, and the color and growth characteristics of the foliage of the plants (see Leaf Analysis and Plant Analysis). Foliar Fertilization Supplying plant nutrient elements directly to plant foliage with absorption taking place through the stomata of the leaves and leaf cuticle. Free Space That portion, about 10%, of plant roots into which ions in the soil solution can passively enter the root without passing through a membrane. G Gibbsite Aluminum hydroxide [Al(OH) 3 ]. A mineral with a platy habit that occurs in highly weathered soils and in laterite. Gram A unit of mass in the metric system, equivalent to the mass of one cubic centimeter of water at maximum density (4 C). There are grams in an English pound.
425 394 Agronomic Handbook: Management of Crops, Soils, and Their Fertility Great Soil Group One of the categories in the system of soil classification that has been used in the United States. Great groups place soils according to soil moisture and temperature, base saturation status, and expression of horizons. Gypsum Common name for calcium sulfate (CaSO 4 2H 2 O), used for reclaiming alkali soils, and improving soil physical characteristics, and a source for sulfur (S), as calcium sulfate contains approximately 18% S. Another common name is landplaster. H Halloysite A member of the kaolin subgroup of clay minerals. Heavy Metals A group of metallic elements with relatively high atomic weights (>55) that generally have similar effects on biological functions. Elements such as cadmium (Cd), chromium (Cr), cobalt (Co), lead (Pb), nickel (Ni), and mercury (Hg) are frequently identified as heavy metals, as well as the micronutrients copper (Cu), iron (Fe), manganese (Mn), and zinc (Zn). Humic Acid The dark-colored organic material that can be extracted from soil by various reagents (e.g., dilute alkali) and that is precipitated by acidification to ph 1 to 2. Humidity The amount of water vapor in the air. Relative humidity is the ratio of the air s actual water content to the total amount of water vapor the same volume of air could theoretically hold under its current conditions of temperature and pressure. Humus Organic materials within the soil that have been partially decomposed, forming a relatively stable organic matrix that has colloidal properties and, in turn, has a marked affect on the physical and chemical properties of a soil. Hybrid An organism whose male and female parents are members of two separate and distinct genetic lines. Hydrocarbon Any compound that contains only hydrogen (H), oxygen (O), and carbon (C) in its molecular structure. Hydrogen Bond An electrostatic bond between an atom of hydrogen (H) in one molecule and an atom of another element in a neighboring molecule. Hydroponics A method of growing plants without soil in which the essential elements are supplied by means of a nutrient solution that periodically bathes the plant roots. Hydroscopic Capable of taking up moisture from the air. Hydroxide Any inorganic compound containing hydrogen (H) and oxygen (O) bound together in the form of a negatively charged ion (OH-). I Illite The mica component of a structurally mixed fine grained mica and smectite or vermiculite. Ion An atom that has lost or gained one or more electrons and has thus acquired a small positive or negative charge. Ion Carriers A proposed theory that explains how ions are transported from the surface of a root into root cells, the transport being across a membrane and a concentration gradient, the transport occurring by means of a carrier or carriers. Ion Exchange Refers to the phenomenon of physical chemical attraction between charged colloidal substances (such as clay and humus) with cations and anions. Ion Pumps A proposed theory that explains how ions are transported from the surface of a root into root cells, the transport being across a membrane and a concentration gradient Iron (Fe) An essential element classified as a micronutrient which is involved in the electronic transport systems in plants. Iron can exist as either the ferrous (Fe 2+ ) or ferric (Fe 3+ ) cation in the plant or soil solution. Irrigation The intentional application of water to the soil.
426 Appendix A: Soil/Plant Definitions 395 K Kaolin A subgroup name of aluminum silicates with a 1:1 layer structure. Kaolinite A clay mineral of the kaolin subgroup which has a general formula of Al 2 Si 2 O 5 (OH) 4, and 1:1 layer structure. Kriging A method based on the theory of regionalized variables for predicting without bias and minimum variance the spatial distribution of earth components, including soil properties. L Labile Pool The sum of an element in the soil solution and the amount of that element readily solubilized or exchanged when the soil is equilibrated with a salt solution. Landplaster see Gypsum. Leaching The removal of materials in solution from the soil. Leaf Analysis A method of determining the total elemental content of a leaf and relating this concentration to the well-being of the plant in terms of its elemental composition (see Foliar Analysis and Plant Analysis). Lignin A complex organic compound found as a constituent of the walls of plant cells. Lime A term that generally refers to agricultural lime, as either ground limestone (calcium carbonate), hydrated lime (calcium hydroxide), or burned lime (calcium oxide), although it strictly refers to calcium oxide (CaO). Lime Requirement (LR) The amount of AgLime (agricultural limestone, either calcitic or dolomitic) required to neutralize soil acidity by raising an acid soil to a higher ph level. Loam The textural class name for soil having a moderate amount of all three soil seperates, sand, silt, and clay. Luxury Consumption The uptake by a plant of an essential element in excess of its actual need. M Macronutrients see Major Essential Elements. Magnesium (Mg) An essential element classified as a major element which is a constituent of the chlorophyll molecule and serves as an enzyme cofactor for phosphorylation processes. Magnesium exists in the plant and soil solution as a cation (Mg 2+ ). Major Essential Elements The nine essential elements found in relatively large concentrations (>500 mg/kg) in mature plant tissues. These elements are: calcium (Ca), carbon (C), hydrogen (H), oxygen (O), magnesium (Mg), nitrogen (N), phosphorus (P), potassium (K), and sulfur (S). Manganese (Mn) An essential element classified as a micronutrient which is involved in the oxidation-reduction processes and enzyme activator. Manganese exists in the plant and soil solution as a cation in several oxidation states (Mn 2+, Mn 3+, Mn 4+ ). The most common oxidation state is Mn 2+. Manure The excreta of animals, with or without an admixture of bedding or litter, fresh or at various stages of further decomposition or composting, which can be used as fertilizer. Marl Soft and unconsolidated calcium carbonates, usually mixed with varying amounts of clay or other impurities. Mass Flow The movement of ions in soil as a result of the flow of water. Mechanical Analysis Technique for the determination of the percent of sand, silt, and clay in a soil sample to identify its textural class. Mehlich Buffer A buffer method for determining exchangeable acidity and the lime requirement (LR) for both mineral and organic soils.
427 396 Agronomic Handbook: Management of Crops, Soils, and Their Fertility Mehlich No. 1 Extraction Reagent An extraction reagent of 0.05N hydrochloric acid (HCl) in N sulfuric acid (H 2 SO 4 ) for extracting phosphorus (P), potassium (K), calcium (Ca), magnesium (Mg), sodium (Na), and zinc (Zn) from acid sandy soils of low cation exchange capacity (CEC) and low organic matter (OM) content. Mehlich No. 3 Extraction Reagent An extraction reagent of 0.2N acetic acid (CH 3 COOH) N ammonium fluoride (NH 4 F) N ammonium nitrate (NH 4 NO 3 ) N nitric acid (HNO 3 ) M EDTA for extracting phosphorus (P), potassium (K), calcium (Ca), magnesium (Mg), sodium (Na), boron (B), and zinc (Zn) from acid to neutral ph soils. Metabolism The set of chemical reactions taking place within the living cell that allows energy to be used and transferred and tissues to be constructed and repaired. Metal Any element that has a positive valence, that is, one that gives up electrons when forming ionic compounds. Mica A layer-structured aluminosilicate mineral group of the 2:1 type that is characterized by its high layer charge, which is usually satisfied by potassium (K). Micronutrient Seven essential elements found in relatively small concentrations (< 100 mg/kg) in plant tissue. These elements are boron (B), chlorine (Cl), copper (Cu), iron (Fe), manganese (Mn), molybdenum (Mo), and zinc (Zn) (see Trace Elements). Mineral A term used to identify an essential element. Mineral Nutrition The study of the essential elements as they relate to the growth and the well-being of plants. Mineral Soil A soil consisting predominantly of, and having its properties determined predominantly by, mineral matter. Molecular Weight The weight of one molecule, ion, group, or other formula unit. The molecular weight is the sum of the atomic weights of the atoms that combine to make up the formula unit. Molecule The smallest unit that a compound may be divided into and still retain its physical and chemical characteristics. Molybdenum (Mo) An essential element classified as a micronutrient which is a component of two enzyme systems that are involved in the conversion of nitrate (NO 3 ) to ammonium (NH 4 ). Montimorrillonite An aluminum silicate (smectite) with a layer structure composed of two silica tetrahdral sheets and a shared aluminum (Al) and magnesium (Mg) octahedral sheet. Morgan Extraction Reagent An extraction reagent of 0.7N sodium acetate (NaC 2 H 3 O 2 ) and 0.54 N acetic acid (CH 3 COOH) buffered at ph 4.8 for determining soil-extractable phosphorus (P), potassum (K), calcium (Ca), and magnesium (Mg) in acid soils of moderate cation exchange capacity (CEC) (see Wolf Modification). Muriate of Potash Potassium chloride (KCl). N Neutral Soil A soil in which the surface layer, at least in the tillage zone, is in the ph 6.6 to 7.3 range. Nitrate An anion of one atom of nitrogen (N) and three of oxygen (O) to form NO 3, which is a common form of N found in soils and that can be readily absorbed by plant roots in order to satisfy the N requirement of a plant. Nitrification The formation of nitrate (NO 3 ) and nitrite (NO 2 ) from ammonium (NH 4 ) by soil microorganisms.
428 Appendix A: Soil/Plant Definitions 397 Nitrite An anion of one atom of nitrogen (N) and two of oxygen (O) to form NO 2, a reduced form of N that exists mostly under anaerobic conditions and is a form of N that is highly toxic to plants. Nitrogen (N) An essential element classified as a major element which is a component of amino acids and proteins. Nitrogen exists in the atmosphere as a gas, and in the plant and soil solution as either the nitrate (NO 3- ) anion or the ammonium (NH 4+ ) cation. Nitrogen Fixing Bacteria Any of several genera of bacteria that have the ability to convert atmospheric nitrogen (N 2 ) into ammonium (NH 4 ) and nitrate (NO 3 ), which can then be used by other organisms. Nutrient Element In plant nutrition use, refers to one of the essential elements and is frequently refered to as nutrient. O Olsen Extraction Reagent An extraction reagent of 0.5 N sodium bicarbonate (NaHCO 3 ) at ph 8.5 for determining phosphorus (P) in primarily alkaline soils. Organic Matter Material that was formed by the bodily processes of an organism and as plant residues. Decaying organic matter (plant and organism residues) can be a source of essential plant nutrient elements, primarily nitrogen (N), phosphorus (P), sulfur (S), and boron (B). Organic Soil A soil which contains a high percentage (>200 g/kg, or > g/kg if saturated with water) of organic carbon (C) throughout the solum. Orthophosphate A molecular ion containing phosphorus (PO 4 3-, HPO 4 2-, H 2 PO 4 - depending on soil ph). Osmosis The passage of water or another solvent through a membrane in response to differences in the concentrations of dissolved materials on opposite sides of the membrane. Osmotic Pressure Force exerted by substances dissolved in water which affects water movement into and out of plant cells. Salts in the soil solution exert some degree of force which can restrict water movement into plant root cells or extract water from them. Oven-Dried-Soil Soil that has been dried at 100 C until it reaches constant mass. Oxygen (O 2 ) An essential element classified as a major element. P Parent Material The unconsolidated and more or less chemically weathered mineral or organic matter from which the solum or soils is developed by pedogenic processes. Particle Density The density of the soil particles, the dry mass of the particles being divided by the solid (not bulk) volume of the particles, in contrast with bulk density. Units are mg/cm 3. Particle Size The effective diameter of a particle measured by sedimentation, sieving, or micrometric methods. Parts per Million (ppm) Number of units by weight of a substance per million weight units of another. Passive Absorption The movement of ions into plant roots carried along with water being absorbed by roots. Percolation, Soil Water The downward movement of water through soil. Petiole The stem of a leaf which connects the base of the leaf blade to the stem. ph A measure of the acidity or basicity of a liquid; a measure of the number of hydrogen (H + ) ions present in the liquid (in moles/l), expressed as the negative logarithm. ph ranges from 1 (acid) to 10 (alkaline).
429 398 Agronomic Handbook: Management of Crops, Soils, and Their Fertility Phloem The tissue system of a vascular plant through which the sugar and other food substances formed in the leaves are conducted to other parts of the plant. The direction of flow is downward, the driving force being osmotic pressure. Phosphorus (P) An essential element classified as a major element which is a component of several enzymes and proteins, and an element involved in various energy transfer systems in the plant. Phosphorus exists in the soil solution as an anion in various forms (PO 4 3-, HPO 4 2+, H 2 PO 4 2- ) depending on the soil ph. Photosynthesis The synthesis of carbohydrates from carbon dioxide (CO 2 ) and water (H 2 O) by living organisms utilizing light energy as an energy source which is catalyzed by chlorophyll according to the following formula: 6CO 2 + 6H 2 O + light C 6 H 12 O 6 + 6O 2. Plant Analysis A method of determining the total elemental content of the whole plant or one of its parts, and then relating the concentration found to the well-being of the plant in terms of its elemental requirement (see Foliar Analysis and Leaf Analysis). Plant Nutrient Elements A term used to identify those elements that are essential to plants. Plant Nutrient An element that is required by plants for normal growth and development. Plant Nutrition The study of the effects of the essential as well as other elements on the growth and well-being of plants. Plant Requirement That quantity of an essential element needed for the normal growth and development of the plant without inducing stress due to its deficiency or excess. Porosity The volume of pores in a soil sample (nonsold volume) divided by the bulk volume of the sample. Potash Designates potassium oxide (K 2 O) content in a fertilizer. Potassium (K) An essential element classified as a major element which maintains cellular turgor. Potassium exists in the plant and soil solution as a cation (K + ). ppb An abbreviation for parts per billion, which is 1/1000 of a part per million, expressed in metric units as micrograms per kilogram (pg/kg) in weight units and micrograms per liter (µg/l) in liquid units. ppm An abbreviation for parts per million, expressed in metric units as milligrams per kilogram (mg/kg) in weight units and milligrams per liter (mg/l) in liquid units. R Residual Fertility The available nutrient content of a soil carried over to subsequent crops. Respiration The set of processes through which energy is obtained from sugars and other carbohydrates in the body of a living organism. Rhizophere The zone of soil immediately adjacent to plant roots in which the kinds, numbers, or activities of microorganisms differ from that of the bulk soil. Root Interception A concept of ion uptake by plant roots which is enhanced by the increased occupancy of the soil mass by roots and root characteristics. S Saline Soil A soil containing sufficient soluble salts to impair plant growth, having an electric conductivity (EC) greater than 4 ds/m in a saturation extract. Saline/Sodic Soil A soil containing a sufficiently high combination of both salts and sodium (Na) to impair plant growth. Salt Index An index used to compare solubilities of fertilizer compounds, usually based on the relationship with sodium nitrate (NaNO 3 ) which is set at 100. Salt Tolerance The ability of plants to resist the adverse, nonspecific effects of excessive soluble salts in the rooting medium.
430 Appendix A: Soil/Plant Definitions 399 Salt ph Measurement of the soil water ph in a solution of either 0.01M calcium chloride (CaCl 2 ) or 1N potassium chloride (KCl). Sand A soil particle between 0.05 and 2.0 mm in diameter. Saturation Extract The solution extracted from soil at its saturation percentage. Scorch Burned leaf margins, a visual symptom typical of potassium (K) deficiency or boron (B) and chloride (Cl) excess. Separates Refers to three sizes of particles in soil: sand, silt, and clay (see Mechanical Analysis). Silt A soil particle consisting of particles between 0.05 to mm in equivalent diameter. SMP Buffer A buffer solution used to measure exchangeable hydrogen ions (H + ) for determining the lime requirement (LR) of acid soil, with cation exchange capacities (CEC) greater than 10 meq/100 g (see Adams-Evans Buffer). Sodic Soils A soil containing sufficient exchangeable sodium (Na) to affect its physiological properties and impair plant growth, usually having greater than 15% exchangeable cations. Sodium Adsorption Ratio A ratio for soil extracts and irrigation waters used to express the relative activity of sodium ions in exchange reactions with soil, expressed in milliequivalents per liter: SAR = Na + /(Ca 2+ + Mg 2+ ) 1/2 /2. Soil Auger A tool for boring into the soil and withdrawing a small sample for field or laboratory observation. Soil Characteristics Soil properties which can be described or measured by field or laboratory observations, e.g., color, temperature, water content, structure, ph, and exchangeable cations. Soil Chemistry The branch of soil science that deals with the chemical constitution, chemical properties, and chemical reactions of soils. Soil Extract The solution separated from soil suspension or from a soil by filtration, centrifugation, suction, or pressure. Soil Horizon A layer of soil or soil material approximately parallel to the land surface and differing from adjacent genetically related layers in physical, chemical, and biological properties or characteristics such as color, structure, texture, consistency, kinds and number of organisms present, degree of acidity or alkalinity, etc. Soil Organic Matter The organic fraction of the soil exclusive of undecayed plant and animal residue. Soil Permeability Quality of soil that enables water or air to move through it. Soil Profile A vertical section of the soil extending through all its horizons. Soil ph A measure of the hydronium ion (H 3 O + ) activity in the soil solution. Soil Salinity The amount of soluble salts in a soil. Soil Sample A representative sample taken from an area, a field, or portion of a field from which the physical and chemical properties can be determined. Soil Science That science dealing with soils as a natural resource on the surface of the earth, including soil formation, classification and mapping, and physical, chemical, biological, and fertility properties of soils per se; and these properties in relation to their use and management. Soil Separate One of individual-size groups of mineral soil particles, sand, silt, and clay. Soil Series A group of soils that have soil horizons similar in their differentiating characteristics and arrangement in the soil profile, except for the texture of the surface soil, and that are formed from a particular type of parent material. Soil Solution The liquid, water phase of the soil which contains solutes. Soil Structure The physical arrangements of the soil particles. Soil Test (Analysis) A series of analytical procedures used to determine the fertility status of a soil in terms of plant growth, and the need for lime and fertilizer additions.
431 400 Agronomic Handbook: Management of Crops, Soils, and Their Fertility Soil Test (Analysis) Calibration A two-stage pocedure to determine first the agronomic meaning of a soil test value (index) in terms of a particular crop response, and then to establish the amount of nutrient element(s) required for specific crops within each category to achieve optimum yield. Soil Test (Analysis) Correlation A determination of the relationship between plant nutrient element uptake or yield, and the amount of nutrient element extracted by a soil test (analysis) procedure. Soil Test (Analysis) Deficiency Critical Level That concentration of an extractable nutrient element below which deficiency occurs and above which sufficiency exists. Soil Test (Analysis) Toxic Critical Level That concentration of an extractable nutrient element above which toxicity is likely to occur Soil Test (Analysis) Value A nutrient element level expressed in either concentration or as an index value. Soil Test Interpretation Category An interval of soil test (analysis) values associated with corresponding probabilities of response by a specific crop to a nutrient element application. Soil Texture A method of soil calssification based on the precentage of sand, silt, and clay found in the soil (see Mechanical Analysis and Separates). Soluble Salts Total soluble ions (anions and/or cations) in a soil and measured as the conductivity (EC) of a soil water suspension or extract (see Conductivity). Specific Conductance The reciprocal of the electrical resistance of a solution measured using a standard cell, expressed as mhos/cm (ds/m) at 25 C (77 F) (see Conductivity). Standard Value The mean concentration of an element in plant tissue based on the analysis results from a large population of normal growing plants. Sufficiency and Sufficiency Range The adequate supply of an essential element to the plant. Also, an adequate concentration of an essential element in the plant to satisfy the plant s physiological requirement. The plant in such a condition will look normal in appearance, be healthy and capable of high production. Sulfur (S) An essential element classified as a major element which is a component of some proteins and is a component of glucosides that are the source for the characteristic odors of some plants. Sulfur exists in the plant and soil solution as the sulfate anion (SO 4 2- ). Surface Soil The uppermost part of the soil, ordinarily moved in tillage, or its equivalent in uncultivated soils and ranging in depth from 7 to 20 cm. Symbiotic Bacteria Relates to bacteria that infect plant roots of legumes, forming nodules on the roots, fixing atmospheric nitrogen (N 2 ), thereby providing nitrogen (N) for the plant and obtaining their carbohydrates from the plant. T Tilth The physical condition of a soil with respect to its fitness for the growth of plants. Tissue Testing A method for determining the concentration of the soluble form of an element in the plant by analyzing sap that has been physically extracted from a particular plant part, usually from stems or petioles. Tests are usually limited to the determination of nitrate (NO 3 ), phosphate (PO 4 ), potassium (K), and iron (Fe). Topsoil The layer of soil moved in cultivation. Toxicity The ability of a substance or element to disrupt the normal functions of a plant. Trace Elements An obsolete term which was used to identify the micronutrients but today is used to identify those nonessential elements found in plant tissue in very low concentrations (see Micronutrients and Heavy Metals). Tracking A technique of following through time the essential element content of the rooting media or plant by a sequence of analyses made at specified stages of plant growth.
432 Appendix A: Soil/Plant Definitions 401 Transpiration Loss of water vapor from leaves and stems of living plants to the atmosphere. Tundra A level or undulating treeless plain characteristic of arctic regions. V Vermiculite A highly charged layer-structured silicate of the 2:1 type that is formed from mica. W Water Dihydrogen oxide (H 2 O). Among the most familiar and ubiquitous of all chemicals, water is also among the most unusual, with a group of unique properties that place it in a class by itself. Water is highly polar, can exist as all three phases of matter liquid, solid, and gaseous, has an extremely high surface tension, and is an excellent solvent. Water ph (phw) A measure of the hydrogen ion (H + ) concentration in the soil solution on a log scale from 0 to 14. Water-Holding Capacity The weight of water held by a given quantity of absolutely dry soil when saturated. Water Table The upper surface of ground water or that level in the ground where the water is at atmospheric pressure. Wolf Modification The addition of diethylenetriaminepentaacetic acid (DTPA) to the Morgan extraction reagent to obtain the extractable micronutrients (see Morgan Extraction Reagent). X Xylem The tissue of a vascular plant through which water and minerals are transported upward from roots to the leaves. Y Yield The amount of a specified substance produced (e.g., grain, straw, total dry matter) per unit area. Z Zinc (Zn) An essential element classified as a micronutrient which is involved in several enzymatic functions in plants. Zinc exists in the plant and the soil solution as a cation (Zn 2+ ).
433
434 Appendix B Botanical Definitions Apical Situated at the tip of a stem. Auricle Small lobe or ear; appendage to a leaf. Awn Bristle-like appendage that form a beard on a plant. Awned Having awns. Axil Angle between the upper side of a leaf or stem and the supporting branch. Chlorosis Loss of green color; plant tissue turns yellow or white; adjective is chlorotic. Cotyledon Primary or rudimentary leaf of the embryo of a seed plant. Dieback Deaths of leaves or growing buds; symptoms are not limited to single leaves or sections of leaves; they spread over the whole plants or leaves. Glume Chaff-like bract in the spikelet of a grass. Internode Area or part of a stem between two leaf nodes. Interveinal Affecting only the tissue between the veins of a leaf. Lamina Blade or flat surface of a leaf; attached to the stem directly or by a petiole. Leaf base Section of a leaf nearest the point of attachment to the stem; opposite to the leaf tip. Leaf tip Section of the leaf furthest from the point of attachment to the stem; opposite to the leaf base. Leaflet Blade or separate division of a compound leaf. Lesion Discrete or localized area of tissue that is chlorotic or necrotic, has distinct boundaries, and is surrounded by apparently healthy tissue. Localized Symptom limited to one leaf or one section of a leaf or plant. Marginal Localized symptom occurring on the margins of the lamina. Meristem Growing tissue of small plant cell. Mottling Blotchy pattern of indistinct light and dark (opaque and vitreous in grain) areas; irregularly spotted surface. Necrosis Dead tissue; usually has brown, papery appearance; adjective is necrotic. Petiole Stalk that attaches the leaf lamina to the stem. Tiller Sucker or branch from the bottom of the stem. Veins Vascular leaf bundles. Weathertip Deaths of leaf tips or tips of ears or heads of cereals; they usually turn pale brown to white. Wilting Condition of a plant when cells lack water and lose their turgidity; leaves, petioles, and stems droop. 403
435
436 Appendix C Nutrient Element Requirements for Several Agronomic Crops (based on crop removal and/or growth response) Agronomic Crop Scientific Name Major Element Requirement Levels N P K Ca Mg S Barley Hordeum vulgare M L L L L L Cassava Manihot L L H L L M esculenta Corn, grain Zea mays H M M M M M Oat Avena sativa L L L L L L Peanut Arachis hypogaea M L L H L M Rice Oryza sativa L L L L VL L Rye Secale cereale L VL VL (M) (M) L Sorghum Sorghum bicolor H M M L M M Soybean Glycine max VH M M M L M Sugar beet Beta vulgaris H L VH (M) H H Wheat Triticum aestivum L L L L L L Micronutrient Element Requirement Levels B Cu Fe Mn Zn Barley Hordeum vulgare L M (M) M H Cassava Manihot M L M M H esculenta Corn, grain Zea mays L (M) H (M) (M) Oat Avena sativa L M M H M Peanut Arachis hypogaea L H H M M Rice Oryza sativa L L M H M Rye Secale cereale L L M L L Sorghum Sorghum bicolor (L) (M) H M H Soybean Glycine max L M M M H Sugar beet Beta vulgaris M L M H M Wheat Triticum aestivum L M L M L VL = very low; L = low; M = medium; H = high; VH = very high. Requirements shown in parentheses designate levels assumed and not clearly known. If crop removal and/or growth response to an element are unknown, a medium (M) requirement is assumed. The only exception is boron (B), for which a low (L) requirement is always assumed. 405
437
438 Appendix D Troublesome Weeds Weed spectra vary widely by crop and growing region. While some weeds flourish over wide geographic areas, local environmental conditions and production practices exert big impacts on weed populations, weed species, and degrees of difficulty of control. For example, a survey of corn from the Southern Weed Science Society s 12 states included 47 weeds. The list was narrowed to 10. Listed below are some of the most troublesome weeds most commonly cited by university weed-control specialists. They are listed in no particular order. Southern corn Midwest corn and soybeans Southern soybeans Southern cotton Johnsongrass Ragweed Morning glory Morning glory Morning glory Waterhemp Sicklepod Nutsedge Broadleaf signalgrass Canada thistle Johnsongrass Cocklebur Texas panicum Johnsongrass Nutsedge Bermudagrass Sicklepod Lambsquarters Cocklebur Velvetleaf Cocklebur Shattercane Pigweed Sicklepod Pigweed Hemp dogbane Ragweed Pigweed Burcucumber Foxtail Bermudagrass Spurge Nutsedge Velvetleaf Lambsquarters Palmer amaranth Fall panicum Cocklebur Palmer amaranth Prickly sida Source: Troublesome weeds, Progressive Farmer, January STEPS TO STOP RESISTANT WEEDS Scout fields before applying any herbicide to identify the weed species and to decide, based on economic levels, whether a herbicide application is necessary. Rotate crops with an accompanying rotation of herbicides with the same mode of action on the same field. Limit the number of applications of a single herbicide or a combination of herbicides with the same mode of action during a single growing season. Mix or sequentially treat using herbicides that each control the weeds in the fields but have different modes of action. Scout fields after application to detect weed escapes or shifts. If you find a potentially resistant weed or weed population, use available control methods to avoid seed deposition in the field. Clean equipment before leaving fields suspected of having resistant weeds. Note: The Weed Science Society of America management guidelines. Source: Steps to stop resistant weeds, Progressive Farmer, September
439
440 Appendix E Legumes: Nutrient Element Deficiency Symptoms Symptom Deficient Element Effects Spread throughout Plants or Confined to Older or Lower Leaves Generalized on whole plant; yellowing and drying or firing of lower leaves Light green plant; lower leaves affected first; other leaves soon follow; lower leaves fade to pale yellow, then brown; subsequent shedding; stunted growth due to lack of nitrogen fixation by bacteria Dark green plant; petioles and leaflets tilted upward; spindly, stunted plants; stems may turn red Light green plant; lower leaves die and drop prematurely Localized; mottling or chlorosis with or without leaf spots; little drying of lower leaves Areas between main veins become pale green; later turn deep yellow; bases and lower centers of leaves are not affected; deficiency appearing at a late stage of growth is shown by a downward curling of leaf margins, gradual yellowing from margins inward, and bronzing Yellow mottling around the edges of leaves; chlorotic areas merge to form distinct, continuous yellow borders around tip ends and along sides of leaves that soon dry; dead tissue falls; leaves on small-leaved legumes tend to develop small white spots around the leaf margins first; stunted growth Brown spots and yellowing of leaf tissue develop between veins; dead tissue drops from chlorotic areas; stunted growth Nitrogen Phosphorus Molybdenum Magnesium Potassium Zinc Effects Localized on Newer Leaves Stunted growth; terminal buds die following distortions at the tips or bases of young leaves Leaves yellowed and sometimes reddened near growing points; lower leaves remain healthy green color; internodes shorten and form rosettes; buds appear as white or light brown dead tissues; little flowering Emergence of primary leaves delayed; emerged leaves are cup-shaped; primary leaves are necrotic; narrow chlorotic bands develop around remainder of leaves; terminal buds deteriorate; petioles break down Stunted growth; terminal buds remain alive Leaves turn light green to yellow; veins remain distinctly green; spots of dead tissue appear on leaves; heavy rains may cause chlorosis in young leaves to disappear Leaves turn yellow to almost white; principal veins remain green; spots of dead tissue appear, particularly at leaf margins; tissue drops away Leaves including veins turn pale green to yellow; young leaves affected first Young leaves wilt and wither without chlorosis; excessive leaf shedding Boron Calcium Manganese Iron Sulfur Copper 409
441
442 Appendix F Characteristics of Essential Nutrient Elements BORON (B) Functions in Plants: A micronutrient associated with carbohydrate chemistry, B is believed to be important in the synthesis of uracil, a base for RNA formation and in cellular activities (division, differentiation, maturation, respiration, growth, etc.). Boron has long been associated with pollen germination and growth. It improves the stability of pollen tubes. It is relatively immobile in plants and is transported primarily in the xylem. Content and Distribution: Boron requirements are separated by plant groups: Leaf content of monocots, 1 to 6 ppm B Dicots, 20 to 70 ppm B Dicots with latex systems, 80 to 100 ppm B Boron tends to accumulate in leaf margins at concentrations 5 to 10 times those in leaf blades. Levels can increase enough to produce marginal burning and deaths of leaf margins. High Ca content creates a high B requirement; high K content accentuates the negative effects of low B tissue levels. B can exist in a plant as the borate (BO 3 3- ) anion. Movement in Soil and Plant Root Absorption: Boron moves in soil by mass flow and diffusion. Deficiency occurs when soil moisture levels are low for extended periods or after a long period of heavy rainfall that causes leaching. Mobility: Immobile Forms Utilized: Borate (BO 3 3- ) anion and H 3 BO 3 molecule. Fertilizer Sources: Source Formula % B Boric acid H 3 BO 3 17 Fertilizer borate, 48 Na 2 B 4 O 7 10H 2 O Fertilizer borate, granular Na 2 B 4 O 7 10H 2 O 14 Ca 2 B 6 O 11 5H 2 O 10 Foliarel Na 2 B 8 O 13 H 2 O 21 Solubor Na 2 B 4 O 7 4H 2 O + Na 2 B 10 O 16 10H 2 O 20 Borax Na 2 B 4 O 7 10H 2 O 11 Hydroponic Reagent Sources: Compound Formula % B Boric acid H 3 BO 3 16 Solubor Na 2 B 4 O 7 4H 2 O + Na 2 B 10 O 16 10H 2 O
443 412 Agronomic Handbook: Management of Crops, Soils, and Their Fertility Concentration in Nutrient Solutions: 0.3 mg B/L (ppm). Symptoms of Deficiency: Slowed and stunted new growth, with possible death of growing points and root tips (meristematic tissues); lack of fruit set and development; auxins accumulate at growing points; leaves and stems become brittle. Symptoms of Excess: Leaf tips become yellow, followed by necrosis, as B accumulates in leaf margins; margins die; leaves assume a scorched appearance and fall prematurely. Critical Level: 25 mg B/kg (ppm) in dry matter. Reference Plant Content (Markert, 1994): 40 mg B/kg (ppm) in dry matter. Available Forms for Plant Root Absorption: Most B in soil exists in organic plant and microorganism residues. Its release by residue decomposition serves as the major supply for crop utilization. It exists in the soil solution as the BO 3 3- anion, although recent findings suggest it can also exist as undissociated B(OH) 3. Since the major soil form is undissociated and neutral in charge, the primary loss of B from soils is by leaching. Leaching is also a common way to remove excess B from the surface soil and rooting zone. Generally, total B in the soil can range from 20 to 200 ppm, while the amount available for absorption ranges from 1 to 5 ppm in the soil solution. The accepted range of B is narrow. A deficiency occurs when a hot water extract contains less than 1 ppm. Toxicity occurs at levels above 5 ppm. Boron availability is also influenced by soil water ph; the optimum range for maximum availability lies between 5.5 to 7.0. Movement in Soil and Plant Root Absorption: Boron moves in soil by mass flow and diffusion, with deficiency occurring when soil moisture levels are low for extended periods, or after a long period of heavy, leaching rainfall. Sufficiency Ranges: Plant (Scientific Name) Plant Part (Time of Sampling) B mg/kg (ppm) in Dry Matter Cassava (Manihot esculenta) 25 mature leaves from new growth (vegetative stage) to 30-cm bark sections from main stem just above the soil (14-month old plants) Alfalfa/Lucerne (Medicago sativa) 12 tops (6 new growth, prior to flowering) Bahia grass (Paspalum notatum) 50 leaf blades (summer) 9 Bird s-foot trefoil (Lotus 50 mature leaves (first flower) corniculatus) Clover Alsike (Trifolium hybridum) 20 whole tops (first flower) Red (Trifolium pratense) 15 whole tops (prior to flowering) Ladino/White (Trifolium repens f. 50 mature leaves (prior to flowering) lodigense) Subterranean (Trifolium 75 mature leaves from new growth (prior to flowering) subterraneum) Coastal Bermudagrass (Cynodon 40 whole plants (4- to 5-week old plants) 6 30 dactylon) Corn (Zea mays) 15 whole tops (plants <12 tall) leaves below the whorl (prior to tasseling) ear leaves (initial silk) 4 25 Cotton (Gossypium hirsutum) 25 vegetative stems (first squares to intial bloom) vegetative stems (full bloom) Peanut/Ground nut (Archis 50 whole plants (prior to or at bloom stage) hypogaea) 25 whole tops (early pegging) Rice (Oryza sativa) 25 mature leaves from new growth (maximum tillering) mature leaves from new growth (panicle initiation) 6 10 Rye (Secale cereale) 25 whole tops (panicle initiation) 4 13
444 Appendix F: Characteristics of Essential Nutrient Elements 413 Plant (Scientific Name) Plant Part (Time of Sampling) B mg/kg (ppm) in Dry Matter Sorghum (Sorghum bicolor) 25 whole tops (seedlings <30 cm tall, 23- to 39-day old 4 13 plants) 25 mature leaves from new growth (37 to 56 days after 1 10 planting) 25 leaves, third leaf below head (plants at bloom stage, 1 10 heads visible) 25 leaves, third leaf below head (grain in dough 1 6 condition) Soybean (Glycine max) 25 mature leaves from new growth (prior to pod set) Sugar beet (Beta vulgaris) 25 leaves (50 80 after planting) Sugarcane (Saccharium officinanum) 15 leaves, third leaf from tip (3 to 5 months after planting) 4 30 Sunflower (Helianthus annuus) 25 mature leaves from new growth (summer) Timothy (Phleum pratense) 25 whole plants (early anthesis) 1 10 Wheat, spring (Triticum aestivum) 25 whole tops (as head emerges from boot) 6 10 Toxic Level: >100 mg B/kg (ppm) in dry matter. Major Antagonistic Elements: Ca, P, K, and N. Major Synergistic Elements: P and N. Agronomic Crops Susceptible to Deficiency: Alfalfa, clover, cotton, peanut, and sugar beet. Soil Conditions for Deficiency: Acid sandy soils low in organic matter, overlimed soils, and organic soils. Typical Concentration in Foliage of Normal Crops: 15 to 100 mg B/kg in dry matter, 0.2 to 1.3 mm cell sap content. Concentration in Environment: mol B per m 3. Most Important Sources: Tourmaline, accessory in silicates and salts. Usual Soil Content: 5 to 100 mg B/kg. CALCIUM (Ca) Functions in Plants: Calcium is a major element. It plays an important part in maintaining cell integrity and membrane permeability, enhances pollen germination and growth, and activates enzymes for cell mitosis, division, and elongation. Calcium may also be important for protein synthesis and carbohydrate transfer, and may detoxify heavy metals in plants. Content and Distribution: Calcium content ranges from 0.20 to 5.00% of dry weight in leaf tissue, with sufficiency ranges from 0.30 to 3.00% in leaf tissue of most crops. Critical values vary considerably among various crop species and are lowest for grain crops and highest for some vegetable and most fruit crops. Highest concentrations are found in older leaves as the content in leaves tends to increase with age. High-yielding crops contain from 10 to 175 lbs Ca per acre (11 to 196 kg per ha). Calcium removal is lower for grains and most fruit crops when only the grain or fruit is removed, leaving behind the plant which contains most of the Ca. The relationship between Ca and K is as well known as the one between Ca and Mg. The ratios are used as DRIS norms for the interpretation of plant analysis results. The ratio of Ca to N in fruit crops and a similar ratio of Ca and B may be related to quality. Ammonium nutrition can create a Ca deficiency by reducing Ca uptake. It has been suggested that total Ca content does not relate to sufficiency, since it accumulates in some plants as crystals of calcium oxalate. Extractable Ca (in 2% acetic acid) may be a better indicator of sufficiency. The critical concentration for soluble Ca is around 800 ppm, a concentation suggested as a true critical value for most plants.
445 414 Agronomic Handbook: Management of Crops, Soils, and Their Fertility It is generally assumed that if soil ph is within acceptable range in the rooting media, Ca should be of sufficient concentration to ensure sufficiency, assuming other factors are also within normal ranges. Soil ph seems to have little effect on Ca uptake. Available Forms for Plant Root Absorption: Calcium exists as the Ca 2+ cation in the soil solution and as exchangeable Ca on soil colloids. It is usually the cation of highest concentration in both soluble and exchangeable forms in high ph soils (>8.0), soils that may contain sizable quantities of Ca as precipitates of CaCO 3 and CaSO 4. Movement in Soil and Plant Root Absorption: Calcium moves in the soil by mass flow, the dominant supply factor, and diffusion. Its availability can be significantly affected by soil moisture level. Reduced evapotranspiration will also reduce root uptake. Mobility: Immobile Form Utilized: Ca 2+ cation Calcium Liming and Fertilizer Sources : Carrier Formula % Ca Liming Materials Blast furnace slag CaSiO 3 29 Calcitic limestone CaCO 3 32 Dolomitic limestone CaCO 3 + MgCO 3 22 Hydrated lime Ca(OH) 2 46 Precipitated lime CaO 60 Fertilizers Calcium nitrate Ca(NO 3 ) 2 19 Superphosphate, normal Ca(H 2 PO 4 ) 2 + CaSO 4 2H 2 O 20 Superphosphate, triple Ca(H 2 PO 4 ) 2 14 Others Gypsum CaSO 4 2H 2 O 23 Gypsum (by-product) CaSO 4 2H 2 O 17 (varies) Gypsum (impure) CaSO 4 2H 2 O 15 (varies) For acid soils, it is assumed that maintaining ph within the optimum range (5.8 to 7.5) by frequent liming will provide sufficient Ca to meet crop requirements. Hydroponic Reagent Sources: Compound Formula % Ca Calcium chloride CaCl 2 36 (64% Cl) Calcium nitrate Ca(NO 3 ) 2 4H 2 O 19 (15% N) Calcium sulfate CaSO 4 2H 2 O 23 (19% S) Concentration in Nutrient Solutions: 20 to 300 mg Ca/L (ppm). Symptoms of Deficiency: The growing tips of roots and leaves turn brown and die, a symptom called tipburn. Leaves curl and their margins turn brown. Margins of emerging leaves stick together, leaving the expanded leaves with shredded edges. Fruit quality decreases and incidence of blossomend rot and internal decay is high.
446 Appendix F: Characteristics of Essential Nutrient Elements 415 Since Ca is immobile in plants, deficiencies occur at growing terminals. Reproduction may be delayed or terminated. The conductive tissue at the bases of plants will decay. This reduces water intake, produces wilting on high atmospheric demand days, and reduces essential element uptake. Symptoms of Excess: Excessive Ca will produce a deficiency of Mg or K, depending on Mg and K concentrations present. Critical Level: 1.00% in dry matter (varies with plant type and growth stage). Excessive Level: >5.00% in dry matter (varies with levels of K and/or Mg). Reference Plant Content (Markert, 1994): 1.00% in dry matter. Sufficiency Ranges: Plant (Scientific Name) Plant Part (Time of Sampling) Ca % in Dry Matter Barley (Hordeum vulgare) 25 whole tops (emergence of head from boot) Cassava (Manihot esculenta) 25 mature leaves from new growth (vegetative stage) to 30-cm bark sections from main stem just above the soil ( month old plants) Alfalfa/Lucerne (Medicago 12 tops (6 new growth, prior to flowering) sativa) Bahia grass (Paspalum notatum) 50 leaf blades (summer) 0.52 Bird s-foot trefoil (Lotus 50 mature leaves (first flower) corniculatus) Alsike (Trifolium hybridum) 20 whole tops (first flower) Red (Trifolium pratense) 15 whole tops (prior to flowering) Ladino/White (Trifolium repens f. lodigense) 50 mature leaves (prior to flowering) Subterranean (Trifolium 75 mature leaves from new growth (prior to flowering) subterraneum) Coastal bermudagrass (Cynodon 40 whole 4- to 5-week old plants dactylon) Corn (Zea mays) 15 whole tops (plants <12 tall) leaves below the whorl (prior to tasseling) ear leaves (initial silk) Cotton (Gossypium hirsutum) 25 vegetative stems (first squares to initial bloom) vegetative stems (full bloom) Oat (Avena sativa) 25 whole tops (head emergence from boot) Peanut/Ground nut (Archis 50 whole plants (prior to or at bloom stage) hypogaea) 25 whole tops (early pegging) Rice (Oryza sativa) 25 mature leaves from new growth (maximum tillering) mature leaves from new growth (panicle initiation) Sorghum (Sorghum bicolor) 25 whole tops (seedlings <30 cm tall, day old plants) mature leaves from new growth (37 56 days after planting) leaves, third leaf below head (plants at bloom stage, heads visible) 25 leaves, third leaf below head (grain in dough condition) Soybean (Glycine max) 25 mature leaves from new growth (prior to pod set) Sugar beet (Beta vulgaris) 25 leaves (50 80 after planting) Sugarcane (Saccharium 15 leaves, third leaf from tip (3 5 months after planting) officinanum) Sunflower (Helianthus annuus) 25 mature leaves from new growth (summer) Timothy (Phleum pratense) 25 whole plants (early anthesis) Wheat, spring (Triticum aestivum) 25 whole tops (as head emerges from boot) Winter wheat 50 leaves, top two leaves (just before heading)
447 416 Agronomic Handbook: Management of Crops, Soils, and Their Fertility Major Antagonistic Elements: Al, Ba, Be, B, Cd, Cs, Cr, Co, Cu, Fl, Fe, Pb, Li, Mn, Ni, Sr, and Zn. Major Synergistic Elements: Cu, Mn, and Zn. Most Important Sources: Feldspar, augite, hornblende, CaCO 3, and CaSO 4. Usual Soil Content: 0.2 to 1.5% (except chalk soils). CHLORINE (Cl) Functions in Plants: Chlorine is a micronutrient involved in the evolution of O 2 in Photosystem II of the photosynthetic process. It raises cell osmotic pressure, affects stomatal regulation, and increases hydration of plant tissue. Chlorine may be related to the suppression of leaf spot disease in wheat and fungus root disease in oats. Content and Distribution: The leaf content of Cl ranges from low levels (20 ppm) in dry matter to percent concentrations. A deficiency occurs in wheat when plant levels are below 0.15%. Cl exists in plants as the Cl - anion. Available Forms for Plant Root Absorption: Chlorine exists in the soil solution as the Cl - anion which moves by mass flow. The anion competes for uptake with other anions, such as NO 3 - and SO 4 2- ) for uptake. Mobility: Mobile Form Utilized by Plants: Cl - anion. Fertilizer Sources: Source Formula % Cl Potassium chloride KCl 47 Trace amounts found in many fertilizers are usually sufficient to satisfy most crop requirements. Hydroponic Reagent Sources: Compound Formula % Cl Calcium chloride CaCl 2 63 (36% Ca) Potassium chloride KCl 47 (50% K) Concentration in Nutrient Solutions: 50 to 1,000 mg Cl per L (ppm), depending on reagent used. Symptoms of Deficiency: Deficient plants exhibit chlorosis of younger leaves and wilting. Deficiency is not common. Deficiencies in wheat and oats in some soil areas has been related to disease infestation. Symptoms of Excess: An excess produces premature yellowing of leaves, burning of leaf tips and margins, bronzing, and abscission of leaves. Excess is primarily associated with salt-affected (high NaCl content) soils, a condition that influences the osmotic characteristics of roots by restricting the uptake of water and other ions. Critical Level: 20 mg Cl per kg (ppm) in dry matter. Sufficiency Range: 20 to 1,500 mg Cl per kg (ppm) in dry matter.
448 Appendix F: Characteristics of Essential Nutrient Elements 417 Excess Level: >0.50% in dry matter. Reference Plant Content (Markert, 1994): 0.20% in dry matter. Agronomic Crops Susceptible to Deficiency: Small grains. Typical Concentration in Foliage of Normal Crops: 100 to 1,000 mg Cl per kg dry matter, 0.4 to 4.0 mm cell sap content. Concentration in Environment: mol Cl per m 3. Usual Soil Content: 30 to 450 mg Cl per kg (extreme values: 5 to 800 mg Cl per kg). COPPER (Cu) Functions in Plants: Copper is a micronutrient, a constituent of the plastocyanin chloroplast protein, and a component of the electron transport system linking Photosystems I and II in the photosynthetic process. Copper participates in protein and carbohydrate metabolism and N 2 fixation. It is a component of enzymes that reduce atoms of molecular oxygen (cytochrome oxidase, ascorbic acid oxidase, and polyphenol oxidase) and is involved in the desaturation and hydroxylation of fatty acids. Content and Distribution: Cu sufficiency range in leaves is 3 to 7 ppm of dry matter; toxicity range begins at 20 to 30 ppm. Much higher values, 20 to 200 ppm, can be tolerated if Cu is applied as a fungicide. Copper in plants can interfere with Fe metabolism and lead to Fe deficiency. In interactions with Mo, Cu may interfere with enzymatic reduction of NO 3. Available Forms for Plant Root Absorption: Copper exists in the soil primarily in complexed forms as low molecular weight organic compounds such as humic and fulvic acids. The cupric (Cu 2+ ) cation is present in small quantities in the soil solution. Deficiency occurs primarily on sandy and organic soils. Uptake rates are lower than for most other micronutrients. Movement in Soil and Plant Root Absorption: Although Cu supply in the soil solution is very low (<0.2 mg Cu per kg), most soils have sufficient Cu to meet crop requirements and are able to maintain sufficient Cu 2+ cations in the soil solution even with increasing ph. However with increasing organic matter content, Cu availability can be significantly reduced. Soil Plant Transfer Coefficient: 0.1 to 10. Mobility: Immobile. Form Utilized: Cupric (Cu 2+ ) cation. Fertilizer Sources: Source Formula % Cu Copper sulfate (monohydrate) CuSO 4 H 2 O 35 Copper sulfate (pentahydrate) CuSO 4 5H 2 O 25 Cupric oxide CuO 75 Cuprous oxide Cu 2 O 89 Cupric ammonium phosphate Cu(NH 4 )PO 4 H 2 O 32 Basic copper sulfates CuSO 4 3Cu(OH) (general formula) Cupric chloride CuCl 2 47 Copper chelates Na 2 CuEDTA 13 NaCuHEDTA 9 Copper polyflavonoids Organically bound Cu 5 7 Copper can be soil- or foliar-applied; some sources are shown in this table.
449 418 Agronomic Handbook: Management of Crops, Soils, and Their Fertility Hydroponic Reagent Sources: Compound Formula % Cu Copper sulfate CuSO 4 5H 2 O 25 (13% S) Copper sulfate (monohydrate) CuSO 4 H 2 O 35 (18% S) Copper chloride CuCl 2 47 Copper chelates Na 2 CuEDTA 13 NaCuHEDTA 9 Concentration in Nutrient Solutions: mg Cu per L (ppm); highly toxic to roots in excess of 1.0 mg per L (ppm) in solution Symptoms of Deficiency: Symptoms include stunted growth with distortion of young leaves and necrosis of the apical meristems. In trees, deficiency may cause white tips or bleaching of younger leaves and summer dieback. Symptoms of Excess: Excess Cu can induce Fe deficiency and chlorosis. Root growth may be suppressed, with inhibited elongation and lateral root formation at relatively low Cu levels in the soil solution. Copper is 5 to 10 times more toxic to roots than Al and may more significantly affect root development into acid (ph <5.5) subsoils. Critical Plant Level: 5 mg Cu per kg (ppm) in dry matter. Toxic Plant Level: >50 mg Cu per kg (ppm) in dry matter. Reference Plant Content (Markert, 1994): 10 mg Cu per kg (ppm) in dry matter. Sufficiency Ranges: Plant (Scientific Name) Plant Part (Time of Sampling) Cu mg per kg (ppm) in Dry Matter Barley (Hordeum vulgare) 25 whole tops (emergence of head from the boot) 5 25 Cassava (Manihot esculenta) 25 mature leaves from new growth (vegetative stage) to 30-cm bark sections from main stem just above soil 6 7 (14-month old plants) Alfalfa/Lucerne (Medicago sativa) 12 tops (6 new growth, prior to flowering) 7 30 Bahia grass (Paspalum notatum) 50 leaf blades (summer) 11 Bird s-foot trefoil (Lotus corniculatus) 50 mature leaves (first flower) 6 10 Alsike (Trifolium hybridum) 20 whole tops (first flower) 3 15 Red (Trifolium pratense) 15 whole tops (prior to flowering) 8 15 Ladino/White (Trifolium repens f. 50 mature leaves (prior to flowering) 5 8 lodigense) Subterranean (Trifolium subterraneum) 75 mature leaves from new growth (prior to flowering) 7 13 Coastal bermudagrass (Cynodon 40 whole plants (4- to 5-week old plants) 5 25 dactylon) Corn (Zea mays) 15 whole tops (plants <12 tall) leaves below whorl (prior to tasseling) ear leaves (initial silk) 3 15 Cotton (Gossypium hirsutum) 25 vegetative stems (first squares to initial bloom) vegetative stems (full bloom) 5 25 Oat (Avena sativa) 25 whole tops (head emergence from boot) 5 25 Peanut/Ground nut (Archis hypogaea) 50 whole plants (prior to or at bloom stage) whole tops (early pegging) Rice (Oryza sativa) 25 mature leaves from new growth (maximum tillering) mature leaves from new growth (panicle initiation) 8 25
450 Appendix F: Characteristics of Essential Nutrient Elements 419 Plant (Scientific Name) Plant Part (Time of Sampling) Cu mg per kg (ppm) in Dry Matter Rye (Secale cereale) 25 whole tops (panicle initiation) 8 15 Sorghum (Sorghum bicolor) 25 whole tops (seedlings <30 cm tall, 23- to 29-day old 8 15 plants) 25 mature leaves from new growth (37 56 days after 2 15 planting) 25 leaves, third leaf below head (plants at bloom stage, 2 7 heads visible) 25 leaves, third leaf below head (grain in dough condition) 1 3 Soybean (Glycine max) 25 mature leaves from new growth (prior to pod set) Sugarcane (Saccharium officinanum) 15 leaves, third leaf from tip (3 5 months after planting) 5 15 Sunflower (Helianthus annuus) 25 mature leaves from new growth (summer) 4 25 Timothy (Phleum pratense) 25 whole plants (early anthesis) 7 45 Wheat, spring (Triticum aestivum) 25 whole tops (as head emerges from boot) 5 25 Winter wheat 50 leaves, top two leaves (just before heading) 5 50 Relative Tolerance to Copper Low Moderate High Pasture grass, rice rye, soybean Barley, corn, cotton, sorghum, sugar beet Alfalfa, barley, Lucerne, millet, oat, pangola grass, Sudan grass, wheat Major Antagonistic Elements: Ca, Mg, P, and N. Major Synergistic Elements: Ca, P, and N. Soil Conditions for Deficiency: Organic soils, mineral soils high in Cu and organic matter content. Typical Concentration in Foliage of Normal Crops: 5 to 15 mg per kg in dry matter, 0.01 to 0.03 mm cell sap content. Concentration in Environment: 3 x 10⁻⁴ mol Cu per m 3. High Accumulator Crops: Sugar beets and some barley cultivars. Most Important Sources: Copper sulfide, sulfate, and carbonate. Usual Soil Content: 5 to 100 mg Cu per kg (extreme values: 0.1 to 1,300 mg Cu per kg). IRON (Fe) Functions in Plants: Iron is a micronutrient and an important component in many plant enzyme systems, such as cytochrome oxidase (electron transport) and cytochrome (terminal respiration step). Iron is a component of ferredoxin and is required for NO 3 and SO 4 reduction, N 2 assimilation, and energy (NADP) production. It functions as a catalyst or part of an enzyme system associated with chlorophyll formation and may be involved in protein synthesis and root-tip meristem growth. Its plant and soil chemistry is highly complex and both facets are under intensive study. Content and Distribution: Leaf content ranges from 10 to 1,000 ppm in dry matter; sufficiency ranges from 50 to 75 ppm, although total Fe may not always be related to sufficiency. In general, 50 ppm is the accepted critical value for most crops, with deficiency likely when total leaf Fe is lower. An accurate determination of plant content is normally not possible since extraneous sources of Fe are difficult to exclude from the determination. Soil and dust contamination are the primary contributors to extraneous Iron. Decontamination (washing) procedures are described in Chapter 12.
451 420 Agronomic Handbook: Management of Crops, Soils, and Their Fertility Iron deficiency affects many crops. A common deficiency known as lime chlorosis appears on alkaline soils. Most plant Fe is in the Fe 3+ form as ferric phosphoprotein, although the ferrous (Fe 2+ ) ion is believed to be metabolically active. High P decreases the solubility of Fe in plants. A P:Fe ratio of 29:1 is average for most plants. K increases the mobility and solubility of Fe, while N accentuates Fe deficiency due to increased growth. The bicarbonate anion is believed to interfere with Fe uptake and translocation. High Zn can interfere with Fe metabolism and produce visual symptoms of Fe deficiency. Extractable ferrous (Fe 2+ ) iron may be a better indicator of plant Fe status than total Fe. Various extraction procedures have been proposed for diagnosing Fe deficiency and 20 to 25 ppm appears to be the critical extractable Fe range. Most methods of determining Fe status by means of analysis, whether total or extractable, are flawed because of soil and dust particles on tissue and Fe added during plant tissue processing. The indirect measurement of chlorophyll content may be the best alternative method for Fe sufficiency diagnosis. Available Forms for Plant Root Absorption: Iron exists in the soil as both the ferric (Fe 3+ ) and ferrous (Fe 2+ ) cations. The Fe 2+ form, whose availability is affected by the degree of soil aeration, is thought to be the active form taken up by plants. Iron-sufficient plants can acidify the rhizosphere and release Fe-complexing substances, such as siderophores, which enhance Fe availability and uptake, while Fe-inefficient plants do not exhibit similar root characteristics. Movement in Soil and Plant Root Absorption: Iron moves in the soil by mass flow and diffusion. When an Fe ion reaches the rhizosphere, it is reduced (from Fe 3+ to Fe 2+ ), or released from a chelated form (although chelated Fe can also be taken into a plant), and absorbed. Copper, Mn, and Ca competitively inhibit Fe uptake, and high levels of P reduce Fe uptake. Mobility: Immobile. Forms Utilized by Plants: Ferrous (Fe 2+ ) and ferric (Fe 3+ ) cations. Fertilizer Sources: Source Formula % Fe Ferrous ammonium phosphate Fe(NH 4 )PO 4 H 2 O 29 Ferrous ammonium sulfate (NH 4 ) 2 SO 4.FeSO 4 6H 2 O 14 Ferrous sulfate FeSO 4 7H 2 O Ferric sulfate Fe(SO 4 ) 3 4H 2 O 23 Iron chelates FeHEDTA 5 9 FeEDDHA 6 NaFeEDTA 5 11 NaFeHFDTA 5 9 NaFeEDDHA 6 NaFeDTPA 10 Iron polyflavonoids Organically bound Fe 9 10 Iron sources can be soil- or foliar-applied. Foliar application is the most efficient with a solution of FeSO 4 or one of the chelated (EDTA or EDDHA) forms. Hydroponic Reagent Sources: Compound Formula % Fe Iron chelate FeEDTA ~12 Iron citrate Iron tartrate FeC 4 H 4 O Iron lignin sulfonate 6 Ferrous sulfate FeSO 4 7H 2 O 20 (11% S) Concentration in Nutrient Solutions: 2 to 12 mg Fe per L (ppm).
452 Appendix F: Characteristics of Essential Nutrient Elements 421 Symptoms of Deficiency: Interveinal chlorosis of younger leaves is a typical deficiency symptom. As the severity increases, chlorosis spreads to the older leaves. Symptoms of Excess: Iron may accumulate to several hundred ppm without toxicity symptoms. At toxic levels (not clearly defined), bronzing of the leaves with tiny brown spots will appear, a typical symptom in rice. Critical Level in Plants: 50 mg Fe per kg (ppm) in dry matter. Reference Plant Content (Markert, 1994): 150 mg Fe per kg (ppm) in dry matter. Sufficiency Ranges in Plants: Plant (Scientific Name) Plant Part (Time of Sampling) Fe mg per kg (ppm) in Dry Matter Cassava (Manihot esculenta) 25 mature leaves from new growth (vegetative stage) to 30-cm bark sections from main stem just above soil (14-month old plants) Alfalfa/Lucerne (Medicago sativa) 12 tops (6 new growth, (prior to flowering) Bahia grass (Paspalum notatum) 50 leaf blades (summer) 100 Alsike (Trifolium hybridum) 20 whole tops (first flower) Red (Trifolium pratense) 15 whole tops (prior to flowering) Ladino/White (Trifolium repens f. 50 mature leaves (prior to flowering) lodigense) Subterranean (Trifolium subterraneum) 75 mature leaves from new growth (prior to flowering) Coastal bermudagrass (Cynodon 40 whole plants (4- to 5-week-old plants) dactylon) Corn (Zea mays) 15 whole tops (plants <12 tall) leaves below the whorl (prior to tasseling) ear leaves (initial silk) Cotton (Gossypium hirsutum) 25 vegetative stems (first squares to initial bloom) vegetative stems (full bloom) Oat (Avena sativa) 25 whole tops (head emergence from boot) Peanut/Ground nut (Archis hypogaea) 50 whole plants (prior to or at bloom stage) whole tops (early pegging) Rice (Oryza sativa) 25 mature leaves from new growth (maximum tillering) mature leaves from new growth (panicle initiation) Sorghum (Sorghum bicolor) 25 whole tops (seedlings <30 cm tall, 23- to 30-day-old plants) 25 mature leaves from new growth (37 56 days after planting) 25 leaves, third leaf below head (plants at bloom stage, heads visible) 25 leaves, third leaf below head (grain in dough condition) Soybean (Glycine max) 25 mature leaves from new growth (prior to pod set) Sugar beet (Beta vulgaris) 25 leaves (50 80 after planting) Sugarcane (Saccharium officinanum) 15 leaves, third leaf from tip (3 5 months after planting) Sunflower (Helianthus annuus) 25 mature leaves from new growth (summer) Timothy (Phleum pratense) 25 whole plants (early anthesis) Wheat, spring (Triticum aestivum) 25 whole tops (as head emerges from boot) Winter wheat 50 leaves, top two leaves (just before heading) Agronomic Crops Susceptible to Deficiency: Barley, peanuts, soybeans, sorghum, Sudan grass, and sugar beet. Agronomic Crops Susceptible to Excess: Rice.
453 422 Agronomic Handbook: Management of Crops, Soils, and Their Fertility Major Antagonistic Elements: Ca, Mg, P, and S. Major Synergistic Elements: P, N, and S. Soil Conditions for Deficiency: Leached sandy soils low in organic matter, alkaline soils, soils high in P. Typical Concentration in Foliage of Normal Crops: 50 to 300 mg Fe per kg dry matter, 0.15 to 0.75 mm cell sap content. Concentration in Environment: mol Fe per m 3. Most Common Sources: Augite, hornblende, biotite, olivine, iron oxide, and hydroxide. Usual Soil Content: 0.5 to 4.0% Fe (extreme values: 10 to 80,000 mg Fe per kg). MAGNESIUM (Mg) Functions in Plants: Magnesium is a major element and component of the chlorophyll molecule. It serves as a cofactor in most enzymes that activate phosphorylation as a bridge between pyrophosphate structures of ATP or ADP and enzyme molecules, and stabilizes ribosome particles in configurations for protein synthesis. Content and Distribution: Plant content ranges from 0.15 to 1.00% of dry weight in leaf tissue. The sufficiency value is 0.25% in the leaf tissues of most crops. Critical values may vary among crop species. They are lowest for grain crops and highest for legumes, some vegetables, and fruit crops. The Mg content in leaves increases with age; the highest concentrations are found in older leaves. High yielding crops will contain 10 to 175 lb Mg per acre (11 to 196 kg Mg per ha), with crop removal considerably less for grain and some fruit crops when only the grain or fruit is removed, leaving behind most of the Mg that exists primarily in the plant. The relationships of Mg and K and Mg and Ca are well known. The ratios are used as DRIS norms for the interpretation of plant analysis result. Magnesium deficiency can be induced by high concentrations of NH 4+, K +, or Ca 2+ cations in the rooting medium. The Mg 2+ cation is the poorest competitor among the cations. Some plant species and cultivars within species have particular sensitivities to Mg and will become Mg-deficient under moisture and/or temperature stress even though Mg may be at sufficient availability levels in the rooting media. Available Forms for Plant Root Absorption: Magnesium exists as the Mg 2+ cation in the soil solution and as exchangeable Mg on soil colloids. The cation usually has the next to the highest in concentration in the soil in both soluble and exchangeable forms when the soil is slightly acid to neutral. Manganese availability declines significantly when the soil water ph is below 5.4. Movement in Soil and Plant Root Absorption: The supply of Mg to roots depends on root interception, mass flow, and diffusion. Mass flow is the primary delivery mechanism. Deficiency can occur under soil moisture stress even when the soil is adequate in available Mg. Mobility: Moderately immobile. Form Utilized by Plants: Magnesium (Mg 2+ ) cation. Fertilizer Sources: Source Formula Water Solubility % Mg Dolomitic limestone CaCO 3 + MgCO 3 Insoluble 6 12 Kieserite (magnesium sulfate) MgSO 4 H 2 O Slightly soluble 18 Magnesium sulfate (Epsom salt) MgSO 4 H 2 O Soluble 10 Potassium magnesium sulfate K 2 SO 4 MgSO 4 Soluble 11 Pro/Mesium 3MgOSiO 2 2H 2 O Insoluble 22 Magnesium oxide MgO Slightly soluble 50 55
454 Appendix F: Characteristics of Essential Nutrient Elements 423 As for Ca, it is assumed that maintaining soil ph within the optimum range (5.8 to 7.5) in acid soils by frequent liming using dolomitic (Mg-bearing) limestone or other high-content liming materials will provide sufficient Mg to meet crop requirements. Hydroponic Reagent Sources: Compound Formula % Mg Magnesium sulfate (Epsom salt) MgSO 4 7H 2 O 10 (23% S) Concentration in Nutrient Solutions: 30 to 50 mg Mg per L (ppm). Symptoms of Deflciency: Deficient plants exhibit yellowing of leaves or interveinal chlorosis that begins on the older leaves since Mg is a mobile element. With an increased deficiency, symptoms appear on the younger leaves with the development of necrosis when the deficiency is very severe. Symptoms of Excess: Manganese deficiency has no specific toxicity symptoms. The Mg content of a plant can be quite high (>1.0%) in leaf tissue without inducing a deficiency of Ca or K. However, an imbalance among these three elements when the Mg content is unusually high may reduce growth. Critical Level in Plants: 0.25% in dry matter. Reference Plant Content (Markert, 1994): 0.2% in dry matter. Sufficiency Ranges: Plant (Scientific Name) Plant Part (Time of Sampling) Mg % in Dry Matter Barley (Hordeum vulgare) 25 whole tops (emergence of head from boot) Cassava (Manihot esculenta) 25 mature leaves from new growth (vegetative stage) 10- to 30-cm bark sections from main stem just above soil (14-month old plants) Alfalfa/Lucerne (Medicago sativa) 12 tops (6 new growth, prior to flowering) Bahia grass (Paspalum notatum) 50 leaf blades (summer) 0.32 Bird s-foot trefoil (Lotus corniculatus) 50 mature leaves (first flower) Alsike (Trifolium hybridum) 20 whole tops (first flower) Red (Trifolium pratense) 15 whole tops (prior to flowering) Ladino/White (Trifolium repens f. lodigense) 50 mature leaves (prior to flowering) Subterranean (Trifolium subterraneum) 75 mature leaves from new growth (prior to flowering) Coastal Bermudagrass (Cynodon dactylon) 40 whole plants (4- to 5-week old plants) Corn (Zea mays) 15 whole tops (plants <12 tall) leaves below whorl (prior to tasseling) ear leaves (initial silk) Cotton (Gossypium hirsutum) 25 vegetative stems (first squares to initial bloom) 25 vegetative stems (full bloom) Oat (Avena sativa) 25 whole tops (head emergence from boot) Peanut/Ground nut (Archis hypogaea) 50 whole plants (prior to or at bloom stage) whole tops (early pegging) Rice (Oryza sativa) 25 mature leaves from new growth (maximum tillering) 25 mature leaves from new growth (panicle initiation)
455 424 Agronomic Handbook: Management of Crops, Soils, and Their Fertility Plant (Scientific Name) Plant Part (Time of Sampling) Mg % in Dry Matter Rye (Secale cereale) 25 whole tops (panicle initiation) Sorghum (Sorghum bicolor) 25 whole tops (seedlings <30 cm tall, 23- to day old plants) 25 mature leaves from new growth (37 56 days after planting) 25 leaves, third leaf below head (plants at bloom stage, heads visible) 25 leaves, third leaf below head (grain in dough condition) Soybean (Glycine max) 25 mature leaves from new growth (prior to pod set) Sugar beet (Beta vulgaris) 25 leaves (50 80 after planting) Sugarcane (Saccharium officinanum) 15 leaves, third leaf from tip (3 5 months after planting) Sunflower (Helianthus annuus) 25 mature leaves from new growth (summer) Timothy (Phleum pratense) 25 whole plants (early anthesis) Wheat, spring (Triticum aestivum) 25 whole tops (as head emerges from boot) Winter wheat 50 leaves, top two leaves (just before heading) Excessive Plant Level: >1.50% Mg dry matter (may vary with level of K and/or Mg). Major Antagonistic Elements: Al, Ba, Be, Cr, Co, Cu, F, Fe, Mn, Ni, and Zn. Major Synergistic Elements: Al and Zn. Most Important Sources: Augite, hornblende, olivine, biotite, and MgCO 3. Usual Soil Content: 0.1 to 1.0% (except for dolomitic soils). MANGANESE (Mn) Functions in Plants: Manganese is a micronutrient. It is involved in the oxidation reduction processes in the photosynthetic electron transport system. It is essential in Photosystem II for photolysis, and acts as a bridge for ATP, phosphokinase complexes, and phosphotransferases, and activates IAA oxidases. Content and Distribution: Leaf sufficiency ranges from 10 to 50 ppm in dry matter in mature leaves. Tissue levels will reach 200 ppm or higher (soybean, 600; cotton, 700; sweet potato, 1,380) before severe toxicity symptoms develop. Available Forms for Plant Root Absorption: Manganese exists in the soil solution as Mn 2+, Mn 3+, and Mn 4+ cations and as exchangeable Mn. Manganese (Mn 2+ ) is the ionic form taken up by plants. Availability is significantly affected by soil ph, decreasing when the ph exceeds 6.2 in some soils, while in other soils, the decrease may not occur until the soil water ph reaches 7.5. Manganese availability can be reduced significantly by low soil temperatures. Soil organic matter can affect Mn availability, decreasing its availability with an increase in organic matter content. Movement in Soil and Plant Root Absorption: Manganese is primarily supplied to plants by mass flow and root interception. Low soil temperature and moisture stress reduce Mn uptake. Some plants may release root exudates that reduce Mn 4+ to Mn 2+, complex it, and thus increase Mn availability. Mobility in Plants: Immobile. Form Utilized by Plants: Manganous (Mn 2+ ) cation.
456 Appendix F: Characteristics of Essential Nutrient Elements 425 Fertilizer Sources: Source Formula % Mn Manganese sulfate MnSO 4 4H 2 O 24 (14% S) Manganese oxide MnO 53 Manganese chelate MnEDTA 5 12 Manganese oxysulfate Manganese is best applied as a foliar spray to correct deficiencies. Soil application is inefficient due to inactivation of applied Mn. Row application of a P fertilizer increases Mn availability and uptake. Hydroponic Reagent Sources: Compound Formula % Mn Manganese sulfate MnSO 4 4H 2 O 24 (14% S) Concentration in Nutrient Solutions: 0.5 to 2.0 mg Mn per L (ppm). Symptoms of Deficiency: For dicots, stunted growth with interveinal chlorosis on younger leaves indicates deficiency. Cereals develop gray spots (specks) on lower leaves. Legumes develop necrotic areas on cotyledons (marsh spots). Symptoms of Excess: Symptoms of Mn excess are brown spots surrounded by chlorotic zones or circles on older leaves. Black specks (measles) on stone fruits, particularly apples, evidence high Mn content in tissues. Critical Level: 25 mg Mn per kg (ppm) in dry matter. Reference Plant Content (Markert, 1994): 200 mg Mn per kg (ppm) in dry matter. Sufficiency Ranges: Plant (Scientific Name) Plant Part (Time of Sampling) Mn mg/kg (ppm) in Dry Matter Barley (Hordeum vulgare) 25 whole tops (emergence of head from boot) Cassava (Manihot esculenta) 25 mature leaves from new growth (vegetative stage) to 30-cm bark sections from main stem just above soil (14-month old plants) Alfalfa/Lucerne (Medicago sativa) 12 tops (6 new growth, prior to flowering) Bahia grass (Paspalum notatum) 50 leaf blades (summer) 105 Bird s-foot trefoil (Lotus corniculatus) 50 mature leaves (first flower) Alsike (Trifolium hybridum) 20 whole tops (first flower) Red (Trifolium pratense) 15 whole tops (prior to flowering) Ladino/White (Trifolium repens f. 50 mature leaves (prior to flowering) lodigense) Subterranean (Trifolium subterraneum) 75 mature leaves from new growth (prior to flowering) Coastal bermudagrass (Cynodon 40 whole plants (4- to 5-week old plants) dactylon) Corn (Zea mays) 15 whole tops (plants <12 tall) leaves below whorl (prior to tasseling) ear leaves (initial silk) Cotton (Gossypium hirsutum) 25 vegetative stems (first squares to initial bloom)
457 426 Agronomic Handbook: Management of Crops, Soils, and Their Fertility Plant (Scientific Name) Plant Part (Time of Sampling) Mn mg/kg (ppm) in Dry Matter 25 vegetative stems (full bloom) Oat (Avena sativa) 25 whole tops (head emergence from boot) Peanut/Ground nut (Archis hypogaea) 50 whole plants (prior to or at bloom stage) whole tops (early pegging) Rice (Oryza sativa) 25 mature leaves from new growth (maximum tillering) mature leaves from new growth (panicle initiation) Rye (Secale cereale) 25 whole tops (panicle initiation) Sorghum (Sorghum bicolor) 25 whole tops (seedlings <30 cm tall, 23- to 39-day old plants) mature leaves from new growth (37 56 days after planting) 25 leaves, third leaf below head (plants at bloom stage, heads visible) 25 leaves, third leaf below head (grain in dough 8 40 condition) Soybean (Glycine max) 25 mature leaves from new growth (prior to pod set) Sugar beet (Beta vulgaris) 25 leaves (50 80 after planting) Sugarcane (Saccharium officinanum) 15 leaves, third leaf from tip (3 5 months after planting) Sunflower (Helianthus annuus) 25 mature leaves from new growth (summer) Timothy (Phleum pratense) 25 whole plants (early anthesis) Wheat, spring (Triticum aestivum) 25 whole tops (as head emerges from boot) Winter wheat 50 leaves, top two leaves (just before heading) Toxic Level: >400 mg Mn per kg (ppm) in dry matter. Agronomic Crops Sensitive to Deficiency: Alfalfa, oats, small grains, sorghum, soybeans, sudangrass, sugar beets, and wheat. Agronomic Crops Sensitive to Excess: Soybeans. Major Antagonistic Elements: Ca, Mg, P, and K. Major Synergistic Elements in Plants: Ca and P. Soil Conditions for Deficiency: Leached acid soils, neutral to alkaline soils high in organic matter. Typical Concentration in Foliage of Normal Crops: 25 to 250 mg Mn per kg dry matter, 0.06 to 0.6 mm cell sap content. Concentration in Environment: mol Mn per m 3. Most Important Sources: Manganite, pyrolusite; accessory in silicates. Usual Soil Content: 200 to 400 mg Mn per kg (extreme values: 12 to 10,000 mg Mn per kg). MOLYBDENUM (Mo) Functions in Plants: Molybdenum is a micronutrient and a component of two major enzyme systems, nitrogenase and nitrate reductase. Nitrogenase is involved in converting nitrate (NO 3 ) to ammonium (NH 4 ). The Mo requirement is reduced greatly if the primary form of N available to the plant is NH 4. Content and Distribution: Leaf content is usually below 1 ppm in dry matter, due in part to low levels of molybdate (MnO 4 2- ) anion in soil solution. Molybdenum can be taken up in higher amounts without producing toxic effects. However, high content (>10 ppm Mo) forage can pose a serious health hazard to cattle, particularly dairy cows that have sensitive Cu-to-Mo balance requirements. Normal plant content ranges from 0.34 to 1.5 ppm.
458 Appendix F: Characteristics of Essential Nutrient Elements 427 Available Forms for Plant Root Absorption: The primary soluble soil form is the molybdate (MoO 4 2- ) anion, whose availability is increased 10-fold for each unit increase in soil ph. In the soil, Mo is strongly absorbed by Fe and Al oxides whose formation is ph dependent. Movement in Soil and Plant Root Absorption: Mass flow and diffusion equally supply Mo to roots, although mass flow supplies most of it when soil levels are high. If nitrate is the primary N source, Mo uptake is higher than if NH 4 is equal to or greater than NO 3 as the source of N. In general, P and Mg enhance Mo uptake, while sulfate (SO 4 ) reduces it. Mobility: Immobile. Form Utilized by Plants: Molybdate (MoO 4 2- ) anion. Fertilizer Sources : Source Formula % Mo Ammonium molybdate (NH 4 ) 6 Mo 7 O 24 4H 2 O 53 Molybdenum dioxide MoO 2 75 Molybdenum trioxide MnO 3 66 Sodium molybdate Na 2 MoO 4 H 2 O Mo is best supplied by means of seed treatment. Hydroponic Reagent Sources: Compound Formula % Mo Ammonium molybdate (NH 4 ) 6 Mo 7 O 24 4H 2 O 53 (6.8% N) Concentration in Nutrient Solutions: 0.05 mg Mo per L (ppm). Symptoms of Deficiency: Deficiency symptoms frequently resemble N deficiency symptoms. Older and middle leaves become chlorotic first, and in some instances, leaf margins are rolled, and growth and flower formation are restricted. Cruciferae and pulse crops have high Mo requirements. In cauliflower, the middle lamellae of the cell walls are not formed completely when Mo is deficient. Only the leaf ribs are formed, producing a whip-tail appearance in severe cases. Whip-tail is commonly used to describe Mo deficiency. Symptoms of Excess: High plant levels do not normally affect the plants, but can pose a problem for ruminant animals, particularly dairy cows that consume plants containing 5 ppm or more Mo. Critical Level in Plants: Probably 0.10 mg Mo per kg (ppm) in dry matter. Sufficiency Range: 0.2 to 1.0 mg Mo per kg (ppm) in dry matter. Excess Level in Plants (affecting the plant only): Not known. Reference Plant Content (Markert, 1994): 0.5 mg Mo per kg (ppm) in dry matter. Major Antagonistic Elements: P, K, and S. Major Synergistic Elements: N and P. Typical Concentration in Foliage of Normal Crops: 0.5 to 5 mg Mo per kg dry matter, to mm cell sap content. Concentration in Environment: mol Mo per m 3. Most Important Sources: Accessory in silicates; Fe and Al oxides and hydroxides. Usual Soil Content: 0.5 to 5 mg Mo per kg (extreme values: 0.1 to 80 mg Mo per kg).
459 428 Agronomic Handbook: Management of Crops, Soils, and Their Fertility NITROGEN (N) Function in Plants: Nitrogen is a major element found in inorganic and organic forms in plants. It combines with C, H, O, and sometimes S to form amino acids, amino enzymes, nucleic acids, chlorophyll, alltaloids, and purine bases. Although inorganic N can accumulate in plants, primarily in stems and conductive tissues, in the NO 3 form, organic N predominates as high molecular weight proteins in plants. Plant Content and Distribution: Nitrogen consists of 1.50 to 6.00% of the dry weights of many crops with sufficiency values from 2.50 to 3.50% in leaf tissue. Lower ranges of 1.80 to 2.20% are found in most fruit crops; higher ranges of 4.80 to 5.50% are found in legumes. Critical values vary considerably, depending on crop species, stage of growth, and plant part. Highest concentrations are found in new leaves, with the total plant N content normally decreasing with the age of a plant or any one of its parts. Ammonium (NH 4+ ) fertilized plants are usually higher in Kjeldahl N than those that have mostly nitrate-nitrogen (NO 3- N) available for adsorption. High-yielding crops will contain 50 to 500 lb N per acre (56 to 560 kg N per ha) with the extent of removal dependent on the disposition of the crop. The relationships between N and P and N and K are well known. The ratios of N and P and N and K are treated as DRIS norms for interpreting plant analysis results. The uptake of NO 3 stimulates the uptake of cations; Cl - and OH - anions restrict NO 3 - anion uptake. High carbohydrate status enhances the uptake of NH 4 ), and the uptake of NH 4 + restricts cations that can lead to Ca deficiency and to reduced K levels. Nitrogen exists as the NO 3 - anion in main stems and leaf petioles, ranging in concentration from 8,000 to 12,000 ppm during early growth. It declines to a range of 3,000 to 8,000 ppm in mid-season. It is most concentrated at the bases of main stems and in the petioles of recently fully matured leaves. The determination of NO 3 in either stem or petiole tissue is used to analyze N status of plants or to regulate N supplement fertilizer applications. Soluble amino acids are also found in plants. Available Forms for Root Absorption: Nitrogen exists in the soil as either the NO 3 - anion or the NH 4 + cation. The uptake of either form is influenced by soil ph, temperature, and other ions in the soil solution. The NH 4 + cation participates in cation exchange in the soil. Nitrite (NO 2 ) may be present in the soil solution under anaerobic conditions and is toxic to plants at levels below 5 ppm. Movement in Soil and Plant Root Absorption: Nitrogen as the nitrate (NO 3- ) anion moves in the soil primarily by mass flow with most of the NO 3 absorbed when it reaches the root surface. Nitrate ions can be readily leached from rooting zones by irrigation water and/or rainfall, or lifted into the rooting zone by upward movement driven by water loss as a result of evaporation at the soil surface and/or evapotranspiration. The other N form, the ammonium (NH 4+ ) cation, acts much like the K + cation in the soil and its movement in the soil solution is primarily by diffusion. Ammonium Toxicity: When ammonium (NH 4 ) is the major source of N, toxicity can occur as seeb often by the cupping of plant leaves, breakdown of vascular tissue at the base of the stem, lesions on stems and leaves, and increased blossom-end rot on fruit. Mobility in Plants: Mobile. Forms Utilized by Plants: Ammonium (NH 4+ ) cation and nitrate (NO 3- ) anion.
460 Appendix F: Characteristics of Essential Nutrient Elements 429 Fertilizer Sources: Name Formula Form % N Inorganic Ammonium nitrate NH 4 NO 3 Solid 34 Ammonium sulfate (NH 4 ) 2 SO 4 Solid 21 Ammonium thiosulfate (NH 4 ) 2 SO 3 Liquid 12 Anhydrous ammonia NH 3 Gas 82 Aqua ammonia NH 4 OH Liquid 2 25 Nitrogen solutions Variable Liquid Monoammonium phosphate NH 4 H 2 PO 4 Solid 11 Diammonium phosphate (NH 4 ) 2 HPO 4 Solid 1 18 Calcium cyanamide CaCN 2 Solid 21 Calcium nitrate Ca(NO 3 ) 2 Solid 16 Sodium nitrate NaNO 3 Solid 16 Potassium nitrate KNO 3 Solid 13 Synthetic organic Urea CO(NH 2 ) 2 Solid Sulfur-coated urea CO(NH 2 ) 2 -S Solid 40 Urea-formaldehyde CO(NH 2 ) 2 -CH 2 O Solid 38 Natural organic Cotton seed meal Solid Soybean meal Solid 7.0 Milorganite Solid 12 Sewage sludge Solid Chicken litter Solid Dried blood Solid 13 Bone meal (raw) Solid 3.5 Animal manures Dairy Solid 0.7 Goat Solid 2.8 Hog Solid 1.0 Horse Solid 0.7 Rabbit Solid 2.0 Sheep Solid 2.0 Steer Solid 2.0 Crop response to applied mineral N fertilizer would be expected to be similar regardless of N source if applied as directed. However, the efficiency of N utilization will vary with time, method of application, and N form. Acidifying Effects of Ammonium Fertilizers: Fertilizer Calcium ammonium nitrate (27% N) Ammonia, urea, and, ammonium nitrate Diammonium phosphate and ammonium nitrate Ammonium sulfate Amount of CaO Needed to Compensate for Soil Acidification Induced by 2.2 lb (1 kg) Nitrogen a 1.32 lb (0.6 kg) 2.2 lb (1 kg) 4.4 lb (2 kg) 6.6 lb (3 kg) a On the basis of 50% utilization (IFA World Fertilizer Use Manual, 1992, International Fertilization Association, Paris. With permission.)
461 430 Agronomic Handbook: Management of Crops, Soils, and Their Fertility Hydroponic Reagent Sources: Compound Formula % N Ammonium dihydrogen phosphate NH 4 H 2 PO 4 11 (21% P) Ammonium hydroxide NH 4 OH Ammonium nitrate NH 4 NO 3 32 (16% NH 4 and 16% NO 3 ) Ammonium sulfate NH 4 (SO 4 ) 2 21 (24% S) Diammonium hydrogen phosphate (NH 4 ) 2 HPO 4 18 (21% P) Calcium nitrate Ca(NO 3 ) 2 4H 2 O 15 (19% Ca) Potassium nitrate KNO 3 13 (36% K) Concentration in Nutrient Solutions: mg N/L (ppm); 3 to 4 parts nitrate (NO 3 ) to 2 and 1 part ammonium (NH 4 ) for best plant growth. Fixation Rate by Crops: (kg N/ha): alfalfa, 150; sweet clover, 120; red clover, 90; and soybean, 60. Symptoms of Deficiency: Slow-growing, weak, and stunted plants; older leaves turn light green to yellow; plants mature early; dry weight, yield, and quality are reduced. The initial and more severe symptoms of yellow-leaf deficiency are seen in the older leaves, since N is mobilized in the older tissue for transport to active growing areas. Symptoms of Excess: Plants turn dark green and have succulent foliage; easily susceptible to environmental stress, disease, and insect invasion; poor fruit yield of low quality. Critical Plant Levels: 3.00% total N in dry matter (varies with plant type and stage of growth); 1000 mg per kg (ppm) nitrate-nitrogen (NO 3 -N) in leaf petioles. Reference Plant Content (Markert, 1994): 2.50% in dry matter. Excessive Plant Level: >5.00% total in dry matter (varies with plant type and stage of growth): >12,000 mg nitrate (NO 3 -N) per kg (ppm) in leaf petioles. Sufficiency Range: Plant (Scientific Name) Plant Part (Time of Sampling) N% in Dry Matter Barley (Hordeum vulgare) 25 whole tops (emergence of head from boot) Cassava (Manihot esculenta) 25 mature leaves from new growth (vegetative stage) to 30-cm bark sections from main stem just above soil (14-month old plants) Alfalfa/Lucerne (Medicago sativa) 12 tops (6 new growth, prior to flowering) Bahia grass (Paspalum notatum) 50 leaf blades (summer) 2.80 Bird s-foot trefoil (Lotus corniculatus) 50 mature leaves (first flower) Alsike (Trifolium hybridum) 20 whole tops (first flower) no data Red (Trifolium pratense) 15 whole tops (prior to flowering) Ladino/White (Trifolium repens f. 50 mature leaves (prior to flowering) lodigense) Subterranean (Trifolium subterraneum) 75 mature leaves from new growth (prior to flowering) Coastal bermudagrass (Cynodon dactylon) 40 whole plants (4- to 5-week old plants) Corn (Zea mays) 15 whole tops (plants <12 tall) leaves below whorl (prior to tasseling) ear leaves (initial silk) Cotton (Gossypium hirsutum) 25 vegetative stems (first squares to initial bloom) vegetative stems (full bloom) Oat (Avena sativa) 25 whole tops (head emergence from boot)
462 Appendix F: Characteristics of Essential Nutrient Elements 431 Plant (Scientific Name) Plant Part (Time of Sampling) N% in Dry Matter Peanut/Ground nut (Archis hypogaea) 50 whole plants (prior to or at bloom stage) whole tops (early pegging) Rice (Oryza sativa) 25 mature leaves from new growth (maximum tillering) mature leaves from new growth (panicle initiation) Rye (Secale cereale) 25 whole tops (panicle initiation) Sorghum (Sorghum bicolor) 25 whole tops (seedlings <30 cm tall, 23- to 29-day old plants) 25 mature leaves from new growth (37 56 days after planting) 25 leaves, third leaf below head (plants at bloom stage, heads visible) 25 leaves, third leaf below head (grain in dough condition) Sudan grass (Sorghum sudanense) 15 whole tops (4 5 weeks between clippings) Soybean (Glycine max) 25 mature leaves from new growth (prior to pod set) Sugar beet (Beta vulgaris) 25 leaves (50 80 days after planting) Sugarcane (Saccharium officinanum) 15 leaves, third leaf from tip (3 5 months after planting) Sunflower (Helianthus annuus) 25 mature leaves from new growth (summer) Timothy (Phleum pratense) 25 whole plants (early anthesis) Wheat, spring (Triticum aestivum) 25 whole tops (as head emerges from boot) Winter wheat 50 leaves, top two leaves (just before heading) Antagonistic Elements: B, Cu, and F. Synergistic Elements: B, Cu, Fe, and Mo. Symptoms of Deficiency: Deficient plants grow slowly, are weak and stunted. Typically, the foliage is light green to yellow. The initial and more severe symptoms of yellow-leaf deficiency are seen in the older leaves, since N is mobilized in older tissue for transport to actively growing portions of the plant. N deficient plants mature early; yield and quality are significantly reduced. Symptoms of Excess: Plants with an excess of N are dark green and have succulent foliage that is easily susceptible to disease and insect invasion. The plants may lodge easily and are susceptible to drought stress. Fruit and seed crops may fail to yield; fruit and grain are of poor quality. If ammonium (NH 4 ) is the only or major form available for uptake, a toxicity condition may break down vascular tissue, thus restricting water uptake. Tomatoes, peppers, cucumbers and other fruiting crops may develop blossom-end rot on the fruit or fruit set may be poor. Symptoms of Ca deficiency may occur if NH 4 is the primary N source. Carbohydrate depletion can occur with NH 4 nutrition, which results in growth reduction. Most Important Sources: Organic matter and N 2 from the atmosphere. Usual Soil Content: 0.03 to 0.3% N. Primary Soil Forms: Plant and animal residues and NH 4 + and NO 3 - ions. PHOSPHORUS (P) Function in Plants: Phosphorus is a major element and a component of certain enzymes and proteins, adenosine triphosphate (ATP), RNAs, DNAs, and phytin. ATP is involved in various energy transfer reactions, and RNA and DNA contain genetic information. Highest P concentration is found in new leaves and petioles. High-yielding crops contain 15 to 75 lb P per acre (17 to 84 kg P per ha). The P when crops are harvested is considerably less for grain crops when only the grain is removed; most P is left behind in the plants.
463 432 Agronomic Handbook: Management of Crops, Soils, and Their Fertility The relationships of P with N, Cu, Fe, Mn, and Zn are well known. Ratios of 3:1 of N and P and 200:1 of P and Zn are considered critical. The ratio of N:P serves as a DRIS norm for interpreting plant analysis results. Soluble P (in 2% acetic acid) is present as the orthophosphate (PO 4 3- ) anion in main stems and leaf petioles of the actively growing portions of the plant. Its concentration ranges from 100 to 5,000 ppm of the dry weight and can be used to evaluate P status. Critical concentration is about 2,500 ppm. Available Forms for Plant Root Absorption: Phosphorus exists in most soils in about equal amounts of organic and inorganic forms. Dihydrogen phosphate (H 2 PO 4- ) and monohydrogen phosphate (HPO 4 2- ) are the two anion forms. Their ratio depends on soil ph. A combination of Al, Fe, and Ca phosphate is the major inorganic source of P; the relative amounts of the forms are also functions of soil ph. Phosphorus is released into the soil solution by decomposition of crop residues and microorganisms, so they are major sources of P for plant utilization. Movement in Soil and Plant Root Absorption: The phosphate (H 2 PO 4- and HPO 4 2- ) anions contact root surfaces primarily by diffusion in the soil solution. However, root interception and an abundance of root hairs will significantly increase opportunities for P absorption. Cool soil temperatures and low soil moisture content can reduce P uptake and create a deficiency. Mobility: Mobile. Forms Utilized by Plants: Monohydrogen and dihydrogen phosphate (HPO 4 2-, H 2 PO 4- ), and phosphate (PO 4 3- ) anions, depending on ph. Fertilizer Sources: Source Formula % Available P 2 O 5 Citrate- Soluble Water- Soluble 20% superphosphate (0-20-0) Ca(H 2 PO 4 ) Concentrated superphosphate (0-45-0) Ca(H 2 PO 4 ) Monoammonium phosphate NH 4 H 2 PO Diammonium phosphate (NH 4 ) 2 HPO Ammonium polyphosphate (NH 4 ) 3 HP 2 O 7 H 2 O Phosphoric acid H 3 PO Superphosphoric acid, polyphosphate H 3 PO 4 + H 4 P 2 O Rock phosphate Fluor- and chloro-apatites, Ca 3 (PO 4 ) 2 CaF 2 Basic slag 5CaO. P 2 O 5 SiO Bone meal Phosphorus fertilizers vary considerably in water solubility, and this can affect crop response. Method of application (broadcast versus row) also influences availability, as applied P can be readily fixed by the soil into unavailable forms. Hydroponic Reagent Sources: Compound Formula % P Ammonium dihydrogen phosphate NH 4 H 2 PO 4 21 (11% N) Diammonium hydrogen phosphate (NH 4 ) 2 HPO 4 21 (81% N) Dipotassium hydrogen phosphate K 2 HPO 4 18 (22% K) Phosphoric acid H 3 PO 4 34 Potassium dihydrogen phosphate KH 2 PO 4 32 (30% K)
464 Appendix F: Characteristics of Essential Nutrient Elements 433 Concentration in Nutrient Solutions: 30 to 50 mg P per L (ppm). Symptoms of Deficiency: Plants grow slowly and are weak and stunted. They may turn dark green. Older leaves may show purple pigmentation. Since P is fairly mobile in plants, deficiency symptoms initially appear in older tissues. Symptoms of Excess: Phosphorus excess appears mainly as a micronutrient deficiency. Iron and Zn are usually the first elements affected. High P may interfere with normal plant metabolism. Leaf content above 1% is considered excessive and possibly toxic. Reference Plant Content (Markert, 1994): 0.20% in dry matter. Sufficiency Ranges: Plant (Scientific Name) Plant Part (Time of Sampling) P % in Dry Matter Barley (Hordeum vulgare) 25 whole tops (emergence of head from boot) Cassava (Manihot esculenta) 25 mature leaves from new growth (vegetative stage) to 30-cm bark sections from main stem just above soil (14-month old plants) Alfalfa/Lucerne (Medicago sativa) 12 tops (6 new growth, prior to flowering) Bahia grass (Paspalum notatum) 50 leaf blades (summer) 0.40 Bird s-foot trefoil (Lotus corniculatus) 50 mature leaves (first flower) Alsike (Trifolium hybridum) 20 whole tops (first flower) Red (Trifolium pratense) 15 whole tops (prior to flowering) Ladino/White (Trifolium repens f. 50 mature leaves (prior to flowering) lodigense) Subterranean (Trifolium subterraneum) 75 mature leaves from new growth (prior to flowering) Coastal bermudagrass (Cynodon dactylon) 40 whole plants (4- to 5-week old plants) Corn (Zea mays) 15 whole tops (plants <12 tall) leaves below the whorl (prior to tasseling) ear leaves (initial silk) Cotton (Gossypium hirsutum) 25 vegetative stems (first squares to initial bloom) vegetative stems (full bloom) Oat (Avena sativa) 25 whole tops (head emergence from boot) Peanut/Ground nut (Archis hypogaea) 50 whole plants (prior to or at bloom stage) whole tops (early pegging) Rice (Oryza sativa) 25 mature leaves from new growth (maximum tillering) 25 mature leaves from new growth (panicle initiation) Rye (Secale cereale) 25 whole tops (panicle initiation) Sorghum (Sorghum bicolor) 25 whole tops (seedlings <30 cm tall, 23- to 39-day old plants) 25 mature leaves from new growth (37 56 days after planting) 25 leaves, third leaf below head (plants at bloom stage, heads visible) 25 leaves, third leaf below head (grain in dough condition) Sudan grass (Sorghum sudanense) 15 whole tops (4 5 weeks between clippings) Soybean (Glycine max) 25 mature leaves from new growth (prior to pod set) Sugar beet (Beta vulgaris) 25 leaves (50 80 days after planting) Sugarcane (Saccharium officinanum) 15 leaves, third leaf from tip (3 5 months after planting) Sunflower (Helianthus annuus) 25 mature leaves from new growth (summer) Timothy (Phleum pratense) 25 whole plants (early anthesis)
465 434 Agronomic Handbook: Management of Crops, Soils, and Their Fertility Plant (Scientific Name) Plant Part (Time of Sampling) P % in Dry Matter Wheat, spring (Triticum aestivum) 25 whole tops (as head emerges from boot) Winter wheat 50 leaves, top two leaves (just before heading) Critical Plant Level: 0.25% total P in dry matter; 500 mg per kg (ppm) extractable P in leaf petioles. Antagonistic Elements: Al, As, B, Be, Cd, Cr, Cu, F, Fe, Pb, Mn, Hg, Mo, Ni, Rb, Sc, Si, Sr, and Zn. Synergistic Elements: Al, B, Cu, F, Fe, Mn, and Zn. Most Important Sources: calcium (Ca), aluminum (Al), and iron (Fe) phosphates. Usual Soil Content: % P. POTASSIUM (K) Function in Plants: Potassium is a major element involved in maintaining plant water status, turgor pressure of plant cells, and the opening and closing of stomata. Potassium is required for the accumulation and translocation of newly formed carbohydrates. Content and Distribution: Potassium consists of 1.00 to 5.00% of dry weight of leaf tissue with sufficiency values from 1.50 to 3.00% in recently mature leaf tissue for many crops. Potassium is considered deficient or in excess when critical values are less than 1.50% or greater than 5.00%, respectively. In excess, K levels may exceed sufficiency level two- to three-fold. Sufficient K can be as high as 6.00 to 8.00% in the stem tissues of some vegetable crops. Highest concentrations are found in new leaves, petioles, and plant stems. K content decreases with age. High-yielding crops contain 50 to 500 lb K per acre (56 to 560 kg K per ha). Bananas contain 1,500 lb K per acre (1,680 kg K per ha). Most plants absorb more K than they need. This excess is frequently called luxury consumption. Harvesting most fruits removes sizable quantities of K from the soil. The relationships of K and Mg and K and Ca are well known. High K concentrations first lead to Mg deficiency; when K is in greater imbalance, it causes Ca deficiency. The K:Mg and K:Ca ratios are used as DRIS norms for interpreting plant analysis results. Ammonium (NH 4+ ) cations can also play a role in the balance of the three cations, K +, Ca 2+, and Mg 2+. Since K does not exist in a combined form in plants, it can be extracted easily from fresh or dried tissue. The extracted concentration is essentially equal to that determined by total analysis. Some vegetable tips are considered deficient when extracted sap from fresh stems and petioles contains less than 2,000 ppm K, and adequate when the K content exceeds 3,000 ppm. Available Forms for Plant Root Absorption: The potassium (K+) cation. Potassium exists in the soil: As the K + cation in the soil solution As exchangeable K + on soil colloids As fixed K in the lattice of 2:1 clays As a component in K-bearing minerals Equilibrium exists among K in the soil solution, exchangeable K, and fixed K. When K fertilizer is applied to the soil, the equilibrium shifts toward exchangeable and fixed K. The shift is reversed as K is removed from the soil solution by root absorption. As the anion concentration increases in the soil solution, the K level also increases. Although the balance of Ca and Mg related to K in
466 Appendix F: Characteristics of Essential Nutrient Elements 435 plants is important, K uptake is not significantly affected by soil Ca levels since Ca moves in the soil primarily by mass flow, while K moves by diffusion. Movement in Soil and Plant Root Absorption: Potassium moves to root-absorbing surfaces by diffusion in soil solution. The rate of diffusion is very temperature dependent. The extent of root contact (root density) with soil exerts significant effect on uptake. Soil O 2 has a greater effect on K uptake than it has on most other ions. Mobility: Mobile. Form Utilized by Plants: K + cation. Fertilizer Sources: Compound Formula % K Potassium chloride (muriate of potash) KCl Potassium sulfate K 2 SO Potassium magnesium sulfate (SUL-PO-MAG) K 2 SO 4 MgSO 4 22 Potassium nitrate KNO 3 44 Potassium hydroxide KOH 83 Hydroponic Reagent Sources: Compound Formula % K Dipotassium hydrogen phosphate K 2 HPO 4 22 (18% P) Potassium chloride KCl 50 (47% Cl) Potassium dihydrogen phosphate KH 2 PO 4 30 (32% P) Potassium nitrate KNO 3 36 (13% N) Potassium sulfate K 2 SO 4 42 (17% S) Concentration in Nutrient Solutions: 10 to 200 mg K per L (ppm). Symptoms of Deficiency: Potassium-deficient plants lodge easily and are sensitive to disease infestation. Fruit yield and quality are reduced. Older leaves will look as if their edges were burned, a symptom known as scorch. Since K is mobile in plants, deficiency symptoms first appear in older tissues. K-deficient plants may also become sensitive to NH 4, leading to a possible NH 4 toxicity syndrome. Symptoms of Excess: Plants with excess K will become deficient in Mg and possibly Ca due to the imbalance. Magnesium deficiency is most likely to occur first. Critical Level: 2.00% in dry matter. Reference Plant Content (Markert, 1994): 1.90% in dry matter. Sufficiency Ranges: Plant (Scientific Name) Plant Part (Time of Sampling) K % in Dry Matter Barley (Hordeum vulgare) 25 whole tops (emergence of head from boot) Cassava (Manihot esculenta) 25 mature leaves from new growth (vegetative stage) to 30-cm bark sections from main stem just above soil (14-month old plants) Alfalfa/Lucerne (Medicago sativa) 12 tops (6 new growth prior to flowering) Bahia grass (Paspalum notatum) 50 leaf blades (summer) 1.80 Bird s-foot trefoil (Lotus corniculatus) 50 mature leaves (first flower) Alsike (Trifolium hybridum) 20 whole tops (first flower)
467 436 Agronomic Handbook: Management of Crops, Soils, and Their Fertility Plant (Scientific Name) Plant Part (Time of Sampling) K % in Dry Matter Red (Trifolium pratense) 15 whole tops (prior to flowering) Ladino/White (Trifolium repens f. 50 mature leaves (prior to flowering) lodigense) Subterranean (Trifolium subterraneum) 75 mature leaves from new growth (prior to flowering) Coastal bermudagrass (Cynodon 40 whole plants (4- to 5-week old plants) dactylon) Corn (Zea mays) 15 whole tops (plants <12 tall) leaves below the whorl (prior to tasseling) ear leaves (initial silk) Cotton (Gossypium hirsutum) 25 vegetative stems (first squares to intial bloom) vegetative stems (full bloom) Oat (Avena sativa) 25 whole tops (head emergence from boot) Peanut/Ground nut (Archis hypogaea) 50 whole plants (prior to or at bloom stage) whole tops (early pegging) Rice (Oryza sativa) 25 mature leaves from new growth (maximum tillering) 25 mature leaves from new growth (panicle initiation) Rye (Secale cereale) 25 whole tops (panicle initiation) Sorghum (Sorghum bicolor) 25 whole tops (seedlings <30 cm tall, 23- to 29-day old plants) mature leaves from new growth (37 to 56 days after planting) 25 leaves, third leaf below head (plants at bloom stage, heads visible) 25 leaves, third leaf below head (grain in dough condition) Sudan grass (Sorghum sudanense) 15 whole tops (4 5 weeks between clippings) Soybean (Glycine max) 25 mature leaves from new growth (prior to pod set) Sugar beet (Beta vulgaris) 25 leaves (50 80 days after planting) Sugarcane (Saccharium officinanum) 15 leaves, third leaf from tip (3 5 months after planting) Sunflower (Helianthus annuus) 25 mature leaves from new growth (summer) Timothy (Phleum pratense) 25 whole plants (early anthesis) Wheat, spring (Triticum aestivum) 25 whole tops (as head emerges from boot) Winter wheat 50 leaves, top two leaves (just before heading) Antagonistic Elements: Al, B, Cd, Cr, F, Mn, Hg, Mo, and Rb. Most Important Sources: Micas, illite, and potassium feldspar. Usual Soil Content: 0.2 to 3.0% K. SULFUR (S) Functions in Plants: Sulfur is a major element involved in protein synthesis and is a component of amino acids, cystine and thiamine. Sulfur is present in peptide glutathione, coenzyme A, vitamin B 1, and in glucosides such as mustard oil and thiols that contribute characteristic odors and tastes to plants in the Cruciferae and Liliaceae families. Sulfur also reduces the incidence of disease in many plants. Content and Distribution: Content in leaf tissue ranges from 0.15 to 0.50% of dry weight. Total content varies with species and stage of growth. The N:S ratio may be as important as total S alone or the sulfate and sulfur:total S ratio as indicators of sufficiency.
468 Appendix F: Characteristics of Essential Nutrient Elements 437 Cruciferae accumulate three times as much S as P. Leguminosae accumulate equal amounts of S and P, and cereals accumulate one third less S than P. Plants may contain 10 to 80 lbs S per acre (11 to 90 kg S per ha). Cereals, grasses, and potatoes remove about 10 lb S per acre. Sugar beets, cabbage, alfalfa, and cotton will remove 15 to 40 lb S per acre (17 to 45 kg S per ha). Sulfur is synergistic with N and P. Available Forms for Plant Root Absorption: Over 90% of available S exists in the soil organic matter, which has an approximate 10:1 N:S ratio. The sulfate anion is the primary available form found in the soil solution. Most available sulfate is found in the subsoil as the anion can be easily leached from the surface horizon. In addition, availability frequently depends on amounts deposited in rainfall (acid rain) and/or released from organic matter decomposition. At high soil ph (>7.0), S may be precipitated as CaSO 4. At lower ph levels (<4.0), the SO 4 2- anion may be adsorbed by Al and Fe oxides. Movement in Soil and Plant Root Absorption: Sulfur moves in the soil as the sulfate (SO 4 2- ) anion by mass flow and within the soil solution by diffusion. Low soil moisture conditions can inhibit S uptake. Sulfate may precipitate as CaSO 4 around the roots if mass flow carries sulfate anions at a rate greater than what can be absorbed. Mobility: Moderately mobile. Form Utilized by Plants: Sulfate (SO 4 2- ) anion. Fertilizer Sources: Source Formula % S Sulfur, elemental S Ammonium sulfate (NH 4 ) 2 SO 4 24 Gypsum CaSO 4 2H 2 O 19 Magnesium sulfate (Epsom salt) MgSO 4 7H 2 O 13 Potassium sulfate K 2 SO 4 18 Potassium magnesium sulfate (SUL-PO-MAG) K 2 SO 4 + MgSO 4 23 Superphosphate (0 20 0) CaSO 4 + calcium phosphate 12 Ammonium thiosulfate (NH 4 ) 2 S 2 O 3 26 Sulfur-coated urea CO(NH 2 ) 2 -S 10 Nitrogen-S solution CO(NH 2 ) 2 NH 4 NO 3 (NH 4 ) 2 SO Hydroponic Reagent Sources: Compound Formula % S Ammonium sulfate (NH 4 ) 2 SO 4 24 (21% N) Calcium sulfate CaSO 4 2H 2 O 23 (26% Ca) Magnesium sulfate (Epsom salt) MgSO 4 7H 2 O 23 (10% Mg) Potassium sulfate K 2 SO 4 17 (42% K) Concentration in Nutrient Solutions: mg S per L (ppm). Symptoms of Deficiency: Deficient plants are light yellow-green. Fruits are light green and lack succulence. Roots are longer than normal and stems become woody; root nodulation in legumes is reduced and delayed maturity occurs in grains. Interestingly, S deficiency is desirable in tobacco crops; it produces proper leaf color. Sulfur deficiency symptoms can be confused with N deficiency symptoms, although S symptoms normally affect whole plants. Nitrogen deficiency symptoms start at older portions of plants. In sandy and/or acid soils, symptoms of S deficiency may occur in newly emerging plants only to disappear as the plant roots enter the subsoil because S as sulfate (SO 4 ) tends to accumulate in the
469 438 Agronomic Handbook: Management of Crops, Soils, and Their Fertility subsoil under such soil conditions. Drought conditions may reduce the uptake of S, thereby inducing deficiency. Symptoms of Excess: Poorly defined. Critical Level in Plants: 0.30% in dry matter. Reference Plant Content (Markert, 1994): 0.30% in dry matter. Sufficiency Ranges: Plant (Scientific Name) Plant Part (Time of Sampling) S % in Dry Matter Barley (Hordeum vulgare) 25 whole tops (emergence of head from boot) Cassava (Manihot esculenta) 25 mature leaves from new growth (vegetative stage) Alfalfa/Lucerne (Medicago sativa) 12 tops (6 new growth prior to flowering) Bahia grass (Paspalum notatum) 50 leaf blades (summer) 0.40 Red (Trifolium pratense) 15 whole tops (prior to flowering) Ladino/White (Trifolium repens f. 50 mature leaves (prior to flowering) lodigense) Subterranean (Trifolium subterraneum) 75 mature leaves from new growth (prior to flowering) Coastal bermudagrass (Cynodon 40 whole plants (4 5 week old plants) dactylon) Corn (Zea mays) 15 whole tops (plants <12 tall) leaves below whorl (prior to tasseling) ear leaves (initial silk) Cotton (Gossypium hirsutum) 25 vegetative stems (first squares to initial bloom) Oat (Avena sativa) 25 whole tops (head emergence from boot) Peanut/Ground nut (Archis hypogaea) 50 whole plants (prior to or at bloom stage) whole tops (early pegging) Soybean (Glycine max) 25 mature leaves from new growth (prior to pod set) Sugarcane (Saccharium officinanum) 15 leaves, third leaf from tip (3 5 months after planting) Sunflower (Helianthus annuus) 25 mature leaves from new growth (summer) Wheat, spring (Triticum aestivum) 25 whole tops (as head emerges from boot) Excess (Toxicity) Symptoms: Premature senescence of leaves may occur. Antagonistic Elements: As, Ba, Fe, Pb, Mo, and Se. Synergistic Elements: F and Fe. Most Important Sources: Iron sulfide and sulfate. Usual Soil Content: 0.01 to 0.1% S. ZINC (Zn) Functions in Plants: Zinc is a micronutrient involved in the same enzymatic functions as Mn and Mg; it is specific to the carbonic anhydrase enzyme. Content and Distribution: Leaf sufficiency range for Zn is 15 to 50 ppm in the dry matter in mature leaves. In some species, visual deficiency symptoms do not appear until the Zn content is as low as 12 ppm. For most crops, 15 ppm Zn in the leaves is considered the critical value. However, a small variation in Zn content, as little as 1 to 2 ppm at the critical level, may be sufficient to establish deficiency or efficiency. Some plants can accumulate Zn concentrations of several hundred ppm without harm. The relation of P and Zn has been intensively studied. Research suggests that high P can interfere with Zn metabolism and affect the uptake of Zn through the roots. High Zn can induce Fe deficiency, particularly in plants sensitive to Fe.
470 Appendix F: Characteristics of Essential Nutrient Elements 439 Available Forms for Plant Root Absorption: Zinc exists in the soil solution as the Zn 2+ cation, as exchangeable Zn, and as organically complexed Zn. Availability is affected by soil ph. It decreases with increasing ph. Availability can also be reduced when available soil P level is very high. Movement in Soil and Plant Root Absorption: Zinc is brought into contact with plant roots by mass flow and diffusion; diffusion is the primary delivery mechanism. Copper (Cu 2+ ) and other cations, such as ammonium (NH 4+ ), will inhibit root Zn uptake. Phosphorus appears to inhibit translocation rather than directly inhibiting uptake. The efficiency of Zn uptake seems to be enhanced by a reduction in ph of the rhizosphere. Plant species that can readily reduce the ph are less affected by low soil Zn than those that cannot. Mobility: Immobile. Form Utilized by Plants: Zinc (Zn 2+ ) cation. Soil Plant Transfer Coefficient: 1 to 10. Fertilizer Sources: Compound Formula % Zn Zinc sulfate ZnSO 4 7H 2 O 35 Zinc oxide ZnO Zinc chelates Na 2 ZnEDTA 14 NaZnTA 13 NaZnHEDTA 9 Zinc polyflavonoids Organically bound Zn 10 Zinc can be applied to plants by soil and foliar applications. Hydroponic Reagent Sources: Compound Formula % Zn Zinc sulfate ZnSO 4 7H 2 O 22 (11% S) Concentration in Nutrient Solutions: 0.05 mg Zn per L (ppm); can be highly toxic to roots above 0.5 mg Zn per L (ppm) Symptoms of Deficiency: Zinc deficiency appears as a chlorosis in the interveinal areas of new leaves. The leaves apprear banded. As severity increases, leaf and plant growth are stunted (rosette appearance). Leaves die and fall. At branch terminals of fruit and nut trees, rosetting occurs with considerable dieback of branches. Symptoms of Excess: Plants particularly sensitive to Fe will become chlorotic when Zn levels are abnormally high (>100 ppm). However, some species can tolerate relatively high Zn (100 to 250 ppm) without significant effects on growth and yield. Critical Level: 15 mg Zn per kg (ppm) in dry matter. Reference Plant Content (Markert, 1994): 50 mg Zn per kg (ppm) in dry matter.
471 440 Agronomic Handbook: Management of Crops, Soils, and Their Fertility Sufficiency Ranges in Plants: Plant (Scientific Name) Plant Part (Time of Sampling) Zn ppm in Dry Matter Barley (Hordeum vulgare) 25 whole tops (emergence of head from boot) Cassava (Manihot esculenta) 25 mature leaves from new growth (vegetative stage) to 30-cm bark sections from main stem just above soil (14-month old plants) Alfalfa/Lucerne (Medicago sativa) 12 tops (6 new growth prior to flowering) Bahia grass (Paspalum notatum) 50 leaf blades (summer) 31 Bird s-foot trefoil (Lotus corniculatus) 50 mature leaves (first flower) Alsike (Trifolium hybridum) 20 whole tops (first flower) Red (Trifolium pratense) 15 whole tops (prior to flowering) Ladino/White (Trifolium repens f. 50 mature leaves (prior to flowering) lodigense) Subterranean (Trifolium subterraneum) 75 mature leaves from new growth (prior to flowering) Coastal bermudagrass (Cynodon 40 whole plants (4- to 5-week old plants) dactylon) Corn (Zea mays) 15 whole tops (plants <12 tall) leaves below whorl (prior to tasseling) ear leaves (initial silk) Cotton (Gossypium hirsutum) 25 vegetative stems (first squares to initial bloom) vegetative stems (full bloom) Oat (Avena sativa) 25 whole tops (head emergence from boot) Peanut/Ground nut (Archis hypogaea) 50 whole plants (prior or at boot stage) whole tops (early pegging) Rice (Oryza sativa) 25 mature leaves from new growth (maximum tillering) mature leaves from new growth (panicle initiation) Sorghum (Sorghum bicolor) 25 whole tops (seedlings <30 cm tall, 23- to 39-day old plants) 25 mature leaves from new growth (37 56 days after planting) 25 leaves, third leaf below head (plants at bloom stage, heads visible) 25 leaves, third leaf below head (grain in dough condition) 7 16 Soybean (Glycine max) 25 mature leaves from new growth (prior to pod set) Sugar beet (Beta vulgaris) 25 leaves (50 80 days after planting) Sugarcane (Saccharium officinanum) 15 leaves, third leaf from tip (3 5 months after planting) Sunflower (Helianthus annuus) 25 mature leaves from new growth (summer) Timothy (Phleum pratense) 25 whole plants (early anthesis) Wheat, spring (Triticum aestivum) 25 whole tops (as head emerges from boot) Winter wheat 50 leaves, top two leaves (just before heading) Excess Level in Plants: >300 mg Zn per kg (ppm). Major Antagonistic Elements: Ca, Mg, and P. Major Synergistic Elements in Plants: Ca, Mg, and P. Agronomic Crops Susceptible to Deficiency: Corn, rice, and sorghum. Soil Conditions for Deficiency: Leached acid sandy soils low in organic matter, neutral to alkaline soils and/or soil high in P. Typical Concentration in Foliage of Normal Crops: 15 to 75 mg Zn per kg in dry matter, 0.03 to 0.15 mm cell sap content. High Accumulator Crop: Sugar beet.
472 Appendix F: Characteristics of Essential Nutrient Elements 441 Most Important Source: Zinc phosphate, carbonate and hydroxide; accessory in silicates. Extraneous Sources: Batteries, galvanized metal, brass, rubber products, and fungicides. Concentration in Environment: Zn per m 3. Usual Soil Content: 10 to 500 mg Zn per kg (extreme values: 4 to 10,000 mg Zn per kg).
473
474 Book List Each chapter contains a reference list citing publications relevant to that chapter. The publications below are general references and relate to the entire book. Anonymous, 1995, International Soil Fertility Manual, Potash & Phosphate Institute, Norcross, GA. Anonymous, 1999, Handbook of Agriculture, Marcel Dekker, New York. Anonymous, 2001, Agricultural Statistics, U.S. Department of Agriculture, U.S. Government Printing Office, Washington, D.C. Anonymous, 2001, Soil Test Levels in North America: Summary Update, Technical Bulletin , Phosphate & Potash Institute, Norcross, GA. Baker, D.E. and Murray, M.R., 1985, Application of Soil Environmental Science in Landspreading and Monitoring of Toxic Chemicals, Institute for Research on Land and Water Resources, Pennsylvania State University, University Park, PA. Bennett, W.F., Tucker, B.B., and Maunder, A.B., 1990, Modern Grain Sorghum Production, Iowa State University Press, Ames. Beverly, R.B., 1991, A Practical Guide to the Diagnosis and Recommendation Integrated System (DRIS), MicroMacro Publishing, Athens, GA. Boote, K.J. et al., Eds., Physiology and Determination of Crop Yield, American Society of Agronomy, Madison, WI. Brown, L.R., 1997, The Agricultural Link: How Environmental Deterioration Could Disrupt Economic Progress, Worldwatch Paper 136, Worldwatch Institute, Washington, D.C. Carter, M.R., Ed., 1993, Soil Sampling and Methods of Analysis, Canadian Society of Soil Science, Ottawa, Canada. Chapman, H.D., 1996, Diagnostic Criteria for Plants and Soils, University of California, Riverside. Cramer, C., 1985, The Farmer s Fertilizer Handbook, Regenerative Agriculture Association, Emmaus, PA. Dobermann, A. and Fairhurst, T., 2000, Rice: Nutrient Disorders and Nutrient Management, Potash & Phosphate Institute of Canada and International Rice Research Institute, Singapore. Downing, R., 1998, Compost/Organics Reference Book, Downing & Associates, Mentor, OH. Flavin, C., French, H., and Gardner, G., Eds., 2002, State of the World, W.W. Norton, New York. Gardner, G., 1996, Shrinking Fields: Cropland Loss in a World of Eight Billion, Worldwatch Paper 131, Worldwatch Institute, Washington, D.C. Glass, A.D.M., 1989, Plant Nutrition: An Introduction to Current Concepts, Jones & Bartlett, Boston. Grundon, N.J., 1984, Hungry Crops: A Guide to Nutrient Deficiencies in Field Crops, Queensland Department of Primary Industries, Brisbane, Australia. Halliday, D.J. and Trenkel, M.E., Eds., 1992, IFA World Fertilizer Use Manual, International Fertilizer Association, Paris. Johnston, A.E., 2000, Soil and Plant Phosphate, International Fertilizer Association, Paris. Jones, J.B., Jr., 1998, Plant Nutrition Manual, CRC Press, Boca Raton, FL. Jones, J.B., Jr., 2001, Laboratory Guide for Conducting Soil Tests and Plant Analysis, CRC Press, Boca Raton, FL. Kabata-Pendias, A., 2000, Trace Elements in Soil and Plants, 3rd ed., CRC Press, Boca Raton, Fl. Kalra, Y.P., 1998, Handbook of Reference Methods for Plant Analysis, Soil and Plant Analysis Council, CRC Press, Boca Raton, FL. Ludwick, A.E., 1998, Western Fertilizer Handbook, Second Horticultural Edition, California Fertilizer Association, Interstate Publishers, Danville, Il. Markert, B., 1994, Progress Report of the Element Concentration Cadaster Project, 25th General Assembly of Institute of Advanced Ecological and Economic Studies, Zittau, Germany. Martin, J.H., Leonard, W.H., and Stamp, D.L., 1976, Principles of Crop Production, 3rd ed., John Wiley & Sons, New York. 443
475 444 Agronomic Handbook: Management of Crops, Soils, and Their Fertility Mills, H.A. and Jones, J.B., Jr., 1996, Plant Analysis Handbook II: A Practical Sampling, Preparation, Analysis, and Interpretation Guide, MacroMicro Publishing, Athens, GA. Mortvedt, J.J. et al., Eds., 1991, Micronutrients in Agriculture, Soil Science Society of America, Madison, WI. Pais, I. and Jones, J.B., Jr., 1997, Handbook of Trace Elements, St. Lucie Press, Boca Raton, FL. Parnes, R., 1990, Fertile Soil: A Grower s Guide to Organic and Inorganic Fertilizers, AgAccess, Davis, CA. Peperill, K.I., Sparrow, L.A., and Reuter, D.J., Eds., 1999, Soil Analysis: An Interpretation Manual, CSIRO Publishing, Collingwood, Australia. Rechcigl, J.E., Ed., 1995, Soil Amendments and Environmental Quality, Lewis Publishers, Boca Raton, Fl. Reid, K., 1998, Soil Fertility Handbook, Fertilizer Institute of Ontario, Queen s Printer for Ontario, Toronto, Canada. Reuter, D.J. and Robinson, J.B., Eds., 1997, Plant Analysis: An Interpretation Manual, CSIRO Publishing, Collingwood, Australia. Smith, C.W., 1995, Crop Production: Evolution, History, and Technology, John Wiley & Sons, New York. Soon, Y.K., Ed., 1985, Soil Nutrient Availability: Chemistry and Concepts, Van Nostrand Reinhold, New York. Sparks, D.L., Ed., 1996, Methods of Soil Analysis 3: Chemical Methods, Soil Science Society of America, Madison, WI. Starke, L., Ed., 2000, State of the World, W.W. Norton, New York. Sumner, M.E., Ed., Handbook of Soil Science, CRC Press, Boca Raton, Fl. Vaughn, J.G. and Geissler, C.A., 1999, The New Oxford Book of Food Plants, Oxford University Press, Oxford, U.K. Westerman, R.L., Ed., 1993, Soil Testing and Plant Analysis, Soil Science Society of America, Madison, WI.
476 0897_frame_INDEX Page 445 Thursday, September 19, :40 AM Index A AB-DTPA extraction procedure, 344, 347, interpretation for micronutrients, , 359 interpretation for potassium, 348 Acidity, fertilizer efficiency, 243 plant nutrition, 299 Alfalfa record yield, 9 uptake major elements and micronutrients, 12 Alfisols, 182, 184, 191, 195 Agronomic commodities conversion factors, 14 weights and measures, 13 weights full bushel, 14 Alkalinity, 234 plant nutrition, 299 Ammonium soil test procedure, 354 translocation, 314 toxicity, 300 Antagonistic elements, 303 Aridisols, 182, , 196 Availability of elements, B Barley (Hordenum vulgare L.), consumption, 8 maximum attainable yield, 5 record yield, 9 Boron approximate concentration, 306 classification, essential/toxic, 303 concentration in plants, 304, crop sensitivities, deficiency symptoms and causes, 279, 301 forms and principal functions, 308 function in plant, 278 general effects, 307 plant nutrition summary, soil/plant summary, soil test interpretation, uptake, 306 Boron fertilizers, 274 applications rates, 276 Bray P1, 342 Bray P2, 342 Bulk density, 218 C Cadmium average content in crops, 309 Calcium concentration in plants, deficiency/excess, fertilizers, 264 plant nutrition summary, soil/plant summary, soil testing procedures, Calcium chloride soil test procedures, 344, 347, 350, Cation exchange capacity clay minerals, 212 clay minerals and soils, 211 soil colloids, 212 soil order, 211 textural class, 213 Cations fertility ratings, 358 soil testing procedures, Chelates, 276 Chloride fertilizers, 274 Chlorine concentration in plants, 304 crop sensitivities, 303 deficiency/excess, 301 plant nutrition summary, soil/plant summary, Chlorophyll meter,
477 0897_frame_INDEX Page 446 Thursday, September 19, :40 AM 446 Agronomic Handbook: Management of Crops, Soils, and Their Fertility Clay minerals cation exchange capacity, classification scheme for phyllosilicates, 213 Clays, 217 Cobalt average content in crops, 309 Conversion factors, 14, Conductivity (EC) determination, measurement and conversion, 234 Copper accumulator plants, 311 approximate concentration, 306 classification, essential/toxic, 303 concentration in plants, 304, crop sensitivities, deficiency symptoms and causes, 279, 301 forms and principal functions, 308 function in plant, 278 general effects, 307 interpretative soil values, 359 plant nutrition summary, removal by crops, 311 sludge content, 311 soil/plant summary, soil-plant transfer, 310 uptake, 306 Copper fertilizers, applications rates, 276 chelates, 276 Corn (Zea mays L.), average yield, 9 consumption, 8 fertilizer applications, 10 maximum attainable yield, 5 nutrient utilization, 11 production, , 4 record yield, 9 uptake major elements and micronutrients, 12 Cotton (Gossypium spp.), average yield, 9 fertilizer applications, 10 maximum attainable yield, 5 nutrient utilization, 11 record yield, 9 uptake major elements and micronutrients, 12 Crop diagnosis, Crop responses by soil rating, 357 Crop maximum attainable yields, 5 Crop record yields, 9 D Definitions botanical, 403 soil/plant, Diffusion, ion movement, Diagnostic observations, DTPA extraction, 350 E Electrical conductivity (see Conductivity) Elemental mobility in plants, 367 Entisols, 182, 192, 197 Ethanol production, Exchange capacity (see cation exchange capacity) F Fertilizer acidity, 269 application rates-small areas, 283 application and utilization, 10 characteristics, cold water solubility, 269 consumption by region, 255 conversion factors, 271 equivalent acidity, 269 equivalent weights/ionic forms, 268 glossary, granular properties, 272 liquid, 272 major element sources, , 268, 414, 422, , 432, 435, 437 micronutrient sources, 411, , 420, 425, 427, 439 nutrient concentrations, 271 organic, organic fertilizer preparation, phosphorus, physical characteristics of liquids, 272 placement and rates, properties, 268, 272 water solutions, 270 world use, G Germination, 15 Global distribution of major soil orders Alfisols, 182, 184, 191, 195 Aridisols, 182, , 196 Entisols, 182, 192, 197
478 0897_frame_INDEX Page 447 Thursday, September 19, :40 AM Index 447 Histisols, 182, 192, 198 Inceptisols, 183, 185, 199 Mollisols, 183, 185, 200 Oxisols, 183, 185, 201 Spodosols, 183, 185, 202 Ultisols, 183, 185, 203 Vertisols, 186, 204 Great soil zones, 193 nine major soil regions, 194 Grains harvested, 4 supply, 6 yearly yields, 6 Grain crop statistics, 6 Grain sorghum [Sorghum bicolor (L.) Moench], average yield, 9 maximum attainable yield, 5 nutrient utilization, 11 Grain supply, 6 Grain yield potential, 5 Grassland soil, composition, 218 Great group names, 190 Great soil zones, 193 Groundnut, see Peanut H Harvested grain area per person, 4 Heavy metals accumulator plants, 311 cumulative additions, 310 removal by plants, 311 sludge content, 311 soil-plant transfer, 310 sources, 309 Histisols, 182, 192, 198 I Inceptisols, 183, 185, 199 Ion movement in soil diffusion, mass flow, root interception, Iron approximate concentration, 306 classification, essential/toxic, 303 concentration in plants, 304, 421 crop sensitivities, deficiency symptoms and causes, 229, 301 forms and principal functions, 308 function in plant, 278 general effects, 307 interpretative soil values, 359 plant nutrition summary, soil/plant summary, uptake, 306 Iron fertilizers, 275 applications rates, 276 chelates, 276 Irrigation water productivity, 221 K Kaolinite L Lead average content in crops, 309 Lime rate (LR) recommendations, Liming characteristics, Liming glossary, Liming materials, , 264 Lowering soil ph, 250 M Magnesium concentration in plants, deficiency/excess, 300 fertilizers, 264, 422 plant nutrition summary, soil/plant summary, soil testing procedures, Major elements fertilizers, , 268, 414, 422, , 432, 435, 437 plant nutrition summary, uptake, 12 Manganese applications rates, 276 approximate concentration, 306 chelates, 276 classification, essential/toxic, 303 concentration in plants, 304, 426 critical soil test values, 358 crop sensitivities, deficiency/excess, 301 deficiency symptoms and causes, , 301 fertilizers, 275, 425 forms and principal functions, 308 function in plant, 278 general effects, 307
479 0897_frame_INDEX Page 448 Thursday, September 19, :40 AM 448 Agronomic Handbook: Management of Crops, Soils, and Their Fertility interpretative soil values, 359 plant nutrition summary, soil/plant summary, soil testing procedures toxicity, 55, 90, 153 uptake, 306 Manure, Markert s reference plant composition, 370 Mass flow, Mehlich No. 1, 343, 346, 349 Mehlich No. 3, 343, 346, 349 Micronutrients application rates, 276 approximate concentrations, 306 chelates, 276 classification, essential/toxic, 303 classification for plants, 305 classification into fertility classes, 352 concentration in plants, 304 crop sensitivities, 277, 302 deficiency and excess soil ranges, 353 fertilizers, , 411, , 420, 425, 427, 439 forms and principal functions, 308 in soils, interpretation of soil data, 353 plant nutrition summary, soil conditions affecting deficiency, 277 soil test interpretations, 351 uptake, 12 Mollisols, 183, 185, 200 Molybdenum approximate concentration, 306 classification, essential/toxic, 303 concentration in plants, 304 crop sensitivities, deficiency symptoms and causes, 280, 301 fertilizers, 275, 427 forms and principal functions, 308 functions in plant, 278 general effects, 307 plant nutrition summary, soil/plant summary, uptake, 306 Molybdenum fertilizers, 275, 427 applications rates, 276 Morgan soil testing procedures, 343, , 349, N Neutral ammonium acetate, 346 Nitrate interpretative soil test values, 359 soil test procedures, 354 Nitrogen content in plants, fertilizers, 263, fixation by legumes, 16 plant nutrition summary, soil/plant summary, Nutrient elements deficiency symptoms, legumes, 409 factors affecting, , in soils, molecular weights, compounds, and ions, 262 movement in soil, 297 requirements, 405 symptoms, uptake by crops, 297 Nutrient utilization, 11 Nutritive values, 15 O Oats (Avena satia L.), consumption, 8 nutrient utilization, 11 Oil seed production, 9 Olsen soil test procedure, 343 Organic fertilizers, preparation, Organic matter components, 228 determination, 224 functions and organisms, interpretative values, 228 soil component glossary, 227 Oxisols, 183, 185, 201 P Peanut (Arachis hypogaea L.), average yield, 9 maximum attainable yield, 5 nutrient utilization, 11 uptake major elements and micronutrients, 12 ph, determination by color indicators, 239 determination in 0.01M CaCl2, determination in 1N KCl, 238 determination in water, 237 effect on soil and plant composition, fertilizer efficiency, 243 interpretations, Phosphorus concentration in plants,
480 0897_frame_INDEX Page 449 Thursday, September 19, :40 AM Index 449 deficiency/excess, 300 fertilizers, 263, , 432 North American summary, 362 plant nutrition summary, soil interpretative values, 344, 358 soil/plant summary, soil test frequencies, 362 soil testing procedures, Plant analysis, interpretation, reference materials, 373 values, 387 Plant mineral nutrition, Potassium concentration in plants, deficiency/excess, 300 fertilizers, 264, 435 North American summary, 361 plant nutrition summary, soil/plant summary, soil test frequencies, 361 soil testing procedures, Q Quality components of grains, 16 R Rice (Oryza sativa L.), average yield, 9 consumption, 7 maximum attainable yield, 5 nutrient utilization, 11 production, , 4 uptake major elements and micronutrients, 12 Root interception, S Salinity corn, 54 cotton, 172 grain sorghum, oats, wheat, Selenium average content in crops, 309 Sewage sludge, annual rate applications, 311 Sodium soil testing procedures, Soil acidity definitions, 239 alkalinity, 234 analysis, classification system, , component glossary, 227 conductivity measurement, consistence, 219 great soil group names, 190 interpretative values, 228 micronutrient/trace element concentration, 222 nutrient elements, 223 organic matter components, 228 organic matter determination, 224 organic matter functions, ph, ph interpretations, plant nutrient element content, 222 salinity, 234 sampling, water held, 219 Soil horizons and layers, designations, Soil moisture constants, 220 Soil nutrient availability, 356 classifications, fertility ratings, 358 Soil orders, cation exchange capacities, 211 characteristics and diagnosis, temperature regions, 186 Soil ph, lowering, 250 North American soil ph summary, 251 Soil/Plant definitions, Soil salinity, Soil separate definitions, Soil suborders, Soil test values, 387 Soil texture, infiltration rates, 220 particle size fractions, 217 water held, 219 Soils bulk densities, 218 chemical and physical properties, water storage capacity, 220 Sorghum (see grain sorghum) Soybean [Glycine max (L.) Merr.], average yield, 9 fertilizer applications, 10 maximum attainable yield, 5 nutrient utilization, 11 record yield. 9 uptake major elements and micronutrients, 12 Spodosols, 183, 185, 202 State soils,
481 0897_frame_INDEX Page 450 Thursday, September 19, :40 AM 450 Agronomic Handbook: Management of Crops, Soils, and Their Fertility Suborders, areas and percentages, Sugar beet (Beta vulgaris L. spp.), average yield, 9 maximum attainable yield, 5 nutrient utilization, 11 Sulfate, soil test extractants, 355 Sulfur concentration in plants, 438 fertilizers, 265, 437 plant nutrition summary, soil/plant summary, Sustaining high yields, Synergistic elements, 303 T Trace elements approximate concentration, 306 classification for plants, 305 forms and principal functions, 308 general effects, 307 U Ultisols, 183, 185, 203 V Vertisols, 186, 204 W Water extraction procedure, 347 Weeds, 407 Weights and measures, 13, full bushels/standard yields, 14 Wheat (Triticum aestivum L., T. durum Desf), average yield, 9 consumption, 7 fertilizer applications, 10 maximum attainable yield, 5 nutrient utilization, 11 production , 4 record yield, 9 uptake major elements and micronutrients, 12 World grain production, 3 Z Zinc accumulator plants, 311 approximate concentration, 306 classification, essential/toxic, 303 concentration in plants, 304, 440 critical soil test values, 358 crop sensitivities, deficiency symptoms and causes, 280, 301 fertilizers, 275, 439 forms and principal functions, 308 function in plant, 278 general effects, 307 interpretative soil test values, 359 plant nutrition summary, removal by plants, 311 sludge content, 311 soil/plant summary, soil-plant transfer, 310 uptake, 306 Zinc fertilizers, 275, 439 applications rates, 276 chelates, 276
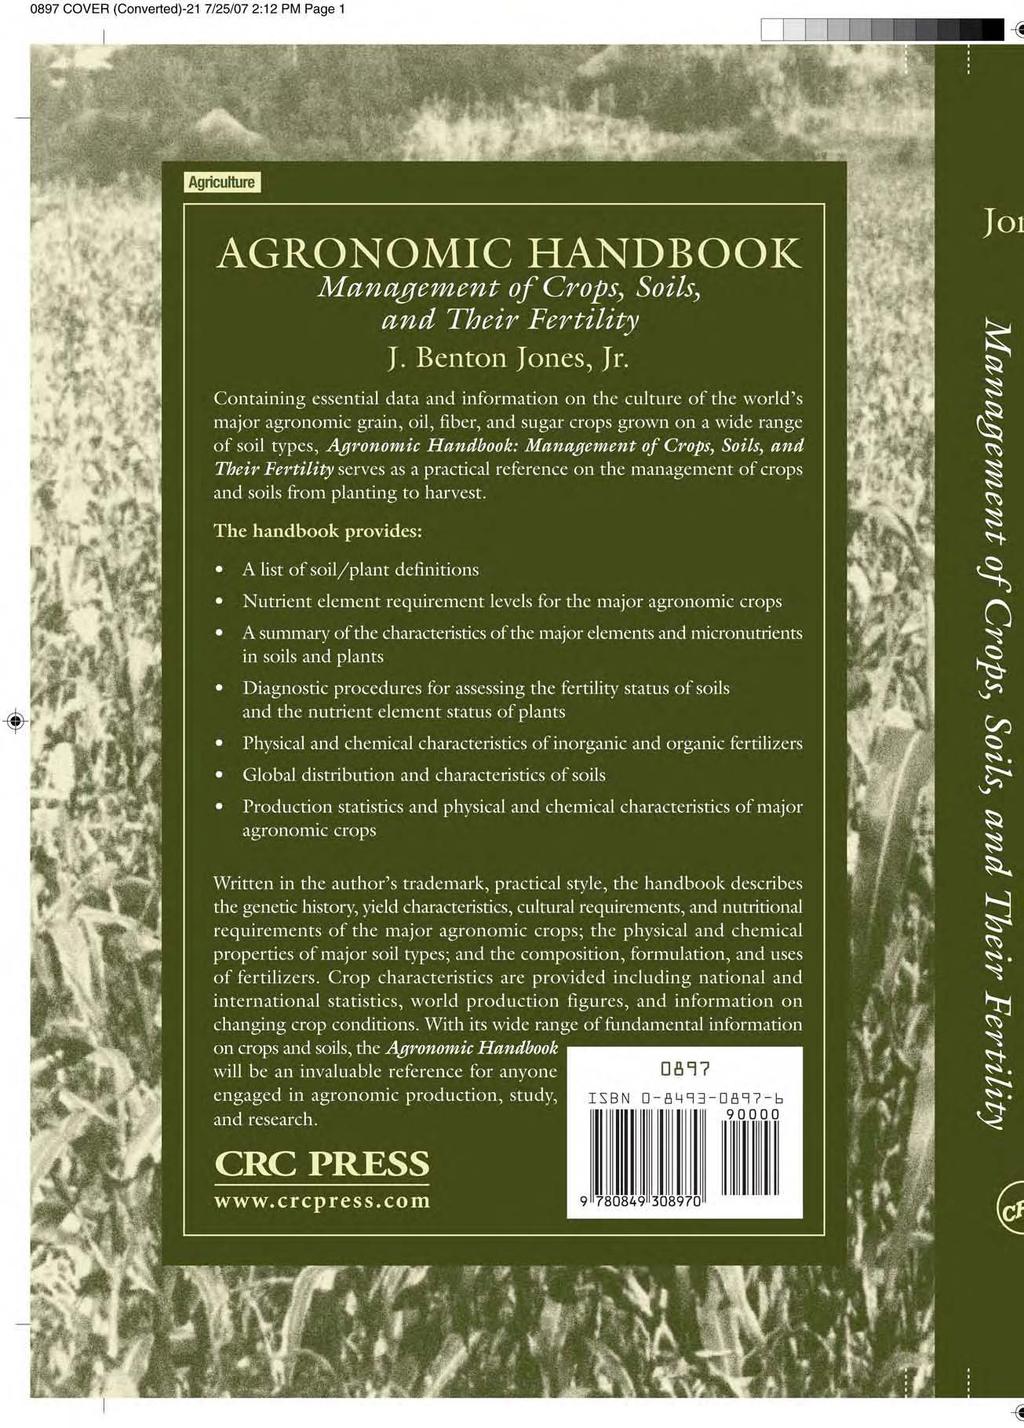
482
Understanding a Soil Report
 Understanding a Soil Report AGRONOMY SOIL ANALYSIS 1. Soil ph Soil ph is a measure of the acidity in the soil. An acidic soil has a greater amount of hydrogen (H+) ions and a ph below 7.0. Values above
Interpretation of Soil Tests for Environmental Considerations
 Interpretation of Soil Tests for Environmental Considerations Ray Ward Ward Laboratories, Inc Kearney, NE www.wardlab.com Guiding Producers Today to Feed the World Tomorrow www.wardlab.com Saline County
Potassium and Phosphorus as Plant Nutrients. Secondary Nutrients and Micronutrients. Potassium is required in large amounts by many crops
 Potassium and Phosphorus as Plant Nutrients Secondary Nutrients and Micronutrients Potassium is required in large amounts by many crops Yield K 2 O taken up Crop level/ac in total crop, lb Alfalfa 8 tons
Chapter 1: Overview of soil fertility, plant nutrition, and nutrient management
 Chapter 1: Overview of soil fertility, plant nutrition, and nutrient management Agustin Pagani, John E. Sawyer, and Antonio P. Mallarino / Department of Agronomy, Iowa State University Developed in cooperation
Interpreting Soils Report. Beyond N P K
 Interpreting Soils Report Beyond N P K What we will cover We will not discuss Macro Nutrients Nitrogen, Phosphorus, and Potassium. We will touch on Secondary Nutrients Magnesium, Calcium and Sulfur. We
Interpreting Plant Tissue and Soil Sample Analysis
 Interpreting Plant Tissue and Soil Sample Analysis Dan Fromme Associate Professor-Cotton, Corn, & Grain Sorghum Specialist LSU AgCenter Dean Lee Research & Extension Center Alexandria, Louisiana Fertilization
Raymond C. Ward Ward Laboratories, Inc Kearney, NE
 Raymond C. Ward Ward Laboratories, Inc Kearney, NE www.wardlab.com There is More Than N P K Major Nutrients N, P, and K Secondary Nutrients Calcium, Magnesium, and Sulfur Micro-Nutrients Zinc, Iron, Manganese,
Nutrient Recommendations Agronomic Crops Last Updated 12/1/16. Grain Corn. Crop Highlights Target ph: 6.0
 Nutrient Recommendations Agronomic Crops Last Updated 12/1/16 Crop Highlights Target ph: 6.0 Grain Corn Split N applications to increase N-use efficiency in corn. Apply a small amount (20-25%) at planting
1101 S Winchester Blvd., Ste. G 173 San Jose, CA (408) (408) fax Page 1 of 2
 (408) fax Page 1 of 2") San Jose Office September 28, 2018 Report 18-262-0106 Zanker Landscape Mateirals 675 Los Esteros Road San Jose, CA 95134 Attn: Beto Ochoa RE: ZB-PPM Reaction at 7.5 is slightly alkaline and with lime absent
San Jose Office September 28, 2018 Report 18-262-0106 Zanker Landscape Mateirals 675 Los Esteros Road San Jose, CA 95134 Attn: Beto Ochoa RE: ZB-PPM Reaction at 7.5 is slightly alkaline and with lime absent
Soil Composition. Air
 Soil Composition Air Soil Included Air Approximately 40 to 60% of the volume of a soil is actually empty space between the solid particles (voids). These voids are filled with air and/or water. The air
SOILS AND PLANT NUTRITION
 SOILS AND PLANT NUTRITION WHAT IS SOIL? Soil is the medium in which plants grow - the basis for plant growth. I can t get any respect. People treat me like dirt! Four Major Components of Soil Sand Silt
Soil Fertility and Nutrient Management. Hailin Zhang. Department of Plant and Soil Sciences
 Soil Fertility and Nutrient Management Hailin Zhang Department of Plant and Soil Sciences C H O P N K 16 ESSENTIAL ELEMENTS Ca S Mg B Cl Cu Fe Mn Mo B NON-MINERAL NUTRIENTS Carbon (C) Hydrogen (H) Oxygen
Micronutrient Management. Dorivar Ruiz Diaz Soil Fertility and Nutrient Management
 Micronutrient Management Dorivar Ruiz Diaz Soil Fertility and Nutrient Management Essential Nutrients Thirteen essential nutrients Nitrogen, phosphorus, potassium, calcium, magnesium, sulfur Iron, manganese,
Multi-K. Potassium Nitrate Products For Healthy Crops
 Multi-K Potassium Nitrate Products For Healthy Crops Contents Potassium in the plant Multi-K and its advantages Nutrigation with Multi-K Foliar nutrition with Haifa Bonus Multi-K properties Multi-K products
BOTANY AND PLANT GROWTH Lesson 9: PLANT NUTRITION. MACRONUTRIENTS Found in air and water carbon C oxygen hydrogen
 BOTANY AND PLANT GROWTH Lesson 9: PLANT NUTRITION Segment One Nutrient Listing Plants need 17 elements for normal growth. Carbon, oxygen, and hydrogen are found in air and water. Nitrogen, phosphorus,
Supplying Nutrients to Crops
 Supplying Nutrients to Crops What is Plant Nutrition? Plants need nutrients for healthy growth and development. Plant nutrition involves the absorption of nutrients for plant growth and is dependent on
MICRO NUTRIENTS AND SECONDARY NUTRIENTS
 BR Global, LLC. P.O. Box 8164 Rocky Mount, NC 27804 Tel: 252-442-0700 / Fax: 252-442-0787 Sales@BRGLimited.com www.brglimited.com MICRO NUTRIENTS AND SECONDARY NUTRIENTS Trace elements or micronutrients
Understanding Your Soil Report. Michael Cook 2018
 Understanding Your Soil Report Michael Cook 2018 Soil Sampling Advantage gives nutrient concentrations may shed light on soil issues baseline so look for trends can be done pre-plant timing not as critical
Nutrients & Diagnosing Nutrient Needs. Carrie Laboski Dept. of Soil Science UW-Madison
 Nutrients & Diagnosing Nutrient Needs Carrie Laboski Dept. of Soil Science UW-Madison Sources of nutrients available for plant uptake Nutrients in the soil solution are: In ionic form At low concentration
Soils and Soil Fertility Management
 Soils and Soil Fertility Management Mark L. McFarland Professor and Soil Fertility Specialist Texas A&M AgriLife Extension Service College Station, Texas Four Principal Components of Soil Air Mineral Solid
AgriCal by. Healthier Soils Stronger Plants Higher Yields
 Healthier Soils Stronger Plants Higher Yields does your soil really need LIME? The importance of calcium as an essential plant nutrient in the soil is often overlooked. Too many times, when soil tests
Plant Nutrients in Mineral Soils
 The Supply and Availability of Plant Nutrients in Mineral Soils Plant Nutrients in Mineral Soils Factors Controlling the Growth of Higher Plants 1. Light 2. Mechanical Support. Heat. Air 5. Water 6. Nutrients
What s new with micronutrients in our part of the world?
 2006 Integrated Crop Management Conference - Iowa State University 181 What s new with micronutrients in our part of the world? George Rehm, Professor, Soil, Water and Climate, University of Minnesota
Discuss the importance of healthy soils Soil properties, physical, chemical and biological that one can manage for soil health How organics play a
 Andrew Ristvey The University of Maryland Extension programs are open to any person and will not discriminate against anyone because of race, age, sex, color, sexual orientation, physical or mental disability,
Animal, Plant & Soil Science. D3-7 Characteristics and Sources of Secondary Nutrients and Micronutrients
 Animal, Plant & Soil Science D3-7 Characteristics and Sources of Secondary Nutrients and Micronutrients Interest Approach Obtain samples of minerals that serve as sources of calcium, magnesium, and sulfur
Use of Soil and Tissue Testing for Sustainable Crop Nutrient Programs
 Use of Soil and Tissue Testing for Sustainable Crop Nutrient Programs Kelly T. Morgan Soil and Water Science Department Southwest Florida Research and Education Center Immokalee 239 658 3400 conserv@ufl.edu
May 2008 AG/Soils/ pr Understanding Your Soil Test Report Grant E. Cardon Jan Kotuby-Amacher Pam Hole Rich Koenig General Information
 May 2008 AG/Soils/2008-01pr Understanding Your Soil Test Report Grant E. Cardon, USU Extension Soil Specialist Jan Kotuby-Amacher, Coordinator for North American Proficiency Testing Program Pam Hole, Supervisor
INTERPRETATION GUIDE TO SOIL TEST REPORTS
 Originators of Your Crop's Dieticians 4915 West Monte Cristo Road Edinburg, Texas 78541 Telephone: 956-383-0739 Facsimile: 956-383-0730 INTERPRETATION GUIDE TO SOIL TEST REPORTS TPSL 's Daubeny Carbon
Nutrient level (EC) in a pot is like a bank
 in a pot is like a bank") Dirt, Fert and Squirt (1) Supplying Essential Nutrients What are the most common nutritional problems? Too much fertilizer Not enough fertilizer Paul Fisher pfisher@ufl.edu 1 ph too high ph too low 2 Nutrient
Dirt, Fert and Squirt (1) Supplying Essential Nutrients What are the most common nutritional problems? Too much fertilizer Not enough fertilizer Paul Fisher pfisher@ufl.edu 1 ph too high ph too low 2 Nutrient
Managing Micronutrients with Soil (Plant) Testing and Fertilizer
 Testing and Fertilizer") Managing Micronutrients with Soil (Plant) Testing and Fertilizer What Is Plant Analysis? A tool to monitor or make decisions Identify nutrient deficiencies and determine nutrient shortages Determining
Managing Micronutrients with Soil (Plant) Testing and Fertilizer What Is Plant Analysis? A tool to monitor or make decisions Identify nutrient deficiencies and determine nutrient shortages Determining
Potash Phosphate Nitrogen
 Nutrients 160 140 120 100 Potash Phosphate Nitrogen 80 60 40 20 0 1961 1971 1981 1991 2001 2011 Year FAOSTAT 45,000,000 40,000,000 35,000,000 30,000,000 25,000,000 20,000,000 15,000,000 10,000,000 5,000,000
Understanding your results Acidity... 3 Aluminium... 3 Base saturation... 3 Boron... 4 Bulk density... 4 Calcium... 4 Cations...
 Understanding your results Acidity... 3 Aluminium.... 3 Base saturation... 3 Boron... 4 Bulk density... 4 Calcium... 4 Cations... 4 CEC - Cation Exchange Capacity... 4 Copper... 5 Conductivity... 6 Deficiencies...
Greenhouse Horticulture
 Managing Nutrients in Greenhouse Horticulture Original content by Domenic Cavallaro Stoller Australia Pty Ltd Plant HORMONE PRODUCTION follows approx. cycles with changing NUTRIENT requirements Source:
Understanding ph management and plant nutrition Part 3: Fertilizers
 Understanding ph management and plant nutrition Part 3: Fertilizers Bill Argo, Ph.D. Blackmore Company, Tel: 800-874-8660, Intl 734-483-8661, E-mail: bargo@blackmoreco.com Originally printed in 2003 in
Chapter 7: Micronutrient Management
 Chapter 7: Micronutrient Management Agustin Pagani, John E. Sawyer, and Antonio P. Mallarino / Department of Agronomy, Iowa State University Developed in cooperation with Lara Moody, TFI; John Davis, NRCS;
How to Develop a Balanced Program for Pecan and Chili. Robert R Smith
 Essential Plant Nutrients How to Develop a Balanced Program for Pecan and Chili Robert R Smith Nutrition Management Involves Knowledge of: Site/Soil characteristics and chemistry Plant requirements Cropping
Welcome. Greg Patterson C.C.A. President A&L Canada Laboratories
 Welcome Greg Patterson C.C.A. President A&L Canada Laboratories Discussion Soil test levels Dropping P,K Organic matter levels dropping Cost of Fertilizer Increasing due to Global Demand Environmental
Terry Richmond s Fertilizer Package mentioned in the panel discussion March 14, 2013.
 Terry Richmond s Fertilizer Package mentioned in the panel discussion March 14, 2013. Roles of the 16 essential nutrients in plant development Sixteen plant food nutrients are essential for proper crop
Nutrition of Horticultural Crops. Monica Ozores-Hampton University of Florida/IFAS/SWFREC Spring 2013
 Nutrition of Horticultural Crops Monica Ozores-Hampton University of Florida/IFAS/SWFREC Spring 2013 Phosphorous Essential Nutrients - List MACRONUTRIENTS: MICRONUTRIENTS: Nitrogen Boron Phosphorus Chlorine
Fertility management in soybean
 Fertility management in soybean Dorivar Ruiz Diaz Soil Fertility and Nutrient Management In-depth Soybean Schools 2014 Overview Considerations for soil sampling and testing. Considerations for N, P and
S1AN: Same as test S1A with carryover Nitrogen as Nitrate With Recommendations: $13.20 Without Recommendations: $11.50
 AGRICULTURE SOIL SOIL TEST PACKAGES S1A (Basic): Organic Matter, Available Phosphorus, (P1 Weak Bray and P2 Strong Bray) Exchangeable Potassium, Magnesium, Calcium and Hydrogen, Soil ph, Buffer Index,
Fertilization Programming
 Fertilization Plant Composition Water composes 90% of plant weight (fresh weight) Dry weight is composed of 17 essential elements: Non-fertilizer elements: Carbon (C) -- 41% of dry weight (DW) Hydrogen
Soil Program Recommendation
 Soil Program Recommendation Grower: G.C. Wynne Consultant: Bill Munton Doyle St Quirindi NSW 2343 Soil Test No: K6930ABC These comments and suggestions are based on our interpretation of soil analysis
Soil acidity. Kiyoshi Tsutsuki
 Soil acidity Kiyoshi Tsutsuki http://timetraveler.html.xdomain.jp H = log (H+) oriba Home page ph and crop growth (vegetables and root crops) Low ph tolerance strong (4.0~5.0) A little strong (4.5~6.0)
Barley and Sugarbeet Symposium
 MICRONUTRIENT TESTING & MANAGEMENT IN BARLEY, CORN & PULSES Barley and Sugarbeet Symposium Billings, MT January 10, 2017 Clain Jones clainj@montana.edu 994-6076 MSU Soil Fertility Extension Goals Today
Secondary and Micronutrients
 Secondary and Micronutrients Dr. John E. Sawyer Associate Professor Soil Fertility Extension Specialist Department of Agronomy Slide from G. Rehm, Univ. MN Sulfur Deficiencies Soil Situations and Climatic
Nutrient management irrigated corn. Jim Camberato
 Nutrient management irrigated corn Jim Camberato jcambera@purdue.edu Irrigated corn response to N Indiana Michigan 300 2008CS 2008CC 2008CC2 2013CS 2014CC 2014CW 2015CS Grain yield, bu/ac 250 200 150
FACTORS AFFECTING WATER QUALITY
 TECHNICAL PAPER WATER QUALITY PLANT HEALTH FACTORS Water quality is one of the most important factors affecting plant growth, as unwanted components in water can interfere with nutrient availability and
LIST OF ABBREVIATIONS USED
 LIST OF ABBREVIATIONS USED Abbreviation Meaning Abbreviation Meaning % Per cent Mn Manganèse & and mm milimetre * Asterisk IW Irrigation water Ca Calcium K Potassium cm centimetre kg kilogram CPE Cumulative
Plant Food. Nitrogen (N)
") Plant Food Nitrogen (N) Functions: Promote plant growth Increase protein content of crops Improves quality of crop Makes plant more efficient with water Helps for stay green and dry down Plants take up
Plant Food Nitrogen (N) Functions: Promote plant growth Increase protein content of crops Improves quality of crop Makes plant more efficient with water Helps for stay green and dry down Plants take up
Reading and Analyzing your Fertilizer Bag. Dr. Cari Peters Vice President
 Reading and Analyzing your Fertilizer Bag Dr. Cari Peters Vice President caripeters@jrpeters.com Designer, Formulator, Producer and custom manufacturer of high quality fertilizer products. Hand s on Horticulture
Soil Testing and Interpretation
 Introduction Soil testing, interpretation of the test results, and incorporating prescriptive remedies to improve soils should be a fundamental part of any reclamation or revegetation project. Without
3.0 Supplying Nutrients to Crops
 3.0 Supplying Nutrients to Crops Plants need for healthy growth and development. Plant nutrition involves the absorption of nutrients for plant growth and is dependent on, often referred to as nutrients.
Limitations to Plant Analysis. John Peters & Carrie Laboski Department of Soil Science University of Wisconsin-Madison
 Limitations to Plant Analysis John Peters & Carrie Laboski Department of Soil Science University of Wisconsin-Madison What is an essential plant nutrient omission of the element will result in abnormal
The 1 th International and The 4 th National Congress on Recycling of Organic Waste in Agriculture April 2012 in Isfahan, Iran
 PERIODIC MUNICIPAL COMPOST AND SEWAGE SLUDGE APPLICATION ON ACCUMULATION OF HEAVY METALS IN SOIL AND PLANTS Ali R. Marjovvi 1,* and Moslehedin Rezaei 1 1 Soil and Water Department, Isfahan Agricultural
Trends in Soil Management for Turf. David C. Smith P.Ag DCS Agronomic Services
 Trends in Soil Management for Turf David C. Smith P.Ag DCS Agronomic Services Points for Today s Discussion Soil Testing Considerations Soil test interpretation How water moves in the soil Recommendations
DAFFODILS ARE WHAT THEY EAT: NUTRITIONAL ASPECTS OF SOILS
 DAFFODILS ARE WHAT THEY EAT: NUTRITIONAL ASPECTS OF SOILS Dick Wolkowski Extension Soil Scientist Department of Soil Science University of Wisconsin - Madison Basic concepts of soil fertility How plants
Example: Ammonium Sulphate (also called Sulphate of Ammonia) is composed of the following:
 is composed of the following:") Atoms are made up of smaller particles that are held together by electrical or magnetic forces. Each atom is, in effect, like a mini solar system with a cluster of particles called electrons orbiting it.
Atoms are made up of smaller particles that are held together by electrical or magnetic forces. Each atom is, in effect, like a mini solar system with a cluster of particles called electrons orbiting it.
Specialists In Soil Fertility, Plant Nutrition and Irrigation Water Quality Management.
 Specialists In Soil Fertility, Plant Nutrition and Irrigation Water Quality Management. TOMATOES T PLANT NUTRITION & SAMPLING NOTES - 1 Noel Garcia, CCA he most important aspect of tomato production (field,
ADVANCING CORN YIELDS. Sulf-N Ammonium Sulfate
 ADVANCING CORN YIELDS Sulf-N Ammonium Sulfate Maximize Profit Opportunities in Corn Earlier planting High performing hybrids Reduced tillage Continuous cropping Advanced seed genetics AdvanSix Sulf-N ammonium
Greg Patterson C.C.A. President A&L Canada Laboratories
 Welcome Greg Patterson C.C.A. President A&L Canada Laboratories Compost Quality Consumer of the Future Population dynamics - more and more people involved in use of compost Better educated on what is expected
A & L GREAT LAKES LABORATORIES, INC.
 Report No. F10035-0027 59018 3505 Conestoga Drive Fort Wayne, Indiana 46808 260-483-4759 Fax 260-483-5274 Account No. Date Reported: 02/08/2010 SOIL TEST REPORT Page: 1 of 2 Cation Lab Organic Phosphorus
TNPSC Chemistry Study Material Fertilizers
 TNPSC Chemistry Study Material A fertilizer is any material of natural or synthetic origin (other than liming materials) that is applied to soils or to plant tissues to supply one or more plant nutrients
Enclosed are the tissue analysis results for the samples from the greens at Golf Club.
 Enclosed are the tissue analysis results for the samples from the greens at Golf Club. The results for nitrogen, phosphorus, potassium, calcium, magnesium, sulfur, and sodium are reported on a percent
Biosolids Nutrien Management an Soil Testing. Craig Cogger, Soil Scientis WSU Puyallup
 Biosolids Nutrien Management an Soil Testing Craig Cogger, Soil Scientis WSU Puyallup Nutrient Manageme Meet crop nutrient needs Maintain soil quality Conserve resources Protect water quality -- reduc
SOIL TEST INTERPRETATION JIM FASCHING Technical Field Representative
 SOIL TEST INTERPRETATION JIM FASCHING Technical Field Representative jfasching@midwestlabs.com 507 273-3339 TERMS ppm = parts per million 2 million pounds of soil represented by soil samples taken 6 inches
Sulphur Fertilizer Effect on Crop Development & Quality
 Sulphur Fertilizer Effect on Crop Development & Quality Sulphur Play a key role in: Chlorophyll (Photosynthesis) a key ingredient in the formation and sulphur deficient plants can be 40% lower in chlorophyll.
INTRODUCTION TO VISCOFOL. Revolutionary high viscosity foliar feeds
 INTRODUCTION TO VISCOFOL Revolutionary high viscosity foliar feeds Contents Page 1 Page 2 Pages 3-5 Page 6 Page 7 Pages 8 27 GCiC launches VISCOFOL Why choose VISCOFOL? VISCOFOL formulation technology
RELIABILITY OF SOIL AND PLANT ANALYSES FOR MAKING NUTRIENT RECOMMENDATIONS
 RELIABILITY OF SOIL AND PLANT ANALYSES FOR MAKING NUTRIENT RECOMMENDATIONS Robert. O. Miller Soil and Crop Sciences Dept. Colorado State University Fort Collins, CO 80523 Phone: 970-686-5702 Fax: 970-491-0564
Table 1. Plant Nutrients. Nutrients From Air & Water Primary Macronutrients
 WHITEPAPER THE GREAT DEBATE SYNTHETIC VS. ORGANIC PLANT NUTRIENTS RX GREEN Plant nutrients are inorganic elements such as zinc or magnesium that are absorbed by plant roots in order to fuel growth and
Markus Braaten. Elston D. Solberg. Director of Agri-Knowledge Agri-Trend. US Director of Agri-Knowledge Agri-Trend USA
 Water Drives Everything!! So Make Every Drop Count Elston D. Solberg Director of Agri-Knowledge Agri-Trend Markus Braaten US Director of Agri-Knowledge Agri-Trend USA Food, Fibre and Fuel Uptake (lbs/a)
Soil Conditions Favoring Micronutrient Deficiencies and Responses in 2001
 Soil Conditions Favoring Micronutrient Deficiencies and Responses in 2001 K.A. Kelling and P.E. Speth Department of Soil Science University of Wisconsin-Madison Why micronutrients now: Higher yield, therefore
Manual of Soil, Plant and Water Analysis
 Manual of Soil, Plant and Water Analysis Dr. Tahir Ali Associate Professor, Division of Soil Science, SKUAST-K, Shalimar Mr. Sumati Narayan Assistant Professor, Division of Olericulture, SKUAST-K, Shalimar
Corn and soybean yield responses to micronutrients fertilization
 2014 Integrated Crop Management Conference - Iowa State University 129 Corn and soybean yield respoes to micronutrients fertilization Antonio P. Mallarino, professor, Agronomy, Iowa State University; Joshua
FACT SHEET. Understanding Cation Exchange Capacity and % Base Saturation
 Understanding Cation Exchange Capacity and % Base Saturation FACT SHEET A & L CANADA LABORATORIES, INC. 2136 Jetstream Rd. London, ON N5V 3P5 Phone: 519-457-2575 Fax: 519-457-2664 Aginfo@alcanada.com www.alcanada.com
Soil 4234 Guest Lecture
 Soil 4234 Guest Lecture Soil Fertility in Potted Horticulture Crops Dr. Bruce Dunn Determine Water Quality Prior to selecting a site for a new business and periodically thereafter, test water Seasonally
USE OF OCEANGROWN PRODUCTS TO INCREASE CROP YIELD AND ESSENTIAL NUTRIENT CONTENT. Dave Franzen, North Dakota State University, Fargo, ND
 USE OF OCEANGROWN PRODUCTS TO INCREASE CROP YIELD AND ESSENTIAL NUTRIENT CONTENT Dave Franzen, North Dakota State University, Fargo, ND Introduction OceanGrown (OG) products (Toronto, Ontario, Canada)
Importance of Water Quality: ph, buffering, and effects on nutrient availability
 Importance of Water Quality: ph, buffering, and effects on nutrient availability Andrew G. Ristvey The University of Maryland Extension programs are open to any person and will not discriminate against
AVAILABLE Cd CONTENT OF SALT AFFECTED AND NORMAL SOILS OF HALASTRA KALOHORI AREA
 Global NEST Journal, Vol 9, No 3, pp 195-200, 2007 Copyright 2007 Global NEST Printed in Greece. All rights reserved AVAILABLE Cd CONTENT OF SALT AFFECTED AND NORMAL SOILS OF HALASTRA KALOHORI AREA TH.
Figure 1. Location of 43 benchmark sites across Alberta.
 1.0 INTRODUCTION This report describes the micronutrient and trace element status of the AESA (Alberta Environmentally Sustainable Agriculture) Soil Quality Benchmark Sites. Previous reports completed
INTRODUCTION TO GCiC
 INTRODUCTION TO GCiC Contents Who are GCiC? Product Range Approach, features and benefits Who are GCiC? Incorporated on 26 March 2014. GCiC invests in: product research novel formulations registration
By Andrew & Erin Oxford, Bethel
 Chemistry in Plant Nutrition & Growth Objectives Review elements of chemistry and apply them to plant nutrition and growth in an agricultural context. Suggested grade levels 9-12 Alaska Content Standards
INTERPRETING SOIL & LEAF ANALYSIS
 INTERPRETING SOIL & LEAF ANALYSIS Nutrient use in Tree Fruit 94% of plant dry weight is carbohydrates (C, H, O) Primary sugars are sorbitol, fructose, sucrose and starch 6% is minerals 2 Essential Elements
Sulf-N Ammonium Sulfate PRODUCT GUIDE
 Sulf-N Ammonium Sulfate PRODUT GUIDE AdvanSix Sulf-N Ammonium Sulfate -0-0-S hemical ontent % Nitrogen (N) Sulfur (S) Free Acitidy (H SO ) Moisture min. min. 0. max..0 max. hemical Formula (NH ) SO Molecular
Soybean Soil Fertility
 Soybean Soil Fertility Dave Franzen, Extension Soil Science Specialist Soybean has a need, as do most crops, for the 14 mineral nutrients: nitrogen (N), phosphorus (P), potassium (K), sulfur (S), calcium
Nutrients. Carbon, Hydrogen, and Oxygen 1/18/2012. Soils, Nutrients and Fertilizers Part I I. 17 elements essential for plant growth
 Soils, Nutrients and Fertilizers Part I I Handouts: Home Garden Soil Testing and Fertilizer Guidelines MontGuide Nutrients 17 elements essential for plant growth Oxygen Carbon Hydrogen Nitrogen Phosphorus
Common Salt Ions. Salinity. Soil permeability reflects sodicity problems from sodium concentrations 1/15/2008
 Salinity Water Deficits Ion Toxicities SALT - RELATED PRBLEMS Ion Imbalances Soil Permeability Water deficits reflect salinity problems from salt concentrations Salinity -A measure of the salt concentration
REMEMBER as we go through this exercise: Science is the art of making simple things complicated!
 REMEMBER as we go through this exercise: Science is the art of making simple things complicated! Fertilization of Hops Ron Godin, Ph.D., Colorado State University Extension Fertilization of Hops - Care
FROM SOIL ELEMENTS TO FOOD NUTRIENTS: Joyce Kinabo Dept. of Food Science and Technology, Sokoine University, Tanzania
 FROM SOIL ELEMENTS TO FOOD NUTRIENTS: Joyce Kinabo Dept. of Food Science and Technology, Sokoine University, Tanzania All forms of life are directly dependent on plants for food Plant foods contain almost
Soil Nutrients and Fertilizers. Essential Standard Explain the role of nutrients and fertilizers.
 Soil Nutrients and Fertilizers Essential Standard 6.00- Explain the role of nutrients and fertilizers. Objective 6.01 Discuss macro and micro nutrients and the role they play in plant deficiencies. Macro
Foliar Micronutrients for Broad Acre Crops Higher yield and better quality Balanced trace element supply for healthy crops Insurance against
 B S Zn Mn Mo Foliar Micronutrients for Broad Acre Crops Higher yield and better quality Balanced trace element supply for healthy crops Insurance against deficiencies of micronutrients Crop adapted nutrient
Importance of fertigation scheduling
 Importance of fertigation scheduling Mr. C K Patel Sr. Manager Agronomy Ck.patel@netafim.com SBU-WEST-NETAFIM 9687696657 Proper fertigation scheduling can maximize the fertilizers use efficiency & Crop
IRON. AGRITOPIC August INTRODUCTION 2. IRON IN THE SOIL
 AGRITOPIC August 2015 IRON 1. INTRODUCTION Of all the elements plants derive from the soil, iron (Fe) is the most abundant. Yet, as far as plant nutrition is concerned, it is classified as a micronutrient,
NUTRIENT AND HEAVY METAL CONTENTS OF HOG MANURE - EFFECT ON SOIL QUALITY AND PRODUCTIVITY
 NUTRIENT AND HEAVY METAL CONTENTS OF HOG MANURE - EFFECT ON SOIL QUALITY AND PRODUCTIVITY G.J. Racz and M.M. Fitzgerald Professor and Research Associate, respectively, Department of Soil Science, University
Soil Prescription - Sample 1
 Soil Prescription - Sample 1 Hay Meadow In Eastern Kansas The following soil prescription was prepared for a five acre hay meadow in production for over three decades. The hay is sold to a livestock farmer
Essential Soil Nutrients for Plant Growth and Development
 Essential Soil Nutrients for Plant Growth and Development Essential nutrients required by plants Role of nutrients within the plant Symptoms of deficiencies/toxicities 2 The basic soil components are:
Overview. Managing Soil Fertility in Organic Systems. Fertilizer Analyses? Fertilizer Analyses? What Soil Amendments Can Be Used?
 Managing Soil Fertility in Organic Systems Overview Calculating fertilizer rates Match Soil Amendments to crop needs What can be used? Economics Forbes Walker, Environmental Soils Specialist, UT Extension
Care Chemicals & Formulators. Librel BMX. Technical Information. = Registered trademark of BASF group Multi-Micronutrient EDTA Chelate.
 Technical Information Librel BMX April 2010 08_100206e-00/Page 1 of 6 = Registered trademark of BASF group Multi-Micronutrient EDTA Chelate Care Chemicals & Formulators 08_100206e-00 April 2010 Page 2
INFLUENCE OF DAIRY MANURE APPLICATIONS ON CORN NUTRIENT UPTAKE
 INFLUENCE OF DAIRY MANURE APPLICATIONS ON CORN NUTRIENT UPTAKE A. Moore 1, S. Hines 1, B. Brown 1, M. de Haro Marti 1, C. Falen 1, M. Chahine 1, T. Fife 1, R. Norell 1, and J. Ippolito 2 1 University of
Agronomy 365 Exam I Spring 2002
 Agronomy 365 Exam I Spring 2002 Name Lab Please keep your answers brief and to the point. DO NOT try to fill in all the space given unless you need it to answer the question. Where applicable, show your