Baum, Charles L. and Ruhm, Christopher J. Age, Socioeconomic Status and Obesity Growth Journal of Health Economics, 2009
|
|
|
- Christina Webb
- 5 years ago
- Views:
Transcription
1 Age, socioeconomic status and obesity growth By: Charles L. Baum II, Christopher J. Ruhm Baum, Charles L. and Ruhm, Christopher J. Age, Socioeconomic Status and Obesity Growth Journal of Health Economics, 2009 Made available courtesy of Elsevier: *** Note: Figures may be missing from this format of the document Abstract: We use panel data from the National Longitudinal Survey of Youth (NLSY) to examine how body weight changes with age for a cohort moving through early adulthood, to investigate how the age-obesity gradient differs with socioeconomic status (SES) and to study channels for these SES disparities. Our results show first that weight increases with age and is inversely related to SES during childhood. Second, the obesity gradient widens over the lifecycle, consistent with research on other health outcomes. Third, a substantial portion of the effect of early life conditions operates through race/ethnicity and the translation of advantaged family backgrounds during childhood into higher levels of subsequent education. By contrast, little of the SES gap appears to propagate through household composition, family income or health behaviors. Fourth, adult SES has independent effects after controlling for childhood status. Keywords: Obesity, Body weight, Age, Socioeconomic status Article: Although a positive relationship between socioeconomic status (SES) and health has been widely documented (Marmot et al., 1991; Smith, 2004), the sources of these disparities are not well under-stood. Medical researchers and epidemiologists tend to emphasize the causal effects of SES, whereas economists frequently focus on how health influences SES or on potential confounding factors (like discount rates or genetics). In an effort to identify the impact of SES, some analysts have recently focused on health disparities early in life and on the evolution of these gradients as age increases. A primary advantage is that health status is unlikely to significantly affect the SES of youths, since the latter is largely determined by the economic situation of the child s parents. These investigations suggest that SES-health gradients become more pronounced with age, through at least early adulthood. Socioeconomic status during childhood may also be of interest to the extent that it affects adult outcomes independently of any relationship it might have with SES later in life. 2 This analysis uses data from the National Longitudinal Survey of Youth (NLSY) to investigate how body weight and obesity change with age for a cohort moving through middle adulthood, SES differences in this ageobesity gradient, and channels for the SES disparities. The focus on weight is useful for several reasons. First, obesity is an important risk factor for premature death (Allison et al., 1999; Fontaine et al., 2003; Flegal et al., 2005) and health problems like diabetes, gallbladder disease, coronary heart disease, high cholesterol, hypertension and asthma (Must et al., 1999; Mokdad et al., 2001; McTigue et al., 2006). Excess weight reduces the quality of life, raises medical expenditures, stresses the health care system and decreases productivity (Quesenberry et al., 1998; Finkelstein et al., 2003; Andreyeva et al., 2004). Second, changes in weight are easily observable, whereas health indicators such as overall status or specific morbidities are likely to be measured with greater error or require interaction with the medical system for diagnosis. 3 Third, obesity represents a rapidly increasing health risk. Using conventional definitions, 32% of years old were obese in , compared to just 14% in (Ruhm, 2007). Fourth, obesity generally develops over a lengthy period since body weight is a stock resulting from flows of caloric intake and expenditures and so may reflect an accumulation of the effects of SES. Consistent with this, excess weight during childhood and particularly late adolescence is a strong predictor of adult obesity (Whitaker et al., 1997; Guo et al., 2002; McTigue et al., 2002).
2 Our results show first that weight increases with age and is inversely related to SES. Second, the obesity gradient widens over the lifecycle, consistent with research on other health outcomes. Third, a substantial portion of the effect of early life conditions operates through race/ethnicity and the translation of advantaged family backgrounds during childhood into higher levels of subsequent education. By contrast, little of the SES gap appears to propagate through household composition, family income or the health behaviors accounted for. Fourth, adult SES has independent effects, after controlling for childhood status. Previous research has used cross-sectional data to document an inverse association between current SES and weight that strengthens through at least middle-age. However, since such data provide only contemporaneous information, it is not possible to study how socioeconomic status earlier in life is related to adult obesity. Conversely, the longitudinal data and rich information on family background characteristics in the NLSY permit us to investigate whether adult body weight is independently affected by current and previous SES and the extent to which economic conditions early in life operate through the stickiness of SES over time. 1. Socioeconomic status and obesity Adult body weight and obesity are negatively related to social and economic advantage for most groups. For instance, using self reported data, 26% of high school dropouts were obese in 2000 versus 22% of high school graduates and 15% of college graduates (Mokdad et al., 2001). Similarly, 23 (14)% of white women (men) with family incomes greater than 400% of the poverty line were obese in compared to 40 (34)% of their poor counterparts, although this distinction is not always present for nonwhites and may have weakened over time (Chang and Lauderdale, 2005). Using clinical measures of height and weight (which result in higher prevalence estimates), 31% of non-hispanic whites aged 20 and older were obese in , versus 37% of Hispanics and 45% of non-hispanic blacks (Ogden et al., 2006). These patterns are consistent with high SES adults being healthier than their less advantaged peers. Pathways, however, are difficult to identify. SES certainly may have causal effects on body weight. For example, Drewnowski and Specter (2004) attribute some of the high obesity rates of disadvantaged groups to the relatively low cost of energy-dense foods; similarly, the weathering hypothesis (Geronimus et al., 2006) emphasizes the cumulative impact of social or economic adversity and political marginalization. On the other hand, economists show that obese women receive a wage penalty (Averett and Korenman, 1996; Baum and Ford, 2004; Cawley, 2004), suggesting that excess weight reduces income-based measures of SES. Finally, unobserved factors could determine both SES and body weight. For instance, high discount rates may simultaneously reduce educational investments and the willingness to forgo current caloric intake for the future benefit of lower weight (Fuchs, 2004; Smith et al., 2005; Borghans and Golsteyn, 2006). In addition, selfcontrol problems could be more common among low SES individuals (Cutler et al., 2003). Some investigators have focused on SES-health gradients among youths as a promising method of identifying the causal effects of life circumstances. Examining youths has two advantages. First, it seems unlikely that health could significantly affect child SES, since the latter is largely determined by the education and economic situation of the parents. 4 Second, omitted factors transmitted across generations (such as genetics) could play a role, but other potential confounders (like discount rates) would not be expected to affect SES until later in life. Of particular relevance is research by Case et al. (2002) indicating that the SES-health gradient rotates (steepens) between infancy and late adolescence. In subsequent work, Case et al. (2005) show that poor health during childhood is associated with reduced educational attainment, lower social status and more health problems in adulthood, suggesting that health is an important mechanism through which economic status is transmitted. 5 We do not fully understand why the SES gradient rotates. Janet Currie and co-authors indicate that it is primarily because disadvantaged individuals are subjected to a greater number of deleterious health events rather than being more adversely affected by given shocks (Currie and Hyson, 1999; Currie and Stabile, 2003). Case et al. (2002) suggest that health behaviors may play an important role. Body weight and obesity are useful outcomes for understanding age-related changes in SES-health disparities, but they have not been directly examined in this context.
3 A vast literature investigates how adult socioeconomic status is related to obesity (Sobal and Stunkard, 1989; McLaren, 2007) but most analyses use cross-sectional data and so are unable to distinguish between age and period effects or identify the potentially distinct effects of contemporaneous and childhood SES; they also cannot account for differential selection due to the higher mortality rates of obese individuals. 6 There is evidence of a weaker relationship between SES and body weight for children than adults (Parsons et al.,1999), suggesting that age-related weight gains may be larger for disadvantaged individuals. However, the sources and timing of these differences remain poorly understood. McTigue et al. (2002) did use NLSY data for 1981 through 1998 the same source we use but for a shorter period to investigate race/ethnicity differences in the evolution of body weight. However, their study did not explicitly examine the role of SES, contained an extremely restricted set of controls and had other limitations that our research attempts to rectify The production of body weight The body weight (W) of individual i increases between periods t and t 1 if energy intake (N) exceeds energy expenditure. Dividing the latter into basal metabolism (B) and calories consumed during physical activity (P), this can be expressed as 8 W it = W it W it 1 = N it B it P it. (1) Basal metabolism depends on body weight and individual specific components (e.g. genetics) according to B it = a i + bw it, (2 ) where b is positive because increased weight raises the amount of energy required to sustain bodily functions. For simplicity, we assume that a is time-invariant. Substituting Eqs. (2) into (1) and using subscripts to indicate partial derivatives: W it = N it a i bw it P it = f(n it, a i, P it ), (3) where f N > 0 and f a, f P < 0. Equation (3) shows that, ceteris paribus, individuals are more likely to gain weight if they have a high energy intake and low basal metabolism or physical activity. 9 An individual s weight is in steady-state if Wit = Wit 1. This occurs when: N it a i P it W * i = = g(n it, a i, P it ) (4) where g N > 0 and g a, g P < 0.Steady-state weight is therefore determined by the same factors (N, a, and P) operating in the same direction as weight gain. Equations (3) and (4) highlight possible pathways for an inverse relationship between weight and SES. Specifically, disadvantaged individuals will weigh more than their counterparts if they consume a greater number of calories, are less active, or have lower baseline metabolisms. Assuming their weight has not reached a steady-state, these same conditions are likely to lead to a faster rate of weight gain, implying rotation of the SES gradient with age. This framework is useful for considering how adult weight is related to both early life conditions and current socioeconomic status. For instance, low childhood SES may raise weight by influencing patterns of energy intake and expenditure later in life, independent of adult status (e.g. if eating habits are determined at a young age). Analyses of cross-sectional data containing information on current but not previous status would then miss
4 important sources of SES-related disparities. On the other hand, early life conditions might transmit to adult weight entirely because advantaged children become high SES adults.10 Childhood and contemporary socioeconomic status might also have effects that are partially independent or reinforcing. 11 These possibilities can be empirically tested using the NLSY (but not cross-sectional data) by estimating equations that simultaneously control for socioeconomic status during adolescence and adulthood. A significant coefficient on childhood but not contemporaneous status then suggests that only the former are determinative. The reverse pattern implies either that early conditions are not important or that they operate entirely by affecting adult status. 12 Significant coefficients for both SES variables suggest effects that are at least partially independent. A final possibility is that the observed SES gradients are spurious, occurring, for example, because disadvantaged individuals happen to have genetic characteristics leading to low basal metabolisms. Although we are not able to fully investigate this scenario, such biological causes probably imply a similar evolution of SES age gradients across race/ethnicity groups since there is no reason to think that the sources of confounding differ by race/ethnicity. Conversely, large differences cast doubt upon such explanations. 3. Data Data are from the 1979 cohort of the NLSY, which initially included 12, years old, with oversamples of blacks, His-panics, low-income whites and military personnel. Annual surveys were conducted through 1994, with biennial interviews thereafter. The military sample was dropped in 1984 and the low-income white sample in 1990; therefore we exclude both from our analysis. We also omit females pregnant at the interview date or who have given birth in the last year. 13 Most of our analysis is performed separately for men and women, and we sometimes stratify the sample by race/ethnicity. The NLSY collects data on individual and family characteristics at each interview, with additional retrospective information available from the baseline (1979) survey. Questions about body weight were included in 1981,1982,1985,1986,1988,1989,1990, 1992, 1993, 1994, 1996, 1998, 2000, 2002 and 2004; those on height were incorporated in 1981,1982 and 1985 (Centerfor Human Resource Research, 2004). 14 Our analysis assumes that height does not change after 1985, since all NLSY respondents were at least 20 years old at that time. Body Mass Index (BMI) defined as weight in kilograms divided by height in meters squared is less accurate than laboratory measures of body composition because it does not account for variations in muscle mass or in the distribution of body fat. It, nevertheless, is a favored method of assessing excess weight because it is simple, rapid, and inexpensive to calculate. 15 Our analysis focuses on BMI, obesity and, for some descriptive analysis, class 3 obesity. Adults are obese if their BMI is 30 and class 3 obese if it is 40 (World Health Organization, 1997; National Heart, Lung, and Blood Institute, 1998). A more complicated criterion is used for persons under 21 years of age, based on gender and age-specific growth charts compiled by the Center for Disease Control and Prevention (Kuczmarski et al., 2000). 16 We use the adult obesity standard for all respondents, including those under 21 years of age, to provide consistency across individuals and over time. Preliminary analysis confirmed that our results were robust to the use of the CDC classification of overweight for respondents under 21. Self-reported data on height and weight contain errors: height tends to be over-reported and weight to be understated (Strauss, 1999; Goodman et al., 2000; Kuczmarski et al., 2001). A number of regression-based correction procedures have been proposed (Bolton-Smith et al., 2000; Spencer et al., 2002; Plankey et al., 1997). In the economics literature, researchers (Cawley, 2004; Chou et al., 2004; Ruhm, 2005) have regressed clinical measures of weight (height) on a quadratic of the corresponding self-reported variable using National Health and Nutrition Examination Survey (NHANES) data and then used the resulting regression estimates to predict actual weight (height) as a function of the self-reported values in a target data set (such as the NLSY) containing only the latter. 17 We found that our results were not substantively altered by using this procedure. Therefore, most findings below are based on the self-reported data.
5 To maintain a consistent sample across survey years, our main estimates eliminate persons failing to provide valid body weight information for any of the 15 interviews in which it was collected.18 We examined the implication of these deletions by comparing average BMI for our main analysis sample with an unbalanced sample that included respondents with missing BMI information in one or more year. Despite substantial differences in sample size, average BMI was similar across the two samples for each year, although always slightly higher in the unbalanced sample.19 We also replicated some of our analysis using a less restricted sample that included individuals providing valid body weight information in 2004 (the last interview year), even if corresponding data were missing in some earlier survey waves. Results from these estimates were qualitatively similar to those using the balanced sample. Our primary proxy for childhood SES is the highest grade completed by the respondent s mother, measured at the 1979 interview. We focus on maternal education because previous research suggests it is more directly related to child health than the schooling of fathers (Currie et al., 2007), for whom education data are also more often missing, and because mothers may be more instrumental in establishing the eating habits and health behaviors of children. The descriptive analysis divides the sample into low medium and high SES groups, defined by <12, 12, or >12 years of maternal schooling; 29, 49 and 22% of the NLSY cohort fall into these categories. Previous research (Zhang and Wang, 2004; Classen and Hokayem, 2005) finds substantial health gradients when proxying SES with schooling, suggesting that our education-based measure is informative. As alternatives, we experimented with indicators based on: (i) the presence or absence of the father in the household when the respondent was 14; (ii) highest grade completed by the respondent s mother or father; (iii) highest Duncan Socioeconomic Index occupation score of the respondent s mother or father for the longest job held in 1978; and (iv) respondent scores on the Armed Forces Qualification Test (AFQT), an indicator of cognitive skill measured in The NLSY does not collect data on permanent income during the respondent s childhood, which otherwise would be a logical alternative SES measure. Some specifications include controls for adult socioeconomic status, proxied by the respondent s highest grade completed, total family income, or both. When examining SES transmission mechanisms, we also control for race/ethnicity, marital status, number of biological children and health behaviors. Family income refers to all sources during the previous calendar year and is expressed in year-2004 dollars. Marital status takes the value of one if the respondent was married at the survey date and zero if he or she was separated, divorced, widowed or never married. We use two strategies to avoid losing observations due to missing values of variables other than BMI. First, we replace missing data with averages for adjacent survey years. For instance, if family income is missing in 1985, we use average income in 1984 and Second, we set values still missing (after using the first procedure) to zero and include a dummy variable denoting that the information is missing. Our controls for health behaviors are limited, both with regard to the information available and the years in which it was collected. For instance, we have data on alcohol consumption, cigarette smoking, exercise, and job-related physical demands but none on diet or caloric intake. Our strategy for alcohol and cigarette consumption is to use information from the most recent previous survey in which the relevant questions were asked or from the first survey in which it was collected, when this occurred subsequent to the relevant interview date. Using drinking questions included in 1983, 1984, 1988,1989,1994 and 2002, we constructed dummy variables indicating binge consumption ( 6 drinks in a single session) and heavy drinking (consumption of >60 alcoholic beverages during the previous month). Information on smoking, available in 1984, 1992, 1994 and 1998, was used to create three dummy variables. The first indicates whether the respondent has smoked 100 or more cigarettes during his or her lifetime. The second and third denote current and heavy smoking, with the latter defined as consumption of 20 or more cigarettes per day.

6 Data on the frequency and duration of light/moderate and vigorous physical activity and the frequency of strengthening exercises was provided in 2002 and Four variables were created using averages over these 2 years. 21 Individuals are physically inactive if they engaged in less than 1 h of exercise per week, moderately active if they exercised 1 2 h weekly, physically active if exercising at least 2 h per week but less than 2 h vigorously, and vigorous exercisers if they engaged in more than 2 h per week of vigorous physical activity. An additional activity variable indicates participation in strengthening exercises at least once per week. Following Lakdawalla and Philipson (2007), we also constructed a measure of the number of fitness activities (climbing, reaching, stooping, kneeling, crouching and crawling) required by the individual s occupation and an ordinal strength ranking ranging from one for sedentary occupations to five for those with very heavy strength demands. 22 These behaviors are included to capture the effects of a broad range of lifestyle factors, but we do not apply a causal interpretation to their estimated coefficients. 23 Table 1 presents descriptive statistics for BMI, obesity and many variables used in our analysis. Sample means are generally similar for men and women, although males are heavier, have higher incomes, greater rates of obesity and fewer children. Men also have more physically demanding jobs and lifestyles that are healthier in some ways (like exercising more) but less so in others (more binge or heavy drinking and heavy smoking). The SES differences are more pronounced. Compared to less advantaged individuals, respondents with highly educated mothers are lighter, less often obese, more educated, have higher incomes, smoke less and are more physically active. Differences between medium and low SES individuals generally follow the same patterns, except that the middle group has relatively high rates of binge and heavy drinking.

7 4. Age-related changes in body weight Fig. 1 and Table 2 provide descriptive evidence of the growth in body weight occurring over time for the NLSY cohort. Unless otherwise noted, all results below incorporate sampling weights to provide nationally representative estimates. Standard errors, shown in parentheses, are corrected for complex survey design.24 Kernel density estimates demonstrate that much of the growth in self-reported BMI occurred in the right-tail of the distribution (Fig. 1). This is consistent with evidence obtained using clinical data (Ruhm, 2007) and resulted in faster increases in obesity or severe obesity than in average body weight. Thus, mean self-reported BMI of NLSY respondents rose 23% (from 22.3 to 27.4 kg/m2) between 1981 and 2004, obesity prevalence increased almost 8-fold (from 3.0 to 26.5%), and class 3 obesity increased by even more (from <0.1 to 2.5%). 25 Average BMI and obesity (but not class 3 obesity) prevalence is higher for men than women, which initially seems surprising since clinical measures from NHANES show the opposite pattern (Flegal et al., 2002; Ogden et al., 2006). We suspect that three factors explain this result, which has also been obtained in previous analyses of the NLSY (e.g. Cawley, 2004). First, self-reported BMI understates true values by larger amounts for women. Second, since clinical data indicate that females are less often overweight but more frequently obese, an equal BMI underestimate for both sexes could cause more obese women to be classified as overweight based on self-reported data. 26 These are not major issues if the reporting errors are similar across time periods and SES groups, but may be more problematic if this is not the case. Third, heavier women are disproportionately likely to have missing weight information in some survey years (and so to be excluded from our balanced sample), whereas this selection is weaker for men. 27 The last three rows of Table 2 show how the results differ with childhood SES, proxied by maternal education. BMI, obesity and class-3 obesity are more common and increase faster over time for the disadvantaged: average BMI rose 5.4kg/m 2 and obesity prevalence by 29.2 percentage points between 1981 and 2004 for the lowest
8 SES group, compared with 5.1 kg/m 2 and 22.2 points for the middle category and 4.5 kg/m 2 and 18.7 points for the most advantaged. 28 Since body weight trended upward throughout the NLSY sample period, the preceding results combine the impacts of aging and secular changes. The following procedure was employed to isolate the effects of aging. NHANES data were first used to calculate growth in the average BMI of years old occurring between and This was converted to an annualized increase using a linear trend and adjustments to eliminate these effects were made to the BMI of each NLSY respondent. 29 Finally, adjusted BMI values were used to calculate mean BMI and obesity prevalence. These corrections were implemented separately for males and females when examining gender-specific findings. 30 BMI and obesity prevalence grew rapidly with age. As shown in Fig. 2, average BMI rose from 21.6 to 26.9 kg/m 2 between the ages of 18 and 40, while obesity prevalence increased from 1.0 to 23.2%. Over two-fifths of BMI growth was due to secular trends rather than aging, so that adjusted BMI rose from 24.3 to 27.3 kg/m 2 (see the on-line appendix for details). This correction had less effect on obesity adjusted prevalence was 3.5% at age 18 and 24.9% for 40 years old because the procedure did not change the status of individuals with BMI substantially above or below the threshold. Fig. 3 displays age-related changes in body weight for gender and maternal education subgroups, all adjusted for secular trends in average BMI. BMI and obesity rise with age for all subsamples. The age-related increase in BMI is somewhat faster for men than women while growth in obesity prevalence is similar. Generally, the evolution of body weight does not vary sharply with gender over the ages studied. Not only do high SES individuals have lower BMI and obesity prevalence but the gradient steepens with age. 31 SES differences are
9 more pronounced for obesity than BMI, reflecting the importance of differences in the right tail of the distribution. Finally, although the age profiles show weak evidence of concavity, a linear approximation is reasonable for NLSY-aged respondents. 5. Empirical methods We next use regression analysis to explore the association between age, SES and body weight. Our basic specification is Y it = α 0 + α 1 X it + α 2 AGE it + α 3 SES i + ε it, (5) where Y it indicates BMI or obesity for individual i at time t, X is a vector of control variables, AGE is the respondent s age at the survey date, SES is socioeconomic status during childhood, and ε is the error term. The supplementary covariates included vary by model specification. All equations contain survey year dummy variables and, in the full sample estimates, control for gender. We do not initially include regressors for race/ethnicity, respondent education, family income, household composition, or health behaviors because they represent mechanisms through which early life conditions may be transmitted. However, we add them to subsequent models when attempting to understand how childhood SES operates. We also sometimes stratify the sample by sex and race/ethnicity. The assumption that the SES gradients are age-invariant can be relaxed by estimating: BMI it = α 0 + α 1 X it + α 2 AGE it + α 3 SES i + α 4 AGE it SES i + ε it (6) where AGE SES is the interaction between SES and age. We also examine whether socioeconomic status early and later in life have independent effects from: BMI it = α 0 + α 1 X it + α 2 AGE it + α 3 SES i + α 4 ADULT SES + ε it, (7) where ADULT-SES refers to socioeconomic status at the survey date.
10 For ease of interpretation, we generally express age and SES as deviations from the sample averages, so that ˆα 2, ˆα 3 and ˆα 4 indicate marginal effects evaluated at the means of respective variables. Sample weights are incorporated to provide nationally representative estimates and the standard errors account for complex survey design. We use linear probability (LP) models when obesity is the dependent variable. Preliminary analysis revealed similar predicted effects with logit or probit specifications, but the LP coefficients are easier to interpret, especially when including the AGE SES interactions (Ai and Norton, 2003). 6. Age and SES profiles Initially, we examine age and SES gradients for BMI and obesity with additional covariates limited to gender and the survey year. These results are summarized in Table 3. For each specification, column (b) includes an interaction between age and maternal education, whereas column (a) does not. The first model controls for low and high childhood SES, with the middle category (12 years of maternal education) constituting the reference group. These correspond to the categories used in the descriptive analysis above. We do not examine contemporaneous socioeconomic status until Section 8 and, for ease of notation, refer to childhood status simply as SES in this and the next section. BMI is predicted to increase by 0.12 kg/m 2 and obesity prevalence by 0.60 percentage points per year of age (see column 1 a). Low SES individuals are anticipated to have a BMI 0.74 (1.39) kg/m 2 above that of their medium (high) SES peers and a 4.3 (8.4) percentage point greater obesity prevalence. These differences are all statistically significant. The SES disparities widen with age. The BMI gap between low and high SES individuals is predicted to rise by kg/m 2 per year of age (0.80 kg/m 2 over 20 years) and the obesity disparity by 0.41 percentage points per year (8.2 points over 20 years). These magnitudes are reasonably consistent with those in the descriptive analysis, where the BMI disparity between low and high SES sample members increased from 0.5 kg/m 2 for 20 years old to 1.3 kg/m 2 at age 40, and the obesity gap rose from 6.2 to 11.7 percentage points. (The on-line appendix provides further details.) The remainder of Table 3 specifies SES as a continuous variable measured by the mother s years of completed schooling. The basic model indicates that BMI (obesity) rises a statistically significant 0.12 kg/m 2 (0.6 percentage points) per year of age and falls 0.20 kg/m2 (1.2 points) for each additional grade completed by the mother (columns 2a and 2b). The age effects are identical to those in model (1 a) and the SES gradients accord closely with them. 32 Inclusion of an age SES interaction confirms that the gradient rotates: the predicted disparity rises kg/m 2 for BMI and 0.07 percent-age points for obesity per year of age (see column 2b). To place these in perspective, the BMI gap between respondents at the 10th and 90th percentiles of maternal education (9 and 16 years of schooling) is anticipated to grow 1.04 kg/m 2 between the ages of 20 and 40; the corresponding disparity in obesity prevalence increases 9.7 percentage points. The continuous SES classification uses all available information on the mother s education. However, the findings may be sensitive to outliers, particularly if the effects are nonlinear and because a substantial portion of the sample report that their mother received very little schooling. 33 To address this concern, columns (3a) and (3b) winsorize SES (Angrist and Kruegar, 1999) by setting the minimum (maximum) level of maternal education to 7 (16) years, corresponding to the 5th (95th) percentile. The resulting age profiles are essentially identical to those in models (2a) and (2b), while the SES gradients are 25 30% larger. This is not surprising, since winsorizing reduces the variance of SES, but it suggests that the previous results provide conservative predictions of the SES disparities. 34 It may be difficult to separate the effects of cohort aging and secular time trends at the top and bottom of the NLSY age range, since data at these ages are only obtained early or late in the sample period.35 This problem may be reduced by limiting the sample to years old, for whom observations are available in each survey year. These results, shown in columns (4a) and (4b), are fairly similar to those using the full age range: age

11 coefficients and age SES interactions are virtually identical for BMI and are somewhat larger for obesity, while the SES coefficients rise slightly.
 lacking information on maternal education, with mother s education coded to zero and a missing education dummy variable added.")
12 We conducted other tests of robustness. First, we included the 3828 person-year observations (5.4% of the sample) lacking information on maternal education, with mother s education coded to zero and a missing education dummy variable added. None of the coefficient estimates were substantially affected, with the largest change being a 5% reduction for age in the obesity equation. Next, we allowed nonlinear age effects by controlling for age squared and its interaction with SES. The BMI models provided modest evidence of concavity, while the quadratic terms were small and insignificant for obesity. A third set of models removed secular changes in body weight from individual values using the adjustment procedures described in Section 4. The BMI estimates were identical to those previously reported and the obesity predictions were similar, although with somewhat stronger age and SES disparities and less rotation of the gradient. Fourth, we corrected BMI and obesity for self-reported errors using the methods discussed in Section 3. Coefficients on SES and its interaction with age were essentially unaffected, while the age parameters increased 10 17%. Fifth, we expanded the sample to include all persons with valid weight information in 2004, even if values were missing for some preceding years. This led to slightly (3 8%) larger age effects, no change in the average SES disparity, and marginally attenuated (3 7%) coefficient estimates on the age SES interaction. Sixth, we used the following alternative SES proxies: presence of the father in the household at age 14, highest grade completed by the mother or father, highest Duncan occupation score of the mother or father, and respondent AFQT score in These yielded results consistent with those obtained using maternal education. Finally, we estimated models where the dependent variable was the change in BMI or obesity status occurring between 1981 and Such long-difference specifications automatically control for time-invariant factors that influence body weight and are confounded with SES. We expected the age coefficients to be negative, since age changes by the same amount for all sample members and weight rises relatively rapidly in early adulthood, implying larger growth for younger respondents. We also anticipated relatively large weight increases for the disadvantaged, assuming that the SES gradient rotates with age. These expectations were confirmed. Each additional year of age (in 1981) reduced predicted BMI growth by kg/m 2 ; an additional year of maternal education did so by kg/m 2. This latter prediction is 24% smaller than the corresponding estimate in column (2a) of Table 3, suggesting that time-invariant confounding factors account for up to onequarter of the cross-sectional SES gradient Subgroups Table 4 relaxes the assumption that males and females have the same age and SES gradients by providing separate gender-specific estimates. Throughout the remaining analysis, our preferred specifications correspond to variants of columns (2a) and (2b) of Table 3. The average age effect is similar for males and females but SES disparities are considerably larger for women the coefficient on maternal education is over twice as big for females for BMI and 50% greater for obesity. The interaction coefficients also indicate greater rotation of the SES gradient for women. 37 Table 5 displays predicted BMI and obesity prevalence for individuals at 20 and 40 years of age and 9 and 16 years of maternal education. As noted, BMI and obesity prevalence increase with age for all groups and decline


13 with SES, while the SES-gradient widens with age. These disparities are particularly pronounced for obesity. For instance, while the predicted obesity rate of those whose mothers had 9 years of schooling almost triples between the ages of 20 and 40 (rising from 9.0 to 24.7%), expected prevalence for their counterparts whose mothers had 16 years of education is two-thirds as large at age 20 (6.0%) but less than half as great by 40 years of age (12.1%). Table 5 also shows that the SES gradient rotates more for women than men. A 20 years old female whose mother had 9 years of education is 25% less likely to be obese than a corresponding male (7.7% versus 10.2%) but has essentially identical predicted prevalence at age 40 (24.3% versus 24.7%). Conversely, a 40 years old woman whose mother had 16 years of schooling is less than three-fifths as likely to be obese as her male peer (8.6% versus 15.1%). Table 6 summarizes results from subsamples stratified by race/ethnicity and reveals additional differences. 38 First, SES gaps are generally larger for whites than minorities, with little evidence of an SES gradient for black males. This last result is consistent with previous research (e.g. Chang and Lauderdale, 2005), and disparate results will be obtained for African-American men throughout the remaining analysis. Second, age-related weight increases are larger for black than white males and nonexistent for Hispanic men, but with smaller differences for women. Third, the SES gradient rotates more for whites than nonwhites, although not always by statistically significant amounts. A full understanding of these sex and race/ethnicity disparities is beyond the scope of this analysis. However, it seems unlikely that the age-related rotation of the SES gradients is purely biological in nature since, in this case, we would expect the gradients to be similar across race/ethnicity groups SES transmission processes This section investigates potential mechanisms for our findings that individuals growing up disadvantaged weigh more at given ages and that the gradient rotates. We begin by emphasizing several caveats. First, the observed linkages are not necessarily causal. For instance, we will not be able to determine whether race/ethnicity disparities result from genetic differences (although we touched on this above), measurement
14 error in other covariates or omitted characteristics. Similarly, differences in schooling could be correlated with discount rates that are an underlying causal determinant of adult weight. Second, our regressors are often limited. In particular, data on leisure-time physical activity are available only late in the sample period and may be measured with significant error, and the NLSY lacks information on energy intake, an important determinant of body weight. 40 Third, the mechanisms for any observed correlations may be difficult to ascertain. For example, even if the higher education levels obtained by advantaged children cause lower rates of subsequent obesity, we will not know whether this reflects differences in lifestyles, access to health information, or schooling-induced changes in preferences Child and adult socioeconomic status Our evidence that socioeconomic status at young ages is related to adult obesity is consistent with a large body of research showing lasting health effects of early life conditions. There are three reasons why this might occur. Adult weight could be affected only by contemporaneous status but with SES itself being highly correlated over time. In this case, childhood SES matters because advantaged youths become advantaged adults. Alternatively, early life conditions might affect adult weight, whereas contemporaneous status does not. Finally, child and adult SES might have independent effects. These possibilities are examined in Table 7, which provides results for models that control for previous and current SES as measured by maternal education and the respondent s highest grade completed. 41 We also briefly discuss (but do not display) findings using family income to proxy current SES. The results suggest that early life conditions are important, partly because they are correlated with subsequent status, but that child and contemporaneous SES also have distinct effects. When maternal and respondent education are separately controlled for, an extra year of maternal education reduces estimated BMI by a statistically significant kg/m 2 and obesity by 1.20 percentage points (model 1), while the decreases associated with an extra year of the respondent s education are kg/m 2 and 1.59 percentage points (column 2). Including both simultaneously (specification 3) attenuates the coefficient on child (adult) SES by (23 33)% but remains substantial: an extra year of maternal (respondent) education is predicted to lower adult BMI by (0.146)kg/m 2 and obesity by 0.76 (1.23) percentage points. 42 The findings are similar when stratifying by sex but with larger race/ethnicity differences. Maternal and respondent education are negatively related to weight outcomes for males and females, entered either separately or together, with stronger SES gradients for women than men. There is somewhat greater attenuation of the coefficient on maternal than respondent schooling for males when controlling for both simultaneously, whereas the reverse is true for females. Contemporaneous and childhood SES are negatively correlated with BMI and obesity for most race/ethnicity subgroups, but maternal education is only weakly correlated with the body weight of black males and respondent education is positively related to it (the on-line appendix provides further information). In models proxying contemporaneous SES by family income (in the previous calendar year), income was significantly negatively related to the weight outcomes when respondent education was not controlled for but much less so when it was: the full sample income coefficient was ( 1.67E 4) for BMI (obesity) without respondent education compared to ( 1.01E 4) with its addition. By contrast, the parameter estimate for respondent education was only slightly attenuated by controlling for income changing from to ( to ) for BMI (obesity) Additional propagation mechanisms This section examines the following additional mechanisms through which the effects of early life conditions might transmit to adult body weight: (1) some effects of childhood SES are linked to race-based disparities; (2) persons growing up in advantaged households have relatively high adult incomes; (3) SES is correlated with marriage and fertility rates; and (4) SES early in life is linked to subsequent health behaviors.

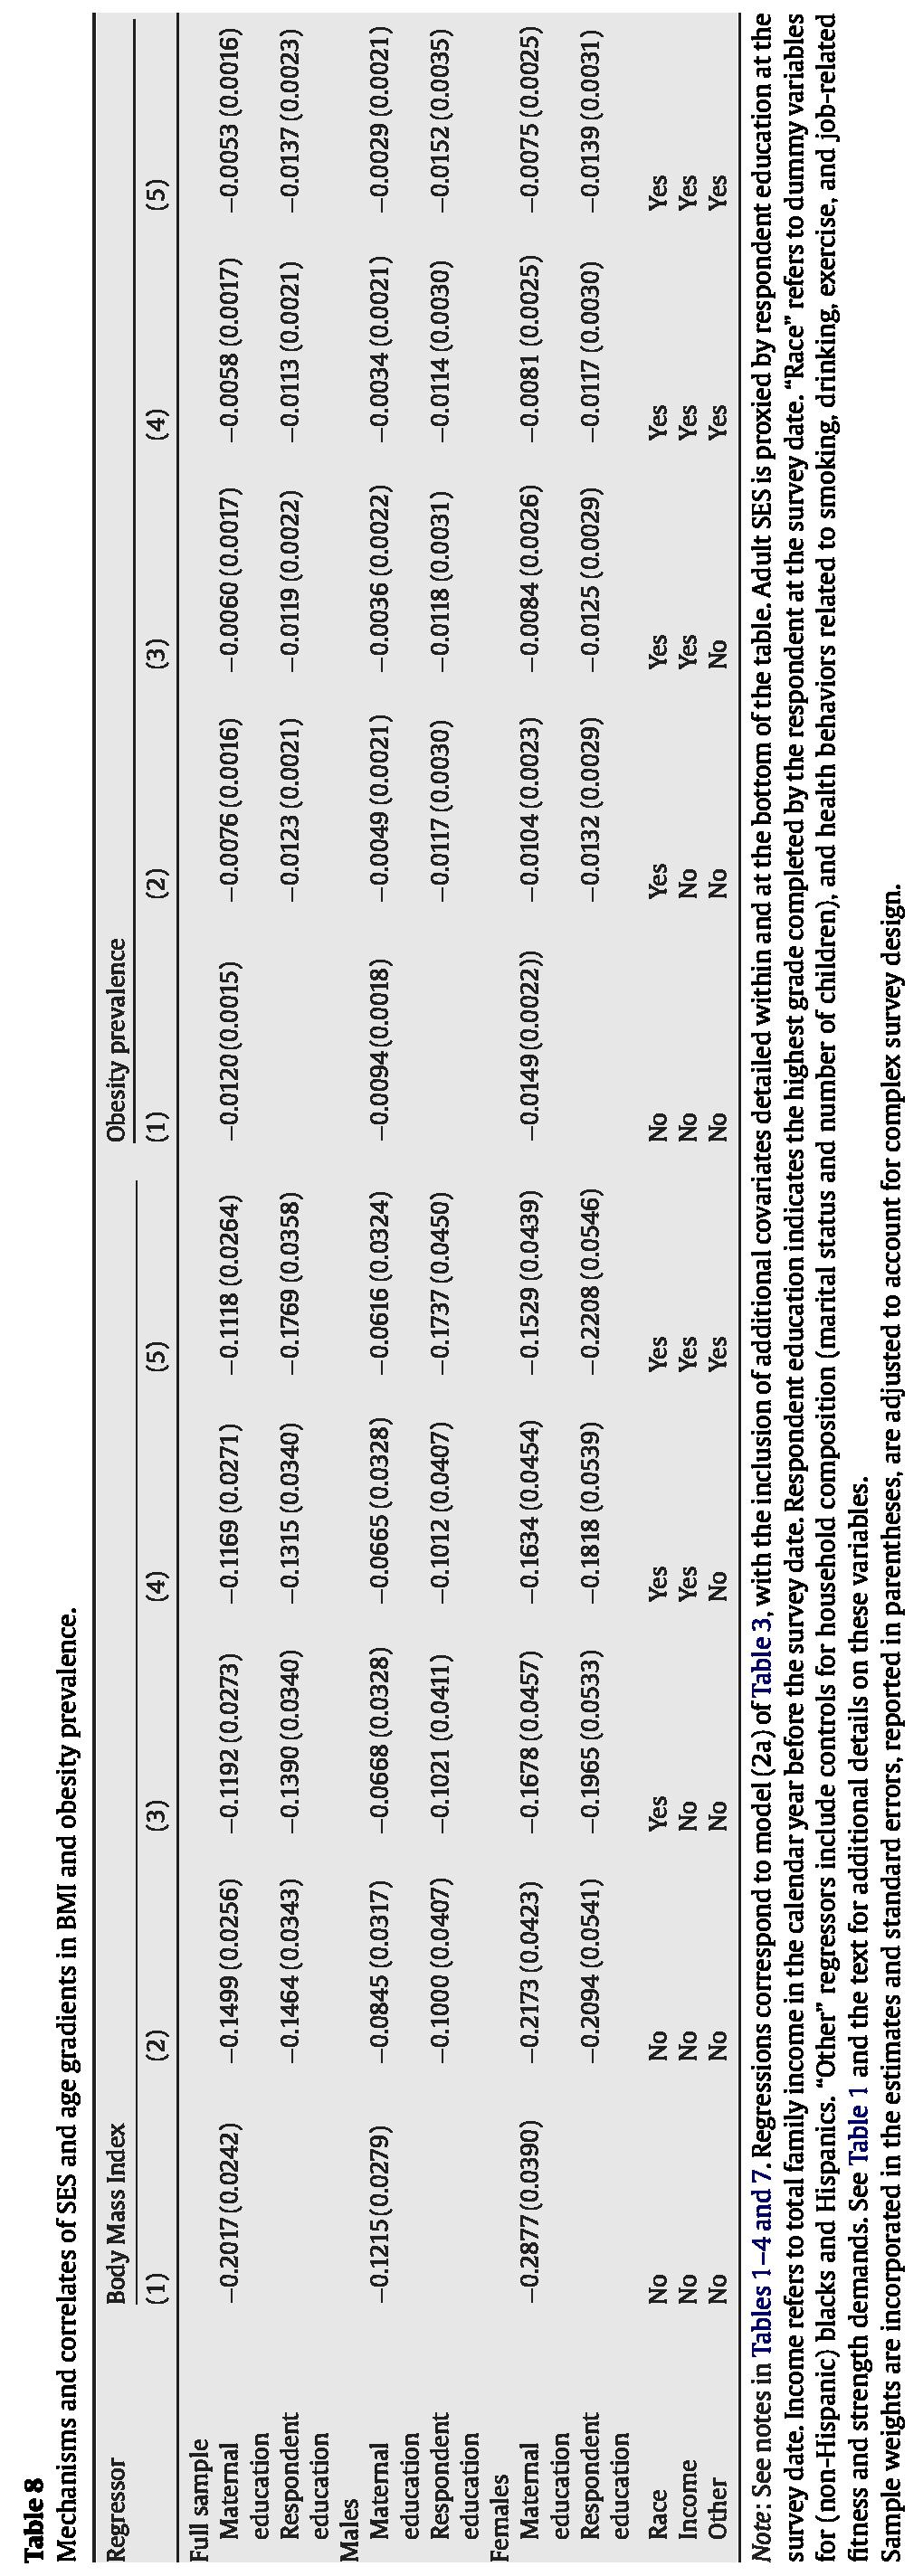
15 The beneficial effects of advantaged childhood circumstances primarily propagate through education and, to a lesser extent, race/ethnicity. The estimates in Table 8 exclude age-maternal education interactions and so constrain the SES gradient to be age-invariant. Results in columns (1) and (2), previously presented in Table 7, show that controlling for the respondent s education attenuates the full sample coefficient on maternal schooling by 26% for BMI and 37% for obesity. Also accounting for race/ethnicity (specification 3) shrinks the maternal schooling parameter by a total of 41 (50)% for BMI (obesity), with the education and race/ethnicity effects being essentially additive. Conversely, little of the impact of childhood SES appears to be transmitted through family income, household composition, or the available health behaviors. Higher income predicts lower body weight but the effects are small and controlling for them only slightly attenuates the maternal education coefficient (column 4). Nor is the latter much affected by holding constant household composition or health behaviors. 43 When simultaneously including all supplementary controls (model 5), 45 (55)% of the maternal education effect on BMI (obesity) is explained, with 92 (90)% of this being due to education and race/ethnicity. There is also no evidence that the additional covariates account for much of the predicted effect of contemporaneous SES. Controlling for race/ethnicity attenuates the respondent education parameter by 5 (3)% for BMI (obesity); also accounting for family income decreases its magnitude by a total of 10 (8)%; and holding constant household status and health behaviors substantially increases this coefficient. 44 Broadly similar results are obtained when examining men and women separately (see the bottom four rows of Table 8). Respondent education and race/ethnicity separately attenuate the maternal education parameter by and 14 15%, respectively, for men and 45 62% in combination. When also controlling for family income, household composition and health behaviors, the predicted effect of childhood SES declines 49 69%. Education and race/ethnicity individually attenuate the maternal education coefficient for females by and 15 19% and by 42 44% when included together. This coefficient falls 47 50%, in absolute value, when controlling for all supplementary covariates. Finally, the predicted effect of contemporaneous SES increases with the additional controls, although by less for women than men. 45 Lastly, we use estimates from models that include age SES inter-actions to calculate predicted BMI and obesity prevalence at 20 and 40 years of age for high and low childhood SES (defined as 9 and 16 years of maternal education). 46 The difference between the two groups, predicted from the basic model and previously summarized in Table 5, is the SES gap. We then calculate expected SES disparities, after controlling for supplementary covariates, and compute the share of the initial gap explained by them. 47 The results, displayed in Table 9, confirm the dominant role of education and, to a lesser extent, race/ethnicity in transmit-ting the effects of family background. The supplementary variables explain almost the entire relatively small SES differential in obesity for 20 years old but much less of the BMI gap. Much larger disparities are predicted at age 40, with just under half of the gap accounted for by the additional controls.
16

17 Schooling and race/ethnicity are individually responsible for and 33 38% of the explained disparity among 40 years old, with education representing a particularly important propagation mechanism for males. A possible concern is that respondent education may be a more important mechanism for transmitting the effects of childhood advantage when the latter is proxied by maternal schooling than when using other SES measures. For this reason, we replicated Tables 8 and 9 using Duncan occupation scores as an alternative indicator of childhood status. The results were quite similar to those presented and confirmed the dominant role of contemporaneous education and, to a smaller degree, race/ethnicity as propagation mechanisms Discussion Body weight rises during the transition from early to middle adulthood. BMI (obesity prevalence) is predicted to grow about 0.12 kg/m 2 (0.6 percentage points) per year. The increase is approximately linear over most ages examined, although with some evidence of concavity for the oldest sample members. Virtually identical estimates are obtained for men and women with some race/ethnicity differences (e.g., faster growth for black males and slower increases for Hispanics). Excess body weight is inversely related to childhood SES and the disparity increases with age. Our main proxy for early socioeconomic status is schooling by the respondent s mother. The regression results suggest that an additional year of maternal education reduces BMI (obesity) by an average of 0.20kg/m 2 (1.2 percentage points) and that this effect increases by kg/m 2 (0.07 points) per year of age. Larger SES disparities are predicted for women than men, with smaller differences for minorities than whites and little evidence of an SES gap for black males. Preliminary examination of the mechanisms through which the beneficial effects of childhood advantage translate into future outcomes highlights the importance of educational attainment and race/ethnicity. When entered into the models separately, respondent schooling attenuates the childhood SES effect by 26 37% and race/ethnicity by 15 16%. In combination, they explain a large majority of the (small) SES gap in the obesity of 20 years old but less of the (larger) disparity at age 40. Conversely, family income, marital status, number of children, and health behaviors play only a minor role. Evidence that SES differences in body weight grow with age is consistent with research results for other health outcomes. As with that literature, pathways for these effects are only partially understood. Between one-third and three-fifths of the differential predicted for 40 years old remains unaccounted for, after including our full set
Age, Socioeconomic Status and Obesity Growth. Charles L. Baum II Middle Tennessee State University (615)
") Age, Socioeconomic Status and Obesity Growth Charles L. Baum II Middle Tennessee State University cbaum@mtsu.edu (615) 898-2527 and Christopher J. Ruhm * University of North Carolina at Greensboro and
Age, Socioeconomic Status and Obesity Growth Charles L. Baum II Middle Tennessee State University cbaum@mtsu.edu (615) 898-2527 and Christopher J. Ruhm * University of North Carolina at Greensboro and
NBER WORKING PAPER SERIES AGE, SOCIOECONOMIC STATUS AND OBESITY GROWTH. Charles L. Baum II Christopher J. Ruhm
 NBER WORKING PAPER SERIES AGE, SOCIOECONOMIC STATUS AND OBESITY GROWTH Charles L. Baum II Christopher J. Ruhm Working Paper 13289 http://www.nber.org/papers/w13289 NATIONAL BUREAU OF ECONOMIC RESEARCH
The Effects of Food Stamps on Obesity
 DEPARTMENT OF ECONOMICS AND FINANCE WORKING PAPER SERIES February 2010 The Effects of Food Stamps on Obesity Charles L. Baum II * Middle Tennessee State University, Murfreesboro, TN Abstract Poverty has
Preliminary Draft. The Effect of Exercise on Earnings: Evidence from the NLSY
 Preliminary Draft The Effect of Exercise on Earnings: Evidence from the NLSY Vasilios D. Kosteas Cleveland State University 2121 Euclid Avenue, RT 1707 Cleveland, OH 44115-2214 b.kosteas@csuohio.edu Tel:
EXAMINING THE EDUCATION GRADIENT IN CHRONIC ILLNESS
 EXAMINING THE EDUCATION GRADIENT IN CHRONIC ILLNESS PINKA CHATTERJI, HEESOO JOO, AND KAJAL LAHIRI Department of Economics, University at Albany: SUNY February 6, 2012 This research was supported by the
Looking Toward State Health Assessment.
 CONNECTICUT DEPARTMENT OF PUBLIC HEALTH Policy, Planning and Analysis. Looking Toward 2000 - State Health Assessment. Table of Contents Glossary Maps Appendices Publications Public Health Code PP&A Main
Food Labels and Weight Loss:
 Food Labels and Weight Loss: Evidence from the National Longitudinal Survey of Youth Bidisha Mandal Washington State University AAEA 08, Orlando Motivation Who reads nutrition labels? Any link with body
A Multilevel Approach to Model Weight Gain: Evidence from NLSY79 Panel
 A Multilevel Approach to Model Weight Gain: Evidence from NLSY79 Panel Bidisha Mandal Washington State University bmandal@wsu.edu Obesity Trends* Among U.S. Adults BRFSS, 1985 (*BMI 30, or ~ 30 lbs. overweight
8/10/2012. Education level and diabetes risk: The EPIC-InterAct study AIM. Background. Case-cohort design. Int J Epidemiol 2012 (in press)
") Education level and diabetes risk: The EPIC-InterAct study 50 authors from European countries Int J Epidemiol 2012 (in press) Background Type 2 diabetes mellitus (T2DM) is one of the most common chronic
Education level and diabetes risk: The EPIC-InterAct study 50 authors from European countries Int J Epidemiol 2012 (in press) Background Type 2 diabetes mellitus (T2DM) is one of the most common chronic
From the Center for Human Nutrition, Department of International Health, Johns Hopkins Bloomberg School of Public Health, Baltimore, MD.
 Epidemiologic Reviews Copyright ª 2007 by the Johns Hopkins Bloomberg School of Public Health All rights reserved; printed in U.S.A. Vol. 29, 2007 DOI: 10.1093/epirev/mxm007 Advance Access publication
Risk Factors for Heart Disease
 Developmental Perspectives on Health Disparities from Conception Through Adulthood Risk Factors for Heart Disease Philip Greenland, MD Harry W. Dingman Professor Chair, Department of Preventive Medicine
Beer Purchasing Behavior, Dietary Quality, and Health Outcomes among U.S. Adults
 Beer Purchasing Behavior, Dietary Quality, and Health Outcomes among U.S. Adults Richard Volpe (California Polytechnical University, San Luis Obispo, USA) Research in health, epidemiology, and nutrition
Noncognitive Skills and the Racial Wage Gap
 Noncognitive Skills and the Racial Wage Gap Charles Hokayem* Poverty Statistics Branch Housing and Household Economic Statistics U.S. Census Bureau March 2011 Abstract This paper explores the role of a
Identifying Endogenous Peer Effects in the Spread of Obesity. Abstract
 Identifying Endogenous Peer Effects in the Spread of Obesity Timothy J. Halliday 1 Sally Kwak 2 University of Hawaii- Manoa October 2007 Abstract Recent research in the New England Journal of Medicine
Healthy Montgomery Obesity Work Group Montgomery County Obesity Profile July 19, 2012
 Healthy Montgomery Obesity Work Group Montgomery County Obesity Profile July 19, 2012 Prepared by: Rachel Simpson, BS Colleen Ryan Smith, MPH Ruth Martin, MPH, MBA Hawa Barry, BS Executive Summary Over
HEALTH PROMOTION AND CHRONIC DISEASE PREVENTION PROGRAM OREGON STATE OF THE HEART AND STROKE REPORT 2001 PREPARED BY.
 OREGON STATE OF THE HEART AND STROKE REPORT 2001 PREPARED BY THE OREGON DEPARTMENT OF HUMAN SERVICES HEALTH SERVICES HEALTH PROMOTION AND CHRONIC DISEASE PREVENTION PROGRAM www.healthoregon.org/hpcdp Contents
Health Concern. Obesity Guilford County Department of Public Health Community Health Assessment
 2012-2013 Guilford County Department of Public Health Community Health Assessment 10 Health Concern The leading causes of death in Guilford County are chronic degenerative diseases, especially cancer and
Does Male Education Affect Fertility? Evidence from Mali
 Does Male Education Affect Fertility? Evidence from Mali Raphael Godefroy (University of Montreal) Joshua Lewis (University of Montreal) April 6, 2018 Abstract This paper studies how school access affects
Higher Fruit Consumption Linked With Lower Body Mass Index
 Higher Fruit Consumption Linked With Lower Body Mass Index Biing-Hwan Lin and Rosanna Mentzer Morrison Healthy weight children, both girls and boys, consumed significantly more fruits than overweight children.
Econometric Game 2012: infants birthweight?
 Econometric Game 2012: How does maternal smoking during pregnancy affect infants birthweight? Case A April 18, 2012 1 Introduction Low birthweight is associated with adverse health related and economic
11/18/2013. Correlational Research. Correlational Designs. Why Use a Correlational Design? CORRELATIONAL RESEARCH STUDIES
 Correlational Research Correlational Designs Correlational research is used to describe the relationship between two or more naturally occurring variables. Is age related to political conservativism? Are
BMI may underestimate the socioeconomic gradient in true obesity
 8 BMI may underestimate the socioeconomic gradient in true obesity Gerrit van den Berg, Manon van Eijsden, Tanja G.M. Vrijkotte, Reinoud J.B.J. Gemke Pediatric Obesity 2013; 8(3): e37-40 102 Chapter 8
Adjusting Body Mass for Measurement Error with Invalid Validation Data
 DISCUSSION PAPER SERIES IZA DP No. 8009 Adjusting Body Mass for Measurement Error with Invalid Validation Data Charles Courtemanche Joshua C. Pinkston Jay Stewart February 2014 Forschungsinstitut zur Zukunft
Reading and maths skills at age 10 and earnings in later life: a brief analysis using the British Cohort Study
 Reading and maths skills at age 10 and earnings in later life: a brief analysis using the British Cohort Study CAYT Impact Study: REP03 Claire Crawford Jonathan Cribb The Centre for Analysis of Youth Transitions
IMPACTS OF PARENTAL EDUCATION ON SUBSTANCE USE: DIFFERENCES AMONG WHITE, AFRICAN-AMERICAN, AND HISPANIC STUDENTS IN 8TH, 10TH, AND 12TH GRADES
 Paper No. 7 IMPACTS OF PARENTAL EDUCATION ON SUBSTANCE USE: DIFFERENCES AMONG WHITE, AFRICAN-AMERICAN, AND HISPANIC STUDENTS IN 8TH, TH, AND 12TH GRADES (1999 8) Jerald G. Bachman Patrick M. O Malley Lloyd
Obesity in the US: Understanding the Data on Disparities in Children Cynthia Ogden, PhD, MRP
 Obesity in the US: Understanding the Data on Disparities in Children Cynthia Ogden, PhD, MRP National Center for Health Statistics Division of Health and Nutrition Examination Surveys Obesity in the US,
The Effects of Maternal Alcohol Use and Smoking on Children s Mental Health: Evidence from the National Longitudinal Survey of Children and Youth
 1 The Effects of Maternal Alcohol Use and Smoking on Children s Mental Health: Evidence from the National Longitudinal Survey of Children and Youth Madeleine Benjamin, MA Policy Research, Economics and
Aggregation of psychopathology in a clinical sample of children and their parents
 Aggregation of psychopathology in a clinical sample of children and their parents PA R E N T S O F C H I LD R E N W I T H PSYC H O PAT H O LO G Y : PSYC H I AT R I C P R O B LEMS A N D T H E A S SO C I
Rising cigarette prices and rising obesity: Coincidence or unintended consequence?
 Rising cigarette prices and rising obesity: Coincidence or unintended consequence? By: Charles Courtemanche Courtemanche, Charles. Rising Cigarette Prices and Rising Obesity: Coincidence or Unintended
The U.S. Obesity Epidemic: Causes, Consequences and Health Provider Response. Suzanne Bennett Johnson 2012 APA President
 The U.S. Obesity Epidemic: Causes, Consequences and Health Provider Response Suzanne Bennett Johnson 2012 APA President sbjohnson@apa.org Presentation Overview Epidemiology of obesity Consequences of obesity
11/24/2017. Do not imply a cause-and-effect relationship
 Correlational research is used to describe the relationship between two or more naturally occurring variables. Is age related to political conservativism? Are highly extraverted people less afraid of rejection
Research Article Prevalence and Trends of Adult Obesity in the US,
 ISRN Obesity, Article ID 185132, 6 pages http://dx.doi.org/.1155/14/185132 Research Article Prevalence and Trends of Adult Obesity in the US, 1999 12 Ruopeng An CollegeofAppliedHealthSciences,UniversityofIllinoisatUrbana-Champaign,GeorgeHuffHallRoom13,16South4thStreet,
Cancer survivorship and labor market attachments: Evidence from MEPS data
 Cancer survivorship and labor market attachments: Evidence from 2008-2014 MEPS data University of Memphis, Department of Economics January 7, 2018 Presentation outline Motivation and previous literature
Author's response to reviews
 Author's response to reviews Title:Mental health problems in the 10th grade and non-completion of upper secondary school: the mediating role of grades in a population-based longitudinal study Authors:
Preliminary Draft: Please do not cite or quote. Adult Eating Behaviors and Weight Status: A Time Use Analysis
 Preliminary Draft: Please do not cite or quote Adult Eating Behaviors and Weight Status: A Time Use Analysis Charlene M. Kalenkoski Ohio University Department of Economics Bentley Annex 351 Athens, OH
Lecture Outline. Biost 517 Applied Biostatistics I. Purpose of Descriptive Statistics. Purpose of Descriptive Statistics
 Biost 517 Applied Biostatistics I Scott S. Emerson, M.D., Ph.D. Professor of Biostatistics University of Washington Lecture 3: Overview of Descriptive Statistics October 3, 2005 Lecture Outline Purpose
Instrumental Variables Estimation: An Introduction
 Instrumental Variables Estimation: An Introduction Susan L. Ettner, Ph.D. Professor Division of General Internal Medicine and Health Services Research, UCLA The Problem The Problem Suppose you wish to
Motherhood and Female Labor Force Participation: Evidence from Infertility Shocks
 Motherhood and Female Labor Force Participation: Evidence from Infertility Shocks Jorge M. Agüero Univ. of California, Riverside jorge.aguero@ucr.edu Mindy S. Marks Univ. of California, Riverside mindy.marks@ucr.edu
Prevalence of Overweight Among Anchorage Children: A Study of Anchorage School District Data:
 Department of Health and Social Services Division of Public Health Section of Epidemiology Joel Gilbertson, Commissioner Richard Mandsager, MD, Director Beth Funk, MD, MPH, Editor 36 C Street, Suite 54,
Prevalence of Childhood Overweight among Low-Income Households
 Prevalence of Childhood Overweight among Low-Income Households Chung L. Huang Dept. of Agricultural & Applied Economics 313-E Conner Hall The University of Georgia Athens, GA 30602-7509 Tel: (706) 542-0747;
NUMEROUS studies link obesity to poorer socioeconomic outcomes, including
 Obesity Is in the Eye of the Beholder: BMI and Socioeconomic Outcomes across Cohorts Vida Maralani, Douglas McKee Cornell University Abstract: The biological and social costs of body mass cannot be conceptualized
Hull s Adult Health and Lifestyle Survey: Summary
 Hull s 211-212 Adult Health and Lifestyle Survey: Summary Public Health Sciences, Hull Public Health April 213 Front cover photographs of Hull are taken from the Hull City Council Flickr site (http://www.flickr.com/photos/hullcitycouncil/).
How Early Health Affects Children s Life Chances
 How Early Health Affects Children s Life Chances David Figlio* Director, Institute for Policy Research Northwestern University Sulzberger Lecture, Duke University, January 13, 2015 *Collaborative research
Propensity Score Methods for Estimating Causality in the Absence of Random Assignment: Applications for Child Care Policy Research
 2012 CCPRC Meeting Methodology Presession Workshop October 23, 2012, 2:00-5:00 p.m. Propensity Score Methods for Estimating Causality in the Absence of Random Assignment: Applications for Child Care Policy
Disentangling the Contemporaneous and Life-Cycle Effects of Body Mass on Earnings
 Disentangling the Contemporaneous and Life-Cycle Effects of Body Mass on Earnings by Donna B. Gilleskie, Euna Han, and Edward C. Norton Donna B. Gilleskie Department of Economics University of North Carolina
Judy Kruger, PhD, MS, Deborah A. Galuska, PhD, MPH, Mary K. Serdula, MD, MPH, Deborah A. Jones, PhD
 Attempting to Lose Weight Specific Practices Among U.S. Adults Judy Kruger, PhD, MS, Deborah A. Galuska, PhD, MPH, Mary K. Serdula, MD, MPH, Deborah A. Jones, PhD Background: Methods: Results: Conclusions:
The relation of dietary patterns to future survival, health, and cardiovascular events in older adults
 Journal of Clinical Epidemiology 56 (2003) 1224 1235 The relation of dietary patterns to future survival, health, and cardiovascular events in older adults Paula Diehr a,b,c, *, Shirley A.A. Beresford
The Impact of Relative Standards on the Propensity to Disclose. Alessandro Acquisti, Leslie K. John, George Loewenstein WEB APPENDIX
 The Impact of Relative Standards on the Propensity to Disclose Alessandro Acquisti, Leslie K. John, George Loewenstein WEB APPENDIX 2 Web Appendix A: Panel data estimation approach As noted in the main
IS THERE A RELATIONSHIP BETWEEN EATING FREQUENCY AND OVERWEIGHT STATUS IN CHILDREN?
 IS THERE A RELATIONSHIP BETWEEN EATING FREQUENCY AND OVERWEIGHT STATUS IN CHILDREN? A Thesis submitted to the Faculty of the Graduate School of Arts and Sciences of Georgetown University in partial fulfillment
APPENDIX: Supplementary Materials for Advance Directives And Nursing. Home Stays Associated With Less Aggressive End-Of-Life Care For
 Nicholas LH, Bynum JPW, Iwashnya TJ, Weir DR, Langa KM. Advance directives and nursing home stays associated with less aggressive end-of-life care for patients with severe dementia. Health Aff (MIllwood).
Alcohol Consumption and Mortality Risks in the U.S. Brian Rostron, Ph.D. Savet Hong, MPH
 Alcohol Consumption and Mortality Risks in the U.S. Brian Rostron, Ph.D. Savet Hong, MPH 1 ABSTRACT This study presents relative mortality risks by alcohol consumption level for the U.S. population, using
The Economics of Obesity
 The Economics of Obesity John Cawley Cornell University Usefulness of Economics in Studying Obesity Offers widely-accepted theoretical framework for human behavior (constrained maximization) We ask different
The Dynamic Effects of Obesity on the Wages of Young Workers
 The Dynamic Effects of Obesity on the Wages of Young Workers Joshua C. Pinkston University of Louisville June, 2015 Contributions 1. Focus on more recent cohort, NLSY97. Obesity
UCLA UCLA Previously Published Works
 UCLA UCLA Previously Published Works Title Bigger bodies: Long-term trends and disparities in obesity and body-mass index among U.S. adults, 1960-2008 Permalink https://escholarship.org/uc/item/1ff06821
La Follette School of Public Affairs
 Robert M. La Follette School of Public Affairs at the University of Wisconsin-Madison Working Paper Series La Follette School Working Paper No. 2008-003 http://www.lafollette.wisc.edu/publications/workingpapers
Evaluating the Effects of Nutritional Intake During Adolescence on Educational Attainment and Labor Market Earnings as an Adult
 Claremont Colleges Scholarship @ Claremont CMC Senior Theses CMC Student Scholarship 2018 Evaluating the Effects of Nutritional Intake During Adolescence on Educational Attainment and Labor Market Earnings
Obesity prevalence, disparities, trends and persistence among US children <5 y
 Obesity prevalence, disparities, trends and persistence among US children
Web Appendix Index of Web Appendix
 Web Appendix Index of Web Appendix Page 2: Footnote 2 (also discussed in Page 17): 1980 Census with other outcomes Page 3: Footnote 8: correlation matrix between health/education expenditure and pandemic
6. Unusual and Influential Data
 Sociology 740 John ox Lecture Notes 6. Unusual and Influential Data Copyright 2014 by John ox Unusual and Influential Data 1 1. Introduction I Linear statistical models make strong assumptions about the
NBER WORKING PAPER SERIES THE HETEROGENEITY OF THE CIGARETTE PRICE EFFECT ON BODY MASS INDEX. George Wehby Charles J. Courtemanche
 NBER WORKING PAPER SERIES THE HETEROGENEITY OF THE CIGARETTE PRICE EFFECT ON BODY MASS INDEX George Wehby Charles J. Courtemanche Working Paper 18087 http://www.nber.org/papers/w18087 NATIONAL BUREAU OF
Economics of obesity
 Economics of obesity Chris Auld Economics 317 March 30, 2011 References. This lecture does not draw on the textbook. See Philipson and Posner (2008) Is the obesity epidemic a public health problem? A decade
Underweight Children in Ghana: Evidence of Policy Effects. Samuel Kobina Annim
 Underweight Children in Ghana: Evidence of Policy Effects Samuel Kobina Annim Correspondence: Economics Discipline Area School of Social Sciences University of Manchester Oxford Road, M13 9PL Manchester,
Abstract Locus of control, that is, people s perception of how much influence they have over their lives, is
 Institutions, Parental Selection, and Locus of Control Kristin J. Kleinjans * and Andrew Gill California State University, Fullerton October 2017 Abstract Locus of control, that is, people s perception
National Child Measurement Programme Changes in children s body mass index between 2006/07 and 2010/11
 National Child Measurement Programme Changes in children s body mass index between 2006/07 and 2010/11 Delivered by NOO on behalf of the Public Health Observatories in England Published: March 2012 NOO
Some college. Native American/ Other. 4-year degree 13% Grad work
 Access to Affordable Health Care Access to affordable care improves quality of life and health outcomes. Without affordable access to a doctor, residents are more likely to end up in expensive emergency
CHAPTER 9. Anthropometry and Body Composition
 CHAPTER 9 Anthropometry and Body Composition 9.1 INTRODUCTION Ageing is characterized by reduction in fat free mass (FFM), primarily via loss of muscle mass, loss of bone mineral in women, redistribution
Food Insecurity or Poverty? Measuring Need-Related Dietary Adequacy
 Institute for Research on Poverty Discussion Paper no. 1252-02 Food Insecurity or Poverty? Measuring Need-Related Dietary Adequacy Jayanta Bhattacharya Center for Primary Care and Outcomes Research Stanford
Math Workshop On-Line Tutorial Judi Manola Paul Catalano. Slide 1. Slide 3
 Kinds of Numbers and Data First we re going to think about the kinds of numbers you will use in the problems you will encounter in your studies. Then we will expand a bit and think about kinds of data.
MEA DISCUSSION PAPERS
 Inference Problems under a Special Form of Heteroskedasticity Helmut Farbmacher, Heinrich Kögel 03-2015 MEA DISCUSSION PAPERS mea Amalienstr. 33_D-80799 Munich_Phone+49 89 38602-355_Fax +49 89 38602-390_www.mea.mpisoc.mpg.de
Why the Increase In Obesity
 Obesity From an Economist s Perspective Eric Finkelstein, PhD, MHA RTI INTERNATIONAL The Economics of Obesity (outline) Why the Increase in Obesity Rates Adverse Health Consequences Why do (or should)
Health Behaviors and Education in Turkey
 DISCUSSION PAPER SERIES IZA DP No. 8262 Health Behaviors and Education in Turkey Aysit Tansel Deniz Karaoglan June 2014 Forschungsinstitut zur Zukunft der Arbeit Institute for the Study of Labor Health
Feeling overweight vs. being overweight: Accuracy of weight perception among Minnesota youth
 DHS-5625-ENG 10-08 Feeling overweight vs. being overweight: Accuracy of weight perception among Minnesota youth October 2008 Minnesota Department of Human Services Performance Measurement and Quality Improvement
Australian Longitudinal Study on Women's Health TRENDS IN WOMEN S HEALTH 2006 FOREWORD
 Australian Longitudinal Study on Women's Health TRENDS IN WOMEN S HEALTH 2006 FOREWORD The Longitudinal Study on Women's Health, funded by the Commonwealth Government, is the most comprehensive study ever
COPD and environmental risk factors other than smoking. 14. Summary
 COPD and environmental risk factors other than smoking 14. Summary Author : P N Lee Date : 7 th March 2008 1. Objectives and general approach The objective was to obtain a good insight from the available
Smoking Status and Body Mass Index in the United States:
 Smoking Status and Body Mass Index in the United States: 1996-2000 Jun Yang, MD, PhD and Gary Giovino, PhD Roswell Park Cancer Institute Elm and Carlton Streets Buffalo, NY 14263, USA Society for Research
Infertility services reported by men in the United States: national survey data
 MALE FACTOR Infertility services reported by men in the United States: national survey data John E. Anderson, Ph.D., Sherry L. Farr, Ph.D., M.S.P.H., Denise J. Jamieson, M.D., M.P.H., Lee Warner, Ph.D.,
Those Who Tan and Those Who Don t: A Natural Experiment of Employment Discrimination
 Those Who Tan and Those Who Don t: A Natural Experiment of Employment Discrimination Ronen Avraham, Tamar Kricheli Katz, Shay Lavie, Haggai Porat, Tali Regev Abstract: Are Black workers discriminated against
Math Workshop On-Line Tutorial Judi Manola Paul Catalano
 Math Workshop On-Line Tutorial Judi Manola Paul Catalano 1 Session 1 Kinds of Numbers and Data, Fractions, Negative Numbers, Rounding, Averaging, Properties of Real Numbers, Exponents and Square Roots,
ATTENTION-DEFICIT/HYPERACTIVITY DISORDER, PHYSICAL HEALTH, AND LIFESTYLE IN OLDER ADULTS
 CHAPTER 5 ATTENTION-DEFICIT/HYPERACTIVITY DISORDER, PHYSICAL HEALTH, AND LIFESTYLE IN OLDER ADULTS J. AM. GERIATR. SOC. 2013;61(6):882 887 DOI: 10.1111/JGS.12261 61 ATTENTION-DEFICIT/HYPERACTIVITY DISORDER,
Community Health Profile: Minnesota, Wisconsin, & Michigan Tribal Communities 2006
 Community Health Profile: Minnesota, Wisconsin, & Michigan Tribal Communities 26 This report is produced by: The Great Lakes EpiCenter If you would like to reproduce any of the information contained in
etable 3.1: DIABETES Name Objective/Purpose
 Appendix 3: Updating CVD risks Cardiovascular disease risks were updated yearly through prediction algorithms that were generated using the longitudinal National Population Health Survey, the Canadian
Social Determinants and Consequences of Children s Non-Cognitive Skills: An Exploratory Analysis. Amy Hsin Yu Xie
 Social Determinants and Consequences of Children s Non-Cognitive Skills: An Exploratory Analysis Amy Hsin Yu Xie Abstract We assess the relative role of cognitive and non-cognitive skills in mediating
Chapter 10 Lecture. Health: The Basics Tenth Edition. Reaching and Maintaining a Healthy Weight
 Chapter 10 Lecture Health: The Basics Tenth Edition Reaching and Maintaining a Healthy Weight OBJECTIVES Define overweight and obesity, describe the current epidemic of overweight/obesity in the United
Misreporting and misclassification: Implications for. socioeconomic disparities in body-mass index and obesity
 Working Paper 2012:19 Department of Economics School of Economics and Management Misreporting and Misclassification: Implications for Socioeconomic Disparities in Body-mass Index and Obesity Åsa Ljungvall
Swiss Food Panel. -A longitudinal study about eating behaviour in Switzerland- ENGLISH. Short versions of selected publications. Zuerich,
 Vertrag 10.008123 ENGLISH Swiss Food Panel -A longitudinal study about eating behaviour in Switzerland- Short versions of selected publications Zuerich, 16.10. 2013 Address for Correspondence ETH Zurich
THE ROLE OF UNEMPLOYMENT INSURANCE ON ALCOHOL USE AND ABUSE FOLLOWING JOB LOSS ROBERT LANTIS AND BRITTANY TEAHAN
 THE ROLE OF UNEMPLOYMENT INSURANCE ON ALCOHOL USE AND ABUSE FOLLOWING JOB LOSS ROBERT LANTIS AND BRITTANY TEAHAN MOTIVATION 2013 National Survey on Drug Use and Health finds that 17% of unemployed have
Department of Sociology, University of Washington, 211 Savery Hall, Box , Seattle, WA , USA
 Journal of Obesity Volume, Article ID 959658, pages doi:.55//959658 Research Article Measuring Distributional Inequality: Relative Body Mass Index Distributions by Gender, Race/Ethnicity, and Education,
Title: Living alone and antidepressant medication use: a prospective study in a working-age population
 Author's response to reviews Title: Living alone and antidepressant medication use: a prospective study in a working-age population Authors: Laura Pulkki-Råback (laura.pulkki-raback@helsinki.fi) Mika Kivimäki
Health information and life-course smoking behavior: evidence from Turkey
 The European Journal of Health Economics https://doi.org/10.1007/s10198-018-0988-9 ORIGINAL PAPER Health information and life-course smoking behavior: evidence from Turkey Dean R. Lillard 1 Zeynep Önder
Case A, Wednesday. April 18, 2012
 Case A, Wednesday. April 18, 2012 1 Introduction Adverse birth outcomes have large costs with respect to direct medical costs aswell as long-term developmental consequences. Maternal health behaviors at
At the change of government, South Africa faced important health challenges. The country was bearing
 Health Challenges Past and Future Cally Ardington and Anne Case Chapter 41 in The Oxford Companion to the Economics of South Africa, Haroon Bhorat, Alan Hirsch, Ravi Kanbur and Mthuli Ncube (eds.), Oxford
Modelling Research Productivity Using a Generalization of the Ordered Logistic Regression Model
 Modelling Research Productivity Using a Generalization of the Ordered Logistic Regression Model Delia North Temesgen Zewotir Michael Murray Abstract In South Africa, the Department of Education allocates
Nutrition and Physical Activity Situational Analysis
 Nutrition and Physical Activity Situational Analysis A Resource to Guide Chronic Disease Prevention in Alberta Executive Summary December 2010 Prepared by: Alberta Health Services, AHS Overview Intrinsic
Cheap Donuts and Expensive Broccoli: The Effect of Relative Prices on Obesity
 Cheap Donuts and Expensive Broccoli: The Effect of Relative Prices on Obesity Jonah B. Gelbach University of Maryland, Department of Economics Florida State University, College of Law Jonathan Klick Florida
Addendum: Multiple Regression Analysis (DRAFT 8/2/07)
") Addendum: Multiple Regression Analysis (DRAFT 8/2/07) When conducting a rapid ethnographic assessment, program staff may: Want to assess the relative degree to which a number of possible predictive variables
Addendum: Multiple Regression Analysis (DRAFT 8/2/07) When conducting a rapid ethnographic assessment, program staff may: Want to assess the relative degree to which a number of possible predictive variables
HEALTH. Sexual and Reproductive Health (SRH)
") HEALTH The changes in global population health over the last two decades are striking in two ways in the dramatic aggregate shifts in the composition of the global health burden towards non-communicable
HEALTH The changes in global population health over the last two decades are striking in two ways in the dramatic aggregate shifts in the composition of the global health burden towards non-communicable
Obesity and Control. Body Mass Index (BMI) and Sedentary Time in Adults
 and Sedentary Time in Adults") Obesity and Control Received: May 14, 2015 Accepted: Jun 15, 2015 Open Access Published: Jun 18, 2015 http://dx.doi.org/10.14437/2378-7805-2-106 Research Peter D Hart, Obes Control Open Access 2015, 2:1
Obesity and Control Received: May 14, 2015 Accepted: Jun 15, 2015 Open Access Published: Jun 18, 2015 http://dx.doi.org/10.14437/2378-7805-2-106 Research Peter D Hart, Obes Control Open Access 2015, 2:1
CHOICES The magazine of food, farm and resource issues
 CHOICES The magazine of food, farm and resource issues Fall 2004 A publication of the American Agricultural Economics Association Obesity: Economic Dimensions of a Super Size Problem Maria L. Loureiro
Savannah :: Chatham. August rd Edition COMMUNITY INDICATORS DATABASE COUNTY CHATHAM. produced by the Armstrong Public Service Center
 photo: GA Dept. of Economic Development Savannah :: Chatham COMMUNITY INDICATORS DATABASE August 2013 3rd Edition produced by the Armstrong Public Service Center CHATHAM COUNTY www.savannah-chatham-indicators.org