Adjusting Body Mass for Measurement Error with Invalid Validation Data
|
|
|
- Dominick Jacobs
- 5 years ago
- Views:
Transcription
1 DISCUSSION PAPER SERIES IZA DP No Adjusting Body Mass for Measurement Error with Invalid Validation Data Charles Courtemanche Joshua C. Pinkston Jay Stewart February 2014 Forschungsinstitut zur Zukunft der Arbeit Institute for the Study of Labor
2 Adjusting Body Mass for Measurement Error with Invalid Validation Data Charles Courtemanche Georgia State University and NBER Joshua C. Pinkston University of Louisville Jay Stewart U.S. Bureau of Labor Statistics and IZA Discussion Paper No February 2014 IZA P.O. Box Bonn Germany Phone: Fax: Any opinions expressed here are those of the author(s) and not those of IZA. Research published in this series may include views on policy, but the institute itself takes no institutional policy positions. The IZA research network is committed to the IZA Guiding Principles of Research Integrity. The Institute for the Study of Labor (IZA) in Bonn is a local and virtual international research center and a place of communication between science, politics and business. IZA is an independent nonprofit organization supported by Deutsche Post Foundation. The center is associated with the University of Bonn and offers a stimulating research environment through its international network, workshops and conferences, data service, project support, research visits and doctoral program. IZA engages in (i) original and internationally competitive research in all fields of labor economics, (ii) development of policy concepts, and (iii) dissemination of research results and concepts to the interested public. IZA Discussion Papers often represent preliminary work and are circulated to encourage discussion. Citation of such a paper should account for its provisional character. A revised version may be available directly from the author.
3 IZA Discussion Paper No February 2014 ABSTRACT Adjusting Body Mass for Measurement Error with Invalid Validation Data * We propose a new method for using validation data to correct self-reported weight and height in surveys that do not weigh and measure respondents. The standard correction from prior research regresses actual measures on reported values using an external validation dataset, and then uses the estimated coefficients to predict actual measures in the primary dataset. This approach requires the strong assumption that the expectations of actual weight and height conditional on the reported values are the same in both datasets. In contrast, we use percentile ranks rather than levels of reported weight and height. Our approach requires the much weaker assumption that the conditional expectations of actual measures are increasing in reported values in both samples, making our correction more robust to differences in measurement error across surveys. We then examine three nationally representative datasets and confirm that misreporting is sensitive to differences in survey context such as data collection mode. When we compare predicted BMI distributions using the two approaches, we find that the standard correction is biased by differences in misreporting while our correction is not. Finally, we present several examples that demonstrate the potential importance of our correction for future econometric analyses and estimates of obesity rates. JEL Classification: C18, I1 Keywords: body mass index, obesity, measurement error, validation data Corresponding author: Joshua C. Pinkston Economics Department College of Business University of Louisville Louisville, KY USA josh.pinkston@louisville.edu * The views expressed in this paper are the authors and do not necessarily reflect those of the U.S. Bureau of Labor Statistics.
4 1 Introduction Obesity, defined as having a body mass index (BMI) of at least 30, leads to heart disease, diabetes, high blood pressure, stroke, and other health problems (Strum, 2002). 1 The obesity rate among U.S. adults rose from 13% in 1960 to 34% in 2008, prompting a large literature examining the causes and consequences of this trend (Flegal et al., 1998; National Center of Health Statistics, 2008). Appropriate measurement of weight and height has long been a problematic issue for researchers in this literature. Medically measured weight and height are obviously ideal, but they are expensive to collect in large samples due to the need for trained personnel to have in-person contact with respondents. For this reason, only one large-scale U.S. government health dataset the National Health and Nutrition Examination Surveys (NHANES) contains measured weights and heights. The NHANES has several limitations that render it viable for only a small subset of the topics of interest to obesity researchers. Though large enough to produce nationallevel descriptive statistics, it is often too small for more sophisticated estimation. Moreover, the NHANES consists of repeated cross-sections so it does not allow for the use of panel data methods. Finally, although the NHANES contains excellent health information, it includes only a limited number of economic and demographic variables. Other datasets include respondents self-reports of weight and height, often obtained through telephone surveys (e.g. Behavioral Risk Factor Surveillance System (BRFSS)). Such an approach permits a much larger sample size and broader geographic coverage, but is limited by the fact that self-reports are often subject to considerable measurement error. Some respondents 1 BMI=weight in kilograms divided by height in squared meters. 1
5 may not know their current weight, while others might be dishonest about their weight and height in an effort to adhere to social norms. Cawley (2002) finds that underweight people tend to overreport their weight while those who are heavier tend to underreport. Overreporting among the underweight is greater for men, while underreporting among the overweight is greater for women. For both sexes, the distribution of self-reported weight is therefore more compressed than the actual weight distribution. Rowland (1990) finds similar results for weight and also documents a tendency to exaggerate height that is more pronounced among the overweight. These results imply that obesity rates computed from self-reported weight and height will be understated. Moreover, the systematic, non-classical nature of the measurement error suggests that bias in regression estimates is possible regardless of whether BMI is an independent or dependent variable, and that the direction of the bias is unclear. In two concurrent papers, Cawley (2002; 2004) corrects for the misreporting of height and weight using a procedure that was developed in the statistics literature. In a dilemma common in obesity research, the NHANES is not a suitable dataset for the topic of either paper. 2 In both studies, Cawley uses the 1979 cohort of the National Longitudinal Survey of Youth, which contains self-reported weight and height, and attempts to correct these measures using the relationship between self-reports and measured values in the NHANES. For each race and gender group, Cawley regresses actual weight and height on the corresponding self-reports and their squares in NHANES, and then uses the resulting regression estimates to predict the NLSY79 respondents actual weights and heights. 2 The first paper, Cawley (2002), tests for rational addiction in caloric intake, which requires panel data. The second, Cawley (2004), examines the impact of obesity on wages, and wages are not available in the NHANES. 2
6 Cawley s correction for self-reported weight and height has since become commonly used in the economics of obesity literature. Several recent papers have used this correction when studying the impacts of obesity on labor market outcomes (e.g. Cawley and Danzinger, 2005; Gregory, 2010; Gregory and Ruhm, 2011; Majumder, 2013). This correction has also been used in a number of papers that examine potential economic determinants of obesity. 3 Unfortunately, the standard validation method of Cawley (2002, 2004) is not appropriate if the amount or type of measurement error differs between the primary and validation samples. As Han et al. (2009) point out, NHANES respondents expect to be weighed and measured when they report their height and weight, while respondents in the NLSY and other commonly used datasets do not. Furthermore, Pinkston (2013) notes that even being interviewed by phone instead of in person affects the self-reported values of respondents in the NLSY cohorts. Our paper develops an alternative correction for self-reported weight and height that relies on weaker assumptions about the relationship between true and reported values in the primary and validation datasets. Instead of relying on the reported values themselves, we predict actual measures using the percentile rank of reported values in their respective distributions. Our method is robust to differences across samples in the severity (or type) of measurement error as long as the rankings of respondents based on reported values resembles the rankings based on actual measures in both datasets. 3 Potential determinates of obesity studied using Cawley s correction include age (Baum and Ruhm, 2009), income (Cawley et al., 2010), unemployment rate (Ruhm, 2005), childhood socioeconomic status (Baum and Ruhm, 2009), food prices (Lakdawalla and Philipson, 2002; Chou et al., 2004; Courtemanche et al., forthcoming; Goldman et al., 2011), cigarette prices (Chou et al., 2004; Baum, 2009), alcohol prices (Chou et al., 2004), food stamps (Fan, 2010; Baum, 2011), restaurant density (Chou et al., 2004), on-the-job physical activity (Lakdawalla and Philipson, 2002), smoking bans (Chou et al., 2004), urban sprawl (Plantinga and Bernell, 2007; Eid et al., 2008), and time preference (Courtemanche et al., forthcoming). 3
7 Using data from the Behavioral Risk Factor Surveillance System and the American Time Use Survey, we show that our percentile rank method produces predicted values of BMI that are consistent across datasets, and consistent with the distribution of actual BMI in the population. We also confirm that the standard approach in the literature is not appropriate in these datasets because it is sensitive to differences in misreporting across samples. Finally, we illustrate how the corrections can influence regressions coefficients and estimates of the prevalence of obesity. Using both the BRFSS and ATUS, we consider basic regressions that include BMI or obesity as either a dependent or an independent variable. In each case, we compare estimates with our adjustment to analogous estimates that use either no correction for measurement error or the standard correction. While using our correction generally does not affect the signs of coefficient estimates or statistical significance, it can lead to important differences in the magnitudes of the estimates. We then revisit the Centers for Disease Control s (CDC s) well-known map of obesity rates by state and demonstrate that correcting for measurement error dramatically increases the estimated prevalence for most states. 2 The Problem of Transportability and an Alternative Approach For the sake of simplicity, our discussions in this section will consider the regression of some dependent variable on an independent variable that is measured with error. Both the standard method and our proposed method extend to cases in which the dependent variable is measured with error under similar assumptions. 4 In what follows, we will note any changes in assumptions required by such extensions. 4 L&S develop their approach to correct measurement error in either the dependent or independent variables of a nonlinear regression. See Chen et al. (2005) among others for applications that use fewer parametric assumptions. 4
8 Let b denote the true measures of height or weight in the population, and bb jj denote the reported value in sample j, where jj = PP, VV indicates the primary or validation dataset. The reported values, bb jj, are allowed to have arbitrary (potentially nonclassical) measurement error. The standard validation approach used by Cawley (2002, 2004) is based on work by Lee and Sepanski (1995) (L&S in what follows) and others in the statistics literature. 5 We can distill two conditions from this literature that must be met when validation data are used to correct for measurement error: C1. There must be a surrogate for b. A variable, bb ss jj, is a surrogate for b if the distribution of y given (bb, bb ss jj ) is the same as the distribution of y given b. 6 In cases where b is a dependent variable that is measured with error, bb ss jj is a surrogate if its distribution depends only on the true response (see Carroll et al., 2006). C2. The surrogate, bb ss jj, must satisfy some form of transportability across datasets. Transportability is usually described as the distribution of b conditional on bb ss jj being the same in both datasets; however, L&S use a weaker form of transportability, which requires EE(bb bb ss PP ) = EE(bb bb ss VV ). 7 The first condition simply states that a surrogate for b contains no information about the dependent variable that is not also contained in b (and possibly other observed covariates). This condition is easily satisfied by the reported values, bb jj. 5 See Bound et al. (2001) for a brief survey of this work, and Carroll et al. (2006) for more depth. 6 In addition to L&S, see Carroll et al. (2006). 7 See Bound et al. (2001) or Carroll et al. (2006) for examples of the stronger version of transportability. Strictly speaking, L&S assume that the expectation of y conditional on bb jj ss is the same in both datasets, but that reduces to EE(bb bb PP ss ) = EE(bb bb VV ss ) in the current context. 5
9 The second condition, transportability, is essential if the procedure used to generate predicted values in the validation dataset is to be applied to the primary dataset. C2 requires that researchers make additional assumptions about the characteristics of the primary and validation datasets. Carroll et al. (2006) warn that transportability may not be satisfied when the validation data are drawn from external sources. They emphasize that validation data are ideally drawn from a random subsample of the primary data. Bound et al. (2001) point out that measurement error in survey data often varies with the context of the survey, which is potentially an issue when the validation data are drawn from an external source. Bound et al. (2001) also note that transportability requires that the primary and validation data are representative of the same population. As in previous work on obesity, we use datasets that are weighted to be nationally representative, which implies that the distribution of b, FF(bb), does not vary across samples. In the next section, we will use this implication to demonstrate that transportability is not satisfied when using the standard approach. The rest of this section compares the standard validation approach used by Cawley (2002, 2004) and our proposed alternative. In section 2.1, we focus on the assumptions required for the standard approach to satisfy transportability, and argue that they are not likely to hold. In section 2.2, we propose an alternative surrogate that satisfies the transportability condition under weaker assumptions. In contrast to the standard approach, the method we develop is robust to differences in misreporting across samples. 6
10 2.1 The Standard Validation Method Consider the regression of some dependent variable y on b and other covariates, but assume we only observe bb PP in the primary data set. Following the previous literature on obesity, we would estimate using the validation sample, and then use bb = ηη bb VV + εε (1) bb = ηη bb PP in place of b as an independent variable in our primary sample. 8 This approach assumes that bb jj is a surrogate for bb, and that it is transportable. In this case, transportability is satisfied under the assumption that EE bb bb PP = EE bb bb VV. 9 This assumption is violated if measurement error in bb jj varies across samples, which is likely when NHANES data are treated as a validation sample for data from telephone surveys. As we noted above, respondents are more likely to misreport their height and weight in telephone surveys than in in-person surveys and misreport to a greater extent. 2.2 An Alternative Method Based on Percentile Rank Fortunately, the theory supporting the use of validation data does not require us to directly use the reported measures, bb jj, when correcting for measurement error in b. Any surrogate for bb that satisfies transportability can be used. 8 In Cawley (2004) and other papers in the obesity literature, the dependent variable is actually regressed on a nonlinear function of the predicted values, BMI. As we discuss later, L&S argue that it would be preferable to predict the nonlinear function directly. 9 This is consistent with the weaker form of transportability used by L&S. 7
11 As before, we assume that the bb jj are surrogates for b. Following the previous literature, bb jj are functions of bb and a random error term that is not correlated with yy. 10 This implies that the percentile rank of bb jj, given by the distribution function GG jj (bb jj ), is a function of b and the same random error. Therefore, GG jj (bb jj ) is also a surrogate for the true value, b, satisfying C1. Our approach uses the percentile rank of the report, bb jj, to generate predicted values of b. The advantage of this approach is that it requires a much weaker assumption about the relationship between bb jj and the true values, b. Specifically, we assume: A1. The expected value of the true measure conditional on the reported value is monotonically increasing in the reported value; i.e., bb > bb, implies that EE(bb bb ) > E(bb bb ). 11 In other words, A1 says that, given any two people who report their weight, the person who reports the higher weight is expected to actually weigh more. Assumption A1 is unaffected by differences in measurement error across samples, as long as reported values still allow a relevant (expected) ranking of respondents in each sample. Furthermore, if A1 does not hold, then it is not clear to us that respondent reports convey any useful information about actual height and weight. Finally, note that the monotonicity described by A1 is testable in the validation sample but not in the primary samples Following equation (1), bb vv = ηη 1 (bb εε), where ηη 1 (. ) describes how reported values differ from what respondents believe the actual measure is. Although εε is not correlated with yy, it could be correlated with bb. 11 This is akin to the assumptions made in the principal-agent literature to allow the use of the first-order approach to solving maximization programs (see Milgrom, 1981, and Rogerson, 1985). A sufficient, but not necessary, condition for this assumption is the first-order stochastic dominance of FF(bb bb ) over FF(bb bb ). 12 We test A1 for each race and gender group in NHANES using nonparametric regressions of actual height and weight on their reported values. We find no statistically significant violations of monotonicity in any case. 8
12 Now consider the unconditional distribution of true values, FF(bb). 13 Both FF(bb) and GG jj (bb jj ) are continuous, monotonically increasing functions with ranges in the interval [0, 1]. This implies that for every value of bb jj there is a bb such that FF(bb) = GG jj (bb jj ). In general, bb bb jj ; however, taking the inverse of FF( ), we have: bb = FF 1 (GG jj (bb jj )), which maps reported values into the true values of bb. Note that FF 1 ( ) does not depend on whether the reported values, bb jj, are drawn from the primary or auxiliary sample. It simply takes the percentile rank associated with a reported value in sample jj and returns the actual value that has the same position in the distribution of true values. As a result, FF bb GG VV (bb VV ) = FF bb GG PP (bb PP ). This implies that the percentile ranks, GG jj (bb jj ), satisfy transportability, even when the reported values do not. Therefore, the percentile rank approach satisfies both of the conditions required for the use of validation data. 3 Data and the Transportability of Self-Reported Measures This section begins with a brief introduction to the data sets we use in our analysis. We then demonstrate that self-reported height and weight do not satisfy transportability between these data sets. 13 FF( ) does not vary between datasets when the datasets are both representative samples of the same population. 9
13 3.1 Three Data Sets We draw our primary datasets from two sources, the Behavioral Risk Factor Surveillance System (BRFSS) and the American Time Use Survey (ATUS). The BRFSS is a telephone survey conducted by the Centers for Disease Control in conjunction with state health departments. It focuses on health and risky behaviors, but also contains a variety of demographic information. The primary advantage of the BRFSS for obesity studies is its size. With over 300,000 respondents per year in the later waves, the BRFSS is large enough to compute reliable statelevel descriptive statistics. Additionally, the large sample size makes it popular among economists seeking to identify causal effects using inherently inefficient estimation techniques such as instrumental variables. The ATUS was designed to measure how people spend their time rather than to study health outcomes. It is a telephone survey that asks respondents to sequentially report what they did on the day prior to the interview. In addition to the time diary, the ATUS collects demographic information about respondents and members of the respondent s household, and employment status information for the respondent and the respondent s spouse. In 2006, 2007, and 2008, the U.S. Department of Agriculture s Economic Research Service (ERS) sponsored Eating and Health Modules that collected information about the respondent s health, including weight and height, and additional information on time spent eating and drinking. Following the previous literature, our external validation data are drawn from the National Health and Nutrition Examination Survey (NHANES). NHANES is collected by the Centers for Disease Control and Prevention with the goal of assessing the health status and behaviors of children and adults in the United States. While BRFSS and ATUS only include selfreported measures of height and weight, respondents in NHANES were measured and weighed 10
14 after they were asked to report height and weight. We use data on race, gender, and age from the demographic background files of the wave; reported values of height and weight from the Weight History questionnaire; and measures of actual height and weight from the physical examination. For the sake of consistency, we restrict the samples from all three data sets to 2007 and We also focus on respondents between the ages of 19 and 64 who identify as Caucasian, African-American or any other racial or ethnic group. 14 All estimation uses weights to ensure that each sample is representative of the same population. Table 1 presents basic summary statistics for the three datasets. Even with all race and gender groups pooled together, average reported weight is higher in the NHANES (180 lbs) sample than either BRFSS (178.6) or ATUS (178). Average actual weight, on the other hand, is roughly two pounds heavier for the full NHANES sample. The demographic variables in Table 1 are very similar across samples, which is consistent with the samples being representative of the same populations. The one notable exception is that black respondents appear to be underrepresented in the BRFSS. Such differences may point to shortcomings in the sample weights used; however, any shortcomings in our sample weights would affect both of the correction methods we compare. 15 Therefore, we ignore this difference in the work that follows. 14 All respondents who identify as Hispanic are included in the other category. We did not divide this category further due to the sample size in NHANES. For the sake of convenience, we refer to these groups as though they are defined by race, even though that is not strictly correct. 15 Additionally, our point can also be demonstrated using only data from race and gender groups that appear to be equally represented across samples. 11
15 3.2 The Transportability of Self-Reported Height and Weight The most relevant difference between the samples is that respondents in the BRFSS and ATUS are surveyed by telephone, while respondents in the NHANES are interviewed in person with reason to believe they will be weighed and measured. 16 It seems natural to expect misreporting to be more severe in telephone surveys than in surveys conducted in person prior to a medical examination. Pinkston (2013) points out that phone interviews in the NLSY cohorts are associated with lower reported weights for white women than in-person interviews, even though NLSY respondents have no reason to believe they will be measured in either case. Any such difference in misreporting, however, implies that EE bb bb PP EE bb bb VV when bb PP = bb VV and that the transportability condition does not hold when using the standard approach. Comparing differences in misreporting between our data sets is straightforward. We expect the distribution of actual height and weight to be the same in all three datasets because they are all representative samples from the same population. If the distributions of a reported value are not the same in two samples that have the same distribution of actual measures, the relationships between actual and reported measures are also not the same. Therefore, a simple comparison of reported height and weight across samples is sufficient to evaluate whether the key assumption of the standard approach holds. Figures 1A compare the densities of reported height and weight across samples for white, black and other women. Relative to white women in NHANES, white women in both BRFSS and ATUS report weights between 120 and 150 pounds more frequently and report higher weights less frequently. The comparison of reported weight produces a similar picture for women of other races. We only see a difference in the reported weights of black women in the 16 See Han et al. (2009) and the online documentation for NHANES. 12
16 upper half of their distributions; however, self-reported height appears more sensitive to context for black women than for white or other. Figures 1B provide analogous comparisons for men. Differences in reported weight are less pronounced for men than for women; but differences in height appear to be larger, especially for black and other men. In sharp contrast to the results for women, black men and men from other races appear more likely to report higher weights when interviewed on the phone than when interviewed in person. Tables 2A and B compare the self-reported measures in BRFSS and ATUS to those from NHANES. Each table presents averages of reported height and weight, followed by the medians, 75 th and 90 th percentiles. The final row of each table then presents nonparametric Kolmogorov- Smirnov tests for the equality of distributions between samples. In both tables, we see that women reported lower weights over the phone than in person, but this result is more consistent for black and white women than for women of other races. The differences in average reported weight appear to driven more by the upper tail for black and (to a lesser degree) other women than for white women. The differences in reported distributions are less pronounced for men. We only see differences in reported weight for black men and men of other races, and again they appear to report higher weights when they cannot be observed by the interviewer. There are small differences in reported height, but they are less obvious in the summary statistics than the kernel densities. The Kolmogorov-Smirnov tests reject the equality of at least some distributions for every race and gender group. The only cases in which we cannot reject the equality across samples of 13
17 either measure are for white and black men in BRFSS compared to NHANES; however, even then we can reject the equality of reported BMI distributions (not shown) for black men. Overall, these results strongly suggest that the key assumption of the standard approach does not hold, and that NHANES data cannot be reliably used as validation data for the BRFSS and the ATUS when using the standard approach. Finally, it is worth noting that some differences in the results for BRFSS and ATUS may be expected. Although both are conducted over the telephone, they have very different focuses. The differences in the reported height of black men in ATUS and BRFSS (Figure 1B), for example, could be caused by something as simple as differences in the preceding questions or in the surveys introductions. 4 Comparing Methods for Predicting BMI The standard method used by Cawley (2002, 2004) to correct BMI for measurement error involves regressing actual height and weight in NHANES on respondents reported values, and then predicting the actual measures in the primary dataset. Specifically, for each race and gender category, we regress actual height (or weight) on cubic polynomials in age and reported height (weight). We then predict actual height and weight, and use those values to calculate predicted BMI L&S argue that constructing a nonlinear function of mismeasured variables from predicted values of those variables may provide a useful approximation, but predicting the nonlinear function directly is preferable. In the case of BMI, this means that researchers who are interested in BMI should predict BMI directly instead of constructing it from predicted height and weight; however, we find that the mean squared error associated with the prediction of BMI is higher in NHANES when BMI is predicted directly than when it is constructed from predicted height and weight. Furthermore, predicting height and weight is more consistent with the previous obesity literature. Therefore, we do not follow the advice of L&S in this particular case. 14
18 The estimation used in our method is similar, but uses the percentile rank of the reports and a more flexible functional form. Consistent with the fact that percentile ranks are (roughly) distributed uniformly between zero and one, we found that regressing the actual measures on simple polynomials of the percentile ranks resulted in predicted values in NHANES that were poor fits for the actual measures. 18 For that reason, we regress the actual measures on cubic b- splines in the percentile rank of reported values. 19 Figures 2A through 2F compare kernel densities of predicted BMI using our percentilerank method to predictions using the standard validation approach for each race and gender group. Each figure contains four graphs, one for each prediction method and primary data set. Each graph compares predicted BMI from a primary data set to the analogous prediction from NHANES, as well as actual BMI from NHANES. At the bottom of each figure, we include results for Kolmogorov-Smirnov tests of the differences observed in each graph. Figure 2A shows that the standard method can produce values of predicted BMI that differ significantly between samples. These differences follow the differences between samples in reported weight, and the Kolmogorov-Smirnov tests strongly reject the hypothesis that the standard method produces predicted values in ATUS or BRFSS that are equal to those in NHANES. Again, this suggests that the standard method is inappropriate in our context. In contrast, the density functions of BMI predicted using the percentile rank method are very similar across samples. The density of predicted BMI in ATUS is almost indistinguishable from the analogous density in NHANES. The Kolmogorov-Smirnov tests both have p-values 18 The distributions of percentile ranks differ from uniform distributions because reported values of height and weight have clustering at certain numbers (e.g., intervals of five pounds). 19 The details of our estimation are included in the Appendix. 15
19 over 0.8, providing no reason to doubt that the density functions of predicted BMI are the same across samples when our method is used. The results for black women (Figure 2C) and women of other races (2E) are similar to those for white women. The densities of predicted BMI using our approach are noticeably closer to the corresponding densities in NHANES, which makes them more similar to actual BMI in NHANES (and presumably the national population). Kolmogorov-Smirnov tests again reject the equality of the standard method across data sets, but fail to reject our approach. The results for men are less striking than the results for women, but still support our approach. The density functions for white men (Figure 2B) appear more similar when the percentile method is used than when the standard method is used, but testing the equality of distributions suggests that none of these differences are statistically significant. Although the graphs of kernel densities for black men do not tell an obvious story, the K-S tests reject the standard approach and fail to reject our percentile method. 20 Finally, the standard method is rejected for men of other races when we compare the ATUS to NHANES, and the percentile method again produces predictions of BMI that are more consistent across contexts. As a robustness check, we also tested for differences in the density functions of predicted BMI between the ATUS and BRFSS (not shown). We would not expect our percentile correction to produce different distributions between the two primary samples, and we find no evidence that it does. On the other hand, we find statistically significant differences for men and women of 20 Regardless of method, the BMI of black men appears to be more difficult to predict that the BMI of other groups. This is appears to be due to errors in the prediction of height for black men. 16
20 other races in these surveys when the standard correction is used, which suggests that differences in context that are less obvious than mode of collection may affect misreporting Do These Differences Matter? The results of sections 3 and 4 strongly suggest that using the relationship between reported and actual height and weight in the NHANES to predict BMI in data from the ATUS or BRSS is inappropriate. Furthermore, the alternative we propose appears to work well in practice, producing predictions of BMI that are consistent across random samples of the same population. In this section we provide results that demonstrate the potential importance of our adjustment to empirical work. 5.1 Effects of BMI Correction on Regression Estimates This section is intended to illustrate the impact our adjustment might have on empirical work that uses BMI or obesity in regressions. For both the BRFSS and ATUS, we consider one case where BMI or obesity is an explanatory variable and one case where it is the dependent variable. We report the results both for the full sample and for each race gender subgroup. None of the estimates presented in this section consider endogeneity or any other complications researchers might encounter. These results are presented for demonstration purposes only. To assist with the interpretation of results, Table 3 presents average BMI and percentages overweight, obese (BMI 30), and class II/III obese (BMI 35) by correction method and race gender group for both the BRFSS and ATUS samples. Averages for the actual measures from NHANES are included for comparison. 21 Kolmogorov-Smirnov tests reject the equality of distributions of BMI predicted using the standard correction with p-values less than or equal to for other women and men. No other test suggests a statistically significant difference in predicted values between any ATUS and BRFSS subsamples. 17
21 In the full sample of either dataset, correcting for measurement error increases average body mass, and the effects are most pronounced for the upper tail of the distributions. Roughly 10.5% of population reports a BMI of 35 or higher. Applying the standard correction raises this to 12.5%. Applying our percentile-based correction produces estimates of nearly 14%, which is consistent with the rate of class II/III obesity using measured height and weight from NHANES. The patterns seen in the full sample are seen to some degree in most of the race and gender groups, but they are most pronounced for white women. The average reported BMI for this group is The standard correction increases average BMI to 27.6, and our correction increases it further to 28.2, which is the same as the average actual BMI from NHANES. The differences in the correction methods are larger at the upper tails of the distribution. For example, the overall obesity rate based on uncorrected reports is 25.5%. The standard correction increases the rate to 30%, and our correction increases it further to 32.7%. The actual rate from NHANES is 33.8%. Thus our correction still slightly underestimates the obesity rate for white women, but it does significantly better than the standard approach. Looking at class II/III obesity, the rate is under 11% when self-reported measures are used, just over 13% using the standard correction, and around 16% using our percentile-based correction, which again is lower than the actual rate from NHANES (17.3%). Black men are the most obvious exception to the pattern seen in the full sample. The average self-reported BMI in both the BRFSS and the ATUS samples is nearly indistinguishable from average measured BMI in NHANES for black men. Furthermore, while black men appear to under-report obesity and class II/III obesity slightly, the incidence of self-reported overweight status is higher than the actual incidence for black men. 18
22 5.1.1 BRFSS: Food Prices and BMI For our first empirical example, we use the BRFSS to evaluate the relationship between state-level food prices and BMI. Table 4 reports coefficient estimates of interest from OLS regressions of BMI on food price and other basic control variables, as well as probit estimates (presented as average marginal effects) of the effects of food prices on the probabilities of being obese or class II/III obese. In each case, results are presented with no adjustment, adjustment using the standard approach, and then adjustment using our percentile rank method. The control variables include race (dummies for non-hispanic black and non-hispanic white), education (dummies for some high school, high school, some college, and four-year college degree or greater), marital status (dummies for married, divorced, and widowed), age, inflation-adjusted household income, and a dummy for whether the year was The state food price measure is computed from city-level data from the Council for Community and Economic Research (formerly American Chamber of Commerce Researchers Association) Cost of Living Index. 22 The sample average food price is $2.56, so a one-unit increase in food price represents approximately a 40% increase relative to the mean. The results presented in Table 4 suggest that neither the standard correction nor our correction affect the conclusion that higher food prices are associated with lower body mass; however, the choice of correction method has potentially important implications for the magnitudes of coefficients. For the full sample and for most subgroups, the standard correction leads to larger magnitudes than no correction, while our correction leads to even larger magnitudes than the standard correction. This is consistent with the aforementioned result that 22 Following Chou et al. (2004), for each city we average over the prices of each grocery food item, weighting by the C2ER shares of each item s importance in the basket of goods. We then define state prices as the populationweighted average of the prices in the state s C2ER markets. Prices are in 2008 dollars. 19
23 measurement error in self-reported weight and height serves to compress the BMI distribution. The more measurement error is eliminated, the more stretched out the BMI distribution becomes. In other words, the smaller the measurement error, the larger the change in BMI that is associated with a given change in food prices. For the 0-1 variables, this stretching out of the distribution increases the number of lower-bmi individuals (i.e. those closer to the cutoff) that are categorized as obese or class II/III obese. It is therefore not surprising that our correction, which purges the most measurement error, would lead to larger magnitudes than the standard correction, which purges some measurement error, which in turn leads to larger magnitudes than using no correction. More specifically, consider the whole-sample regressions. The effect of food price on BMI using our percentile rank correction is 23% larger ( compared to ) than that using no correction, and 9% larger ( compared to ) than that using the standard levels-based correction. For obesity, the estimated effect using our approach is 20% larger than with no correction, and 3.4% larger than with the standard correction. The differences are most striking, however, for class II/III obesity. The estimates with our correction are 64% and 28% larger than those using no correction and the standard correction, respectively. The finding that mitigating measurement error matters most for class II/III obesity makes sense in light of the aforementioned results from the literature that the extent of misreporting of both weight and height increases as weight increases (Rowland, 1990; Cawley, 2002). In other words, correcting measurement error leads to the largest increases in BMI among the right tail of the distribution, where the Class II/III obesity cutoff lies. Accurately estimating effects on class II/III obesity is vital, as a recent meta-analysis has shown that an increased risk of mortality from high BMI does not begin until crossing the class 20
24 II/III obesity threshold (Flegal et al., 2013). To illustrate, suppose we are interested in predicting lives saved from a calorie tax that raises the price of the food basket by $1. Obesity is estimated to cause 112,000 deaths per year (Flegal et al., 2005), and Flegal et al. s (2013) results suggest it is reasonable to attribute all of the premature mortality from obesity to class II/III obesity. The class II/III obesity rate in the NHANES is 14.4%. Therefore, using the estimate with our correction of a $1 increase in food prices would reduce class II/III obesity by 28.5%, compared to 22.2% using the standard correction s estimate of and 17.4% using the estimate with no correction of Multiplying these numbers by the annual deaths from obesity, the estimated lives saved from the hypothetical policy are 31,889 using our correction, compared to 24,889 using the standard correction and 19,444 with no correction. Therefore, the chosen correction method can lead to important differences in policy implications, even if the general conclusions about sign and statistical significance are unaffected. Turning to the subsamples, we observe the same general pattern of the magnitudes increasing as measurement error is purged for all groups except black women, black men, and men of a race other than white or black. Even for these three groups, however, our correction still leads to the largest magnitudes for class II/III obesity substantially larger magnitudes for black women and other men. For BMI, our correction increases the food price effect most substantially relative to the standard correction for other men (14% larger estimated food price effect), black women (14% larger), and white women (13%). For obesity, we observe the largest percentage increases in magnitudes using our correction as opposed to the standard correction for black women (30%) and white women (11%). Importantly, for class II/III obesity our correction increases the estimated food price effect by over 20% relative to the standard correction for all 21
25 groups except men. The largest changes are among other men (44%), white women (41%), and black women (37%) ATUS: Food Prices and BMI Table 5 is analogous to Table 4, but presents estimated effects of food prices on body mass using data from the ATUS. Overall, the results are very similar, but the standard errors are larger in Table 5 due to the smaller sample size. Looking at the entire sample, the estimated effect of food prices on BMI is smallest when reported BMI is used and largest when our rankbased correction is used. Furthermore, correcting for measurement error appears to have the largest effect when we consider class II/III obesity. The estimated effect of an increase in food prices on the probability of class II/III obesity is 29% larger with the standard correction than with reported values ( versus ), and 22% larger with our correction than with the standard correction ( versus ). Looking within race and gender groups, the results for white women again show that correcting for measurement error results in larger estimated effects of prices on body mass. The estimated effects of food prices on BMI fall for black men as we correct for measurement error, which is consistent with black men reporting themselves as overweight more often than they are BRFSS: BMI and Diabetes We next turn to an examination of the implications of our percentile rank correction in regressions with a weight-related independent variable. For the BRFSS, we consider a question of broad interest to epidemiologists and health policy researchers: the impact of obesity on diabetes. We estimate probit models with a dummy for whether the individual has ever been diagnosed with diabetes as the dependent variable; either BMI, obese, or class II/III obese as the 22
26 independent variable of interest; and the same set of controls as our preceding BRFSS analysis in Section Average marginal effects of BMI, obesity, and class II/III obesity on P(Diabetes) are reported in Table 6. In all regressions, the association between BMI, obesity, or class II/III obesity and diabetes is positive and statistically significant, so the correction method again does not influence the general conclusions. However, important differences again emerge in the magnitudes. In most regressions, the standard correction leads to smaller magnitudes than no correction, while our correction leads to even smaller magnitudes than the standard correction. This is the opposite of the pattern observed when the weight-related variable was the outcome, and is again consistent with the observation that measurement error in self-reported weight and height compresses the BMI distribution. Correcting measurement error leads to a larger change in BMI being associated with a given change in diabetes, and therefore a smaller coefficient estimate when BMI is an explanatory variable. Turning to the more specific results for the full sample, the most interesting observation is that the corrections have only a minimal effect on the estimated relationship between BMI and diabetes, but more substantial effects on the estimates for obesity and class II/III obesity. Being obese is estimated to increase P(Diabetes) by 6.9 percentage points using no correction, 6.5 percentage points using the standard levels correction, and 6.2 percentage points using our percentile-rank correction. Our correction therefore leads to a 10% smaller magnitude than no correction, and a 5% smaller magnitude than the standard correction. For most subsamples, we observe the same pattern of the estimated effects of obesity and severe obesity on P(diabetes) decreasing with the extent of the measurement error purged. The most notable exceptions are for black men, but they are also the only group for which the 23
27 incidence of class II/III obesity appears to be lower when our correction is used than it is when the standard correction is used. In the BMI regressions, our correction makes the biggest difference for black women (10% smaller magnitude than no correction, 8% smaller magnitude than the standard correction). In the obesity and class II/III obesity regressions, our correction is most consequential for white women. The estimated effect of obesity on P(diabetes) using our correction is 14% smaller than using no correction, and 7% smaller than using the standard correction. For class II/III obesity, these numbers are 10% and 6%, respectively. It is not surprising that the correction is important for white women since they are the group among which underreported weight is the most common ATUS: BMI and Disability The results in Table 7 provide another example of how correcting for measurement error can affect estimates that use a measure of body mass as an independent variable. In this case, we use data from the ATUS to consider effects of BMI, obesity and class II/III obesity on the probability of being out of labor force due to disability. 23 The results in Table 7 are average marginal effects from probit models that use the same controls as previous regressions in the section. As in the case of diabetes, adjusting for measurement error does not affect the basic conclusion that body mass is positively associated with disability, but it does reduce the estimated effects. The average marginal effect of obesity on disability falls by 26%, from (0.005) to (0.004), when the standard correction is applied; and by 32%, to (0.004) when our percentile correction is used. The difference between our correction and the standard correction is more pronounced when we consider the effects of class II/III obesity. The estimated 23 This variable equals one if the respondent reported being out of the labor force due to disability in either the ATUS or the CPS. Its mean (standard deviation) is (0.2297). We acknowledge that this is variable is not an ideal measure of disability; however, it is still useful for the purpose of our demonstration. 24
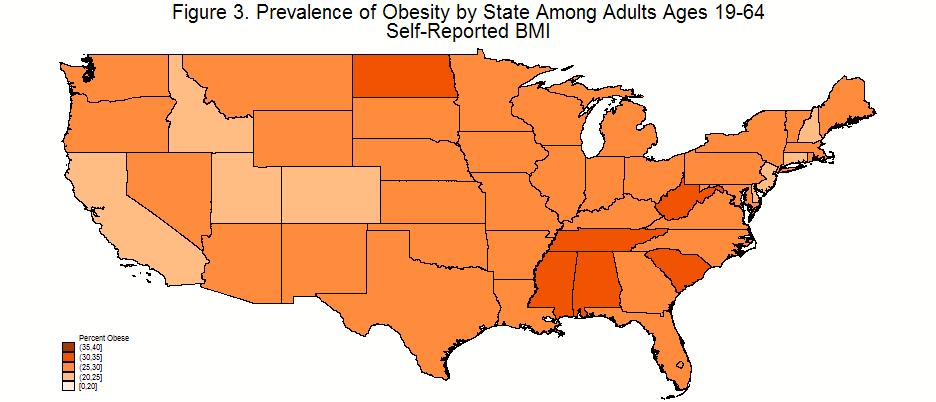
28 effects fall by 22% when our correction is used, but by only 6% when the standard correction is used. The results, therefore, are again consistent with measurement error compressing the upper tail of the BMI distribution and resulting in fewer people being classified as obese or class II/III obese. The patterns of effects for most race and gender groups are similar to those for the entire sample. The results for white women again mirror those for the full sample most closely; however the results for black women may be the most striking. The average marginal effect of class II/III obesity on the probability a black woman is disabled falls by nearly 26% when the standard correction is applied, but by more than half when our percentile rank correction is used. 5.2 Obesity Maps Finally, we demonstrate the effect of measurement error correction on the estimated prevalence of obesity in the United States. Figure 3 is inspired by the well-known obesity maps produced by the CDC using data from BFRSS. 24 Figure 4 is similar to Figure 3, but we use the standard validation method to correct for measurement error before calculating the prevalence of obesity. Finally, Figure 5 shows the map after our percentile rank method has been used. These three figures demonstrate that correcting for measurement error can have dramatic effects on the estimated prevalence of obesity. Our percentile rank correction has a larger effect than the standard validation approach because the standard approach is biased by the measurement error it aims to correct. Looking at the nation as a whole, we find that 27.3% of the population reports being obese, 30.8% are found to be obese using the standard correction, and 33.3% are found to be obese using the correction we propose. 24 There are a couple minor differences between our maps and those produced by the CDC. While the CDC map considers all states and uses data on all adults, we focus on adults between the ages of 19 and 64 in the continental United States. We also pool data from 2007 and 2008 into one map instead of creating separate maps for each year. 25
29 Table 8 summarizes the pattern of obesity prevalence in Figures 4-5. When no correction is made, the obesity rates for most states (34) are higher than 25 percent and less than or equal to 30 percent, while no state has an obesity rate over 35 percent. With the standard correction, most states (29) fall into the percent range and three fall into the percent range. Using our correction, the modal obesity rate still falls into the percent range, but now 15 states have obesity rates in the percent range. Furthermore, we find at least a quarter of the adult population in every state is obese when our correction is applied. It is also interesting to look at the number of states that move to a higher interval of obesity prevalence when we correct for measurement error. When using the standard correction, 36 states move to the next highest prevalence interval, while 12 states do not change ranges. Using our approach, no state remains in the same prevalence interval and 14 move up two intervals, which is consistent with a median increase in the prevalence of obesity (not shown) of just over six percentage points. Effects of correcting for measurement error also vary by state. The largest absolute increases in prevalence when our correction is applied are in West Virginia and Iowa (7.5 and 7.1 percentage points, respectively). The smallest increases, 5.0 and 5.2 points, are in New York and Rhode Island. As a percent of reported obesity prevalence, estimated prevalence increased the most (by over 27 percent) in Delaware and Utah, and the least (around 17.4 percent) in Mississippi and South Carolina. Finally, the corrections increase the variance between states (not shown) from 5.88 to 6.21 with the standard correction and 6.53 with our correction. 26
30 6 Conclusion Since Cawley (2002, 2004) it has been common in the economics-of-obesity literature to correct for measurement error in self-reported height and weight by using data from the NHANES as an external validation sample for the authors primary data. The standard approach is to regress actual height and weight on reported height and weight using NHANES data, and use the estimated coefficients to predict height and weight in the primary dataset. This approach relies on the assumption that the misreporting of height and weight is the same in both surveys, even though one survey is followed by a physical examination and (in most cases) the other survey interviews respondents by telephone. We propose an alternative approach that requires much weaker assumptions about the data and is robust to differences in measurement error between samples. Specifically, we assume that if person A says she weighs more than an otherwise similar person B, the conditional expectation of A s actual weight is higher than B s. We show that, if this assumption holds, the relationship between the percentile rank of a respondent s reported height and weight and her actual height and weight will be the same in both samples, even if misreporting is more severe in one sample than the other. If this assumption does not hold, then it is not clear what we can learn from selfreported height and weight. Our approach replaces the reported measures used in the standard approach, which are surrogates for the actual measures, with surrogates that are more likely to be transportable across datasets. We use the percentile ranks of reported values, as opposed to the reported values themselves, to predict actual height and weight. Our regressions use functional forms of the percentile ranks that are more flexible than the polynomials that are traditionally used with selfreported values, but our approach is otherwise similar to the standard approach. The result is a 27
31 correction for measurement error that is more robust than the standard approach, while still being easy to implement. To illustrate the value of our correction, we compare data from the NHANES and two nationally representative telephone surveys, the BRFSS and the ATUS. First, we compare reported values of height and weight within race and gender subsamples of each dataset to demonstrate that misreporting does vary by context. We find that misreporting appears to be more sensitive to context among groups (e.g., white women) that are more prone to misreporting. When we compare predictions of BMI using the standard approach and our percentile-rank approach, we find that the standard approach predicts statistically significant differences in the distribution of BMI across samples that are representative of the same populations, and those differences reflect the differences in reported values. We find no evidence of such differences between samples when BMI is predicted using our alternative method. In other words, our results confirm that the standard approach is biased by differences in misreporting between samples, while our approach is not. We also consider how corrections for misreported height and weight might matter in future empirical work. We find that the estimated prevalence of obesity and class II/III obesity is higher when our rank-based correction is used than when either the standard correction or no correction is used. Next, we present examples of regression estimates with body mass as a dependent and an independent variable. In each of these examples, we find differences in coefficient estimates that are consistent with measurement error compressing the upper tail of the distribution. The differences in coefficient estimates between our correction and the standard correction are often similar in size to the differences in estimates between the standard correction and uncorrected 28
32 reports. These differences are often economically significant and could affect the conclusions researchers and policymakers draw. There are a few caveats we wish to discuss. First of all, we must acknowledge that an internal validation sample, drawn at random from the primary data, should be preferred to an external validation sample, even when our correction is used. The rank-based correction we propose allows the use of an external validation sample under weaker assumptions than the standard approach does, but it still requires more assumptions than an internal validation sample would. In many cases, however, an internal validation study is not feasible. More broadly, our work should be seen as a warning (or reminder) that the misreporting of height and weight is sensitive to the context of the survey. The differences in context between the NHANES and the BRFSS or NLSY cohorts, for example, are relatively obvious but still sometimes forgotten. It is also possible that context varies in ways that affect misreporting even within a given survey. For example, there is no reason to assume that misreporting in a survey that spans decades, such as BRFSS, has remained constant over time because social norms may have changed as waistlines expanded. Additionally, some surveys, such as the NLSY, mix telephone interviews with in-person interviews, which can cause differences in misreporting between interviews with the same respondent. 25 As a final note, we must emphasize that body mass is not the same as body composition. As discussed by Burkhauser and Cawley (2008) and others, body fat percentage or other measures of adiposity may be preferable to BMI in many applications. Unfortunately, measures of body composition are rarely available in large datasets because, like actual weight and height, 25 As mentioned above, Pinkston (2013) notes that white women in the NLSY97 claim to weigh less in years when they are interviewed by phone than in years when they are interviewed in person. 29
33 they are more expensive to collect than self-reported weight and height. Therefore, the widespread use of self-reported BMI is likely to continue in the future, and measurement error will continue to be a problem as long as self-reported BMI is used. 30
34 References Baum, Charles. The effects of cigarette costs on BMI and obesity, Health Economics 18, no. 1 (2009): Baum, Charles. Effects of food stamps on obesity, Southern Economic Journal 77, no. 3 (2011): Baum, Charles and Christopher Ruhm. Age, socioeconomic status and obesity growth, Journal of Health Economics 28, no. 3 (2009): Bound, John, Charles Brown, and Nancy Mathiowetz. Measurement error in survey data. Handbook of econometrics 5 (2001): Burkhauser, Richard and John Cawley. Beyond BMI: The value of more accurate measures of fatness and obesity in social science research. Journal of Health Economics 27, no. 2 (2008): Burkhauser, Richard, John Cawley, and Maximilian Schmeiser. The timing of the rise in U.S. obesity varies with measure of fatness. Economics and Human Biology 7, no. 3 (2009): Carroll, Raymond J, David Ruppert, Leonard A Stefanski, Ciprian M Crainiceanu. Measurement Error in Nonlinear Models: a Modern Perspective, 2 nd edition. (2006) Chapman & Hall, Boca Raton, FL. Cawley, John. Addiction and the consumption of calories: Implications for obesity. Unpublished manuscript (2002), Cornell University. Cawley, John. The impact of obesity on wages. Journal of Human Resources 39, no. 2 (2004): Cawley, John and Sheldon Danzinger. Morbid obesity and the transition from welfare to work. Journal of Policy Analysis and Management 24, no. 4 (2005): Cawley, John, John Moran, and Kosali Simon. The impact of income on the weight of elderly Americans. Health Economics 19, no. 8 (2010): Chou, Shin-Yi, Michael Grossman, and Henry Saffer. An economic analysis of adult obesity: Results from the Behavioral Risk Factor Surveillance System. Journal of Health Economics 23, no. 3 (2004): Courtemanche, Charles, Garth Heutel, and Patrick McAlvanah. Impatience, incentives, and obesity. Economic Journal (forthcoming). Eid, J., H. Overman, D. Puga, and M. Turner. Fat city: Questioning the relationship between urban sprawl and obesity. Journal of Urban Economics 63, no. 2 (2008), Fan, Maoyang. Do food stamps contribute to obesity in low-income women? Evidence from the National Longitudinal Survey of Youth 1979, American Journal of Agricultural Economics 92, no. 4 (2010), Flegal, Katherine, M. Carroll, R. Kuczmarski, C. Johnson. Overweight and obesity in the United States: prevalence and trends, , International Journal of Obesity Related Metabolic Disorders 22, no. 1 (1998):
35 Flegal, Katherine, Barry Graubard, David Williamson, and Mitchell Gail. Excess deaths associated with underweight, overweight, and obesity, Journal of the American Medical Association 293, no. 15 (2005): Flegal, Katherine, Brian Kit, Heather Orpana, and Barry Graubard. Association of All-Cause Mortality with Overweight and Obesity using Standard Body Mass Index Categories: A Systematic Review and Meta-Analysis. Journal of the American Medical Association 309, no. 1 (2013): Goldman, Dana, Darius Lakdawalla, and Yuhui Zheng. Food prices and the dynamics of body weight in Economic Aspects of Obesity, Grossman, Michael and Naci Mocan eds., Chicago, IL (2011): University of Chicago Press. Gregory, Christian. Wages, BMI, and Age. Unpublished manuscript (2010), United States Department of Agriculture Economic Research Service. Gregory, Christian and Christopher Ruhm. Where does the wage penalty bite? in Economic Aspects of Obesity, Grossman, Michael and Naci Mocan eds., Chicago, IL (2011): University of Chicago Press. Han, Euna, Edward C. Norton, Sally C. Stearns. Weight and wages: fat versus lean paychecks. Health Economics, 18, no. 5 (2009): Lakdawalla, Darius and Tomas Philipson. The growth of obesity and technological change: A theoretical and empirical investigation. National Bureau of Economic Research Working Paper No (2002). Lee, Lung-fei, and Jungsywan H. Sepanski. Estimation of linear and nonlinear errors-in-variables models using validation data. Journal of the American Statistical Association 90, no. 429 (1995): Majumder, Md. Alauddin. Does obesity matter for wages? Evidence from the United States. Economic Papers 32, no. 2 (2013): Ogden, C.L. and M.D. Carroll. Prevalence of Overweight, Obesity, and Extreme Obesity Among Adults: United States, Trends Through , National Center for Health Statistics report. (2010) Pinkston, Joshua C. (2013) The Dynamic Effects of Obesity on the Wages of Young Workers. University of Louisiville, mimeo. Plantinga, Andrew and Stephanie Bernell. The association between urban sprawl and obesity: Is it a twoway street? Journal of Regional Science 47, no. 5 (2007): Rowland, M.L. Self-reported weight and height. American Journal of Clinical Nutrition 52, no. 6 (1990): Ruhm, Christopher. Healthy Living in Hard Times. Journal of Health Economics 24, no. 2 (2005): Schmeiser, Maximilian. Expanding wallets and waistlines: The impact of family income on the BMI of women and men eligible for the earned income tax credit. Health Economics 18, no. 11 (2009):
36 Appendix: How to Use Our Percentile-Based Correction Although our percentile-based approach may sound more complicated to implement than the standard approach, we want to assure the reader that the added complication is trivial. Our approach adds two simple steps to the standard approach. Each of those two steps requires one line of code in Stata. First, we find the percentile rank of the reported measure in the relevant subsample. This is easily done in Stata using the cumul command by dataset, race or ethnic group, and gender. Using reported weight as an example, we would have: bysort dataset race sex: cumul reported_weight [aw= samp_wt], g(wt_rank) equal where wt_rank is the newly created percentile rank in the distribution of reported_weight for the subsample determined by the indicators dataset, race and sex. Actual weight must then be regressed on a flexible function of wt_rank, and a polynomial in age. We found that simple polynomials in wt_rank were not flexible enough to predict actual weight, and used cubic basis splines in wt_rank instead. The second step our method adds to the standard approach generates the splines with the user-written command bspline. 1 For example, bspline, xvar(wt_rank) p(3) gen(wt_spline) knots(0,.05,.1,.25,.5,.75,.9,.95, 1) where wt_spline is the prefix of the generated splines. 2 From this point on, our approach closely resembles the standard approach. Our splines simply replace the polynomial in reported weight that previous authors have used: 1 The command bspline was written by Roger Newson. Documentation and code can be found here: 2 The number and spacing of knots can be adjusted as needed to improve the fit of the predicted values. 33
37 reg actual_weight (i.race##i.sex)##(c.age##c.age##c.age c.wt_spline*) [aw=samp_wt], nocons Weight is predicted in both the validation sample, which contains actual_weight, and the primary sample. Finally, the process can be repeated for height, allowing a predicted BMI measure to be constructed. 3 3 Alternatively, BMI itself could be predicted directly following the same approach. 34
38 Table 1. Summary Statistics by Dataset BRFSS ATUS NHANES Reported Height (4.18) (4.10) (4.08) Reported Weight (44.67) (43.60) (45.15) Actual Height (3.88) Actual Weight (47.18) White (0.466) (0.463) (0.469) Black (0.303) (0.318) (0.323) Other Race/Ethnicity (0.412) (0.397) (0.405) Male (0.500) (0.500) (0.500) Age (12.48) (12.54) (12.67) Observations 17, ,072 4,113 Notes: Standard deviations are in parentheses. All samples weighted to be representive of adults in the US between the ages of 19 and 64 in the years 2007 and "Other Race/Ethnicity" includes all respondents who indentify as Hispanic. 35
39 Table 2A. Comparison of Self-Reported Values: BRFSS vs. NHANES Weight Height Weight Height Weight Height Weight Height Weight Height Weight Percentiles of Distribution Kolmogorov-Smirnov Mean Median 75th 90th Test (p-value) White Women NHANES BRFSS NHANES BRFSS White Men NHANES BRFSS NHANES BRFSS Black Women NHANES BRFSS NHANES BRFSS Black Men NHANES BRFSS NHANES BRFSS Other Women NHANES BRFSS NHANES BRFSS Other Men NHANES BRFSS NHANES Height <0.001 BRFSS Notes: All samples weighted to be representative of adults in the US between the ages of 19 and 64 in the years 2007 and "Other" includes all respondents who identify as Hispanic. 36
40 Table 2B. Comparison of Self-Reported Values: ATUS vs. NHANES Weight Height Weight Height Weight Height Weight Height Weight Height Weight Percentiles of Distribution Kolmogorov-Smirnov Mean Median 75th 90th Test (p-value) White Women NHANES ATUS NHANES ATUS White Men NHANES ATUS NHANES ATUS Black Women NHANES ATUS NHANES ATUS Black Men NHANES ATUS NHANES ATUS Other Women NHANES ATUS NHANES ATUS Other Men NHANES ATUS NHANES Height ATUS Notes: All samples weighted to be representative of adults in the US between the ages of 19 and 64 in the years 2007 and "Other" includes all respondents who identify as Hispanic. 37
41 Table 3. Average Body Mass by Correction Method and Race/Gender Group from BRFSS and ATUS, Compared to Actual Measures from NHANES BMI Overweight Obese Class II/III Obese Reported Standard Percentile Reported Standard Percentile Reported Standard Percentile Reported Standard Percentile Method Method Method Method Method Method Method Method Full Sample % 33.6% 14.4% BRFSS % 65.9% 67.2% 28.0% 31.4% 33.0% 10.5% 12.5% 13.8% ATUS % 66.2% 67.4% 28.5% 31.7% 33.0% 10.7% 12.5% 13.9% White Women % 33.8% 17.3% BRFSS % 57.9% 60.8% 25.5% 30.0% 32.7% 10.8% 13.3% 15.8% ATUS % 58.0% 61.0% 25.6% 30.2% 32.6% 10.9% 13.2% 16.0% White Men % 31.3% 10.2% BRFSS % 71.8% 72.0% 27.9% 30.8% 31.8% 9.1% 10.9% 11.0% ATUS % 72.2% 72.0% 28.2% 30.7% 31.8% 9.0% 10.8% 10.9% Black Women % 48.1% 28.7% BRFSS % 76.6% 78.9% 42.2% 46.0% 47.6% 22.0% 24.9% 28.2% ATUS % 76.9% 79.5% 42.5% 45.8% 47.8% 21.0% 23.1% 28.2% Black Men % 35.9% 14.0% BRFSS % 68.4% 67.0% 33.5% 35.5% 36.1% 12.0% 14.6% 13.6% ATUS % 68.8% 66.5% 33.7% 36.1% 35.1% 12.8% 14.6% 13.5% Other Women % 35.1% 15.7% BRFSS % 60.8% 63.5% 27.5% 30.7% 32.7% 10.4% 12.1% 14.7% ATUS % 57.8% 62.9% 27.3% 30.1% 31.8% 10.3% 11.9% 14.4% Other Men % 29.1% 9.6% BRFSS % 69.5% 68.9% 26.5% 29.1% 29.7% 7.9% 8.8% 9.0% ATUS % 71.8% 69.4% 28.6% 30.9% 30.2% 8.5% 9.2% 9.1% Notes: Actual measures from NHANES are underlined and in italics. All samples weighted to be representive of adults in the US between the ages of 19 and
42 Table 4. BRFSS Estimated Effects of Food Prices on BMI, P(Obese), and P(Class II/III Obese) by Race-Gender Group and BMI Correction Method Reported Whole Sample (0.170)*** White Women (0.216)*** White Men (0.191)** Black Women (0.368)** Black Men (0.229)*** Other Women (0.321)*** BMI Obese Class II/III Obese Standard Percentile Standard Percentile Standard Percentile Reported Reported Method Method Method Method Method Method (0.187)*** (0.189)*** (0.010)*** (0.011)*** (0.012)*** (0.007)*** (0.009)*** (0.010)*** (0.218)*** (0.193)** (0.362)** (0.258)*** (0.301)*** (0.226)*** (0.208)** (0.401)** (0.276)*** (0.334)*** (0.012)*** (0.015)** (0.029) (0.019)*** (0.022)*** (0.012)*** (0.015)** (0.033) (0.022)*** (0.026)*** (0.013)*** (0.015)*** (0.029) (0.019)*** (0.025)*** (0.008)*** (0.011) (0.017)*** (0.011)*** (0.010)*** (0.008)*** (0.010) (0.018)*** (0.014)*** (0.013)*** (0.009)*** (0.011) (0.021)*** (0.011)*** (0.013)*** Other Men (0.286)** (0.355)** (0.364)*** (0.017)** (0.021)*** (0.019)*** (0.011)** (0.014)** (0.020)** Notes: All cells report estimated effects of $1 increase in state food price basket in the corresponding regression; the average food price is $2.56. Average marginal effects are reported in the probit regressions for obesity and Class II/III obesity. Standard errors, heteroskedasticity-robust and clustered by state, are in parentheses. *** indicates statistically significant at 1% level; ** 5% level; * 10% level. The regressions include control variables for race, education, marital status, age, inflation-adjusted household income, and a dummy for whether the year was The BRFSS sampling weights are used. 39
43 Table 5. ATUS Estimated Effects of Food Prices on BMI, P(Obese), and P(Class II/III Obese) by Race-Gender Group and BMI Correction Method BMI Obesity Class II/III Obesity Reported Standard Percentile Standard Percentile Standard Percentile Reported Reported Method Method Method Method Method Method Whole Sample *** *** *** *** *** *** *** *** *** (0.182) (0.192) (0.207) (0.015) (0.018) (0.016) (0.008) (0.007) (0.011) White Women *** *** *** ** *** *** ** ** (0.376) (0.391) (0.408) (0.024) (0.024) (0.026) (0.018) (0.016) (0.021) White Men * ** ** * * (0.430) (0.458) (0.487) (0.036) (0.043) (0.041) (0.012) (0.016) (0.014) Black Women (1.079) (1.169) (1.294) (0.071) (0.082) (0.088) (0.052) (0.046) (0.067) Black Men ** ** ** * ** (0.521) (0.558) (0.536) (0.067) (0.065) (0.040) (0.027) (0.039) (0.029) Other Women ** *** (0.658) (0.671) (0.677) (0.040) (0.057) (0.064) (0.014) (0.017) (0.021) Other Men *** *** *** *** ** *** ** ** (0.692) (0.690) (0.683) (0.049) (0.049) (0.045) (0.034) (0.035) (0.032) Notes: All cells report estimated effects of $1 increase in state food price basket in the corresponding regression; the average food price is $2.56. Average marginal effects are reported in the probit regressions for obesity and Class II/III obesity. Standard errors, heteroskedasticity-robust and clustered by state, are in parentheses. *** indicates statistically significant at 1% level; ** 5% level; * 10% level. The regressions include control variables for race, education, marital status, age, inflation-adjusted household income, and a dummy for whether the year was The ATUS sampling weights are used. 40
44 Table 6 BRFSS Estimated Effects of BMI, Obesity, and Class II/III obesity on P(Diabetes) by Race-Gender Group and BMI Correction Method Reported Whole Sample (0.0001)*** BMI Obese Class II/III Obese Standard Percentile Standard Percentile Standard Percentile Reported Reported Method Method Method Method Method Method (0.0001)*** (0.0001)*** (0.002)*** (0.003)*** (0.002)*** (0.005)*** (0.005)*** (0.004)*** White Women (0.0001)*** (0.0001)*** (0.0001)*** (0.002)*** (0.002)*** (0.002)*** (0.003)*** (0.003)*** (0.003)*** White Men (0.0002)*** (0.0002)*** (0.0002)*** (0.003)*** (0.002)*** (0.002)*** (0.004)*** (0.004)*** (0.004)*** Black Women (0.0002)*** (0.0002)*** (0.0002)*** (0.004)*** (0.004)*** (0.004)*** (0.007)*** (0.007)*** (0.006)*** Black Men (0.0005)*** (0.0004)*** (0.0004)*** (0.008)*** (0.008)*** (0.009)*** (0.013)*** (0.015)*** (0.013)*** Other Women (0.0002)*** (0.0002)*** (0.0003)*** (0.007)*** (0.006)*** (0.006)*** (0.013)*** (0.012)*** (0.010)*** Other Men (0.0004)*** (0.0004)*** (0.0005)*** (0.005)*** (0.006)*** (0.005)*** (0.017)*** (0.021)*** (0.017)*** Notes: All regressions are probits; the cells report average marginal effects of BMI and average effects of a switch from 0 to 1 in obesity and Class II/III obesity status. The dependent variable is a dummy for ever being diagnosed with diabetes; its sample mean is Standard errors, heteroskedasticity-robust and clustered by state, are in parentheses. *** indicates statistically significant at 1% level; ** 5% level; * 10% level. The regressions include control variables for race (dummies for non-hispanic black and non-hispanic white), education (dummies for some high school but no degree, high school degree but no further, some college but no degree, and four-year college degree or greater), marital status (dummies for married, divorced, and widowed), age, inflation-adjusted household income, and a dummy for whether the year was The BRFSS sampling weights are used. 41
45 Table 7. ATUS Estimated Effects of BMI, Obesity, and Class II/III Obesity on P(Disabled) by Race-Gender Group and BMI Correction Method BMI Obesity Class II/III Obesity Reported Standard Percentile Standard Percentile Standard Percentile Reported Reported Method Method Method Method Method Method Whole Sample *** *** *** *** *** *** *** *** *** (0.0003) (0.0003) (0.0002) (0.0045) (0.0041) (0.0041) (0.0042) (0.0041) (0.0037) White Women *** *** *** *** *** *** *** *** *** (0.0005) (0.0005) (0.0005) (0.0078) (0.0076) (0.0078) (0.0093) (0.0090) (0.0081) White Men ** * * (0.0008) (0.0007) (0.0006) (0.0072) (0.0068) (0.0067) (0.0081) (0.0084) (0.0080) Black Women *** *** *** *** *** ** (0.0011) (0.0010) (0.0009) (0.0201) (0.0174) (0.0152) (0.0184) (0.0156) (0.0148) Black Men * ** ** ** (0.0032) (0.0028) (0.0025) (0.0373) (0.0290) (0.0269) (0.0316) (0.0394) (0.0301) Other Women *** *** *** *** *** *** *** *** *** (0.0004) (0.0005) (0.0005) (0.0069) (0.0067) (0.0073) (0.0111) (0.0105) (0.0100) Other Men ** *** *** *** *** *** *** *** *** (0.0008) (0.0008) (0.0007) (0.0077) (0.0072) (0.0070) (0.0117) (0.0099) (0.0127) Notes: All regressions are probits; the cells report average marginal effects of BMI and average effects of a switch from 0 to 1 in obesity and Class II/III obesity status. The dependent variable is a dummy for being out of labor market due to disability. Standard errors, heteroskedasticity-robust and clustered by state, are in parentheses. *** indicates statistically significant at 1% level; ** 5% level; * 10% level. The regressions include control variables for race (dummies for non-hispanic black and non-hispanic white), education (dummies for some high school but no degree, high school degree but no further, some college but no degree, and four-year college degree or greater), marital status (dummies for married, divorced, and widowed), age, inflation-adjusted household income, and a dummy for whether the year was The ATUS sampling weights are used. 42
46 Table 8: Summary of State-Level Obesity Prevalence Results Reported Obesity Standard Correction Number of States in Each Range of Obesity Prevalence 20-25% % % % Percentile Correction Number of States Moving to a Higher Prevalence Category, Relative to Reported Prevalence No Change Up 1 Category Up 2 Categories Notes: This table summarizes results presented in Figures 3, 4 and 5. The data are from the 2007 and 2008 BRFSS. Observations are limited to the 48 states in the continental U.S. 43
47 44
48 45
49 Kolmogorov-Smirnov Tests (p-values) for Equality of Density Functions Standard Method Percentile Method ATUS vs. NHANES BRFSS vs. NHANES
50 Kolmogorov-Smirnov Tests (p-values) for Equality of Density Functions Standard Method Percentile Method ATUS vs. NHANES BRFSS vs. NHANES
51 Kolmogorov-Smirnov Tests (p-values) for Equality of Density Functions Standard Method Percentile Method ATUS vs. NHANES BRFSS vs. NHANES
52 Kolmogorov-Smirnov Tests (p-values) for Equality of Density Functions Standard Method Percentile Method ATUS vs. NHANES BRFSS vs. NHANES
53 Kolmogorov-Smirnov Tests (p-values) for Equality of Density Functions Standard Method Percentile Method ATUS vs. NHANES BRFSS vs. NHANES
54 Kolmogorov-Smirnov Tests (p-values) for Equality of Density Functions Standard Method Percentile Method ATUS vs. NHANES BRFSS vs. NHANES
55 52
Following in Your Father s Footsteps: A Note on the Intergenerational Transmission of Income between Twin Fathers and their Sons
 D I S C U S S I O N P A P E R S E R I E S IZA DP No. 5990 Following in Your Father s Footsteps: A Note on the Intergenerational Transmission of Income between Twin Fathers and their Sons Vikesh Amin Petter
An Experimental Test of a Search Model under Ambiguity
 DISCUSSION PAPER SERIES IZA DP No. 7933 An Experimental Test of a Search Model under Ambiguity Takao Asano Hiroko Okudaira Masaru Sasaki January 2014 Forschungsinstitut zur Zukunft der Arbeit Institute
Preliminary Draft. The Effect of Exercise on Earnings: Evidence from the NLSY
 Preliminary Draft The Effect of Exercise on Earnings: Evidence from the NLSY Vasilios D. Kosteas Cleveland State University 2121 Euclid Avenue, RT 1707 Cleveland, OH 44115-2214 b.kosteas@csuohio.edu Tel:
A Multilevel Approach to Model Weight Gain: Evidence from NLSY79 Panel
 A Multilevel Approach to Model Weight Gain: Evidence from NLSY79 Panel Bidisha Mandal Washington State University bmandal@wsu.edu Obesity Trends* Among U.S. Adults BRFSS, 1985 (*BMI 30, or ~ 30 lbs. overweight
Food Labels and Weight Loss:
 Food Labels and Weight Loss: Evidence from the National Longitudinal Survey of Youth Bidisha Mandal Washington State University AAEA 08, Orlando Motivation Who reads nutrition labels? Any link with body
The Dynamic Effects of Obesity on the Wages of Young Workers
 The Dynamic Effects of Obesity on the Wages of Young Workers Joshua C. Pinkston University of Louisville June, 2015 Contributions 1. Focus on more recent cohort, NLSY97. Obesity
The Effects of Food Stamps on Obesity
 DEPARTMENT OF ECONOMICS AND FINANCE WORKING PAPER SERIES February 2010 The Effects of Food Stamps on Obesity Charles L. Baum II * Middle Tennessee State University, Murfreesboro, TN Abstract Poverty has
Baum, Charles L. and Ruhm, Christopher J. Age, Socioeconomic Status and Obesity Growth Journal of Health Economics, 2009
 Age, socioeconomic status and obesity growth By: Charles L. Baum II, Christopher J. Ruhm Baum, Charles L. and Ruhm, Christopher J. Age, Socioeconomic Status and Obesity Growth Journal of Health Economics,
Health Behaviors and Education in Turkey
 DISCUSSION PAPER SERIES IZA DP No. 8262 Health Behaviors and Education in Turkey Aysit Tansel Deniz Karaoglan June 2014 Forschungsinstitut zur Zukunft der Arbeit Institute for the Study of Labor Health
Looking Toward State Health Assessment.
 CONNECTICUT DEPARTMENT OF PUBLIC HEALTH Policy, Planning and Analysis. Looking Toward 2000 - State Health Assessment. Table of Contents Glossary Maps Appendices Publications Public Health Code PP&A Main
The Economics of Obesity
 The Economics of Obesity John Cawley Cornell University Usefulness of Economics in Studying Obesity Offers widely-accepted theoretical framework for human behavior (constrained maximization) We ask different
Economics of obesity
 Economics of obesity Chris Auld Economics 317 March 30, 2011 References. This lecture does not draw on the textbook. See Philipson and Posner (2008) Is the obesity epidemic a public health problem? A decade
EXAMINING THE EDUCATION GRADIENT IN CHRONIC ILLNESS
 EXAMINING THE EDUCATION GRADIENT IN CHRONIC ILLNESS PINKA CHATTERJI, HEESOO JOO, AND KAJAL LAHIRI Department of Economics, University at Albany: SUNY February 6, 2012 This research was supported by the
NBER WORKING PAPER SERIES THE HETEROGENEITY OF THE CIGARETTE PRICE EFFECT ON BODY MASS INDEX. George Wehby Charles J. Courtemanche
 NBER WORKING PAPER SERIES THE HETEROGENEITY OF THE CIGARETTE PRICE EFFECT ON BODY MASS INDEX George Wehby Charles J. Courtemanche Working Paper 18087 http://www.nber.org/papers/w18087 NATIONAL BUREAU OF
The Dynamic Effects of Obesity on the Wages of Young Workers
 The Dynamic Effects of Obesity on the Wages of Young Workers Joshua C. Pinkston University of Louisville May 8, 2015 Abstract This paper considers effects of body mass on wages in the years following labor
Citation for published version (APA): Ebbes, P. (2004). Latent instrumental variables: a new approach to solve for endogeneity s.n.
: Ebbes, P. (2004). Latent instrumental variables: a new approach to solve for endogeneity s.n.") University of Groningen Latent instrumental variables Ebbes, P. IMPORTANT NOTE: You are advised to consult the publisher's version (publisher's PDF) if you wish to cite from it. Please check the document
University of Groningen Latent instrumental variables Ebbes, P. IMPORTANT NOTE: You are advised to consult the publisher's version (publisher's PDF) if you wish to cite from it. Please check the document
Age, Socioeconomic Status and Obesity Growth. Charles L. Baum II Middle Tennessee State University (615)
") Age, Socioeconomic Status and Obesity Growth Charles L. Baum II Middle Tennessee State University cbaum@mtsu.edu (615) 898-2527 and Christopher J. Ruhm * University of North Carolina at Greensboro and
Age, Socioeconomic Status and Obesity Growth Charles L. Baum II Middle Tennessee State University cbaum@mtsu.edu (615) 898-2527 and Christopher J. Ruhm * University of North Carolina at Greensboro and
Preliminary Draft: Please do not cite or quote. Adult Eating Behaviors and Weight Status: A Time Use Analysis
 Preliminary Draft: Please do not cite or quote Adult Eating Behaviors and Weight Status: A Time Use Analysis Charlene M. Kalenkoski Ohio University Department of Economics Bentley Annex 351 Athens, OH
Research Parasites Are Beneficial for the Organism as a Whole: Competition between Researchers Creates a Symbiotic Relationship
 DISCUSSION PAPER SERIES IZA DP No. 9895 Research Parasites Are Beneficial for the Organism as a Whole: Competition between Researchers Creates a Symbiotic Relationship Benedikt Fecher Gert G. Wagner April
The Role of Relative BMI Across Racial and Ethnic Groups: Impacts on Happiness Within the United States
 Union College Union Digital Works Honors Theses Student Work 6-2013 The Role of Relative BMI Across Racial and Ethnic Groups: Impacts on Happiness Within the United States Colin Knox Union College - Schenectady,
NBER WORKING PAPER SERIES AGE, SOCIOECONOMIC STATUS AND OBESITY GROWTH. Charles L. Baum II Christopher J. Ruhm
 NBER WORKING PAPER SERIES AGE, SOCIOECONOMIC STATUS AND OBESITY GROWTH Charles L. Baum II Christopher J. Ruhm Working Paper 13289 http://www.nber.org/papers/w13289 NATIONAL BUREAU OF ECONOMIC RESEARCH
11/18/2013. Correlational Research. Correlational Designs. Why Use a Correlational Design? CORRELATIONAL RESEARCH STUDIES
 Correlational Research Correlational Designs Correlational research is used to describe the relationship between two or more naturally occurring variables. Is age related to political conservativism? Are
Meta-Analysis and Publication Bias: How Well Does the FAT-PET-PEESE Procedure Work?
 Meta-Analysis and Publication Bias: How Well Does the FAT-PET-PEESE Procedure Work? Nazila Alinaghi W. Robert Reed Department of Economics and Finance, University of Canterbury Abstract: This study uses
The Role of Income in Determining Leisure Time Exercise: A Cross-sectional Study. Abstract
 The Role of Income in Determining Leisure Time Exercise: A Cross-sectional Study José E. Laborde, Ph.D. * Abstract The obesity epidemic is increasingly dangerous to poor people and racial minorities. This
Community Health Profile: Minnesota, Wisconsin, & Michigan Tribal Communities 2006
 Community Health Profile: Minnesota, Wisconsin, & Michigan Tribal Communities 26 This report is produced by: The Great Lakes EpiCenter If you would like to reproduce any of the information contained in
Misreporting and misclassification: Implications for. socioeconomic disparities in body-mass index and obesity
 Working Paper 2012:19 Department of Economics School of Economics and Management Misreporting and Misclassification: Implications for Socioeconomic Disparities in Body-mass Index and Obesity Åsa Ljungvall
DOING SOCIOLOGICAL RESEARCH C H A P T E R 3
 DOING SOCIOLOGICAL RESEARCH C H A P T E R 3 THE RESEARCH PROCESS There are various methods that sociologists use to do research. All involve rigorous observation and careful analysis These methods include:
August 29, Introduction and Overview
 August 29, 2018 Introduction and Overview Why are we here? Haavelmo(1944): to become master of the happenings of real life. Theoretical models are necessary tools in our attempts to understand and explain
Practice for Exam 1 Econ B2000, MA Econometrics Kevin R Foster, CCNY Fall 2011
 Practice for Exam 1 Econ B2000, MA Econometrics Kevin R Foster, CCNY Fall 2011 Not all of these questions are strictly relevant; some might require a bit of knowledge that we haven't covered this year,
Food Stamps and Obesity: Ironic Twist or Complex Puzzle?
 Food Stamps and Obesity: Ironic Twist or Complex Puzzle? VOLUME 4 ISSUE 1 Michele Ver Ploeg Lisa Mancino Biing-Hwan Lin sverploeg@ers.usda.gov lmancino@ers.usda.gov blin@ers.usda.gov 32 USDA and Getty
Obesity in Cleveland Center for Health Promotion Research at Case Western Reserve University. Weight Classification of Clevelanders
 Obesity in Cleveland 2005-2006 March 2008 Report Contents Weight Classification of Clevelanders Local, State and National Trends in the Prevalence of Obesity Obesity by Demographic Characteristics Nutrition,
NBER WORKING PAPER SERIES THE EFFECT OF SMOKING ON OBESITY: EVIDENCE FROM A RANDOMIZED TRIAL. Charles Courtemanche Rusty Tchernis Benjamin Ukert
 NBER WORKING PAPER SERIES THE EFFECT OF SMOKING ON OBESITY: EVIDENCE FROM A RANDOMIZED TRIAL Charles Courtemanche Rusty Tchernis Benjamin Ukert Working Paper 21937 http://www.nber.org/papers/w21937 NATIONAL
Grazing, Goods and Girth: Determinants and Effects
 DISCUSSION PAPER SERIES IZA DP No. 4378 Grazing, Goods and Girth: Determinants and Effects Daniel Hamermesh August 2009 Forschungsinstitut zur Zukunft der Arbeit Institute for the Study of Labor Grazing,
Do Menu Labeling Laws Translate into Results? Impacts on Population Obesity and Diabetes
 Do Menu Labeling Laws Translate into Results? Impacts on Population Obesity and Diabetes Jacqueline Craig Charles C. Moul Gregory Niemesh Miami University Miami University Miami University May 2016 Abstract:
Supplementary Online Content
 Supplementary Online Content Holme Ø, Løberg M, Kalager M, et al. Effect of flexible sigmoidoscopy screening on colorectal cancer incidence and mortality: a randomized clinical trial. JAMA. doi:10.1001/jama.2014.8266
Americans See Weight Problems Everywhere But In the Mirror
 Americans See Weight Problems Everywhere But In the Mirror EMBARGOED FOR RELEASE APRIL 11, 2006 12:01AM EST Paul Taylor, Executive Vice President Cary Funk, Senior Project Director Peyton Craighill, Project
CASE STUDY 2: VOCATIONAL TRAINING FOR DISADVANTAGED YOUTH
 CASE STUDY 2: VOCATIONAL TRAINING FOR DISADVANTAGED YOUTH Why Randomize? This case study is based on Training Disadvantaged Youth in Latin America: Evidence from a Randomized Trial by Orazio Attanasio,
You Can Be Too Thin (But Not Too Tall): Social Desirability Bias in Self-Reports of Weight and Height
: Social Desirability Bias in Self-Reports of Weight and Height") No. 16-15 You Can Be Too Thin (But Not Too Tall): Social Desirability Bias in Self-Reports of Weight and Height Mary A. Burke and Katherine G. Carman Abstract Previous studies of survey data for the United
No. 16-15 You Can Be Too Thin (But Not Too Tall): Social Desirability Bias in Self-Reports of Weight and Height Mary A. Burke and Katherine G. Carman Abstract Previous studies of survey data for the United
Political Science 15, Winter 2014 Final Review
 Political Science 15, Winter 2014 Final Review The major topics covered in class are listed below. You should also take a look at the readings listed on the class website. Studying Politics Scientifically
The Effect of Smoking on Obesity: Evidence from a Randomized Trial. Charles Courtemanche Georgia State University and NBER
 W. J. Usery Workplace Research Group Paper Series Working Paper 2016-1-2 February 2016 The Effect of Smoking on Obesity: Evidence from a Randomized Trial Charles Courtemanche Georgia State University and
This PDF is a selection from a published volume from the National Bureau of Economic Research
 This PDF is a selection from a published volume from the National Bureau of Economic Research Volume Title: Economic Aspects of Obesity Volume Author/Editor: Michael Grossman and Naci H. Mocan, editors
Community Health Profile: Minnesota, Wisconsin & Michigan Tribal Communities 2005
 Community Health Profile: Minnesota, Wisconsin & Michigan Tribal Communities 25 This report is produced by: The Great Lakes EpiCenter If you would like to reproduce any of the information contained in
Write your identification number on each paper and cover sheet (the number stated in the upper right hand corner on your exam cover).
.") STOCKHOLM UNIVERSITY Department of Economics Course name: Empirical methods 2 Course code: EC2402 Examiner: Per Pettersson-Lidbom Number of credits: 7,5 credits Date of exam: Sunday 21 February 2010 Examination
STOCKHOLM UNIVERSITY Department of Economics Course name: Empirical methods 2 Course code: EC2402 Examiner: Per Pettersson-Lidbom Number of credits: 7,5 credits Date of exam: Sunday 21 February 2010 Examination
Rising cigarette prices and rising obesity: Coincidence or unintended consequence?
 Rising cigarette prices and rising obesity: Coincidence or unintended consequence? By: Charles Courtemanche Courtemanche, Charles. Rising Cigarette Prices and Rising Obesity: Coincidence or Unintended
P E R S P E C T I V E S
 PHOENIX CENTER FOR ADVANCED LEGAL & ECONOMIC PUBLIC POLICY STUDIES Revisiting Internet Use and Depression Among the Elderly George S. Ford, PhD June 7, 2013 Introduction Four years ago in a paper entitled
Lecture II: Difference in Difference. Causality is difficult to Show from cross
 Review Lecture II: Regression Discontinuity and Difference in Difference From Lecture I Causality is difficult to Show from cross sectional observational studies What caused what? X caused Y, Y caused
Motherhood and Female Labor Force Participation: Evidence from Infertility Shocks
 Motherhood and Female Labor Force Participation: Evidence from Infertility Shocks Jorge M. Agüero Univ. of California, Riverside jorge.aguero@ucr.edu Mindy S. Marks Univ. of California, Riverside mindy.marks@ucr.edu
Judy Kruger, PhD, MS, Deborah A. Galuska, PhD, MPH, Mary K. Serdula, MD, MPH, Deborah A. Jones, PhD
 Attempting to Lose Weight Specific Practices Among U.S. Adults Judy Kruger, PhD, MS, Deborah A. Galuska, PhD, MPH, Mary K. Serdula, MD, MPH, Deborah A. Jones, PhD Background: Methods: Results: Conclusions:
NBER WORKING PAPER SERIES THE GROWTH OF OBESITY AND TECHNOLOGICAL CHANGE: A THEORETICAL AND EMPIRICAL EXAMINATION. Darius Lakdawalla Tomas Philipson
 NBER WORKING PAPER SERIES THE GROWTH OF OBESITY AND TECHNOLOGICAL CHANGE: A THEORETICAL AND EMPIRICAL EXAMINATION Darius Lakdawalla Tomas Philipson Working Paper 8946 http://www.nber.org/papers/w8946 NATIONAL
Obesity and health care costs: Some overweight considerations
 Obesity and health care costs: Some overweight considerations Albert Kuo, Ted Lee, Querida Qiu, Geoffrey Wang May 14, 2015 Abstract This paper investigates obesity s impact on annual medical expenditures
CHAPTER ONE CORRELATION
 CHAPTER ONE CORRELATION 1.0 Introduction The first chapter focuses on the nature of statistical data of correlation. The aim of the series of exercises is to ensure the students are able to use SPSS to
Crime Victimisation and Subjective Well-Being: Panel Evidence from Australia
 DISCUSSION PAPER SERIES IZA DP No. 9253 Crime Victimisation and Subjective Well-Being: Panel Evidence from Australia Stéphane Mahuteau Rong Zhu August 2015 Forschungsinstitut zur Zukunft der Arbeit Institute
The impact of workplace smoking bans: results from a national survey
 272 Center for Economics Research, Research Triangle Institute, 3040 Cornwallis Rd, Research Triangle Park, North Carolina, USA M C Farrelly A E S Sfekas Department of Economics, University of Maryland,
Charitable Giving as a Gift Exchange: Evidence from a Field Experiment
 DISCUSSION PAPER SERIES IZA DP No. 1148 Charitable Giving as a Gift Exchange: Evidence from a Field Experiment Armin Falk May 2004 Forschungsinstitut zur Zukunft der Arbeit Institute for the Study of Labor
11/24/2017. Do not imply a cause-and-effect relationship
 Correlational research is used to describe the relationship between two or more naturally occurring variables. Is age related to political conservativism? Are highly extraverted people less afraid of rejection
Rapid decline of female genital circumcision in Egypt: An exploration of pathways. Jenny X. Liu 1 RAND Corporation. Sepideh Modrek Stanford University
 Rapid decline of female genital circumcision in Egypt: An exploration of pathways Jenny X. Liu 1 RAND Corporation Sepideh Modrek Stanford University This version: February 3, 2010 Abstract Egypt is currently
Fertility and its Consequence on Family Labour Supply
 DISCUSSION PAPER SERIES IZA DP No. 2162 Fertility and its Consequence on Family Labour Supply Jungho Kim Arnstein Aassve June 2006 Forschungsinstitut zur Zukunft der Arbeit Institute for the Study of Labor
Reading and maths skills at age 10 and earnings in later life: a brief analysis using the British Cohort Study
 Reading and maths skills at age 10 and earnings in later life: a brief analysis using the British Cohort Study CAYT Impact Study: REP03 Claire Crawford Jonathan Cribb The Centre for Analysis of Youth Transitions
Lecture II: Difference in Difference and Regression Discontinuity
 Review Lecture II: Difference in Difference and Regression Discontinuity it From Lecture I Causality is difficult to Show from cross sectional observational studies What caused what? X caused Y, Y caused
This slide set provides an overview of the impact of type 1 and type 2 diabetes mellitus in the United States, focusing on epidemiology, costs both
 This slide set provides an overview of the impact of type 1 and type 2 diabetes mellitus in the United States, focusing on epidemiology, costs both direct and indirect and the projected burden of diabetes,
SELECTED FACTORS LEADING TO THE TRANSMISSION OF FEMALE GENITAL MUTILATION ACROSS GENERATIONS: QUANTITATIVE ANALYSIS FOR SIX AFRICAN COUNTRIES
 Public Disclosure Authorized Public Disclosure Authorized Public Disclosure Authorized Public Disclosure Authorized ENDING VIOLENCE AGAINST WOMEN AND GIRLS SELECTED FACTORS LEADING TO THE TRANSMISSION
A SILVER LINING? THE CONNECTION BETWEEN GASOLINE PRICES AND OBESITY
 A SILVER LINING? THE CONNECTION BETWEEN GASOLINE PRICES AND OBESITY By: Charles Courtemanche Courtemanche, Charles (2009) A Silver Lining? The Connection Between Gasoline Prices and Obesity. Economic Inquiry.
Time as an Ingredient in Meal Production and Consumption
 Time as an Ingredient in Meal Production and Consumption Department of Economics Working Paper Series Jonathan Woodward University of North Carolina at Greensboro July 2011 Working Paper 11-12 www.uncg.edu/bae/econ/
1 Online Appendix for Rise and Shine: The Effect of School Start Times on Academic Performance from Childhood through Puberty
 1 Online Appendix for Rise and Shine: The Effect of School Start Times on Academic Performance from Childhood through Puberty 1.1 Robustness checks for mover definition Our identifying variation comes
PLS 506 Mark T. Imperial, Ph.D. Lecture Notes: Reliability & Validity
 PLS 506 Mark T. Imperial, Ph.D. Lecture Notes: Reliability & Validity Measurement & Variables - Initial step is to conceptualize and clarify the concepts embedded in a hypothesis or research question with
Baseline Health Data Report: Cambria and Somerset Counties, Pennsylvania
 Baseline Health Data Report: Cambria and Somerset Counties, Pennsylvania 2017 2018 Page 1 Table of Contents Executive Summary.4 Demographic and Economic Characteristics 6 Race and Ethnicity (US Census,
Sample selection in the WCGDS: Analysing the impact for employment analyses Nicola Branson
 LMIP pre-colloquium Workshop 2016 Sample selection in the WCGDS: Analysing the impact for employment analyses Nicola Branson 1 Aims Examine non-response in the WCGDS in detail in order to: Document procedures
CHOICES The magazine of food, farm and resource issues
 CHOICES The magazine of food, farm and resource issues Fall 2004 A publication of the American Agricultural Economics Association Obesity: Economic Dimensions of a Super Size Problem Maria L. Loureiro
The Growth of Obesity and Technological Change: A Theoretical and Empirical Examination *
 The Growth of Obesity and Technological Change: A Theoretical and Empirical Examination * Darius Lakdawalla RAND 1700 Main Street Santa Monica, CA 90407 darius@rand.org Tomas Philipson Irving B Harris
From the Center for Human Nutrition, Department of International Health, Johns Hopkins Bloomberg School of Public Health, Baltimore, MD.
 Epidemiologic Reviews Copyright ª 2007 by the Johns Hopkins Bloomberg School of Public Health All rights reserved; printed in U.S.A. Vol. 29, 2007 DOI: 10.1093/epirev/mxm007 Advance Access publication
Technical Specifications
 Technical Specifications In order to provide summary information across a set of exercises, all tests must employ some form of scoring models. The most familiar of these scoring models is the one typically
Americans Current Views on Smoking 2013: An AARP Bulletin Survey
 Americans Current Views on Smoking 2013: An AARP Bulletin Survey November 2013 Americans Current Views on Smoking 2013: An AARP Bulletin Survey Report Prepared by Al Hollenbeck, Ph.D. Copyright 2013 AARP
2017 Community Health Needs Assessment Report
 2017 Community Health Needs Assessment Report, Florida Prepared for: By: Professional Research Consultants, Inc. 11326 P Street Omaha, NE 68137-2316 www.prccustomresearch.com 2017-0313-02 June 2017 Table
Systematic measurement error in selfreported health: is anchoring vignettes the way out?
 Dasgupta IZA Journal of Development and Migration (2018) 8:12 DOI 10.1186/s40176-018-0120-z IZA Journal of Development and Migration ORIGINAL ARTICLE Systematic measurement error in selfreported health:
The Impact of Alcohol Consumption on Occupational Attainment in England
 DISCUSSION PAPER SERIES IZA DP No. 166 The Impact of Alcohol Consumption on Occupational Attainment in England Ziggy MacDonald Michael A. Shields June 2000 Forschungsinstitut zur Zukunft der Arbeit Institute
David V. McQueen. BRFSS Surveillance General Atlanta - Rome 2006
 David V. McQueen Associate Director for Global Health Promotion, National Center for Chronic Disease Prevention and Health Promotion, Atlanta BRFSS Surveillance General Atlanta - Rome 2006 Behavioral Risk
Analysis A step in the research process that involves describing and then making inferences based on a set of data.
 1 Appendix 1:. Definitions of important terms. Additionality The difference between the value of an outcome after the implementation of a policy, and its value in a counterfactual scenario in which the
Maintaining Healthy Weight in Childhood: The influence of Biology, Development and Psychology
 Maintaining Healthy Weight in Childhood: The influence of Biology, Development and Psychology Maintaining a Healthy Weight in Biology Development Psychology Childhood And a word about the Toxic Environment
NBER WORKING PAPER SERIES HEALTH DISPARITIES ACROSS EDUCATION: THE ROLE OF DIFFERENTIAL REPORTING ERROR. John Cawley Anna Choi
 NBER WORKING PAPER SERIES HEALTH DISPARITIES ACROSS EDUCATION: THE ROLE OF DIFFERENTIAL REPORTING ERROR John Cawley Anna Choi Working Paper 21317 http://www.nber.org/papers/w21317 NATIONAL BUREAU OF ECONOMIC
MEA DISCUSSION PAPERS
 Inference Problems under a Special Form of Heteroskedasticity Helmut Farbmacher, Heinrich Kögel 03-2015 MEA DISCUSSION PAPERS mea Amalienstr. 33_D-80799 Munich_Phone+49 89 38602-355_Fax +49 89 38602-390_www.mea.mpisoc.mpg.de
NBER WORKING PAPER SERIES AN ECONOMIC ANALYSIS OF ADULT OBESITY: RESULTS FROM THE BEHAVIORAL RISK FACTOR SURVEILLANCE SYSTEM
 NBER WORKING PAPER SERIES AN ECONOMIC ANALYSIS OF ADULT OBESITY: RESULTS FROM THE BEHAVIORAL RISK FACTOR SURVEILLANCE SYSTEM Shin-Yi Chou Michael Grossman Henry Saffer Working Paper 9247 http://www.nber.org/papers/w9247
Regression Discontinuity Analysis
 Regression Discontinuity Analysis A researcher wants to determine whether tutoring underachieving middle school students improves their math grades. Another wonders whether providing financial aid to low-income
Dichotomizing partial compliance and increased participant burden in factorial designs: the performance of four noncompliance methods
 Merrill and McClure Trials (2015) 16:523 DOI 1186/s13063-015-1044-z TRIALS RESEARCH Open Access Dichotomizing partial compliance and increased participant burden in factorial designs: the performance of
A New Look at Lake Wobegon: Who s in Your Canoe?
 AEA Papers and Proceedings 2018, 108: 312 316 https://doi.org/10.1257/pandp.20181055 A New Look at Lake Wobegon: Who s in Your Canoe? By Chris Bollinger, Tisha L. N. Emerson, Linda English, and Gail M.
Childhood Obesity in Dutchess County 2004 Dutchess County Department of Health & Dutchess County Children s Services Council
 Childhood Obesity in Dutchess County 2004 Dutchess County Department of Health & Dutchess County Children s Services Council Prepared by: Saberi Rana Ali, MBBS, MS, MPH Dutchess County Department of Health
Introduction to statistics Dr Alvin Vista, ACER Bangkok, 14-18, Sept. 2015
 Analysing and Understanding Learning Assessment for Evidence-based Policy Making Introduction to statistics Dr Alvin Vista, ACER Bangkok, 14-18, Sept. 2015 Australian Council for Educational Research Structure
Section 6: Analysing Relationships Between Variables
 6. 1 Analysing Relationships Between Variables Section 6: Analysing Relationships Between Variables Choosing a Technique The Crosstabs Procedure The Chi Square Test The Means Procedure The Correlations
MULTIPLE LINEAR REGRESSION 24.1 INTRODUCTION AND OBJECTIVES OBJECTIVES
 24 MULTIPLE LINEAR REGRESSION 24.1 INTRODUCTION AND OBJECTIVES In the previous chapter, simple linear regression was used when you have one independent variable and one dependent variable. This chapter
I. Introduction and Data Collection B. Sampling. 1. Bias. In this section Bias Random Sampling Sampling Error
 I. Introduction and Data Collection B. Sampling In this section Bias Random Sampling Sampling Error 1. Bias Bias a prejudice in one direction (this occurs when the sample is selected in such a way that
Effects of Civil Society Involvement on Popular Legitimacy of Global Environmental Governance
 Effects of Civil Society Involvement on Popular Legitimacy of Global Environmental Governance Thomas Bernauer and Robert Gampfer Global Environmental Change 23(2) Supplementary Content Treatment materials
Research Article Prevalence and Trends of Adult Obesity in the US,
 ISRN Obesity, Article ID 185132, 6 pages http://dx.doi.org/.1155/14/185132 Research Article Prevalence and Trends of Adult Obesity in the US, 1999 12 Ruopeng An CollegeofAppliedHealthSciences,UniversityofIllinoisatUrbana-Champaign,GeorgeHuffHallRoom13,16South4thStreet,
EMPIRICAL STRATEGIES IN LABOUR ECONOMICS
 EMPIRICAL STRATEGIES IN LABOUR ECONOMICS University of Minho J. Angrist NIPE Summer School June 2009 This course covers core econometric ideas and widely used empirical modeling strategies. The main theoretical
Does Male Education Affect Fertility? Evidence from Mali
 Does Male Education Affect Fertility? Evidence from Mali Raphael Godefroy (University of Montreal) Joshua Lewis (University of Montreal) April 6, 2018 Abstract This paper studies how school access affects
Unit 1 Exploring and Understanding Data
 Unit 1 Exploring and Understanding Data Area Principle Bar Chart Boxplot Conditional Distribution Dotplot Empirical Rule Five Number Summary Frequency Distribution Frequency Polygon Histogram Interquartile
A NON-TECHNICAL INTRODUCTION TO REGRESSIONS. David Romer. University of California, Berkeley. January Copyright 2018 by David Romer
 A NON-TECHNICAL INTRODUCTION TO REGRESSIONS David Romer University of California, Berkeley January 2018 Copyright 2018 by David Romer CONTENTS Preface ii I Introduction 1 II Ordinary Least Squares Regression
Everyday Problem Solving and Instrumental Activities of Daily Living: Support for Domain Specificity
 Behav. Sci. 2013, 3, 170 191; doi:10.3390/bs3010170 Article OPEN ACCESS behavioral sciences ISSN 2076-328X www.mdpi.com/journal/behavsci Everyday Problem Solving and Instrumental Activities of Daily Living:
Overweight and Obesity Rates Among Upstate New York Adults
 T H E F A C T S A B O U T Overweight and Obesity Rates Among Upstate New York Adults Upstate New York Obesity Rate: 27.5% Overweight Rate: 35.5% Increase in the combined overweight/ obesity rate from 2003
Healthy Montgomery Obesity Work Group Montgomery County Obesity Profile July 19, 2012
 Healthy Montgomery Obesity Work Group Montgomery County Obesity Profile July 19, 2012 Prepared by: Rachel Simpson, BS Colleen Ryan Smith, MPH Ruth Martin, MPH, MBA Hawa Barry, BS Executive Summary Over
Data and Statistics 101: Key Concepts in the Collection, Analysis, and Application of Child Welfare Data
 TECHNICAL REPORT Data and Statistics 101: Key Concepts in the Collection, Analysis, and Application of Child Welfare Data CONTENTS Executive Summary...1 Introduction...2 Overview of Data Analysis Concepts...2
Beer Purchasing Behavior, Dietary Quality, and Health Outcomes among U.S. Adults
 Beer Purchasing Behavior, Dietary Quality, and Health Outcomes among U.S. Adults Richard Volpe (California Polytechnical University, San Luis Obispo, USA) Research in health, epidemiology, and nutrition