Kentucky Traumatic Brain & Spinal Cord Injury Surveillance Project
|
|
|
- Henry Lyons
- 5 years ago
- Views:
Transcription

1 Kentucky Traumatic Brain & Spinal Cord Injury Surveillance Project Fiscal Year 2007 Final Report 1 July 2007 This project is located at the Kentucky Injury Prevention and Research Center, University of Kentucky, and funded by the Kentucky Traumatic Brain Injury Trust Fund
2 FOR MORE INFORMATION This report was prepared by Michael Singleton, Huifang Qin and Shannon Beaven of the Kentucky Injury Prevention and Research Center (Director: Dr. Julia Costich), with funding from the Kentucky Traumatic Brain Injury Trust Fund Board. Data requests, questions, or other correspondence should be directed to the address/phone numbers below. Address: 333 Waller Avenue, Suite 202 Lexington, KY Telephone: (859) Fax: (859)
3 FIGURES AND TABLES Figures Page 1. Distribution of TBI among databases Number of TBI cases by county Age-adjusted incidence rate of TBI by county Number of cases listed in Tennessee TBI registry for Kentucky residents, by county Distribution of ABI among databases Number of ABI cases by county Age-adjusted incidence rate of ABI by county Distribution of SCI cases among databases Mechanism of injury for self-pay TBI Mechanism of injury for TBI having Commercial Insurance as primary payer Mechanism of injury for TBI having Government as primary payer Mechanism of injury for TBI having Worker s Compensation as primary payer Mechanism of injury for TBI having HMO as primary payer 27 2
4 Tables Page 1. TBI by age TBI by gender Leading causes of TBI, all ages Leading causes of TBI for ages Leading causes of TBI for ages Leading causes of TBI for ages Leading causes of TBI for ages Leading causes of TBI for ages Leading causes of TBI for ages Incidence of TBI by county, sorted by county name Incidence of TBI by county, sorted by frequency Incidence of TBI by county, sorted by age-adjusted rate Hospital discharges by disposition for non-fatal TBI Barrell Matrix Type I/II/III TBI by mechanism for non-fatal TBI Primary payers for hospitalized TBI ABI by age ABI by gender Incidence of ABI by county, sorted by county name Incidence of ABI by county, sorted by frequency Incidence of ABI by county, sorted by age-adjusted rate Causes of ABI Anoxia/hypoxia by age group Exposure to toxic substances by age group Diagnoses in nonfatal anoxia/hypoxia Diagnoses in fatal anoxia/hypoxia Diagnoses in nonfatal exposures to toxic substances Diagnoses in fatal exposures to toxic substances Injury-related causes of ABI Hospital discharge disposition for non-fatal ABI Primary payers for hospitalized ABI SCI by age SCI by gender Incidence of SCI by county Leading causes of SCI, all ages Hospital discharge disposition for non-fatal SCI Primary payers for hospitalized SCI Number of injury-related cases on hospital discharge file,
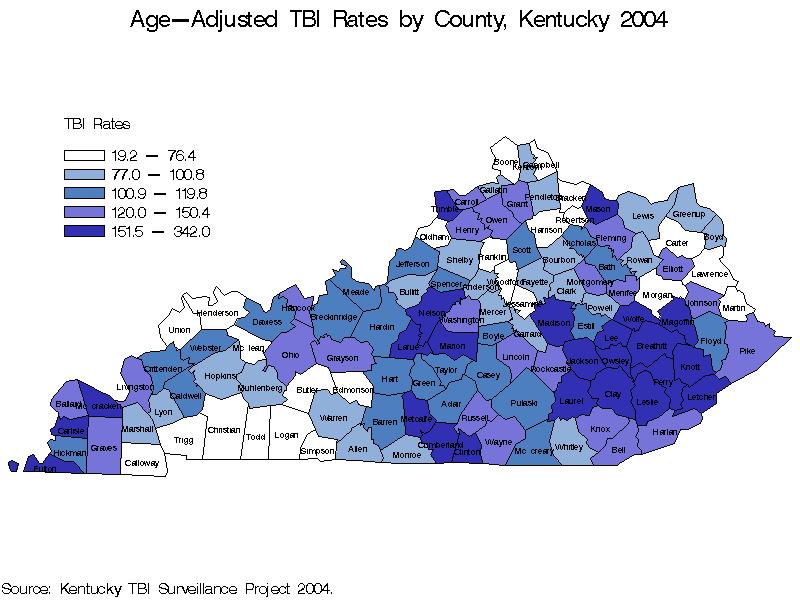
5 Introduction In 2004, traumatic brain injury (TBI) was a factor in the deaths of 1,088 Kentuckians, as well as the live discharges of 3,353 Kentuckians from licensed, acute-care hospitals across the state. TBI played a role in the death or hospitalization of 12 state residents per day. Acquired brain injury (ABI) was diagnosed in 1,241 deaths and 2,194 live discharges (more than 9 ABI per day), and spinal cord injury (SCI) was reported in 71 deaths and 213 live discharges, or over 5 SCI per week. See Tables 1, 16, and 31 for details. NOTE: Due to a change in the methods of creating this year s report, we have omitted comparisons with previous years results in this report. Details are provided in the Methods section. The results of this year s report, combined with the two previous year s reports, clearly suggest that further exploration of the following causes of TBI, ABI, and SCI are needed, in order to pinpoint the risk factors involved and develop prevention strategies: Motor vehicle traffic crashes (TBI and SCI), especially among ages Falls (TBI and SCI), especially among ages 0-4 and 65 and older Anoxia/hypoxia (ABI), especially among ages 45 and older Exposure to toxic substances (ABI), especially among ages Motor vehicle traffic crashes in persons aged 15-24, and falls in persons aged 65 and older, again emerged as the leading causes of TBI. Anoxia/hypoxia was most common among persons aged 65 and older, whereas exposure to toxic substances was greatest among those aged Combined, these two were the cause of 99% of fatal ABI and 92% of nonfatal, hospitalized ABI. Geographically, rates of TBI and ABI were both highest in eastern Kentucky. The west-central part of the state is also high for TBI, and the western part is high for ABI. Furthermore, the following counties have been identified as top priorities for prevention activities and programs. These counties have ranked in the top quarter of Kentucky counties in terms of both the number of cases reported and the age-adjusted rate per 100,000 residents in at least four out of the last five years and can be considered excellent candidates for an in-depth pilot study leading to interventions to prevent and control TBI and ABI: TBI: Breathitt, Letcher, Nelson, and Perry ABI: Bell, Hopkins, Johnson, Perry and Whitley SCI: There were not enough total reported cases of SCI statewide to support a reliable geographic analysis. 4
6 Jefferson county would also be a good choice for an in-depth pilot study as it represented 19% of all TBI in 2004 and had an age-adjusted rate that was higher than the statewide rate, and almost 50% higher than the rate for Fayette county, which had the second highest number of TBI. Methods Data collection Data used for surveillance were all received electronically. Hospital Discharge Data files from the Kentucky Department for Public Health (KDPH) are routinely received by the Kentucky Injury Prevention and Research Center (KIPRC) for surveillance purposes. The National Center for Health Statistics Multiple Cause of Death File (NCHS Death) was required, as this data set contains information on up to 20 supplemental causes of death, whereas the Kentucky computerized death certificate data file generally includes only the external cause of injury (Ecode) for trauma cases. In addition to these data sets, we were able to obtain data on Kentucky residents treated in Tennessee from that state s TBI registry. We have reported the number of TBI identified on that dataset. However, those cases were not included in the data linkage or in the final count or rates. The current year of analysis (2004) marks the first year analysis has been done not using the state trauma registry data. Over the last several years, the trauma registry has contributed around 8% of the TBI cases. However, many of the cases that were identified only in the trauma registry had lengths of stay equal to zero, suggesting that they were non-admissions and some were patients who died before they could be admitted. After all such factors are taken into account, it appears that the trauma registry contributes few cases of hospitalized brain injury that are not captured through the HDD. For this reason, we will not be including the Kentucky trauma registries in this or in future CNSI surveillance. This should be noted when comparing 2004 data to previous years data. Next year s report will be a 5 year review looking at comparable data over the time period covering Traumatic brain injury case definition The Centers for Disease Control and Prevention (CDC) have established standards for TBI case identification (CDC, 1995). Hospitals commonly use ICD- 9 codes for injury coding. For death certificates, state and federal authorities use ICD-10 codes. The following ICD-9 diagnosis codes (n-codes) were used for identifying TBI in HDD: 5
7 Fracture of vault or base of skull: Other, unqualified, and multiple fractures of skull: Intracranial injury, including concussion, cerebral laceration, subdural hemorrhage, unspecified intracranial injury, etc: Head injury, unspecified: ICD-10 codes were used to identify TBI in NCHS Death records: Open wound of head: S01.0-S01.9 Fracture of skull and facial bones: S02.0-S02.1, S02.3, S02.7-S02.9 Intracranial injury: S06.0, S06.2-S06.9 Crushing injury of head: S07.0-S07.1, S07.8-S07.9 Other unspecified injuries of head: S09.7-S09.9 Open wounds involving head with neck: T01.0 Fractures involving head with neck: T02.0 Crushing injuries involving head with neck: T04.0 Injuries of brain and cranial nerve with injuries of nerves and spinal cord at neck level: T06.0 Sequelae of injuries of head: T90.1-T90.2, T90.4-T90.5, T90.8-T90.9 If one or more of these codes was found in any of the diagnosis code fields in HDD or NCHS Death, the record was determined to be a TBI. Acquired brain injury case definition In addition to CDC-defined TBI, there are many brain injuries that have nontraumatic etiologies. These we have classified as ABI. Because these diagnoses are not included in the CDC definition of TBI, they have been linked and analyzed separately. These conditions were also identified by ICD-9 diagnosis codes, as follows: Anoxia/Hypoxia: 348.1, 668.2, 669.4, 768.1, 768.5, 768.6, 768.9, 799.0, 994.1, 994.7, Allergy/Anaphylaxis: 995.0, 999.4, Acute Medical Clinical Incidents: , Toxic Substances: 964.2, , , , 985, 986, , 989.0, 995.4, 995.5, The following ICD-10 codes were used to identify ABI in NCHS Death records: Anoxia/Hypoxia: G93.1, O29.2, O74.3, O75.4, O89.2, P20.1, P21.0, P21.1, P21.9, R09.0,, T75.1 Allergy/Anaphylaxis: T78.0, T78.2, T80.5, T80.6, T88.1, T88.6 Acute Medical Clinical Incidents: G00.0, G00.1, G00.2, G00.3, G00.8, G01, G07, G02.0, G02.1, G02.8, G04.2, G04.8, G05.0, G05.1, G06.2 6
8 Toxic Substances: G03.8, G03.9, G97.1, G97.2, G97.8, G97.9, N14.3, R29.1, T40.5, T41.0, T41.1, T41.2, T41.3, T41.4, T42.3, T42.4, T42.6, T42.7, T45.5, T49.0, T51.0, T51.1, T51.2, T51.3, T51.8, T51.9, T56.1, T56.2, T56.3, T56.4, T56.5, T56.6, T56.7, T56.8, T57.0, T57.2, T57.3, T57.8, T58, T60.4, T61.9, T62.0, T62.1, T62.2, T62.8, T62.8, T64, T65.0, T65.8, T65.9, T81.1, T88.2, T88.5 If one or more of these codes was found in any of the diagnosis code fields in HDD or NCHS Death, the record was classified as an ABI. Note: The code T71 was reclassified from Toxic Substances to Anoxia/Hypoxia. The definition of T71 is Asphyxiation, and includes suffocation (by strangulation) and systemic oxygen deficiency due to low oxygen content in ambient air or mechanical threat to breathing. Spinal cord injury case definition The CDC defines SCI by the following ICD-9 diagnosis codes (CDC, 1995): Fracture of vertebral column with spinal cord injury: Spinal cord injury without evidence of spinal bone injury: The following ICD-10 codes were used to identify SCI in NCHS Death records: Fracture of neck: S12.0-S12.2, S12.7, S12.9 Fracture of thoracic vertebra and thoracic spine: S22.0-S22.1 Fracture of lumbar spine: S32.0, S32.7 Injury of nerves and spinal cord at neck level: S14.0-S14.1 Injury of nerves and spinal cord at thorax level: S24.0-S24.1 Injury of nerves and lumbar spinal cord at abdomen, lower back, and pelvis level: S34.0-S34.1, S34.3 Fracture of spine, level unspecified: T08 Injury of nerves and spinal cord involving other multiple body regions: T06.1 Injury of spinal cord, level unspecified: T09.3 Sequelae of injury of spinal cord: T91.3 For this report, SCI records had to contain one of these codes in one of the first three diagnosis code fields in HDD or NCHS Death data. Probabilistic data linkage Probabilistic data linkage (PDL) has been described in scholarly depth by Jaro (1995, 1989). Briefly, PDL is a statistical method for matching records in unrelated databases. By comparing the frequencies of all individuals characteristics, such as age, birth date, and zip code, the data linkage software decides which records in the different databases probably pertain to the same 7
9 person. Thus, we avoid counting these cases more than once when calculating incidence. For this project, the ratio of authentic to spurious links was set to 99:1. Standardized variables were created from variables necessary for linkage. These included dates (of injury, admission, discharge, death, birth), geographic variables (resident county, resident state, zip codes), and demographic characteristics (age, gender, race, martial status) and others (hospital ID, TBI indicator, cause of injury). Self match: As a first step, we matched each file against itself to determine the extent of duplication of cases within the datasets. We found that less than 0.5% of the HDD records, and almost none of the NCHS death records, appeared to be a duplicate. In other words, duplication of cases within the datasets appeared to be minimal. File linkages and master dataset: Next we linked the HDD and NCHS death datasets. We then created a master dataset containing two sections: one for the HDD portion of the record and one for the NCHS death portion. For example, if a case was identified by data linkage in both the HDD and NCHS Death files, the master file would contain a single record with an HDD and a NCHS Death portion. If it was found in the HDD only, the master file would contain a single record with only the HDD portion populated, and so on. Create analytical file: From the master dataset we created a simplified dataset from which the tables and figures in this report were derived. In doing so we made several choices which we outline briefly here. First, we defined a master record to represent a TBI, ABI, or SCI case if there was a TBI, ABI, or SCI diagnosis on any of the three files. Second, we declared a master record to represent a fatality if there was an NCHS death record present, or if there was a HDD record with a patient disposition indicating death. Third, we established rules of precedence for the data source. For fatalities, if a NCHS death record was found its values were used to populate the analytical file. If a death was indicated on the HDD but no death record was found, then the HDD files were used to populate the analytical file. Using these rules we reduced the master file to an analytical file with a single value for each data element (age, gender, diagnosis codes, etc.). Incidence rates Crude incidence rates were calculated for each injury type by dividing the number of injuries by 4,118,189, the estimated 2003 population of Kentucky according to the Kentucky State Data Center, and then multiplying by 100,000. This figure represents the number of TBI, ABI, or SCI that occurred per 100,000 8
10 residents of Kentucky. Age-adjusted rates were calculated using the Year 2000 Standard Population. Data analysis All data analysis, including mapping, was performed using SAS Version
11 Results Traumatic brain injury There were 4,441 Kentucky-resident TBI cases identified for 2004 (Table 1). The crude incidence rate was per 100,000 population. (Residents who were treated out-of-state are not included in any of any of the estimate in this report.) The demographics of TBI in 2004 were consistent with those for Table 1 shows that the highest rates of TBI were again found among those aged 65 and over and From Table 2 we find that 58% of non-fatal and 74% of fatal TBI occurred in males. The leading mechanisms of injury were also consistent with last year s report. Motor vehicle traffic crashes (MVTC) were the cause of 37% of all TBI, and falls caused 24% (Table 3). The top three mechanisms varied by age group (Tables 4 to 9). For those aged 65 and over, falls were the leading cause (49%). MVTC s contributed to just under two thirds (63%) of TBI in those aged 15-24, and were the leading cause from ages 5 to 64. Falls led among young children (ages 0-4). As one would expect, the incidence of TBI was highest in the larger counties (Figure 2). Four of the most populous counties in 2004 (Jefferson, Fayette, Kenton, Hardin) were among the top six in TBI incidence. A notable exception was Owsley, which was 80 th in TBI incidence but 119 th in population. Unsurprisingly, Owsley County had the highest age-adjusted rate in the state. Owsley was 2 nd in age-adjusted rate in Another notable exception was Christian county, which was 10 th in population but 38 th in frequency (and 115 th in age-adjusted rate) of TBI. Because it borders Tennessee, we can reasonable infer that a substantial number of TBI cases in Christian county residents are not treated in Kentucky. This conclusion is supported by Figure 4, which shows that 34 Christian county residents appeared in the 2004 Tennessee TBI registry. In general, Figure 4 shows that several southern border counties have significant numbers of residents treated in Tennessee hospitals. Prominent examples, in addition to Christian, include McCreary, Bell, Logan, Harlan, Whitley, and Warren. This illustrates an important point: if this report shows a county to have a high rate of TBI, we can be confident that this is a county in need. Conversely, however, if a county is shown to have a low rate we cannot conclude that there is not a significant problem in that county, particularly if it is located on or near the state border. Viewing the state in terms of age-adjusted rates (Figure 3), again there were clusters of high-incidence counties in the eastern and west-central regions. The eastern cluster for 2004 was inclusive of the 2003 cluster. A west-central cluster was again evident, though slightly more expansive with some variation in counties involved. One useful way of determining priority counties is to find those that ranked among the top thirty in both frequency and age-adjusted rate 10
12 of TBI. For 2004 there were eight such counties: Clay,, Laurel, Letcher, Madison, McCracken, Nelson, Perry. Tables 10 through 12 show the frequency and rates of TBI by county, ranked in order by county, frequency, and ageadjusted rate respectively. Nearly 4 out of 5 TBI (76%) were non-fatal (Table 1). We attempted by several means to estimate the number of the non-fatal TBI that inclined toward the higher end of the severity spectrum. All of the three methods placed the number somewhere between 1,200 and 1,600, or 30% to 49%. Table 13 indicates that 1,119 non-fatal TBI discharges had a disposition other than routine. The three most frequent non-routine discharges were skilled nursing facility, home health, and inpatient other short term hospital. A total of 677 discharges had one of these three dispositions. Table 15 presents an analysis of TBI in terms defined by the Barell Injury Diagnosis Matrix (Barell et al 2002). The definitions are as follows: A Type I TBI is one in which there is recorded evidence of an intracranial injury or a moderate or a prolonged loss of consciousness (LOC), Shaken Infant Syndrome, or injuries to the optic nerve pathways. A Type 2 TBI is one in which there is no recorded evidence of intracranial injury, and LOC of less than one hour, or LOC of unknown duration, or unspecified level of consciousness. A Type 3 TBI is one in which there is no evidence of intracranial injury and no LOC. From this Table we see that 1,497 non-fatal TBI discharges had a principal diagnosis indicating a Type I TBI. Government (38%) or commercial (30%) sources were the primary payers billed for acute care charges in 68% of nonfatal TBI, based on discharges identified from the HDD (Table 16). Commercial payers were billed just over $41 million in 2004, and government payers almost $28 million. There was a notable shift, compared to 2002 and 2003, in both the number of TBI discharges and the total charges billed to Self Pay (with charges over 9 times 2003 totals) and HMOs (charges over 3 times 2003 totals). Please note that the amount billed by the hospital will generally be larger than the amount actually paid after adjudication of the claim. Figures 9 through 13 demonstrate that the leading mechanism of TBI varies according to the primary insurance source billed. For example, MVTC was the mechanism of injury in 66% of TBI for which Commercial Insurance was the primary payer billed. Falls were the leading mechanism of TBI when Government was the primary payer, at 48%. These insurers should be viewed 11
13 as stakeholders in programs to prevent those injuries that result in a substantial portion of their claims. Acquired brain injury There were 3,435 ABI cases for Kentucky residents identified in 2004 (Table 16). The crude incidence rate for 2004 was 82.9 per 100,000 population. ABI was skewed toward the middle and older age groups, with 86% occurring in persons aged 25 and older, compared to 76% of TBI (Table 16). Also in contrast to TBI, of which 62% occurred in males, ABI affected the genders in closer to equal proportions (Table 17). Just under two thirds (64%) of ABI were nonfatal, compared to 76% of TBI. As shown in Table 21, nearly all ABI (99% of fatal and 91% of nonfatal, hospitalized) were a result of either anoxia/hypoxia or exposure to toxic substances (ETS). Anoxia/hypoxia tends to affect older people (ages 45 and over) considerably more often than younger people, where as ETS affects persons 15 and older at similar rates, and is most common among persons aged (Tables 22 and 23). Diagnosis codes (Tables 24-27) provide minimal information about the circumstances of injury. Asphyxia was the leading cause in fatal anoxia/hypoxia. Complications related to medical care were the leading cause in nonfatal anoxia/hypoxia with asphyxia being a close second. Complications related to medical care were much less common in fatal cases. Alcohol and drugs were involved in most of the nonfatal ETS. They were common in fatal ETS as well, as were carbon monoxide poisoning and postoperative shock. Among those ABI discharges that were reported to have some relationship with an injury (i.e., included an E-code), 83% of the non-fatal cases were poisonings. Poisoning, suffocation or drowning were indicated in over 7 out of 10 of the fatal, injury-related ABI (Table 28). (Note that we are making a distinction here between injury-related and traumatic, with trauma being considered one of several forms of injury. ABI is, by the statutory definition, non-traumatic). In general, as with TBI, the more populous counties had high numbers of ABI (Figure 6). Four of the most populous counties in 2004 (Jefferson, Fayette, Kenton, and Hardin) were the top four counties in ABI incidence. However, with the exceptions of McCracken (which ranked 37 in rate) and Hardin (36 th ), the ten most populous counties did not appear in the top forty counties when ranked by age-adjusted rate. The counties with the highest rates were strongly concentrated in eastern Kentucky (Figure 7). As with TBI, we located the counties that ranked among the top thirty in both frequency and age-adjusted rate of ABI. There were nine counties that met both criteria in 2004: Bell, Casey, Floyd, Hopkins, Knox, 12
14 Madison, Perry, Russell, and Whitley. These can be considered leading candidates for further study and intervention. Tables 18 through 20 show the frequency and rates of ABI cases by county, ranked in order by county, frequency, and age-adjusted rate respectively. Table 29 indicates that 42% of ABI discharges were other than routine i.e., to destinations other than the home. The three most frequent non-routine discharges were home health, skilled nursing facility, and inpatient other type of facility. Government (57%) or commercial (16%) sources were the primary payer billed for hospital charges in almost 3 out of every 4 non-fatal ABI, based on discharges identified from the HDD (Table 30). Government payers were billed over $38 million in 2004, and commercial payers over $12 million. Spinal cord injury SCI patients often are readmitted for problems stemming from the original injury. In an effort to avoid double counting in such cases, for SCI we looked only at the first three listed diagnosis codes. There were 284 SCI cases for Kentucky residents identified in 2004 (Table 31). This number is 14 more than the number of cases identified in The crude incidence rate was 6.9 per 100,000 population. Age groups 65 and over had the highest age-specific rates (14.6 per 100,000) of SCI (Table 32). s for persons aged were the next highest at 9.7. Persons aged had lower rates but were similar across this group. Males had nearly double the SCI rate of females, and had just over two thirds of the non-fatal SCI (Table 32). Table 33 presents the number of SCI per county. Due to the small number of cases per county, we did not attempt a graphical analysis of SCI rates by county, as the rates would be unstable. Among SCI s for which an E-code was reported, MVTC and falls were the leading mechanisms of injury (Table 34). Unfortunately, over one out of four of the non-fatal SCI discharges had no E-code reported. Half (50%) of the non-fatal SCI discharges had dispositions other than routine, compared to one-third for TBI (Table 35). Government (34%) or commercial (27%) sources were the primary payer billed for acute care charges in 61% of nonfatal SCI, based on discharges identified from the HDD (Table 38). Commercial payers were billed almost $5.5 million in 2004, and government payers just over $4 million. 13
15 Limitations The methodology used in this report under-represents the incidence of ABI. The reason is that the injury subset of the HDD used in this and previous years included only those cases of ABI that were comorbid with at least one injury diagnosis. Double counting of cases is possible for several reasons, including multiple representation of cases within individual data sets (e.g., transfers between hospitals), or across linked data sets (due to failure of data linkage to identify duplicate records). Non-fatal in this report refers to Kentucky-resident inpatients discharged alive from a licensed, acute-care hospital in Kentucky (including trauma centers). It does not include those treated and released at emergency departments (with the exception of certain cases treated and released from ED s at certified trauma centers), those treated by emergency medical services who refused transport to a hospital, or those hospitalized outside of Kentucky. The incidence of nonfatal TBI in Kentucky residents, in that larger sense, is certainly several times larger than the results reported here. 14
16 References Dryden DM, Saunders LD, Rowe BH, May LA, Yiannakoulias N, Svenson LW, Schopflocher DP, Voaklander DC. The epidemiology of traumatic spinal cord injury in Alberta, Canada. Can J Neurol Sci, 2003; 30(2): Jaro M. Advances in record-linkage methodology as applied to matching the 1985 census of Tampa, Florida. Journal of the American Statistical Association, 1989; 84(406): Jaro M. Probabilistic linkage of large public health data files. Statistics in Medicine, 1995; 14: PMIC. International Classification of Diseases: 9 th Revision, Clinical Modification (5 th Edition). Los Angeles, California: Practice Management Information Corporation, Sekhon LHS, Fehlings MG. Epidemiology, demographics, and pathophysiology of acute spinal cord injury. Spine, 2001; 26(24S): S2-S12. Singleton M. Deaths of Kentucky Residents Due to Unintentional Poisoning and Poisoning of Undetermined Intent. Kentucky Injury Prevention and Research Center, August Thomas C, Butler J, Davies M, Johnson R. State Injury Indicators Report, Second Edition 1999 Data. Atlanta (GA): Centers for Disease Control and Prevention, National Center for Injury Prevention and Control, CDC. Thurman DJ, Sniezek JE, Johnson D, Greenspan A, Smith SM. Guidelines for Surveillance of Central Nervous System Injury. Atlanta: Centers for Injury Prevention and Control, CDC. Traumatic brain injury Colorado, Missouri, Oklahoma, and Utah, MMWR, 1997; 46(1): CDC. Recommended Framework for Presenting Injury Mortality Data. MMWR 1997; 46 (No. RR-14). CDC. Unintentional and Undetermined Poisoning Deaths 11 States, MMWR 2004;53:
17 References Thurman DJ, Alverson C, Dunn KA, Guerrero J, Sniezek JE. Traumatic brain injury in the United States: a public health perspective. Journal of Head Trauma Rehabilitation, 1999; 14(6): Barell V, Aharonson-Daniel L, Fingerhut LA, Mackenzie EJ, Ziv A, Boyko V, Abargel A, Avitzour M, Heruti R. An introduction to the Barell body region by nature of injury diagnosis matrix. Injury Prevention, June 2002 v8 i2 p91(6). WHO. International Statistical Classification of Diseases and Related Health Problems 10 Revision. Geneva, Switzerland: World Health Organization,
18 FIGURES Figure 1. Distribution of TBI among databases, 2004 Hospital Discharge TN TBI Registry 309 Death Certificate s 17
19 18
20 19
21 20
22 Figure 5. Distribution of ABI among databases, 2004 Hospital Discharge Death Certificate s 21
23 22
24 23
25 Figure 8. Distribution of SCI among databases, 2004 Hospital Discharge Death Certificate s 24

26 Figure 9. Mechanism of injury for self-pay TBI, 2004 Figure 10. Mechanism of injury for TBI having Commercial Insurance as primary payer,


27 Figure 11. Mechanism of injury for TBI having Government as primary payer, 2004 Figure 12. Mechanism of injury for TBI having Worker s Compensation as primary payer,

28 Figure 13. Mechanism of injury for TBI having HMO as primary payer,
29 TABLES Table 1. TBI by age, 2004 Fatal Non-fatal Total Age Number Percent Number Percent Number Percent , , Total 1, , , Table 2. TBI by gender, 2004 Fatal Non-fatal Total Age Number Percent Number Percent Number Percent Male , , Female , , Total 1, , , * For one observation, the individual's gender was not reported Table 3. Leading causes of TBI, all ages, 2004 Fatal Non-fatal Total Mechanism of Injury Number Pct. Number Pct. Number Pct. Motor vehicle traffic crash , , Fall , Firearm Non-traffic land transport Struck by object or person Non-traffic pedal cycle Machinery Other Unknown (missing E-code) Total 1, , ,
30 Table 4. Leading causes of TBI for ages 0-4, 2004 Fatal Non-fatal Total Mechanism of Injury Number Percent Number Percent Number Percent Fall Motor vehicle traffic crash Struck by or against object or person Non-traffic land transportation Other (including non-specific codes) Unknown (missing E-code) Total Table 5. Leading causes of TBI for ages 5-14, 2004 Fatal Non-fatal Total Mechanism of Injury Number Percent Number Percent Number Percent Motor vehicle traffic crash Fall Non-traffic land transportation Other pedal cycle Struck by or against object or person Firearm Other (including non-specific codes) Unknown (missing E-code) Total Table 6. Leading causes of TBI for ages 15-24, 2004 Fatal Non-fatal Total Mechanism of Injury Number Percent Number Percent Number Percent Motor vehicle traffic crash Firearm Non-traffic land transportation Fall Struck by or against object or person Other (including non-specific codes) Unknown (missing E-code) Total
31 Table 7. Leading causes of TBI for ages 25-44, 2004 Fatal Non-fatal Total Mechanism of Injury Number Percent Number Percent Number Percent Motor vehicle traffic crash Firearm Fall Struck by or against object or person Non-traffic land transportation Machinery Other (including non-specific codes) Unknown (missing E-code) Total , Table 8. Leading causes of TBI for ages 45-64, 2004 Fatal Non-fatal Total Mechanism of Injury Number Percent Number Percent Number Percent Motor vehicle traffic crash Fall Firearm Struck by or against object or person Non-traffic land transportation Other (including non-specific codes) Unknown (missing E-code) Total Table 9. Leading causes of TBI for ages 65+, 2004 Fatal Non-fatal Total Mechanism of Injury Number Percent Number Percent Number Percent Fall Motor vehicle traffic crash Firearm Struck by or against object or person Non-traffic land transportation Other (including non-specific codes) Unknown (missing E-code) Total , ,
32 Table 10. Incidence of TBI by county, sorted by county name, 2004 County Freq Percent Age- Adjusted Crude County Freq Percent Age- Adjusted Crude County Freq Percent Age- Adjusted ADAIR GRANT MCLEAN ALLEN GRAVES MEADE ANDERSON GRAYSON MENIFEE BALLARD GREEN MERCER BARREN GREENUP METCALFE BATH HANCOCK MONROE BELL HARDIN MONTGOMERY BOONE HARLAN MORGAN BOURBON HARRISON MUHLENBERG BOYD HART NELSON BOYLE HENDERSON NICHOLAS BRACKEN HENRY OHIO BREATHITT HICKMAN OLDHAM BRECKINRIDGE HOPKINS OWEN BULLITT JACKSON OWSLEY BUTLER JEFFERSON PENDLETON CALDWELL JESSAMINE PERRY CALLOWAY JOHNSON PIKE CAMPBELL KENTON POWELL CARLISLE KNOTT PULASKI CARROLL KNOX ROBERTSON * CARTER LARUE ROCKCASTLE CASEY LAUREL ROWAN CHRISTIAN LAWRENCE RUSSELL CLARK LEE SCOTT CLAY LESLIE SHELBY CLINTON LETCHER SIMPSON CRITTENDEN LEWIS SPENCER CUMBERLAND LINCOLN TAYLOR DAVIESS LIVINGSTON TODD * EDMONSON LOGAN TRIGG ELLIOTT LYON TRIMBLE ESTILL MADISON UNION * FAYETTE MAGOFFIN WARREN FLEMING MARION WASHINGTON FLOYD MARSHALL WAYNE FRANKLIN MARTIN WEBSTER FULTON MASON WHITLEY GALLATIN MCCRACKEN WOLFE GARRARD MCCREARY WOODFORD * At least one but fewer than five - Percentage or rate suppressed to prevent disclosure of the value on which it was based Crude 31
33 Table 11. Incidence of TBI by county, sorted by frequency, 2004 County Freq Percent Age- Adjusted Crude County Freq Percent Age- Adjusted Crude County Freq Percent Age- Adjusted JEFFERSON SHELBY SPENCER FAYETTE BREATHITT WOODFORD KENTON LINCOLN LEE DAVIESS JESSAMINE TRIMBLE MCCRACKEN LESLIE WASHINGTON HARDIN WAYNE WEBSTER WARREN MARION FULTON LAUREL TAYLOR GREEN PIKE CLARK MCCREARY MADISON GRANT MCLEAN PULASKI MONTGOMERY CARROLL PERRY MEADE LOGAN NELSON JACKSON POWELL MARSHALL MAGOFFIN BATH GRAVES BRECKINRIDGE HARRISON BOONE CALLOWAY LEWIS CAMPBELL ROCKCASTLE LIVINGSTON BULLITT HART MARTIN HOPKINS LARUE BALLARD CLAY RUSSELL CRITTENDEN FLOYD WOLFE LAWRENCE BARREN ADAIR MONROE BOYD BOURBON PENDLETON KNOX FLEMING BUTLER BELL HENRY CUMBERLAND HARLAN ROWAN HANCOCK LETCHER ALLEN MENIFEE SCOTT ANDERSON MORGAN BOYLE MERCER SIMPSON KNOTT CARLISLE EDMONSON WHITLEY CARTER ELLIOTT FRANKLIN CASEY LYON GREENUP CLINTON NICHOLAS JOHNSON ESTILL TRIGG MUHLENBERG METCALFE GALLATIN OHIO CALDWELL HICKMAN OLDHAM GARRARD BRACKEN CHRISTIAN MASON TODD * GRAYSON OWEN UNION * HENDERSON OWSLEY ROBERTSON * * At least one but fewer than five - Percentage or rate suppressed to prevent disclosure of the value on which it was based Crude 32
34 Table 12. Incidence of TBI by county, sorted by age-adjusted rate, 2004 County Freq Percent Age- Adjusted Crude County Freq Percent Age- Adjusted Crude County Freq Percent Age- Adjusted OWSLEY WASHINGTON ANDERSON WOLFE CARROLL SHELBY CARLISLE HANCOCK KENTON LESLIE KNOX WHITLEY PERRY HARLAN MARSHALL MADISON RUSSELL MONROE MAGOFFIN MONTGOMERY GALLATIN JACKSON ELLIOTT LEWIS BREATHITT HART BOYD KNOTT JEFFERSON GREENUP CLAY DAVIESS CLARK CLINTON ADAIR ROWAN LEE HICKMAN MERCER TRIMBLE BOYLE PENDLETON MARION TAYLOR FAYETTE METCALFE GREEN BULLITT LAUREL CRITTENDEN MARTIN LARUE PULASKI OLDHAM LETCHER BRECKINRIDGE MCLEAN FULTON BARREN BUTLER MASON HARDIN FRANKLIN CUMBERLAND FLOYD LAWRENCE NELSON MEADE EDMONSON MCCRACKEN ESTILL JESSAMINE WAYNE WEBSTER HENDERSON ROCKCASTLE MCCREARY BOONE OWEN SPENCER WOODFORD FLEMING CASEY HARRISON JOHNSON CALDWELL MORGAN BALLARD NICHOLAS CALLOWAY BELL BATH CAMPBELL GRAVES SCOTT CARTER OHIO BOURBON BRACKEN HENRY HOPKINS SIMPSON LIVINGSTON GARRARD CHRISTIAN PIKE LYON TRIGG GRAYSON ALLEN LOGAN LINCOLN WARREN ROBERTSON * MENIFEE POWELL TODD * GRANT MUHLENBERG UNION * * At least one but fewer than five - Percentage or rate suppressed to prevent disclosure of the value on which it was based Crude 33
35 Table 13. Hospital discharges by disposition for non-fatal TBI, 2004 Discharge Disposition Number Percent Routine discharge (home/self care) 2, Skilled nursing facility (SNF) Home health Inpatient-other short-term hospital Intermediate care facility (ICF) Inpatient-other type facility Other Total 3, Table 14. Barrell Matrix Type I/II/III TBI by mechanism for non-fatal TBI, 2004 Type I Type II Type III Other Injury Mechanism Number Percent Number Percent Number Percent Number Percent Total Motor vehicle traffic crash Falls Non-traffic land transportation Struck by or against object or person Type of TBI Non-traffic pedal cycle Firearm Other Unknown Total 1, ,260 Table 15. Primary payers for hospitalized TBI, 2004 (Hospital Discharge Dataset only) Payer Number of Discharges Percent of Discharges Total Hospital Charges Government 1, $ 27,925,527 Commercial Ins 1, $ 41,383,636 Self Pay $ 13,855,222 Workers Compensation $ 4,651,458 HMO $ 7,268,867 Other $ 12,836,863 Total 3, $ 107,921,573 34
36 Table 16. ABI by age, 2004 Fatal Non-fatal Total Age Number Percent Number Percent Number Percent , Total 1, , , Table 17. ABI by gender, 2004 Fatal Non-fatal Total Age Number Percent Number Percent Number Percent Male , , Female , , Total 1, , ,
37 Table 18. Incidence of ABI by county, sorted by county name, 2004 Age- Adjusted Age- Adjusted Age- Adjusted Crude Crude Crude County Freq Percent County Freq Percent County Freq Percent ADAIR GRANT MCLEAN ALLEN GRAVES MEADE ANDERSON GRAYSON MENIFEE BALLARD GREEN MERCER BARREN GREENUP METCALFE BATH HANCOCK * MONROE BELL HARDIN MONTGOMERY BOONE HARLAN MORGAN BOURBON HARRISON MUHLENBERG BOYD HART NELSON BOYLE HENDERSON NICHOLAS * BRACKEN * HENRY OHIO BREATHITT HICKMAN OLDHAM BRECKINRIDGE HOPKINS OWEN BULLITT JACKSON OWSLEY * BUTLER JEFFERSON PENDLETON CALDWELL JESSAMINE PERRY CALLOWAY JOHNSON PIKE CAMPBELL KENTON POWELL CARLISLE * KNOTT PULASKI CARROLL KNOX ROBERTSON * CARTER LARUE ROCKCASTLE CASEY LAUREL ROWAN CHRISTIAN LAWRENCE RUSSELL CLARK LEE SCOTT CLAY LESLIE SHELBY CLINTON LETCHER SIMPSON CRITTENDEN LEWIS SPENCER CUMBERLAND LINCOLN TAYLOR DAVIESS LIVINGSTON * TODD EDMONSON LOGAN TRIGG ELLIOTT LYON TRIMBLE ESTILL MADISON UNION FAYETTE MAGOFFIN WARREN FLEMING MARION WASHINGTON FLOYD MARSHALL WAYNE FRANKLIN MARTIN WEBSTER FULTON MASON WHITLEY GALLATIN MCCRACKEN WOLFE GARRARD MCCREARY WOODFORD * At least one but fewer than five - Percentage or rate suppressed to prevent disclosure of the value on which it was based 36
38 Table 19. Incidence of ABI by county, sorted by frequency, 2004 County Freq Percent Age- Adjusted Crude County Freq Percent Age- Adjusted Crude County Freq Percent Age- Adjusted JEFFERSON GREENUP SCOTT FAYETTE LINCOLN GARRARD KENTON BREATHITT MARION HARDIN LETCHER MCLEAN CAMPBELL LOGAN HARRISON HOPKINS HENDERSON PENDLETON MCCRACKEN MERCER ROCKCASTLE PULASKI JACKSON SHELBY BOONE MARSHALL SIMPSON PERRY BOURBON TRIGG DAVIESS HENRY WASHINGTON FLOYD MAGOFFIN WEBSTER PIKE BOYLE CALLOWAY MADISON NELSON GREEN WARREN WOODFORD MORGAN WHITLEY ADAIR TRIMBLE KNOX ROWAN CUMBERLAND LAUREL ALLEN FULTON FRANKLIN BRECKINRIDGE LYON BARREN LEWIS MONROE BELL MONTGOMERY OHIO BOYD WAYNE MENIFEE RUSSELL CLINTON METCALFE CASEY FLEMING UNION CLARK HART BALLARD BULLITT MARTIN CRITTENDEN JESSAMINE MASON EDMONSON CHRISTIAN TODD LEE GRAVES BATH HICKMAN HARLAN ESTILL BUTLER KNOTT LAWRENCE GALLATIN CLAY ANDERSON SPENCER JOHNSON CALDWELL WOLFE MUHLENBERG CARROLL BRACKEN * CARTER ELLIOTT CARLISLE * GRANT LARUE HANCOCK * GRAYSON LESLIE LIVINGSTON * OLDHAM MEADE NICHOLAS * TAYLOR OWEN OWSLEY * MCCREARY POWELL ROBERTSON * * At least one but fewer than five - Percentage or rate suppressed to prevent disclosure of the value on which it was based Crude 37
Kentucky Traumatic Brain & Spinal Cord Injury Surveillance Project
 Kentucky Traumatic Brain & Spinal Cord Injury Surveillance Project Fiscal Year 2009 Final Report 1 July 2009 This project is located at the Kentucky Injury Prevention and Research Center, University of
tic Brain Fiscal Year 1 July 2010 This project Brain Injury Trust Fund Living.
 Kentucky Trauma tic Brain & Spinal Cord Injury Surveillancee Project Fiscal Year 2010 Final Report 1 July 2010 This project is located at the Kentucky Injury Prevention and Research Center, University
Where to Find Help Enrolling in kynect in Your County
 Adair Community Action Kentucky 1-800-456-3452 Allen Community Action Kentucky 1-800-456-3452 Allen County (270) 237-4423 Anderson Community Action Kentucky 1-800-456-3452 Anderson County (502) 839-4551
KASPER QUARTERLY THRESHOLD ANALYSIS REPORT THIRD QUARTER 2017
 DECEMBER 1, KASPER QUARTERLY THRESHOLD ANALYSIS REPORT THIRD QUARTER Prepared by Dana Quesinberry, JD KASPER Quarterly Threshold Analysis Report, Third Quarter The Kentucky Injury Prevention and Research
Table of Contents. 2 P age. Susan G. Komen
 KENTUCKY Table of Contents Table of Contents... 2 Introduction... 3 About... 3 Susan G. Komen Affiliate Network... 3 Purpose of the State Community Profile Report... 4 Quantitative Data: Measuring Breast
Drug Overdose Deaths in Kentucky,
 Drug Overdose Deaths in Kentucky, 2000-2013 Kentucky Injury Prevention and Research Center Drug Overdose Deaths in Kentucky, 2000-2013 March 6, 2015 Prepared by Svetla Slavova, PhD Terry L. Bunn, PhD Wei
Executive Summary Kentucky Trauma System Evaluation 2016
 Executive Summary Kentucky Trauma System Evaluation 2016 Julia F. Costich, JD, PhD and Peter J. Rock, MPH Kentucky Injury Prevention & Research Center Prepared with support from the Kentucky Department
3/14/18. What is Recovery Kentucky? Who Will Be Served?
 What is Recovery Kentucky? Initiative to help Kentuckians recover from substance abuse that often leads to chronic homelessness. Studies indicate that substance addiction is one of the leading causes of
Factors Associated with the Increase in Prescriptions for Opioid Analgesic. Medications in Kentucky between 2001 to 2007
 Factors Associated with the Increase in s for Opioid Analgesic Medications in Kentucky between 2001 to 2007 Yelena Tarasenko, DrPH(c), MPH, MPA Michael Singleton, MS Kentucky Injury Prevention and Research
Work Destination Report - Where Workers are Employed Who Live in the Selection Area - by Counties Boyle County, Kentucky: All Counties
 OnTheMap Work Destination Report - Where Workers are Employed Who Live in the Selection Area - by Counties Boyle County, Kentucky: All Counties Created by the U.S. Census Bureau s OnTheMap http://onthemap.ces.census.gov
COLON CANCER IN KENTUCKY
 COLON CANCER IN KENTUCKY PARTNERSHIPS & POLICY FOR SUSTAINABILITY December 7, 2017 Katie Bathje Program Director Kentucky Cancer Consortium New Cases Per 100,000 PROGRESS IN KENTUCKY: CRC INCIDENCE 61
2015 County Health Rankings. Kentucky
 2015 County Health Rankings Kentucky INTRODUCTION The County Health Rankings & Roadmaps program helps communities identify and implement solutions that make it easier for people to be healthy in their
Drug Overdose Emergency Department Visits in Kentucky,
 Drug Overdose Emergency Department Visits in Kentucky, 2008-2014 Kentucky Injury Prevention and Research Center Drug Overdose Emergency Department Visits in Kentucky, 2008-2014 January, 2016 Prepared by
Clearing the Air for All Kentucky Children
 Blueprint for Kentucky s Children Issue Brief Series Clearing the Air for All Kentucky Children November 2013 For more information, contact Mahak Kalra at mkalra@kyyouth.org. All children deserve to breathe
Patient Care Protocols
 KENTUCKY BOARD OF EMERGENCY MEDICAL SERVICES EMT-Basic EMT-Advanced EMT-Paramedic Patient Care Protocols 9/2017 Revision 09/17 Page 1 of 405 Pediatric Medical Protocols Adult Trauma Protocols 09/17 Page
In accordance with 902 KAR 2:020, cases of acute hepatitis A should be reported within 24 hours.
 Kentucky Department for Public Health KY7-89 - Acute Hepatitis A Outbreak Weekly Report Morbidity and Mortality Weekly Report (MMWR) Week May, 8 May, 8 Brief Description of Outbreak: In November 7, the
FINISH THE FIGHT AGAINST CANCER
 2016 American Cancer Society Relay For Life FINISH THE FIGHT AGAINST CANCER cancer.org 1.800.227.2345 RelayForLife.org WHAT IS RELAY FOR LIFE? Founded by Dr. Gordy Klatt in Tacoma, Wash., in 1985, the
3/14/18. Why Would We Give Needles to People Who Inject Drugs? 0-30 days = 60% more Kentuckian is diagnosed with. >365 days = 17% days = 10%
 Why Would We Give Needles to People Who Inject Drugs? Greg Lee HIV/AIDS Continuing Education Director Kentucky Department for Public Health Every DAY, more Kentuckian is diagnosed with 1. Background: HIV
Drug Overdose Fatality Surveillance System (DOFSS) 2015 Annual Report
 2015 Annual Report") Drug Overdose Fatality Surveillance System (DOFSS) 05 Annual Report Released: October 07 Sarah L. Hargrove, MS Patrick J. Ward, MPH Terry L. Bunn, PhD Kentucky Injury Prevention and Research Center, bona
Drug Overdose Fatality Surveillance System (DOFSS) 05 Annual Report Released: October 07 Sarah L. Hargrove, MS Patrick J. Ward, MPH Terry L. Bunn, PhD Kentucky Injury Prevention and Research Center, bona
Drug Overdose Emergency Department Visits among Kentucky Residents,
 Drug Overdose Emergency Department Visits among Kentucky Residents, 2008-2016 Kentucky Injury Preven on and Research Center Drug Overdose Emergency Department Visits among Kentucky Residents, 2008 2016
Drug Overdose Inpatient Hospitalizations among Kentucky Residents,
 Drug Overdose Inpatient Hospitalizations among Kentucky Residents, 2000-2016 Kentucky Injury Preven on and Research Center Drug Overdose Inpa ent Hospitaliza ons among Kentucky Residents, 2000 2016 October,
An introduction to the Barell body region by nature of injury diagnosis matrix
 91 SPECIAL FEATURE An introduction to the Barell body region by nature of injury diagnosis matrix V Barell*, L Aharonson-Daniel, L A Fingerhut, E J Mackenzie, A Ziv, V Boyko, A Abargel, M Avitzour, R Heruti...
Illinois Stroke Data Report
 Illinois Stroke Data Report Robynn Cheng Leidig, MPH CDC Public Health Prevention Service Fellow Division of Patient Safety and Quality Illinois Department of Public Health September 2015 Illinois Stroke
Preventing Substance Abuse and Promoting Mental Health in Kentucky
 Preventing Substance Abuse and Promoting Mental Health in A Community Profile to Promote Positive Mental and Behavioral Health State Epidemiological Outcomes Workgroup (SEOW) Report 2012 WESTERN KENTUCKY:
Syringe Exchange: Indicators of Need & Success March 2015
 Syringe Exchange: Indicators of Need & Success March 2015 The recent outbreak of HIV in southern Indiana among injection drug users brings attention to the lack of a strong public health system in these
Connecting the Supply and Need for Buprenorphine Treatment in Kentucky Counties
 University of Kentucky UKnowledge Theses and Dissertations--Public Health (M.P.H. & Dr.P.H.) College of Public Health 2014 Connecting the Supply and Need for Buprenorphine Treatment in Kentucky Counties
CABINET FOR HEALTH AND FAMILY SERVICES DEPARTMENT FOR PUBLIC HEALTH
 Volume 16, Number 1 CABINET FOR HEALTH AND FAMILY SERVICES DEPARTMENT FOR PUBLIC HEALTH Matthew G. Bevin Vickie Yates Brown Glisson Governor Secretary Hiram C. Polk, Jr., MD Commissioner December 2016
Table of Contents. 2 P age. Susan G. Komen
 INDIANA Table of Contents Table of Contents... 2 Introduction... 3 About... 3 Susan G. Komen Affiliate Network... 3 Purpose of the State Community Profile Report... 4 Quantitative Data: Measuring Breast
HOW THE POLL WAS CONDUCTED
 HOW THE POLL WAS CONDUCTED This poll was conducted by Mason-Dixon Polling & Research, Inc. of Jacksonville, Florida from April 17 through April 19, 2018. A total of 625 registered Tennessee voters were
CHILDHOOD HEALTH. Key findings
 Key findings Prenatal care 85.5 percent of Illinois women received prenatal care in the first trimester in 2004. That s up from 82.4 percent in 2000 but short of the national Healthy People 2010 goal of
Acquired Brain Injury by Local Health Integration Network in Ontario
 Acquired Brain Injury by Local Health Integration Network in Research Team: Angela Colantonio, Principal Investigator Senior Research Scientist, Toronto Rehabilitation Institute UHN Professor of Occupational
An Analysis of the Role of Medicaid Expansion on Mobile Mammography Units and Breast Cancer Screening in the Commonwealth of Kentucky
 University of Kentucky UKnowledge Theses and Dissertations--Public Health (M.P.H. & Dr.P.H.) College of Public Health 2016 An Analysis of the Role of Medicaid Expansion on Mobile Mammography Units and
Governor s Commission for a Drug-Free Indiana. Commission s Purpose. Local Coordinating Councils 10/18/2013
 Governor s Commission for a Drug-Free Indiana Presented By: Indiana Criminal Justice Institute Substance Abuse Services Division Commission s Purpose Strengthen Local Coordinating Councils (LCCs) and assist
County-level Vulnerability Assessment for Rapid Dissemination of HIV or HCV Infection Among
 County-level Vulnerability Assessment for Rapid Dissemination of HIV or HCV Infection Among Persons who Inject Drugs, United States Supplemental Appendix Contents Supplemental Methods... 2 Regression Modeling
1 PERSON 2 PERSON 3 PERSON 4 PERSON 5 PERSON 6 PERSON 7 PERSON 8 PERSON
 Bloomington, IL HUD Metro FMR Area 30% LIMITS 19250 22000 24750 27500 29700 31900 34100 36300 VERY LOW INCOME 32100 36650 41250 45800 49500 53150 56800 60500 60% LIMITS 38520 43980 49500 54960 59400 63780
Drug Overdose Morbidity and Mortality in Kentucky,
 Drug Overdose Morbidity and Mortality in Kentucky, 2000-2010 An examination of statewide data, including the rising impact of prescription drug overdose on fatality rates, and the parallel rise in associated
The Burden of Cardiovascular Disease in Illinois. Mortality, Morbidity and Risk Factors 2013
 The Burden of Cardiovascular Disease in Illinois Mortality, Morbidity and Risk Factors 2013 Table of Contents Executive Summary... iii Introduction... 1 Cardiovascular Disease Mortality... 2 Heart Disease
TRAUMATIC AND ACQUIRED BRAIN INJURY IN NEW MEXICO INCIDENCE, CAUSES, DIAGNOSIS, AND IMPACT FATALITIES HOSPITALIZATIONS
 TRAUMATIC AND ACQUIRED BRAIN INJURY IN NEW MEXICO INCIDENCE, CAUSES, DIAGNOSIS, AND IMPACT 2004-2006 FATALITIES 2004-2007 HOSPITALIZATIONS March, 2010 Prepared by the New Mexico Epidemiology and Response
Improving Ohio s Health: Controlling Diabetes and Hypertension
 Improving Ohio s Health: Controlling Diabetes and Ohio Hospital for Diabetes and 1 By Cathy Costello, JD, Director of CliniSyncPLUS Services This article is the first in a series devoted to diabetes and
Ontario Acquired Brain Injury (ABI) Dataset Project Phase III. Highlights: Numbers of Episodes of Care and Causes of Brain Injury
 Dataset Project Phase III. Highlights: Numbers of Episodes of Care and Causes of Brain Injury") Ontario Acquired Brain Injury (ABI) Dataset Project Phase III Highlights: Numbers of Episodes of Care and Causes of Brain Injury Acquired Brain Injury (ABI), which includes brain injury from traumatic
Ontario Acquired Brain Injury (ABI) Dataset Project Phase III Highlights: Numbers of Episodes of Care and Causes of Brain Injury Acquired Brain Injury (ABI), which includes brain injury from traumatic
Potentially Preventable Hospitalizations in Pennsylvania
 Potentially Preventable Hospitalizations in Pennsylvania Pennsylvania Health Care Cost Containment Council June 2012 About PHC4 The Pennsylvania Health Care Cost Containment Council (PHC4) is an independent
This dynamic document will be reviewed and updated on a periodic basis. Each change will be recorded in the Revision History section.
 lll ARKANSAS MEDICARE HbA1c UTILIZATION REPORT November 20, 2015 T. Mac Bird Ph.D., APCD Analytic Lead Kenley Money, APCD Director Version 1.0.2015 ACHI is a nonpartisan, independent, health policy center
Dental. I H C P A n n u a l S e m i n a r
 Dental I H C P 2 0 1 7 A n n u a l S e m i n a r CareSource & Scion Dental CareSource has partnered with Scion Dental to enhance efficiency and consistency of our Dental Management Services. Scion handles:
Executive Summary Composite Prevention Profile: Rural, Illinois
 Executive Summary : Rural, Illinois 2008 Adams County Alexander County Brown County Bureau County Carroll County Cass County Christian County Clark County Clay County Coles County Crawford County Cumberland
KHIP. Contents Kentucky Health Issues Poll. Drug Problems and Opinions about the Topic Tobacco-free Policies... 4
 KHIP 2017 Health Issues Poll Results from the Foundation for a Healthy and Interact for Health Spotlight on Since 2008, the Foundation for a Healthy and Interact for Health have sponsored the Health Issues
Executive Summary Composite Prevention Profile: City of Chicago, Illinois
 Executive Summary :, Illinois 2008 Prepared by Published by the Center for Prevention Research and Development, within the Institute of Government and Public Affairs at the University of Illinois, based
Executive Summary Composite Prevention Profile: Urban/Suburban, Illinois (excluding Chicago Metro Area)
") Executive Summary Composite Prevention Profile: Urban/Suburban, Illinois (excluding Chicago Metro Area) 2008 Bond County Calhoun County Clinton County Henry County Kankakee County Macoupin County Marshall
Executive Summary Composite Prevention Profile: Urban/Suburban, Illinois (excluding Chicago Metro Area) 2008 Bond County Calhoun County Clinton County Henry County Kankakee County Macoupin County Marshall
Neonatal Abstinence Syndrome and Maternal Substance Abuse in Tennessee
 Neonatal Abstinence Syndrome and Maternal Substance Abuse in Tennessee 1999-2011 Tennessee Department of Health Division of Policy, Planning and Assessment Surveillance, Epidemiology and Evaluation TENESSEE
PEDIATRIC SUMMARY REPORT, 2014 EMS & TRAUMA REGISTRIES. Texas Department of State Health Services Injury Epidemiology & Surveillance Branch
 PEDIATRIC SUMMARY REPORT, 2014 EMS & TRAUMA REGISTRIES Texas Department of State Health Services Injury Epidemiology & Surveillance Branch 1 Heidi Bojes, PhD Director, Environmental Epidemiology and Disease
2017 CSTE Annual Conference. Analysis and Reporting of Injury-Related Inpatient Hospitalizations Using ICD-10-CM-coded Administrative Billing Data
 217 CSTE Annual Conference Analysis and Reporting of Injury-Related Inpatient Hospitalizations Using ICD-1-CM-coded Administrative Billing Data Svetla Slavova, PhD Kentucky Injury Prevention and Research
INDIANA PRIMARY CARE NEEDS ASSESSMENT Report
 INDIANA PRIMARY CARE NEEDS ASSESSMENT 2017 Report INDIANA PRIMARY CARE NEEDS ASSESSMENT REPORT Prepared for: Indiana State Department of Health Prepared by: Bowen Center for Health Workforce Research and
THE TOOL BOX KENTUCKY DEPARTMENT OF CORRECTIONS STAFF AND OFFENDER NEWSLETTER APRIL 2015 VOLUME 4, ISSUE 2 KENTUCKY ONE STOP CAREER CENTERS
 KENTUCKY DEPARTMENT OF CORRECTIONS STAFF AND OFFENDER NEWSLETTER APRIL 2015 THE TOOL BOX VOLUME 4, ISSUE 2 KENTUCKY ONE STOP CAREER CENTERS TABLE OF CONTENTS KENTUCKY CAREER CENTER INFORMATION 1 SPOTLIGHT
CLINICAL QUALITY MEASURES Public Reports. as of 09/30/2013
 CLINICAL QUALITY MEASURES Public Reports as of 09/30/2013 Table of Contents Introduction... 4 Measures Summary... 5 Reports by Measure... 6 ASM Appropriate Medications for People with Persistent Asthma...
E. Omohundro, PhD, 3/15/2017 Office of Research 2
 Ellen Omohundro, PhD, 3/15/217 Successes Both the number of prescriptions and quantity of opioids prescribed are decreasing. Challenges Opioid crimes, especially heroin crimes, are on the rise. Injection
Experience Summary Information
 Visit us online at www.crai-ky.com Karen Taylor Archeological Field Technician Availability: Immediate Email: kstaylor@crai-ky.cim Specific Duties: General Archaeological Technician responsibilities Education
Table of Contents. 2 P age. Susan G. Komen
 OHIO Table of Contents Table of Contents... 2 Introduction... 3 About... 3 Susan G. Komen Affiliate Network... 3 Purpose of the State Community Profile Report... 4 Quantitative Data: Measuring Breast Cancer
TRAUMATIC BRAIN INJURIES IN PENNSYLVANIA
 TRAUMATIC BRAIN INJURIES IN PENNSYLVANIA Hospital Discharges 1995-1999 Traumatic Brain Injuries in Pennsylvania, 1995-1999 An Injury Profile Monograph Injury Prevention Program Division of Health Risk
KENTUCKY HOMEPLACE QUARTERLY REPORT APRIL 1 JUNE 30, 2004
 KENTUCKY HOMEPLACE QUARTERLY REPORT APRIL 1 JUNE 30, 2004 UNIVERSITY OF KENTUCKY CENTER FOR RURAL HEALTH 750 MORTON BLVD HAZARD, KY 41701 (606) 439-3557 www.mc.uky.edu/ruralhealth TABLE OF CONTENTS Letter
American Red Cross Bluegrass Area Chapter
 American Red Cross Bluegrass Area Chapter General Information Contact Information Nonprofit American Red Cross Bluegrass Area Chapter Address 1450 Newtown Pike Lexington, KY 40511 Phone (859) 253-1331
Hospitalizations for Opioid Overdose 2016
 Opioid Overdose 2016 This research brief focuses on inpatient hospitalizations for patients whose principal reason for admission was overdose of heroin or pain medication. This brief follows one released
CHAPTER 2: HEALTH CARE ACCESS
 CHAPTER 2: HEALTH CARE ACCESS No Health Care Coverage (among Adults 18 to 64) in 2006 Definition Responding No to the following question: Do you have any kind of health care coverage, including health
Figure 1. Fentanyl-Related Drug Overdoses, Ohio,
 Number of Deaths OHIO DRUG OVERDOSE PRELIMINARY DATA: GENERAL FINDINGS OVERVIEW Unintentional drug overdose continued to be the leading cause of injury-related death in Ohio in, ahead of motor vehicle
PUBLIC SCHOOL SUPPORT PROGRAM AVERAGE STATE FUNDED SALARY FOR PROFESSIONAL EDUCATORS FINAL COMPS
 PUBLIC SCHOOL SUPPORT PROGRAM AVERAGE STATE FUNDED SALARY FOR PROFESSIONAL EDUCATORS 2018-19 FINAL COMPS Basic Equity County Salary Salary Total Barbour 43,055.50 3,674.06 46,729.56 Berkeley 41,428.42
Executive Summary Composite Prevention Profile: Suburban Chicago Metro Area, Illinois
 Executive Summary : Suburban Chicago Metro Area, Illinois 2008 Cook County (excluding the city of Chicago) DeKalb County DuPage County Grundy County Kane County Kendall County Lake County McHenry County
Alaska Native Injury Atlas of Mortality and Morbidity. Prepared by: The Injury Prevention Program and the Alaska Native Epidemiology Center
 Alaska Native Injury Atlas of Mortality and Morbidity Prepared by: The Injury Prevention Program and the Alaska Native Epidemiology Center Alaska Native Tribal Health Consortium January 2008 Acknowledgements
Ohio Brain Injury Program and the Brain Injury Advisory Committee. Biennial Report on the Incidence of Traumatic Brain Injury in Ohio: 2012
 Ohio Brain Injury Program and the Brain Injury Advisory Committee Biennial Report on the Incidence of Traumatic Brain Injury in Ohio: 212 Presented to the Brain Injury Advisory Committee Report Date: January
TRAUMATIC BRAIN INJURIES ARIZONA RESIDENTS 2013
 TRAUMATIC BRAIN INJURIES ARIZONA RESIDENTS 2013 Resources for the development of this report were provided through funding to the Arizona Department of Health Services from the Centers for Disease Control
2013 Rankings Indiana
 2013 Rankings Indiana Introduction Where we live matters to our health. The health of a community depends on many different factors, including the environment, education and jobs, access to and quality
State Data Report. ASTHO Breast Cancer Learning Community: Using Data to Address Disparities in Breast Cancer Mortality at the State Level
 State Data Report STATE HEALTH DEPARTMENT NAME: WV Bureau for Public Health Dr. Rahul Gupta, Commissioner ASTHO Breast Cancer Learning Community: Using Data to Address Disparities in Breast Cancer Mortality
CHAPTER 6: TOBACCO USE
 CHAPTER 6: TOBACCO USE Current Cigarette Smoking in 2006 Smoking at least 100 cigarettes in one s lifetime and currently smoking every day or some days. Prevalence WV: 25.7% (95% CI: 24.0-27.5) in 2006.
Tennessee Department of Health in collaboration with Tennessee State University and University of Tennessee Health Science Center
 Tennessee Department of Health in collaboration with Tennessee State University and University of Tennessee Health Science Center 2006 Tennessee Department of Health 2006 ACKNOWLEDGEMENTS CONTRIBUTING
Pennsylvania s Super-Utilizers of Hospital Care
 Pennsylvania s of Hospital Care Super-utilizer has been used to describe patients who have repeated inpatient hospital stays or who make frequent trips to hospital emergency rooms often across different
The new landscape for stroke research. Enrique Leira M.D., M.S. Associate Professor of Neurology University of Iowa PI: UIRCC StrokeNet
 The new landscape for stroke research Enrique Leira M.D., M.S. Associate Professor of Neurology University of Iowa PI: UIRCC StrokeNet NIH Randomized Clinical Trials (RCT) POPULATION STUDY Provide best
Mo Family-to-Family Network A Statewide Collaboration to Support Families
 Mo Family-to-Family Network A Statewide Collaboration to Support Families Michelle Sheli Reynolds, SIB, PhD Director of Individual Advocacy and Family Supports UMKC-Institute for Human Development, UCEDD
Provider Newsletter. Aetna Better Health of Kentucky IN THIS ISSUE
 Aetna Better Health of Kentucky Provider Newsletter First Quarter 2019 Welcome to the Aetna Better Health of Kentucky Quarterly Provider Newsletter! In these issues you will find important updates along
Unintentional Fall-Related Injuries among Older Adults in New Mexico
 Unintentional Fall-Related Injuries among Older Adults in New Mexico 214 Office of Injury Prevention Injury and Behavioral Epidemiology Bureau Epidemiology and Response Division Unintentional fall-related
Disparities in Cancer Incidence Among Residents of Appalachia Ohio
 Disparities in Cancer Incidence Among Residents of Ohio Ohio Cancer Incidence Surveillance System The Ohio Department of Health Arthur G. James Cancer Hospital and Richard J. Solove Research Institute
Table of Contents. 2 P age. Susan G. Komen
 ALABAMA Table of Contents Table of Contents... 2 Introduction... 3 About... 3 Susan G. Komen Affiliate Network... 3 Purpose of the State Community Profile Report... 4 Quantitative Data: Measuring Breast
DIRECTORY OF INDIANA COMMUNITY TRANSITION PROGRAMS
 DIRECTORY OF INDIANA COMMUNITY TRANSITION PROGRAMS A Partnership Between Indiana Department of Correction and Community Correction Counties Indiana Code 11-10-11-5 Created November 1, 2010 Adams *Case
Fatal Drug Overdoses: A Growing Concern in Indiana
 Figure 1: Number of Alcohol- and Drug-Induced Deaths in the United States, 1999 through 2004 35,000 30,000 I N D I A N A CENTER FOR HEALTH POLICY R E S E A R C H F O R A H E A L T H I E R I N D I A N A
CHAPTER 9: ALCOHOL CONSUMPTION
 CHAPTER 9: ALCOHOL CONSUMPTION Binge Drinking in 2004 and 2005 Definition Consumption of five or more alcoholic drinks on one or more occasions during the past one month. Prevalence WV: 9.7% (95% CI: 8.4-11.1)
1 in 37 Hospitalizations were Related to Opioids in (36,712 Opioid-Related Hospitalizations)
") October 2018 PA Health Care Cost Containment Council Research Briefs Hospital Admissions for Opioid Overdose and Opioid Use Disorder This research brief is part of a series produced by the PA Health Care
October 2018 PA Health Care Cost Containment Council Research Briefs Hospital Admissions for Opioid Overdose and Opioid Use Disorder This research brief is part of a series produced by the PA Health Care
2018 Oral Health Licensure Survey SCHOOL OF MEDICINE BOWEN CENTER FOR HEALTH WORKFORCE RESEARCH & POLICY. Data Report. Published: December 2018
 SCHOOL OF MEDICINE BOWEN CENTER FOR HEALTH WORKFORCE RESEARCH & POLICY 2018 Oral Health Licensure Survey Data Report 10 0 010 0 0110101010 0110 0 010 011010 010 0 010 0 0110110 0110 0110 0 010 010 0 010
General Information. * Are you a hospital or an LHD. Hospital LHD
 General Information * Are you a hospital or an LHD Hospital LHD Hospital Information * Hospital Name Year(s) of Current CHNA Year(s) of current Improvement Strategies/Plan What counties are represented/served
Pennsylvania Hospital Admissions for Diabetes
 November 2017 Pennsylvania Hospital Admissions for Examining hospital admissions for diabetes is one way to observe the quality of care provided to Pennsylvania residents with diabetes, especially as it
Hospitalizations for Opioid Overdose Population Differences
 September 2018 Hospitalizations for Opioid Overdose Population Differences This research brief is part of a series produced by the PA Health Care Cost Containment Council (PHC4) that examines opioid-related
Prevention and Treatment Approaches to Childhood Obesity
 Prevention and Treatment Approaches to Childhood Obesity http://chlnkc.org/current-projects/ http://chlnkc.org/our-members/ Research Dr. John Thyfaultmetabolism translational science related to obesity
Children labeled medically complex enrolled in Early Intervention. Susan Wiley, MD Jareen Meinzen-Derr, PhD Dan Choo, MD
 Children labeled medically complex enrolled in Early Intervention Susan Wiley, MD Jareen Meinzen-Derr, PhD Dan Choo, MD Background Approximately 40% of children with hearing loss have additional developmental
Mississippi. Data Sources:
 Data Sources: Multiple Cause of Death (MCOD) Files, 2009-2013, National Center for Health Statistics. The MCOD file is a census of all deaths in the U.S. and some territories. Five years data were combined
Hospital Discharge Data
 Hospital Discharge Data West Virginia Health Care Authority Hospitalization data were obtained from the West Virginia Health Care Authority s (WVHCA) hospital discharge database. Data are submitted by
Fatal primary malignancy of brain. Glioblasatoma, histologically
 TABLE 10.2 TBI and Brain Tumors Reference Study Design Population Type of TBI Health s or Annegers et al., 1979 Burch et al., 1987 Carpenter et al., 1987 Hochberg et al., 1984 Double cohort All TBI in
The Role of HMOs in Managing Diabetes Technical Notes
 The Role of HMOs in Managing Diabetes Technical Notes The 225 Market Street, Suite 400 Harrisburg, PA 17101 (717) 232-6787 www.phc4.org Foreword These Technical Notes are intended to accompany the public
University of Kentucky Center on Drug and Alcohol Research Monthly Report March 2011
 University of Kentucky Center on Drug and Alcohol Research Monthly Report March 2011 Grants Journals/Publications Knudsen, H. K. & Studts, J. L. (in press). Availability of nicotine replacement therapy
Delaware. Data Sources:
 Data Sources: Multiple Cause of Death (MCOD) Files, 2009-2013, National Center for Health Statistics. The MCOD file is a census of all deaths in the U.S. and some territories. Five years data were combined
SUSAN G. KOMEN LOUISVILLE
 SUSAN G. KOMEN LOUISVILLE Table of Contents Table of Contents... 2 Acknowledgments... 3 Introduction... 4 Affiliate History... 4 Affiliate Organizational Structure... 4 Affiliate Service Area... 4 Purpose
markey cancer center Annual Report
 Our Future is Bright markey cancer center 2013 14 Annual Report Jianhang Jia, PhD, researches cancer pathways innovation 1 markey cancer center growing by leaps and bounds 2 Oncofertility specialist joins
Chapter 14. Injuries with a Focus on Unintentional Injuries & Deaths
 Chapter 14 Injuries with a Focus on Unintentional Injuries & Deaths Learning Objectives By the end of this chapter the reader will be able to: Define the term intentionality of injury Describe environmental
SIM Outcomes and Data Acquisition Report CY 2015 and CY Policy Report. October 2017
 Policy Report October 2017 SIM Outcomes Data Acquisition Report CY 2015 CY 2016 Elizabeth T. Momany, PhD Associate Research Scientist Assistant Director, Health Policy Research Program Suzanne Bentler,
CHAPTER 11: ALCOHOL CONSUMPTION
 CHAPTER 11: ALCOHOL CONSUMPTION Heavy Drinking: Defined as consumption of more than two drinks per day for men and more than one drink per day for women during the past one month. 7 State Prevalence 3.1%
FINAL COMPUTATIONS - HB 4588 PUBLIC SCHOOL SUPPORT PROGRAM FOR THE YEAR
 Step 1a Step 1b Step 1 Step 1 Step 1 Basic Salary Increment Basic Equity Total Allowance For Principals Allowance Allowance Allowance Professional & Assistant Professional Professional Professional Educators