Applying Machine Learning Methods in Medical Research Studies
|
|
|
- Stuart Shepherd
- 5 years ago
- Views:
Transcription
1 Applying Machine Learning Methods in Medical Research Studies Daniel Stahl Department of Biostatistics and Health Informatics Psychiatry, Psychology & Neuroscience (IoPPN), King s College London daniel.r.stahl@kcl.ac.uk 1
2 Machine learning in medical research Machine learning (ML) explores the study and construction of algorithms that can learn from and make predictions on data (Mund 2013) Machine learning is concerned with prediction and automated model building Typically used to analyse large, complex datasets with the number of variables often larger than sample szie (p>>n): Bioinformatics Brain imaging (fmri) Clinical prediction models from large databases 2


3 Multiple tests: DNA micro arrays The aim of DNA micro array experiments is to detect differential gene expression. E.g. to identify genes expression changes under different treatment conditions or among different types of cell samples. Often hundred of thousands of genes are tested on the array for expression changes. R Jansen et al (2016)Gene expression in major depressive disorder. Mol. Psych. 21, ; 3

4 3-Dimensional Data fmri: Detect changes in brain activity somewhere in the brain: 64x64 voxel matrix 43 slices in the brain = voxels About 1/3 of this area is studied 50,000 voxels/ hypotheses tests Add time as 4 th dimension and you will get into s Does the brain activity change after a stimulus? Images: T. Nichols:
5 Clinical Prediction Models inform health care providers and patients about the risk of developing an disease, the risk of the presence of a disease and about the future course of an illness based on currently available information about the patient: Main types of clinical prediction models Risk prediction models Diagnostic models Prognostic models: Prediction models: predicts likely benefit of treatment (Personalized medicine)
6 Example: Chronic fatigue syndrome (CFS) Risk prediction What is the risk of a person who has family members with CFS to develop the condition themselves? Diagnosis Can we reliable diagnose a patient to have CFS and not suffering from an illness with similar symptoms (i.e. depression)? Prognosis: How likely is it that a patient diagnosed with CFS will recover if untreated? Prediction and Personalized medicine: Which of the three main treatments will most likely benefit a patient most? Which patients are most likely to benefit from Cognitive behavioural therapy?
7 Machine learning (ML) Typically used to analyse large, complex datasets with the number of variables often larger than sample szie (p>>n): Bioinformatics Brain imaging Clinical prediction models from large databases Risk prediction models Diagnostic models Prognostic models: Prediction of treatment success (Personalized Medicne) Statistical modelling is predominately used in other medical research areas. Why?
8 Outline Why are Machine learning methods not more widely used in many medical research areas? Differences between machine learning and statistical modelling Can we implement machine learning methods alongside statistical modelling to improve medical research? Example: Problems of low reproducibility in medical research due to selective inference (i.e. multiple testing) Example form autism research using lasso regression methods Outlook 8
9 Describing and explaining the world Statistical modelling is the formalization of relationships between variables in the form of mathematical equations. we infer the process by which data was generated! theory-driven Statistical models, such as regression, are therefore typically used for explanatory research to assess causal hypotheses that explain why and how empirical phenomena occur (Gregor 2006) explanatory research usually infers from a random sample to an expected mean response of the underlying population. 9
10 10
11 Example of Explaining the world D. Stahl et al. 2014) Mechanisms of change underlying the efficacy of cognitive behaviour therapy for chronic fatigue syndrome : a mediation analysis. Psychological Medicine (2014), 44,
12 Statistical modelling Construct causes construct, via the function, such that =. and are operationalized by measurable variables X and Y and the model by a statistical model f, such as E(Y)=f(X) In explanatory research we aim to match f as closely as possible to to assess (or develop new) theoretical hypotheses/models. X and Y are tools for estimating to assess causal hypotheses Theoretical prediction: theory predicts an association between X and Y) and less empirical prediction 12
13 Machine Learning In machine learning the true data generating process is less of importance: X and Y are of interest and the function f is used as a tool for generating accurate predictions of unseen Y values: Even if = describes the causal relationships other functions than and variables other than X can be better predictors of Y. ML algorithms are optimized for the purpose of predicting new or future observations, while in explanatory research minimizing the bias is the key criterion to select a best model Implications for model selection and estimation: 13
14 Expected Prediction Error We assume that there is a relationship between outcome Y (depression score) and at least one of the p independent variables X (clinical and demographic characteristics) We can model the relationships as: and where is an unknown function random error with mean 0 and variance σ Then the expected prediction error (EPE) is EPE = E(Y ) 2 )) σ 14
15 Bias and Variance )) + σ Bias 2 error + Model estimation variance + Irreducible error Bias is result of misspecifying the model f Estimation variance is result of using sample to estimate f() σ is irreducible error even if the model f is correctly specified and estimated SD1 15
16 Slide 15 SD1 remove? Stahl, Daniel, 03/09/2016
17 Explanatory vs. Prediction Modelling Explanatory modelling: minimizing model bias and then sampling variance by minimizing the residual sum of squares between observed and predicted responses of the same data set (i.e. BLUE). Machine learning and predictive modelling: minimizing combination of model bias and sampling variance by minimizing the residual sum of squares between observed and predicted responses of an unseen (new) data set (using e.g. cross-validation) Theoretical model itself is not of interest ( Black box ) Tension between explanatory and predictive modelling because the best explanatory model may differ from the best predictive model (Sober 2006). 16
18 Explanatory research Prediction Who is interested? Mainly academia Until recently: more outside Academia Methodology Main interest Statistical modelling using inference, usually using probability models Unbiased estimates (correct model) Machine learning: learn from data in order to make predictions Prediction of Y for unseen cases Biggest threat Confounding Poor prediction of new cases Omitted variables Explained Variance r 2 Multicollinearity Missing data Measurement error Omission of confounder variables can invalidate conclusions Nice but not necessary, large sample size may compensate Major concern because accurate parameter estimates are under threat Major concern: potential serious bias, major developments in last 30 years Great concern because measurement error in predictors produces bias can Mostly ignored because interpretation of model is not of interest Crucial Minor concern because interpretation is not of importance Hardly addressed, missing data indicator is often sufficient for model Variables with many missing data are useless Only concern because of loss of predictive power Adapted from: Paul Allison (2014)

19 Explanatory research and selective inference The explanatory approach using statistical modelling works very well with a few well specified models. However, with a large number of variables and applying variable selection procedures to select a subset of variables problems with overfitting and the validity of statistical inference will occur. Presenting a final reduced model ignoring the assessments of excluded variables (selective inference) greatly exaggerates the apparent strength of a predictor and the assessment of its significance! Selective inference is a main causes in the low reproducibility of studies in medical research or other sciences. 18


20 Cited 4441 times
21 Using ML for explanatory modelling Machine learning is mainly used for prediction modelling Can we use machine learning for medical research besides prediction modelling? Can we use it for explanatory modelling in theory building and theory testing? Can we use it for reducing the problem of over-fitting and selective inference? 20
22 ML methods for explanatory research A model that achieve both explanation and prediction - will have to compromise: If causal explanation is main purpose we can assess predictive ability of a causal model and may modify the model if predictive ability is not satisfactory. If prediction is primary aim we can build a prediction model that is relatively transparent but sacrifice some predictive power. Regularized models are a promising method to use ML for explanatory research 21
23 Statistical Learning In recent years ML and Statistics are merging into Statistical Learning Theory The theory describes the properties of learning algorithms in a probabilistic framework and say how well algorithms can be expected to do at producing rules with minimum expected error on new cases. Statistical learning methods can be used to adjust regression models with good prediction modelling abilities and allowing to understand the process of predication! penalized or regularized methods
24 Regularized regressions methods A modern approach to prediction modelling are regularized or penalized methods that can be applied to both large data sets (bioinformatics, neuroimaging) and small data sets with a large number of variables (RCTs, experimental studies, cohort studies). Not really new: Ridge regression: Arthur Hoerl and Robert Kennard (1970) limited computer power restricted their use 23
25 Loss function The performance of our model function is measured by a loss function for penalizing error in prediction. Popular one is the squared loss function We decide to choose the function f(x) which minimizes the expected loss or here the expected mean squared error (MSE). The expected MSE can be estimated by cross-validation or bootstrapping methods. In the linear regression case, the OLS usually does not provide the best solution. 2 24
26 Avoiding overfitting by penalising When a model over-fits the data, standard estimates of regression coefficients are inflated or unstable: poor prediction and generalization power Shrinkage of regression coefficients is an important technique to battle overfitting and to improve prediction accuracy in ML Estimates can be stabilised (regularised) by adding a penalty to the estimating equations For linear regressions, the penalty is added to the sum of squared errors(sse): Penalty term 25
27 Penalty functions Three commonly used penalty functions are 1. Ridge penalty: sum of squared coefficients ( 2 ) forms the penalty Also called L2 norm 2. LASSO (Least Absolute Shrinkage and Selection Operator): sum of absolute coefficients ( ) forms the penalty Also called L1 norm 3. Elastic net a combination of L1 and L2 norm regularization 26
28 Regularized LASSO regression LASSO penalize the size of the regression coefficients based on their norm: LASSO tends to select one variable from a group of correlated variables automatic variable selection 27
 We")
29 How to select Lambda? Goal is to evaluate the model in terms of it s ability to predict future observations: the model need to be evaluated on a dataset that was not used to build the model (test sets) We assess different lambdas and choose the one which predicts best unseen cases using cross-validation This best lambda is used fit the model using the complete data set 28
30 Example: Regularized regression Data set with 21 predictor variables, N=100 Regression coefficients of final model (lambda =0.17): Variable 1 to 20: 0 Variable 21:
31 Using hold-out data for prediction accuracy estimation Using CV to select optimal selects the best set of predictors of unseen cases. However: Prediction accuracy measures are over-optimistic estimates for accuracy of future sample: CV test data were used to select our model! Often ignored! 30

32 Nested Cross-validation We need to retain an independent test dataset that shall never be used for parameter tuning. Or else, our results will be over-optimistic. Internal validation fold Model selection fold from: Sebastian Raschka, 31
33 Application of Lasso Example of prediction model to classify infants at risk for autism based on event-related potential (ERP) studies 32


34 Event-related potential (ERP) ERPs are electrical brain activity recordings that are direct result of a specific stimulus (external or internal event). ERPs are commonly quantified by measuring the amplitude and latency of observable peaks of the signal time-locked stimulus These signals provide real-time indices of neural information processing and allow assessing cognitive processes. From: 33
35 Applying Lasso to ERP data Elsabbagh et al. (2009) investigated ERP correlates of eye gaze processing in 36 ten-months old infants. Two groups: infants with autistic siblings ( at risk -group ) versus control infants Two experimental conditions: direct gaze and averted gaze 18 averaged ERP measurements per experimental condition from (= 36 measurements per infant) were available Standard logistic regression is not possible Univariate tests (or stepwise model selection) will result in inflated alpha errors Methodological tasks: How to best to classify infants as to their group (at-risk group versus control group) Which ERP signals are responsible for group differences? 34
36 Regularized logistic regression Lasso In logistic regression we replace the residual sum of squares by the corresponding residual sum of the squared deviance residuals (equivalent to -2LogLiklihood or Deviance) 35
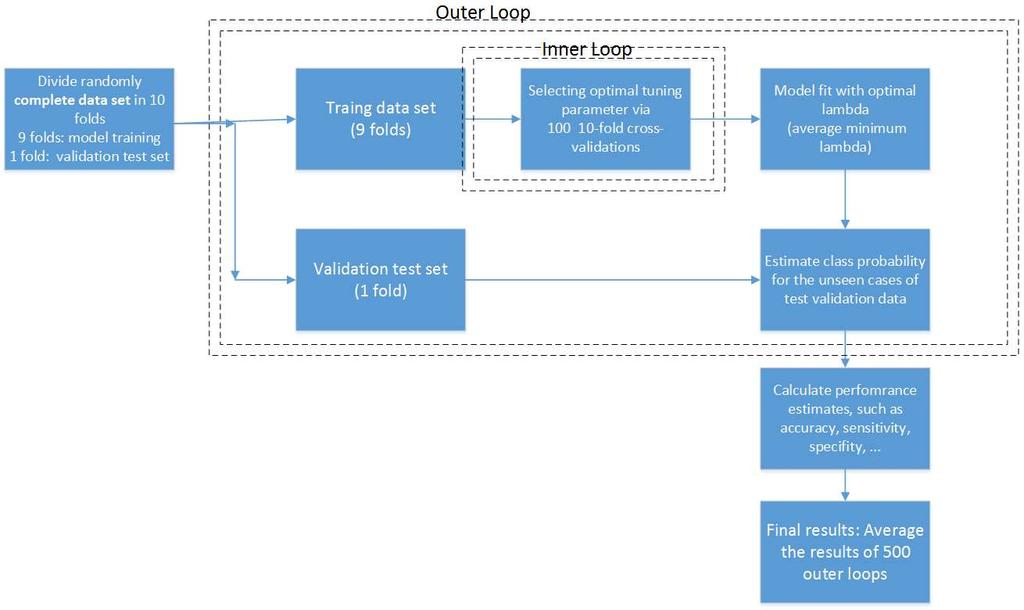
37 Methods used Regularized logistic regression Lasso Nested cross-validation 500 outer loops with 10 fold cross-validation to estimate prediction accuracy (internal validity) 100 inner loops with 10 fold cross validation to select optimal lambda Final model based on averaged lambda Measures of predictive power: Area under the curve (AUC) or c statistics Sensitivity Specifity % correct classification KCL1 36
38 Slide 36 KCL1 Such a statistic is an estimated conditional probability that for any pair of case and control, the predicted risk of an event is higher for the case [6]. King's College London, 02/09/2016
39 Nested Cross-validation 37
40 Results The final model selected 8 out of 36 variables. P400lat_D_Occ shows the largest effect size and is the only electrode selected if we select the tolerance (minimal + 1SE = stronger penalty)) Electrode st. Odds ratio N1_D_Left 1.30 N1_A_Left 1.61 N2_D_Left 1.16 N2_A_Right 1.54 N1Lat_D_Right 1.19 N1Lat_D_Cent 1.09 P400_D_Occ 1.22 P400lat_D_Occ 2.44 (IQR) 38
41 Internal validity Internal validity estimates (95% range) based on nested CV: Area under the curve (AUC): 0.63 (0.52 to 0.71) Accuracy: 58.3% (50% to 66.7%) Specificity for risk group: 52.9% (47.2% to 63.2%) Sensitivity for risk group: 63.2% (57.2% to 64.7%) Permutation test showed that measures are above chance. 39
42 Summary of results Lasso regression predicted group membership above chance, which suggest that at-risk group is different from control group. Automatic variable selection suggest that prolonged latency of occipital P400 ERP electrode in direct gaze condition is mainly responsible for discrimination. This signal is known to be sensitive to face processing in infants Atypical response in at 10 months old at risk -group infants? In agreement with theory about development of autism! 40
43 Case-control studies Before concluding that an individual study's conclusions are valid, one must consider three sources of error that might provide an alternative explanation for the findings. These are: Random Error Confounding Other Bias: e.g. selection bias (control group parents are more social ) Cross-validation only controls for random error!
44 Conclusion We need to be aware of the differences of explanatory and prediction modelling research and their methodologies Machine learning methods are prediction models: build models which minimizes the prediction error of unseen data Machine learning methods combined with cross-validation can also be useful in explanatory research or causal modelling. Regularization ML methods are useful to increase the reproducibility of studies in medical research by avoiding avoid multiple testing problems/model selection problems 42
45 Outlook Medical research should integrate machine learning as a promising tool for explanatory research, such as: New theory generation/explorative data analyses Measurement development Comparison of competing theories Improvement of existing models Relevance assessment Assessment of predictive power of empirical models ML can be used for discovery of new constructs, identifying relationships, refinement of existing models and identifying unknown pattern. ML community can also learn from Statisticians: confounding, sampling bias, missing data Combining machine learning and statistical methods ( Statistical Learning ) are of great interest to improve both explanatory medical research. 43
46 Thank you for your attention Thanks to Mayada Elsabbagh (McGill) and Mark H. Johnson (Birkbeck) and the BASIS team for providing their data Shmueli, G. (2010) To explain or to predict? Statistical Science 25, Gregor, S (2006) The nature of theory in information systems. MIS Quarterly 30, Sober (2006) Parsimony: In The Philosophy of Science: An Encyclopaedia. Routledge: Oxford 44
Chapter 11: Advanced Remedial Measures. Weighted Least Squares (WLS)
") Chapter : Advanced Remedial Measures Weighted Least Squares (WLS) When the error variance appears nonconstant, a transformation (of Y and/or X) is a quick remedy. But it may not solve the problem, or it
Chapter : Advanced Remedial Measures Weighted Least Squares (WLS) When the error variance appears nonconstant, a transformation (of Y and/or X) is a quick remedy. But it may not solve the problem, or it
The impact of pre-selected variance inflation factor thresholds on the stability and predictive power of logistic regression models in credit scoring
 Volume 31 (1), pp. 17 37 http://orion.journals.ac.za ORiON ISSN 0529-191-X 2015 The impact of pre-selected variance inflation factor thresholds on the stability and predictive power of logistic regression
Analysis of Rheumatoid Arthritis Data using Logistic Regression and Penalized Approach
 University of South Florida Scholar Commons Graduate Theses and Dissertations Graduate School November 2015 Analysis of Rheumatoid Arthritis Data using Logistic Regression and Penalized Approach Wei Chen
RISK PREDICTION MODEL: PENALIZED REGRESSIONS
 RISK PREDICTION MODEL: PENALIZED REGRESSIONS Inspired from: How to develop a more accurate risk prediction model when there are few events Menelaos Pavlou, Gareth Ambler, Shaun R Seaman, Oliver Guttmann,
Summary of main challenges and future directions
 Summary of main challenges and future directions Martin Schumacher Institute of Medical Biometry and Medical Informatics, University Medical Center, Freiburg Workshop October 2008 - F1 Outline Some historical
MODEL SELECTION STRATEGIES. Tony Panzarella
 MODEL SELECTION STRATEGIES Tony Panzarella Lab Course March 20, 2014 2 Preamble Although focus will be on time-to-event data the same principles apply to other outcome data Lab Course March 20, 2014 3
What is Regularization? Example by Sean Owen
 What is Regularization? Example by Sean Owen What is Regularization? Name3 Species Size Threat Bo snake small friendly Miley dog small friendly Fifi cat small enemy Muffy cat small friendly Rufus dog large
Multivariate Regression with Small Samples: A Comparison of Estimation Methods W. Holmes Finch Maria E. Hernández Finch Ball State University
 Multivariate Regression with Small Samples: A Comparison of Estimation Methods W. Holmes Finch Maria E. Hernández Finch Ball State University High dimensional multivariate data, where the number of variables
MS&E 226: Small Data
 MS&E 226: Small Data Lecture 10: Introduction to inference (v2) Ramesh Johari ramesh.johari@stanford.edu 1 / 17 What is inference? 2 / 17 Where did our data come from? Recall our sample is: Y, the vector
Introduction to Machine Learning. Katherine Heller Deep Learning Summer School 2018
 Introduction to Machine Learning Katherine Heller Deep Learning Summer School 2018 Outline Kinds of machine learning Linear regression Regularization Bayesian methods Logistic Regression Why we do this
Article from. Forecasting and Futurism. Month Year July 2015 Issue Number 11
 Article from Forecasting and Futurism Month Year July 2015 Issue Number 11 Calibrating Risk Score Model with Partial Credibility By Shea Parkes and Brad Armstrong Risk adjustment models are commonly used
Review: Logistic regression, Gaussian naïve Bayes, linear regression, and their connections
 Review: Logistic regression, Gaussian naïve Bayes, linear regression, and their connections New: Bias-variance decomposition, biasvariance tradeoff, overfitting, regularization, and feature selection Yi
Anale. Seria Informatică. Vol. XVI fasc Annals. Computer Science Series. 16 th Tome 1 st Fasc. 2018
 HANDLING MULTICOLLINEARITY; A COMPARATIVE STUDY OF THE PREDICTION PERFORMANCE OF SOME METHODS BASED ON SOME PROBABILITY DISTRIBUTIONS Zakari Y., Yau S. A., Usman U. Department of Mathematics, Usmanu Danfodiyo
SUPPLEMENTARY INFORMATION. Table 1 Patient characteristics Preoperative. language testing
 Categorical Speech Representation in the Human Superior Temporal Gyrus Edward F. Chang, Jochem W. Rieger, Keith D. Johnson, Mitchel S. Berger, Nicholas M. Barbaro, Robert T. Knight SUPPLEMENTARY INFORMATION
Variable selection should be blinded to the outcome
 Variable selection should be blinded to the outcome Tamás Ferenci Manuscript type: Letter to the Editor Title: Variable selection should be blinded to the outcome Author List: Tamás Ferenci * (Physiological
CHAPTER VI RESEARCH METHODOLOGY
 CHAPTER VI RESEARCH METHODOLOGY 6.1 Research Design Research is an organized, systematic, data based, critical, objective, scientific inquiry or investigation into a specific problem, undertaken with the
3. Model evaluation & selection
 Foundations of Machine Learning CentraleSupélec Fall 2016 3. Model evaluation & selection Chloé-Agathe Azencot Centre for Computational Biology, Mines ParisTech chloe-agathe.azencott@mines-paristech.fr
Multiple Regression. James H. Steiger. Department of Psychology and Human Development Vanderbilt University
 Multiple Regression James H. Steiger Department of Psychology and Human Development Vanderbilt University James H. Steiger (Vanderbilt University) Multiple Regression 1 / 19 Multiple Regression 1 The Multiple
Network-based pattern recognition models for neuroimaging
 Network-based pattern recognition models for neuroimaging Maria J. Rosa Centre for Neuroimaging Sciences, Institute of Psychiatry King s College London, UK Outline Introduction Pattern recognition Network-based
Selection and Combination of Markers for Prediction
 Selection and Combination of Markers for Prediction NACC Data and Methods Meeting September, 2010 Baojiang Chen, PhD Sarah Monsell, MS Xiao-Hua Andrew Zhou, PhD Overview 1. Research motivation 2. Describe
UNIVERSITY of PENNSYLVANIA CIS 520: Machine Learning Final, Fall 2014
 UNIVERSITY of PENNSYLVANIA CIS 520: Machine Learning Final, Fall 2014 Exam policy: This exam allows two one-page, two-sided cheat sheets (i.e. 4 sides); No other materials. Time: 2 hours. Be sure to write
investigate. educate. inform.
 investigate. educate. inform. Research Design What drives your research design? The battle between Qualitative and Quantitative is over Think before you leap What SHOULD drive your research design. Advanced
(CORRELATIONAL DESIGN AND COMPARATIVE DESIGN)
") UNIT 4 OTHER DESIGNS (CORRELATIONAL DESIGN AND COMPARATIVE DESIGN) Quasi Experimental Design Structure 4.0 Introduction 4.1 Objectives 4.2 Definition of Correlational Research Design 4.3 Types of Correlational
UNIT 4 OTHER DESIGNS (CORRELATIONAL DESIGN AND COMPARATIVE DESIGN) Quasi Experimental Design Structure 4.0 Introduction 4.1 Objectives 4.2 Definition of Correlational Research Design 4.3 Types of Correlational
Biostatistics II
 Biostatistics II 514-5509 Course Description: Modern multivariable statistical analysis based on the concept of generalized linear models. Includes linear, logistic, and Poisson regression, survival analysis,
Ridge regression for risk prediction
 Ridge regression for risk prediction with applications to genetic data Erika Cule and Maria De Iorio Imperial College London Department of Epidemiology and Biostatistics School of Public Health May 2012
Prognosticating Autism Spectrum Disorder Using Artificial Neural Network: Levenberg-Marquardt Algorithm
 Research Article Prognosticating Autism Spectrum Disorder Using Artificial Neural Network: Levenberg-Marquardt Algorithm Avishek Choudhury*, Christopher M Greene Binghamton University, New York, USA *Corresponding
Epidemiologic Methods I & II Epidem 201AB Winter & Spring 2002
 DETAILED COURSE OUTLINE Epidemiologic Methods I & II Epidem 201AB Winter & Spring 2002 Hal Morgenstern, Ph.D. Department of Epidemiology UCLA School of Public Health Page 1 I. THE NATURE OF EPIDEMIOLOGIC
Regression Discontinuity Analysis
 Regression Discontinuity Analysis A researcher wants to determine whether tutoring underachieving middle school students improves their math grades. Another wonders whether providing financial aid to low-income
Technical Specifications
 Technical Specifications In order to provide summary information across a set of exercises, all tests must employ some form of scoring models. The most familiar of these scoring models is the one typically
Stepwise method Modern Model Selection Methods Quantile-Quantile plot and tests for normality
 Week 9 Hour 3 Stepwise method Modern Model Selection Methods Quantile-Quantile plot and tests for normality Stat 302 Notes. Week 9, Hour 3, Page 1 / 39 Stepwise Now that we've introduced interactions,
CSE 258 Lecture 2. Web Mining and Recommender Systems. Supervised learning Regression
 CSE 258 Lecture 2 Web Mining and Recommender Systems Supervised learning Regression Supervised versus unsupervised learning Learning approaches attempt to model data in order to solve a problem Unsupervised
2.75: 84% 2.5: 80% 2.25: 78% 2: 74% 1.75: 70% 1.5: 66% 1.25: 64% 1.0: 60% 0.5: 50% 0.25: 25% 0: 0%
 Capstone Test (will consist of FOUR quizzes and the FINAL test grade will be an average of the four quizzes). Capstone #1: Review of Chapters 1-3 Capstone #2: Review of Chapter 4 Capstone #3: Review of
Classification and Statistical Analysis of Auditory FMRI Data Using Linear Discriminative Analysis and Quadratic Discriminative Analysis
 International Journal of Innovative Research in Computer Science & Technology (IJIRCST) ISSN: 2347-5552, Volume-2, Issue-6, November-2014 Classification and Statistical Analysis of Auditory FMRI Data Using
An Introduction to Bayesian Statistics
 An Introduction to Bayesian Statistics Robert Weiss Department of Biostatistics UCLA Fielding School of Public Health robweiss@ucla.edu Sept 2015 Robert Weiss (UCLA) An Introduction to Bayesian Statistics
SISCR Module 7 Part I: Introduction Basic Concepts for Binary Biomarkers (Classifiers) and Continuous Biomarkers
 and Continuous Biomarkers") SISCR Module 7 Part I: Introduction Basic Concepts for Binary Biomarkers (Classifiers) and Continuous Biomarkers Kathleen Kerr, Ph.D. Associate Professor Department of Biostatistics University of Washington
SISCR Module 7 Part I: Introduction Basic Concepts for Binary Biomarkers (Classifiers) and Continuous Biomarkers Kathleen Kerr, Ph.D. Associate Professor Department of Biostatistics University of Washington
UNIVERSITY of PENNSYLVANIA CIS 520: Machine Learning Midterm, 2016
 UNIVERSITY of PENNSYLVANIA CIS 520: Machine Learning Midterm, 2016 Exam policy: This exam allows one one-page, two-sided cheat sheet; No other materials. Time: 80 minutes. Be sure to write your name and
11/18/2013. Correlational Research. Correlational Designs. Why Use a Correlational Design? CORRELATIONAL RESEARCH STUDIES
 Correlational Research Correlational Designs Correlational research is used to describe the relationship between two or more naturally occurring variables. Is age related to political conservativism? Are
Data and Statistics 101: Key Concepts in the Collection, Analysis, and Application of Child Welfare Data
 TECHNICAL REPORT Data and Statistics 101: Key Concepts in the Collection, Analysis, and Application of Child Welfare Data CONTENTS Executive Summary...1 Introduction...2 Overview of Data Analysis Concepts...2
Machine Learning to Inform Breast Cancer Post-Recovery Surveillance
 Machine Learning to Inform Breast Cancer Post-Recovery Surveillance Final Project Report CS 229 Autumn 2017 Category: Life Sciences Maxwell Allman (mallman) Lin Fan (linfan) Jamie Kang (kangjh) 1 Introduction
CHAMP: CHecklist for the Appraisal of Moderators and Predictors
 CHAMP - Page 1 of 13 CHAMP: CHecklist for the Appraisal of Moderators and Predictors About the checklist In this document, a CHecklist for the Appraisal of Moderators and Predictors (CHAMP) is presented.
Lecture Outline. Biost 590: Statistical Consulting. Stages of Scientific Studies. Scientific Method
 Biost 590: Statistical Consulting Statistical Classification of Scientific Studies; Approach to Consulting Lecture Outline Statistical Classification of Scientific Studies Statistical Tasks Approach to
Russian Journal of Agricultural and Socio-Economic Sciences, 3(15)
") ON THE COMPARISON OF BAYESIAN INFORMATION CRITERION AND DRAPER S INFORMATION CRITERION IN SELECTION OF AN ASYMMETRIC PRICE RELATIONSHIP: BOOTSTRAP SIMULATION RESULTS Henry de-graft Acquah, Senior Lecturer
ON THE COMPARISON OF BAYESIAN INFORMATION CRITERION AND DRAPER S INFORMATION CRITERION IN SELECTION OF AN ASYMMETRIC PRICE RELATIONSHIP: BOOTSTRAP SIMULATION RESULTS Henry de-graft Acquah, Senior Lecturer
Classification. Methods Course: Gene Expression Data Analysis -Day Five. Rainer Spang
 Classification Methods Course: Gene Expression Data Analysis -Day Five Rainer Spang Ms. Smith DNA Chip of Ms. Smith Expression profile of Ms. Smith Ms. Smith 30.000 properties of Ms. Smith The expression
Propensity Score Methods for Estimating Causality in the Absence of Random Assignment: Applications for Child Care Policy Research
 2012 CCPRC Meeting Methodology Presession Workshop October 23, 2012, 2:00-5:00 p.m. Propensity Score Methods for Estimating Causality in the Absence of Random Assignment: Applications for Child Care Policy
Propensity Score Analysis Shenyang Guo, Ph.D.
 Propensity Score Analysis Shenyang Guo, Ph.D. Upcoming Seminar: April 7-8, 2017, Philadelphia, Pennsylvania Propensity Score Analysis 1. Overview 1.1 Observational studies and challenges 1.2 Why and when
4. Model evaluation & selection
 Foundations of Machine Learning CentraleSupélec Fall 2017 4. Model evaluation & selection Chloé-Agathe Azencot Centre for Computational Biology, Mines ParisTech chloe-agathe.azencott@mines-paristech.fr
Applications. DSC 410/510 Multivariate Statistical Methods. Discriminating Two Groups. What is Discriminant Analysis
 DSC 4/5 Multivariate Statistical Methods Applications DSC 4/5 Multivariate Statistical Methods Discriminant Analysis Identify the group to which an object or case (e.g. person, firm, product) belongs:
Introduction to Computational Neuroscience
 Introduction to Computational Neuroscience Lecture 5: Data analysis II Lesson Title 1 Introduction 2 Structure and Function of the NS 3 Windows to the Brain 4 Data analysis 5 Data analysis II 6 Single
Write your identification number on each paper and cover sheet (the number stated in the upper right hand corner on your exam cover).
.") STOCKHOLM UNIVERSITY Department of Economics Course name: Empirical methods 2 Course code: EC2402 Examiner: Per Pettersson-Lidbom Number of credits: 7,5 credits Date of exam: Sunday 21 February 2010 Examination
STOCKHOLM UNIVERSITY Department of Economics Course name: Empirical methods 2 Course code: EC2402 Examiner: Per Pettersson-Lidbom Number of credits: 7,5 credits Date of exam: Sunday 21 February 2010 Examination
CHAPTER 4 RESULTS. In this chapter the results of the empirical research are reported and discussed in the following order:
 71 CHAPTER 4 RESULTS 4.1 INTRODUCTION In this chapter the results of the empirical research are reported and discussed in the following order: (1) Descriptive statistics of the sample; the extraneous variables;
What is Multilevel Modelling Vs Fixed Effects. Will Cook Social Statistics
 What is Multilevel Modelling Vs Fixed Effects Will Cook Social Statistics Intro Multilevel models are commonly employed in the social sciences with data that is hierarchically structured Estimated effects
Study Guide #2: MULTIPLE REGRESSION in education
 Study Guide #2: MULTIPLE REGRESSION in education What is Multiple Regression? When using Multiple Regression in education, researchers use the term independent variables to identify those variables that
Chapter 1: Explaining Behavior
 Chapter 1: Explaining Behavior GOAL OF SCIENCE is to generate explanations for various puzzling natural phenomenon. - Generate general laws of behavior (psychology) RESEARCH: principle method for acquiring
Introduction to Computational Neuroscience
 Introduction to Computational Neuroscience Lecture 10: Brain-Computer Interfaces Ilya Kuzovkin So Far Stimulus So Far So Far Stimulus What are the neuroimaging techniques you know about? Stimulus So Far
Identification of Tissue Independent Cancer Driver Genes
 Identification of Tissue Independent Cancer Driver Genes Alexandros Manolakos, Idoia Ochoa, Kartik Venkat Supervisor: Olivier Gevaert Abstract Identification of genomic patterns in tumors is an important
Inferential Statistics
 Inferential Statistics and t - tests ScWk 242 Session 9 Slides Inferential Statistics Ø Inferential statistics are used to test hypotheses about the relationship between the independent and the dependent
Multiple Regression Analysis
 Multiple Regression Analysis Basic Concept: Extend the simple regression model to include additional explanatory variables: Y = β 0 + β1x1 + β2x2 +... + βp-1xp + ε p = (number of independent variables
Multivariable Systems. Lawrence Hubert. July 31, 2011
 Multivariable July 31, 2011 Whenever results are presented within a multivariate context, it is important to remember that there is a system present among the variables, and this has a number of implications
Sum of Neurally Distinct Stimulus- and Task-Related Components.
 SUPPLEMENTARY MATERIAL for Cardoso et al. 22 The Neuroimaging Signal is a Linear Sum of Neurally Distinct Stimulus- and Task-Related Components. : Appendix: Homogeneous Linear ( Null ) and Modified Linear
Multiple Regression Models
 Multiple Regression Models Advantages of multiple regression Parts of a multiple regression model & interpretation Raw score vs. Standardized models Differences between r, b biv, b mult & β mult Steps
DATA MANAGEMENT & TYPES OF ANALYSES OFTEN USED. Dennis L. Molfese University of Nebraska - Lincoln
 DATA MANAGEMENT & TYPES OF ANALYSES OFTEN USED Dennis L. Molfese University of Nebraska - Lincoln 1 DATA MANAGEMENT Backups Storage Identification Analyses 2 Data Analysis Pre-processing Statistical Analysis
IAPT: Regression. Regression analyses
 Regression analyses IAPT: Regression Regression is the rather strange name given to a set of methods for predicting one variable from another. The data shown in Table 1 and come from a student project
PSYCH-GA.2211/NEURL-GA.2201 Fall 2016 Mathematical Tools for Cognitive and Neural Science. Homework 5
 PSYCH-GA.2211/NEURL-GA.2201 Fall 2016 Mathematical Tools for Cognitive and Neural Science Homework 5 Due: 21 Dec 2016 (late homeworks penalized 10% per day) See the course web site for submission details.
SISCR Module 4 Part III: Comparing Two Risk Models. Kathleen Kerr, Ph.D. Associate Professor Department of Biostatistics University of Washington
 SISCR Module 4 Part III: Comparing Two Risk Models Kathleen Kerr, Ph.D. Associate Professor Department of Biostatistics University of Washington Outline of Part III 1. How to compare two risk models 2.
Introduction to diagnostic accuracy meta-analysis. Yemisi Takwoingi October 2015
 Introduction to diagnostic accuracy meta-analysis Yemisi Takwoingi October 2015 Learning objectives To appreciate the concept underlying DTA meta-analytic approaches To know the Moses-Littenberg SROC method
Combining machine learning and matching techniques to improve causal inference in program evaluation
 bs_bs_banner Journal of Evaluation in Clinical Practice ISSN1365-2753 Combining machine learning and matching techniques to improve causal inference in program evaluation Ariel Linden DrPH 1,2 and Paul
Computer Age Statistical Inference. Algorithms, Evidence, and Data Science. BRADLEY EFRON Stanford University, California
 Computer Age Statistical Inference Algorithms, Evidence, and Data Science BRADLEY EFRON Stanford University, California TREVOR HASTIE Stanford University, California ggf CAMBRIDGE UNIVERSITY PRESS Preface
Template 1 for summarising studies addressing prognostic questions
 Template 1 for summarising studies addressing prognostic questions Instructions to fill the table: When no element can be added under one or more heading, include the mention: O Not applicable when an
Part [2.1]: Evaluation of Markers for Treatment Selection Linking Clinical and Statistical Goals
![Part [2.1]: Evaluation of Markers for Treatment Selection Linking Clinical and Statistical Goals](/thumbs/94/121286452.jpg "Part [2.1]: Evaluation of Markers for Treatment Selection Linking Clinical and Statistical Goals") Part [2.1]: Evaluation of Markers for Treatment Selection Linking Clinical and Statistical Goals Patrick J. Heagerty Department of Biostatistics University of Washington 174 Biomarkers Session Outline
Part [2.1]: Evaluation of Markers for Treatment Selection Linking Clinical and Statistical Goals Patrick J. Heagerty Department of Biostatistics University of Washington 174 Biomarkers Session Outline
Citation for published version (APA): Ebbes, P. (2004). Latent instrumental variables: a new approach to solve for endogeneity s.n.
: Ebbes, P. (2004). Latent instrumental variables: a new approach to solve for endogeneity s.n.") University of Groningen Latent instrumental variables Ebbes, P. IMPORTANT NOTE: You are advised to consult the publisher's version (publisher's PDF) if you wish to cite from it. Please check the document
University of Groningen Latent instrumental variables Ebbes, P. IMPORTANT NOTE: You are advised to consult the publisher's version (publisher's PDF) if you wish to cite from it. Please check the document
Methods for Addressing Selection Bias in Observational Studies
 Methods for Addressing Selection Bias in Observational Studies Susan L. Ettner, Ph.D. Professor Division of General Internal Medicine and Health Services Research, UCLA What is Selection Bias? In the regression
A Comparative Study of Some Estimation Methods for Multicollinear Data
 International Journal of Engineering and Applied Sciences (IJEAS) A Comparative Study of Some Estimation Methods for Multicollinear Okeke Evelyn Nkiruka, Okeke Joseph Uchenna Abstract This article compares
11/24/2017. Do not imply a cause-and-effect relationship
 Correlational research is used to describe the relationship between two or more naturally occurring variables. Is age related to political conservativism? Are highly extraverted people less afraid of rejection
Supplementary Materials
 Supplementary Materials July 2, 2015 1 EEG-measures of consciousness Table 1 makes explicit the abbreviations of the EEG-measures. Their computation closely follows Sitt et al. (2014) (supplement). PE
Experimental Psychology
 Title Experimental Psychology Type Individual Document Map Authors Aristea Theodoropoulos, Patricia Sikorski Subject Social Studies Course None Selected Grade(s) 11, 12 Location Roxbury High School Curriculum
Testing Statistical Models to Improve Screening of Lung Cancer
 Testing Statistical Models to Improve Screening of Lung Cancer 1 Elliot Burghardt: University of Iowa Daren Kuwaye: University of Hawai i at Mānoa Iowa Summer Institute in Biostatistics - University of
Unit 1 Exploring and Understanding Data
 Unit 1 Exploring and Understanding Data Area Principle Bar Chart Boxplot Conditional Distribution Dotplot Empirical Rule Five Number Summary Frequency Distribution Frequency Polygon Histogram Interquartile
Lecture Outline Biost 517 Applied Biostatistics I
 Lecture Outline Biost 517 Applied Biostatistics I Scott S. Emerson, M.D., Ph.D. Professor of Biostatistics University of Washington Lecture 2: Statistical Classification of Scientific Questions Types of
Clustering Autism Cases on Social Functioning
 Clustering Autism Cases on Social Functioning Nelson Ray and Praveen Bommannavar 1 Introduction Autism is a highly heterogeneous disorder with wide variability in social functioning. Many diagnostic and
Voxel-based Lesion-Symptom Mapping. Céline R. Gillebert
 Voxel-based Lesion-Symptom Mapping Céline R. Gillebert Paul Broca (1861) Mr. Tan no productive speech single repetitive syllable tan Broca s area: speech production Broca s aphasia: problems with fluency,
VARIABLE SELECTION WHEN CONFRONTED WITH MISSING DATA
 VARIABLE SELECTION WHEN CONFRONTED WITH MISSING DATA by Melissa L. Ziegler B.S. Mathematics, Elizabethtown College, 2000 M.A. Statistics, University of Pittsburgh, 2002 Submitted to the Graduate Faculty
Funnelling Used to describe a process of narrowing down of focus within a literature review. So, the writer begins with a broad discussion providing b
 Accidental sampling A lesser-used term for convenience sampling. Action research An approach that challenges the traditional conception of the researcher as separate from the real world. It is associated
Outline of Part III. SISCR 2016, Module 7, Part III. SISCR Module 7 Part III: Comparing Two Risk Models
 SISCR Module 7 Part III: Comparing Two Risk Models Kathleen Kerr, Ph.D. Associate Professor Department of Biostatistics University of Washington Outline of Part III 1. How to compare two risk models 2.
Chapter 1: Exploring Data
 Chapter 1: Exploring Data Key Vocabulary:! individual! variable! frequency table! relative frequency table! distribution! pie chart! bar graph! two-way table! marginal distributions! conditional distributions!
WELCOME! Lecture 11 Thommy Perlinger
 Quantitative Methods II WELCOME! Lecture 11 Thommy Perlinger Regression based on violated assumptions If any of the assumptions are violated, potential inaccuracies may be present in the estimated regression
Bringing machine learning to the point of care to inform suicide prevention
 Bringing machine learning to the point of care to inform suicide prevention Gregory Simon and Susan Shortreed Kaiser Permanente Washington Health Research Institute Don Mordecai The Permanente Medical
Assessment of a disease screener by hierarchical all-subset selection using area under the receiver operating characteristic curves
 Research Article Received 8 June 2010, Accepted 15 February 2011 Published online 15 April 2011 in Wiley Online Library (wileyonlinelibrary.com) DOI: 10.1002/sim.4246 Assessment of a disease screener by
How Does Analysis of Competing Hypotheses (ACH) Improve Intelligence Analysis?
 Improve Intelligence Analysis?") How Does Analysis of Competing Hypotheses (ACH) Improve Intelligence Analysis? Richards J. Heuer, Jr. Version 1.2, October 16, 2005 This document is from a collection of works by Richards J. Heuer, Jr.
How Does Analysis of Competing Hypotheses (ACH) Improve Intelligence Analysis? Richards J. Heuer, Jr. Version 1.2, October 16, 2005 This document is from a collection of works by Richards J. Heuer, Jr.
Reliability of Ordination Analyses
 Reliability of Ordination Analyses Objectives: Discuss Reliability Define Consistency and Accuracy Discuss Validation Methods Opening Thoughts Inference Space: What is it? Inference space can be defined
Novel Machine Learning Methods for ERP Analysis: A Validation From Research on Infants at Risk for Autism
 Developmental Neuropsychology ISSN: 8756-5641 (Print) 1532-6942 (Online) Journal homepage: http://www.tandfonline.com/loi/hdvn20 Novel Machine Learning Methods for ERP Analysis: A Validation From Research
Gene expression correlates of clinical prostate cancer behavior
 Gene expression correlates of clinical prostate cancer behavior Cancer Cell 2002 1: 203-209. Singh D, Febbo P, Ross K, Jackson D, Manola J, Ladd C, Tamayo P, Renshaw A, D Amico A, Richie J, Lander E, Loda
Dr. Kelly Bradley Final Exam Summer {2 points} Name
 {2 points} Name You MUST work alone no tutors; no help from classmates. Email me or see me with questions. You will receive a score of 0 if this rule is violated. This exam is being scored out of 00 points.
Application of Local Control Strategy in analyses of the effects of Radon on Lung Cancer Mortality for 2,881 US Counties
 Application of Local Control Strategy in analyses of the effects of Radon on Lung Cancer Mortality for 2,881 US Counties Bob Obenchain, Risk Benefit Statistics, August 2015 Our motivation for using a Cut-Point
Homo heuristicus and the bias/variance dilemma
 Homo heuristicus and the bias/variance dilemma Henry Brighton Department of Cognitive Science and Artificial Intelligence Tilburg University, The Netherlands Max Planck Institute for Human Development,
Part 8 Logistic Regression
 1 Quantitative Methods for Health Research A Practical Interactive Guide to Epidemiology and Statistics Practical Course in Quantitative Data Handling SPSS (Statistical Package for the Social Sciences)
Week 8 Hour 1: More on polynomial fits. The AIC. Hour 2: Dummy Variables what are they? An NHL Example. Hour 3: Interactions. The stepwise method.
 Week 8 Hour 1: More on polynomial fits. The AIC Hour 2: Dummy Variables what are they? An NHL Example Hour 3: Interactions. The stepwise method. Stat 302 Notes. Week 8, Hour 1, Page 1 / 34 Human growth
A COMBINATORY ALGORITHM OF UNIVARIATE AND MULTIVARIATE GENE SELECTION
 5-9 JATIT. All rights reserved. A COMBINATORY ALGORITHM OF UNIVARIATE AND MULTIVARIATE GENE SELECTION 1 H. Mahmoodian, M. Hamiruce Marhaban, 3 R. A. Rahim, R. Rosli, 5 M. Iqbal Saripan 1 PhD student, Department