Bayesian Adjustments for Misclassified Data. Lawrence Joseph
|
|
|
- Nancy Strickland
- 5 years ago
- Views:
Transcription
1 Bayesian Adjustments for Misclassified Data Lawrence Joseph
2 Bayesian Adjustments for Misclassified Data Lawrence Joseph Marcel Behr, Patrick Bélisle, Sasha Bernatsky, Nandini Dendukuri, Theresa Gyorkos, Martin Ladouceur, Elham Rahme, Kevin Schwartzman, Allison Scott
3 Bayesian Adjustments for Misclassified Data Lawrence Joseph Marcel Behr, Patrick Bélisle, Sasha Bernatsky, Nandini Dendukuri, Theresa Gyorkos, Martin Ladouceur, Elham Rahme, Kevin Schwartzman, Allison Scott Department of Epidemiology and Biostatistics McGill University
4 Outline
5 Outline Statistical trends in medical journals
6 Outline Statistical trends in medical journals Misclassification in analysis of diagnostic testing data
7 Outline Statistical trends in medical journals Misclassification in analysis of diagnostic testing data User friendly software
8 Outline Statistical trends in medical journals Misclassification in analysis of diagnostic testing data User friendly software Misclassification in administrative database studies
9 Outline Statistical trends in medical journals Misclassification in analysis of diagnostic testing data User friendly software Misclassification in administrative database studies Extension to more complex situations (correlations, continuous data)
10 Outline Statistical trends in medical journals Misclassification in analysis of diagnostic testing data User friendly software Misclassification in administrative database studies Extension to more complex situations (correlations, continuous data) Conclusion
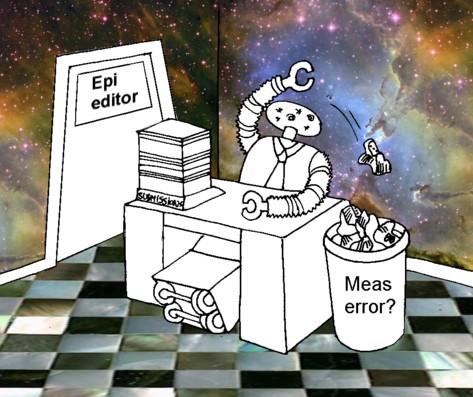
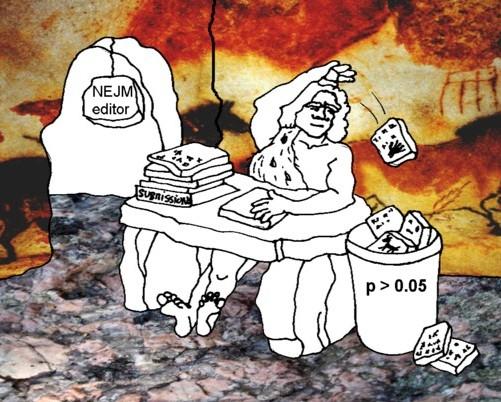
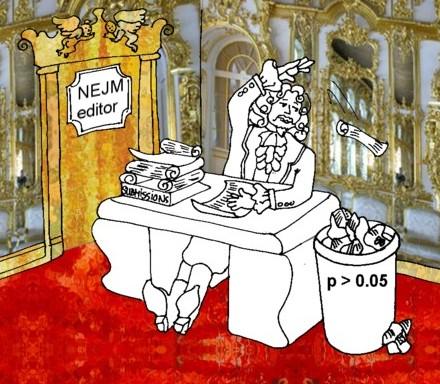
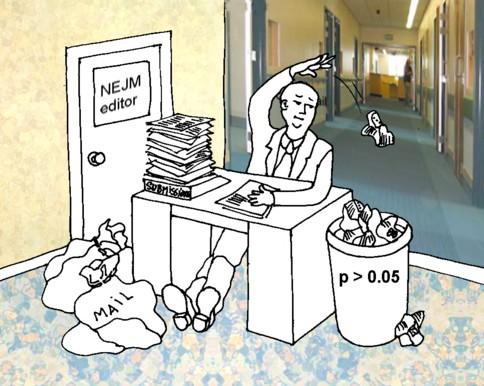
11 Trends in Medical Journals
12 Trends in Medical Journals Recognition of a good idea Optional, but if you analyze data this way, reviewers generally will say it is a good idea
13 Trends in Medical Journals Recognition of a good idea Optional, but if you analyze data this way, reviewers generally will say it is a good idea Commonplace If you do not analyze data this way, reviewers generally will ask you to do it
14 Trends in Medical Journals Recognition of a good idea Optional, but if you analyze data this way, reviewers generally will say it is a good idea Commonplace If you do not analyze data this way, reviewers generally will ask you to do it What is considered as a Good Idea or is Commonplace changes over time.
15
16
17
18
19
20
21
22
23 Current Trends in Medical Journals (2007)
24 Current Trends in Medical Journals (2007) 1. Bayesian analysis is recognized as a good idea but not required
25 Current Trends in Medical Journals (2007) 1. Bayesian analysis is recognized as a good idea but not required 2. Adjustment for measurement error is also recognized as a good idea but not required
26 Current Trends in Medical Journals (2007) 1. Bayesian analysis is recognized as a good idea but not required 2. Adjustment for measurement error is also recognized as a good idea but not required 3. Non-identifiability issues often means that 2 1
27 Current Trends in Medical Journals (2007) 1. Bayesian analysis is recognized as a good idea but not required 2. Adjustment for measurement error is also recognized as a good idea but not required 3. Non-identifiability issues often means that Both ideas are increasing in popularity
28 Articles encouraging use of Bayesian methods in medicine
29 Articles encouraging use of Bayesian methods in medicine Malakoff D. Bayes offers a new way to make sense of numbers. Science 1999;286: [Science review about the rise of Bayesian analysis]
30 Articles encouraging use of Bayesian methods in medicine Malakoff D. Bayes offers a new way to make sense of numbers. Science 1999;286: [Science review about the rise of Bayesian analysis] Dunson D. Practical advantages of Bayesian analysis of epidemiologic data. American Journal of Epidemiology 2001;153:
31 Articles encouraging use of Bayesian methods in medicine Malakoff D. Bayes offers a new way to make sense of numbers. Science 1999;286: [Science review about the rise of Bayesian analysis] Dunson D. Practical advantages of Bayesian analysis of epidemiologic data. American Journal of Epidemiology 2001;153: Goodman S. Of P-values and Bayes: A modest proposal. Epidemiology. 2001;12: [Encourages use of Bayes Factors rather than p-values]
32 Articles encouraging use of Bayesian methods in medicine Malakoff D. Bayes offers a new way to make sense of numbers. Science 1999;286: [Science review about the rise of Bayesian analysis] Dunson D. Practical advantages of Bayesian analysis of epidemiologic data. American Journal of Epidemiology 2001;153: Goodman S. Of P-values and Bayes: A modest proposal. Epidemiology. 2001;12: [Encourages use of Bayes Factors rather than p-values] Greenland S. Multiple-bias modelling for analysis of observational data. JRSSA 2005;168: [Encourages use of Bayesian methods for bias adjustments and measurement error/misclassification]
33 Quote from Greenland 2005 Conventional analytic results do not reflect any source of uncertainty other than random error, and as a result readers must rely on informal judgments regarding the effect of possible biases. When standard errors are small these judgments often fail to capture sources of uncertainty and their interactions adequately. Multiple-bias models provide alternatives.... Typically, the bias parameters in the model are not identified by the analysis data and so the results depend completely on priors for those parameters. A Bayesian analysis is then natural...
34 Another quote from Greenland 2005 Conventional analyses can be characterized as:
35 Another quote from Greenland 2005 Conventional analyses can be characterized as: (a) Employ frequentist statistical methods based on assumptions which may be grossly violated and are not testable with the data under analysis:
36 Another quote from Greenland 2005 Conventional analyses can be characterized as: (a) Employ frequentist statistical methods based on assumptions which may be grossly violated and are not testable with the data under analysis: (i) the study exposure is randomized within levels of controlled covariates
37 Another quote from Greenland 2005 Conventional analyses can be characterized as: (a) Employ frequentist statistical methods based on assumptions which may be grossly violated and are not testable with the data under analysis: (i) the study exposure is randomized within levels of controlled covariates (ii) selection, participation and missing data are random
38 Another quote from Greenland 2005 Conventional analyses can be characterized as: (a) Employ frequentist statistical methods based on assumptions which may be grossly violated and are not testable with the data under analysis: (i) the study exposure is randomized within levels of controlled covariates (ii) selection, participation and missing data are random (iii) there is no measurement error
39 Another quote from Greenland 2005 Conventional analyses can be characterized as: (a) Employ frequentist statistical methods based on assumptions which may be grossly violated and are not testable with the data under analysis: (i) the study exposure is randomized within levels of controlled covariates (ii) selection, participation and missing data are random (iii) there is no measurement error (b) Address possible violations of assumptions with speculative discussions. If they like the results, researchers argue that the biases are inconsequential. If they dislike the results they focus on possible biases.
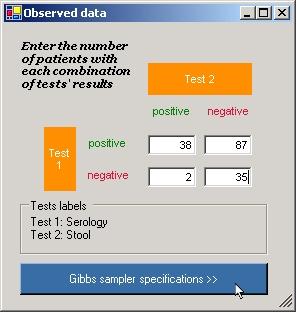
40 Example: Diagnostic testing for Strongyloides infection Stool Examination + Serology
41 Example: Diagnostic testing for Strongyloides infection Stool Examination + Serology Prevalence 25%? Prevalence 75%?
42 Example: Diagnostic testing for Strongyloides infection Stool Examination + Serology Prevalence 25%? Prevalence 75%? Sensitivity? Specificity?
43 Problem: Non-identifiability
44 Problem: Non-identifiability Table has 3 degrees of freedom
45 Problem: Non-identifiability Table has 3 degrees of freedom There are five unknown parameters (prev + sens and spec from each test)
46 Problem: Non-identifiability Table has 3 degrees of freedom There are five unknown parameters (prev + sens and spec from each test) Thus we have non-identifiability: There is an infinite number of solutions (estimates of the five parameters) that fit the data equally well
47 Frequentist Solution
48 Frequentist Solution With 3 df, can only estimate 3 parameters at a time
49 Frequentist Solution With 3 df, can only estimate 3 parameters at a time Solution: Pick any two parameters, and fix their values, use data to estimate other three
50 Frequentist Solution With 3 df, can only estimate 3 parameters at a time Solution: Pick any two parameters, and fix their values, use data to estimate other three Problems:
51 Frequentist Solution With 3 df, can only estimate 3 parameters at a time Solution: Pick any two parameters, and fix their values, use data to estimate other three Problems: Which 2 to pick as known?
52 Frequentist Solution With 3 df, can only estimate 3 parameters at a time Solution: Pick any two parameters, and fix their values, use data to estimate other three Problems: Which 2 to pick as known? What if known values are inaccurate?
53 Frequentist Solution With 3 df, can only estimate 3 parameters at a time Solution: Pick any two parameters, and fix their values, use data to estimate other three Problems: Which 2 to pick as known? What if known values are inaccurate? Even if exactly correct values selected for known parameters, confidence intervals are too narrow, as uncertainty in constrained values ignored.
54 Bayesian Solution
55 Bayesian Solution Treat all five parameters as equal
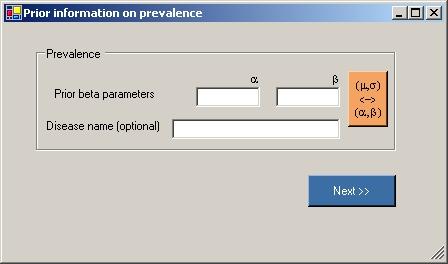
56 Bayesian Solution Treat all five parameters as equal Place a prior distribution over each parameter
57 Bayesian Solution Treat all five parameters as equal Place a prior distribution over each parameter At least two priors must be informative, to get around identifiability problem
58 Bayesian Solution Treat all five parameters as equal Place a prior distribution over each parameter At least two priors must be informative, to get around identifiability problem Have priors, can write down likelihood, get posteriors for all parameters via Bayes Theorem
59 Bayesian Solution Treat all five parameters as equal Place a prior distribution over each parameter At least two priors must be informative, to get around identifiability problem Have priors, can write down likelihood, get posteriors for all parameters via Bayes Theorem Contains the frequentist solution as a special case, with point priors on two parameters and uniform priors on other three parameters... very unrealistic solution when looked at in this way
60 Bayesian Solution - Need For User Friendly Software
61 Bayesian Solution - Need For User Friendly Software Thousands of articles discussing new statistical methods are published every year
62 Bayesian Solution - Need For User Friendly Software Thousands of articles discussing new statistical methods are published every year Only a very small percentage of these find use in real applications
63 Bayesian Solution - Need For User Friendly Software Thousands of articles discussing new statistical methods are published every year Only a very small percentage of these find use in real applications An even smaller proportion of new methods find use by researchers other than the developers
64 Bayesian Solution - Need For User Friendly Software Thousands of articles discussing new statistical methods are published every year Only a very small percentage of these find use in real applications An even smaller proportion of new methods find use by researchers other than the developers Reasons:
65 Bayesian Solution - Need For User Friendly Software Thousands of articles discussing new statistical methods are published every year Only a very small percentage of these find use in real applications An even smaller proportion of new methods find use by researchers other than the developers Reasons: Too difficult for most non-statisticians to understand
66 Bayesian Solution - Need For User Friendly Software Thousands of articles discussing new statistical methods are published every year Only a very small percentage of these find use in real applications An even smaller proportion of new methods find use by researchers other than the developers Reasons: Too difficult for most non-statisticians to understand Lack of recognition for applied work (not here!)
67 Bayesian Solution - Need For User Friendly Software Thousands of articles discussing new statistical methods are published every year Only a very small percentage of these find use in real applications An even smaller proportion of new methods find use by researchers other than the developers Reasons: Too difficult for most non-statisticians to understand Lack of recognition for applied work (not here!) Even if understandable, lack of time to program
68 Bayesian Solution - Need For User Friendly Software Thousands of articles discussing new statistical methods are published every year Only a very small percentage of these find use in real applications An even smaller proportion of new methods find use by researchers other than the developers Reasons: Too difficult for most non-statisticians to understand Lack of recognition for applied work (not here!) Even if understandable, lack of time to program Useful to provide user friendly software
69 Example: BayesDiagnosticTests Software
70 Example: BayesDiagnosticTests Software Windows based exe file
71 Example: BayesDiagnosticTests Software Windows based exe file Input data + priors through user friendly fill in the blanks windows
72 Example: BayesDiagnosticTests Software Windows based exe file Input data + priors through user friendly fill in the blanks windows Runs a Gibbs sampler using WinBUGS by itself
73 Example: BayesDiagnosticTests Software Windows based exe file Input data + priors through user friendly fill in the blanks windows Runs a Gibbs sampler using WinBUGS by itself When ready (typically a few minutes) pops up posterior distributions + graphs
74 Example: BayesDiagnosticTests Software Windows based exe file Input data + priors through user friendly fill in the blanks windows Runs a Gibbs sampler using WinBUGS by itself When ready (typically a few minutes) pops up posterior distributions + graphs Extensive manual, free help via
75 Example: BayesDiagnosticTests Software Windows based exe file Input data + priors through user friendly fill in the blanks windows Runs a Gibbs sampler using WinBUGS by itself When ready (typically a few minutes) pops up posterior distributions + graphs Extensive manual, free help via Let s look at the results from the Strongyloides example
76
77
78 Results: Strongyloides Example Stool Examination Serology Prev Sens Spec Sens Spec Prior Information Stool Examin ation Alone Serology Alone Both Tests Combined
79
80
81 Application to Administrative Database Research
82 Application to Administrative Database Research Primary data collection can be expensive
83 Application to Administrative Database Research Primary data collection can be expensive Researchers are increasingly using information collected in administrative databases (e.g. RAMQ)
84 Application to Administrative Database Research Primary data collection can be expensive Researchers are increasingly using information collected in administrative databases (e.g. RAMQ) Such databases typically contain substantial proportions of misclassification errors (e.g. diagnoses).
85 Example: Prevalence of OA in 65+ from RAMQ data Three imperfect clues about OA are available:
86 Example: Prevalence of OA in 65+ from RAMQ data Three imperfect clues about OA are available: ICD-9 diagnostic code for OA
87 Example: Prevalence of OA in 65+ from RAMQ data Three imperfect clues about OA are available: ICD-9 diagnostic code for OA At least one prescription for acetaminophen or an NSAID, but not methotrexate or plaquenil
88 Example: Prevalence of OA in 65+ from RAMQ data Three imperfect clues about OA are available: ICD-9 diagnostic code for OA At least one prescription for acetaminophen or an NSAID, but not methotrexate or plaquenil Received injection common in OA, an arthroplasty or a tibial osteotomy
89 Methods
90 Methods Similar to case with two tests, but can use data from one, two, or all three tests (7 combinations in all)
91 Methods Similar to case with two tests, but can use data from one, two, or all three tests (7 combinations in all) Priors not needed if all three tests are used
92 Methods Similar to case with two tests, but can use data from one, two, or all three tests (7 combinations in all) Priors not needed if all three tests are used Idea is to compare results from a variety of models, to check robustness of prevalence estimates
93 OA data from RAMQ data base Test 1 Test 2 Test 3 Number of Phys. Diagnosis Medication Medical Acts individuals observed , , , , , , , ,415
94 OA data from RAMQ data base Test 1 Test 2 Test 3 Number of Phys. Diagnosis Medication Medical Acts individuals observed , , , , , , , ,415 Test 1 +ve = 11, ,222 +3, ,651 = 98,009 N = 968,959
95 Results with no Misclassification Adjustment
96 Results with no Misclassification Adjustment Naive estimate using physician diagnosis error is 10.1%, 95% Credible Interval (CrI)
97 Results with no Misclassification Adjustment Naive estimate using physician diagnosis error is 10.1%, 95% Credible Interval (CrI) Very narrow interval, but accounts only for uncertainty due to random variation, not for extra variability due to misclassification
98 Results with no Misclassification Adjustment Naive estimate using physician diagnosis error is 10.1%, 95% Credible Interval (CrI) Very narrow interval, but accounts only for uncertainty due to random variation, not for extra variability due to misclassification How much confidence can we place in this seemingly very accurate estimate?
99 Results with Misclassification Adjustment Prev Sens 1 Sens 2 Sens 3 Spec 1 Spec 2 Spec 2 Prior distribution One Test Physician diagnosis alone Prescribed medication alone Medical procedure alone Two Tests Combination of physician diagnosis and prescribed medication Combination of physician diagnosis and medical acts Combination of prescribed medication and medical acts Three Tests 3 tests using non-informative priors
100 Comparison of Estimates
101 Comparison of Estimates Usual estimate: 10.1% ( ), width = 0.1
102 Comparison of Estimates Usual estimate: 10.1% ( ), width = 0.1 Adj estimate (3 tests): 14.8% ( ), width = 0.6
103 Comparison of Estimates Usual estimate: 10.1% ( ), width = 0.1 Adj estimate (3 tests): 14.8% ( ), width = 0.6 Bias 50%, CrI width grows by a factor of 6
104 Comparison of Estimates Usual estimate: 10.1% ( ), width = 0.1 Adj estimate (3 tests): 14.8% ( ), width = 0.6 Bias 50%, CrI width grows by a factor of 6 Other plausible estimates range from 3.3% to 22%
105 Comparison of Estimates Usual estimate: 10.1% ( ), width = 0.1 Adj estimate (3 tests): 14.8% ( ), width = 0.6 Bias 50%, CrI width grows by a factor of 6 Other plausible estimates range from 3.3% to 22% Must admit true answer not really known
106 Comparison of Estimates Usual estimate: 10.1% ( ), width = 0.1 Adj estimate (3 tests): 14.8% ( ), width = 0.6 Bias 50%, CrI width grows by a factor of 6 Other plausible estimates range from 3.3% to 22% Must admit true answer not really known All estimates depend on unverifiable assumptions
107 Comparison of Estimates Usual estimate: 10.1% ( ), width = 0.1 Adj estimate (3 tests): 14.8% ( ), width = 0.6 Bias 50%, CrI width grows by a factor of 6 Other plausible estimates range from 3.3% to 22% Must admit true answer not really known All estimates depend on unverifiable assumptions Problems carry over to regressions based on risk factors for OA, etc.
108 Extensions
109 Different numbers of tests Extensions
110 Different numbers of tests Extensions Correlations among dichotomous tests
111 Different numbers of tests Extensions Correlations among dichotomous tests Continuous diagnostic test results (Para + Non-Para)
112 Different numbers of tests Extensions Correlations among dichotomous tests Continuous diagnostic test results (Para + Non-Para) Combinations of continuous and dichotomous tests
113 Different numbers of tests Extensions Correlations among dichotomous tests Continuous diagnostic test results (Para + Non-Para) Combinations of continuous and dichotomous tests Correlations among continuous tests
114 Different numbers of tests Extensions Correlations among dichotomous tests Continuous diagnostic test results (Para + Non-Para) Combinations of continuous and dichotomous tests Correlations among continuous tests Hierarchical models for diagnostic test data
115 Conclusions Important to consider measurement/misclassification error in Epi (coming trend?)
116 Conclusions Important to consider measurement/misclassification error in Epi (coming trend?) For real impact: not enough to develop methods need user friendly software
117 Conclusions Important to consider measurement/misclassification error in Epi (coming trend?) For real impact: not enough to develop methods need user friendly software Beware of unadjusted results from Administrative Database research
118 References Joseph L, Gyorkos T, Coupal L. Bayesian estimation of disease prevalence and the parameters of diagnostic tests in the absence of a gold standard. American Journal of Epidemiology 1995;141(3): (Dichotomous tests) Rahme E, Joseph L, and Gyorkos T. Bayesian sample size determination for estimating binomial parameters from data subject to misclassification. Applied Statistics 2000;49(1): (Design of studies with misclassification) Dendukuri N, Joseph L. Bayesian approaches to modeling the conditional dependence between multiple diagnostic tests. Biometrics 2001;57(1): (Dependent tests) Bernatsky S, Joseph L, Bélisle P, Boivin J, Rajan R, Moore A, Clarke A. A Bayesian hierarchical model for estimating the properties of cancer ascertainment methods in cohort studies. Statistics in Medicine 2005;24: (Hierarchical model) Carabin H, Marshall C, Joseph L, Riley S, Olveda R, McGarvey S. Estimating and modelling the dynamics of the intensity of infection with Schistosoma japonicum in villagers of Leyte, Philippines. Part I: A Bayesian cumulative logit model. American Journal of Tropical Medicine and Hygiene 2005;72(6): (Logistic regression with misclassification) Ladouceur M, Rahme E, Pineau C, Joseph L. Robustness of prevalence estimates derived from misclassified data from administrative databases. Biometrics 2007;63: (Application to Administrative Data) Scott A, Joseph L, Bélisle P, Behr M, Schwartzman K. Bayesian estimation of tuberculosis clustering rates from DNA sequence data. Statistics in Medicine 2007 (to appear). (Continuous tests)
Bayesian Adjustments for Misclassified Data. Lawrence Joseph
 Bayesian Adjustments for Misclassified Data Lawrence Joseph Marcel Behr, Patrick Bélisle, Sasha Bernatsky, Nandini Dendukuri, Theresa Gyorkos, Martin Ladouceur, Elham Rahme, Kevin Schwartzman, Allison
Robustness of Prevalence Estimates Derived from Misclassified Data from Administrative Databases
 Biometrics DOI: 10.1111/j.1541-0420.2006.00665.x Robustness of Prevalence Estimates Derived from Misclassified Data from Administrative Databases Martin Ladouceur, 1,2 Elham Rahme, 3 Christian A. Pineau,
Bayesian sample size for diagnostic test studies in the absence of a gold standard: Comparing identifiable with non-identifiable models
 Research Article Received 13 August 2009 Published online 27 August 2010 in Wiley Online Library (wileyonlinelibrary.com) DOI: 10.1002/sim.4037 Bayesian sample size for diagnostic test studies in the absence
MS&E 226: Small Data
 MS&E 226: Small Data Lecture 10: Introduction to inference (v2) Ramesh Johari ramesh.johari@stanford.edu 1 / 17 What is inference? 2 / 17 Where did our data come from? Recall our sample is: Y, the vector
Introduction to Bayesian Analysis 1
 Biostats VHM 801/802 Courses Fall 2005, Atlantic Veterinary College, PEI Henrik Stryhn Introduction to Bayesian Analysis 1 Little known outside the statistical science, there exist two different approaches
Bayesian Methods for Medical Test Accuracy. Broemeling & Associates Inc., 1023 Fox Ridge Road, Medical Lake, WA 99022, USA;
 Diagnostics 2011, 1, 1-35; doi:10.3390/diagnostics1010001 OPEN ACCESS diagnostics ISSN 2075-4418 www.mdpi.com/journal/diagnostics/ Review Bayesian Methods for Medical Test Accuracy Lyle D. Broemeling Broemeling
Bayesian performance
 Bayesian performance In this section we will study the statistical properties of Bayesian estimates. Major topics include: The likelihood principle Decision theory/bayes rules Shrinkage estimators Frequentist
Models for potentially biased evidence in meta-analysis using empirically based priors
 Models for potentially biased evidence in meta-analysis using empirically based priors Nicky Welton Thanks to: Tony Ades, John Carlin, Doug Altman, Jonathan Sterne, Ross Harris RSS Avon Local Group Meeting,
Bayesian latent class estimation of the incidence of chest radiograph-confirmed pneumonia in rural Thailand
 Epidemiol. Infect., Page 1 of 8. Cambridge University Press 2016 doi:10.1017/s0950268816000455 Bayesian latent class estimation of the incidence of chest radiograph-confirmed pneumonia in rural Thailand
UNLOCKING VALUE WITH DATA SCIENCE BAYES APPROACH: MAKING DATA WORK HARDER
 UNLOCKING VALUE WITH DATA SCIENCE BAYES APPROACH: MAKING DATA WORK HARDER 2016 DELIVERING VALUE WITH DATA SCIENCE BAYES APPROACH - MAKING DATA WORK HARDER The Ipsos MORI Data Science team increasingly
Bayesian modelling of tuberculosis clustering from DNA fingerprint data
 STATISTICS IN MEDICINE Statist. Med. (in press) Published online in Wiley InterScience (www.interscience.wiley.com).2899 Bayesian modelling of tuberculosis clustering from DNA fingerprint data Allison
Commentary: Practical Advantages of Bayesian Analysis of Epidemiologic Data
 American Journal of Epidemiology Copyright 2001 by The Johns Hopkins University School of Hygiene and Public Health All rights reserved Vol. 153, No. 12 Printed in U.S.A. Practical Advantages of Bayesian
A Bayesian approach to sample size determination for studies designed to evaluate continuous medical tests
 Baylor Health Care System From the SelectedWorks of unlei Cheng 1 A Bayesian approach to sample size determination for studies designed to evaluate continuous medical tests unlei Cheng, Baylor Health Care
Bayesian Meta-Analysis of the Accuracy of a Test for Tuberculous Pleuritis in the Absence of a Gold Standard Reference
 Biometrics DOI: 10.1111/j.1541-040.01.01773.x Bayesian Meta-Analysis of the Accuracy of a Test for Tuberculous Pleuritis in the Absence of a Gold Standard Reference Nandini Dendukuri, 1, Ian Schiller,
A Bayesian Approach to Measurement Error Problems in Epidemiology Using Conditional Independence Models
 American Journal of Epidemlotogy Vol 138, No 6 Copyright 1993 by The Johns Hopkins University School of Hygiene and Public Health Printed in U SA. All rights reserved A Bayesian Approach to Measurement
A Brief Introduction to Bayesian Statistics
 A Brief Introduction to Statistics David Kaplan Department of Educational Psychology Methods for Social Policy Research and, Washington, DC 2017 1 / 37 The Reverend Thomas Bayes, 1701 1761 2 / 37 Pierre-Simon
Advanced Bayesian Models for the Social Sciences
 Advanced Bayesian Models for the Social Sciences Jeff Harden Department of Political Science, University of Colorado Boulder jeffrey.harden@colorado.edu Daniel Stegmueller Department of Government, University
Advanced Bayesian Models for the Social Sciences. TA: Elizabeth Menninga (University of North Carolina, Chapel Hill)
") Advanced Bayesian Models for the Social Sciences Instructors: Week 1&2: Skyler J. Cranmer Department of Political Science University of North Carolina, Chapel Hill skyler@unc.edu Week 3&4: Daniel Stegmueller
Advanced Bayesian Models for the Social Sciences Instructors: Week 1&2: Skyler J. Cranmer Department of Political Science University of North Carolina, Chapel Hill skyler@unc.edu Week 3&4: Daniel Stegmueller
Lecture Outline Biost 517 Applied Biostatistics I. Statistical Goals of Studies Role of Statistical Inference
 Lecture Outline Biost 517 Applied Biostatistics I Scott S. Emerson, M.D., Ph.D. Professor of Biostatistics University of Washington Statistical Inference Role of Statistical Inference Hierarchy of Experimental
Missing data. Patrick Breheny. April 23. Introduction Missing response data Missing covariate data
 Missing data Patrick Breheny April 3 Patrick Breheny BST 71: Bayesian Modeling in Biostatistics 1/39 Our final topic for the semester is missing data Missing data is very common in practice, and can occur
5/10/2010. ISPOR Good Research Practices for Comparative Effectiveness Research: Indirect Treatment Comparisons Task Force
 ISPOR Good Research Practices for Comparative Effectiveness Research: Indirect Treatment Comparisons Task Force Presentation of Two Draft Reports 17 May 2010 ITC Task Force: Leadership Team Lieven Annemans
Comparing treatments evaluated in studies forming disconnected networks of evidence: A review of methods
 Comparing treatments evaluated in studies forming disconnected networks of evidence: A review of methods John W Stevens Reader in Decision Science University of Sheffield EFPSI European Statistical Meeting
Bayesian graphical models for combining multiple data sources, with applications in environmental epidemiology
 Bayesian graphical models for combining multiple data sources, with applications in environmental epidemiology Sylvia Richardson 1 sylvia.richardson@imperial.co.uk Joint work with: Alexina Mason 1, Lawrence
Lecture Outline. Biost 590: Statistical Consulting. Stages of Scientific Studies. Scientific Method
 Biost 590: Statistical Consulting Statistical Classification of Scientific Studies; Approach to Consulting Lecture Outline Statistical Classification of Scientific Studies Statistical Tasks Approach to
Chapter 23. Inference About Means. Copyright 2010 Pearson Education, Inc.
 Chapter 23 Inference About Means Copyright 2010 Pearson Education, Inc. Getting Started Now that we know how to create confidence intervals and test hypotheses about proportions, it d be nice to be able
Supplementary Online Content
 Supplementary Online Content Jain A, Marshall J, Buikema A, et al. Autism occurrence by MMR vaccine status among US children with older siblings with and without autism. JAMA. doi:10.1001/jama.2015.3077
Lecture Outline Biost 517 Applied Biostatistics I
 Lecture Outline Biost 517 Applied Biostatistics I Scott S. Emerson, M.D., Ph.D. Professor of Biostatistics University of Washington Lecture 2: Statistical Classification of Scientific Questions Types of
ST440/550: Applied Bayesian Statistics. (10) Frequentist Properties of Bayesian Methods
 Frequentist Properties of Bayesian Methods") (10) Frequentist Properties of Bayesian Methods Calibrated Bayes So far we have discussed Bayesian methods as being separate from the frequentist approach However, in many cases methods with frequentist
(10) Frequentist Properties of Bayesian Methods Calibrated Bayes So far we have discussed Bayesian methods as being separate from the frequentist approach However, in many cases methods with frequentist
Type and quantity of data needed for an early estimate of transmissibility when an infectious disease emerges
 Research articles Type and quantity of data needed for an early estimate of transmissibility when an infectious disease emerges N G Becker (Niels.Becker@anu.edu.au) 1, D Wang 1, M Clements 1 1. National
Epidemiology: Overview of Key Concepts and Study Design. Polly Marchbanks
 Epidemiology: Overview of Key Concepts and Study Design Polly Marchbanks Lecture Outline (1) Key epidemiologic concepts - Definition - What epi is not - What epi is - Process of epi research Lecture Outline
Bayesian Inference Bayes Laplace
 Bayesian Inference Bayes Laplace Course objective The aim of this course is to introduce the modern approach to Bayesian statistics, emphasizing the computational aspects and the differences between the
Bayesian and Frequentist Approaches
 Bayesian and Frequentist Approaches G. Jogesh Babu Penn State University http://sites.stat.psu.edu/ babu http://astrostatistics.psu.edu All models are wrong But some are useful George E. P. Box (son-in-law
An Introduction to Bayesian Statistics
 An Introduction to Bayesian Statistics Robert Weiss Department of Biostatistics UCLA Fielding School of Public Health robweiss@ucla.edu Sept 2015 Robert Weiss (UCLA) An Introduction to Bayesian Statistics
Psychology, 2010, 1: doi: /psych Published Online August 2010 (
 Psychology, 2010, 1: 194-198 doi:10.4236/psych.2010.13026 Published Online August 2010 (http://www.scirp.org/journal/psych) Using Generalizability Theory to Evaluate the Applicability of a Serial Bayes
An Empirical Assessment of Bivariate Methods for Meta-analysis of Test Accuracy
 Number XX An Empirical Assessment of Bivariate Methods for Meta-analysis of Test Accuracy Prepared for: Agency for Healthcare Research and Quality U.S. Department of Health and Human Services 54 Gaither
Challenges of Observational and Retrospective Studies
 Challenges of Observational and Retrospective Studies Kyoungmi Kim, Ph.D. March 8, 2017 This seminar is jointly supported by the following NIH-funded centers: Background There are several methods in which
Response to the ASA s statement on p-values: context, process, and purpose
 Response to the ASA s statement on p-values: context, process, purpose Edward L. Ionides Alexer Giessing Yaacov Ritov Scott E. Page Departments of Complex Systems, Political Science Economics, University
Project Funded under FP7 - HEALTH Grant Agreement no Funded under FP7 - HEALTH Grant Agreement no
 Developing methods of HTA for medical devices: WP3 - Methods for comparative effectiveness research of medical devices Final Conference November, 13 th 2015 U. Siebert, P. Schnell-Inderst, C. Iglesias,
On the Targets of Latent Variable Model Estimation
 On the Targets of Latent Variable Model Estimation Karen Bandeen-Roche Department of Biostatistics Johns Hopkins University Department of Mathematics and Statistics Miami University December 8, 2005 With
Bayesian Analysis by Simulation
 408 Resampling: The New Statistics CHAPTER 25 Bayesian Analysis by Simulation Simple Decision Problems Fundamental Problems In Statistical Practice Problems Based On Normal And Other Distributions Conclusion
A Bayesian Perspective on Unmeasured Confounding in Large Administrative Databases
 A Bayesian Perspective on Unmeasured Confounding in Large Administrative Databases Lawrence McCandless lmccandl@sfu.ca Faculty of Health Sciences, Simon Fraser University, Vancouver Canada Summer 2014
Detection of Unknown Confounders. by Bayesian Confirmatory Factor Analysis
 Advanced Studies in Medical Sciences, Vol. 1, 2013, no. 3, 143-156 HIKARI Ltd, www.m-hikari.com Detection of Unknown Confounders by Bayesian Confirmatory Factor Analysis Emil Kupek Department of Public
Practical Bayesian Design and Analysis for Drug and Device Clinical Trials
 Practical Bayesian Design and Analysis for Drug and Device Clinical Trials p. 1/2 Practical Bayesian Design and Analysis for Drug and Device Clinical Trials Brian P. Hobbs Plan B Advisor: Bradley P. Carlin
Bayesian Statistics Estimation of a Single Mean and Variance MCMC Diagnostics and Missing Data
 Bayesian Statistics Estimation of a Single Mean and Variance MCMC Diagnostics and Missing Data Michael Anderson, PhD Hélène Carabin, DVM, PhD Department of Biostatistics and Epidemiology The University
Biost 590: Statistical Consulting
 Biost 590: Statistical Consulting Statistical Classification of Scientific Questions October 3, 2008 Scott S. Emerson, M.D., Ph.D. Professor of Biostatistics, University of Washington 2000, Scott S. Emerson,
Combining Risks from Several Tumors Using Markov Chain Monte Carlo
 University of Nebraska - Lincoln DigitalCommons@University of Nebraska - Lincoln U.S. Environmental Protection Agency Papers U.S. Environmental Protection Agency 2009 Combining Risks from Several Tumors
Administrative database research has unique characteristics that can risk biased results
 Journal of Clinical Epidemiology 65 (2012) 126e131 REVIEW ARTICLE Administrative database research has unique characteristics that can risk biased results Carl van Walraven a,b,c, *, Peter Austin d a Department
with Stata Bayesian Analysis John Thompson University of Leicester A Stata Press Publication StataCorp LP College Station, Texas
 Bayesian Analysis with Stata John Thompson University of Leicester A Stata Press Publication StataCorp LP College Station, Texas Contents List of figures List of tables Preface Acknowledgments xiii xvii
Outline. What s inside this paper? My expectation. Software Defect Prediction. Traditional Method. What s inside this paper?
 Outline A Critique of Software Defect Prediction Models Norman E. Fenton Dongfeng Zhu What s inside this paper? What kind of new technique was developed in this paper? Research area of this technique?
Inference About Magnitudes of Effects
 invited commentary International Journal of Sports Physiology and Performance, 2008, 3, 547-557 2008 Human Kinetics, Inc. Inference About Magnitudes of Effects Richard J. Barker and Matthew R. Schofield
Truth Versus Truthiness in Clinical Data
 Temple University Health System Truth Versus Truthiness in Clinical Data Mark Weiner, MD, FACP, FACMI Assistant Dean for Informatics, Temple University School of Medicine mark.weiner@tuhs.temple.edu 1
Misclassification errors in prevalence estimation: Bayesian handling with care
 Int J Public Health DOI 10.1007/s00038-012-0439-9 HINTS & KINKS Misclassification errors in prevalence estimation: Bayesian handling with care Niko Speybroeck Brecht Devleesschauwer Lawrence Joseph Dirk
Bayesian methods for combining multiple Individual and Aggregate data Sources in observational studies
 Bayesian methods for combining multiple Individual and Aggregate data Sources in observational studies Sara Geneletti Department of Epidemiology and Public Health Imperial College, London s.geneletti@imperial.ac.uk
Prevalence of Systemic Lupus Erythematosus and Systemic Sclerosis in the First Nations Population of Alberta, Canada
 Arthritis Care & Research Vol. 64, No. 1, January 2012, pp 138 143 DOI 10.1002/acr.20656 2012, American College of Rheumatology ORIGINAL ARTICLE Prevalence of Systemic Lupus Erythematosus and Systemic
T-Statistic-based Up&Down Design for Dose-Finding Competes Favorably with Bayesian 4-parameter Logistic Design
 T-Statistic-based Up&Down Design for Dose-Finding Competes Favorably with Bayesian 4-parameter Logistic Design James A. Bolognese, Cytel Nitin Patel, Cytel Yevgen Tymofyeyef, Merck Inna Perevozskaya, Wyeth
A Case Study: Two-sample categorical data
 A Case Study: Two-sample categorical data Patrick Breheny January 31 Patrick Breheny BST 701: Bayesian Modeling in Biostatistics 1/43 Introduction Model specification Continuous vs. mixture priors Choice
Sensory specific satiation: using Bayesian networks to combine data from related studies
 Sensory specific satiation: using Bayesian networks to combine data from related studies Van-Anh Phan, PhD student 10 th Sensometrics Rotterdam, July 2010 Outline of the presentation I. Bayesian networks
School of Population and Public Health SPPH 503 Epidemiologic methods II January to April 2019
 School of Population and Public Health SPPH 503 Epidemiologic methods II January to April 2019 Time: Tuesday, 1330 1630 Location: School of Population and Public Health, UBC Course description Students
Bayesian Analysis of Between-Group Differences in Variance Components in Hierarchical Generalized Linear Models
 Bayesian Analysis of Between-Group Differences in Variance Components in Hierarchical Generalized Linear Models Brady T. West Michigan Program in Survey Methodology, Institute for Social Research, 46 Thompson
Bayesian Mediation Analysis
 Psychological Methods 2009, Vol. 14, No. 4, 301 322 2009 American Psychological Association 1082-989X/09/$12.00 DOI: 10.1037/a0016972 Bayesian Mediation Analysis Ying Yuan The University of Texas M. D.
What is probability. A way of quantifying uncertainty. Mathematical theory originally developed to model outcomes in games of chance.
 Outline What is probability Another definition of probability Bayes Theorem Prior probability; posterior probability How Bayesian inference is different from what we usually do Example: one species or
Can you guarantee that the results from your observational study are unaffected by unmeasured confounding? H.Hosseini
 Instrumental Variable (Instrument) applications in Epidemiology: An Introduction Hamed Hosseini Can you guarantee that the results from your observational study are unaffected by unmeasured confounding?
Structural Approach to Bias in Meta-analyses
 Original Article Received 26 July 2011, Revised 22 November 2011, Accepted 12 December 2011 Published online 2 February 2012 in Wiley Online Library (wileyonlinelibrary.com) DOI: 10.1002/jrsm.52 Structural
Treatment effect estimates adjusted for small-study effects via a limit meta-analysis
 Treatment effect estimates adjusted for small-study effects via a limit meta-analysis Gerta Rücker 1, James Carpenter 12, Guido Schwarzer 1 1 Institute of Medical Biometry and Medical Informatics, University
Comparison of Meta-Analytic Results of Indirect, Direct, and Combined Comparisons of Drugs for Chronic Insomnia in Adults: A Case Study
 ORIGINAL ARTICLE Comparison of Meta-Analytic Results of Indirect, Direct, and Combined Comparisons of Drugs for Chronic Insomnia in Adults: A Case Study Ben W. Vandermeer, BSc, MSc, Nina Buscemi, PhD,
OHDSI Tutorial: Design and implementation of a comparative cohort study in observational healthcare data
 OHDSI Tutorial: Design and implementation of a comparative cohort study in observational healthcare data Faculty: Martijn Schuemie (Janssen Research and Development) Marc Suchard (UCLA) Patrick Ryan (Janssen
UNIVERSITY of PENNSYLVANIA CIS 520: Machine Learning Midterm, 2016
 UNIVERSITY of PENNSYLVANIA CIS 520: Machine Learning Midterm, 2016 Exam policy: This exam allows one one-page, two-sided cheat sheet; No other materials. Time: 80 minutes. Be sure to write your name and
Epidemiologic Methods and Counting Infections: The Basics of Surveillance
 Epidemiologic Methods and Counting Infections: The Basics of Surveillance Ebbing Lautenbach, MD, MPH, MSCE University of Pennsylvania School of Medicine Nothing to disclose PENN Outline Definitions / Historical
Hypothetical Scenario
 Using Indirect and Multiple Treatment Comparisons Methods To Estimate Comparative Effectiveness of Alternative Treatments Workshop September 27, 2010 Beth Devine, PharmD, MBA, PhD Rafael Alfonso C., MD,
extraction can take place. Another problem is that the treatment for chronic diseases is sequential based upon the progression of the disease.
 ix Preface The purpose of this text is to show how the investigation of healthcare databases can be used to examine physician decisions to develop evidence-based treatment guidelines that optimize patient
Data Analysis Using Regression and Multilevel/Hierarchical Models
 Data Analysis Using Regression and Multilevel/Hierarchical Models ANDREW GELMAN Columbia University JENNIFER HILL Columbia University CAMBRIDGE UNIVERSITY PRESS Contents List of examples V a 9 e xv " Preface
Longitudinal and Hierarchical Analytic Strategies for OAI Data
 Longitudinal and Hierarchical Analytic Strategies for OAI Data Charles E. McCulloch, Division of Biostatistics, Dept of Epidemiology and Biostatistics, UCSF OARSI Montreal September 10, 2009 Outline 1.
Missing Data in Longitudinal Studies: Strategies for Bayesian Modeling, Sensitivity Analysis, and Causal Inference
 COURSE: Missing Data in Longitudinal Studies: Strategies for Bayesian Modeling, Sensitivity Analysis, and Causal Inference Mike Daniels (Department of Statistics, University of Florida) 20-21 October 2011
Sawtooth Software. MaxDiff Analysis: Simple Counting, Individual-Level Logit, and HB RESEARCH PAPER SERIES. Bryan Orme, Sawtooth Software, Inc.
 Sawtooth Software RESEARCH PAPER SERIES MaxDiff Analysis: Simple Counting, Individual-Level Logit, and HB Bryan Orme, Sawtooth Software, Inc. Copyright 009, Sawtooth Software, Inc. 530 W. Fir St. Sequim,
Presenter Disclosure Information
 Presenter Disclosure Information Soko Setoguchi, MD DrPH Prescription Drug Data: Advantages, Availability, and Access FINANCIAL DISCLOSURE: Grants/Research Support: NIH, AHRQ UNLABELED/UNAPPROVED USES
Citation for published version (APA): Ebbes, P. (2004). Latent instrumental variables: a new approach to solve for endogeneity s.n.
: Ebbes, P. (2004). Latent instrumental variables: a new approach to solve for endogeneity s.n.") University of Groningen Latent instrumental variables Ebbes, P. IMPORTANT NOTE: You are advised to consult the publisher's version (publisher's PDF) if you wish to cite from it. Please check the document
University of Groningen Latent instrumental variables Ebbes, P. IMPORTANT NOTE: You are advised to consult the publisher's version (publisher's PDF) if you wish to cite from it. Please check the document
A Vision-based Affective Computing System. Jieyu Zhao Ningbo University, China
 A Vision-based Affective Computing System Jieyu Zhao Ningbo University, China Outline Affective Computing A Dynamic 3D Morphable Model Facial Expression Recognition Probabilistic Graphical Models Some
Remarks on Bayesian Control Charts
 Remarks on Bayesian Control Charts Amir Ahmadi-Javid * and Mohsen Ebadi Department of Industrial Engineering, Amirkabir University of Technology, Tehran, Iran * Corresponding author; email address: ahmadi_javid@aut.ac.ir
Bayesian Confidence Intervals for Means and Variances of Lognormal and Bivariate Lognormal Distributions
 Bayesian Confidence Intervals for Means and Variances of Lognormal and Bivariate Lognormal Distributions J. Harvey a,b, & A.J. van der Merwe b a Centre for Statistical Consultation Department of Statistics
Modelling heterogeneity variances in multiple treatment comparison meta-analysis Are informative priors the better solution?
 Thorlund et al. BMC Medical Research Methodology 2013, 13:2 RESEARCH ARTICLE Open Access Modelling heterogeneity variances in multiple treatment comparison meta-analysis Are informative priors the better
Science, Subjectivity and Software (Comments on the articles by Berger and Goldstein)
") Science, Subjectivity and Software (Comments on the articles by Berger and Goldstein) Anthony O Hagan University of She eld May 4, 2006 Abstract The dangerous heresy of so-called objective Bayesian methods
Science, Subjectivity and Software (Comments on the articles by Berger and Goldstein) Anthony O Hagan University of She eld May 4, 2006 Abstract The dangerous heresy of so-called objective Bayesian methods
Selected Topics in Biostatistics Seminar Series. Missing Data. Sponsored by: Center For Clinical Investigation and Cleveland CTSC
 Selected Topics in Biostatistics Seminar Series Missing Data Sponsored by: Center For Clinical Investigation and Cleveland CTSC Brian Schmotzer, MS Biostatistician, CCI Statistical Sciences Core brian.schmotzer@case.edu
INTRODUCTION TO BAYESIAN REASONING
 International Journal of Technology Assessment in Health Care, 17:1 (2001), 9 16. Copyright c 2001 Cambridge University Press. Printed in the U.S.A. INTRODUCTION TO BAYESIAN REASONING John Hornberger Roche
Fundamental Clinical Trial Design
 Design, Monitoring, and Analysis of Clinical Trials Session 1 Overview and Introduction Overview Scott S. Emerson, M.D., Ph.D. Professor of Biostatistics, University of Washington February 17-19, 2003
Bayesians methods in system identification: equivalences, differences, and misunderstandings
 Bayesians methods in system identification: equivalences, differences, and misunderstandings Johan Schoukens and Carl Edward Rasmussen ERNSI 217 Workshop on System Identification Lyon, September 24-27,
10CS664: PATTERN RECOGNITION QUESTION BANK
 10CS664: PATTERN RECOGNITION QUESTION BANK Assignments would be handed out in class as well as posted on the class blog for the course. Please solve the problems in the exercises of the prescribed text
Methods Research Report. An Empirical Assessment of Bivariate Methods for Meta-Analysis of Test Accuracy
 Methods Research Report An Empirical Assessment of Bivariate Methods for Meta-Analysis of Test Accuracy Methods Research Report An Empirical Assessment of Bivariate Methods for Meta-Analysis of Test Accuracy
Copyright by Sindhu Rose Johnson, 2013
 Making More Valid Estimates of Treatment Effect Using Observational Data in Uncommon Disease. The Warfarin in Scleroderma-associated Pulmonary Arterial Hypertension Model by Sindhu Rose Johnson A thesis
Introduction to Computational Neuroscience
 Introduction to Computational Neuroscience Lecture 5: Data analysis II Lesson Title 1 Introduction 2 Structure and Function of the NS 3 Windows to the Brain 4 Data analysis 5 Data analysis II 6 Single
Performance Assessment for Radiologists Interpreting Screening Mammography
 Performance Assessment for Radiologists Interpreting Screening Mammography Dawn Woodard School of Operations Research and Information Engineering Cornell University Joint work with: Alan Gelfand Department
Geoffrey Stewart Morrison
 Basic Workshop on Forensic Statistics Introduction to logical reasoning for the evaluation of forensic evidence Geoffrey Stewart Morrison p(e H ) p p(e H ) d These slides are available on the following
Empirical assessment of univariate and bivariate meta-analyses for comparing the accuracy of diagnostic tests
 Empirical assessment of univariate and bivariate meta-analyses for comparing the accuracy of diagnostic tests Yemisi Takwoingi, Richard Riley and Jon Deeks Outline Rationale Methods Findings Summary Motivating
We thank the Editor for guidance on submitting a revised version and have responded to each of the points outlined in their letter.
 We greatly appreciate the opportunity to revise our manuscript and to respond to comments and questions from the reviewers and editors. We feel that the manuscript is now greatly improved in conveying
Introduction to diagnostic accuracy meta-analysis. Yemisi Takwoingi October 2015
 Introduction to diagnostic accuracy meta-analysis Yemisi Takwoingi October 2015 Learning objectives To appreciate the concept underlying DTA meta-analytic approaches To know the Moses-Littenberg SROC method
Intelligent Systems. Discriminative Learning. Parts marked by * are optional. WS2013/2014 Carsten Rother, Dmitrij Schlesinger
 Intelligent Systems Discriminative Learning Parts marked by * are optional 30/12/2013 WS2013/2014 Carsten Rother, Dmitrij Schlesinger Discriminative models There exists a joint probability distribution
What is a probability? Two schools in statistics: frequentists and Bayesians.
 Faculty of Life Sciences Frequentist and Bayesian statistics Claus Ekstrøm E-mail: ekstrom@life.ku.dk Outline 1 Frequentists and Bayesians What is a probability? Interpretation of results / inference 2
You must answer question 1.
 Research Methods and Statistics Specialty Area Exam October 28, 2015 Part I: Statistics Committee: Richard Williams (Chair), Elizabeth McClintock, Sarah Mustillo You must answer question 1. 1. Suppose
Hierarchy of Statistical Goals
 Hierarchy of Statistical Goals Ideal goal of scientific study: Deterministic results Determine the exact value of a ment or population parameter Prediction: What will the value of a future observation
Research in Real-World Settings: PCORI s Model for Comparative Clinical Effectiveness Research
 Research in Real-World Settings: PCORI s Model for Comparative Clinical Effectiveness Research David Hickam, MD, MPH Director, Clinical Effectiveness & Decision Science Program April 10, 2017 Welcome!
Critical Thinking Rubric. 1. The student will demonstrate the ability to interpret information. Apprentice Level 5 6. graphics, questions, etc.
 Critical Thinking Rubric A. Defining, Demonstrating, Practicing, and Assessing Critical Thinking in the Classroom 1. The student will demonstrate the ability to interpret information. Offers biased interpretations