A SYSTEM FOR COMPUTER-AIDED DIAGNOSIS
|
|
|
- Domenic Goodwin
- 6 years ago
- Views:
Transcription


1 p- %'IK- _'^


2


3 PROBLEM- SOLVING STRATEGIES IN A SYSTEM FOR COMPUTER-AIDED DIAGNOSIS George Anthony Gorry June 1967

4 RECEIVED JUN


5 Abstract A system consisting of a diagnostic program and a variety of support routines is described. The diagnostic program differs from ones previously reported in several important aspects. The program is based on a model diagnostic problem which subsumes the principal features of a number of real diagnostic problems. The user specializes the program to a specific area by providing information derived from past experience in the area. The program operates in an interactive mode. It performs sequential diagnosis^ obtaining additional information from tests which it selects for the user to perform. In evaluating tests^ the program considers both the cost of tests and the seriousness of possible misdiagnoses. The inference function employs Bayesian analysis of observed attributes, and can accomodate a variety of inter-attribute dependencies. The system facilitates the study of a variety of heuristics for various program functions. Some results from the application of th program to a problem in medical diagnosis are presented.
6


7 A SYSTEM FOR COMPUTER-AIDED DIAGNOSIS I. Introduction A diagnostic system consisting of a diagnostic program and a variety of support programs has been implemented for use on the timesharing system at Project MAC, M.I.T. The diagnostic system serves two purposes. First, it was designed in such a way that it can perform diagnosis in a number of different problem areas. Although the information used by the system changes from area to area, the programs of the system remain the same. Second, the environment provided by the support routines facilitates the development and testing of new strategies for the diagnostic program. This paper discusses the considerations which influenced the design of the diagnostic system and the basic strategies incorporated in the current version of the system. Although some results obtained with the system are presented, the emphasis throughout is on the structure and operation of the system. The diagnostic system was designed to deal with a certain class of diagnostic problems. In a typical problem from this class, one wishes to determine the state of a system. For example, the problem may be to determine the disease-state of a patient or it may be to determine the failure-state of a piece of electronic equipment. It is assumed that the unknown state is one of a finite number of possi-
8


9 ble characteristic states. Presumably, if one can identify the current state of the system, one can improve some subsequent decision regarding the given system. For example, if a doctor can identify a patient's disease as pneumonia, he is much better prepared to begin treatment. In general, a diagnostician employs two different sources of information in solving a problem. First, he draws on his experience with similar diagnostic problems. Often this experience is derived mainly from actual problems which confronted him in the past, but it may be augmented by training and study. To a large extent, this experience will dictate how the diagnostician will deal with the current problem. His second source of information is the particular system under consideration. Through the use of various tests, the diagnostician can obtain this information. The results of these tests provide new information which he can use in coming to a decision about the state of the system. The manner in which the diagnostician employs his experience in the interpretation of test results, here termed the inference function, is a basic determinant of diagnostic skill. In choosing a test to perform on the given system, the diagnostician should consider the cost of the test as well as its potential usefulness. Some tests may be very costly. For example, certain medical tests may be costly in terms of discomfort or even danger to the patient, the time of skilled people, or money. Such

10


11 tests should be employed only if their use can be justified by the gain in information about the system expected to result from performing them. This additional information is valuable^ because there is a cost associated with a misdiagnosis. The more information he can obtain about the current problem, the less apt he is to make a misdiagnosis. Thus, the value of additional information about the system is that it tends to reduce the uncertainty about the unknown state, and hence tends to reduce the expected cost of misdiagnosis. Thus, the diagnostician is confronted with the problem of balancing two conflicting objectives: 1) to perform relatively few tests and incur only a limited testing cost, and 2) to perform many tests to obtain much information and hence reduce the expected cost of misdiagnosis. This suggests that the diagnostician might employ sequential diagnosis to advantage in such a situation. In sequential diagnosis he performs some small number of tests and uses the results to update his view of the problem. He then evaluates the relevant alternatives available to him based on this new view of the problem. For example, one alternative is to make a terminal decision about the current state of the system. Also, there is an alternative corresponding to the performance of each potentially useful ^est. Because decision alternatives are evaluated dynamically, tests are performed only as they are needed. Hence the cost of an unneeded test is avoided. The manner in which the diagnostician dynamically evaluates decision alternatives is called the test-selection function.

12


13 This description of a diagnostic problem with emphasis on the inference and test-selection functions seems to characterize a number of actual diagnostic problems such as the diagnosis of machine failure and medical diagnosis. It suggests that it might be possible to develop diagnostic strategies which would be applicable to a number of different diagnostic problems. In the work described here^ this possibility was investigated. An attempt was made to formulate diagnostic strategies which not only are applicable to a number of diagnostic problems^ but are also stated in such a way that they can be incorporated in a computer program. The incorporation of such diagnostic strategies in a computer program may result in an improved diagnostic capability in a number of areas. Diagnosis is generally a difficult problem. It places considerable demands on the organization and use of experience as well as the proper interpretation of test results in light c " this information. When experience is framed in probabilistic terms, the problem is even more difficult. The determination of a good testing strategy is also a difficult problem. Hence, if a diagnostic program could be developed which exploited the comparative advantages of a computer, its use in conjunction with a human diagnostician might provide him with a powerful tool for dealing with the complexities of diagnosis. The goal of the^ work, then, was t^ ^^rmulate diagnostic strategies which exploit t he processing and storage capabilities of a computer. No attempt was made to simulate human diagnostic strategies. While the results of the work might provide strategies
14


15 which hvunans could employ effectively, such results would really be derivative. In order to make the view of diagnosis more specific, a model diagnostic problem was defined. This problem made explicit a number of considerations mentioned above. The object of this model diagnostic problem is to determine the current state of a given finite-state machine. By applying a test to the machine, the diagnostician can discover one or more attributes. Information about the given machine is available only in terms of attributes. For the diagnostician, the significance of any given attribute depends on the other known attributes and on the experience the diagnostician has had with similar machines. In the model problem, experience takes a very specific form. The diagnostician has available the following information about the machine: 1) the identity of each possible state and the a priori probability that the machine is currently in that state, 2) a list of all the possible attributes and for each state the conditional probability that the attribute will be exhibited by the machine given that the machine is in that state, 3) the name and cost (in some units) of a test to detect each attribute if it is present (A given test may be the test for more than one attribute.) and 4) for each pair of states (Mj^,Mj) the cost 1^^ (in the same units as the test costs) of deciding the unknown state is M^ when it is really M^. The diagnostician is also aware of all relevant relationships
16


17 among attributes (e.g. that two given attributes are mutually exclusive). Finally, he is certain that all tests are accurate, and that no test will change the characteristic state of the system. The problem for the diagnostician is as follows. Given some initial set of attributes known to be present, the diagnostician must choose either to make a decision about the state of the machine or to perform a test. In the first case, he incurs the risk of misdiagnosis and its consequent cost, and in the second case, he incurs the cost of the test. If a test is performed, its results (a set of one or more attributes) are revealed to him. Again he has a choice of making a terminal decision or performing a new test. Throughout the problem, his goal is to minimize the sum of the testing cost and the cost of misdiagnosis. A diagnostic program was designed to solve this model problem. The remainder of this paper describes the program and its environment and presents some results obtained from its application to some real diagnostic problems. 2. The Diagnostic System The diagnostic system was implemented on the bime-sharing system (CTSS) at Project MAC, M.I.T. The diagnostic system was written principally in MAD, but some heavily used routines were written in FAP, The system makes very extensive use of the SLIP-MAD library for list processing developed by Professor Joseph Weizenbaum of M.I.T. (5)
18


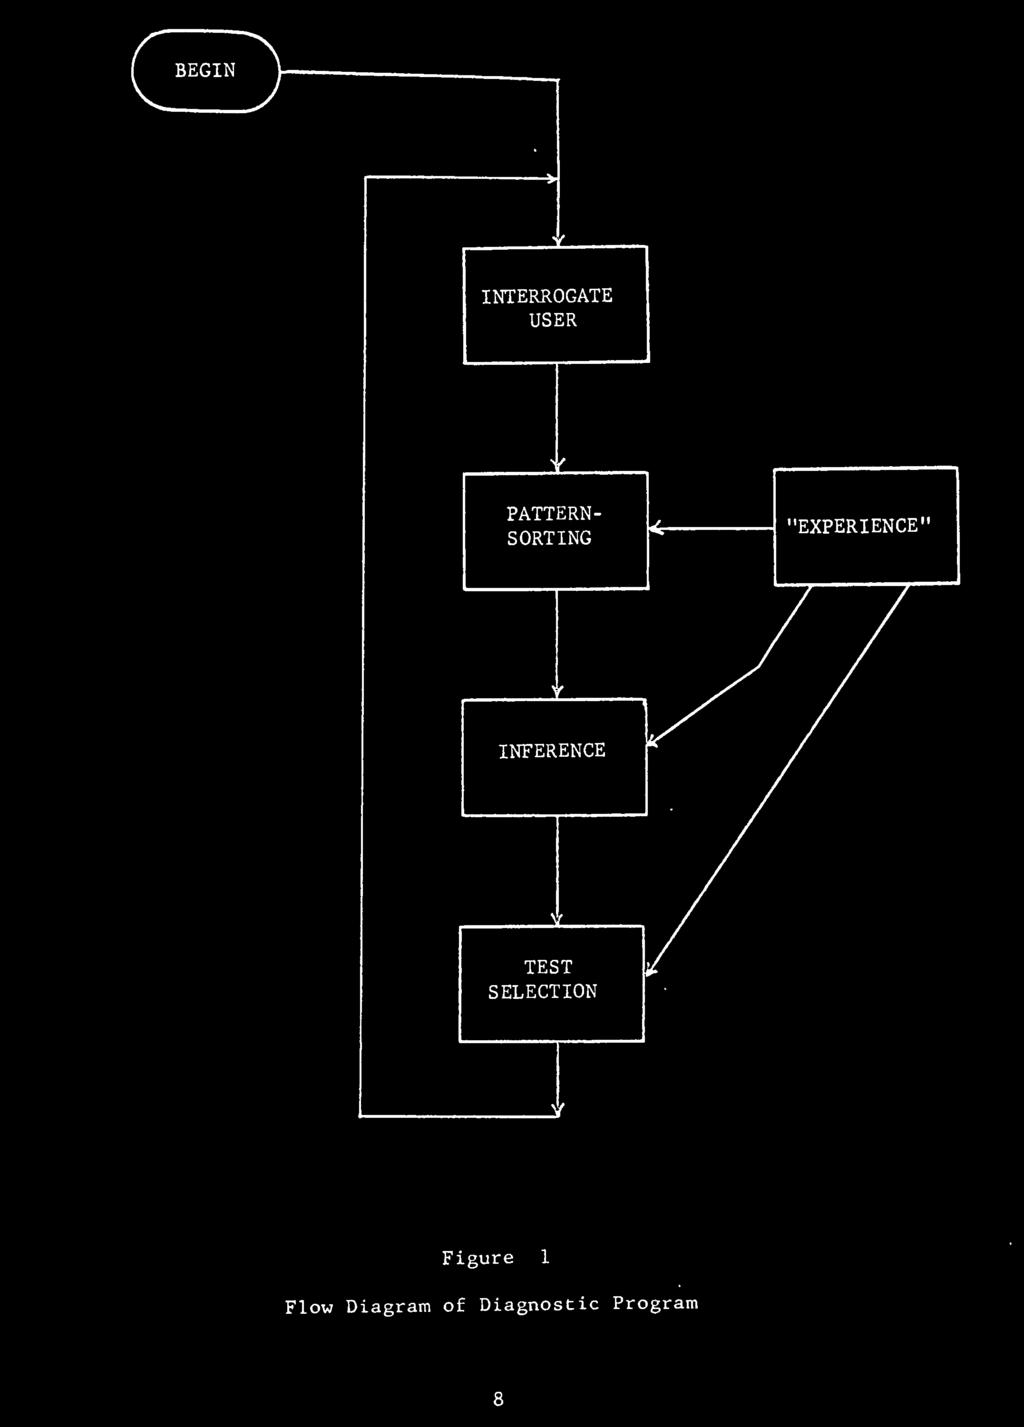
19 In its basic mode of operation, the diagnostic system permits a user to interact directly with the diagnostic program. The latter is a set of functions, each of which will be discussed in some detail. First, however, a brief description of a user's session with the program will be presented, so the reader can get a general understanding of the operation of the program. If a user wishes to employ the program for diagnosis in a particular problem area, he must provide the program with appropriate experience for the area. This experience is all the information specified in the model diagnostic problem discussed above. It includes, for example, the names of all the possible states, attributes, and tests; the relevant probabilities and associations; and the costs of tests and misdiagnoses. This information is stored as a disk file by the user. From this file, the program creates an information structure for the problem area. The information structure is a particular organization of the information in the main memory which is suited for the types of processing required during a diagnosis. Assume that a doctor has provided all the required information about a certain medical area and that the program has created the information structure. The doctor now wishes to use the program in the diagnosis of a patient's problem. The patient's complaint is a persistent cough, and this is the only attribute known so far. From Figure 1, it can be seen that the user inputs the initial defi-
20

21 BEGIN
22

23 nition of the problem to the program. In this case^ the problem is defined by a single attribute. The program processes the attributes through the pattern - sorting function. This function makes decisions about the relevance of attributes to the current diagnostic problem. If^ for examplej the initial problem definition had included the attribute "sore ankle," the pattern-sorting function might have decided that "sore ankle" and "persistent coughing" were manifestations of different medical problems and should be considered separately. The output of the pattern-sorting function is a set of attributes which it believes should be considered as a group by the program. In this example, there is only one attribute in this set. The inference function employs the attribute set produced by the pattern-sorting function and the experience incorporated in the information structure to produce a current view of the problem. The current view includes a probability distribution for the unknown disease given the attributes observed to date and experience with similar problems. Based on the current view, the program evaluates all currently relevant decisions. This evaluation is performed in test - selection function. The program either chooses to make a terminal decision or to request that a certain test be performed. In making this decision, the program considers the costs of available tests and the potential risk of misdiagnosis. Suppose, in the example, the program chose to request a chest X-ray for the patient. (This means that the expected value of the information gained from the test exceeds
24


25 10 the test cost.) The program reports its choice to the doctor. When the test results are available, they are reported to the patternsorting function and the loop depicted in Figure 1 is repeated. Whenever the program decides that the test cost exceeds the expected value of test results for every relevant test, it will make a terminal decision about the set of attributes currently being considered. This brief description has placed the user in a very passive role with regard to the diagnosis. In fact, as the discussion of the various functions will indicate, the system permits the user to be quite active. For example, these functions allow him to test hypotheses and to overrule test selection decisions by the program. The four major components of the diagnostic program will now be considered in some detail. As indicated above, these components are the information structure, the inference function, the test selection function, and the pattern-sorting function. 2.1 The Information Structure The information structure contains all the experience regarding a particular problem area which is employed by the diagnostic program. The contents of the structure are the states, attributes, tests, probabilities, etc. which are assumed in the model problem. As mentioned above, the user provides a file containing this information, and from it, the diagnostic system creates the information structure.
26

27 11 The information structure is a SLIP list structure. The particular form of the information structure was dictated by several considerations. It was advantageous to employ a structure which permitted the use of many of the SLIP list manipulating and searching functions. The decision to make the information structure a SLIP list structure strongly influenced subsequent decisions about internal representations. The information structure must permit answers to a variety of questions to be obtained in a reasonably efficient manner. Such questions might include: What are the attributes of pneumonia? What diseases result in a rash? What is the probability of a fever greater than 102 given pneomonia? The particular form of the information structure was chosen to facilitate the answering of such questions. The three basic components of the information structure are state - lists, attribute - lists, and test - lists. Each of these is a SLIP list. There is one state-list for each state; one attributelist for each attribute, and one test list for each test. A sample state list is represented in Figure 2. For each attribute which is relevant to the given state, the corresponding attribute list appears as a sub-list of this state list. Also associated with each state list is a description list on which are stored attribute-value
28


29 Address of Cell Contents of Cell
30


31 13 pairs. For a given state, the print-name and the priori probability of the state are stored on the description list of the corresponding state list. As depicted in Figure 3, an attribute list contains a test list as a sublist. Thus for each attribute, a test to detect the attribute can be retrieved. The description list for an attribute list contains, in addition to the print-name for the attribute, a special list knovm as a member list. The member list contains the name of each state list for which the given attribute list is a sublist and the conditional probability of the attribute given the state. A test list, like the one depicted in Figure 4, contains the cost of the test. It also possesses a description list which contains its print-name and a member list. The latter contains the list names of all the attribute lists for which the given test list is a sublist. In order to permit accessing of state lists, attribute lists, and test lists in a reasonably efficient way, an additional level or organization was built into the information structure. Each state list is a sublist of one of some number (usually 16) of hash lists which are in turn sublists of the master state list. To retrieve the state list corresponding to a particular state, the printname for the state is sent to a hash coding routine. This routine ^In an attribute-value pair, the attribute (which in this case does not mean attribute of a diagnostic problem) serves as a key word by which the corresponding value can be retrieved. Thus, the value of a given attribute can be set or retrieved by SLIP functions,
32

33 Address of Cell Contents of Cell
34

35 Address of Cell Contents of Cell f

36

. The use of hash lists substantially reduces the search time for a state list with a given print-name.")
37 16 converts the print name to an integer in the range 1 to K, where K is the number of hash lists on the master state list. Assuming that this integer is J, the Jth hash list on the master state list is searched for the state list with the given print-name. Because the state lists were originally distributed among the hash lists in accordance with the hash coding scheme, the required state list will be found on the J hash list (if such a state list is in the information structure at all). The use of hash lists substantially reduces the search time for a state list with a given print-name. As with the state lists, both attribute lists and test lists are organized using the hash coding function. Thus there is a master test list and a master attribute list. Because certain relationships among attributes may be important in diagnosis, the diagnostic system includes a facility for representing such relationships in the information structure. This facility is provided by the clustering routine. This routine permits the user to specify a dependence among the attributes of a particular state. For example, he might indicate that two given attributes are mutually exclusive for the state in question. Because the important relationships are apt to vary from one problem area to another, no attempt was made to incorporate specific relationships into the diagnostic system. Instead, the system provides means by which the user can define relationships in such a way that the inference function can correctly consider relationships during a diagnosis.
38
 in defining predicates.")
 (LE (CHAR TIME X) (CHAR TIME Y)) Here CHAR is a system primitive which retrieves a characteristic of an attribute. Its first argument is taken as a literal.")

39 17 The user defines a relationship by providing the system with a definition of a predicate which is true only when the relationship is satisfied. The system recognizes a set of primitive logical and arithmetic operations, and the user can use these (or previously defined relationships) in defining predicates. If, for example, the relationship "precedes in time" is desired, the user might define it as follows. PRECEDES (X Y) (LE (CHAR TIME X) (CHAR TIME Y)) Here CHAR is a system primitive which retrieves a characteristic of an attribute. Its first argument is taken as a literal. If, for example, for a given state the relationship "A precedes B" is relevant, the evaluation of (CHAR TIME A) would result in a question to the user "What is the time of A?" when A was first observed. The answer would be stored as part of the history of the diagnosis and would be available later without further interrogation of the user. The system includes an interpreter which is used to evaluate relationships. In the above example, the interpreter would apply the definition of PRECEDES to the argument list (A B) during the inference phase. Notice that the attributes A and B may be independent for some other state. The clustering routine is used to distinguish these cases. The arguments of this routine are the name of a state, the name of a relationship, and the names of the attributes involved in the relationship. The effect of the clustering routine is to alter the state list to reflect the dependence
40

/M^). P(Mi) P(Mj/(Ai... Ai,)) P((A,... i^)) ^ where P(M0 is the a priori probability of state M- P((A... A )/M. ) is the conditional probability of {k^.")
41 18 of the attributes. The manner in which the relationship definitions are employed by the system will be discussed in more detail in the following section on the inference function. 2.2 The Inference Function The purpose of the inference function is to provide a rational way of accounting for observed attributes in keeping with the experience contained in the information structure. The basic deductive rule employed by the inference function is Bayes Rule. If the set of attributes observed to date in the diagnosis is (Aj^,,,. Aj^), the probability of the j-=ii state^ M., is given by P^M l(l A ^^ - P((Al... Ak)/M^). P(Mi) P(Mj/(Ai... Ai,)) P((A,... i^)) ^ where P(M0 is the a priori probability of state M- P((A... A )/M. ) is the conditional probability of {k^... Aj^) given Mj P((A^... A, )) is the unconditional probability of (Aj^... Aj^) At any state of the diagnosis, the probabilities PCMj/CAj^... Aj^)) and a record of the tests run and the attributes observed constitute the current view of the problem taken by the diagnostic program. This is the basis for the evaluation by the test selection function of the potential usefulness of new tests.
42


43 1 19 The task of the inference function is to update a probability distribution for the unknown state based on the observation of a new attribute. As noted^ this updating is accomplished through the use of Bayes Rule. While this updating is easily ac- complished in principle^ there are certain considerations which make the practical realization of the procedure somewhat complicated. One consideration is that of the non- independence of certain attributes. The inference function must properly account for relationships among attributes which are discovered in the information structure. The means for handling these relationships are provided by a routine called PIJ and the interpreter mentioned above. The function of the routine PIJ is to determine the conditional probability of an attribute given a state and the history of the diagnosis to date. In the event that the attribute is not dependent on any other attribute for the given state^ PIJ needs only to retrieve the required probability from the information structure. When the attribute is involved in a relationship for the given state, the situation is more complicated. Consider, for example, the two attributes A and B which are mutually exclusive given the state M. Further assume that the conditional probabilities of A and B given M are 0.7 and 0.3 respectively. If, at some stage in the diagnosis, A is observed but there is no information about B, the proper value for P(A/M) is 0.7. If later B is observed, the proper conditional probability for PIJ to return
44
, the routine discovers the attribute cluster for A and B on the state list for M, The name of the cluster relationship (stored in the cluster)")
45 20 is P(B/M,A) or zero. PIJ obtains these probabilities in the following way. When called upon for the conditional probability P(A/M), the routine discovers the attribute cluster for A and B on the state list for M, The name of the cluster relationship (stored in the cluster) and the arguments of the relationship are passed to the interpreter. The interpreter evaluates the predicate which defines the relationship for the arguments A and B. Notice, however, that although A has been observed, there is no information about B currently available. This situation occurs quite often in sequential diagnosis. That is, the interpreter is often confronted with relationships which do not have a complete set of arguments (i.e. the values of some of the arguments are unknown). The interpreter deals with this problem by assuming the truth of any relationship predicate which is not demonatrably false in view of the history of the diagnosis. This strategy results in predicate values which can be employed by PIJ in a manner consistent with Bayesian inference. Thus, in the above example, the interpreter indicates that the relationship i^ satisfied. From this result, PIJ deduces the proper conditional probability, namely 0.7. When B is observed, the relationship is not satisfied. PIJ uses this result to obtain zero for the required conditional probability, PIJ, then, is composed of a set of logical tests on the results produced by the interpreter, the type of the relationship in question, and some information about the number of variables for which values
46

47 21 were available. By combining this information, PIJ can correctly account for a variety of inter-attribute relationships. The inference function is able to assign the proper significance to attributes in the Bayesian analysis. There is another important matter which must be considered in specifying the inference function. In certain diagnostic problems, it may not be possible to relate all the observed attributes to a single state. Consider, for example, the diagnostic problem posed by a patient who has a severe cough and a sore ankle among other signs and symptoms. It is unlikely that the attributes "severe cough" and "sore ankle" are indicative of the same disease state. Suppose further that most of the observed attributes suggest diseases which can produce a severe cough, and that before the attribute "sore ankle" is observed, only diseases in this group are being considered by the program. When the attribute "sore ankle" is finally observed, it is necessary for the inference function to incorporate this new evidence into the current view of the problem. This means applying Bayes Rule. But what value should be assigned to the conditional probability of "sore ankle" given a particular disease, D, from the group being considered? 1 This last source of information permits PIJ to recognize relationships assumed satisfied because no appropriate information was available. Such relationships are accounted for somewhat differently in determining probabilities.
48

49 22 Notice that while it is quite possible for the patient to have disease D and a sore ankle, the attribute "sore ankle" is not significant in the diagnosis of D, If, however, the program takes the conditional probability of "sore ankle" given D to be zero, then D will be permanently eliminated from further consideration by Bayes Rule. This is obviously very undesirable. An alternative is to assign a value of (e^ "^ 0) to the conditional probability in question. (One choice for might be the un - conditional probability of the attribute.) Such a choice would prevent the inference function from eliminating any state from consideration except in the case of an explicit zero conditional probability. The disadvantage of this approach is that it prevents the drastic reduction of the number of states considered by the diagnostic program based on observed attributes. Because the number of possible states may be very large, a reasonable level of efficiency in diagnosis demands maximum use of each attribute to narrow the focus of the search. For example, if the observed attributes indicate a stomach problem, the test selection function should not consider such tests as a leg X-ray. An alternative solution is to employ probabilities as above, but to maintain a threshold and to eliminate states for which the current probability has fallen below this threshold. This approach, too has a major drawback. The conditional probability of a state given the observed attributes can vary greatly during a diagnosis.
50

51 23 The sequence of values it assumes depends upon the order in which observed attributes are considered by the inference function, although for a fixed set of observed attributes, the final probability is independent of the sequence. Thus, the state D in the above example might still be eliminated by the inference function if the attribute "sore ankle" were one of the first attributes observed in the diagnosis. The solution to this problem embodied in the diagnostic program is quite different from those described above. This solution is implemented in the pattern-sorting function, the operation of which is discussed in the next section. 2.3 The Pattern-Sorting Function The information structure as currently constituted associates with each state only those attributes which are considered by the user to be relevant to the diagnosis of that state. Thus, while it is possible for a patient to have tuberculosis and a sore ankle, the user would not associate the attribute "sore ankle" with the state "tuberculosis", because the attribute contributes nothing to the diagnosis of the disease. This means that the attribute list for "sore ankle" does not appear as a sublist of the state list for "tuberculosis" in the information structure. In certain cases, the diagnostic program will be confronted with a set of observed attributes such that no state is associated with all the observed attributes in the information structure. The
52

53 . 24 pattern-sorting function is designed to deal with such a situation. This function operates in such a way as to make maximum use of a newly observed attribute in reducing the number of states considered by the program. At the same time, it provides safeguards against the elimination of the actual state from consideration through the processing of an "irrelevant" attribute. From the set of observed attributes, the pattern-sorting function creates a set of attribute patterns. Each pattern is a subset of the set of observed attributes which satisfies two requirements: 1) at least one state in the information structure is associated with all the attributes in the pattern, and 2) the pattern is not a subset of any other pattern. As an example, consider the patterns obtained from the set of observed attributes (A,B,C). If at least one state in the information structure is associated with all these attributes, there will be only one pattern, namely (A B C). Assume, however, that no state meets this requirement, but a number of states are associated with A and B. Then (A B) is a pattern. The pattern (A C) would be legitimate if at least one state is associated with A and C. (By assumption, A cannot also be associated with B.) In this case (C) cannot be a pattern since it is a subset of (A C) The pattern-sorting function maintains a list of all patterns called the pattern stack. Associated with each pattern in the pattern stack is a probability distribution for the unknown state obtained
54

55 25 by the inference function on the assumption that the given pattern constitutes the entire set of observed attributes. The patterns developed in this way constitute a hypothesis about an overall relationship among attributes. It results in a grouping of attributes in a certain way. The particular grouping, however, may be proved incorrect by the observation of certain new attributes. In the above example, the correct grouping might be (A B), (C). For this reason, the patterns constructed by the pattern-sorting function are not static, but rather are continually reviewed by the function. Such reviews may result in the creation of new patterns and the deletion of old ones. The pattern stack is managed in the following way. Whenever a new attribute is observed, it is processed by the pattern sorting function. For each pattern in the pattern stack, a subroutine determines the relevance of the new attribute to the pattern. If the corresponding attribute list appears as a sublist of any state list associated with the pattern, the new attribute is considered relevant to the pattern. This association between state lists and a pattern is effected through a distribution list. For each pattern, a distribution list contains the names and probabilities of all states which have a non-zero probability given the attributes in the pattern. In obtaining these probabilities, the inference function assigns zero to the conditional probability of an attribute given a state whenever
56

57 26 the corresponding attribute list is not a sublist of the state list. Since states with zero probability are removed from distribution lists, this maximizes the use made of an attribute to reduce the number of states in a distribution list. When a new attribute is relevant to a given pattern, the inference function is invoked to update the distribution list and the attribute is added to the pattern. If after updating, any state in the distribution list has zero probability, it is removed from the list. An example of such a situation is the following. Suppose the pattern in question is (A B C) and the states in the distribution list are (M N 0). The attribute D is now observed. Assume that the attribute list for D appears as a sublist of the state lists for M nd N respectively, but is not a sublist of the state list for 0. This means that the attribute is relevant to the diagnosis of M or N, but not to that of 0. The updating of the pattern will result in a new pattern (A B C D) and a new distribution list containing only M and N, In some cases, the probability of a pattern may go to zero (i,e. the probability of each state in the distribution list becomes zero). In this event, the pattern is deleted from the stack. Note that if an attribute is not relevant to a particular pattern, no updating of the pattern takes place. When the new attribute has been processed against each pattern in the stack, the pattern-sorting function tries to create a new pattern. Each state list on the member list of the given attribute list
58


59 27 is checked. If the state list appears on a distribution list in the stack, no further action is taken. If the state list is not found, a new pattern can be created. The new pattern is the intersection of the set of attributes associated with the state and the set of observed attributes to be accounted for. A distribution list is created for this pattern, and if the pattern has non-zero probability, it is added to the stack. During a diagnosis, the program maintains a list of observed attributes known as the unaccounted - for list. All attributes are placed on this list when they are first observed. Whenever a pattern is assigned a tentative diagnosis by the program, the attributes in the pattern are removed from the unaccounted-for list. The pattern in question is marked in the stack. If the unaccounted-for list is empty, a tentative diagnosis for all attributes has been obtained. If this list is not empty, there are still attributes to be investigated. All unmarked patterns are deleted from the stack, and new patterns are formed using the unaccounted-for list as the set of observed attributes. If, for example, the pattern just diagnosed is (A B CD), the unmarked pattern (C E F) will be converted to (E F) in this process. Once the attribute C has been assigned to a tentative diagnosis, the program need not account for C in another pattern as well. If, however, during the investigation of the pattern (E F), the test selection function chooses a test which would reveal C, This attribute simply will be transferred to the pattern with the

60

 in the pattern stack, the pattern-sorting function must choose one of the patterns for further investigation.")
61 28 appropriate updating. The user will not be interrogated again about C. In summary, then, attributes from tentatively diagnosed patterns are used to update unmarked patterns only if tests for these attributes are suggested by the test selection function. The pattern-sorting function performs one other task for the diagnostic program. The test selection function bases its evaluation of tests on a single distribution list. Since there may be a number of patterns (and hence distribution lists) in the pattern stack, the pattern-sorting function must choose one of the patterns for further investigation.. Thus, if confronted with two patterns, the program must decide which pattern to diagnose first. For example, a doctor might choose to investigate the severe cough of his patient before seeking to account for his sore ankle. There are a number of factors which might influence the choice of a pattern. If the pattern contains a very unlikely attribute, then it might be favored. The pattern might also be favored if it suggests a very serious state or contains many attributes. The selection rule employed by the pattern-sorting function employs a seriousness measure for each state. The actual derivation of the seriousness measure is not important here. (It is obtained from the values 1^^ of the loss function matrix.) Each state is assigned a value W. of the seriousness measure. The seriousness measure for the khll pattern, S, is obtained as follows. Sk= i ^j Wj

62


63 29 where Pj is the conditional probability of of the j state given the attribt" h utes in the k pattern. The current pattern is the pattern for which S-^ is a maximum. At any stage in the diagnosis^ the distribution list of the current pattern, the current distribution, is used by the test selection function for test evaluation. Note that the measure Sj^ has a number of desirable properties. If an attribute in the vs^ pattern is quite specific to a serious state Mg, then P^ is approximately one, and S^ is approximately W, If all the states in the distribution list are very serious, the value of Sj^ will be large regardless of the actual probability distribution. A pattern containing many attributes is favored only if the seriousness measure S, warrants it. Thus, the program may temporarily ignore a number of attributes of the common cold to investigate an attribute associated with cancer. The seriousness measure for each pattern is recomputed before every entry into the test selection function. This means that new current pattern may be chosen. If, for example, the only serious state in the current pattern becomes quite unlikely as the result of the observation of a new attribute, the pattern-sorting function may select a new current pattern for the test selection function 2.4 The Test Selection Function The set of routines which comprise the test selection function
64

, the history of the")

65 . 30 perforin the analysis of all relevant decision alternatives for the diagnostic program. At each stage in a diagnosis, the program must decide whether tp request that the user perform another test or to make a terminal decision about the given system. There is a decision alternative for each relevant test and one for the terminal decision. In choosing one of these alternatives, the test selection function considers the current view of the problem (embodied in a probability distribution for the unknown state), the history of the diagnosis to date, and information about the potential usefulness and cost of the various decisions. The manner in which these considerations are brought to bear on the problem of test selection is discussed in this section. The test selection problem can be represented by part of a de - cision tree such as that depicted in Figure 5. Such a tree contains two kinds of nodes. Nodes such as A are called decision nodes, and correspond to those points in the diagnosis where the program can make decisions. At each decision node, each decision alternative is represented by a branch emanating from that node. In the test selection problem, there is a branch from a decision node for each relevant test and one for the terminal decision alternative. If the program selects a particular test, it moves to one of nature 's nodes such as node B in Figure 5. Here "nature" chooses a branch corresponding to a particular test result, and the program moves along this branch to a new decision node.
66

67 Figure 5 A Portion of a Decision Tree 31
68

 increases very rapidly.")
69 32 Each decision node is characterized by a probability distribution for the unknown state and a history of the diagnosis to date including the sequence of tests already performed. Since the information structure includes all the additional probabilities required, the program could solve the test selection problem by constructing the entire decision tree and "folding it back" in terms of expected loss. In this way, the optimal testing strategy could be obtained. The problem with this approach is not conceptual, but computational. As the number of tests and test results increases, the size of the decision tree (as measured by the nvunber of decision nodes) increases very rapidly. For example, if one were using twenty "one time" tests (each with two mutually exclusive results) to classify patients into one of ten disease groups, the maximum number of decision nodes in the tree is N(K 10) = ^Q^ ^Q' Where K is the depth of the tree. (Searching the decision tree to depth K from the current decision node means evaluating all sequences of K tests from the set of relevant tests.) VJhen K is 5, N(K, 10) is approximately 10, although this example does not constitute a particularly large problem. Notice that even if there were a specific test for each disease, there would be about 30,000 different testing This is possible if no test is to be performed more than once during a diagnosis.
70


71 33 strategies of length 5. The design of the test selection function was strongly influenced by such considerations. The function can employ a variety of heuristics for test selection when the decision tree is very large. It can also obtain optimal testing strategies when this approach is computationally feasible. Since the latter process is extensively discussed in the literature, it will not be considered here. This discussion will focus on the use of heuristics to obtain "good" testing strategies with a reasonable amount of computation. An obvious approach to reducing the number of decision nodes considered by the test selection function is to limit the depth of the search to some small number. For example, only testing sequences of length two might be considered. A second approach is to limit the breadth of the search at each decision node. The breadth of the search is the number of tests considered at a decision node. By controlling either or both of these, the test selection function can restrict the number of decision nodes which it considers. Of course, such a restriction may well lead to sub-optimal testing strategies. The present version of the diagnostic system permits the user to set depth and breadth control parameters for the test selection function. These parameters can be set independently of one another (subject to certain limitations on available memory) and each can be altered at any stage in the diagnosis. If at some stage in a diagnosis the depth control parameter is
72


73 . 34 K, the test selection function evaluates all relevant testing strategies of length K. Thus all paths from the current decision node are explored to the same depth. Generally, this means that the test selection function must decide the relative value of being at a decision node corresponding to a less than certain diagnosis. For example, consider a search of depth 1. Suppose one of the possible outcomes of test T is A. From the current distribution P and the observation A, a new distribution P' can be obtained by the inference function. Part of the problem of evaluating the potential efficacy of T is that of assessing the desirability of attaining the view characterized by P ' The measure used by the test selection function for this purpose is the expected decision loss for a terminal decision. The loss of a decision node at depth K from the current node is the expected loss for the optimal terminal decision for the node. Thus, if a search of depth K down some path in the decision tree terminates on a node for which the probability distribution is P', the expected loss for the node is given by L'= -n ilijpj l^i^n j = l The loss for any test is taken to be the cost of the test plus In some cases, a decision node which permits a terminal decision will be encountered. In such a case, the search of that path is terminated, regardless of depth.
74


75 35 the sum of the expected losses for the decision nodes which can result from the test each weighted by the probability that the node will be reached given the distribution at the node where the test is employed. Thus, for any non-terminal decision node, each relevant test can be evaluated by "folding back" the appropriate portion of the decision tree below the node. When each relevant test has been evaluated in this manner, the expected loss for the best decision (either to perform a certain test or to make a terminal decision) becomes the expected loss for the node. This process of evaluating tests results in a list of decision alternatives for the current node and their expected losses. The decision alternative with minimum expected loss is selected by test selection function. Since the value of each alternative is known, the program can select the second best alternative if for some reason the user overrules the first choice, etc. The user can also control the breadth of the search in the test selection function, although in a less direct way. The user can set a threshold used by the test selection function. Only tests relevant to states whose current probability (at a given node) is greater than the threshold are considered by the test selection function. For example, if the current distribution were (0.1, 0.4, 0.5) for the states A, B, and C respectively, and the threshold were 0.45, only A test is considered relevant to a state if it can detect an attribute which has non-zero conditional probability given the state.
76


77 36 those tests relevant to state C would be considered at this node. Note that this control is indirect^ because all the tests relevant to A and B may also be relevant to C. The user may employ the test selection function to aid him in testing hypotheses about the unknown state. If^ for example, he believes that the state is B, he can request the program to determine the best test to prove or disprove his hypothesis. The test selection function includes a number of other heuristic controls which permit more complicated heuristics to be specified. The effectiveness of some of these heuristics has been studied, and a report on the results is available elsewhere (4). The interested reader is referred to that report for a more extensive discussion of this subject. Suffice it to say here that through the use of the heuristic controls, the user can specialize the test selection function to a number of different selection strategies. 2.5 The Generator One purpose of the highly modular design of the diagnostic system is to allow new strategies to be introduced into it as the problems of diagnosis become better understood. Unfortunately, there are relatively few problem areas for which the appropriate "experience" is available (in terms of probabilities etc.). If the diagnostic program is restricted to real problems, it may not be possible to exercise existing strategies in a sufficient nvmiber of environments to properly assess their general effectiveness. It is particularly useful

78

79 37 to be able to construct artificial problems to test specific features of the program (e.g. the sensitivity of performance to the number of irrelevant attributes encountered by the program). The generator was incorporated into the system to meet this need, The generator is a set of routines which provide an extensive simulation capability. The user can turn system control over to the generator, and the latter becomes the subject of the diagnosis. Using an existing medical information structure, for example, the generator could choose a particular disease at random based on the a priori disease probabilities in the structure. After choosing some number of attributes at random (again in accordance with the probabilities in the information structure), the generator presents these attributes as a problem to the diagnostic program. The latter functions as usual, except the generator intercepts all requests for test results and provides these results in keeping with the probabilistic description of the disease. The generator can maintain extensive records of various aspects of the performance of the diagnostic program on the case. Since the generator employs the information structure and all the associated accessing routines, it can correctly account for any inter-attribute dependency which is represented in the structure. Because the given information structure can correspond to either a real or an artificial diagnostic problem, the user can study the performance of the diagnostic program in many environments. Of course, the
80

 number of initial attributes per case, 4) number of irrelevant attributes per case, and 5) heuristic controls for test selection.")
81 38 generator also allows many cases to be run in a reasonable time. While the generator is a very important tool for the study and improvement of the diagnostic program, its design is generally straightforward, and it will not be discussed in detail here. From the user's point of view, it allows him to perform a simulation run for which he can set 1) the number of cases, 2) whether cases should represent one state only or be representative of the population, 3) number of initial attributes per case, 4) number of irrelevant attributes per case, and 5) heuristic controls for test selection. Although these controls are not exhaustive, they do provide a flexible means for studying the performance of various diagnostic strategies. 3. Applications of the Diagnostic System To date, the diagnostic system has been applied to two problems in medical diagnosis. One problem is the diagnosis of congenital heart disease. The use of a computer in the diagnosis of congenital heart disease has been studied extensively by Warner and his associates (1,2). They have developed a program which employs Bayesian analysis, but their program provided neither a test-selection nor a pattern-sorting capability. All the relevant attributes for a case are collected before the program is invoked. The program employs a

82

, and he has developed a program similar in design to that of Warner. Dr. Warner and Dr.")
83 39 disease-attribute probability matrix and Bayes Rule to obtain a posterior distribution over the thirty-five possible diseases. The second problem considered was the diagnosis of primary bone tumors. Here the problem is to employ evidence derived principally from a radiograph to classify a patient into one of nine bone tumor classes. Computer-aided diagnosis of bone tumors has been studied in depth by Lodwick (3), and he has developed a program similar in design to that of Warner. Dr. Warner and Dr. Lodwick generously provided the necessary statistical information and actual case histories required for the study of the performance of the diagnostic program on these problems. The results of this study are available elsewhere (4), and more studies are planned. Here some representative results from the study of bone tumor diagnosis will be presented, so the reader can obtain a feeling for capabilities of the program. The bone tumor problem was formulated with nine states (one for each histologic type) and thirty-two tests. Some tests were specific for a particular attribute (e.g. a test for a certain pattern of bone destruction), while other tests were associated with a number of attributes. An example of the latter is the "age test" for which there are five attributes, each corresponding to a range of years. Warner's program uses a somewhat modified form of Bayes' Rule to correctly account for mutually exclusive attributes.
84


85 40 There are an extremely large number of possible attribute sets which can be encountered, and while certain attributes are generally strong evidence for particular tumors, this evidence alone is not conclusive. As a result, it may be necessary to consider many attributes to establish a diagnosis for a particular case. The disease-attribute probability matrix provided by Dr. Lodwick was used as the basis for an information structure. The results discussed here were obtained by assigning all tests unit cost and all misdiagnoses a cost of 100,000. Twelve actual case histories were used as the basis for problems presented to the program. For each case, approximately nine attributes were included as the initial statement of the problem. These attributes were considered to be easily observable (for example, the age of the patient, the location of the tumor, etc.). During the diagnosis, when the program chose a test, the results were determined by consulting the appropriate case history. The results of this experiment are summarized in Table 1. In each case, the results of the sequential diagnosis are compared with the pathologist's diagnosis and the diagnosis obtained when all attributes were used. These results are typical of those obtained from an extensive These numbers are quite arbitrary. They were chosen to exemplify a situation in which decision losses are far greater than testing losses,

86
 Sequential diagnosis can substantially reduce the number of tests performed during diagnosis.")
87 41 study of the performance of the program (4), This study suggested that: 1) A computer program can perform quite well in the diagnosis of congenital heart disease and primary bone tumors. This, however, had already been well-established by the work of Warner and Lodwick. 2) Sequential diagnosis can substantially reduce the number of tests performed during diagnosis. When the cost of tests is significant, then, sequential diagnosis may result in improved diagnosis. 3) Although the diagnostic program was developed to solve an abstract problem, it proved effective in the solution of real problems. The same diagnostic program using different information structures was able to deal with two different problems in medical diagnosis. Because the purpose of this paper is to describe the operation of a program to solve diagnostic problems, the results obtained from using the program have been deliberately slighted. The above suggestions, however, are well-supported by the experimental evidence obtained to date with the program, and are included to give the reader some indication of the potential of such a program, 4. Conclusions The program described in this paper was designed to solve an abstract diagnostic problem which is believed to subsume many of the features of a number of real diagnostic problems. The program performs two principal functions, inference and test selection. Like other programs for diagnosis, it employs Bayesian analysis of attrib-
88


89 42 TABLE 1 Sequential Diagnosis of Bone Tumor Cases Summary of Results for Actual Case Histories Case and Pathology
90


91 43 utes to determine the state of the system being diagnosed (although a more flexible way of handling inter-attribute dependencies is included). It differs from other programs in that it interacts with the user, selecting diagnostic tests for him to perform in a sequential manner. The program also includes a way of accounting for both the costs of tests and the seriousness of various misdiagnoses. Finally the program can detect irrelevant attributes during a diagnosis. The program was tested on two different medical problems, the diagnosis of congenital heart disease and the diagnosis of primary bone tumors. The results suggest that: 1) the program can perform effectively in several areas, and 2) there may be a significant advantage derived from the sequential operation of the diagnostic program.

92


93 References 1. Warner J H. R. et al. "A Mathematical Approach to Medical Diagnosis/' JAMA 177, Warner, H. R. e_t al, "Experience with Bayes Theorem for Computer Diagnosis of Congenital Heart Disease," Ann. N. Y, Acad. Sci., 115, 558, Lodwick, G. S. e_t al, "Computer Diagnosis of Primary Bone Tumors: A Preliminary Report" Radiology 80, 273, Gorry, G. A., "A System for Computer-Aided Diagnosis" Unpublished Ph.D. Thesis, M.I.T Weizenbaum, J., "The Symbolic SLIP-MAD System," Project MAC, M.I.T., 1965.


94 ' UG, ^G ^a-^tt
95


96 Date Due '-> * H«r07'81 HftY 5 '84 Lib-26-67


97 76^/-6r 1 3 TDfiD D03 TO D 773. LlBRASlES illlilillllllil TDfiO DD3 fitit fia7 ^6^-^^ MIT LIBRARieS 3 TDflD D 3 fi bt fi3fl MfT LIBRARIES 3 TDflO DD3 TOD 7TT ZQ>7-G7 HD28 m.:'. '«.muiu <^. Nos.26U-67~^"' Nos ^'-^ 3 loa lllllliliil 03 fibl 7b5 MIT LIBRARIES ^^-^7 3 TOflO 003 fib 7T MIT LIBRARIES 3 TOfiO 003 flbt 77 3 TOflO MH LIBRARIES III 3 TOO fltfl 273-^7


98
CPS331 Lecture: Coping with Uncertainty; Discussion of Dreyfus Reading
 CPS331 Lecture: Coping with Uncertainty; Discussion of Dreyfus Reading Objectives: 1. To discuss ways of handling uncertainty (probability; Mycin CF) 2. To discuss Dreyfus views on expert systems Materials:
EXPERIMENTAL DESIGN Page 1 of 11. relationships between certain events in the environment and the occurrence of particular
 EXPERIMENTAL DESIGN Page 1 of 11 I. Introduction to Experimentation 1. The experiment is the primary means by which we are able to establish cause-effect relationships between certain events in the environment
Chapter 2. Knowledge Representation: Reasoning, Issues, and Acquisition. Teaching Notes
 Chapter 2 Knowledge Representation: Reasoning, Issues, and Acquisition Teaching Notes This chapter explains how knowledge is represented in artificial intelligence. The topic may be launched by introducing
How Does Analysis of Competing Hypotheses (ACH) Improve Intelligence Analysis?
 Improve Intelligence Analysis?") How Does Analysis of Competing Hypotheses (ACH) Improve Intelligence Analysis? Richards J. Heuer, Jr. Version 1.2, October 16, 2005 This document is from a collection of works by Richards J. Heuer, Jr.
How Does Analysis of Competing Hypotheses (ACH) Improve Intelligence Analysis? Richards J. Heuer, Jr. Version 1.2, October 16, 2005 This document is from a collection of works by Richards J. Heuer, Jr.
Expert System Profile
 Expert System Profile GENERAL Domain: Medical Main General Function: Diagnosis System Name: INTERNIST-I/ CADUCEUS (or INTERNIST-II) Dates: 1970 s 1980 s Researchers: Ph.D. Harry Pople, M.D. Jack D. Myers
Artificial Intelligence Lecture 7
 Artificial Intelligence Lecture 7 Lecture plan AI in general (ch. 1) Search based AI (ch. 4) search, games, planning, optimization Agents (ch. 8) applied AI techniques in robots, software agents,... Knowledge
Artificial Intelligence Programming Probability
 Artificial Intelligence Programming Probability Chris Brooks Department of Computer Science University of San Francisco Department of Computer Science University of San Francisco p.1/25 17-0: Uncertainty
Modeling and Environmental Science: In Conclusion
 Modeling and Environmental Science: In Conclusion Environmental Science It sounds like a modern idea, but if you view it broadly, it s a very old idea: Our ancestors survival depended on their knowledge
Coherence Theory of Truth as Base for Knowledge Based Systems
 Association for Information Systems AIS Electronic Library (AISeL) AMCIS 1996 Proceedings Americas Conference on Information Systems (AMCIS) 8-16-1996 Coherence Theory of Truth as Base for Knowledge Based
 PART - A 1. Define Artificial Intelligence formulated by Haugeland. The exciting new effort to make computers think machines with minds in the full and literal sense. 2. Define Artificial Intelligence
Choose an approach for your research problem
 Choose an approach for your research problem This course is about doing empirical research with experiments, so your general approach to research has already been chosen by your professor. It s important
CFSD 21 st Century Learning Rubric Skill: Critical & Creative Thinking
 Comparing Selects items that are inappropriate to the basic objective of the comparison. Selects characteristics that are trivial or do not address the basic objective of the comparison. Selects characteristics
BIOL 458 BIOMETRY Lab 7 Multi-Factor ANOVA
 BIOL 458 BIOMETRY Lab 7 Multi-Factor ANOVA PART 1: Introduction to Factorial ANOVA ingle factor or One - Way Analysis of Variance can be used to test the null hypothesis that k or more treatment or group
Problem Set 2: Computer Psychiatrist
 Due Friday, March 3 Computer Science (1)21b (Spring Term, 2017) Structure and Interpretation of Computer Programs Problem Set 2: Computer Psychiatrist Reading Assignment: Chapter 2, Sections 2.1, 2.2.
Bayesian Analysis by Simulation
 408 Resampling: The New Statistics CHAPTER 25 Bayesian Analysis by Simulation Simple Decision Problems Fundamental Problems In Statistical Practice Problems Based On Normal And Other Distributions Conclusion
Outline. What s inside this paper? My expectation. Software Defect Prediction. Traditional Method. What s inside this paper?
 Outline A Critique of Software Defect Prediction Models Norman E. Fenton Dongfeng Zhu What s inside this paper? What kind of new technique was developed in this paper? Research area of this technique?
Module 1. Introduction. Version 1 CSE IIT, Kharagpur
 Module 1 Introduction Lesson 2 Introduction to Agent 1.3.1 Introduction to Agents An agent acts in an environment. Percepts Agent Environment Actions An agent perceives its environment through sensors.
Overview. cis32-spring2003-parsons-lect15 2
 EXPERT SYSTEMS Overview The last lecture looked at rules as a technique for knowledge representation. In a while we will go on to look at logic as a means of knowledge representation. First, however, we
Psychology, 2010, 1: doi: /psych Published Online August 2010 (
 Psychology, 2010, 1: 194-198 doi:10.4236/psych.2010.13026 Published Online August 2010 (http://www.scirp.org/journal/psych) Using Generalizability Theory to Evaluate the Applicability of a Serial Bayes
Overview EXPERT SYSTEMS. What is an expert system?
 EXPERT SYSTEMS Overview The last lecture looked at rules as a technique for knowledge representation. In a while we will go on to look at logic as a means of knowledge representation. First, however, we
Learning to Identify Irrelevant State Variables
 Learning to Identify Irrelevant State Variables Nicholas K. Jong Department of Computer Sciences University of Texas at Austin Austin, Texas 78712 nkj@cs.utexas.edu Peter Stone Department of Computer Sciences
Knowledge Based Systems
 Knowledge Based Systems Human Expert A human expert is a specialist for a specific differentiated application field who creates solutions to customer problems in this respective field and supports them
1 The conceptual underpinnings of statistical power
 1 The conceptual underpinnings of statistical power The importance of statistical power As currently practiced in the social and health sciences, inferential statistics rest solidly upon two pillars: statistical
Some Thoughts on the Principle of Revealed Preference 1
 Some Thoughts on the Principle of Revealed Preference 1 Ariel Rubinstein School of Economics, Tel Aviv University and Department of Economics, New York University and Yuval Salant Graduate School of Business,
The Scientific Method
 The Scientific Method Objectives 1. To understand the central role of hypothesis testing in the modern scientific process. 2. To design and conduct an experiment using the scientific method. 3. To learn
Anamnesis via the Internet - Prospects and Pilot Results
 MEDINFO 2001 V. Patel et al. (Eds) Amsterdam: IOS Press 2001 IMIA. All rights reserved Anamnesis via the Internet - Prospects and Pilot Results Athanasios Emmanouil and Gunnar O. Klein Centre for Health
An Efficient Hybrid Rule Based Inference Engine with Explanation Capability
 To be published in the Proceedings of the 14th International FLAIRS Conference, Key West, Florida, May 2001. An Efficient Hybrid Rule Based Inference Engine with Explanation Capability Ioannis Hatzilygeroudis,
Chapter 1. Introduction
 Chapter 1 Introduction 1.1 Motivation and Goals The increasing availability and decreasing cost of high-throughput (HT) technologies coupled with the availability of computational tools and data form a
Evaluation Models STUDIES OF DIAGNOSTIC EFFICIENCY
 2. Evaluation Model 2 Evaluation Models To understand the strengths and weaknesses of evaluation, one must keep in mind its fundamental purpose: to inform those who make decisions. The inferences drawn
LECTURE 5: REACTIVE AND HYBRID ARCHITECTURES
 Reactive Architectures LECTURE 5: REACTIVE AND HYBRID ARCHITECTURES An Introduction to MultiAgent Systems http://www.csc.liv.ac.uk/~mjw/pubs/imas There are many unsolved (some would say insoluble) problems
The General Intelligent Design (GID) Model Robert A. Herrmann* 28 JULY 2016.
 Model Robert A. Herrmann* 28 JULY 2016.") The General Intelligent Design (GID) Model Robert A. Herrmann* 28 JULY 2016. Abstract: In this article, a history as to the discovery and publication of the General Intelligence Design (GID) properties
The General Intelligent Design (GID) Model Robert A. Herrmann* 28 JULY 2016. Abstract: In this article, a history as to the discovery and publication of the General Intelligence Design (GID) properties
Irrationality in Game Theory
 Irrationality in Game Theory Yamin Htun Dec 9, 2005 Abstract The concepts in game theory have been evolving in such a way that existing theories are recasted to apply to problems that previously appeared
PubH 7470: STATISTICS FOR TRANSLATIONAL & CLINICAL RESEARCH
 PubH 7470: STATISTICS FOR TRANSLATIONAL & CLINICAL RESEARCH Instructor: Chap T. Le, Ph.D. Distinguished Professor of Biostatistics Basic Issues: COURSE INTRODUCTION BIOSTATISTICS BIOSTATISTICS is the Biomedical
An Escalation Model of Consciousness
 Bailey!1 Ben Bailey Current Issues in Cognitive Science Mark Feinstein 2015-12-18 An Escalation Model of Consciousness Introduction The idea of consciousness has plagued humanity since its inception. Humans
Lecture 2: Foundations of Concept Learning
 Lecture 2: Foundations of Concept Learning Cognitive Systems - Machine Learning Part I: Basic Approaches to Concept Learning Version Space, Candidate Elimination, Inductive Bias last change October 18,
Chapter 02 Developing and Evaluating Theories of Behavior
 Chapter 02 Developing and Evaluating Theories of Behavior Multiple Choice Questions 1. A theory is a(n): A. plausible or scientifically acceptable, well-substantiated explanation of some aspect of the
Answers to end of chapter questions
 Answers to end of chapter questions Chapter 1 What are the three most important characteristics of QCA as a method of data analysis? QCA is (1) systematic, (2) flexible, and (3) it reduces data. What are
Handout on Perfect Bayesian Equilibrium
 Handout on Perfect Bayesian Equilibrium Fudong Zhang April 19, 2013 Understanding the concept Motivation In general, the Perfect Bayesian Equilibrium (PBE) is the concept we are using when solving dynamic
Analysis of Environmental Data Conceptual Foundations: En viro n m e n tal Data
 Analysis of Environmental Data Conceptual Foundations: En viro n m e n tal Data 1. Purpose of data collection...................................................... 2 2. Samples and populations.......................................................
Application of Artificial Neural Networks in Classification of Autism Diagnosis Based on Gene Expression Signatures
 Application of Artificial Neural Networks in Classification of Autism Diagnosis Based on Gene Expression Signatures 1 2 3 4 5 Kathleen T Quach Department of Neuroscience University of California, San Diego
Evolutionary Programming
 Evolutionary Programming Searching Problem Spaces William Power April 24, 2016 1 Evolutionary Programming Can we solve problems by mi:micing the evolutionary process? Evolutionary programming is a methodology
Plan Recognition through Goal Graph Analysis
 Plan Recognition through Goal Graph Analysis Jun Hong 1 Abstract. We present a novel approach to plan recognition based on a two-stage paradigm of graph construction and analysis. First, a graph structure
Quality Digest Daily, March 3, 2014 Manuscript 266. Statistics and SPC. Two things sharing a common name can still be different. Donald J.
 Quality Digest Daily, March 3, 2014 Manuscript 266 Statistics and SPC Two things sharing a common name can still be different Donald J. Wheeler Students typically encounter many obstacles while learning
Survival Skills for Researchers. Study Design
 Survival Skills for Researchers Study Design Typical Process in Research Design study Collect information Generate hypotheses Analyze & interpret findings Develop tentative new theories Purpose What is
Computerized Mastery Testing
 Computerized Mastery Testing With Nonequivalent Testlets Kathleen Sheehan and Charles Lewis Educational Testing Service A procedure for determining the effect of testlet nonequivalence on the operating
Citation for published version (APA): Geus, A. F. D., & Rotterdam, E. P. (1992). Decision support in aneastehesia s.n.
: Geus, A. F. D., & Rotterdam, E. P. (1992). Decision support in aneastehesia s.n.") University of Groningen Decision support in aneastehesia Geus, Arian Fred de; Rotterdam, Ernest Peter IMPORTANT NOTE: You are advised to consult the publisher's version (publisher's PDF) if you wish to
University of Groningen Decision support in aneastehesia Geus, Arian Fred de; Rotterdam, Ernest Peter IMPORTANT NOTE: You are advised to consult the publisher's version (publisher's PDF) if you wish to
ICS 606. Intelligent Autonomous Agents 1. Intelligent Autonomous Agents ICS 606 / EE 606 Fall Reactive Architectures
 Intelligent Autonomous Agents ICS 606 / EE 606 Fall 2011 Nancy E. Reed nreed@hawaii.edu 1 Lecture #5 Reactive and Hybrid Agents Reactive Architectures Brooks and behaviors The subsumption architecture
Sample Interaction: Explanation. Sample Interaction (cont d) Sample Interaction: Therapy. Sample Interaction: Diagnosis. How It Worked: Representation
 Sample Interaction: Therapy. Sample Interaction: Diagnosis. How It Worked: Representation") Outline Rule-Based Systems 6.871-- Lecture 6 MYCIN Introduction»Task» Sample Interaction» Reasons for Success How It Worked» Knowledge Representation» Architecture and Control Structure» Inexact Inference»
Outline Rule-Based Systems 6.871-- Lecture 6 MYCIN Introduction»Task» Sample Interaction» Reasons for Success How It Worked» Knowledge Representation» Architecture and Control Structure» Inexact Inference»
Field data reliability analysis of highly reliable item
 Field data reliability analysis of highly reliable item David Valis University of Defence, Czech Republic david.valis@unob.cz Miroslav Koucky Technical University of Liberec, Czech Republic miroslav.koucky@tul.cz
Exploration and Exploitation in Reinforcement Learning
 Exploration and Exploitation in Reinforcement Learning Melanie Coggan Research supervised by Prof. Doina Precup CRA-W DMP Project at McGill University (2004) 1/18 Introduction A common problem in reinforcement
MITOCW conditional_probability
 MITOCW conditional_probability You've tested positive for a rare and deadly cancer that afflicts 1 out of 1000 people, based on a test that is 99% accurate. What are the chances that you actually have
Representation and Analysis of Medical Decision Problems with Influence. Diagrams
 Representation and Analysis of Medical Decision Problems with Influence Diagrams Douglas K. Owens, M.D., M.Sc., VA Palo Alto Health Care System, Palo Alto, California, Section on Medical Informatics, Department
IAASB Main Agenda (February 2007) Page Agenda Item PROPOSED INTERNATIONAL STANDARD ON AUDITING 530 (REDRAFTED)
 Page Agenda Item PROPOSED INTERNATIONAL STANDARD ON AUDITING 530 (REDRAFTED)") IAASB Main Agenda (February 2007) Page 2007 423 Agenda Item 6-A PROPOSED INTERNATIONAL STANDARD ON AUDITING 530 (REDRAFTED) AUDIT SAMPLING AND OTHER MEANS OF TESTING CONTENTS Paragraph Introduction Scope
IAASB Main Agenda (February 2007) Page 2007 423 Agenda Item 6-A PROPOSED INTERNATIONAL STANDARD ON AUDITING 530 (REDRAFTED) AUDIT SAMPLING AND OTHER MEANS OF TESTING CONTENTS Paragraph Introduction Scope
MS&E 226: Small Data
 MS&E 226: Small Data Lecture 10: Introduction to inference (v2) Ramesh Johari ramesh.johari@stanford.edu 1 / 17 What is inference? 2 / 17 Where did our data come from? Recall our sample is: Y, the vector
Foundations of AI. 10. Knowledge Representation: Modeling with Logic. Concepts, Actions, Time, & All the Rest
 Foundations of AI 10. Knowledge Representation: Modeling with Logic Concepts, Actions, Time, & All the Rest Wolfram Burgard, Andreas Karwath, Bernhard Nebel, and Martin Riedmiller 10/1 Contents Knowledge
USE AND MISUSE OF MIXED MODEL ANALYSIS VARIANCE IN ECOLOGICAL STUDIES1
 Ecology, 75(3), 1994, pp. 717-722 c) 1994 by the Ecological Society of America USE AND MISUSE OF MIXED MODEL ANALYSIS VARIANCE IN ECOLOGICAL STUDIES1 OF CYNTHIA C. BENNINGTON Department of Biology, West
Chapter 02. Basic Research Methodology
 Chapter 02 Basic Research Methodology Definition RESEARCH Research is a quest for knowledge through diligent search or investigation or experimentation aimed at the discovery and interpretation of new
Hypothesis-Driven Research
 Hypothesis-Driven Research Research types Descriptive science: observe, describe and categorize the facts Discovery science: measure variables to decide general patterns based on inductive reasoning Hypothesis-driven
COHERENCE: THE PRICE IS RIGHT
 The Southern Journal of Philosophy Volume 50, Issue 1 March 2012 COHERENCE: THE PRICE IS RIGHT Paul Thagard abstract: This article is a response to Elijah Millgram s argument that my characterization of
Chapter-2 RESEARCH DESIGN
 Chapter-2 RESEARCH DESIGN 33 2.1 Introduction to Research Methodology: The general meaning of research is the search for knowledge. Research is also defined as a careful investigation or inquiry, especially
ASD and LRFD of Reinforced SRW with the use of software Program MSEW(3.0)
") ASD and LRFD of Reinforced SRW with the use of software Program MSEW(3.0) Dov Leshchinsky [A slightly modified version of this manuscript appeared in Geosynthetics (formerly GFR), August 2006, Vol. 24,
ASD and LRFD of Reinforced SRW with the use of software Program MSEW(3.0) Dov Leshchinsky [A slightly modified version of this manuscript appeared in Geosynthetics (formerly GFR), August 2006, Vol. 24,
Likelihood Ratio Based Computerized Classification Testing. Nathan A. Thompson. Assessment Systems Corporation & University of Cincinnati.
 Likelihood Ratio Based Computerized Classification Testing Nathan A. Thompson Assessment Systems Corporation & University of Cincinnati Shungwon Ro Kenexa Abstract An efficient method for making decisions
IE 5203 Decision Analysis Lab I Probabilistic Modeling, Inference and Decision Making with Netica
 IE 5203 Decision Analysis Lab I Probabilistic Modeling, Inference and Decision Making with Netica Overview of Netica Software Netica Application is a comprehensive tool for working with Bayesian networks
Generalization and Theory-Building in Software Engineering Research
 Generalization and Theory-Building in Software Engineering Research Magne Jørgensen, Dag Sjøberg Simula Research Laboratory {magne.jorgensen, dagsj}@simula.no Abstract The main purpose of this paper is
Artificial Intelligence
 Artificial Intelligence Intelligent Agents Chapter 2 & 27 What is an Agent? An intelligent agent perceives its environment with sensors and acts upon that environment through actuators 2 Examples of Agents
Assessing the Foundations of Conscious Computing: A Bayesian Exercise
 Assessing the Foundations of Conscious Computing: A Bayesian Exercise Eric Horvitz June 2001 Questions have long been posed with about whether we might one day be able to create systems that experience
Position Paper: How Certain is Recommended Trust-Information?
 Position Paper: How Certain is Recommended Trust-Information? Uwe Roth University of Luxembourg FSTC Campus Kirchberg 6, rue Richard Coudenhove-Kalergi L-1359 Luxembourg uwe.roth@uni.lu ABSTRACT Nowadays
CPSC 121 Some Sample Questions for the Final Exam
 CPSC 121 Some Sample Questions for the Final Exam [0] 1. Tautologies and Contradictions: Determine whether the following statements are tautologies (definitely true), contradictions (definitely false),
How the brain works. ABSTRACT This paper analyses the associative capabilities of the brain and takes the consequences of that capability.
 How the brain works By Ir J.A.J. van Leunen Retired physicist & software researcher Location: Asten, the Netherlands Website: www.scitech.nl Communicate your comments to info at that site. ABSTRACT This
CS343: Artificial Intelligence
 CS343: Artificial Intelligence Introduction: Part 2 Prof. Scott Niekum University of Texas at Austin [Based on slides created by Dan Klein and Pieter Abbeel for CS188 Intro to AI at UC Berkeley. All materials
Central Algorithmic Techniques. Iterative Algorithms
 Central Algorithmic Techniques Iterative Algorithms Code Representation of an Algorithm class InsertionSortAlgorithm extends SortAlgorithm { void sort(int a[]) throws Exception { for (int i = 1; i < a.length;
For general queries, contact
 Much of the work in Bayesian econometrics has focused on showing the value of Bayesian methods for parametric models (see, for example, Geweke (2005), Koop (2003), Li and Tobias (2011), and Rossi, Allenby,
Chapter 3 Software Packages to Install How to Set Up Python Eclipse How to Set Up Eclipse... 42
 Table of Contents Preface..... 21 About the Authors... 23 Acknowledgments... 24 How This Book is Organized... 24 Who Should Buy This Book?... 24 Where to Find Answers to Review Questions and Exercises...
Learning Deterministic Causal Networks from Observational Data
 Carnegie Mellon University Research Showcase @ CMU Department of Psychology Dietrich College of Humanities and Social Sciences 8-22 Learning Deterministic Causal Networks from Observational Data Ben Deverett
Trilateral Project WM4
 ANNEX 2: Comments of the JPO Trilateral Project WM4 Comparative studies in new technologies Theme: Comparative study on protein 3-dimensional (3-D) structure related claims 1. Introduction As more 3-D
Phenomenal content. PHIL April 15, 2012
 Phenomenal content PHIL 93507 April 15, 2012 1. The phenomenal content thesis... 1 2. The problem of phenomenally silent contents... 2 3. Phenomenally sneaky contents... 3 3.1. Phenomenal content and phenomenal
The Power of Feedback
 The Power of Feedback 35 Principles for Turning Feedback from Others into Personal and Professional Change By Joseph R. Folkman The Big Idea The process of review and feedback is common in most organizations.
Modeling State Space Search Technique for a Real World Adversarial Problem Solving
 Modeling State Space Search Technique for a Real World Adversarial Problem Solving Kester O. OMOREGIE Computer Science Department, Auchi Polytechnic, Auchi, NIGERIA Stella C. CHIEMEKE Computer Science
Assignment 4: True or Quasi-Experiment
 Assignment 4: True or Quasi-Experiment Objectives: After completing this assignment, you will be able to Evaluate when you must use an experiment to answer a research question Develop statistical hypotheses
Critical Thinking Assessment at MCC. How are we doing?
 Critical Thinking Assessment at MCC How are we doing? Prepared by Maura McCool, M.S. Office of Research, Evaluation and Assessment Metropolitan Community Colleges Fall 2003 1 General Education Assessment
Wason's Cards: What is Wrong?
 Wason's Cards: What is Wrong? Pei Wang Computer and Information Sciences, Temple University This paper proposes a new interpretation
Perfect Bayesian Equilibrium
 In the final two weeks: Goals Understand what a game of incomplete information (Bayesian game) is Understand how to model static Bayesian games Be able to apply Bayes Nash equilibrium to make predictions
Systems Theory: Should Information Researchers Even Care?
 Association for Information Systems AIS Electronic Library (AISeL) SAIS 2016 Proceedings Southern (SAIS) 2016 Systems Theory: Should Information Researchers Even Care? Kane J. Smith Virginia Commonwealth
Research Methodology in Social Sciences. by Dr. Rina Astini
 Research Methodology in Social Sciences by Dr. Rina Astini Email : rina_astini@mercubuana.ac.id What is Research? Re ---------------- Search Re means (once more, afresh, anew) or (back; with return to
To conclude, a theory of error must be a theory of the interaction between human performance variability and the situational constraints.
 The organisers have provided us with a both stimulating and irritating list of questions relating to the topic of the conference: Human Error. My first intention was to try to answer the questions one
Cognitive Neuroscience History of Neural Networks in Artificial Intelligence The concept of neural network in artificial intelligence
 Cognitive Neuroscience History of Neural Networks in Artificial Intelligence The concept of neural network in artificial intelligence To understand the network paradigm also requires examining the history
Experimental Research in HCI. Alma Leora Culén University of Oslo, Department of Informatics, Design
 Experimental Research in HCI Alma Leora Culén University of Oslo, Department of Informatics, Design almira@ifi.uio.no INF2260/4060 1 Oslo, 15/09/16 Review Method Methodology Research methods are simply
Programming with Goals (3)
") Programming with Goals (3) M. Birna van Riemsdijk, TU Delft, The Netherlands GOAL slides adapted from MAS course slides by Hindriks 4/24/11 Delft University of Technology Challenge the future Outline GOAL:
Programming with Goals (3) M. Birna van Riemsdijk, TU Delft, The Netherlands GOAL slides adapted from MAS course slides by Hindriks 4/24/11 Delft University of Technology Challenge the future Outline GOAL:
RAG Rating Indicator Values
 Technical Guide RAG Rating Indicator Values Introduction This document sets out Public Health England s standard approach to the use of RAG ratings for indicator values in relation to comparator or benchmark
Bottom-Up Model of Strategy Selection
 Bottom-Up Model of Strategy Selection Tomasz Smoleń (tsmolen@apple.phils.uj.edu.pl) Jagiellonian University, al. Mickiewicza 3 31-120 Krakow, Poland Szymon Wichary (swichary@swps.edu.pl) Warsaw School
Emanuela Carbonara. 31 January University of Bologna - Department of Economics
 Game Theory, Behavior and The Law - I A brief introduction to game theory. Rules of the game and equilibrium concepts. Behavioral Games: Ultimatum and Dictator Games. Entitlement and Framing effects. Emanuela
A Computational Theory of Belief Introspection
 A Computational Theory of Belief Introspection Kurt Konolige Artificial Intelligence Center SRI International Menlo Park, California 94025 Abstract Introspection is a general term covering the ability
A Comparison of Three Measures of the Association Between a Feature and a Concept
 A Comparison of Three Measures of the Association Between a Feature and a Concept Matthew D. Zeigenfuse (mzeigenf@msu.edu) Department of Psychology, Michigan State University East Lansing, MI 48823 USA
A FRAMEWORK FOR CLINICAL DECISION SUPPORT IN INTERNAL MEDICINE A PRELIMINARY VIEW Kopecky D 1, Adlassnig K-P 1
 A FRAMEWORK FOR CLINICAL DECISION SUPPORT IN INTERNAL MEDICINE A PRELIMINARY VIEW Kopecky D 1, Adlassnig K-P 1 Abstract MedFrame provides a medical institution with a set of software tools for developing
Handling Partial Preferences in the Belief AHP Method: Application to Life Cycle Assessment
 Handling Partial Preferences in the Belief AHP Method: Application to Life Cycle Assessment Amel Ennaceur 1, Zied Elouedi 1, and Eric Lefevre 2 1 University of Tunis, Institut Supérieur de Gestion de Tunis,
Confidence in Causal Inferences: The Case of Devaluation
 Confidence in Causal Inferences: The Case of Devaluation Uwe Drewitz (uwe.drewitz@tu-berlin.de) Stefan Brandenburg (stefan.brandenburg@tu-berlin.de) Berlin Institute of Technology, Department of Cognitive
BIOSTATISTICAL METHODS
 BIOSTATISTICAL METHODS FOR TRANSLATIONAL & CLINICAL RESEARCH Designs on Micro Scale: DESIGNING CLINICAL RESEARCH THE ANATOMY & PHYSIOLOGY OF CLINICAL RESEARCH We form or evaluate a research or research
CHAPTER 6 HUMAN BEHAVIOR UNDERSTANDING MODEL
 127 CHAPTER 6 HUMAN BEHAVIOR UNDERSTANDING MODEL 6.1 INTRODUCTION Analyzing the human behavior in video sequences is an active field of research for the past few years. The vital applications of this field
Analysis of Human-Human and Human-Computer Agent Interactions from the Viewpoint of Design of and Attribution to a Partner
 Analysis of - and -Computer Interactions from the Viewpoint of Design of and to a Partner Kazuhisa Miwa (miwa@is.nagoya-u.ac.jp) Hitoshi Terai (terai@cog.human.nagoya-u.ac.jp) Graduate School of Information
Assurance Engagements Other than Audits or Review of Historical Financial Statements
 Issued December 2007 International Standard on Assurance Engagements Assurance Engagements Other than Audits or Review of Historical Financial Statements The Malaysian Institute Of Certified Public Accountants