REM: Relational entropy-based measure of saliency
|
|
|
- Cory Bryan
- 6 years ago
- Views:
Transcription


1 University of South Florida Scholar Commons Graduate Theses and Dissertations Graduate School 2010 REM: Relational entropy-based measure of saliency Kester Duncan University of South Florida Follow this and additional works at: Part of the American Studies Commons Scholar Commons Citation Duncan, Kester, "REM: Relational entropy-based measure of saliency" (2010). Graduate Theses and Dissertations. This Thesis is brought to you for free and open access by the Graduate School at Scholar Commons. It has been accepted for inclusion in Graduate Theses and Dissertations by an authorized administrator of Scholar Commons. For more information, please contact
2 REM: Relational Entropy-Based Measure of Saliency by Kester Duncan A thesis submitted in partial fulfillment of the requirements for the degree of Master of Science in Computer Science Department of Computer Science and Engineering College of Engineering University of South Florida Major Professor: Sudeep Sarkar, Ph.D. Dmitry Goldgof, Ph.D. Rangachar Kasturi, Ph.D. Date of Approval: May 7, 2010 Keywords: Bottom-Up, Rényi Entropy, Relational Histograms, Scale-Variation, Perceptual Grouping Copyright c 2010, Kester Duncan
3 DEDICATION To my mother, and the rest of my family, for their loving encouragement over the years.
4 ACKNOWLEDGEMENTS First and foremost I would like to thank my Heavenly Father through Jesus Christ for being my provider, my strength, my rock, my peace, my shield, my great reward, and my life. I would also like to acknowledge my advisor, Dr. Sarkar, who has been patient with me during this journey. I thank him for his immeasurable support and the wealth of knowledge and wisdom he provided. Many thanks go out to my family for providing the moral support necessary for this venture. Thanks also to Michelle, Sharrine, Lasceeka, Gabe, Darnell, Rianna, Sean, Liselle, and countless others for making life as a student worth living. Additionally, I would like to express my gratitude to Tammy Avraham, Nabil Ouerhani, and Roman von Wartburg for their valuable assistance.
5 TABLE OF CONTENTS LIST OF TABLES LIST OF FIGURES ABSTRACT iii iv vi CHAPTER 1 INTRODUCTION What is Saliency? Contributions of this Work Layout of Thesis 5 CHAPTER 2 RELATED WORK Bottom-Up Saliency Approaches Top-Down Saliency Approaches Integrated Saliency Approach Relational Histograms 8 CHAPTER 3 REM: RELATIONAL ENTROPY-BASED MEASURE Relational Distributions Pixel-Based Features Sampling Entropy Saliency Measure R.E.M. Saliency Map Scale Space R.E.M. as an Optimization Criterion Learning Automata 21 CHAPTER 4 RESULTS AND ANALYSES Datasets General Performance of Saliency Measure Evaluation with Regards to Highlighting Pedestrians Evaluation with Regards to Highlighting Traffic Signs Comparison with Human Saliency Maps Subjective Comparison Objective Comparison Comparison with a Dominant Saliency Model Scale Variation Evaluation at a Specified Pixel Location 37 i
6 4.5.2 Evaluation of the Saliency Map at Different Scales Comparison of Shannon and Rényi Entropies Evaluating Histogram Bin Size Evaluation of the Extension to a Perceptual Grouping Framework 46 CHAPTER 5 CONCLUSION AND FUTURE WORK 49 REFERENCES 50 ii
7 LIST OF TABLES Table 4.1 Table 4.2 Table 4.3 Table 4.4 Correlation coefficients λ between Human Fixation Maps [1] and REM saliency maps. 32 Correlation coefficients λ of REM saliency maps and ilab saliency maps with human saliency maps [2]. 34 Correlation coefficients λ between REM and ilab saliency maps with their respective Human Fixation Maps [1]. 34 Comparison of Φ G values using Rényi and Shannon entropy (images were taken from the PASCAL challenge dataset [3]). 44 iii
8 LIST OF FIGURES Figure 1.1 The filled square is immediately perceived by simply glancing at the image. 2 Figure 3.1 Pixel-based binary relational distribution. 12 Figure 3.2 Images and their relational distributions (histograms). 13 Figure 3.3 Local pixel neighborhoods to measure the saliency of a central pixel (image best viewed in color). 17 Figure 3.4 An image and its saliency map. 18 Figure 3.5 System block diagram of the altered perceptual grouping framework. 20 Figure 4.1 REM saliency s performance with regards to highlighting pedestrians. 26 Figure 4.2 REM saliency s performance with regards to highlighting traffic signs. 28 Figure 4.3 Original test images used for the human fixation map comparisons. 29 Figure 4.4 Comparing saliency results and human saliency maps. 31 Figure 4.5 Original test images used for comparison with the state of the art. 33 Figure 4.6 Comparing REM saliency results with human saliency maps and ilab. 33 Figure 4.7 Comparing saliency results and human saliency maps. 35 Figure 4.8 R.E.M. vs. ilab - graph of the correlation coefficients for 120 images from the Bruce and Tsotsos data set. 36 Figure 4.9 Baby image evaluated at the pixel location (244, 180). 37 Figure 4.10 Plot of the entropy values for the image in Figure 4.9 with convergence occurring at a neighborhood size of (165 x 165). 38 Figure 4.11 Bedroom image evaluated at the pixel location (138, 56). 38 Figure 4.12 Plot of the entropy values for the image in Figure 4.11 with convergence occurring at a neighborhood size of (157 x 157). 39 Figure 4.13 Living room image evaluated at the pixel location (242, 170). 39 iv
9 Figure 4.14 Plot of the entropy values for the image in Figure 4.13 with convergence occurring at a neighborhood size of (101 x 101). 40 Figure 4.15 Office image evaluated at the pixel location (135, 71). 40 Figure 4.16 Plot of the entropy values for the image in Figure 4.15 with convergence occurring at a neighborhood size of (135 x 135). 41 Figure 4.17 Scale space evaluation of helmets image. 42 Figure 4.18 Scale space evaluation of band image. 43 Figure 4.19 Scale space evaluation of beer bottles image. 43 Figure 4.20 Effects of varying the number of histogram bins on the saliency map. 45 Figure 4.21 Perceptual grouping extension results. 47 v
10 REM: Relational Entropy-Based Measure of Saliency Kester Duncan ABSTRACT The incredible ability of human beings to quickly detect the prominent or salient regions in an image is often taken for granted. To be able to reproduce this intelligent ability in computer vision systems remains quite a challenge. This ability is of paramount importance to perception and image understanding since it accelerates the image analysis process, thereby allowing higher vision processes such as recognition to have a focus of attention. In addition to this, human eye fixation points occurring during the early stages of visual processing, often correspond to the loci of salient image regions. These regions provide us with assistance in determining the interesting parts of an image and they also lend support to our ability to discriminate between different objects in a scene. Salient regions attract our immediate attention without requiring an exhaustive scan of a scene. In essence, saliency can be defined as the quality of an image region that enables it to stand out in relation to its neighbors. Saliency is often approached in either one of two ways. The bottom-up saliency approach refers to mechanisms which are image-driven and independent of the knowledge in an image, whereas the top-down saliency approach refers to mechanisms which are taskoriented and make use of the prior knowledge about a scene. In this thesis, we present a bottom-up measure of saliency based on the relationships exhibited among image features. The perceived structure in an image is determined more by the relationships among features rather than the individual feature attributes. From this standpoint, we aim to capture the organization within an image by employing relational distributions derived from distance vi
11 and gradient direction relationships exhibited between image primitives. The Rényi entropy of the relational distribution tends to be lower if saliency is exhibited for some image region in the local pixel neighborhood over which the distribution is defined. This notion forms the foundation of our measure. Correspondingly, results of our measure are presented in the form of a saliency map, highlighting salient image regions. We show results on a variety of real images from various datasets. We evaluate the performance of our measure in relation to a dominant saliency model and obtain comparable results. We also investigate the biological plausibility of our method by comparing our results to those captured by human fixation maps. In an effort to derive meaningful information from an image, we investigate the significance of scale relative to our saliency measure, and attempt to determine optimal scales for image analysis. In addition to this, we extend a perceptual grouping framework by using our measure as an optimization criterion for determining the organizational strength of edge groupings. As a result, the use of ground truth images is circumvented. vii
12 CHAPTER 1 INTRODUCTION 1.1 What is Saliency? Certain structures or regions in a scene often attract our immediate attention without requiring an exhaustive scan of the scene itself. The way these regions are captured by the Human Visual System (HVS) without the need for focused attention is often described as pre-attentive processing which was suggested by Neisser in [4] as the first of the two stages of human visual processing. Neisser suggested that human visual processing was divided into the pre-attentive stage, and the attentive stage. The pre-attentive stage consists of parallel processes that operate concurrently on large regions of the visual field, forming structures to which attention can be directed. The attentive stage consists of a focused processing effort applied to a restricted region of the visual field. At this stage, relationships between image features are found and grouping occurs. The set of visual properties of a scene that are processed pre-attentively is limited. Furthermore, anything perceived within the preattentive time frame (which is typically 200 milliseconds) incorporates only the information available from a single cursory glimpse [5]. Intermediate and higher level visual processes only utilize a predefined proportion of the available sensory information before further processing. This is done most likely to reduce the complexity of scene analysis [6]. This is illustrated in Figure 1.1. By simply glancing at the image, the filled square is immediately perceived. The target square has the visual property filled that the empty distractor squares do not. An observer can perceive at a glance whether the object, in this case the filled square, is present or absent. Moreover, the human brain and the vision system work in tandem to identify such relevant regions [7]. An instantaneous visual arousal occurs in the early stages of human visual 1
13 Figure 1.1. The filled square is immediately perceived by simply glancing at the image. processing [8] as a result of these pre-attentively distinctive parts of a scene, and it is this idea that is often referred to as saliency. For many years, vision enthusiasts have been investigating how the human visual system analyzed images which eventually lead to the pre-attentive model being incorporated into many computer vision algorithms. Furthermore, the term saliency came into the forefront after the vast amount of psychology-based work on selective visual attention [9]. With regards to computer vision, saliency can be defined as the quality of an image feature that allows it to stand out in relation to its neighboring features. These features are almost unique, thereby making it possible to discriminate between objects in a scene. They can also be considered as the outliers of the homogeneous region after segmentation due to the fact that the goal of segmentation is to group areas in an image that satisfy some homogeneity predicate [8]. It must be noted however, that salient regions in an image may not necessarily belong to an object of interest. Additionally, saliency can often provide the foundation for a visual attention mechanism whereby the need for computational resources is significantly reduced [9]. Saliency features are of paramount importance when visual recognition must be performed in cluttered scenes. Consequently, the selection of a commensurate set of salient features forms the first step in many computer vision algorithms. Salient features, points, or regions, facilitate 2
14 object recognition, perceptual organization, segmentation, and figure-ground separation because they permit immediate concentration on objects of interest in an image. Various definitions of saliency have been proposed over the last few decades and it has been extensively studied in the computer vision literature [10, 11, 12]. Saliency has been described as visual attention, focus of attention, and the impetus for the selection of fixation points [13]. Saliency research has its origins in attempting to explain perceptual phenomena, thereby focusing on biologically plausible mechanisms for finding long and smooth curves [12]. Most saliency research however, has been focused on the extraction of interest points from an image that expressed some strong mathematical property [11]. A substantial amount of work has been amassed with the goal of modeling mechanisms of perceptual organization such as contour saliency and more general Gestalt phenomena. Interest point detectors have been quite successful in recognition and object tracking applications therefore demonstrating the applicability of saliency mechanisms. A large body of existing saliency mechanisms have also been inspired by the known properties of psychophysics and the physiology of pre-attentive vision. There has also been research that concentrated on computing the salient groupings of low-level features [14]. The notion of saliency however, has been used implicitly in a number of computer vision algorithms. Salient region detection has been used to extract descriptions that were then used to solve vision problems requiring correspondence [8]. Additionally, the idea of using edge detectors to extract object descriptions embodies the idea that the edges are more salient in comparison to other parts of the image. Furthermore, one of the central tasks of perceptual organization is to detect salient structures. Saliency has also been used for the detection of specific visual attributes such as corners, edges, and contours. In more recent literature, saliency has been defined as image complexity [11]. Saliency methods incorporating this definition offers the advantage of greater flexibility because they can detect any of the low-level attributes corners, contours, and edges. Consequently, most saliency mechanisms are approached in two ways: bottom-up saliency and top-down saliency. Bottom-up approaches are analogous to rapid, image or stimulusdriven mechanisms in pre-attentive vision and are to a great extent independent of the 3
15 knowledge of the content in an image. They are fast to implement, requiring no prior knowledge of the scene. However, top-down approaches are goal-oriented and make use of prior knowledge about the scene or the context to identify salient regions [7]. They are task-dependent thereby demanding a more thorough understanding of the context of the image, resulting in high computational costs. Top-down mechanisms can be envisioned as weak classifiers that focus attention on the regions of the visual field which are relevant. These two approaches are analogous to pre-attentive and attentive vision respectively. Integration of these two approaches has been deemed crucial for robot navigation, visual surveillance, and realistic visual searches and they have been studied in the literature [15]. Saliency mechanisms utilizing this approach fall into the category known as integrated approaches. There is also the notion of local saliency and structural (global) saliency as specified in [14]. Local saliency takes place when an image primitive becomes discernible by having a distinguishing local property such as color, contrast, or orientation that enables it to popout in relation to its neighbors. Structural saliency occurs when the structure is perceived in a more global manner [14] whereby parts of the structure are not salient in isolation. In this thesis, we present a measure of saliency based on the relations between low-level image features. Our notion of saliency relies on the distribution of relative gradient directions and the euclidean distances of edge pixels. 1.2 Contributions of this Work The saliency measure presented in this work can be integrated in applications that perform object tracking, object recognition, and visual attention as a preprocessing step that can improve robustness. The measure is also generic thereby more flexible than saliency measures that are tied to specific visual features. It is not driven by recognition goals and it is independent of context, which is achieved by focusing on low-level vision. Our measure highlights the regions of an image which present some form of spatial discontinuity or contrast, and this is captured by the geometric relational distribution. It can also be 4
16 used to extract descriptions, which could then be used to solve vision problems involving matching. Our measure is sensitive to spatial discontinuities and this kind of architecture is capable of detecting locations which stand out relative to their neighborhood, and this is a general computational principle of the retina [15]. 1.3 Layout of Thesis This thesis is laid out as follows. In chapter 2, we survey the state of the community in the field of saliency, saliency detection, visual attention, and interest point detection, and prior work with regards to saliency. We also survey some work done using relational distributions and entropy. In chapter 3, we present our relational entropy-based measure for saliency first by describing relational distributions and their applicability, then we move onto the description of entropy and the different measures of entropy used. The core of our measure is presented here. We also describe the extension that we made to a perceptual grouping framework whereby our measure is used as an optimization criterion. In chapter 4, we present our results on various images, including saliency maps and analyses. We compare our findings to those of a dominant saliency model. Additionally, we present some results from the evaluation of our measure as an optimization criterion for selecting strong groups in a perceptual grouping framework. In chapter 5, we summarize our findings and discuss the implications of our work on saliency research and also look at some potential directions for future work. 5
17 CHAPTER 2 RELATED WORK There has been extensive work on saliency over the last few decades. A vast majority of the work has been amassed in bottom-up approaches to saliency rather than top-down. A more recent trend exists whereby the integration of these two approaches are being explored. 2.1 Bottom-Up Saliency Approaches In [14], Sha ashua and Ullman presented a saliency measure based on curvature and curvature variation. The structures their measure emphasized were also salient in human perception, often corresponding to objects of interest in the image. The authors suggested what made structures salient and proposed a mechanism for detecting salient locations using a locally connected network. Motivated by the work done in [14], Berengolts and Lindenbaum [12] presented a saliency measure based on probabilistic cues, estimated length distributions and the expected length of curves. They showed that probabilistic saliency had the ability to open pathways for different realizations of saliencies based on different cues, thereby allowing other sources of information to be used. Their aim was to separate a figure from its background. Kadir and Brady introduced a multiscale algorithm for salient region selection and applied it to matching problems such as tracking, object recognition, and image retrieval [8]. Their technique determined salient regions as those exhibiting unpredictable characteristics simultaneously in some feature-space and over scale. They investigated the use of entropy measures to identify regions of saliency within a broad class of images and image sequences. They used the local intensity as the descriptor for saliency. They introduced a novel 6
18 algorithm which created a hierarchy of salient regions that operated across feature scale and space. In this thesis, we also investigate the implications of scale and saliency and also adopt the argument presented in [8] that scale is intimately related to the issue of determining saliency and extracting relevant descriptions. We explore this in our measure to determine the scale (neighhborhood) at which a pixel remains salient. Hare and Lewis use Kadir and Brady s scale saliency method for image matching and feature-based tracking [9]. Avraham and Lindenbaum proposed a novel stochastic model to estimate saliency in [16]. They utilize a coarse pre-attentive grouping process to extract uniform regions. These regions were then used as initial candidates for attention (saliency). Their esaliency mechanism determines if an image part is of interest with the goal of finding small image regions where salient objects are present. 2.2 Top-Down Saliency Approaches When visual recognition must be performed in cluttered scenes, saliency mechanisms are of paramount importance. Gao, Han, and Vasconcelos couple saliency to the recognition goal in [11]. They argued that the saliency judgments become significantly more adaptive, only highlighting image areas which were relevant to recognition. The authors equate saliency to discrimination thereby deviating from existing models. They referred to the optimal salient features as those that were maximally informative of the presence or absence of the target class in a field of view [11]. Additionally, Gao and Vasconcelos define discriminant saliency as the features whose response best distinguishes an object to be recognized from the set of all others that may be of possible interest [17]. This concept has been applied to the design of object recognition systems which have been shown to perform well. Gopalakrishnan, Hu, and Rajan presented a salient region detection framework based on the color and orientation distribution in images [7]. color saliency framework and an orientation framework. This framework consisted of a The color saliency framework 7
19 detected salient regions based on the spatial distribution of the component colors in the image space. The orientation framework detected salient regions in the images based on the global and local behavior of different orientations in the image, thereby making use of the image context. They also proposed an orientation histogram as the local descriptor and determined how different its entropy was from the local neighborhood, leading to the notion of orientation entropy contrast. Our measure picks out relevant parts of a scene by using a relational histogram of the gradient orientations and distances as the local descriptor. 2.3 Integrated Saliency Approach Itti and Navalpakkam integrate both bottom-up and top-down approaches of saliency for a novel approach in [15]. They argued that the integration of bottom-up and top-down saliency measures was essential for robot navigation, visual surveillance, and any realistic visual search. Their method decomposed the visual input into a set of topographic feature maps. Subsequently, different spatial locations competed for saliency within each map such that only locations which stood out locally relative to their surroundings would persist. The bottom-up component was responsible for computing the saliency of locations in different feature maps whereas the top-down component used statistical knowledge of the target object to tune the bottom-up maps. They elaborated on the biological motivation for the methods they utilized. 2.4 Relational Histograms The idea of using relational histograms is not new. They have been shown to be quite effective for database indexing and object recognition. Huet et al. used relational histograms in [18] for shape indexing and they were shown to be a very efficient way of indexing images into large image databases. The relational distributions created by gated pairwise attribute histograms were used to recall complex line-patterns thereby permitting rapid simultaneous histogram comparisons. The use of the directed relative angle and the directed relative position permitted the encoding of structural information. In this thesis, 8
20 we use the edge gradient angle and the distance between pixels as the pairwise attributes to construct our relational distribution. Similarly, Vega and Sarkar used relational histograms for motion-based recognition of humans [19]. They used a normalized histogram of the observed inter-feature relations to show that it was possible to recognize individuals from their jogging and running gaits, and not just from their walking gait. Moreover, Ashbrook and Fisher [20] used pairwise geometric histograms to represent and classify arbitrary and 3 dimensional surface shapes. With this representation, they were able to find correspondences between different objects reliably and efficiently. Osada et al. also used sampled distributions for shape-based retrieval in [21]. Thacker et al. demonstrated in [22] that pairwise geometric histograms were complete with regards to describing line-based approximations to arbitrary curves. Altogether, relational histograms have proved to be useful for geometric descriptions and it is on this premise that we build our saliency measure. 9
21 CHAPTER 3 REM: RELATIONAL ENTROPY-BASED MEASURE Our saliency measure is formulated on the entropy of geometric relational distributions. These topics are described in further detail in the subsequent sections. 3.1 Relational Distributions We adopt the notion specified in [19] that the structure perceived in an image is determined more by the relationships among image features rather than by the individual feature attributes. We utilize a mechanism to capture this structure. Image structures can be represented by probability functions. In our case, these probability functions are referred to as relational distributions. We represent these relational distributions using relational histograms (geometric histograms). The concept of relational histograms is not a novel one and they have been used extensively. They were used for database indexing [18], motion-based recognition of humans [19], shape analysis [21], and object recognition [20]. We define relational distributions in definitions and following [19]. Definition Let: F = {f 1,..., f N } represent the set of N features in an image. F k represent a random k-tuple of features, and The relationship among these k-tuple features be denoted by R k. Therefore, pairwise or binary relationships between features are represented by R 2. Loworder spatial dependencies are captured by small values of k whereas higher-order dependencies are captured by larger values of k. 10
22 Definition Let the relationships R k be characterized by a set of M attributes A k = {A k1,..., A km }. Hence, image structures can be represented by joint probability functions: P (A k = a k ), also denoted by P (a k1,..., a km ) or P (a k ), where a ki is the value taken by the relational attribute A ki. These resultant probabilities are referred to as Relational Distributions. These distributions can be interpreted as: Given an image, if you pick k-tuples of features (in our case, two), what is the probability that it will exhibit the relational attributes a k or P (A k = a k )? We represent these relational distributions in a normalized histogram. The histogram bin size can vary, however, we utilized 10 x 10 or 100-bin histograms for most of our experiments. 3.2 Pixel-Based Features The concept of relational distributions is illustrated by considering the pixel properties as features. Each pixel, f i, is associated with the gradient direction, θ i, estimated using a Canny Edge detector. To capture some structure between two pixels, we use the difference between gradient angles (θ i θ j ) and the euclidean distance (d i d j ) between them as the attributes, {A 21, A 22 }, of R 2. These attributes are ideal because they are invariant with respect to image plane rotation and translation. Figure 3.1 depicts the computed attributes. In addition to these attributes, we also utilize the gradient magnitude differences between pixels as weights w i for histogram bin voting. The image in Figure 3.1 (c) illustrates the relational distribution that is formed for the probability function P (d, θ). We can see from this figure that the distribution is multi-modal. It also exhibits some repeated structure for the respective image. For a more complex (or more cluttered) image, this distribution tends to be more uniform, whereas for simpler images, the peaks in the illustration are more apparent. Gradient direction estimation is performed on an image and the relational distribution is built. Figure 3.2 presents a variety of images and their relational distribution (histogram) images. The original images are on the left and the relational distributions for the image are on the right. The vertical axis represents the gradient angle (ranges from 11
 and the horizontal axis represents the distance (ranges from 0 at the bottom left to the maximum distance possible in")
23 (a) Original image (b) Pixel Attributes (c) Relational Distribution P (d, θ) Figure 3.1. Pixel-based binary relational distribution. 0 at the top-left to π at the bottom-left) and the horizontal axis represents the distance (ranges from 0 at the bottom left to the maximum distance possible in the image at the bottom-right). 12


24 Figure 3.2. Images and their relational distributions (histograms). 13
25 For each image in Figure 3.2, the relational histogram was created based on the estimated gradient angles. The number of bins used for these histograms was 2061 (51 x 51). The horizontal axis (from left to right) represents the distance between pixels with a range from 0 to the maximum possible distance for the image, whereas the vertical axis (from top to bottom) represents the edge gradient angle with a range from 0 to π. 3.3 Sampling Relational distributions can be computed naively by performing an exhaustive enumeration of all feature pairs. This is computationally expensive with a time complexity of O(n 2 ), where n is the number of pixels in a local pixel neighborhood. Based on work done in [23], we also found that using a sampling-based method to estimate the relational distribution offers an efficient alternative. For each pixel i, we sample m pairs of pixels from the neighborhood of i (L i ) to create the relational distribution, where m is directly proportional to L i. We then repeat the sampling until the entropy of the distribution converges (change in the entropy is small, in our case 0.001). The complexity of the relational distribution computation is reduced to O(km), where k is the number of iterations for which the relational distribution is updated. 3.4 Entropy Let P = (p 1, p 2,..., p n ) be a discrete probability distribution. The amount of uncertainty or disorder (or randomness) of the distribution P is referred to as the entropy of P and it is measured by the quantity H [P] = H (p 1, p 2,..., p n ) [24]. In our case, the probability distribution is P(d, θ), which is captured by the relational histogram. Entropy designates the extent to which the features characterized by the relational histogram are uniformly distributed [13]. Entropy is defined by the common form by: H (P) = n i=1 p(x i ) log 2 p(x i ). (3.1) 14
26 Equation 3.1 is universally known as Shannon s Entropy. This form of entropy has some special properties [25]: It is continuous, so that small amounts of probability changes only result in small amounts of entropy changes. It is symmetric whereby the measure is unchanged if the outcomes p i are reordered. It is maximal when all the possible events are equally probable (the entropy value would be the highest in this case) - H (p 1, p 2,..., p n ) H ( 1 n, 1 n,..., 1 n ). Similarly, It is additive such that the amount of entropy is independent of how a process is divided into parts. It is invariant with regards to adding or removing an event with zero probability. We also utilize another form of entropy which is a generalization of the Shannon entropy in 3.1. It is defined as follows: H α (P) = 1 1 α log 2 ( n i=1 p(x i ) α ), (3.2) Equation 3.2 is known as Rényi s Entropy of order α where α 0. Increasing values of α produce a Rényi entropy that is devised by favoring the higher probability events. The probability events are considered more equally for lower values of α. When α = 1, we get the Shannon entropy. We ran our experiments with an α value of 2, which is defined as: H 2 (P) = log 2 ( n i=1 p(x i ) 2 ) (3.3) Equation 3.3 is sometimes referred to as Collision entropy. A comparison of the these two entropy measures is presented in a later section. Furthermore, we utilize an extra term (l 1) log 2(e) 2N shown by Abe in [26] to be the the expected divergence between a finite probability distribution Q on {1, 2,..., l} and its empirical one obtained from the sample of size N drawn from Q. This term is added to the entropy value H[P ] in an effort 15
27 to compute the expected divergence between the estimated probabilities and the actual underlying probability. We believe that finding the entropy of the relational distribution P(d, θ) is a good indicator of the pop-out structures in an image. We define our saliency measure in full in the subsequent section. 3.5 Saliency Measure We define saliency as the quality of an image feature that enables it to stand out (or pop-out ) relative to its neighbors. We quantify this quality with an entropic measure based on the relational distributions of local pixel neighborhoods. Therefore, let P(d, θ) be our relational distribution based on the pixel attributes specified in section 3.2. Thus, the saliency function Φ( ) is defined as: Φ = 1 H i [P(d, θ)] (3.4) where i is either 1 or 2 for Shannon s entropy or Rényi s entropy respectively. We calculate our measure Φ both globally (Φ G ) and locally (Φ L ). Φ G is not necessarily a measure of saliency. It measures the disorder (complexity) exhibited in the image. Φ L however, is a measure of pixel saliency with regards to some M, in which M is a (2k + 1)(2k + 1) neighborhood of a pixel with k > 1. Higher values of Φ indicate higher saliency and vice versa. Additionally, Φ is normalized. Due to the fact that Φ G is a global measure, it is more problematic from a computational point of view. We compare pixel pairs to determine the pairwise geometric relationships between them in an effort to build the relational distribution. In order to ascertain Φ G, we approached the problem in two ways: use brute force with n 2 comparisons to gather a fine estimate of Φ G (where n is the total number of pixels) or compare the edge pixels of an edge map to get a coarse estimate of Φ G. We found empirically that the latter approach was an order of magnitude faster than the former and less complex. Furthermore, the value derived only differed from the fine estimate by approximately 0.01 in most cases. We also noticed that the inefficient brute 16

28 force approach was an upper bound for the coarse estimate. With this in mind, the latter approach was preferred. To calculate Φ L, which assigns to each respective pixel location a saliency value, we considered the pairwise comparisons of pixels in the neighborhood M i of a central pixel f i, where i is the index of the pixel. Examples of neighborhoods used are shown in Figure 3.3. In this figure, the central pixel is depicted as a yellow dot. This procedure is also Figure 3.3. Local pixel neighborhoods to measure the saliency of a central pixel (image best viewed in color). administered to calculate Φ G with M being the entire pixel set of the edge map. The major difference is that each point is not given a saliency value. The value that is retrieved is a measure of organization. The euclidean distance d and the gradient angle difference θ between a pixel pair is used to construct the distribution as described in section

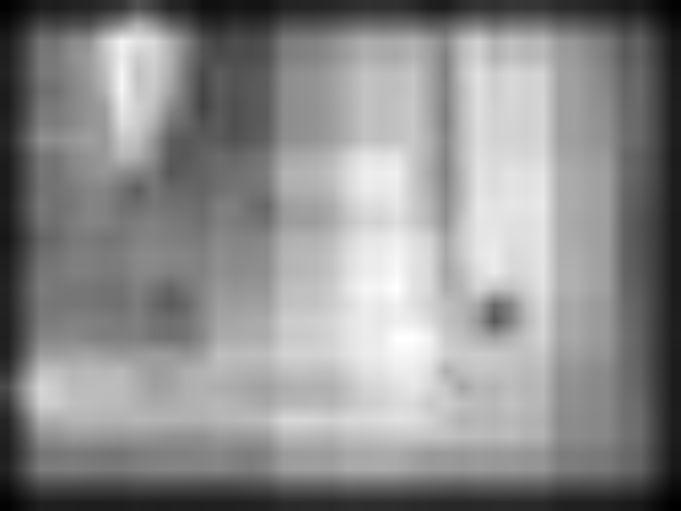
29 3.6 R.E.M. Saliency Map We construct a saliency map which is a representation of an image emphasizing salient locations as defined by our measure Φ L. Our algorithm takes a grayscale image as input and produces a grayscale map highlighting salient structures by assigning an estimated priority to every pixel location. Saliency maps are produced for images for varying local neighborhood scales. The brighter areas of the saliency map signify the more salient areas of the images and vice versa as depicted in Figure 3.4. This map may then be intensitynormalized and convolved with a Gaussian smoothing filter for comparison with the results of other saliency methods (mean saliency map). We hereafter refer to any of our saliency maps as the REM map. In Figure 3.4, the value of Φ G was = 0.171, the size of the local pixel neighborhood used was 11x11 with 25 histogram bins. The map was then intensitynormalized and smoothed with a Gaussian smoothing filter. In this case, a 30 x 30 mask was used with σ = 5. If you simply glance at the original image, some of the structures (a) Original Image Figure 3.4. An image and its saliency map. (b) REM Saliency map that may pop out to you during that brief attention span are represented in the saliency map. This would be explored further in subsequent sections. 18
30 3.7 Scale Space Objects in the world appear in different ways depending on the scale of observation and this fact has important implications if they are to be described. Multi-scale representations are necessary to completely represent and process images [27]. A characteristic property of structures in images is that they may only be meaningful over definite ranges of scale. For instance, a map of the United States would contain the largest cities, towns, and some interstate highways, whereas a city map changes the level of abstraction substantially to include streets and buildings etc. In computer vision, the primary focus is on deriving significant and meaningful information from images (determining that something is meaningful however, is context specific). Consequently, in this thesis, we explore the significance of scale relative to our saliency measure for deriving meaningful information from an image and attempt to select the optimal scales for their analysis [28]. Representations of scale-space would enable us to analyze an image point of interest at different scales, yet they do not indicate at which scale subsequent processing must be performed. As previously noted, our saliency map emphasizes salient locations in an image for a specified scale. We process an image at different local pixel neighborhood scales for square neighborhood scales satisfying 2 k + 1 dimensions, where k = 1,..., R.E.M. as an Optimization Criterion In this thesis, we explored extending a perceptual grouping framework to determine if our relational entropy-based measure was useful as an optimization criterion for selecting structurally organized edge groupings. We utilized the perceptual grouping framework described by Soundararajan in [29]. The goal of this framework was to group low-level image features which were likely to belong to a single object using graph spectral partitioning. This underlying process itself is commonly referred to as perceptual organization. Perceptual organization can be succinctly defined as the ability to detect salient structures and groupings in an image based on some form of organization exhibited among them. The ability to group salient structures is one of the fundamental issues in vision and 19
31 is of paramount importance to the design of vision systems. The groupings that arise as a result of perceptual organization can be thought of as being used to initiate the procedures used for object recognition and other higher level processes since it significantly reduces the complexity and search space for model comparison [30]. The grouping in this framework is done based on salient relationships between Gestalt principles, namely parallelism, continuity, similarity, symmetry, common region, and closure [31, 32]. The framework casts grouping parameters as probabilities which are learned from a set of training images of objects in their natural contexts (the objects of interest are manually outlined) [29]. However, we alter this functionality by eliminating the use of ground truth images, and incorporate our relational entropy-based measure as an optimization criterion. An overview of this framework as altered in this thesis, is depicted in Figure 3.5. Constant Edge Detector Scene Structure Graph Feature Grouping Spectral Partitioning Output Image Ground Truth Parameter Learning Team of Learning Automata Feedback Optimization Criterion Figure 3.5. System block diagram of the altered perceptual grouping framework. curvature edge segments form the low-level image features that are used as input to the grouping algorithm. The output consists of salient groups of these edge segments. The feature grouping algorithm consists of scene structure graph specification and spectral 20
32 partitioning of the scene structure graph. A weighted relational graph captures the salient relationships among the edge segments. Quantification of the relative importance of the salient relationships has not fully been exploited in the computer vision community. Consequently, with this grouping framework, the importance of each relationship is parameterized and is learned using an N-player stochastic automata game framework [33]. The probabilities that form the foundation of the relational graph, along with the other algorithm parameters are learned by the automata. A learning automaton is an algorithm that adaptively chooses from a set of possible actions on a random environment so as to maximize the expected feedback[29]. The environment in our case is the grouping algorithm along with the image set. In response to a chosen action, the environment produces a randomly determined output β, which is used by the learning automata to decide on the next action. The aim is to select the action that produces the maximum expected β (for more details on how the learning automata works, the reader is referred to [29, 33]). 3.9 Learning Automata The learning automata team decides on the contributions for the parameters used to quantify the relationships, which is based on the feedback that it receives from the environment. This feedback measure captures the performance of the grouping algorithm on an image. This was originally calculated by comparing the output of the grouping algorithm with manually outlined training images (ground truth). We altered this feedback measure in an effort to circumvent the use of ground truth images for determining performance. The rationale behind this new feedback measure goes as follows: Definition Let G denote the set of groups found by the perceptual grouping algorithm from [29] and let N G denote the number of groups found. Let Φ β be the new performance feedback measure defined as follows: Φ β = 1 N G ( g G 1 H[ P(d, θ) g ] ), (3.5) 21
33 where P(d, θ) g is the relational distribution formed by the pairwise comparisons of the pixels of g. This measure ranges from ranges from zero to one and larger values indicate stronger groupings and vice versa. Other metrics might be desirable, but this one suffices for the illustration of the essential ideas. 22
34 CHAPTER 4 RESULTS AND ANALYSES We present analyses and evaluations of our saliency measure in this section. We investigate its performance for a wide variety of images and compare our results with the state of the art. We also present results for our extension of a perceptual grouping framework as described in section 3.8. In the subsequent section we detail the image databases that were used in this thesis. 4.1 Datasets A wide variety of real images from various publicly available data sets were gathered. These were used in the design and evaluation of our saliency measure. Representative sample images were chosen from each set and used in this thesis in an effort to illustrate the generic and biologically plausible nature of our measure. All of the images used were originally color images. They were converted to grayscale for use in this work. PASCAL: Saliency mechanisms are often precursors to object recognition. Therefore, we believed that it would be fitting to evaluate our measures on images from an object recognition challenge dataset. This challenge set can be utilized for the development and testing of recognition algorithms. The PASCAL 1 dataset [34] offers a wide array of realistic images for this purpose. This is one route we decided to embark on. Bruce: Images utilized by Bruce and Tsotsos for their study in [1] were also used. We chose 1 PASCAL is an acronym for pattern analysis, statistical modeling, and computational learning. 23
35 these images due to the availability of their human fixation maps, which facilitates the evaluation and comparison of our results with the state of the art. ilab: Images from the ubiquitous ilab 2 of the University of Southern California were also used in an effort to evaluate the performance of our saliency measure with the ground truth data that was available [35]. StreetScenes: The MIT StreetScenes [36] database contains images of urban scenes from many categories. We used this simply to determine if our measure highlighted the pedestrians in a scene to some degree. 4.2 General Performance of Saliency Measure In this section, we present a variety of real images and their saliency map results. As previously noted, our measure is a pure bottom-up, task-independent approach to saliency detection. There is no knowledge about the context of the scene that is used to determine saliency. Salient regions are simply those regions which stand out relative to their neighborhood. Since we utilize gradient information, namely gradient direction and magnitude, boundaries of salient regions are emphasized rather than their interior. This is due to the fact that within the salient region (if composed of many salient pixels), there may be nothing that stands out locally, hence uniformity. This can be observed in the subsequent sections Evaluation with Regards to Highlighting Pedestrians We used our saliency measure to determine if pedestrians would be emphasized as salient in some images taken from the StreetScenes database [36]. We must note however that pedestrians are not essentially salient. With our measure, if pedestrians stand out 2 ilab is the name given to the research laboratory headed by Professor L. Itti of the University of Southern California 24
36 relative to their surroundings, they would be recognized as salient. The original images were converted to grayscale for evaluation and the relational distributions were calculated for neighborhoods of 9 x 9 pixels. 25


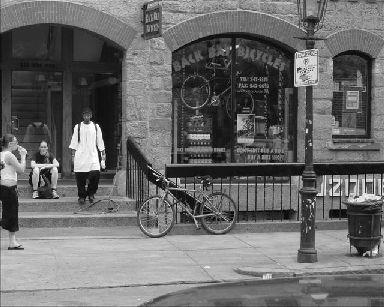


37 (a) Image evaluated (b) Marked pedestrians (c) REM saliency map Figure 4.1. REM saliency s performance with regards to highlighting pedestrians. 26
38 4.2.2 Evaluation with Regards to Highlighting Traffic Signs Analogous to highlighting pedestrians, we used our measure to determine if traffic signs would be emphasized in images taken from the ilab image data set [35]. Similarly to the highlighting of pedestrians in section 4.2.1, traffic signs are only salient if they stand out relative to their surroundings. Traffic signs should be salient if they are to perform their function effectively. The original images were converted to grayscale for evaluation. Following the procedure indicated in the previous section, and the relational distributions were calculated for neighborhoods of 9 x 9 pixels. 27


")


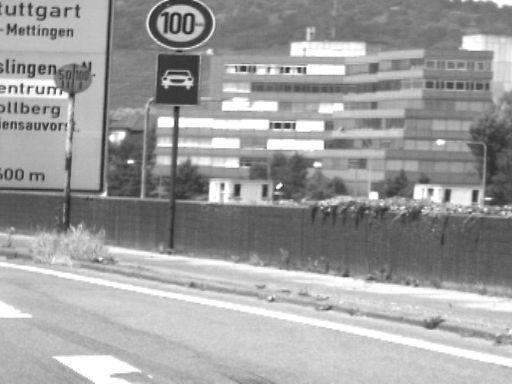


39 (a) Image evaluated (b) Marked traffic signs (c) REM saliency map Figure 4.2. REM saliency s performance with regards to highlighting traffic signs. 28
40 4.3 Comparison with Human Saliency Maps The main goal of this thesis was to develop a pure bottom-up saliency mechanism based on relationships between image features and we highlight those image regions which stand out relative to some local neighborhood. We analyze the performance of our proposed method in relation to that obtained by the human visual attention mechanism. We executed this by comparing our saliency maps with empirical human fixation maps (or fixation density maps) from work done by Bruce and Tsotsos in [1]. The human saliency maps were captured by recording human eye fixations over an image which was displayed to test subjects for a limited amount of time. Each fixation point in these images were then convolved with a Gaussian. For more details on this procedure, the reader is referred to [1]. We follow the evaluation methods of [2] by using a subjective and objective comparison of the saliency maps. The subjective comparison provides an approximate evaluation of the correlation between the human fixation map and the REM saliency map. Conversely, the correlation coefficient between the maps provides a more objective comparison. This measure has been used as de-facto standard for comparing saliency maps. The test images used in this evaluation are shown in Figure 4.3. image1 image2 image3 image4 image5 image6 image7 image8 Figure 4.3. Original test images used for the human fixation map comparisons. 29
41 4.3.1 Subjective Comparison This method gives us an estimated idea about the correlation between the human fixation and saliency maps visually. We assign a different color channel to each map - blue for our saliency map, and green for the human fixation map. The red channel is given a value of 0. With this comparison image, an observer can see where the maps correlate and where they do not. Black regions of the image indicate the absence of saliency for both maps, whereas bright regions indicate saliency on both maps. Similarly, uncorrelated parts are either blue, which signifies REM saliency but no human fixation, or green, signifying human fixation but no saliency as determined by our method. The comparison is shown in Figure 4.4. The human fixation maps were based on the color versions of the images in column (a). 30


42 (a) Image evaluated (b) Human saliency map (c) REM saliency map (d) Comparison map Figure 4.4. Comparing saliency results and human saliency maps. 31
43 4.3.2 Objective Comparison The correlation coefficient serves as the objective comparison between the human fixation map and our REM saliency map. The correlation coefficient λ is calculated as follows: λ = x [(M h(x) µ h ) (M s (x) µ s )] x (M h(x) µ h ) 2 x (M (4.1) s(x) µ s ) 2 2 where M h (x) is the human fixation map, M s (x) is the REM saliency map, µ h is the mean intensity of the human fixation map (M c (x)), and µ s is the mean intensity of our map (M s (x)). If there is no relationship between the human fixation map and the REM saliency map, the correlation coefficient is 0 or very low. As the strength of the relationship between the human saliency map and REM saliency map increases, so does the correlation coefficient. A perfect relationship gives a coefficient of 1.0. Thus, the higher the correlation coefficient the better. The values are displayed in table 4.1. The images are referenced as image1 to image8 with regards to how they are listed in Figure 4.3. Table 4.1. Correlation coefficients λ between Human Fixation Maps [1] and REM saliency maps. image1 image2 image3 image4 image5 image6 image7 image8 λ Comparison with a Dominant Saliency Model Following the approach proposed in [2] and adopted in [16] and some of the test images which were used, we compared the results of our algorithm to that of the results produced by ilab s [35, 37] (available in [38]) saliency algorithm in relation to the respective human saliency maps. ilab s saliency mechanism is considered the dominant saliency model in the state of the art. We must note that our method only uses grayscale images, whereas the ilab makes use of the color information. The original images which were used for this comparison are displayed in Figure 4.5. The REM saliency maps were produced by evaluating a local pixel neighborhood size of 11x11. They were then downsampled so that they could be compared to ilab s saliency maps. The correlation coefficients for both 32
44 mechanisms are shown in table 4.2. The correlations between the human maps and the REM maps are higher than the correlations with ilab saliency in two out of the four images shown. road coke swissalps forest Figure 4.5. Original test images used for comparison with the state of the art. (a) Image evaluated (b) Human saliency map (c) ilab saliency map. (d) REM saliency map Figure 4.6. Comparing REM saliency results with human saliency maps and ilab. 33
45 Table 4.2. Correlation coefficients λ of REM saliency maps and ilab saliency maps with human saliency maps [2]. coke road swissalps forest REM - λ ilab - λ In addition, we compared our results to ilab s with regards to 120 human fixation maps from the Bruce and Tsotsos data set (some examples are shown in Figure 4.4). Some of the results are shown in Figure 4.7 and table 4.3. Table 4.3. Correlation coefficients λ between REM and ilab saliency maps with their respective Human Fixation Maps [1]. image1 image2 image3 image4 image5 image6 image7 image8 REM ilab The overall performance for these 120 images is displayed in Figure 4.8. In 63.3% of the images, the correlation coefficients between the R.E.M. saliency maps and the human fixation maps were higher than ilab s. 34


46 (a) Image evaluated (b) Human saliency map (c) REM saliency map (d) ilab saliency map Figure 4.7. Comparing saliency results and human saliency maps. 35
47 Figure 4.8. R.E.M. vs. ilab - graph of the correlation coefficients for 120 images from the Bruce and Tsotsos data set. 4.5 Scale Variation We first proceeded by evaluating our saliency measure for various local pixel neighborhood dimensions for a specified pixel location. The pixel locations were chosen manually and the neighborhood dimensions extended from (3 x 3) to either 50% of the image size, or the neighborhood at which convergence was achieved. Convergence is achieved in this case when there is no significant change in the entropy of the pixel for twenty iterations and ( H p(d,θ) > 0.001). Keep in mind that our saliency measure is 1 H[P(d, θ)], where P(d, θ) represents the relational distribution of a local pixel neighborhood. This is depicted in Figures 4.9 to
. We see from Figures 4.10, 4.12, 4.14, and 4.")
48 4.5.1 Evaluation at a Specified Pixel Location In this section, we aim to determine the optimal scale at which the saliency of a pixel can be analyzed. Figure 4.9. Baby image evaluated at the pixel location (244, 180). We see from Figures 4.10, 4.12, 4.14, and 4.16 that the entropy is lower for smaller neighborhoods of a pixel (note that our saliency measure is simply 1 entropy). We can deduce that our measure depends strongly upon the scale at which it is measured. The question posed is which neighborhood size is approximately optimal for our entropic measure? From these images, we can see that after a scale σ of 15, the entropy values converge to approximately A more exhaustive approach must be taken to determine the exact scale to derive meaningful information, which can vary from image to image and region to region. Consequently, we investigate this by examining the saliency values for each pixel at different scales. If an image point is salient up to a scale σ, this means that 37
. its saliency value remains relatively unchanged up to this scale. Thus, it persists.")
49 Figure Plot of the entropy values for the image in Figure 4.9 with convergence occurring at a neighborhood size of (165 x 165). Figure Bedroom image evaluated at the pixel location (138, 56). its saliency value remains relatively unchanged up to this scale. Thus, it persists. This idea is investigated in the subsequent section. 38
. Figure 4.13.")
50 Figure Plot of the entropy values for the image in Figure 4.11 with convergence occurring at a neighborhood size of (157 x 157). Figure Living room image evaluated at the pixel location (242, 170). 39
. Figure 4.15.")
51 Figure Plot of the entropy values for the image in Figure 4.13 with convergence occurring at a neighborhood size of (101 x 101). Figure Office image evaluated at the pixel location (135, 71). 40
52 Figure Plot of the entropy values for the image in Figure 4.15 with convergence occurring at a neighborhood size of (135 x 135). 41
 is as follows: (2 k + 1) x (2 k + 1), where k = {1,..., 5}; σ = n would always refer to n x n.")
 Test Image (b) σ = 3 (c) σ = 5 (d) σ = 9 (e) σ = 17 (f) σ = 33 Figure 4.17. Scale space evaluation of helmets image.")

53 4.5.2 Evaluation of the Saliency Map at Different Scales In this section, we evaluate the changes that occur to a saliency map over a narrow range of scales. The scale range (σ) is as follows: (2 k + 1) x (2 k + 1), where k = {1,..., 5}; σ = n would always refer to n x n. The saliency maps were intensity-normalized and smoothed with a Gaussian smoothing filter. From these images, we can subjectively conclude that (a) Test Image (b) σ = 3 (c) σ = 5 (d) σ = 9 (e) σ = 17 (f) σ = 33 Figure Scale space evaluation of helmets image. the border of the ceiling lights and the helmet reflections are the most salient over these narrow range of scales. All other image regions fade to the background. For these images, we can conclude that the borders of the chairs are the most salient over these narrow range of scales. The heads of the band members persist up to the σ = 17 scale, but they are not so apparent at σ = 33. We can see from all the images in Figures that the most salient image regions persist through to the largest scale. Less salient regions fade as the scale increases. 42
 σ =")
 σ = 9 (e)")


54 (a) Test Image (b) σ = 3 (c) σ = 5 (d) σ = 9 (e) σ = 17 (f) σ = 33 Figure Scale space evaluation of band image. (a) Test Image (b) σ = 3 (c) σ = 5 (d) σ = 9 (e) σ = 17 (f) σ = 33 Figure Scale space evaluation of beer bottles image. 43


![Shannon entropy (images were taken from the PASCAL challenge dataset [3]).](/docs-images/72/67345350/images/55-2.jpg "Image Φ G using Rényi s entropy Φ G using Shannon s entropy 0.245 0.182 0.")


55 4.6 Comparison of Shannon and Rényi Entropies The entropy measure was formulated with both the Shannon and Rényi entropies. A comparison of values for our global measure Φ G is shown in table 4.4. We can see from the Table 4.4. Comparison of Φ G values using Rényi and Shannon entropy (images were taken from the PASCAL challenge dataset [3]). Image Φ G using Rényi s entropy Φ G using Shannon s entropy table that Φ G has higher values when the Rényi entropy is incorporated and lower values when the Shannon entropy is used. Due to the fact that Φ is inversely proportional to the entropy value, this provides evidence that the Shannon entropy is an upper bound to the Rényi, as is commonly known. 44
 with a random sampling percentage of 25%.")
56 4.7 Evaluating Histogram Bin Size In this section, we evaluate the effect of varying the histogram bin size on the saliency map composed of Φ L values as well the value of Φ G for an image. The local pixel neighborhood size used in Figure 4.20 to measure the saliency was (9 x 9) with a random sampling percentage of 25%. We can see from the Figure that the contrast of the saliency map is (a) Image evaluated (b) 25 bins, Φ G = (c) 100 bins, Φ G = (d) 900 bins, Φ G = (e) 3600 bins, Φ G = (f) 8100 bins, Φ G = Figure Effects of varying the number of histogram bins on the saliency map. altered with an increase in the number of histogram bins. The areas of the image which were highlighted as salient persisted in all the maps, whereas the areas which were not highlighted as salient did not. There is a somewhat smoothing effect that occurred as a 45
57 result. The Φ L values of non-salient regions leveled out as indicated by the homogenous intensity characteristics. 4.8 Evaluation of the Extension to a Perceptual Grouping Framework In this section we present results of the extension of the perceptual grouping framework of [29]. Figure 4.21 shows some sample results on a variety of real images. The first column (starting from the left) displays the gray-level input images. The second column displays the edge map of the features that must be grouped. The third column displays the different groups retrieved using the original framework, and the fourth column displays the groups retrieved using our measure as an optimization criterion Φ β. 46


58 (a) Original image (b) Edge map (c) Original result (d) Our result Figure Perceptual grouping extension results. 47
Natural Scene Statistics and Perception. W.S. Geisler
 Natural Scene Statistics and Perception W.S. Geisler Some Important Visual Tasks Identification of objects and materials Navigation through the environment Estimation of motion trajectories and speeds
Announcements. Perceptual Grouping. Quiz: Fourier Transform. What you should know for quiz. What you should know for quiz
 Announcements Quiz on Tuesday, March 10. Material covered (Union not Intersection) All lectures before today (March 3). Forsyth and Ponce Readings: Chapters 1.1, 4, 5.1, 5.2, 5.3, 7,8, 9.1, 9.2, 9.3, 6.5.2,
Validating the Visual Saliency Model
 Validating the Visual Saliency Model Ali Alsam and Puneet Sharma Department of Informatics & e-learning (AITeL), Sør-Trøndelag University College (HiST), Trondheim, Norway er.puneetsharma@gmail.com Abstract.
Top-Down Control of Visual Attention: A Rational Account
 Top-Down Control of Visual Attention: A Rational Account Michael C. Mozer Michael Shettel Shaun Vecera Dept. of Comp. Science & Dept. of Comp. Science & Dept. of Psychology Institute of Cog. Science Institute
Identification of Tissue Independent Cancer Driver Genes
 Identification of Tissue Independent Cancer Driver Genes Alexandros Manolakos, Idoia Ochoa, Kartik Venkat Supervisor: Olivier Gevaert Abstract Identification of genomic patterns in tumors is an important
(Visual) Attention. October 3, PSY Visual Attention 1
 Attention. October 3, PSY Visual Attention 1") (Visual) Attention Perception and awareness of a visual object seems to involve attending to the object. Do we have to attend to an object to perceive it? Some tasks seem to proceed with little or no attention
(Visual) Attention Perception and awareness of a visual object seems to involve attending to the object. Do we have to attend to an object to perceive it? Some tasks seem to proceed with little or no attention
Outlier Analysis. Lijun Zhang
 Outlier Analysis Lijun Zhang zlj@nju.edu.cn http://cs.nju.edu.cn/zlj Outline Introduction Extreme Value Analysis Probabilistic Models Clustering for Outlier Detection Distance-Based Outlier Detection Density-Based
Biologically-Inspired Human Motion Detection
 Biologically-Inspired Human Motion Detection Vijay Laxmi, J. N. Carter and R. I. Damper Image, Speech and Intelligent Systems (ISIS) Research Group Department of Electronics and Computer Science University
Computational Cognitive Science
 Computational Cognitive Science Lecture 15: Visual Attention Chris Lucas (Slides adapted from Frank Keller s) School of Informatics University of Edinburgh clucas2@inf.ed.ac.uk 14 November 2017 1 / 28
IAT 355 Perception 1. Or What You See is Maybe Not What You Were Supposed to Get
 IAT 355 Perception 1 Or What You See is Maybe Not What You Were Supposed to Get Why we need to understand perception The ability of viewers to interpret visual (graphical) encodings of information and
VIDEO SALIENCY INCORPORATING SPATIOTEMPORAL CUES AND UNCERTAINTY WEIGHTING
 VIDEO SALIENCY INCORPORATING SPATIOTEMPORAL CUES AND UNCERTAINTY WEIGHTING Yuming Fang, Zhou Wang 2, Weisi Lin School of Computer Engineering, Nanyang Technological University, Singapore 2 Department of
EARLY STAGE DIAGNOSIS OF LUNG CANCER USING CT-SCAN IMAGES BASED ON CELLULAR LEARNING AUTOMATE
 EARLY STAGE DIAGNOSIS OF LUNG CANCER USING CT-SCAN IMAGES BASED ON CELLULAR LEARNING AUTOMATE SAKTHI NEELA.P.K Department of M.E (Medical electronics) Sengunthar College of engineering Namakkal, Tamilnadu,
Computational Cognitive Science. The Visual Processing Pipeline. The Visual Processing Pipeline. Lecture 15: Visual Attention.
 Lecture 15: Visual Attention School of Informatics University of Edinburgh keller@inf.ed.ac.uk November 11, 2016 1 2 3 Reading: Itti et al. (1998). 1 2 When we view an image, we actually see this: The
Performance and Saliency Analysis of Data from the Anomaly Detection Task Study
 Performance and Saliency Analysis of Data from the Anomaly Detection Task Study Adrienne Raglin 1 and Andre Harrison 2 1 U.S. Army Research Laboratory, Adelphi, MD. 20783, USA {adrienne.j.raglin.civ, andre.v.harrison2.civ}@mail.mil
On the implementation of Visual Attention Architectures
 On the implementation of Visual Attention Architectures KONSTANTINOS RAPANTZIKOS AND NICOLAS TSAPATSOULIS DEPARTMENT OF ELECTRICAL AND COMPUTER ENGINEERING NATIONAL TECHNICAL UNIVERSITY OF ATHENS 9, IROON
Performance evaluation of the various edge detectors and filters for the noisy IR images
 Performance evaluation of the various edge detectors and filters for the noisy IR images * G.Padmavathi ** P.Subashini ***P.K.Lavanya Professor and Head, Lecturer (SG), Research Assistant, ganapathi.padmavathi@gmail.com
Reading Assignments: Lecture 18: Visual Pre-Processing. Chapters TMB Brain Theory and Artificial Intelligence
 Brain Theory and Artificial Intelligence Lecture 18: Visual Pre-Processing. Reading Assignments: Chapters TMB2 3.3. 1 Low-Level Processing Remember: Vision as a change in representation. At the low-level,
Theoretical Neuroscience: The Binding Problem Jan Scholz, , University of Osnabrück
 The Binding Problem This lecture is based on following articles: Adina L. Roskies: The Binding Problem; Neuron 1999 24: 7 Charles M. Gray: The Temporal Correlation Hypothesis of Visual Feature Integration:
Computational Cognitive Science
 Computational Cognitive Science Lecture 19: Contextual Guidance of Attention Chris Lucas (Slides adapted from Frank Keller s) School of Informatics University of Edinburgh clucas2@inf.ed.ac.uk 20 November
Principals of Object Perception
 Principals of Object Perception Elizabeth S. Spelke COGNITIVE SCIENCE 14, 29-56 (1990) Cornell University Summary Infants perceive object by analyzing tree-dimensional surface arrangements and motions.
Fusing Generic Objectness and Visual Saliency for Salient Object Detection
 Fusing Generic Objectness and Visual Saliency for Salient Object Detection Yasin KAVAK 06/12/2012 Citation 1: Salient Object Detection: A Benchmark Fusing for Salient Object Detection INDEX (Related Work)
AUTOMATIC MEASUREMENT ON CT IMAGES FOR PATELLA DISLOCATION DIAGNOSIS
 AUTOMATIC MEASUREMENT ON CT IMAGES FOR PATELLA DISLOCATION DIAGNOSIS Qi Kong 1, Shaoshan Wang 2, Jiushan Yang 2,Ruiqi Zou 3, Yan Huang 1, Yilong Yin 1, Jingliang Peng 1 1 School of Computer Science and
Local Image Structures and Optic Flow Estimation
 Local Image Structures and Optic Flow Estimation Sinan KALKAN 1, Dirk Calow 2, Florentin Wörgötter 1, Markus Lappe 2 and Norbert Krüger 3 1 Computational Neuroscience, Uni. of Stirling, Scotland; {sinan,worgott}@cn.stir.ac.uk
Information Processing During Transient Responses in the Crayfish Visual System
 Information Processing During Transient Responses in the Crayfish Visual System Christopher J. Rozell, Don. H. Johnson and Raymon M. Glantz Department of Electrical & Computer Engineering Department of
Using Perceptual Grouping for Object Group Selection
 Using Perceptual Grouping for Object Group Selection Hoda Dehmeshki Department of Computer Science and Engineering, York University, 4700 Keele Street Toronto, Ontario, M3J 1P3 Canada hoda@cs.yorku.ca
Learning to Use Episodic Memory
 Learning to Use Episodic Memory Nicholas A. Gorski (ngorski@umich.edu) John E. Laird (laird@umich.edu) Computer Science & Engineering, University of Michigan 2260 Hayward St., Ann Arbor, MI 48109 USA Abstract
Recognizing Scenes by Simulating Implied Social Interaction Networks
 Recognizing Scenes by Simulating Implied Social Interaction Networks MaryAnne Fields and Craig Lennon Army Research Laboratory, Aberdeen, MD, USA Christian Lebiere and Michael Martin Carnegie Mellon University,
Models of Attention. Models of Attention
 Models of Models of predictive: can we predict eye movements (bottom up attention)? [L. Itti and coll] pop out and saliency? [Z. Li] Readings: Maunsell & Cook, the role of attention in visual processing,
Salient Object Detection in Videos Based on SPATIO-Temporal Saliency Maps and Colour Features
 Salient Object Detection in Videos Based on SPATIO-Temporal Saliency Maps and Colour Features U.Swamy Kumar PG Scholar Department of ECE, K.S.R.M College of Engineering (Autonomous), Kadapa. ABSTRACT Salient
MEMORABILITY OF NATURAL SCENES: THE ROLE OF ATTENTION
 MEMORABILITY OF NATURAL SCENES: THE ROLE OF ATTENTION Matei Mancas University of Mons - UMONS, Belgium NumediArt Institute, 31, Bd. Dolez, Mons matei.mancas@umons.ac.be Olivier Le Meur University of Rennes
Advertisement Evaluation Based On Visual Attention Mechanism
 2nd International Conference on Economics, Management Engineering and Education Technology (ICEMEET 2016) Advertisement Evaluation Based On Visual Attention Mechanism Yu Xiao1, 2, Peng Gan1, 2, Yuling
Visual Perception. Agenda. Visual perception. CS Information Visualization January 20, 2011 John Stasko. Pre-attentive processing Color Etc.
 Topic Notes Visual Perception CS 7450 - Information Visualization January 20, 2011 John Stasko Agenda Visual perception Pre-attentive processing Color Etc. Spring 2011 CS 7450 2 1 Semiotics The study of
Adding Shape to Saliency: A Computational Model of Shape Contrast
 Adding Shape to Saliency: A Computational Model of Shape Contrast Yupei Chen 1, Chen-Ping Yu 2, Gregory Zelinsky 1,2 Department of Psychology 1, Department of Computer Science 2 Stony Brook University
Chapter 1. Introduction
 Chapter 1 Introduction 1.1 Motivation and Goals The increasing availability and decreasing cost of high-throughput (HT) technologies coupled with the availability of computational tools and data form a
ANALYSIS AND DETECTION OF BRAIN TUMOUR USING IMAGE PROCESSING TECHNIQUES
 ANALYSIS AND DETECTION OF BRAIN TUMOUR USING IMAGE PROCESSING TECHNIQUES P.V.Rohini 1, Dr.M.Pushparani 2 1 M.Phil Scholar, Department of Computer Science, Mother Teresa women s university, (India) 2 Professor
Grading of Vertebral Rotation
 Chapter 5 Grading of Vertebral Rotation The measurement of vertebral rotation has become increasingly prominent in the study of scoliosis. Apical vertebral deformity demonstrates significance in both preoperative
Object Substitution Masking: When does Mask Preview work?
 Object Substitution Masking: When does Mask Preview work? Stephen W. H. Lim (psylwhs@nus.edu.sg) Department of Psychology, National University of Singapore, Block AS6, 11 Law Link, Singapore 117570 Chua
The 29th Fuzzy System Symposium (Osaka, September 9-, 3) Color Feature Maps (BY, RG) Color Saliency Map Input Image (I) Linear Filtering and Gaussian
 Color Feature Maps (BY, RG) Color Saliency Map Input Image (I) Linear Filtering and Gaussian") The 29th Fuzzy System Symposium (Osaka, September 9-, 3) A Fuzzy Inference Method Based on Saliency Map for Prediction Mao Wang, Yoichiro Maeda 2, Yasutake Takahashi Graduate School of Engineering, University
The 29th Fuzzy System Symposium (Osaka, September 9-, 3) A Fuzzy Inference Method Based on Saliency Map for Prediction Mao Wang, Yoichiro Maeda 2, Yasutake Takahashi Graduate School of Engineering, University
Recurrent Refinement for Visual Saliency Estimation in Surveillance Scenarios
 2012 Ninth Conference on Computer and Robot Vision Recurrent Refinement for Visual Saliency Estimation in Surveillance Scenarios Neil D. B. Bruce*, Xun Shi*, and John K. Tsotsos Department of Computer
Congruency Effects with Dynamic Auditory Stimuli: Design Implications
 Congruency Effects with Dynamic Auditory Stimuli: Design Implications Bruce N. Walker and Addie Ehrenstein Psychology Department Rice University 6100 Main Street Houston, TX 77005-1892 USA +1 (713) 527-8101
An Evaluation of Motion in Artificial Selective Attention
 An Evaluation of Motion in Artificial Selective Attention Trent J. Williams Bruce A. Draper Colorado State University Computer Science Department Fort Collins, CO, U.S.A, 80523 E-mail: {trent, draper}@cs.colostate.edu
Grounding Ontologies in the External World
 Grounding Ontologies in the External World Antonio CHELLA University of Palermo and ICAR-CNR, Palermo antonio.chella@unipa.it Abstract. The paper discusses a case study of grounding an ontology in the
Computational Architectures in Biological Vision, USC, Spring 2001
 Computational Architectures in Biological Vision, USC, Spring 2001 Lecture 11: Visual Illusions. Reading Assignments: None 1 What Can Illusions Teach Us? They exacerbate the failure modes of our visual
Gathering and Repetition of the Elements in an Image Affect the Perception of Order and Disorder
 International Journal of Affective Engineering Vol.13 No.3 pp.167-173 (2014) ORIGINAL ARTICLE Gathering and Repetition of the Elements in an Image Affect the Perception of Order and Disorder Yusuke MATSUDA
Information Design. Information Design
 Information Design Goal: identify methods for representing and arranging the objects and actions possible in a system in a way that facilitates perception and understanding Information Design Define and
Conditional spectrum-based ground motion selection. Part II: Intensity-based assessments and evaluation of alternative target spectra
 EARTHQUAKE ENGINEERING & STRUCTURAL DYNAMICS Published online 9 May 203 in Wiley Online Library (wileyonlinelibrary.com)..2303 Conditional spectrum-based ground motion selection. Part II: Intensity-based
Automated Detection of Vascular Abnormalities in Diabetic Retinopathy using Morphological Entropic Thresholding with Preprocessing Median Fitter
 IJSTE - International Journal of Science Technology & Engineering Volume 1 Issue 3 September 2014 ISSN(online) : 2349-784X Automated Detection of Vascular Abnormalities in Diabetic Retinopathy using Morphological
LECTURE 5: REACTIVE AND HYBRID ARCHITECTURES
 Reactive Architectures LECTURE 5: REACTIVE AND HYBRID ARCHITECTURES An Introduction to MultiAgent Systems http://www.csc.liv.ac.uk/~mjw/pubs/imas There are many unsolved (some would say insoluble) problems
Oscillatory Neural Network for Image Segmentation with Biased Competition for Attention
 Oscillatory Neural Network for Image Segmentation with Biased Competition for Attention Tapani Raiko and Harri Valpola School of Science and Technology Aalto University (formerly Helsinki University of
Can Saliency Map Models Predict Human Egocentric Visual Attention?
 Can Saliency Map Models Predict Human Egocentric Visual Attention? Kentaro Yamada 1, Yusuke Sugano 1, Takahiro Okabe 1 Yoichi Sato 1, Akihiro Sugimoto 2, and Kazuo Hiraki 3 1 The University of Tokyo, Tokyo,
Subjective randomness and natural scene statistics
 Psychonomic Bulletin & Review 2010, 17 (5), 624-629 doi:10.3758/pbr.17.5.624 Brief Reports Subjective randomness and natural scene statistics Anne S. Hsu University College London, London, England Thomas
A Visual Saliency Map Based on Random Sub-Window Means
 A Visual Saliency Map Based on Random Sub-Window Means Tadmeri Narayan Vikram 1,2, Marko Tscherepanow 1 and Britta Wrede 1,2 1 Applied Informatics Group 2 Research Institute for Cognition and Robotics
Automated Assessment of Diabetic Retinal Image Quality Based on Blood Vessel Detection
 Y.-H. Wen, A. Bainbridge-Smith, A. B. Morris, Automated Assessment of Diabetic Retinal Image Quality Based on Blood Vessel Detection, Proceedings of Image and Vision Computing New Zealand 2007, pp. 132
Exploration and Exploitation in Reinforcement Learning
 Exploration and Exploitation in Reinforcement Learning Melanie Coggan Research supervised by Prof. Doina Precup CRA-W DMP Project at McGill University (2004) 1/18 Introduction A common problem in reinforcement
Learning to classify integral-dimension stimuli
 Psychonomic Bulletin & Review 1996, 3 (2), 222 226 Learning to classify integral-dimension stimuli ROBERT M. NOSOFSKY Indiana University, Bloomington, Indiana and THOMAS J. PALMERI Vanderbilt University,
2012 Course: The Statistician Brain: the Bayesian Revolution in Cognitive Sciences
 2012 Course: The Statistician Brain: the Bayesian Revolution in Cognitive Sciences Stanislas Dehaene Chair of Experimental Cognitive Psychology Lecture n 5 Bayesian Decision-Making Lecture material translated
USING AUDITORY SALIENCY TO UNDERSTAND COMPLEX AUDITORY SCENES
 USING AUDITORY SALIENCY TO UNDERSTAND COMPLEX AUDITORY SCENES Varinthira Duangudom and David V Anderson School of Electrical and Computer Engineering, Georgia Institute of Technology Atlanta, GA 30332
Sensation and Perception
 1 Sensation and Perception DR. ARNEL BANAGA SALGADO, Doctor of Psychology (USA) FPM (Ph.D.) Psychology (India) Doctor of Education (Phl) Master of Arts in Nursing (Phl) Master of Arts in Teaching Psychology
Conclusions and future directions
 Chapter 9 Conclusions and future directions This chapter summarises the findings within this thesis, examines its main contributions, and provides suggestions for further directions. 9.1 Thesis summary
Introduction to Computational Neuroscience
 Introduction to Computational Neuroscience Lecture 11: Attention & Decision making Lesson Title 1 Introduction 2 Structure and Function of the NS 3 Windows to the Brain 4 Data analysis 5 Data analysis
An Attentional Framework for 3D Object Discovery
 An Attentional Framework for 3D Object Discovery Germán Martín García and Simone Frintrop Cognitive Vision Group Institute of Computer Science III University of Bonn, Germany Saliency Computation Saliency
Block-upscaling of transport in heterogeneous aquifers
 158 Calibration and Reliability in Groundwater Modelling: From Uncertainty to Decision Making (Proceedings of ModelCARE 2005, The Hague, The Netherlands, June 2005). IAHS Publ. 304, 2006. Block-upscaling
2D-Sigmoid Enhancement Prior to Segment MRI Glioma Tumour
 2D-Sigmoid Enhancement Prior to Segment MRI Glioma Tumour Pre Image-Processing Setyawan Widyarto, Siti Rafidah Binti Kassim 2,2 Department of Computing, Faculty of Communication, Visual Art and Computing,
Are In-group Social Stimuli more Rewarding than Out-group?
 University of Iowa Honors Theses University of Iowa Honors Program Spring 2017 Are In-group Social Stimuli more Rewarding than Out-group? Ann Walsh University of Iowa Follow this and additional works at:
Human Perception. Topic Objectives. CS 725/825 Information Visualization Fall Dr. Michele C. Weigle.
 CS 725/825 Information Visualization Fall 2013 Human Perception Dr. Michele C. Weigle http://www.cs.odu.edu/~mweigle/cs725-f13/ Topic Objectives! Define perception! Distinguish between rods and cones in
An Information Theoretic Model of Saliency and Visual Search
 An Information Theoretic Model of Saliency and Visual Search Neil D.B. Bruce and John K. Tsotsos Department of Computer Science and Engineering and Centre for Vision Research York University, Toronto,
ELL 788 Computational Perception & Cognition July November 2015
 ELL 788 Computational Perception & Cognition July November 2015 Module 8 Audio and Multimodal Attention Audio Scene Analysis Two-stage process Segmentation: decomposition to time-frequency segments Grouping
Birds' Judgments of Number and Quantity
 Entire Set of Printable Figures For Birds' Judgments of Number and Quantity Emmerton Figure 1. Figure 2. Examples of novel transfer stimuli in an experiment reported in Emmerton & Delius (1993). Paired
Classification of Synapses Using Spatial Protein Data
 Classification of Synapses Using Spatial Protein Data Jenny Chen and Micol Marchetti-Bowick CS229 Final Project December 11, 2009 1 MOTIVATION Many human neurological and cognitive disorders are caused
VISUAL PERCEPTION & COGNITIVE PROCESSES
 VISUAL PERCEPTION & COGNITIVE PROCESSES Prof. Rahul C. Basole CS4460 > March 31, 2016 How Are Graphics Used? Larkin & Simon (1987) investigated usefulness of graphical displays Graphical visualization
Keywords Fuzzy Logic, Fuzzy Rule, Fuzzy Membership Function, Fuzzy Inference System, Edge Detection, Regression Analysis.
 Volume 6, Issue 3, March 2016 ISSN: 2277 128X International Journal of Advanced Research in Computer Science and Software Engineering Research Paper Available online at: www.ijarcsse.com Modified Fuzzy
International Journal of Computational Science, Mathematics and Engineering Volume2, Issue6, June 2015 ISSN(online): Copyright-IJCSME
: Copyright-IJCSME") Various Edge Detection Methods In Image Processing Using Matlab K. Narayana Reddy 1, G. Nagalakshmi 2 12 Department of Computer Science and Engineering 1 M.Tech Student, SISTK, Puttur 2 HOD of CSE Department,
Various Edge Detection Methods In Image Processing Using Matlab K. Narayana Reddy 1, G. Nagalakshmi 2 12 Department of Computer Science and Engineering 1 M.Tech Student, SISTK, Puttur 2 HOD of CSE Department,
Framework for Comparative Research on Relational Information Displays
 Framework for Comparative Research on Relational Information Displays Sung Park and Richard Catrambone 2 School of Psychology & Graphics, Visualization, and Usability Center (GVU) Georgia Institute of
Morton-Style Factorial Coding of Color in Primary Visual Cortex
 Morton-Style Factorial Coding of Color in Primary Visual Cortex Javier R. Movellan Institute for Neural Computation University of California San Diego La Jolla, CA 92093-0515 movellan@inc.ucsd.edu Thomas
Learning Utility for Behavior Acquisition and Intention Inference of Other Agent
 Learning Utility for Behavior Acquisition and Intention Inference of Other Agent Yasutake Takahashi, Teruyasu Kawamata, and Minoru Asada* Dept. of Adaptive Machine Systems, Graduate School of Engineering,
A Bag of Words Approach for Discriminating between Retinal Images Containing Exudates or Drusen
 A Bag of Words Approach for Discriminating between Retinal Images Containing Exudates or Drusen by M J J P Van Grinsven, Arunava Chakravarty, Jayanthi Sivaswamy, T Theelen, B Van Ginneken, C I Sanchez
EFFECTS OF NOISY DISTRACTORS AND STIMULUS REDUNDANCY ON VISUAL SEARCH. Laurence D. Smith University of Maine
 EFFECTS OF NOISY DISTRACTORS AND STIMULUS REDUNDANCY ON VISUAL SEARCH Laurence D. Smith University of Maine ldsmith@maine.maine.edu Ronald M. Pickett Marjan Trutschl Institute for Visualization and Perception
Reinforcement Learning : Theory and Practice - Programming Assignment 1
 Reinforcement Learning : Theory and Practice - Programming Assignment 1 August 2016 Background It is well known in Game Theory that the game of Rock, Paper, Scissors has one and only one Nash Equilibrium.
Hierarchical Bayesian Modeling of Individual Differences in Texture Discrimination
 Hierarchical Bayesian Modeling of Individual Differences in Texture Discrimination Timothy N. Rubin (trubin@uci.edu) Michael D. Lee (mdlee@uci.edu) Charles F. Chubb (cchubb@uci.edu) Department of Cognitive
FEATURE EXTRACTION USING GAZE OF PARTICIPANTS FOR CLASSIFYING GENDER OF PEDESTRIANS IN IMAGES
 FEATURE EXTRACTION USING GAZE OF PARTICIPANTS FOR CLASSIFYING GENDER OF PEDESTRIANS IN IMAGES Riku Matsumoto, Hiroki Yoshimura, Masashi Nishiyama, and Yoshio Iwai Department of Information and Electronics,
5.8 Departure from cognitivism: dynamical systems
 154 consciousness, on the other, was completely severed (Thompson, 2007a, p. 5). Consequently as Thompson claims cognitivism works with inadequate notion of cognition. This statement is at odds with practical
Chapter 5: Perceiving Objects and Scenes
 PSY382-Hande Kaynak, PhD 2/13/17 Chapter 5: Perceiving Objects and Scenes 1 2 Figure 5-1 p96 3 Figure 5-2 p96 4 Figure 5-4 p97 1 Why Is It So Difficult to Design a Perceiving Machine? The stimulus on the
Just One View: Invariances in Inferotemporal Cell Tuning
 Just One View: Invariances in Inferotemporal Cell Tuning Maximilian Riesenhuber Tomaso Poggio Center for Biological and Computational Learning and Department of Brain and Cognitive Sciences Massachusetts
Incorporation of Imaging-Based Functional Assessment Procedures into the DICOM Standard Draft version 0.1 7/27/2011
 Incorporation of Imaging-Based Functional Assessment Procedures into the DICOM Standard Draft version 0.1 7/27/2011 I. Purpose Drawing from the profile development of the QIBA-fMRI Technical Committee,
Edge Detection Techniques Using Fuzzy Logic
 Edge Detection Techniques Using Fuzzy Logic Essa Anas Digital Signal & Image Processing University Of Central Lancashire UCLAN Lancashire, UK eanas@uclan.a.uk Abstract This article reviews and discusses
Cognitive Penetrability and the Content of Perception
 Cognitive Penetrability and the Content of Perception Michela C. Tacca University of Düsseldorf Introduction Perception is modular; namely, its processes are not influenced by our knowledge, since they
Visual Selection and Attention
 Visual Selection and Attention Retrieve Information Select what to observe No time to focus on every object Overt Selections Performed by eye movements Covert Selections Performed by visual attention 2
Gene Selection for Tumor Classification Using Microarray Gene Expression Data
 Gene Selection for Tumor Classification Using Microarray Gene Expression Data K. Yendrapalli, R. Basnet, S. Mukkamala, A. H. Sung Department of Computer Science New Mexico Institute of Mining and Technology
Perceived similarity and visual descriptions in content-based image retrieval
 University of Wollongong Research Online Faculty of Informatics - Papers (Archive) Faculty of Engineering and Information Sciences 2007 Perceived similarity and visual descriptions in content-based image
Learning and Adaptive Behavior, Part II
 Learning and Adaptive Behavior, Part II April 12, 2007 The man who sets out to carry a cat by its tail learns something that will always be useful and which will never grow dim or doubtful. -- Mark Twain
Semi-Supervised Disentangling of Causal Factors. Sargur N. Srihari
 Semi-Supervised Disentangling of Causal Factors Sargur N. srihari@cedar.buffalo.edu 1 Topics in Representation Learning 1. Greedy Layer-Wise Unsupervised Pretraining 2. Transfer Learning and Domain Adaptation
Image Enhancement and Compression using Edge Detection Technique
 Image Enhancement and Compression using Edge Detection Technique Sanjana C.Shekar 1, D.J.Ravi 2 1M.Tech in Signal Processing, Dept. Of ECE, Vidyavardhaka College of Engineering, Mysuru 2Professor, Dept.
Visual Perception. Agenda. Visual perception. CS Information Visualization August 26, 2013 John Stasko. Pre-attentive processing Color Etc.
 Topic Notes Visual Perception CS 7450 - Information Visualization August 26, 2013 John Stasko Agenda Visual perception Pre-attentive processing Color Etc. Fall 2013 CS 7450 2 1 Semiotics The study of symbols
Unit 1 Exploring and Understanding Data
 Unit 1 Exploring and Understanding Data Area Principle Bar Chart Boxplot Conditional Distribution Dotplot Empirical Rule Five Number Summary Frequency Distribution Frequency Polygon Histogram Interquartile
Spatial Orientation Using Map Displays: A Model of the Influence of Target Location
 Gunzelmann, G., & Anderson, J. R. (2004). Spatial orientation using map displays: A model of the influence of target location. In K. Forbus, D. Gentner, and T. Regier (Eds.), Proceedings of the Twenty-Sixth
Quantitative Evaluation of Edge Detectors Using the Minimum Kernel Variance Criterion
 Quantitative Evaluation of Edge Detectors Using the Minimum Kernel Variance Criterion Qiang Ji Department of Computer Science University of Nevada Robert M. Haralick Department of Electrical Engineering
UC Merced Proceedings of the Annual Meeting of the Cognitive Science Society
 UC Merced Proceedings of the Annual Meeting of the Cognitive Science Society Title Top-down Planning and Bottom-up Perception in a Problem-solving Task Permalink https://escholarship.org/uc/item/7573d15j
Robot Behavior Genghis, MIT Callisto, GATech
 Robot Behavior Genghis, MIT Callisto, GATech Today s Objectives To learn what robotic behaviors are To obtain a basic understanding of the design approaches related to behavior-based robotic systems To
Goal-directed search with a top-down modulated computational attention system
 Goal-directed search with a top-down modulated computational attention system Simone Frintrop 1, Gerriet Backer 2, and Erich Rome 1 1 Fraunhofer Institut für Autonome Intelligente Systeme (AIS), Schloss