Describing Naturally Occurring Schedules: Analysis of Feedback Functions for Shooting During Basketball Games. A Thesis Presented
|
|
|
- Beryl Fleming
- 6 years ago
- Views:
Transcription
1 Describing Naturally Occurring Schedules: Analysis of Feedback Functions for Shooting During Basketball Games A Thesis Presented by Nicholas R. Vanselow The Department of Counseling and Applied Educational Psychology In partial fulfillment of the requirements for the degree of Master of Science in the field of Applied Behavior Analysis Northeastern University Boston, MA June 2010
2 NORTHEASTERN UNIVERSITY Bouvé College of Health Sciences Graduate School Thesis Title: Describing Naturally Occurring Schedules: Analysis of Feedback Functions for Shooting During Basketball Games Author: Nicholas Vanselow Department: Counseling and Applied Educational Psychology Approved for Thesis Requirements of Master of Science Degree Jason Bourret Bill Ahearn Chata Dickson
3 Describing Naturally Occurring Schedules: Analysis of Feedback Functions for Shooting During Basketball Games by Nicholas R. Vanselow B.A., University of Wisconsin-Eau Claire Submitted in partial fulfillment of the requirements for the degree of Master of Science in Applied Behavior Analysis in the Bouvé College of Health Sciences Graduate School of Northeastern University, June 2010
4 Acknowledgements I thank Jason Bourret for serving as my thesis chair and working with me to develop and write this project. I also thank William Ahearn and Chata Dickson for serving on my thesis committee. Both provided excellent feedback and guidance for the project. I thank Casey Clay for his input on Study 2 and assisting with conducting sessions and inter-observer agreement. I thank the New England Center for Children for allowing us to use their facilities to conduct sessions for the study.
5 Table of Contents A. Abstract...2 B. Introduction...3 C. Study a. Method...10 b. Results and Discussion...11 D. Study a. Participants...13 b. Setting and Materials...14 c. Procedures...14 d. Results and Discussion...15 E. Discussion...16 F. References...20 G. Table H. Table I. Table J. Figure Captions...25 K. Figure L. Figure M. Figure N. Figure
6 Describing Naturally Occurring Schedules 2 Abstract A number of recent studies have applied the matching law in analyzing behavior occurring in the context of sports including two- and three-point shot allocation by basketball players. This research contributes to our understanding of matching in that it suggests that the matching law may describe responding in naturally occurring human environments. However, because there is no experimental manipulation, the schedule in effect is unknown and it is unclear if obtained matching is a behavioral phenomenon (i.e., behavior conforming to relative reinforcement rates) or merely a relation between responding and reinforcement forced by ratio-like properties of the schedule. In the Study 1, both linear and hyperbolic feedback functions described the naturally occurring basketball shooting data; however data fell along a line which suggests responding was on a ratio schedule. In Study 2, an experiment was conducted in which the rate of basketball shooting was explicitly manipulated to generate a wider range of shooting rates than those observed in Study 1. For five of seven participants both equations described the data equally well and data fell along a linear path. For two participants the hyperbolic function more accurately described the data. Implications of these results for future descriptive analyses are discussed.
7 Describing Naturally Occurring Schedules 3 Describing Naturally Occurring Schedules: Analysis of Feedback Functions for Shooting During Basketball Games The Matching Law states that the relative rate of responding on two or more response alternatives will conform to match the relative rate of reinforcement available for responding on those alternatives. For example, if a variable interval (VI) 2-min schedule is arranged for a response key on the left and a VI 4 min is arranged for a response key on the right in an operant chamber, the matching law predicts that the organism will respond twice as often on the left key (VI 2 min) than the right key (VI 4 min). Baum (1974) proposed an equation which quantifies this relation and also describes bias and sensitivity to relative reinforcement rates. This equation is called the generalized matching law and is expressed quantitatively as: log log log (1) Where B 1 and B 2 are the response rates on two alternatives and r 1 and r 2 are the reinforcement rates for those alternatives. The variable s represents the slope of the line and refers to sensitivity to changes in reinforcement rate. When s is equal to 1, for each unit change in relative reinforcement rate there is an equal unit change in relative response rate. Most commonly, s is less than 1 (e.g., behavior is less sensitive to relative reinforcement rate than strict matching would predict) which is referred to as undermatching (Baum, 1979). The variable b represents bias which is an increase in response allocation toward one or the other alternative that is not due to different reinforcement schedules. Log b is the y intercept. If there is no bias, log b equals zero and response bias will shift the line up or down, changing the y intercept. The matching law has been well studied in the experimental laboratory with a variety of species, responses, and reinforcers. There is a growing body of applied literature as well. Researchers have applied matching theory to socially significant settings and behavior in two
8 Describing Naturally Occurring Schedules 4 ways to empirically validate its usefulness and generality. The first is by using the methods described in the experimental literature with socially significant behavior. In these studies, a reinforcer is identified and explicitly controlled by the experimenter to determine if response allocation matches reinforcer allocation. This method has been applied to social dynamics (Borrero, Crisolo, Tu, Rieland, Ross, Francisco, & Yamamoto, 2007), time spent working on math problems (e.g., Mace, Neef, Shade, & Mauro, 1994), and sensitivity to reinforcement in children with Attention Deficit Hyperactivity Disorder when taking methylphenidate compared to a placebo (Murray & Kollins, 2000). In all of these studies, the matching law accounted for much of the variance in response allocation. This suggests that in situations with two response alternatives, complex behavior, such as those involved in social dynamics, will conform to the relative rate of reinforcement obtained. The second way in which applied researchers have examined the generality of the matching law is in describing naturally-occurring response and reinforcer allocations. For example, Borrero and Vollmer (2002) described allocation of problem behavior and an alternative appropriate response according to the matching law. In this study, the maintaining reinforcer for problem behavior was identified via a functional analysis. After identifying the reinforcer, experimenters observed the participants interacting with care providers. The experimenters collected data on appropriate and inappropriate behavior and the occurrence of consequent events including those identified to be maintaining inappropriate behavior. Borrero and Vollmer (2002) found that allocation of inappropriate and appropriate responding was well described by the matching law when the identified reinforcer was used. When the nonreinforcers were used in the analysis there was no or limited matching. This study, unlike those
9 Describing Naturally Occurring Schedules 5 described previously, demonstrates the occurrence of matching with socially significant behavior in a natural setting and without explicitly controlling the reinforcement rate. Several studies have used sports as a context in which to evaluate the generality of matching in non-experimentally controlled environments. Examination of data from professional and collegiate sports, and basketball in particular, is convenient because the statistics are readily available, the responses (e.g., shooting) and reinforcers (e.g., points) are clearly defined, the reinforcer value stays consistent throughout the game, and the opportunity for two- or three-point shots at anytime approximates a concurrent choice arrangement (Vollmer & Bourret, 2000). An example of a line of research in this vein is a series of studies examining allocation of two- and three-point shot taking in professional and collegiate basketball. In this research, the points gained by successful shots were used as the assumed reinforcer. Vollmer and Bourret (2000) examined allocation of two- and three-point shots by collegiate male and female basketball players from a Division I University. The authors found, when accounting for the difference in amount of points earned for two- and three-point shots, the matching equation predicted the relative response ratio of shots taken. Romanowich, Bourret, and Vollmer (2007) replicated and extending these findings by examining three periods of time in professional basketball history in which the three-point line was moved closer and then moved back creating a naturally occurring reversal design. This type of manipulation might be expected to affect the reinforcement rate for three-point shots. When the authors compared the response ratios across the three time periods, they found that moving the line closer increased the relative rate of three-point shots compared to the first time period. When the line was moved further away again, the ratio of attempted three-point shots decreased again but not to the level observed during the first time period. For all three time periods, the
10 Describing Naturally Occurring Schedules 6 matching equation accounted for more than 95% of the variance in the observed data. This study provides further evidence suggesting matching between relative shooting rates and relative reinforcement rates in terms of the fit of the matching equation within each time period and the shift in responding and reinforcement rate across time periods is congruent with what an analysis of responding as a function of reinforcement rate would predict. The previous studies analyzing basketball statistics only examined data from very good teams. Alferink, Critchfield, Hitt, and Higgins (2009) evaluated response allocation of two- and three-point basketball shots for a variety of collegiate basketball teams to determine if better teams or players would better match relative reinforcement rate of two- and three-point shots better than worse teams or players. The authors found that the matching equation accounted for more variance for better players and teams than worse players and teams. In addition, sensitivity to changes in relative reinforcement rate was higher (closer to 1) for better teams and players. In Study 3, Alferink and colleagues (2009) examined data for a single player across seasons. The authors found that the matching equation still accounted for much of the variability in the data for a single player. The benefit of these descriptive analyses is that matching was found to occur in complex and uncontrolled natural environments. These data increase the robustness of the evidence supporting the matching law and suggest that its generality extends into these naturally occurring contexts. One problem with this research is that the schedule of reinforcement arranged for the responses is unknown unlike more controlled studies. In experimental research on the matching law, variable-interval (VI) schedules are typically used because the rate of behavior can vary widely without significantly affecting reinforcement rate. This is in comparison to variable-ratio (VR) schedules in which the rate of reinforcement is directly tied to the rate of behavior.
11 Describing Naturally Occurring Schedules 7 For example, if a pigeon pecks 50 times per minute on a VR 50 reinforcement schedule, then the pigeon will earn one reinforcer per minute. If the pigeon pecks 100 times per minute the pigeon will earn about two reinforcers per minute. However, on a VI 1-m schedule, if the pigeon pecks either 50 or 100 times per minute it will still only earn one reinforcer. In sports such as basketball, one might argue that the schedule of reinforcement for shooting baskets is, at least to some degree, ratio-like (Vollmer & Bourret, 2000). In other words, the more shots a player attempts, the more points the player will make. The concern, if basketball shooting is maintained on ratio schedule, is that the response rate would be determining the reinforcement rate and not vice versa. For example, if a player doubled the number of three point shots attempted in one game, tripled it in another, and quadrupled it in yet another, he or she might make double, triple, and quadruple the number of three point shots made in each game, respectively. This pattern of response and reinforcement rates may produce matching and it may appear as if behavior is conforming to changing reinforcement rates when, in fact, reinforcement rate is conforming to changes in shooting rates. If this were the case, there would only be matching in the sense of a mathematical relation between response and reinforcement rate but not in the behavioral sense of behavior being controlled by relative reinforcement rate. Therefore, it is important to evaluate what types of schedules are in place in the natural environment. If the rate of reinforcement increases linearly as the rate of responding increases, matching may be forced. However, if rate of reinforcement is a negatively-accelerated function of response rate (i.e., the rate of increase in reinforcement rate slows as response rate increases) and variation in response rate can occur without having a large impact on reinforcement rate observed matching is not necessitated by the schedule and may be considered to be a property of behavior.
12 Describing Naturally Occurring Schedules 8 Applying feedback functions to data are one method used to determine which type of schedule is in place in the natural environment. A feedback function is a mathematical equation which states the relation between rate of responding and rate of reinforcement (Baum, 1973). The equation for a ratio-like schedule (Baum, 1981) is: (2) In this equation r and B are reinforcement rate and response rate respectively. The value c is the average ratio value of the variable ratio schedule. Therefore, if the response rate is equal to 10 responses per minute, and the schedule arranged is a VR 2, then the rate of reinforcement (r) would be five reinforcers per min. The important property of this equation, especially when compared to the feedback function for interval schedules, is that there is a linear relation between response rate and the reinforcer rate. As response rate continues to increase, reinforcer rate will increase proportionally according to the schedule. The feedback function for interval schedules suggests a hyperbolic relation between reinforcer rate and response rate. Baum (1992) suggests three theoretical and empirical requirements of interval schedule feedback functions. There must be 1) a negatively accelerated slope that 2) approaches an asymptote equal to the programmed rate of reinforcement and 3) the slope of the equation at low response rates should be equal to one. This produces the equation suggested by Prelec and Herrnstein (1978 in Baum 1992) which states: / (3) In this equation, t is the value of the interval schedule and a is a free parameter which describes differences in the distribution of randomly selected interval values. This equation also produces a hyperbolic function such that, at response rates below the arranged reinforcer rate, the relation between responses and reinforcers is linear as in the ratio equation. For example, if a VI 1-min is
13 Describing Naturally Occurring Schedules 9 arranged, and the organism responds once every three min and earns one reinforcer every three minutes (.33 reinforcers per minute). During the next session, the organism responds more quickly at one response per minute there will be an increase in reinforcement rate to one reinforcer per minute. As response rates increase to the arranged schedule value, however, reinforcer rates asymptote at the average arranged interval value. For that same schedule, if the organism responds 10 times per min, the maximum rate of reinforcement will remain at one per min. More generally, at inter-response times (IRT) below the average inter-reinforcement interval (IRI), reinforcement rate increases quickly with increases in response rate. However, as the IRT increases to levels above the IRI, increases in reinforcement rate become smaller with increases in response rate. The schedule of reinforcement can be described by fitting these equations to the data. If the observed data fall along a straight line, and the linear or ratio feedback function fits the data better, then the schedule in the environment is ratio-like. However, if the increase in reinforcement rate slows at higher response rates and the hyperbolic or interval feedback function fits the data better, then the schedule in the environment is interval-like. Given the importance of the schedule in interpreting matching data, the purpose of this study is to use feedback functions to describe the schedule in effect for basketball shooting. In Study 1, archival data from the National Basketball Association (NBA) were analyzed. In Study 2, an experimental manipulation was conducted in which the rate of basketball shooting was controlled for volunteer participants in order to analyze the schedule of reinforcement across a greater range of shooting values.
14 Describing Naturally Occurring Schedules 10 Study 1 Method Archival data for eight professional male basketball players were obtained from the National Basketball Association website ( Data were obtained from the regular season. Data from the first eight players listed on the NBA website when the data were sorted according the three-point shot percentage that met inclusion criteria were selected. The participant must have attempted a 3-point shot and played at least 10 min in more than half of the games of the regular season to be included in the study. The years of professional play and position varied between participants. Participant A was a Guard and had played professionally for 13 years. Participants B and C were both in the NBA for six years and played Forward and Guard respectively. Participants D, E, F, G, and H had played professionally for two years. Participants D and H played Forward and Participants E, F, and G played Guard. Data for each player and all players combined were plotted with shots taken per min on the x-axis and points made per hour on the y-axis. Points made were calculated by multiplying the number of 2- and 3-point shots made by 2 and 3 respectively. The rates for shooting and points made were calculated by dividing the total 2- or 3- point shots taken or the points gained in a game divided by the total minutes played during that game. To determine whether the linear (Equation 2) or hyperbolic (Equation 3) feedback function more accurately described the data, lines of best fit were created using least-squares regression for each equation ( Coefficient of determination, 2010). The coefficient of determination was calculated for each line. The coefficient of determination (R 2 ), also often called variance accounted for, is a statistical measure used to describe the goodness of fit of an equation. However, R 2 may be inflated for the linear
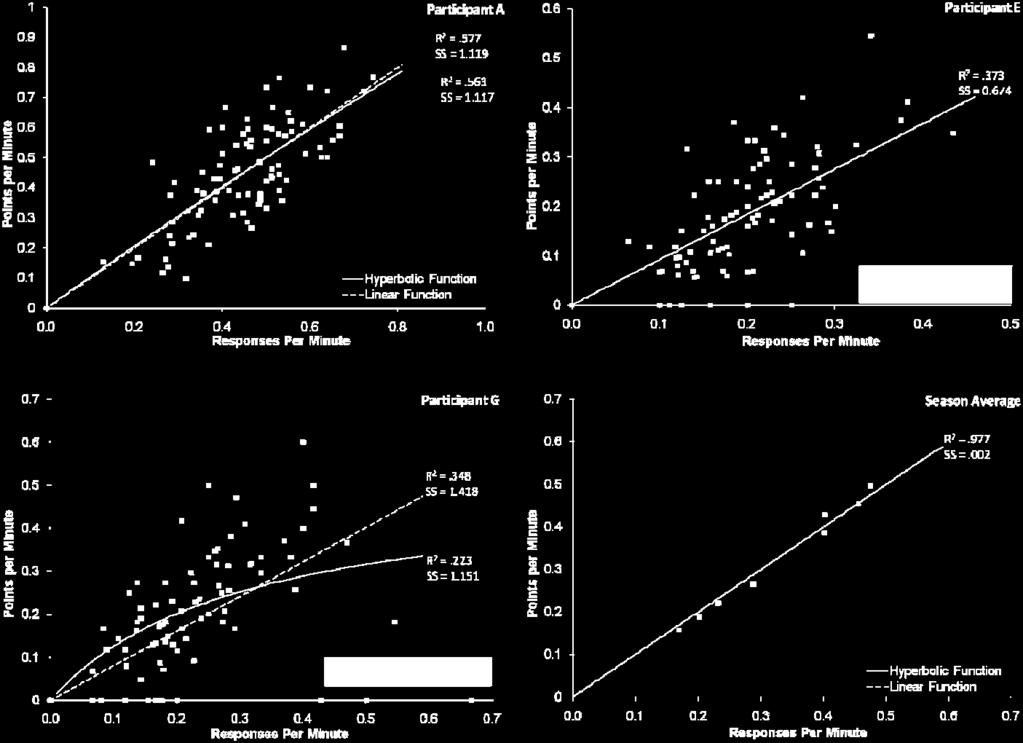
15 Describing Naturally Occurring Schedules 11 function because this function is forced through the origin. Therefore, in addition to R 2, the sumof-squares residual (SS res ) is provided for each line. While SS res is not a normalized measure, it provides a more direct description of the relative goodness of fit for these two functions fit to the same data. SS res is calculated by subtracting the value obtained by the value predicted by the equation and squaring the sum of differences. Results and Discussion Table 1 displays the coefficient of determination and sum-of-squares residual for 2-point shots for all players. Comparisons of best fit between the linear and hyperbolic function indicate that for all eight of the participants both the linear and hyperbolic feedback functions produced similar fits; however, a visual inspection reveals that the data fell along a linear path. These data suggest that a more ratio-like schedule may be occurring in the natural environment for basketball shooting for two point shots. An analysis of the season averages for 2-point shooting (Figure 1, bottom-right panel) results in a linear function form. Again, a visual analysis suggests data patterns which appear more linear than hyperbolic for two point shots. Figure 1 displays the data from three participants and an aggregation of data for all participants. The three individual data sets were chosen as representative of the three pattern types which were obtained across all participants. The top-left panel of Figure 1 exemplifies a pattern in which the function form for the linear and hyperbolic best fit line are nearly identical. This pattern occurred for five of the eight participants. All of the data falls along the linear portion of the hyperbolic function. The top-right panel of Figure 1 indicates a data pattern which resulted in identical fits for both the linear and hyperbolic function which was observed for two participants. This occurs when t in the hyperbolic function equals zero. In this case, c equals a which makes the two equations mathematically identical. The only case in which the R 2 for the hyperbolic function was more
16 Describing Naturally Occurring Schedules 12 than.1 different than the R 2 for the linear function was for Participant G (Figure 1, bottom left panel). However, because R 2 was very low (less than.5) for both equations, the difference between the two R 2 values was not meaningful. For 3-point shooting, linear feedback functions more accurately described the data for all eight of the eight participants and the data fall along a linear path. The best-fit lines for the aggregate data also suggest a linear function form for the data. Figure 2 displays the data from the same three players in Figure 1. In the bottom-right panel of Figure 2, each data point represents a season average for a player. Most players data conformed to patterns in the top-left and top-right panel of Figure 2. As response rate increased, reinforcement rate also increased for these players; however, variability in reinforcement rate also increased as response rate increased. This is demonstrated by the triangular pattern demonstrated by the data for these players. Across both 2- and 3-point shooting analyses, the R 2 for all players and aggregate data was low as shown in Tables 1 and 2. For individual players, R 2 averaged.465 (range,.348 to.578) and.420 (range,.223 to.564) for 2-point shooting for linear and hyperbolic functions respectively. For individual player s 3-point shots, R 2 averaged.402 (range,.341 to.497) and.396 (range,.315 to.497) for linear and hyperbolic functions respectively. These R 2 values are not uncommon for single player data evaluation by game (e.g., Reed, Critchfield, & Martens, 2006). However, in the bottom right panel of Figures 1 and 2, in which season means for each player are plotted, the fits are much better with R 2 values of.977 and.807 for the hyperbolic function for 2- and 3-point shooting respectively. These R 2 values are also consistent with other studies which utilized a similar level of analysis (e.g., Vollmer & Bourret, 2000).
17 Describing Naturally Occurring Schedules 13 While the fits for both equations were similar for the data collected in Study 1, a ratiolike schedule may be operating in the natural environment because the data fell along the linear portion of the hyperbolic function. However, this conclusion is tentative as the predominant difference between the two forms is the negatively-accelerated slope that reaches an asymptote for the hyperbolic function. At higher shooting rates, the linear function predicts increasing reinforcement rates, while the hyperbolic function predicts that reinforcement rate will remain nearly constant. Perhaps the rates of shooting obtained in Study 1 were not high enough to demonstrate the differences between the two equations. Study 2 was conducted to examine the schedule of reinforcement for basketball shooting at higher response rates to better determine if reinforcement rate continues to increase linearly or becomes negatively accelerated. Study 2 In Study 1, most of the data available fell along the linear portion of a hyperbolic function. In Study 2, an experiment was conducted in which shooting rates were controlled to produce higher rates than those rates observed during professional basketball games. Method Participants. Seven adults, four women and three men, participated in Study 2. Participants were in their mid to late twenties. Participants basketball experience varied from no previous structured basketball experience to playing on basketball teams in high school. Participant I was 29-years-old and had never played on an organized basketball team. Participant J was 27-years-old and also had never played on an organized basketball team. Participant K was 29-years-old and had started playing basketball on organized basketball teams for seven years at the youth and high school level. Participant L was 26-years-old and participated in youth basketball teams for three years. Participant M was 29-years-old and played for six years total
18 Describing Naturally Occurring Schedules 14 (four years in youth basketball and two years in high school basketball). Participant N was 24- years-old and had never played on an organized basketball team. Participant O was 26-years-old and played on an organized basketball teams for ten years (nine years on youth leagues and one year at the high school level). Participants were recruited based on interest and availability. Setting and Materials. All sessions took place in a small indoor gym with a basketball hoop. The basketball hoop was 3.05 m (10 ft) from the ground. Participants shot basketballs from a distance of 4.57 m (15 ft) from the far side of the basketball hoop. All participants, men and women, shot eight basketballs. The basketballs were cm (29.5 in) in circumference and weighed approximately 22 oz. Procedure. After participants arrived at the gym, the experimenter provided an informed consent form and asked the participants to review the form and ask any questions. The experimenter also verbally described the task and reminded participants that they could stop at any time. After the experimenter responded to any questions from the participant, the participant was encouraged to stretch, warm-up, and take some practice shots for approximately five min. Each participant shot twice at each of four arranged rates of shooting. During each session, the participant took 20 shots. The basketballs were located on a rack to the left of the participant. The participant would take a ball from the rack and then shoot. Balls were replaced into the rack by others in the gym to make sure a ball was always available to the participant. Shots were arranged to be taken at 7.5 per minute, 15 per minute, 30 per minute, and 60 per minute. The order of these sessions was determined randomly for each participant before the start of the session. To meet each of the shooting rates, the participant was informed to take a shot each time the whistle blew or the experimenter said, Shoot. For each session, the experimenter blew a whistle or said, Shoot at the rate prescribed for that session.
19 Describing Naturally Occurring Schedules 15 Data were collected on the session duration, the number of shots taken, and the number of shots made. The duration recording began at the first shot and ended after the twentieth shot was taken. To calculate the rate of shots and points, the total shots taken or points made was divided by the session duration. A shot was defined as a basketball leaving the participants hands. One point was counted for each basketball that passed through the basketball hoop after a shot was taken. Basketballs that entered and then bounced out of the basket but did not pass completely through the hoop were not counted as points. Inter-observer agreement (IOA) for shots and points was obtained during 38% of sessions and was 100%. IOA was calculated by counting the number of 10-s intervals in which each observer agreed exactly on the number of shots taken or points made divided by the total number of 10-s intervals multiplied by 100%. In some cases, due to the variation in session length, the last interval was less than 10 s in duration. Results and Discussion In Study 2, reinforcement rates at very high response rates were examined to determine if differences between the linear and hyperbolic feedback functions would be obtained at response rates higher than those observed in the data analyzed in Study 1. Figure 3 displays the data for each of seven participants. Similar to Study 1, for five of the seven participants, the hyperbolic and linear feedback function produced similar fits according to R 2 and SS res. As shown in Table 3, the average R 2 for the hyperbolic function was.601 (range,.025 to.918) compared to.646 (range,.180 to.915) for the linear function. However, for two participants (I and J), the hyperbolic equation better described the data. For these two participants, R 2 was higher and SS res was lower for the hyperbolic function than the linear function. A visual analysis of the data in Figure 3 confirms the conclusions of the coefficient of determination analysis. For five of the
20 Describing Naturally Occurring Schedules 16 seven participants, the data fall along a linear path. At higher response rates for participants I and J the data become negatively accelerated at higher response rates. The rates at the far right of the panels in Figure 3 are likely the highest rates. None of the participants were able to shoot at the arranged rate of 60 shots per min. The fastest rate across participants was approximately 41 shots per min. The individual data suggest ratio-like schedules at higher shooting rates due to the small difference in R 2 and SS res and the linear function form for most of the participants. Discussion The purpose of this study was to evaluate the application of feedback functions to describe the type of schedule in effect for basketball shooting. In Study 1 both equations produced similar fits for all participants. However, all of the data fell along the linear portion of the feedback functions which suggests a ratio-like schedule may be operating in this environment. In Study 2, a very artificial form of basketball playing was arranged to examine potential differences between the linear and hyperbolic feedback functions at higher rates of shooting. Study 2 provided some evidence that at a higher rate of shooting, there is a linear relation between rate of shooting and rate of points made; however, for two participants, as response rate increased, the increase in reinforcement rate became negatively accelerated. This type of function approximates that of an interval schedule. However, the primary schedule functioning in this context may still be ratio-like even though for two participants in the current study the feedback function more closely approximated what would be expected from an interval schedule. For example, the hyperbolic feedback function contained two free parameters and the linear equation only had one and a larger percentage of variance would be expected from an equation with more free parameters. Additionally, the negative acceleration in the feedback
21 Describing Naturally Occurring Schedules 17 functions at high response rates may have been a function of something other than the schedule. For example, at very high rates of shooting, such as those observed in Study 2, some part of the response topography may be altered such that shooting becomes less effective or variables such as fatigue may cause reinforcement rate to decrease. For example, when shooting at a low rate, the form of shot taker is very good. However, at high arranged response rates, participants began to hurl the ball toward the hoop as quickly as possible without regard to correct shooting form. The response topography shift may have resulted in reduced reinforcement rates. Also, at higher rates, the inter-response time between shots may not be sufficient for the entire shooting topography to occur which would result in less effective shots taken. These types of problems suggest that if shooters were trained to shoot at very high rates and became efficient shooters, than the outcome of the analysis may have been different. Over time, the response topography of rapid shooting may be shaped by the reinforcement contingency such that a linear relation between shooting and reinforcement rate would develop even at high rates. Although these examples may explain some occasions in a basketball game, there may be other events which produce interval-like schedules for shooting. For example, if a player is rapidly shooting at the three-point line, the defense may change to block more three-point shots. This change in defense might result in a decrease in the reinforcement rate for attempting three point shots at high rates. The events that occur in a basketball game that may produce an interval-like schedule may not have been present in the experimental arrangement in Study 2. Therefore, finding predominantly ratio-like schedule performance in Study 2 may not be surprising. However, for two participants, a negatively accelerated function was observed demonstrating that the arrangement in Study 2 may have been sensitive to interval-like properties of a schedule for shooting only. An additional analysis was conducted which superimposed VI
22 Describing Naturally Occurring Schedules 18 schedules onto the obtained data to determine the data patterns that may have been produced by an interval-like schedule. This analysis is displayed for Participant O in Figure 4. The reinforcement obtained was altered to match the VI schedule indicated in the upper-right corner of each graph. The only points (i.e., shots made) that counted toward the total were ones which would have been arranged if a VI schedule were operating. All of the shots taken were still counted. For example, if a VI 4 s schedule were operating, a point could only be made after 4 s had elapsed. If the participant made a point 2 s after the last point was made, that point would not count toward the total; however, a point made 6 s after the last point would count toward the total. As shown in Figure 4, as the interval in the VI schedule increased, the data become more negatively accelerated as rate increases. The SS residual reduces for the interval feedback function as the data become more hyperbolic as expected. However, R 2 remains larger for the ratio feedback function as the data become more hyperbolic. This is due to R 2 becoming inflated for the linear function because that function is forced through the origin. This analysis is useful for two reasons. First, it demonstrates the data patterns which might occur had a more predominantly interval-like schedule been operating in a basketball game. Second, it demonstrates the usefulness of SS residual in cases for which a linear function is forced through the origin. However, this analysis may not demonstrate data patterns that may occur if the schedule operating was a blended schedule. It may also be the case that the naturally occurring schedule is a blended schedule containing ratio- and interval-like properties. Even with a blended schedule it is likely that the dominant schedule type in the blended schedule would produce either a linear or hyperbolic function. For example, if the schedule operating were a Mixed VI VR schedule (i.e., the player waits for a clear shot to the hoop [VI] and then takes a shot [VR based on shot percentage]), the
23 Describing Naturally Occurring Schedules 19 hyperbolic feedback function would better describe the data. However, the majority of the current data suggest that the ratio-like properties of the schedule control most of the relation between responses and reinforcers due to the linear relation that occurs. The current data, overall, suggest that during a typical basketball game, the relation between shooting and points made may be linear such that the ratio-like features operating in the natural environment may control much of the reinforcement obtained. A linear relation between shooting rates and reinforcement rates creates a situation in which matching may be an artifact of the schedule operating in the natural environment rather than the allocation of behavior conforming to reinforcement rates such that the matching relation may be forced. Even though the linear relation may become less apparent at very high response rates, these rates are not common during typical basketball games. This finding suggests that researchers should be cautious in interpreting relations obtained during naturally occurring basketball games as examples of the process of matching and also that further research is needed on schedules in effect in non-experimentally controlled preparations before definitive conclusions are drawn from these data about the generality of the matching law.
24 Describing Naturally Occurring Schedules 20 References Alferink, L. A., Critchfield, T. S., Hitt, J. L., & Higgins, W. J. (2009). Generality of the matching law as a descriptor of shot selection in basketball. Journal of Applied Behavior Analysis, 42, Baum, W. M. (1992). In search of the feedback function for variable-interval schedules. Journal of the Experimental Analysis of Behavior, 57, Baum, W. M. (1979). Matching, undermatching, and overmatching in studies of choice. Journal of the Experimental Analysis of Behavior, 32, Baum, W. M. (1974). On two types of deviation from the matching law: Bias and undermatching. Journal of the Experimental Analysis of Behavior, 22, Baum, W. M. (1973). The correlation-based law of effect. Journal of the Experimental Analysis of Behavior, 20, Borrero, J. C., Crisolo, S. S., Tu, Q., Rieland, W. A., Ross, N. A., Francisco, M. T., & Yamamoto, K. Y. (2007). An application of the matching law to social dynamics. Journal of Applied Behavior Analysis, 40, Borrero, J. C., & Vollmer, T. R. (2002). An application of the matching law to severe problem behavior. Journal of Applied Behavior Analysis, 35, Coefficient of determination. (2009, November 16). In Wikipedia, the free encyclopedia. Retrieved December 1, 2009, from Critchfield, T. S., & Reed, D. D. (2009). What are we doing when we translate from quantitative models? The Behavior Analyst, 32,
25 Describing Naturally Occurring Schedules 21 Duvinsky, J. D., & Poppen, R. (1982). Human performance on conjunctive fixed-interval fixedratio schedules. Journal of the Experimental Analysis of Behavior, 37, Mace, F. C., Neef, N. A., Shade, D., & Mauro, B. C. (1994). Limited matching on concurrentschedule reinforcement of academic behavior. Journal of Applied Behavior Analysis, 27, Reed, D. D., Critchfield, T. S., & Martens, B. K. (2006). The generalized matching law in elite sport competition: Football play calling as operant choice. Journal of Applied Behavior Analysis, 39, Romanowich, P., Bourret, J., & Vollmer, T. R. (2007). Further analysis of the matching law to describe two- and three-point shot allocation by professional basketball players. Journal of Applied Behavior Analysis, 40, Vollmer, T. R., & Bourret, J. (2000). An application of the matching law to evaluate the allocation of two- and three-point shots by college basketball players. Journal of Applied Behavior Analysis, 33,
26 Describing Naturally Occurring Schedules 22 Table 1 R 2 and Parameter Values for 2-Point Shots for All NBA Players in Study 1 Linear Function Hyperbolic Function Player R 2 SS residual c R 2 SS residual t a A B C D E F G H Average
27 Describing Naturally Occurring Schedules 23 Table 2 R 2 and Parameter Values for 3-Point Shots for All NBA Players in Study 1 Linear Function Hyperbolic Function Player R 2 SS residual c R 2 SS residual t a A B C D E F G H Average
28 Describing Naturally Occurring Schedules 24 Table 3 R 2 and Parameter Values for All Participants in Study 2 Linear Function Hyperbolic Function Participant R 2 SS residual c R 2 SS residual t a I J K L M N O Average
29 Describing Naturally Occurring Schedules 25 Figure Captions Figure 1. Points per hour plotted against shots taken per minute for 2-point shots for three players (top left, top right, and bottom left panels). Each data point represents data for one player from one game. In the bottom right panel, each data point indicates the season average for a single participant. The solid line indicates the best fit line for the hyperbolic feedback function and the dashed line indicates the best fit line for the linear feedback function. A single line indicates that the hyperbolic and linear functions lie on top of each other. Figure 2. Points per hour plotted against shots taken per minute for 3-point shots for three players (top left, top right, and bottom left panels). Each data point represents data for one player from one game. In the bottom right panel, each data point indicates the season average for a single participant. The solid line indicates the best fit line for the hyperbolic feedback function and the dashed line indicates the best fit line for the linear feedback function. A single line indicates that the hyperbolic and linear functions lie on top of each other. Figure 3. Points per hour plotted against shots taken per minute for participants in Study 2. Black diamonds and white squares indicate data from first and second attempts at an arranged shooting rate respectively. The solid line indicates the best fit line for the hyperbolic feedback function and the dashed line indicates the best fit line for the linear feedback function. A single line indicates that the hyperbolic and linear functions lie on top of each other. Figure 4. Analysis of data from Participant O in Study 2 with different VI schedules superimposed upon the obtained data. The original data and fits are presented in the bottom-left panel of the figure with the VI schedule estimated by the hyperbolic feedback function displayed below the participant ID. The R 2 value for each equation is presented next to the respective function in the legend.

30


31

32

33
On applying the matching law to between-subject data
 On applying the matching law to between-subject data Pier-Olivier Caron To cite this version: Pier-Olivier Caron. On applying the matching law to between-subject data. Animal Behaviour, Elsevier Masson,
Effects of Increased Exposure to Training Trials with Children with Autism. A Thesis Presented. Melissa A. Ezold
 Effects of Increased Exposure to Training Trials with Children with Autism A Thesis Presented by Melissa A. Ezold The Department of Counseling and Applied Educational Psychology In partial fulfillment
DEFENSIVE PERFORMANCE AS A MODULATOR OF BIASED PLAY CALLING IN COLLEGIATE AMERICAN-RULES FOOTBALL
 REVISTA MEXICANA DE ANÁLISIS DE LA CONDUCTA MEXICAN JOURNAL OF BEHAVIOR ANALYSIS 2011 VOL. 37, 51-57 NÚMERO 3 (DICIEMBRE) NUMBER 3 (DECEMBER) DEFENSIVE PERFORMANCE AS A MODULATOR OF BIASED PLAY CALLING
Characterizing Response Reinforcer Relations in the Natural Environment: Exploratory
 The Psychological Record, 21,, 9 2 Characterizing Response Reinforcer Relations in the Natural Environment: Exploratory Matching Analyses Jolene R. Sy University of Florida John C. Borrero University of
Conditional Relations among Abstract Stimuli: Outcomes from Three Procedures- Variations of Go/no-go and Match-to-Sample. A Thesis Presented
 1 Conditional Relations among Abstract Stimuli: Outcomes from Three Procedures- Variations of Go/no-go and Match-to-Sample A Thesis Presented by Kimberly M. Walter The Department of Counseling and Applied
Simple Linear Regression the model, estimation and testing
 Simple Linear Regression the model, estimation and testing Lecture No. 05 Example 1 A production manager has compared the dexterity test scores of five assembly-line employees with their hourly productivity.
ASYMMETRY OF REINFORCEMENT AND PUNISHMENT IN HUMAN CHOICE ERIN B. RASMUSSEN AND M. CHRISTOPHER NEWLAND
 JOURNAL OF THE EXPERIMENTAL ANALYSIS OF BEHAVIOR 2008, 89, 157 167 NUMBER 2(MARCH) ASYMMETRY OF REINFORCEMENT AND PUNISHMENT IN HUMAN CHOICE ERIN B. RASMUSSEN AND M. CHRISTOPHER NEWLAND IDAHO STATE UNIVERSITY
STUDIES OF WHEEL-RUNNING REINFORCEMENT: PARAMETERS OF HERRNSTEIN S (1970) RESPONSE-STRENGTH EQUATION VARY WITH SCHEDULE ORDER TERRY W.
 RESPONSE-STRENGTH EQUATION VARY WITH SCHEDULE ORDER TERRY W.") JOURNAL OF THE EXPERIMENTAL ANALYSIS OF BEHAVIOR 2000, 73, 319 331 NUMBER 3(MAY) STUDIES OF WHEEL-RUNNING REINFORCEMENT: PARAMETERS OF HERRNSTEIN S (1970) RESPONSE-STRENGTH EQUATION VARY WITH SCHEDULE
JOURNAL OF THE EXPERIMENTAL ANALYSIS OF BEHAVIOR 2000, 73, 319 331 NUMBER 3(MAY) STUDIES OF WHEEL-RUNNING REINFORCEMENT: PARAMETERS OF HERRNSTEIN S (1970) RESPONSE-STRENGTH EQUATION VARY WITH SCHEDULE
Determining the Reinforcing Value of Social Consequences and Establishing. Social Consequences as Reinforcers. A Thesis Presented. Hilary A.
 Determining the Reinforcing Value of Social Consequences and Establishing Social Consequences as Reinforcers A Thesis Presented by Hilary A. Gibson The Department of Counseling and Applied Educational
Running Head: BEHAVIORAL ECONOMIC ANALYSIS OF CHOICE. A Behavioral Economic Analysis of Choice. A Thesis Presented. Jamie Leigh Lebowitz
 Choice 1 Running Head: BEHAVIORAL ECONOMIC ANALYSIS OF CHOICE A Behavioral Economic Analysis of Choice A Thesis Presented By Jamie Leigh Lebowitz The Department of Counseling and Applied Educational Psychology
on both components of conc Fl Fl schedules, c and a were again less than 1.0. FI schedule when these were arranged concurrently.
 JOURNAL OF THE EXPERIMENTAL ANALYSIS OF BEHAVIOR 1975, 24, 191-197 NUMBER 2 (SEPTEMBER) PERFORMANCE IN CONCURRENT INTERVAL SCHEDULES: A SYSTEMATIC REPLICATION' BRENDA LOBB AND M. C. DAVISON UNIVERSITY
The Matching Law. Definitions. Herrnstein (1961) 20/03/15. Erik Arntzen HiOA Mars, 2015
 20/03/15. Erik Arntzen HiOA Mars, 2015") The Matching Law Erik Arntzen HiOA Mars, 2015 1 Definitions The Matching Law states that responses are allocated to the richest reinforcement schedules. The Matching Law has been shown in both nonhumans
The Matching Law Erik Arntzen HiOA Mars, 2015 1 Definitions The Matching Law states that responses are allocated to the richest reinforcement schedules. The Matching Law has been shown in both nonhumans
Overview. Simple Schedules of Reinforcement. Important Features of Combined Schedules of Reinforcement. Combined Schedules of Reinforcement BEHP 1016
 BEHP 1016 Why People Often Make Bad Choices and What to Do About It: Important Features of Combined Schedules of Reinforcement F. Charles Mace, Ph.D., BCBA-D University of Southern Maine with Jose Martinez-Diaz,
Unit 1 Exploring and Understanding Data
 Unit 1 Exploring and Understanding Data Area Principle Bar Chart Boxplot Conditional Distribution Dotplot Empirical Rule Five Number Summary Frequency Distribution Frequency Polygon Histogram Interquartile
Comparison of Direct and Indirect Reinforcement Contingencies on Task Acquisition. A Thesis Presented. Robert Mark Grant
 Comparison of Direct and Indirect Reinforcement Contingencies on Task Acquisition A Thesis Presented By Robert Mark Grant In partial fulfillment of the requirements for the degree of Master of Science
Assessing the Effects of Matched and Unmatched Stimuli on the Persistence of Stereotypy. A Thesis Presented. Sarah Scamihorn
 Assessing the Effects of Matched and Unmatched Stimuli on the Persistence of Stereotypy A Thesis Presented by Sarah Scamihorn The Department of Counseling and Applied Educational Psychology In partial
On the empirical status of the matching law : Comment on McDowell (2013)
") On the empirical status of the matching law : Comment on McDowell (2013) Pier-Olivier Caron To cite this version: Pier-Olivier Caron. On the empirical status of the matching law : Comment on McDowell (2013):
On the empirical status of the matching law : Comment on McDowell (2013) Pier-Olivier Caron To cite this version: Pier-Olivier Caron. On the empirical status of the matching law : Comment on McDowell (2013):
UF#Stats#Club#STA#2023#Exam#1#Review#Packet# #Fall#2013#
 UF#Stats#Club#STA##Exam##Review#Packet# #Fall## The following data consists of the scores the Gators basketball team scored during the 8 games played in the - season. 84 74 66 58 79 8 7 64 8 6 78 79 77
Concurrent schedule responding as a function ofbody weight
 Animal Learning & Behavior 1975, Vol. 3 (3), 264-270 Concurrent schedule responding as a function ofbody weight FRANCES K. McSWEENEY Washington State University, Pullman, Washington 99163 Five pigeons
A Memory Model for Decision Processes in Pigeons
 From M. L. Commons, R.J. Herrnstein, & A.R. Wagner (Eds.). 1983. Quantitative Analyses of Behavior: Discrimination Processes. Cambridge, MA: Ballinger (Vol. IV, Chapter 1, pages 3-19). A Memory Model for
Examining the Constant Difference Effect in a Concurrent Chains Procedure
 University of Wisconsin Milwaukee UWM Digital Commons Theses and Dissertations May 2015 Examining the Constant Difference Effect in a Concurrent Chains Procedure Carrie Suzanne Prentice University of Wisconsin-Milwaukee
Comparing Two Procedures to Teach Conditional Discriminations: Simple Discriminations With and Without S- Stimuli Present. A Thesis Presented
 1 Comparing Two Procedures to Teach Conditional Discriminations: Simple Discriminations With and Without S- Stimuli Present A Thesis Presented by Lindsey M. Ryan The Department of Counseling and Applied
k/2. Thus, Re is measured in the same units
 JOURNAL OF THE EXPERIMENTAL ANALYSIS OF BEHAVIOR INCREASING AND SIGNALING BACKGROUND REINFORCEMENT: EFFECT ON THE FOREGROUND RESPONSE-REINFORCER RELATION TERRY W. BELKE AND GENE M. HEYMAN HARVARD UNIVERSITY
POST-HOC ANALYSIS OF CHALLENGING BEHAVIOR BY FUNCTION: A COMPARISON OF MULTIPLE-RESPONDENT ANECDOTAL ASSESSMENTS, FUNCTIONAL ANALYSES, AND TREATMENTS
 POST-HOC ANALYSIS OF CHALLENGING BEHAVIOR BY FUNCTION: A COMPARISON OF MULTIPLE-RESPONDENT ANECDOTAL ASSESSMENTS, FUNCTIONAL ANALYSES, AND TREATMENTS Kathleen Dignan, B.S. Thesis Prepared for the Degree
MULTIPLE LINEAR REGRESSION 24.1 INTRODUCTION AND OBJECTIVES OBJECTIVES
 24 MULTIPLE LINEAR REGRESSION 24.1 INTRODUCTION AND OBJECTIVES In the previous chapter, simple linear regression was used when you have one independent variable and one dependent variable. This chapter
CAROL 0. ECKERMAN UNIVERSITY OF NORTH CAROLINA. in which stimulus control developed was studied; of subjects differing in the probability value
 JOURNAL OF THE EXPERIMENTAL ANALYSIS OF BEHAVIOR 1969, 12, 551-559 NUMBER 4 (JULY) PROBABILITY OF REINFORCEMENT AND THE DEVELOPMENT OF STIMULUS CONTROL' CAROL 0. ECKERMAN UNIVERSITY OF NORTH CAROLINA Pigeons
GENERATING VARIABLE AND RANDOM SCHEDULES OF REINFORCEMENT USING MICROSOFT EXCEL MACROS STACIE L. BANCROFT AND JASON C. BOURRET
 JOURNAL OF APPLIED BEHAVIOR ANALYSIS 2008, 41, 227 235 NUMBER 2(SUMMER 2008) GENERATING VARIABLE AND RANDOM SCHEDULES OF REINFORCEMENT USING MICROSOFT EXCEL MACROS STACIE L. BANCROFT AND JASON C. BOURRET
Results & Statistics: Description and Correlation. I. Scales of Measurement A Review
 Results & Statistics: Description and Correlation The description and presentation of results involves a number of topics. These include scales of measurement, descriptive statistics used to summarize
Everything DiSC 363 for Leaders. Research Report. by Inscape Publishing
 Everything DiSC 363 for Leaders Research Report by Inscape Publishing Introduction Everything DiSC 363 for Leaders is a multi-rater assessment and profile that is designed to give participants feedback
Chapter 3 CORRELATION AND REGRESSION
 CORRELATION AND REGRESSION TOPIC SLIDE Linear Regression Defined 2 Regression Equation 3 The Slope or b 4 The Y-Intercept or a 5 What Value of the Y-Variable Should be Predicted When r = 0? 7 The Regression
Operant matching. Sebastian Seung 9.29 Lecture 6: February 24, 2004
 MIT Department of Brain and Cognitive Sciences 9.29J, Spring 2004 - Introduction to Computational Neuroscience Instructor: Professor Sebastian Seung Operant matching Sebastian Seung 9.29 Lecture 6: February
Human Schedule Performance with Hypothetical Monetary Reinforcement
 EUROPEAN JOURNAL OF BEHAVIOR ANALYSIS 2001, 2, 225-234 NUMBER 2 (WINTER 2001)225 Human Schedule Performance with Hypothetical Monetary Reinforcement University College London, UK Experiments examined the
The effects of two different states of food deprivation for 6 roosters was measured with a
 Effects of Food Deprivation on Memory Performance. Jacob. L. Kerewaro Abstract The effects of two different states of food deprivation for 6 roosters was measured with a delayed matching-to-sample (DMTS)
Exemplar for Internal Assessment Resource Mathematics Level 3. Resource title: Sport Science. Investigate bivariate measurement data
 Exemplar for internal assessment resource Mathematics 3.9A for Achievement Standard 91581 Exemplar for Internal Assessment Resource Mathematics Level 3 Resource title: Sport Science This exemplar supports
Law of effect models and choice between many alternatives
 University of Wollongong Research Online Australian Health Services Research Institute Faculty of Business 2013 Law of effect models and choice between many alternatives Michael Alexander Navakatikyan
IAPT: Regression. Regression analyses
 Regression analyses IAPT: Regression Regression is the rather strange name given to a set of methods for predicting one variable from another. The data shown in Table 1 and come from a student project
Supplementary Materials
 Supplementary Materials Supplementary Figure S1: Data of all 106 subjects in Experiment 1, with each rectangle corresponding to one subject. Data from each of the two identical sub-sessions are shown separately.
MCAS Equating Research Report: An Investigation of FCIP-1, FCIP-2, and Stocking and. Lord Equating Methods 1,2
 MCAS Equating Research Report: An Investigation of FCIP-1, FCIP-2, and Stocking and Lord Equating Methods 1,2 Lisa A. Keller, Ronald K. Hambleton, Pauline Parker, Jenna Copella University of Massachusetts
Sum of responding as a function of sum of reinforcement on two-key concurrent schedules
 Animal Learning & Behavior 1977, 5 (1),11-114 Sum of responding as a function of sum of reinforcement on two-key concurrent schedules FRANCES K. McSWEENEY Washington State University, Pul/man, Washington
Lesson 1: Distributions and Their Shapes
 Lesson 1 Name Date Lesson 1: Distributions and Their Shapes 1. Sam said that a typical flight delay for the sixty BigAir flights was approximately one hour. Do you agree? Why or why not? 2. Sam said that
Preference, Resistance to Change, and Qualitatively Different Reinforcers
 Utah State University DigitalCommons@USU All Graduate Theses and Dissertations Graduate Studies 5-2008 Preference, Resistance to Change, and Qualitatively Different Reinforcers Christopher Aaron Podlesnik
PIGEONS CHOICES BETWEEN FIXED-RATIO AND LINEAR OR GEOMETRIC ESCALATING SCHEDULES PAUL NEUMAN, WILLIAM H. AHEARN, AND PHILIP N.
 JOURNAL OF THE EXPERIMENTAL ANALYSIS OF BEHAVIOR 2000, 73, 93 102 NUMBER 1(JANUARY) PIGEONS CHOICES BETWEEN FIXED-RATIO AND LINEAR OR GEOMETRIC ESCALATING SCHEDULES PAUL NEUMAN, WILLIAM H. AHEARN, AND
CRITERIA FOR USE. A GRAPHICAL EXPLANATION OF BI-VARIATE (2 VARIABLE) REGRESSION ANALYSISSys
 REGRESSION ANALYSISSys") Multiple Regression Analysis 1 CRITERIA FOR USE Multiple regression analysis is used to test the effects of n independent (predictor) variables on a single dependent (criterion) variable. Regression tests
Multiple Regression Analysis 1 CRITERIA FOR USE Multiple regression analysis is used to test the effects of n independent (predictor) variables on a single dependent (criterion) variable. Regression tests
Statistical Methods and Reasoning for the Clinical Sciences
 Statistical Methods and Reasoning for the Clinical Sciences Evidence-Based Practice Eiki B. Satake, PhD Contents Preface Introduction to Evidence-Based Statistics: Philosophical Foundation and Preliminaries
Regression Including the Interaction Between Quantitative Variables
 Regression Including the Interaction Between Quantitative Variables The purpose of the study was to examine the inter-relationships among social skills, the complexity of the social situation, and performance
The Effects of Video Modeling on New Staff Training. of Discrete Trial Instruction. A thesis presented. Tamarra Forbes
 The Effects of Video Modeling on New Staff Training of Discrete Trial Instruction A thesis presented by Tamarra Forbes The Department of Counseling and Applied Educational Psychology In partial fulfillment
Section 3.2 Least-Squares Regression
 Section 3.2 Least-Squares Regression Linear relationships between two quantitative variables are pretty common and easy to understand. Correlation measures the direction and strength of these relationships.
Faculty of Physical Education & Sport Sciences, Diala University. Seif El Din Watheq :
 THE EFFECT OF COMPARATIVE COMPETITION METHOD DUE TO SOME KINEMATIC VARIABLES ON CORRECTING SOME MOTOR PERFORMANCE ERRORS IN SHOOTING FROM OVERHEAD FOR THE 3RD STAGE STUDENTS Shaimaa Sami Shehab a Seif
ABSTRACT. Address for correspondence: Alaa Ibrahim Jasim, Ministry of Education, Diala Education Directorate.
 Original Article The Effect of Competition Training on Developing Motor Energy of some Requirements of Skill Performance and Assertive Behavior for Handball Players of the Specialist Center in Diala Alaa
Jennifer J. McComas and Ellie C. Hartman. Angel Jimenez
 The Psychological Record, 28, 58, 57 528 Some Effects of Magnitude of Reinforcement on Persistence of Responding Jennifer J. McComas and Ellie C. Hartman The University of Minnesota Angel Jimenez The University
Regression CHAPTER SIXTEEN NOTE TO INSTRUCTORS OUTLINE OF RESOURCES
 CHAPTER SIXTEEN Regression NOTE TO INSTRUCTORS This chapter includes a number of complex concepts that may seem intimidating to students. Encourage students to focus on the big picture through some of
Instrumental Conditioning I
 Instrumental Conditioning I Basic Procedures and Processes Instrumental or Operant Conditioning? These terms both refer to learned changes in behavior that occur as a result of the consequences of the
Differential Reinforcement of Prompted and Independent Responses: An Alternative. Procedure to Decrease Prompt Dependency. A Thesis Presented
 Differential Reinforcement of Prompted and Independent Responses: An Alternative Procedure to Decrease Prompt Dependency A Thesis Presented by Catia Cividini-Motta The Department of Counseling and Applied
Discrimination and Generalization in Pattern Categorization: A Case for Elemental Associative Learning
 Discrimination and Generalization in Pattern Categorization: A Case for Elemental Associative Learning E. J. Livesey (el253@cam.ac.uk) P. J. C. Broadhurst (pjcb3@cam.ac.uk) I. P. L. McLaren (iplm2@cam.ac.uk)
SUPPLEMENTAL MATERIAL
 1 SUPPLEMENTAL MATERIAL Response time and signal detection time distributions SM Fig. 1. Correct response time (thick solid green curve) and error response time densities (dashed red curve), averaged across
Determining the Optimal Sampling Method to Estimate the Mean and Standard Deviation of Pig Body Weights Within a Population 1,2
 Determining the Optimal Sampling Method to Estimate the Mean and Standard Deviation of Pig Body Weights Within a Population 1,2 C.B. Paulk, M.D. Tokach, S.S. Dritz 3, J.L. Nelssen, J.M. DeRouchey, and
Steps to writing a lab report on: factors affecting enzyme activity
 Steps to writing a lab report on: factors affecting enzyme activity This guide is designed to help you write a simple, straightforward lab report. Each section of the report has a number of steps. By completing
Chapter 2 Norms and Basic Statistics for Testing MULTIPLE CHOICE
 Chapter 2 Norms and Basic Statistics for Testing MULTIPLE CHOICE 1. When you assert that it is improbable that the mean intelligence test score of a particular group is 100, you are using. a. descriptive
Strength and Conditioning for Basketball. Jan Legg. Coaches Conference /13/2016
 Strength and Conditioning for Basketball Jan Legg 5/13/2016 Coaches Conference 2016 1 Strength and Conditioning (S&C) with the Opals and Centre of Excellence (COE). Working within a service team. Practical
THE POWER OF ONE REINFORCER. Mary E. Hunter, B.A. Thesis Prepared for the Degree of MASTER OF SCIENCE UNIVERSITY OF NORTH TEXAS. August 2013 APPROVED:
 THE POWER OF ONE REINFORCER Mary E. Hunter, B.A. Thesis Prepared for the Degree of MASTER OF SCIENCE UNIVERSITY OF NORTH TEXAS August 2013 APPROVED: Jesús Rosales-Ruiz, Major Professor Jonathan Pinkston,
12/31/2016. PSY 512: Advanced Statistics for Psychological and Behavioral Research 2
 PSY 512: Advanced Statistics for Psychological and Behavioral Research 2 Introduce moderated multiple regression Continuous predictor continuous predictor Continuous predictor categorical predictor Understand
Measuring the User Experience
 Measuring the User Experience Collecting, Analyzing, and Presenting Usability Metrics Chapter 2 Background Tom Tullis and Bill Albert Morgan Kaufmann, 2008 ISBN 978-0123735584 Introduction Purpose Provide
Quantitative analyses of methamphetamine s effects on self-control choices: implications for elucidating behavioral mechanisms of drug action
 Behavioural Processes 66 (2004) 213 233 Quantitative analyses of methamphetamine s effects on self-control choices: implications for elucidating behavioral mechanisms of drug action Raymond C. Pitts, Stacy
LAB 1: MOTOR LEARNING & DEVELOPMENT REACTION TIME AND MEASUREMENT OF SKILLED PERFORMANCE. Name: Score:
 LAB 1: MOTOR LEARNING & DEVELOPMENT REACTION TIME AND MEASUREMENT OF SKILLED PERFORMANCE Name: Score: Part I: Reaction Time Environments Introduction: Reaction time is a measure of how long it takes a
Chapter 3: Describing Relationships
 Chapter 3: Describing Relationships Objectives: Students will: Construct and interpret a scatterplot for a set of bivariate data. Compute and interpret the correlation, r, between two variables. Demonstrate
Running head: EVALUATING INHIBITORY STIMULUS CONTROL. Increasing the Reinforcing Efficacy of Low-Preference Teachers and Caretakers
 Reinforcing Efficacy 1 Running head: EVALUATING INHIBITORY STIMULUS CONTROL Increasing the Reinforcing Efficacy of Low-Preference Teachers and Caretakers for Individuals Diagnosed with Developmental Disabilities
THE EFFECTS OF TERMINAL-LINK STIMULUS ARRANGEMENTS ON PREFERENCE IN CONCURRENT CHAINS. LAUREL COLTON and JAY MOORE University of Wisconsin-Milwaukee
 The Psychological Record, 1997,47,145-166 THE EFFECTS OF TERMINAL-LINK STIMULUS ARRANGEMENTS ON PREFERENCE IN CONCURRENT CHAINS LAUREL COLTON and JAY MOORE University of Wisconsin-Milwaukee Pigeons served
Chapter 2--Norms and Basic Statistics for Testing
 Chapter 2--Norms and Basic Statistics for Testing Student: 1. Statistical procedures that summarize and describe a series of observations are called A. inferential statistics. B. descriptive statistics.
Further Mathematics 2018 CORE: Data analysis Chapter 3 Investigating associations between two variables
 Chapter 3: Investigating associations between two variables Further Mathematics 2018 CORE: Data analysis Chapter 3 Investigating associations between two variables Extract from Study Design Key knowledge
Week 17 and 21 Comparing two assays and Measurement of Uncertainty Explain tools used to compare the performance of two assays, including
 Week 17 and 21 Comparing two assays and Measurement of Uncertainty 2.4.1.4. Explain tools used to compare the performance of two assays, including 2.4.1.4.1. Linear regression 2.4.1.4.2. Bland-Altman plots
CHAPTER TWO REGRESSION
 CHAPTER TWO REGRESSION 2.0 Introduction The second chapter, Regression analysis is an extension of correlation. The aim of the discussion of exercises is to enhance students capability to assess the effect
Chapter 3: Examining Relationships
 Name Date Per Key Vocabulary: response variable explanatory variable independent variable dependent variable scatterplot positive association negative association linear correlation r-value regression
BY: Bernard L. Cohen University of Pittsburgh. Pittsburgh, PA ABSTRACT
 CORRELATION BETWEEN MEAN RADON LEVELS AND LUNG CANCER RATES IN U.S. COUNTIES A TEST OF THE LINEAR - NO THRESHOLD THEORY BY: Bernard L. Cohen University of Pittsburgh. Pittsburgh, PA 15260 ABSTRACT Mean
Comparability Study of Online and Paper and Pencil Tests Using Modified Internally and Externally Matched Criteria
 Comparability Study of Online and Paper and Pencil Tests Using Modified Internally and Externally Matched Criteria Thakur Karkee Measurement Incorporated Dong-In Kim CTB/McGraw-Hill Kevin Fatica CTB/McGraw-Hill
The Jumping Dog Quadratic Activity
 Standards: The Jumping Dog Quadratic Activity A2.4.1 Identify the family of function best suited for modeling a given real-world situation. A2.4.3 Using the adapted general symbolic form, draw reasonable
Behavioral Persistence of Stereotypy. A Thesis Presented. Joseph Michael Lambert. The Department of Counseling and Applied Educational Psychology
 The Effects of Matched and Unmatched Stimulation on the Behavioral Persistence of Stereotypy A Thesis Presented by Joseph Michael Lambert The Department of Counseling and Applied Educational Psychology
Correlational Research. Correlational Research. Stephen E. Brock, Ph.D., NCSP EDS 250. Descriptive Research 1. Correlational Research: Scatter Plots
 Correlational Research Stephen E. Brock, Ph.D., NCSP California State University, Sacramento 1 Correlational Research A quantitative methodology used to determine whether, and to what degree, a relationship
Clinical Pharmacology. Pharmacodynamics the next step. Nick Holford Dept Pharmacology & Clinical Pharmacology University of Auckland, New Zealand
 1 Pharmacodynamic Principles and the Course of Immediate Drug s Nick Holford Dept Pharmacology & Clinical Pharmacology University of Auckland, New Zealand The time course of drug action combines the principles
HW 3.2: page 193 #35-51 odd, 55, odd, 69, 71-78
 35. What s My Line? You use the same bar of soap to shower each morning. The bar weighs 80 grams when it is new. Its weight goes down by 6 grams per day on average. What is the equation of the regression
Cross-Lagged Panel Analysis
 Cross-Lagged Panel Analysis Michael W. Kearney Cross-lagged panel analysis is an analytical strategy used to describe reciprocal relationships, or directional influences, between variables over time. Cross-lagged
A Comparison of Methods for Teaching Object Imitation: In-Vivo versus Video Modeling. A Thesis Presented. Amy N. Wick
 Imitation 1 A Comparison of Methods for Teaching Object Imitation: In-Vivo versus Video Modeling A Thesis Presented by Amy N. Wick The Department of Counseling and Applied Educational Psychology In partial
CORRELATED DELAY OF REINFORCEMENT 1
 Journal of Comparative and Physiological Psychology 1961, Vol. 54, No. 2, 196-203 CRRELATED DELAY F REINFRCEMENT 1 It is well established that variations in an operant response can be differentiated by
STATISTICS INFORMED DECISIONS USING DATA
 STATISTICS INFORMED DECISIONS USING DATA Fifth Edition Chapter 4 Describing the Relation between Two Variables 4.1 Scatter Diagrams and Correlation Learning Objectives 1. Draw and interpret scatter diagrams
CURRENT RESEARCH IN SOCIAL PSYCHOLOGY
 CURRENT RESEARCH IN SOCIAL PSYCHOLOGY Volume 6, Number 2 Submitted: September 8, 2000 Resubmitted: January 22, 2001 Accepted: January 23, 2001 Publication date: January 26, 2001 THE EFFICACY OF REINFORCEMENT
Verbal Reasoning: Technical information
 Verbal Reasoning: Technical information Issues in test construction In constructing the Verbal Reasoning tests, a number of important technical features were carefully considered by the test constructors.
11/18/2013. Correlational Research. Correlational Designs. Why Use a Correlational Design? CORRELATIONAL RESEARCH STUDIES
 Correlational Research Correlational Designs Correlational research is used to describe the relationship between two or more naturally occurring variables. Is age related to political conservativism? Are
Experiment Design 9/17/2015. Mini summary of Green & Bavelier
 Experiment Design Main Parameters Experimental design is not a linear Independent Variable planning process What will you manipulate either between subjects or within subjects? Task What will subjects
Resistance-Training Program
 Resistance-Training Program Training for a Defensive Midfield Soccer Player Isaac Bahena - April 21, 2015 TRAINING PROGRAM FOR DEFENSIVE MID. 1 Introduction I have decided to project on my brother Nelson
Results of the Pickleball Player Survey December 2013
 Results of the Pickleball Player Survey December 2013 As part of an ongoing effort to help grow the sport of pickleball, we conducted a survey earlier this year to improve understanding of athletes motivation
Geneva CUSD 304 Content-Area Curriculum Frameworks Grades 6-12
 Geneva CUSD 304 Content-Area Curriculum Frameworks Grades 6-12 Team Sports Course Title Grade Level Semesters (1-2-3-4) Prerequisite Team Sports 9 th Grade 1 None Course Description Freshmen are required
Describe what is meant by a placebo Contrast the double-blind procedure with the single-blind procedure Review the structure for organizing a memo
 Business Statistics The following was provided by Dr. Suzanne Delaney, and is a comprehensive review of Business Statistics. The workshop instructor will provide relevant examples during the Skills Assessment
Schedule Induced Polydipsia: Effects of Inter-Food Interval on Access to Water as a Reinforcer
 Western Michigan University ScholarWorks at WMU Master's Theses Graduate College 8-1974 Schedule Induced Polydipsia: Effects of Inter-Food Interval on Access to Water as a Reinforcer Richard H. Weiss Western
Scatter Plots and Association
 ? LESSON 1.1 ESSENTIAL QUESTION Scatter Plots and Association How can you construct and interpret scatter plots? Measurement and data 8.11.A Construct a scatterplot and describe the observed data to address
Planning for Physical
 9 Planning for Physical Activity In this chapter Lesson 9.1 Lesson 9.2 Self-Assessing Fitness and Physical Activity Needs Moving Together: Getting Active and Fit Take It Home: Moving Forward Creating a
Testing the Functional Equivalence of Retention Intervals and Sample-Stimulus Disparity in Conditional Discrimination
 Utah State University DigitalCommons@USU All Graduate Theses and Dissertations Graduate Studies 5-2008 Testing the Functional Equivalence of Retention Intervals and Sample-Stimulus Disparity in Conditional
7 Grip aperture and target shape
 7 Grip aperture and target shape Based on: Verheij R, Brenner E, Smeets JBJ. The influence of target object shape on maximum grip aperture in human grasping movements. Exp Brain Res, In revision 103 Introduction
Reinforcer Magnitude and Resistance to Change of Forgetting Functions and Response Rates
 Utah State University DigitalCommons@USU All Graduate Theses and Dissertations Graduate Studies 8-2012 Reinforcer Magnitude and Resistance to Change of Forgetting Functions and Response Rates Meredith
Part 1. For each of the following questions fill-in the blanks. Each question is worth 2 points.
 Part 1. For each of the following questions fill-in the blanks. Each question is worth 2 points. 1. The bell-shaped frequency curve is so common that if a population has this shape, the measurements are
c. Construct a boxplot for the data. Write a one sentence interpretation of your graph.
 STAT 280 Sample Test Problems Page 1 of 1 1. An English survey of 3000 medical records showed that smokers are more inclined to get depressed than non-smokers. Does this imply that smoking causes depression?
UNIVERSITY OF TORONTO SCARBOROUGH Department of Computer and Mathematical Sciences Midterm Test February 2016
 UNIVERSITY OF TORONTO SCARBOROUGH Department of Computer and Mathematical Sciences Midterm Test February 2016 STAB22H3 Statistics I, LEC 01 and LEC 02 Duration: 1 hour and 45 minutes Last Name: First Name: